a. describe the following stages of the system life cycle (definition of the problem, investigation and analysis, design, implementation, testing, installation, documentation, evaluation and maintenance) and how the stages relate to ICT systems .................................................................... 3
Definition of the problem ................................................................................................................ 4
Feasibility Study ............................................................................................................................... 5
b. describe the advantages and disadvantages of different approaches an analyst might use when investigating a system: questionnaires, interviews, meetings, document analysis, observation ........................................................................................................................................ 23
c. describe the following software development methodologies: prototyping and rapid application development (RAD) ......................................................................................................... 29
Rapid Application Development .................................................................................................... 30
d. describe the purpose of test data and explain the importance of testing and test plans ........ 32
Importance of Testing .................................................................................................................... 32
Purpose of Test Data ...................................................................................................................... 33
Importance of Test Plans ............................................................................................................... 34
e. describe the contents of the requirements specification, the design specification and the system specification, distinguishing between them .......................................................................... 37
System Specification ...................................................................................................................... 39
f. describe the roles and responsibilities of the following members of the project team: project manager, systems analyst, systems designer, programmer and tester ............................................ 41
g. describe, interpret and create critical path analysis (CPA) and Gantt charts, and for each explain its suitability for use in a given application ........................................................................... 44
h. describe, interpret and create data flow diagrams and flowcharts, and for each explain its suitability for use in a given application. ........................................................................................... 57
a. describe the following stages of the system life cycle (definition of the problem, investigation and analysis, design, implementation, testing, installation, documentation, evaluation and maintenance) and how the stages relate to ICT systems
Note: it is strongly recommended to teach this section alongside the G064 project and to use the
Model Project Answers available from www.paullong.net as a guide for examples of each of the stages of the system life cycle
The system life cycle is a process used for developing ICT systems. An ICT system is one which processes inputs and produces outputs. Review the diagram below of a standard system:
Example – a block paving system An example of a system is a piece of software which allows the user to enter measurements (input) of a driveway and it calculates (process) an invoice (output) to show how much it will cost to resurface the driveway. The file Block Paving.xls shows this system example.
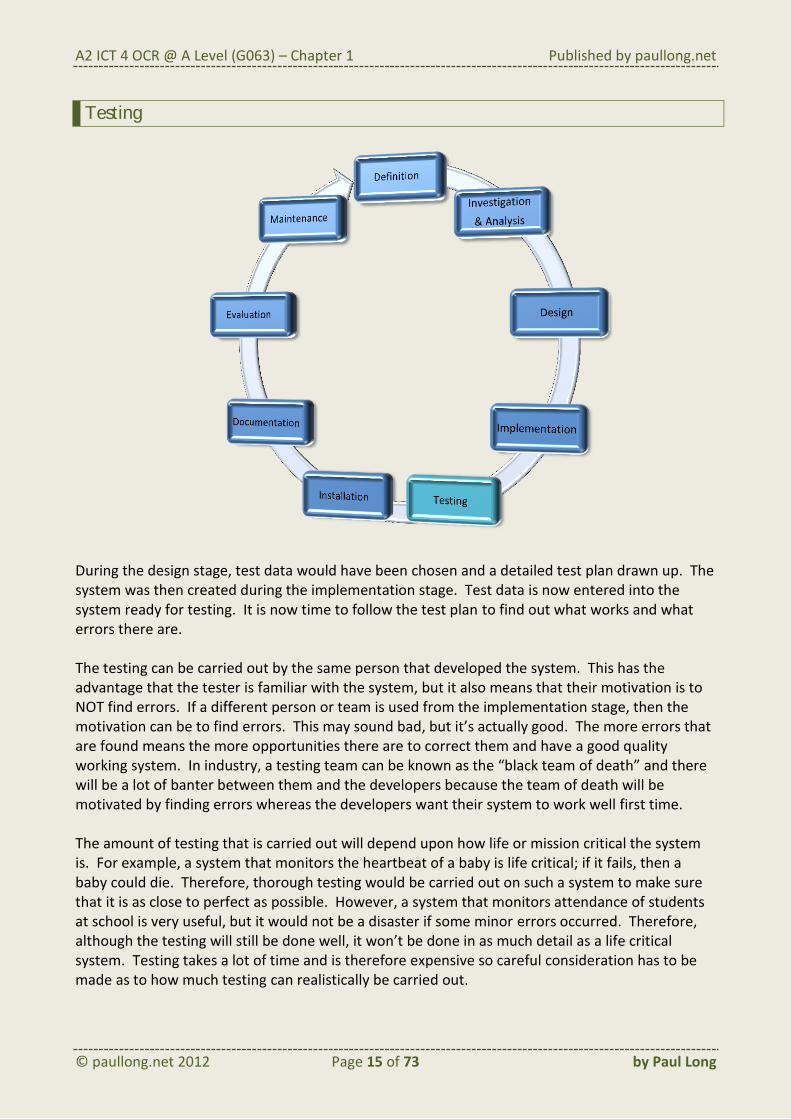
When developing an ICT system, a team of people or an individual will follow the process in the diagram below starting with definition.
As the team or individual work through the life cycle, each stage is dependent upon the previous stage being completed. It is also possible to return to previous stages to make corrections or
changes. Different specialists may be used at each stage. For example, an analyst may complete the definition, investigation and analysis stages whereas a programmer may complete the implementation stage. Throughout the whole process it is imperative that the user is involved so that the system that is eventually delivered is one which meets the user’s needs.
Definition of the problem
The purpose of this stage is to identify the user’s problem. A problem is not necessarily an error or something that is wrong. The problem may be that the user requires a system to perform some calculations or to create some invoices or to create drawing pins using CAD/CAM.
Example – problem Using the Block Paving example, the problem is that the user requires a system that will calculate how much it will cost to pave a driveway and produce an invoice detailing the costs.
Solving a problem may require a completely new system to be built or it may involve upgrading an existing system. A very brief investigation will take place where an analyst will interview the user to find out what their problem is and get a rough idea of what the user wants a system to do. The analyst will also find out what the current system does and how it works. The current system may be a computerised one or may be a manual system.
Example – reasons The current block paving system requires the user to calculate all the costs manually using a calculator, pen and paper. This is inefficient and sometimes inaccurate meaning that a more efficient system is required. It is a repetitive task and so is suitable for computerisation and it also requires complex operations which are the calculations to work out the invoice figures.
Feasibility Study
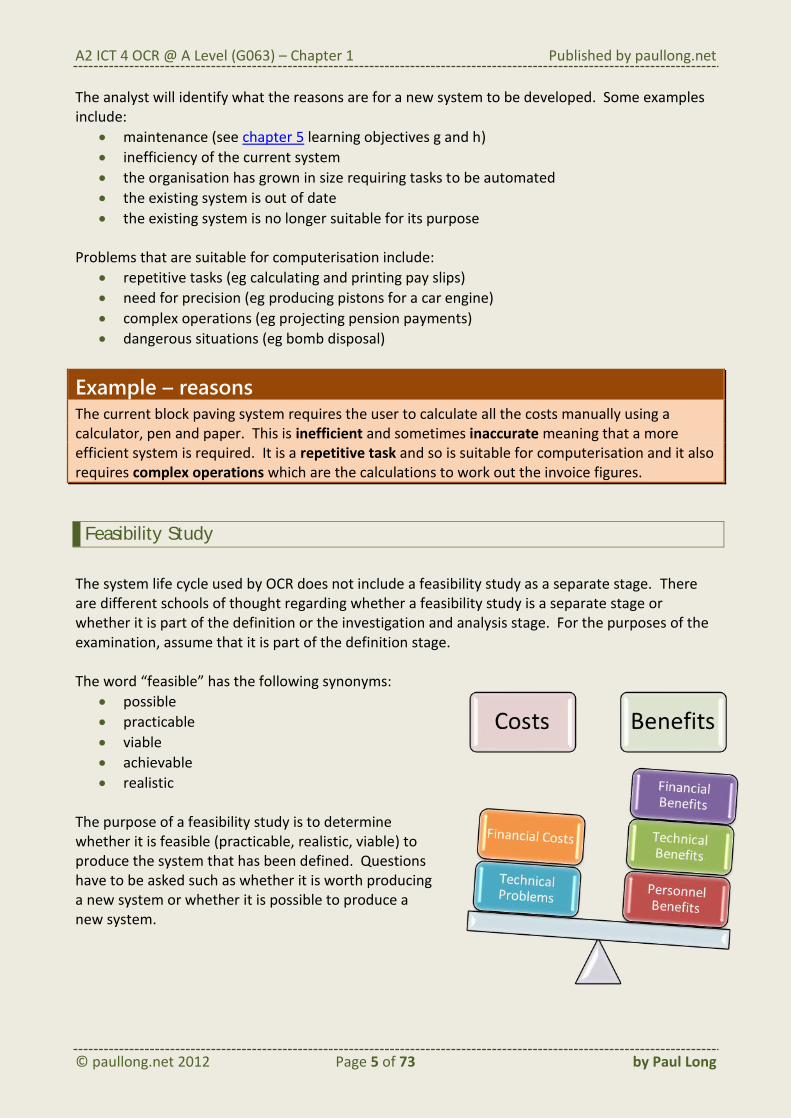
The system life cycle used by OCR does not include a feasibility study as a separate stage. There are different schools of thought regarding whether a feasibility study is a separate stage or whether it is part of the definition or the investigation and analysis stage. For the purposes of the examination, assume that it is part of the definition stage. The word “feasible” has the following synonyms:
possible
practicable
viable
achievable
realistic The purpose of a feasibility study is to determine whether it is feasible (practicable, realistic, viable) to produce the system that has been defined. Questions have to be asked such as whether it is worth producing a new system or whether it is possible to produce a new system.
cost of producing the new system compared with the cost of not producing it
availability of technology (hardware and software) that will be needed to solve the problem
availability of personnel to work through the system life cycle See chapter 5 learning objective c for further restrictions that have to be considered.
Feasibility Task – follow me Discuss some of the AS tasks you completed last year:
Which were suitable for computerisation?
Which ones were not necessary?
Which ones could have been done better in a different way?
Investigation & Analysis
This is an extension of the definition stage but is only completed if it is decided that the system will be feasible. It is all about finding out the detail of the current system and the requirements for a new system. The analyst will find out the following information
full details of the problem to be solved
current methods used to carry out the tasks
detailed requirements (user needs) for the new system
Example – analysis The analyst has interviewed the user to find out more about the block paving problem:
The user needs a system that will allow him to enter the length and width of a driveway, the type of block to be used and the type of base (concrete or hardcore) as well as the customer’s name and address. He wants the system to automatically calculate and produce an invoice.
The analyst has watched how the user works to discover that this is how the user creates invoices at the moment (current system):
The user multiplies the length by the width to calculate the area in square metres.
The user finds out the cost of each brick by looking it up in the catalogue.
The user writes down the area of each brick which is found from the catalogue
The user works out how many bricks are needed by dividing the area of the driveway by the area of one brick and adding an extra 5%
The user works out the cost of the bricks by multiplying the number of bricks by the cost of a single brick
……. in the real analysis of the current system, all the other calculations would also be
included here.
The analyst then looks at some examples of current invoices used by the user and interviews the customer to find out what each invoice should contain (output requirements):
“Block Paving Ltd” and the logo at the top of the page
“Quote for Driveway” underneath the company name
The customer’s name and address
The date of the quotation
The dimensions of the driveway including length, width and area with units included (eg m and m2)
The analyst then used some questionnaires to find out what existing customers thought about the invoices they received and what sort of information they might like to see on future invoices.
The analyst will also determine what the input requirements are in order to produce the output and what calculations must be made in the new system.
In order to gather the information in the example above, you will notice that the analyst used different methods to elicit information from the user. These were:
interviews with the user
observing how the user worked (to find out how it’s really done)
questionnaires (suitable for large numbers of users or customers)
examining documents (to find out what data is used) From these findings, the analyst will produce two reports:
analysis of the current system, current methods and the problem to be solved
user requirements for the new system
A2 ICT 4 OCR @ A Level (G063) – Chapter 1 Published by paullong.net
The user requirements form a foundation for the rest of the life cycle as they will continually be used to check that the user is getting what they have asked for. The user requirements document is like a contract that will be signed by the user. It must be detailed enough for a designer to design a new system that meets all of the user’s needs. If it lacks detail or is inaccurate then the design will also be inaccurate. The user must be involved during all stages of the system life cycle (see chapter 5 learning objective c) but predominantly during the investigation and analysis stage. If the user is not involved, then the system that is produced is one that the analyst thinks is appropriate rather than one which will be useful for the user. The analyst will provide drafts of the current systems analysis document and the user requirements document to the user so that feedback can be given to the analyst and corrections can be made before a final version is produced. This helps to reduce misunderstandings between the analyst and the user and errors that may appear. See chapter 1 learning objective e for more information about requirements specifications.
A2 ICT 4 OCR @ A Level (G063) – Chapter 1 Published by paullong.net
The design stage follows the investigation and analysis stage. The requirements specification is used by a designer to produce draft layouts, plans and data structures. By following the requirements specification, the designer is ensuring that the user’s needs are met. However, mistakes do occur and often errors are identified during the design stage that were not identified during the investigation and analysis stage. This is good news because it gives an opportunity for the user to give feedback before the real system is produced and it means that changes can be made to the requirements specification. The designer will perform some or all of the tasks below:
defining the data dictionary tables, fields, data formats and formulae used to store and process the data validation routines to reduce errors error messages so that the user knows what to do when an error has occurred relationships including an ERD (entity relationship diagram) query structures using pseudo code or SQL
sketching layouts of data capture methods, for example membership application forms, OMR sheets or questionnaires
identifying input methods sketching data entry screen layouts identifying what data must be included when input screen connectivity diagrams to show how the user can move from one screen to
identifying outputs sketching output screens to show where data will be displayed sketching reports that might be printed to show where data will be listed identifying what data must be included in each output audio, video and other multimedia elements (eg story board)
defining processes that need to take place pseudo code (a language in a particular structure that most people can understand
and is used to describe the processes that will take place) flow charts to show the order of processes and decisions that are made descriptions of processes so the developer understands what will need to be done
design specifications identifying the fonts, colours, sizes, backgrounds etc used on documents
test plan identifying each of the tests that should be carried out once the system has been
developed identifying the data that will be used for each test (including normal,
invalid/erroneous and extreme data) identifying how to carry out each test identifying the expected results for each test the test plan must be related to the requirements specification a user test plan that can be followed by the user see chapter 1 learning objective d for the purpose of test data
See chapter 1 learning objective e for information about what is included in the design specification.
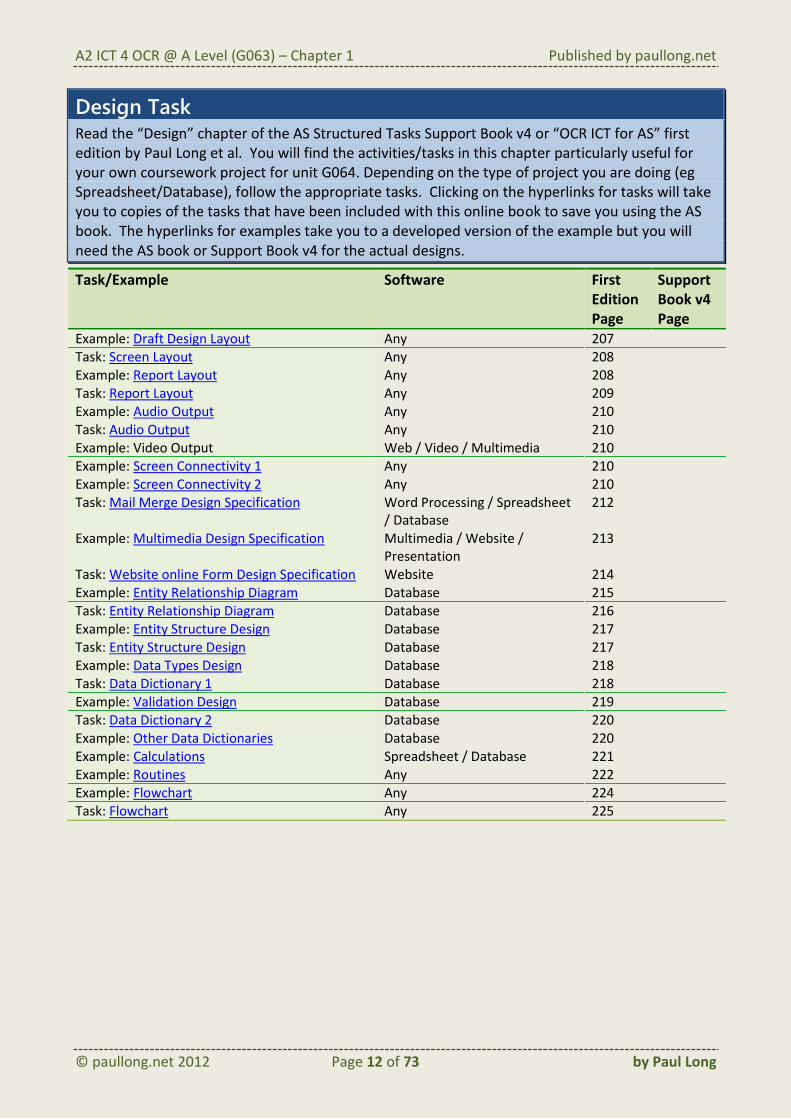
Design Task Read the “Design” chapter of the AS Structured Tasks Support Book v4 or “OCR ICT for AS” first edition by Paul Long et al. You will find the activities/tasks in this chapter particularly useful for your own coursework project for unit G064. Depending on the type of project you are doing (eg Spreadsheet/Database), follow the appropriate tasks. Clicking on the hyperlinks for tasks will take you to copies of the tasks that have been included with this online book to save you using the AS book. The hyperlinks for examples take you to a developed version of the example but you will need the AS book or Support Book v4 for the actual designs.
Task/Example Software First Edition Page
Support Book v4 Page
Example: Draft Design Layout Any 207 Task: Screen Layout Any 208 Example: Report Layout Any 208 Task: Report Layout Any 209 Example: Audio Output Any 210 Task: Audio Output Any 210 Example: Video Output Web / Video / Multimedia 210 Example: Screen Connectivity 1 Any 210 Example: Screen Connectivity 2 Any 210 Task: Mail Merge Design Specification Word Processing / Spreadsheet
The implementation stage involves the actual creating of the system / software. It is more commonly known as the “development” stage, but for OCR’s purposes, you should refer to it as the implementation stage. One or more software developers will be used during this stage to develop the system. They will be expected to follow the design exactly and to refer to the requirements specification to ensure they are meeting the user’s needs. Often developers will use prototyping (see chapter 1 learning objective c) to create the system. This involves creating the basic user interface and showing it to the user for feedback, then moving on to the next stage and at all times getting feedback from the user. A system might be developed from scratch using programming software such as C++ or Visual Basic (known as custom-written software). Alternatively, a developer may user a spreadsheet, database or other standard off-the-shelf software to create the system and tailor it to the user needs.
A2 ICT 4 OCR @ A Level (G063) – Chapter 1 Published by paullong.net
During the design stage, test data would have been chosen and a detailed test plan drawn up. The system was then created during the implementation stage. Test data is now entered into the system ready for testing. It is now time to follow the test plan to find out what works and what errors there are. The testing can be carried out by the same person that developed the system. This has the advantage that the tester is familiar with the system, but it also means that their motivation is to NOT find errors. If a different person or team is used from the implementation stage, then the motivation can be to find errors. This may sound bad, but it’s actually good. The more errors that are found means the more opportunities there are to correct them and have a good quality working system. In industry, a testing team can be known as the “black team of death” and there will be a lot of banter between them and the developers because the team of death will be motivated by finding errors whereas the developers want their system to work well first time. The amount of testing that is carried out will depend upon how life or mission critical the system is. For example, a system that monitors the heartbeat of a baby is life critical; if it fails, then a baby could die. Therefore, thorough testing would be carried out on such a system to make sure that it is as close to perfect as possible. However, a system that monitors attendance of students at school is very useful, but it would not be a disaster if some minor errors occurred. Therefore, although the testing will still be done well, it won’t be done in as much detail as a life critical system. Testing takes a lot of time and is therefore expensive so careful consideration has to be made as to how much testing can realistically be carried out.
A2 ICT 4 OCR @ A Level (G063) – Chapter 1 Published by paullong.net
Some of the testing will be done by the user. The user will follow the test plan that was created by the designer. The main purpose of user testing is to make sure that the requirements specification has been met. When errors are found in the system, they will be recorded on the test plan. The developer will then have the responsibility of correcting these errors. This means going back to the development stage and making the correction. The system can then be re-submitted to the tester to see if the corrections have worked and also to test the impact of the corrections on other parts of the system. Sometimes it might be the design that is wrong or even the requirements specification. This then involves making changes to the requirements specification and/or the design specification before changes can be made to the code or customisation in the development stage. This process of going back and forth between stages is known as “iteration” parts of each stage have to be repeated. See chapter 1 learning objective d for reasons why testing is important. You may find it appropriate to study this chapter now rather than later.
A2 ICT 4 OCR @ A Level (G063) – Chapter 1 Published by paullong.net
This stage is when the system is installed ready for the users to use. It is sometimes known as “implementation” but should not be confused with how “implementation” is used by OCR which is “development”. It is also known as changeover which is when the old system is changed over to the new system. See chapter 5 learning objective d for more information about different methods of installation which include:
Method Description Parallel The old system and the new system are run together at the same time during the
changeover period. Direct The old system is retired immediately and the new system fully used immediately. Phased Parts of the new system are used while other parts of the old system continue to be
used. More new parts are introduced during the changeover period. Pilot A group of people within an organisation use the new system and then more groups
of people start to use the new system during the changeover period.
A2 ICT 4 OCR @ A Level (G063) – Chapter 1 Published by paullong.net
Documentation is used so that the user knows how to use the system. It would normally be provided to the customer during the installation stage. There are 3 main types of documentation:
Documentation Description User documentation
This is usually in the form of a book or other printed material and contains instructions to show the user how to use the software. User documentation would normally include:
Front Cover Identifying the name of the system and the fact that this is user documentation.
Contents Page A list of the main topics with page numbers.
Introduction / Overview A brief overview of what the purpose of the user guide is and what the purpose of the system is.
Hardware Requirements A list of the minimum specification of hardware needed to run the system.
Software Requirements A list of the minimum specification of software needed to run the system.
Instructions Step by step instructions to how to use the software including screenshots of software and photographs of hardware.
Glossary An alphabetical list of common terms used throughout the system with a definition of each term.
Troubleshooting Common problems are described, including all error messages, with causes for why the problem may have occurred and possible solutions.
A2 ICT 4 OCR @ A Level (G063) – Chapter 1 Published by paullong.net
bullets or numbering for sequential instructions User documentation is very likely to be used as part of the training of users. Each user will then have a copy of the user documentation to use as a reference guide when using the software.
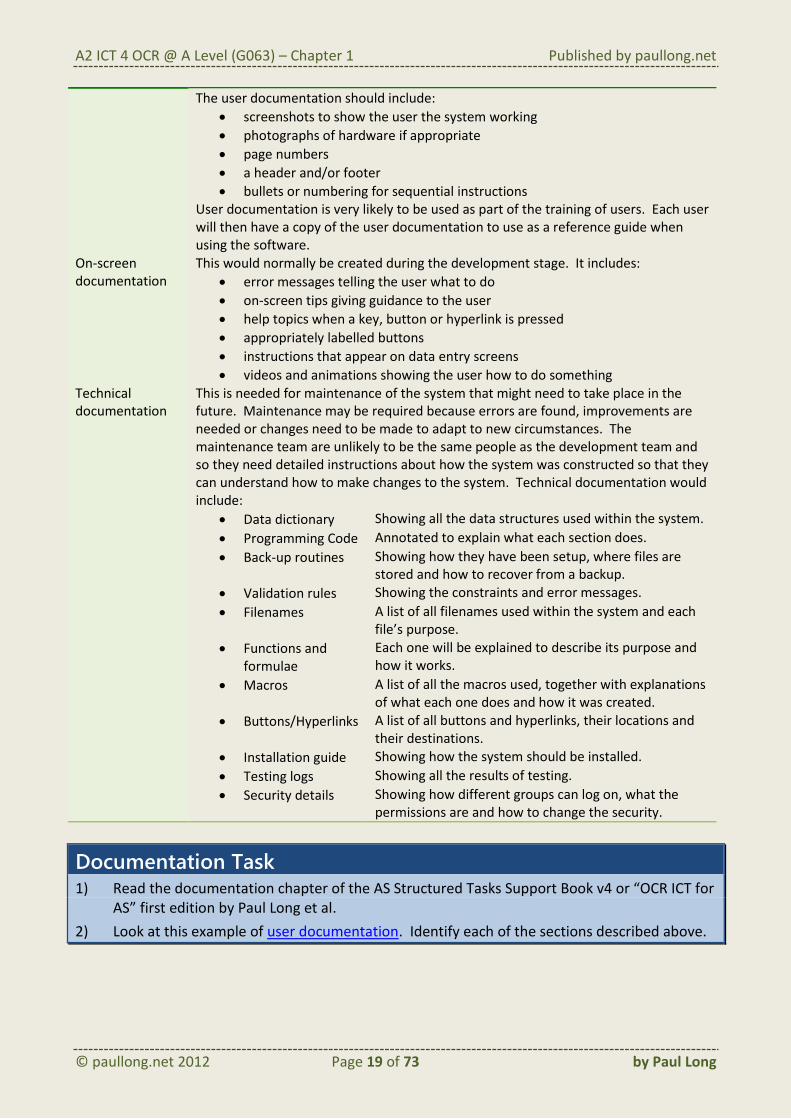
On-screen documentation
This would normally be created during the development stage. It includes:
error messages telling the user what to do
on-screen tips giving guidance to the user
help topics when a key, button or hyperlink is pressed
appropriately labelled buttons
instructions that appear on data entry screens
videos and animations showing the user how to do something Technical documentation
This is needed for maintenance of the system that might need to take place in the future. Maintenance may be required because errors are found, improvements are needed or changes need to be made to adapt to new circumstances. The maintenance team are unlikely to be the same people as the development team and so they need detailed instructions about how the system was constructed so that they can understand how to make changes to the system. Technical documentation would include:
Data dictionary Showing all the data structures used within the system.
Programming Code Annotated to explain what each section does.
Back-up routines Showing how they have been setup, where files are stored and how to recover from a backup.
Validation rules Showing the constraints and error messages.
Filenames A list of all filenames used within the system and each file’s purpose.
Functions and formulae
Each one will be explained to describe its purpose and how it works.
Macros A list of all the macros used, together with explanations of what each one does and how it was created.
Buttons/Hyperlinks A list of all buttons and hyperlinks, their locations and their destinations.
Installation guide Showing how the system should be installed.
Testing logs Showing all the results of testing.
Security details Showing how different groups can log on, what the permissions are and how to change the security.
Documentation Task 1) Read the documentation chapter of the AS Structured Tasks Support Book v4 or “OCR ICT for
AS” first edition by Paul Long et al.
2) Look at this example of user documentation. Identify each of the sections described above.
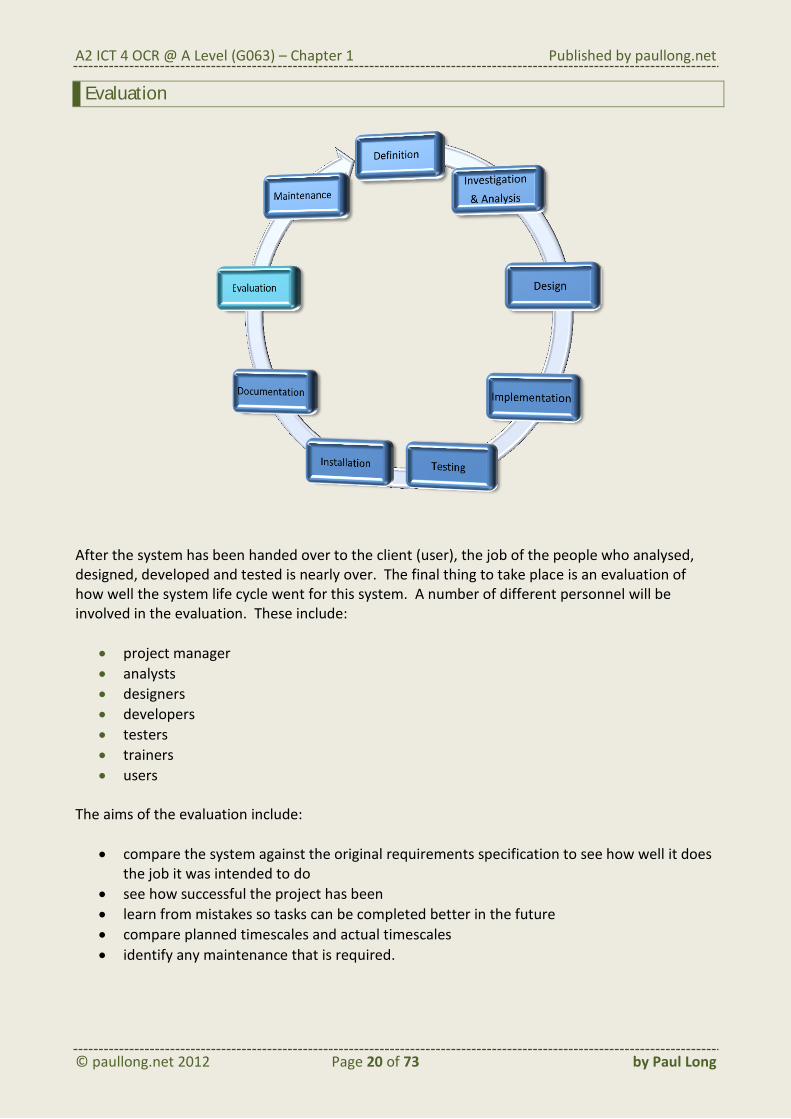
After the system has been handed over to the client (user), the job of the people who analysed, designed, developed and tested is nearly over. The final thing to take place is an evaluation of how well the system life cycle went for this system. A number of different personnel will be involved in the evaluation. These include:
project manager
analysts
designers
developers
testers
trainers
users The aims of the evaluation include:
compare the system against the original requirements specification to see how well it does the job it was intended to do
see how successful the project has been
learn from mistakes so tasks can be completed better in the future
compare planned timescales and actual timescales
identify any maintenance that is required.
A2 ICT 4 OCR @ A Level (G063) – Chapter 1 Published by paullong.net
Maintenance involves making changes to the system. Maintenance takes place because:
improvements are wanted by the user (perfective)
changes need to be made to adapt to new circumstances (adaptive)
errors need to be corrected (corrective) It would appear that this is the final stage of the system life cycle. However, it is just a starting point of the whole life cycle all over again. When a change is made, it needs to be:
identified (definition)
specified (investigation & analysis)
designed (design)
developed (implementation)
tested (testing)
updated in the system (installation)
documented (documentation)
evaluated (evaluation)
A2 ICT 4 OCR @ A Level (G063) – Chapter 1 Published by paullong.net
b. describe the advantages and disadvantages of different approaches an analyst might use when investigating a system: questionnaires, interviews, meetings, document analysis, observation
During the investigation and analysis stage of the system life cycle, an analyst must find out the following information:
full details of the problem to be solved
current methods of carrying out tasks
detailed requirements (user needs) for the new system The following investigation methods may be used by analysts:
interviews (with selected users)
questionnaires (suitable for large numbers of users)
examining documents (to find out what data is used)
observing user activities (to find out how it’s really done) The methods the analyst uses will be dependent upon:
the information required by the analyst
the users/people who need to be involved
availability of personnel
what is permitted by the organisation
Questionnaires
Questionnaires are useful for gathering information from lots of users. Questions need to be structured carefully to:
elicit the information required
enable analysis of the data effectively
gather enough information without causing a large burden upon the users
On-line questionnaires enable quicker analysis of data because the users fill in the data on-line and then the data is entered directly into a database. This saves time with additional data entry. A balance of questions on a questionnaire is required:
Question Reason Multiple Choice To make analysis of results more effective because answers can be categorised and
counted in those categories.
Opinion Ratings To find out how effective current systems are and what potential users think of the plans for a new system.
Open Questions To enable users to add their own ideas and opinions.
Advantages Questionnaires are appropriate for large groups of users, or customers, because it would
be impractical to interview everybody individually. The same information is gathered from each user and so this makes it easy to compare the
results. Sometimes results might be analysed statistically, or for a ‘medium’ sized group then each one would be analysed individually.
The questions are planned in advance and so are designed to gather the information required.
Questionnaires can also be useful if the analyst has difficulty getting appointment times with users.
Honest answers are also more likely to be given on questionnaires if they are anonymous. Disadvantages
Questionnaires are inappropriate for one user or a very small number of users because they do not enable the analyst to find out exactly what the user wants.
The respondent to the questionnaire (the user) is restricted to answering just those questions and so the analyst can’t ask the user to elaborate.
Questionnaires can appear to be impersonal which may alienate the user(s). Many users may not have the time to complete the questionnaire or just may ‘not be
bothered’ meaning that not all questionnaires will be returned.
Interviews and Meetings
Interviews tend to be used for individuals or small groups of people. People that are interviewed may include:
People Reason Management To find out what the needs are of the
organisation and what information needs to be used for decision making.
End-Users To find out how everyday tasks are completed and what is needed to make these tasks more efficient.
Customers To find out what features of the current system the customer likes and dislikes and what improvements customers might like to see (for example emailed invoices).
Questions for interviews need to be well planned:
Questions need to be planned so that they elicit the information that is required
Potential answers should be considered so that the interviewer is prepared for how to respond to those answers
Possible follow-up questions should be planned so that more detailed information can be gathered from the interviewee.
Sometimes “focus groups” might be used instead of individual people. These would be carefully selected people that cover a broad spectrum. For example, customers of different ages could be selected so that a range of views are gathered. These can be expensive to set up because each customer is likely to be paid for their expenses.
A2 ICT 4 OCR @ A Level (G063) – Chapter 1 Published by paullong.net
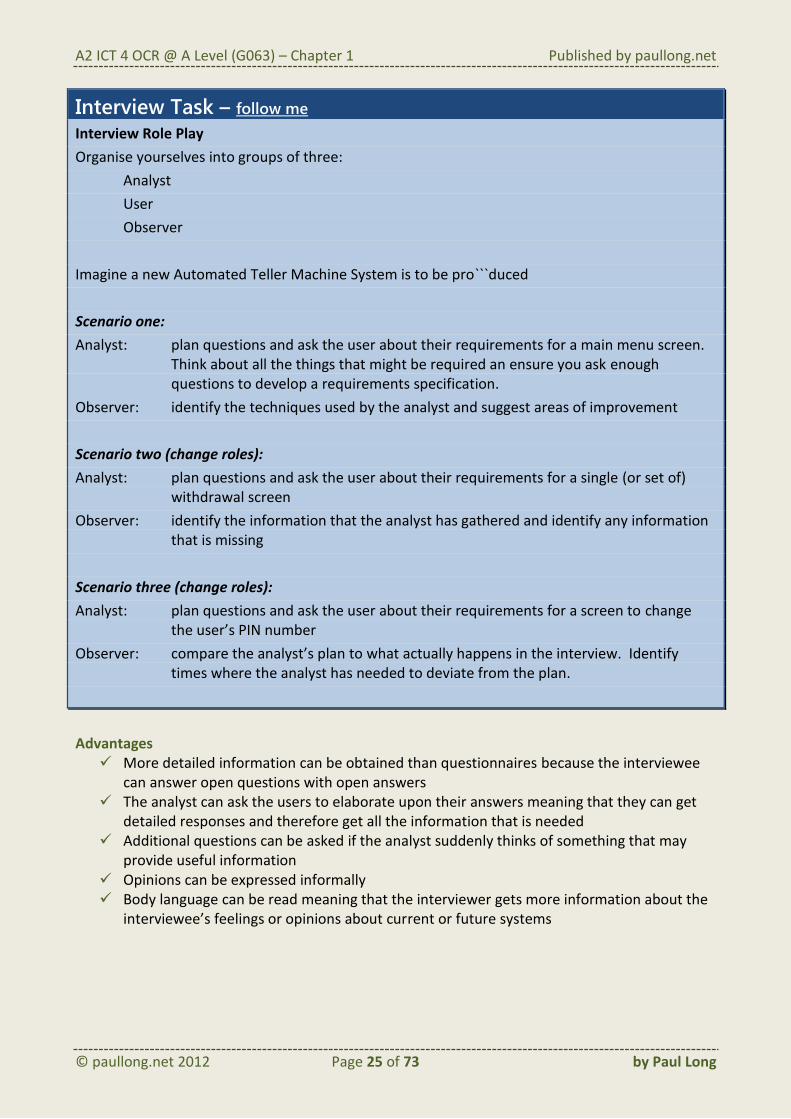
Imagine a new Automated Teller Machine System is to be pro```duced
Scenario one:
Analyst: plan questions and ask the user about their requirements for a main menu screen. Think about all the things that might be required an ensure you ask enough questions to develop a requirements specification.
Observer: identify the techniques used by the analyst and suggest areas of improvement
Scenario two (change roles):
Analyst: plan questions and ask the user about their requirements for a single (or set of) withdrawal screen
Observer: identify the information that the analyst has gathered and identify any information that is missing
Scenario three (change roles):
Analyst: plan questions and ask the user about their requirements for a screen to change the user’s PIN number
Observer: compare the analyst’s plan to what actually happens in the interview. Identify times where the analyst has needed to deviate from the plan.
Advantages
More detailed information can be obtained than questionnaires because the interviewee can answer open questions with open answers
The analyst can ask the users to elaborate upon their answers meaning that they can get detailed responses and therefore get all the information that is needed
Additional questions can be asked if the analyst suddenly thinks of something that may provide useful information
Opinions can be expressed informally Body language can be read meaning that the interviewer gets more information about the
interviewee’s feelings or opinions about current or future systems
Interviews are time consuming because they have to be planned, arranged, carried out and then the responses need to be analysed.
Interviews are not appropriate for lots of users because of the amount of time it would take
Interviews do not provide statistical data analysis because they are not as structured as questionnaires
It may be difficult to arrange a mutually convenient time for the interview Lack of anonymity may lead to honest answers not being given and therefore true opinions
about the current or future system cannot be elicited
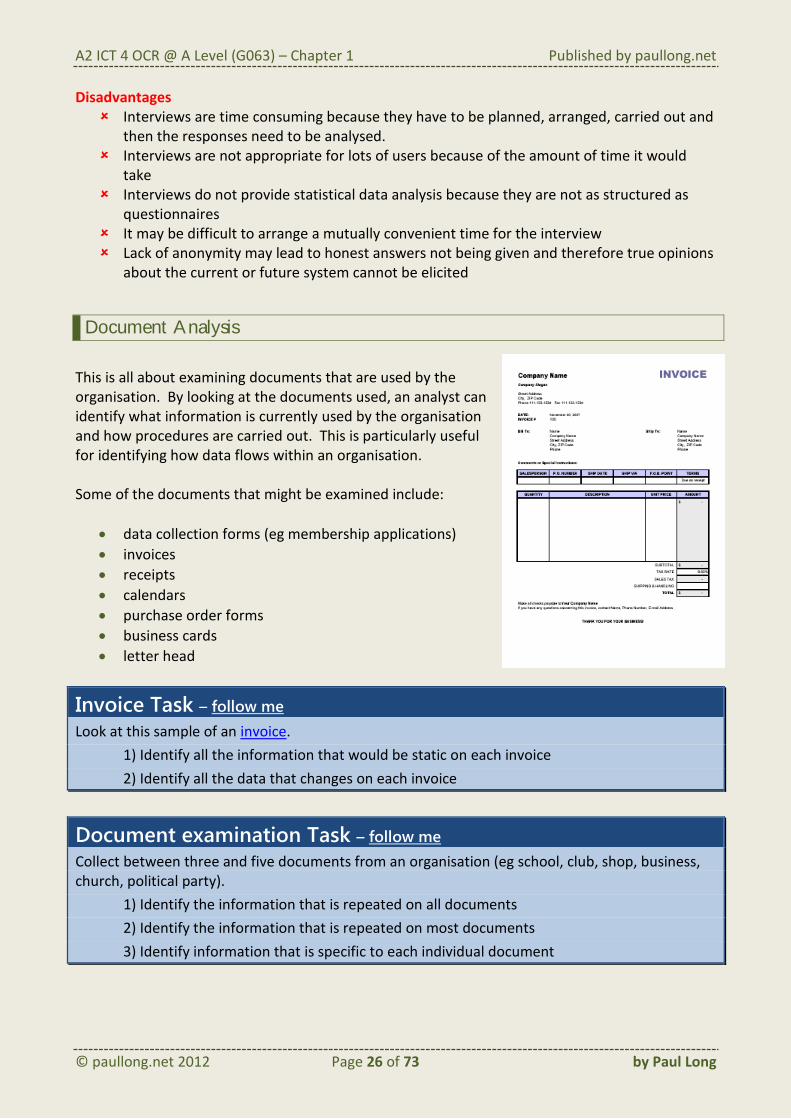
Document Analysis
This is all about examining documents that are used by the organisation. By looking at the documents used, an analyst can identify what information is currently used by the organisation and how procedures are carried out. This is particularly useful for identifying how data flows within an organisation. Some of the documents that might be examined include:
data collection forms (eg membership applications)
invoices
receipts
calendars
purchase order forms
business cards
letter head
Invoice Task – follow me Look at this sample of an invoice.
1) Identify all the information that would be static on each invoice
2) Identify all the data that changes on each invoice
Document examination Task – follow me Collect between three and five documents from an organisation (eg school, club, shop, business, church, political party).
1) Identify the information that is repeated on all documents
2) Identify the information that is repeated on most documents
3) Identify information that is specific to each individual document
lots of data that is used within an organisation can be quickly identified data flows within an organisation can be established
Disadvantages
on its own, document analysis will not show all the data that is used within an organisation it only shows data that is used ‘formally’ – any data that is used verbally will not be seen often an organisation can have standard documents such as purchase orders but the
people within the organisation do not use the documents and so an incorrect picture of the current system can be imagined
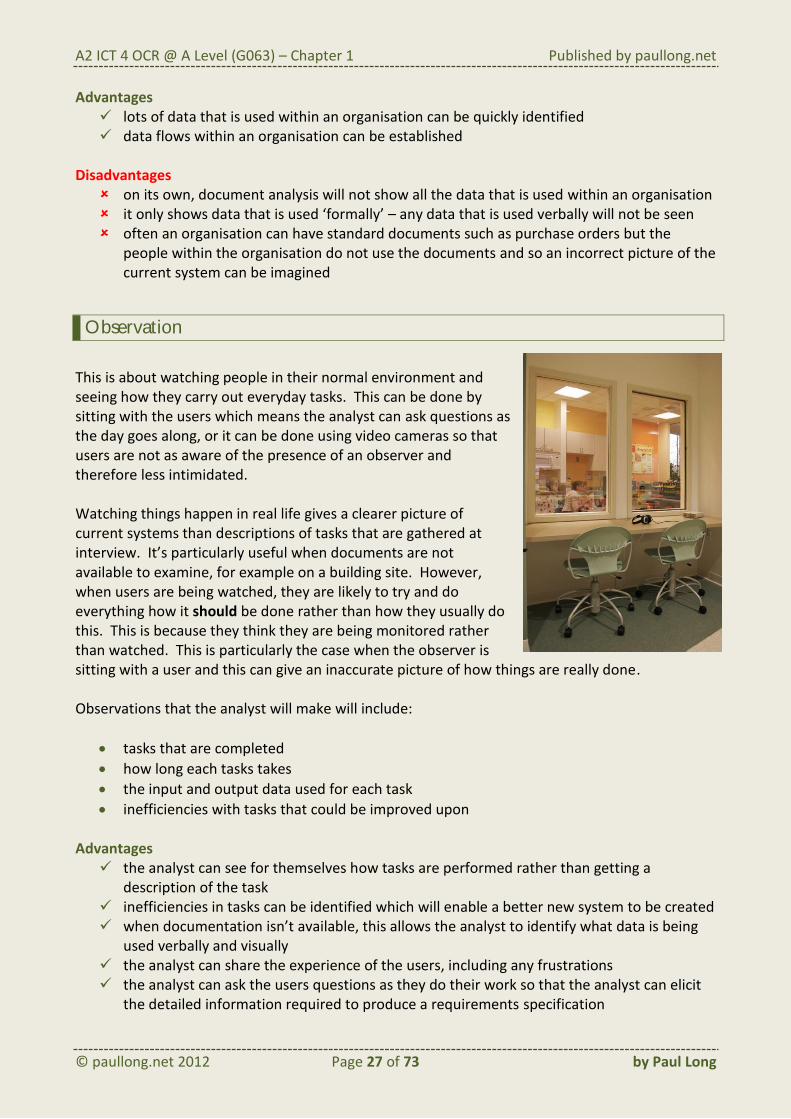
Observation
This is about watching people in their normal environment and seeing how they carry out everyday tasks. This can be done by sitting with the users which means the analyst can ask questions as the day goes along, or it can be done using video cameras so that users are not as aware of the presence of an observer and therefore less intimidated. Watching things happen in real life gives a clearer picture of current systems than descriptions of tasks that are gathered at interview. It’s particularly useful when documents are not available to examine, for example on a building site. However, when users are being watched, they are likely to try and do everything how it should be done rather than how they usually do this. This is because they think they are being monitored rather than watched. This is particularly the case when the observer is sitting with a user and this can give an inaccurate picture of how things are really done. Observations that the analyst will make will include:
tasks that are completed
how long each tasks takes
the input and output data used for each task
inefficiencies with tasks that could be improved upon Advantages
the analyst can see for themselves how tasks are performed rather than getting a description of the task
inefficiencies in tasks can be identified which will enable a better new system to be created when documentation isn’t available, this allows the analyst to identify what data is being
used verbally and visually the analyst can share the experience of the users, including any frustrations the analyst can ask the users questions as they do their work so that the analyst can elicit
the detailed information required to produce a requirements specification
A2 ICT 4 OCR @ A Level (G063) – Chapter 1 Published by paullong.net
users may feel intimidated if they are being watched and this may slow them down or make them less efficient with their tasks than they would be normally
users may do things ‘properly’ because they feel they are being monitored rather than watched meaning the analyst doesn’t get a true picture of how the current system works
it takes up a lot of the analyst’s time to watch users at work, particularly if there are lots of repetitive tasks being performed
only a ‘snapshot’ of the time that the analyst observes is gathered and so there may be other tasks that are regularly carried out but not at that particular time
Observation Task – follow me Observe one of your peers answering a couple of the questions below:
1) What information do they refer to when answering the questions?
2) Where does this information come from?
3) What do they write down?
4) What software and hardware is used?
5) Where are files saved?
Questions – follow me
1) Identify two advantages of using questionnaires. [2]
2) Describe two disadvantages of interviews. [4]
3) You are developing a system for a builder. He is the only person in his company. Identify which methods of investigation would you use and for each give a reason why you would use it. [4]
4) Give one disadvantage of document analysis. [1]
c. describe the following software development methodologies: prototyping and rapid application development (RAD)
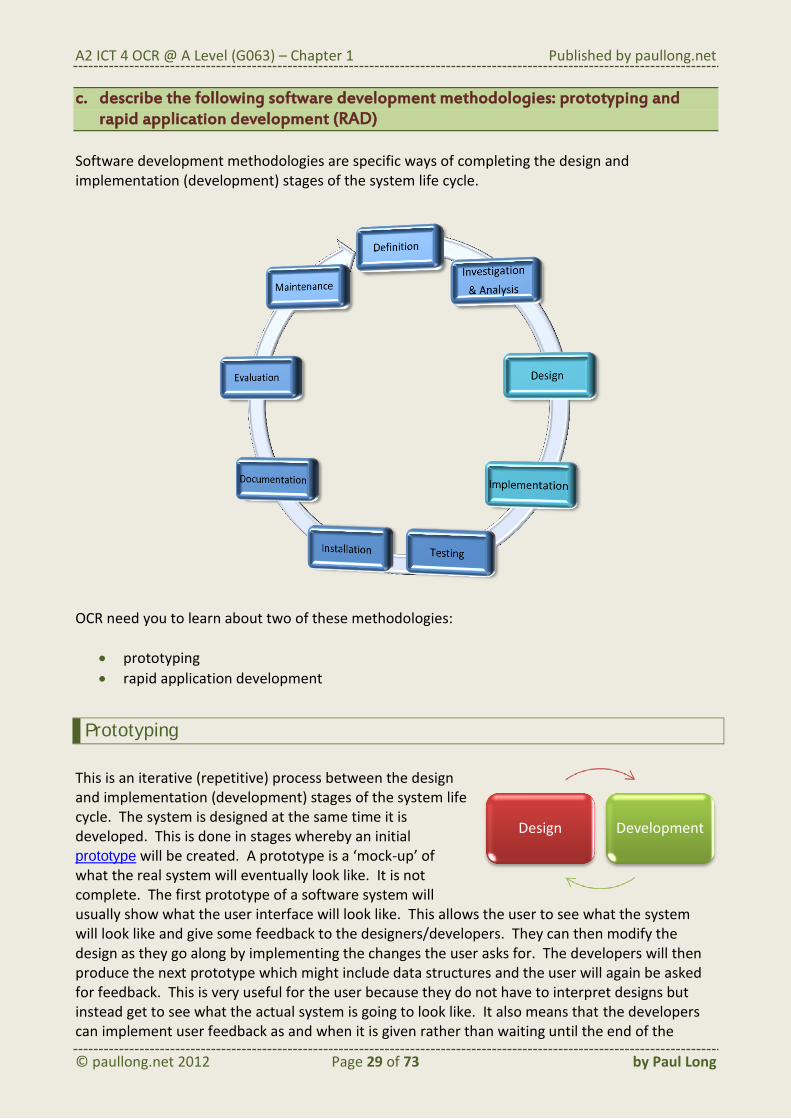
Software development methodologies are specific ways of completing the design and implementation (development) stages of the system life cycle.
OCR need you to learn about two of these methodologies:
prototyping
rapid application development
Prototyping
This is an iterative (repetitive) process between the design and implementation (development) stages of the system life cycle. The system is designed at the same time it is developed. This is done in stages whereby an initial prototype will be created. A prototype is a ‘mock-up’ of what the real system will eventually look like. It is not complete. The first prototype of a software system will usually show what the user interface will look like. This allows the user to see what the system will look like and give some feedback to the designers/developers. They can then modify the design as they go along by implementing the changes the user asks for. The developers will then produce the next prototype which might include data structures and the user will again be asked for feedback. This is very useful for the user because they do not have to interpret designs but instead get to see what the actual system is going to look like. It also means that the developers can implement user feedback as and when it is given rather than waiting until the end of the
development stage. The main problem with this approach is that the user can keep changing their mind and trying to add in new features.
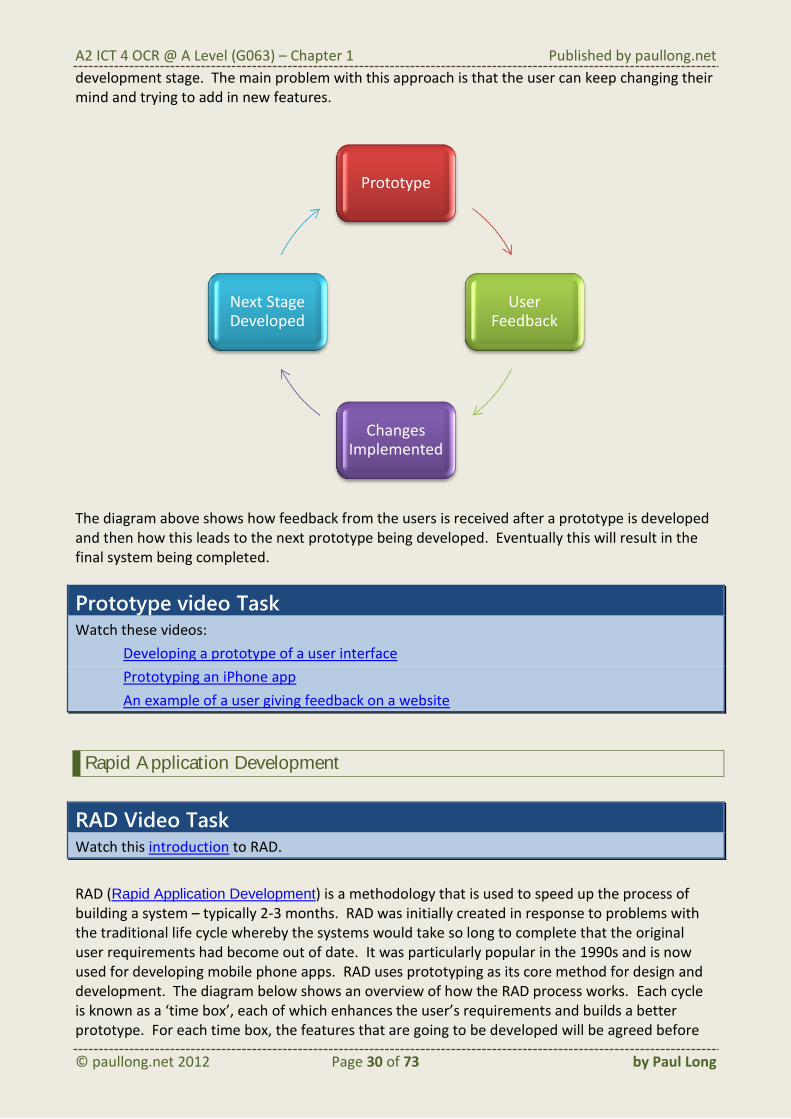
The diagram above shows how feedback from the users is received after a prototype is developed and then how this leads to the next prototype being developed. Eventually this will result in the final system being completed.
Prototype video Task Watch these videos:
Developing a prototype of a user interface
Prototyping an iPhone app
An example of a user giving feedback on a website
Rapid Application Development
RAD Video Task Watch this introduction to RAD.
RAD (Rapid Application Development) is a methodology that is used to speed up the process of building a system – typically 2-3 months. RAD was initially created in response to problems with the traditional life cycle whereby the systems would take so long to complete that the original user requirements had become out of date. It was particularly popular in the 1990s and is now used for developing mobile phone apps. RAD uses prototyping as its core method for design and development. The diagram below shows an overview of how the RAD process works. Each cycle is known as a ‘time box’, each of which enhances the user’s requirements and builds a better prototype. For each time box, the features that are going to be developed will be agreed before
any work takes place so that the development is focussed on those features and does not expand into other aspects of the system. Requirements are gathered using focus groups or workshops of users, developers and managers. A design is created that is made into a prototype. This is then discussed with the users and the users can refine their requirements now that they can see what a system might look like. This is particularly useful when a user does not know exactly what they want a system to do.
RAD usually uses CASE (Computer Aided Software Engineering) tools which are software tools to assist with:
feasibility
gathering requirements
design
prototyping / development
testing
documentation The development aspects are often created automatically from the design. This means that programmers are not necessarily required because the software tools will create the code instead. Libraries of code that have been used for other systems are re-used rather than creating a whole system from scratch.
RAD video examples Task Watch these videos:
Rad with Glade 3
Developing mobile phone apps with RAD
Questions – follow me 1) Expand the following acronyms: RAD, CASE [2]
2) Describe the role of ‘time boxes’ within RAD [2]
d. describe the purpose of test data and explain the importance of testing and test plans
Importance of Testing
Although testing takes place after the implementation stage, the test data is chosen during the design stage and the test plans are also written during the design stage. The human nature of developers means that errors are inevitable. Therefore testing is necessary. The process of testing involves:
select data that will be used to test the system
plan the tests
run the tests
identify faults
correct the faults
user testing The purpose of testing is to:
ensure the system is free of errors although this cannot be guaranteed depends on the depth of testing
ensure system matches requirements specification
give users confidence in the new system
ensure the system works and is reliable
A2 ICT 4 OCR @ A Level (G063) – Chapter 1 Published by paullong.net
Testing review Task Read the section on testing in chapter 1 learning objective a.
Purpose of Test Data
Test data is selected during the design stage. It is important that a range of test data, that covers the variety of data that a user will use in the end system, is selected. Assuming that a validation rule is being used for data entry and the rule is that the entered value must be <50, then the following data could be selected as test data:
Valid (normal) data Data that is acceptable to the system eg 35
Invalid data Data that is not acceptable to the system Data that generates error messages eg 65
Extreme valid data Data that is only just acceptable to the system eg 49
Extreme invalid data Data that is only just not acceptable to the system eg 50
Each of the above types of data are examples of data that the user may enter into the system. By selecting valid test data, this ensures that the system will work as it is intended to do based upon normal operation by the user. By choosing invalid data to test the system, this ensures that the error message(s) work as they are intended to do when invalid data is entered. The final types of test data are extreme values. These are very important because they test the system to its limit. By entering the value 50, it ensures that the lowest possible invalid item of data produces an error message. If the developer accidentally creates a validation rule of <=50 then this will also identify the problem. By entering the value 49, it ensures that the highest possible valid item of data is accepted by the system. If the developer accidentally creates a validation rule of <5 then this will identify the problem.
A2 ICT 4 OCR @ A Level (G063) – Chapter 1 Published by paullong.net
Test data Task Read the Test Data section of the “Testing” chapter of the AS Structured Tasks Support Book v4 or “OCR ICT for AS” first edition by Paul Long et al. You will find the examples/tasks in this chapter particularly useful for your own coursework project for unit G064. Depending on the type of project you are doing (eg Spreadsheet/Database), follow the appropriate tasks. Clicking on the hyperlinks for tasks will take you to copies of the tasks that have been included with this online book to save you using the AS book.
Task Software First Edition Page
Support Book v4 Page
Example: Range Validation Test Data Any 278
Example: Format Validation Test Data Any 279
Example: Lookup in List Validation Test Data Any 279
Task: Input Test Data Any 279 Task: Formulae Test Data Spreadsheet / Database 281 Example: Testing Outputs (Members Database) Database 282 Task: Query Test Data Database 282
Importance of Test Plans
Test plans are created during the design stage. Test plans are extremely important because they will ensure all routes through a system are covered when it comes to testing. Without a plan, testing will be sporadic and many features of the system will remain untested and this increases the likelihood of errors not being found. Reasons that test plans are important include:
to identify all the tests needed so that none are missed out meaning that all features are tested which means most errors are likely to be found
to cover all requirements so that the user’s needs are met meaning that the user will be satisfied that the system does what it was intended to do
to ensure that testers follow all tests so that no routes through the system are missed out and most errors are likely to be found
to help with documenting the testing process so that if errors are found in the future then it may be possible to discover what happened during testing
A test plan should include for each test:
a test number to identify the test for documentation purposes
a description of what is being tested
the type of test - valid, extreme valid, invalid, extreme invalid, button, query, report, hyperlink etc
the specific input data value(s) to be used for the test
the specific expected results which may be values or something that happens
space for actual results so that when the testing is carried out the tester can record what actually happened during testing and compare that with the expected result
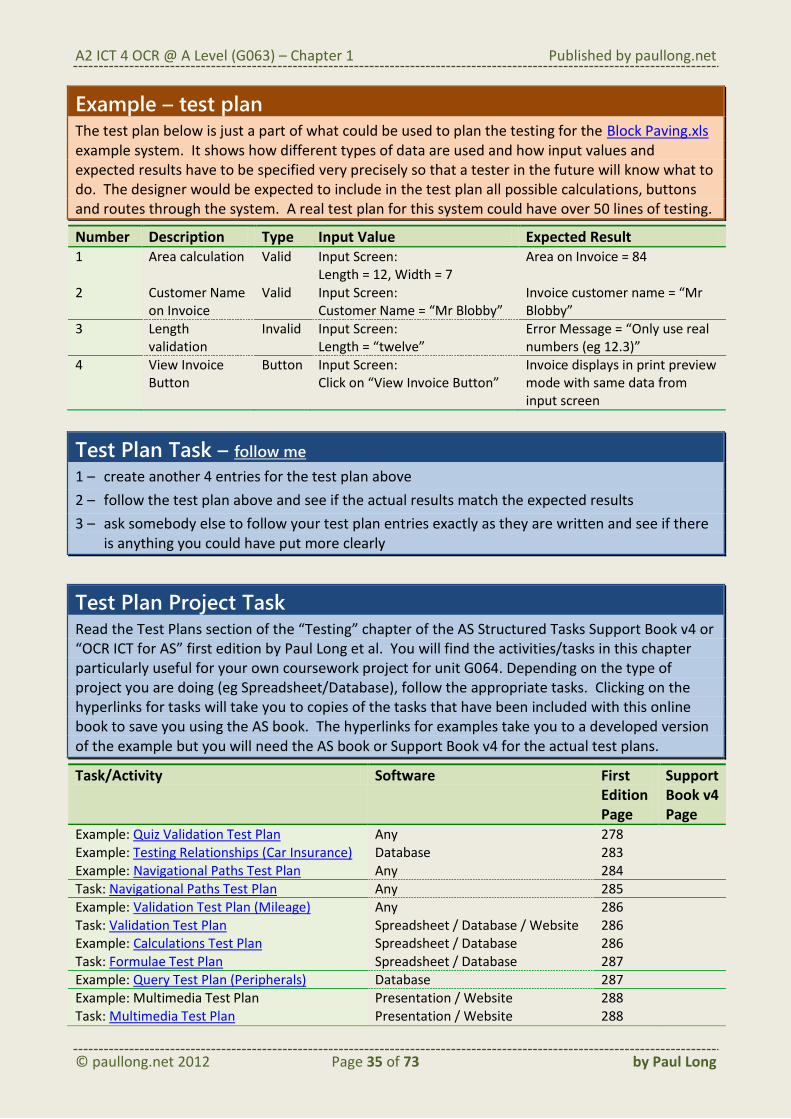
Example – test plan The test plan below is just a part of what could be used to plan the testing for the Block Paving.xls example system. It shows how different types of data are used and how input values and expected results have to be specified very precisely so that a tester in the future will know what to do. The designer would be expected to include in the test plan all possible calculations, buttons and routes through the system. A real test plan for this system could have over 50 lines of testing.
Number Description Type Input Value Expected Result 1 Area calculation Valid Input Screen:
Length = 12, Width = 7 Area on Invoice = 84
2 Customer Name on Invoice
Valid Input Screen: Customer Name = “Mr Blobby”
Invoice customer name = “Mr Blobby”
3 Length validation
Invalid Input Screen: Length = “twelve”
Error Message = “Only use real numbers (eg 12.3)”
4 View Invoice Button
Button Input Screen: Click on “View Invoice Button”
Invoice displays in print preview mode with same data from input screen
Test Plan Task – follow me 1 – create another 4 entries for the test plan above
2 – follow the test plan above and see if the actual results match the expected results
3 – ask somebody else to follow your test plan entries exactly as they are written and see if there is anything you could have put more clearly
Test Plan Project Task Read the Test Plans section of the “Testing” chapter of the AS Structured Tasks Support Book v4 or “OCR ICT for AS” first edition by Paul Long et al. You will find the activities/tasks in this chapter particularly useful for your own coursework project for unit G064. Depending on the type of project you are doing (eg Spreadsheet/Database), follow the appropriate tasks. Clicking on the hyperlinks for tasks will take you to copies of the tasks that have been included with this online book to save you using the AS book. The hyperlinks for examples take you to a developed version of the example but you will need the AS book or Support Book v4 for the actual test plans.
Task/Activity Software First Edition Page
Support Book v4 Page
Example: Quiz Validation Test Plan Any 278 Example: Testing Relationships (Car Insurance) Database 283 Example: Navigational Paths Test Plan Any 284 Task: Navigational Paths Test Plan Any 285 Example: Validation Test Plan (Mileage) Any 286 Task: Validation Test Plan Spreadsheet / Database / Website 286 Example: Calculations Test Plan Spreadsheet / Database 286 Task: Formulae Test Plan Spreadsheet / Database 287 Example: Query Test Plan (Peripherals) Database 287 Example: Multimedia Test Plan Presentation / Website 288 Task: Multimedia Test Plan Presentation / Website 288
e. describe the contents of the requirements specification, the design specification and the system specification, distinguishing between them
These 3 specifications can be summarised as follows:
Requirements Specification
The requirements specification is a document that specifies in detail exactly what the client wants the system to be able to do. The document is produced by the systems analyst and it forms a contract between the development team and the client (user). The requirements specification will include:
the scope of the system (the limits of what is to be developed)
the objectives of the system
deadlines which must be met
input requirements (input screens, data capture forms etc)
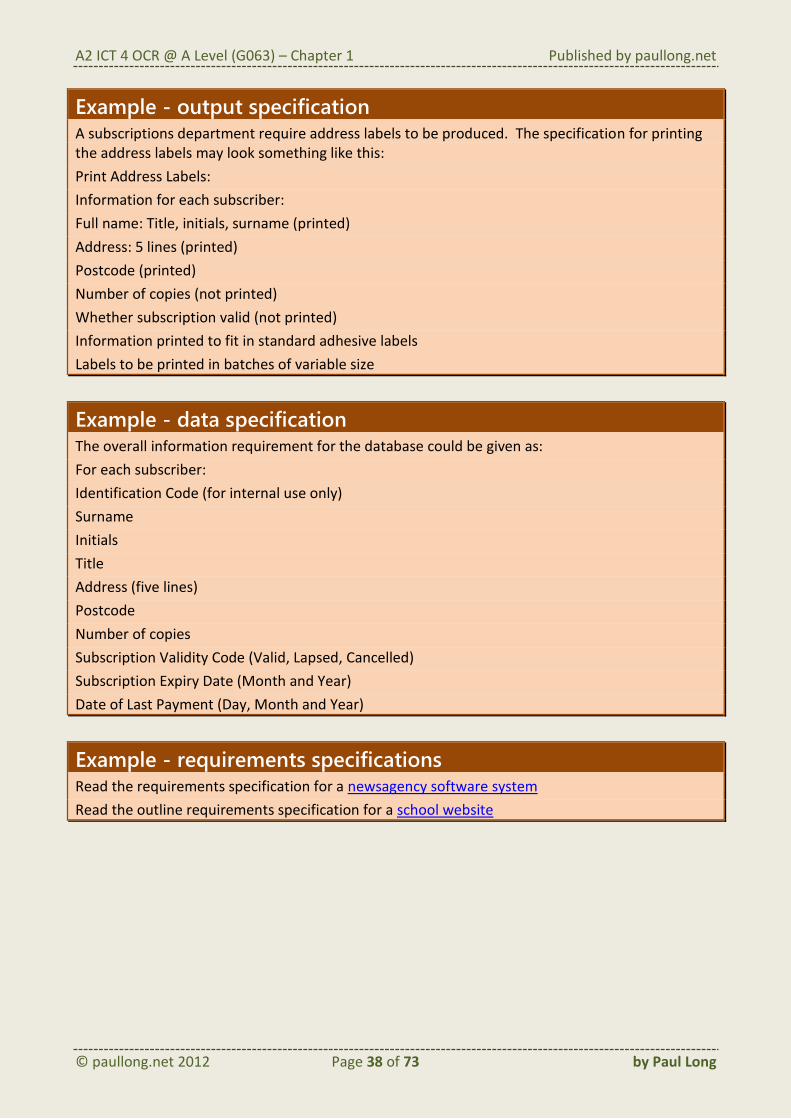
Example - output specification A subscriptions department require address labels to be produced. The specification for printing the address labels may look something like this:
Print Address Labels:
Information for each subscriber:
Full name: Title, initials, surname (printed)
Address: 5 lines (printed)
Postcode (printed)
Number of copies (not printed)
Whether subscription valid (not printed)
Information printed to fit in standard adhesive labels
Labels to be printed in batches of variable size
Example - data specification The overall information requirement for the database could be given as:
The design specification is effectively the documentation that is produced by the designer. It will include:
the data dictionary tables, fields, data formats and formulae validation routines and error messages relationships including an ERD (entity relationship diagram)
sketches of layouts of data capture methods for example membership application forms, OMR sheets or questionnaires
sketches of data entry screen layouts
sketches of output layouts (eg reports)
fonts, colours, sizes & styles to use
types of data entry to use (eg combo box / text box / list box / option buttons)
screen resolutions and proportions
page sizes and orientations
instructions to be included
animations / transitions
button actions and other processes
style templates
file naming conventions
purpose of formulae (not actual formula, but what each needs to do)
pseudo code (a language in a particular structure that most people can understand and is used to describe the processes that will take place)
flow charts to show the order of processes and decisions that are made
Design Task Attempt to design a couple of small parts of the newsagency software system or school website based upon their requirements.
Identify any weaknesses in the requirements specification that made it difficult to complete the designs.
System Specification
This document identifies the minimum software and hardware required in order for the system to run effectively. It would normally be produced during the design stage. It will include:
System specification Task – follow me Use the world wide web to find out what the minimum hardware and software requirements are for the latest version of Microsoft Office.
Questions – follow me 1) Describe two items you would expect to find in a requirements specification. [2]
2) Identify four items you would expect to find in a design specification. [4]
3) During which stage of the system life cycle is the requirements specification produced? [1]
4) Describe the system specification. [2]
5) Describe two differences between the requirements and the design specifications. [4]
f. describe the roles and responsibilities of the following members of the project team: project manager, systems analyst, systems designer, programmer and tester
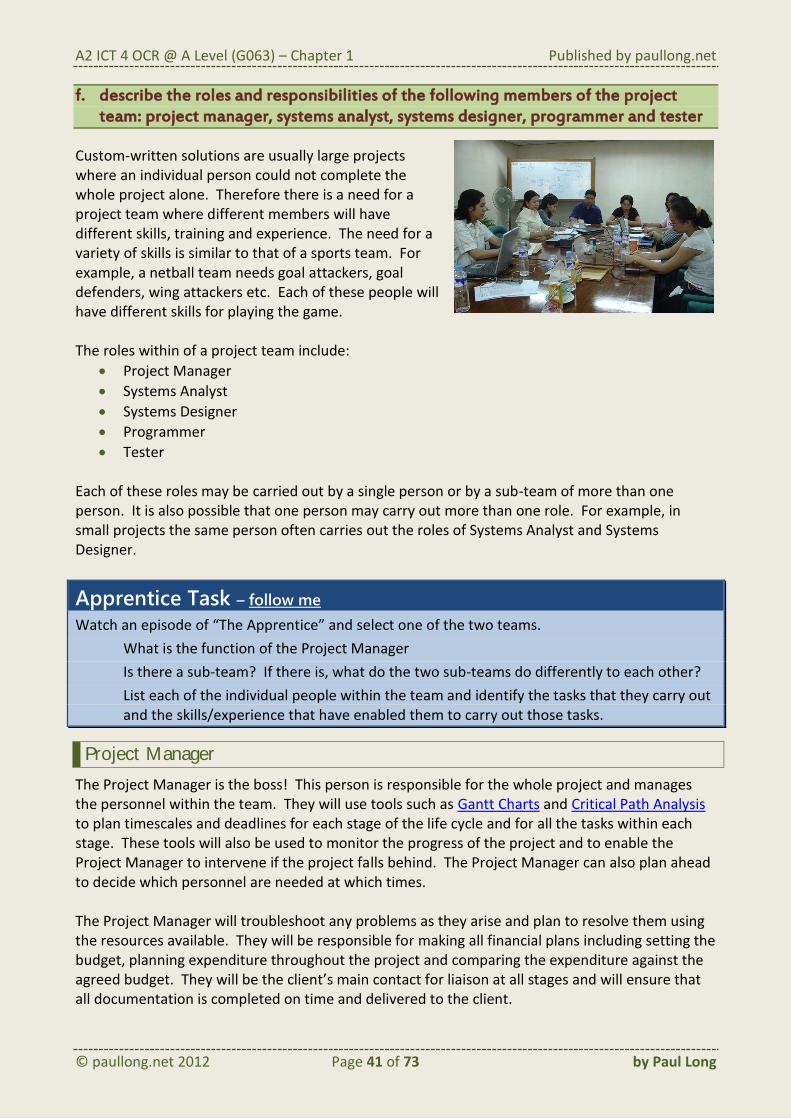
Custom-written solutions are usually large projects where an individual person could not complete the whole project alone. Therefore there is a need for a project team where different members will have different skills, training and experience. The need for a variety of skills is similar to that of a sports team. For example, a netball team needs goal attackers, goal defenders, wing attackers etc. Each of these people will have different skills for playing the game. The roles within of a project team include:
Project Manager
Systems Analyst
Systems Designer
Programmer
Tester Each of these roles may be carried out by a single person or by a sub-team of more than one person. It is also possible that one person may carry out more than one role. For example, in small projects the same person often carries out the roles of Systems Analyst and Systems Designer.
Apprentice Task – follow me Watch an episode of “The Apprentice” and select one of the two teams.
What is the function of the Project Manager
Is there a sub-team? If there is, what do the two sub-teams do differently to each other?
List each of the individual people within the team and identify the tasks that they carry out and the skills/experience that have enabled them to carry out those tasks.
Project Manager
The Project Manager is the boss! This person is responsible for the whole project and manages the personnel within the team. They will use tools such as Gantt Charts and Critical Path Analysis to plan timescales and deadlines for each stage of the life cycle and for all the tasks within each stage. These tools will also be used to monitor the progress of the project and to enable the Project Manager to intervene if the project falls behind. The Project Manager can also plan ahead to decide which personnel are needed at which times. The Project Manager will troubleshoot any problems as they arise and plan to resolve them using the resources available. They will be responsible for making all financial plans including setting the budget, planning expenditure throughout the project and comparing the expenditure against the agreed budget. They will be the client’s main contact for liaison at all stages and will ensure that all documentation is completed on time and delivered to the client.
This person is responsible for the investigation and analysis stage which involves analysing the current systems and writing the requirements specification. The main tasks that the analyst will carry out include those listed in chapter 1 learning objective b:
conducting interviews with client and users
creating and analysing questionnaires
observing the users at work
examining documents The Systems Analyst may work alone or may have a team of other analysts to help with this stage of the life cycle.
Systems Designer
This person is responsible for the design stage which involves following the requirements specification in order to produce a design specification. They will design and plan all aspects of the proposed system. The general tasks of a Systems Designer include:
liaising with the analyst following the investigation and analysis stage to ensure the requirements specification is followed
liaising with programmers before and during the development stage
liaising with the client to get feedback and act upon it
selecting the actual hardware and software that will be used
creating the design specification
creating a test plan
Programmer
This is the person or group of people that will implement (develop) the system during the implementation stage of the life cycle. The tasks will include:
liaising with the designer at the end of the design stage to ensure the design specification is followed
following the design specification
creating the software solution using software including writing any programming code
creating the technical documentation
liaising with the client to obtain feedback
Tester
This is the person or team that will be responsible for testing the system during the testing stage of the life cycle. The tester will follow the test plan and their aim will be to find errors within the system. Although they work for the same company as the Programmer, they are not expected to
A2 ICT 4 OCR @ A Level (G063) – Chapter 1 Published by paullong.net
be ‘gentle’ and let small mistakes go. They must identify the mistakes in order that the system can be improved before it is handed over to the client. The tester will document all the results of the testing and compare the actual results of each test with the expected results. When the actual results do not meet the expected results, the tester will feedback this information to the Programmer so that corrections can be made. At time is can appear that the tester works against the Software Developer because the aim of the tester is to find errors that the Software Developer has made. The motivation of the Tester is to find bugs and errors by testing the system to its limits. For this reason, a Testing team can be known as the ‘Black team of death’. However, the Tester is actually helping the whole team, including the Software Developer, by identifying the errors before the final version is given to the client. You could compare the Tester to you teacher who checks your coursework before you submit it. Lots of red ink from your teacher can be a good thing because your teacher is helping you to improve your work rather than just leaving it with errors.
Questions – follow me 1) Identify three tasks carried out by the Programmer. [3]
2) Describe two roles of the Systems Analyst. [2]
3) Describe two responsibilities of the Tester [2]
g. describe, interpret and create critical path analysis (CPA) and Gantt charts, and for each explain its suitability for use in a given application
Critical Path Analysis (CPA) and Gantt charts are tools used by Project Managers to help plan the project. They are particularly focussed on planning timescales and the resources required. Software tools are used to create these charts. Critical Path Analysis is also known as Critical Path Method (CPM).
Gantt Charts
Gantt Chart produced using Gantt Project from http://www.ganttproject.biz See sample file.
Describing Gantt Charts
A Gantt Chart is effectively a timeline showing each of the tasks as a blocked line. The length of the line represents how long each task will take. A Gantt Chart is created by listing all of the tasks, how long each task will take (usually in days) and then adding any dependencies. Dependencies are tasks which must take place before another task can be started. For example, before you drive a car, you must have passed your test, purchased a car, insured it, taxed it and got an MOT. These are all dependencies for driving a car.
Example – Gantt chart This example has been created using OpenProj software. This is freeware and so you can download it and use it at home. The file that this project is saved in can be opened here.
This example is all about making breakfast. The tasks that need to be completed have been listed together with their durations. It’s not possible to use minutes, so imagine that each day is a minute. The first 3 tasks can all be started straight away and completed at the same time. Three different people could do these things and so it’s possible that the tasks can be run concurrently (at the same time). When it comes to frying the bacon, there are two dependencies for this task. Firstly, the ingredients must be prepared. Secondly, the cooking utensils must be ready. For this reason, frying the bacon cannot take place until these two dependencies have been completed.
The table below shows how the dependencies (called predecessors in this software) have been entered into the table. The diagram is then changed to show which tasks can be completed and when. Notice that serving the food cannot happen until all the cooking has been completed and all the crockery and cutlery is ready.
The red line shows the Critical Path. This is the shortest time that the project can take. If there are any delays to the tasks along the critical path then the whole project will be delayed. Later in this section, you will see how this can be turned into a diagram.
Gantt spreadsheet Task Use this spreadsheet template to create a Gantt Chart for the example above. You will need to create 2 new rows to fit in all 9 tasks. Enter the number of minutes in the M (most likely) column as a number of days. Alternatively, use jxProject.
This spreadsheet template works slightly differently because it uses a method called PERT (Program Evaluation Review Technique) which calculates times for tasks based upon minimum, most likely and maximum estimates. You will therefore need to estimate minimum and maximum times as well. These can be any sensible estimate.
Gantt Charts can be used when planning the project in order to schedule tasks and personnel. They can also be used to monitor progress throughout the project.
Interpreting Gantt Charts
In an exam, you may be asked to interpret a Gantt Chart. The example and task below take you through interpreting a Gantt Chart.
Example This example uses this Gantt Chart which was created using Gantt Project.
This project is about creating a database and installing it for the customer. It is the same example used in the G064 Model Project. In this chart, you can see straight away that the longest task is changeover which is also the last task. You should also notice that there is a gap between June and July when there was probably a company holiday. Each of the arrows represents a dependency from an earlier task.
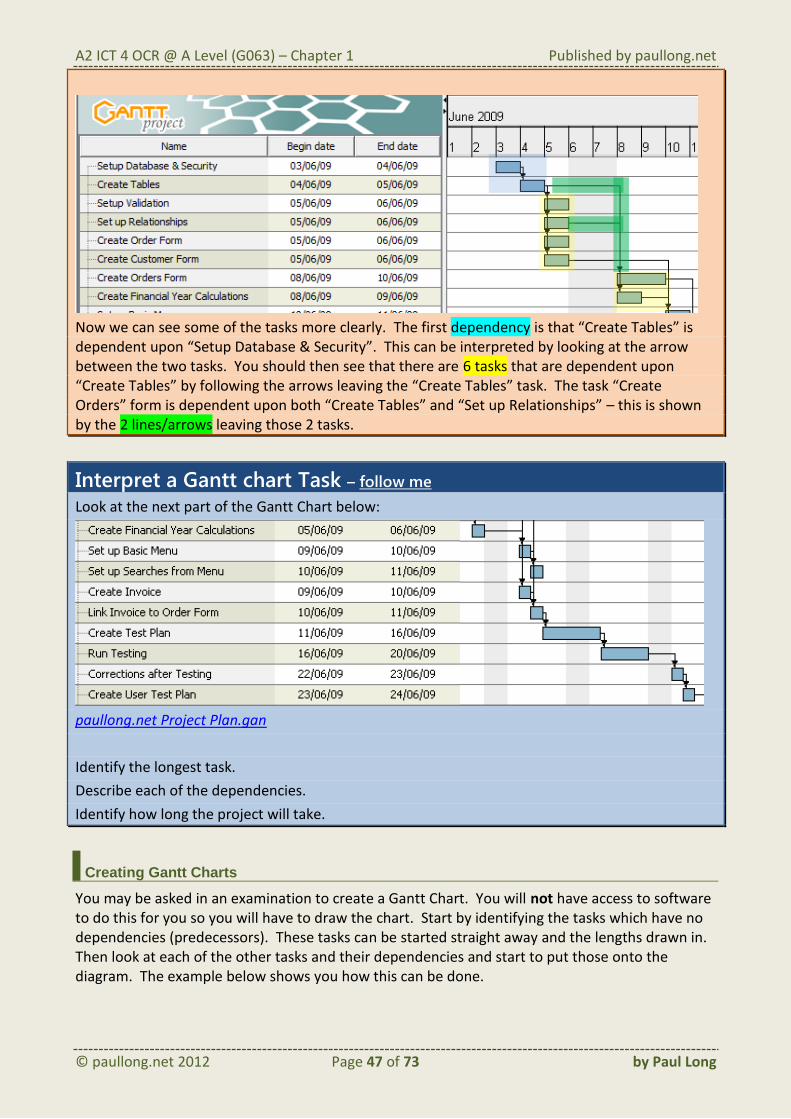
Now we can see some of the tasks more clearly. The first dependency is that “Create Tables” is dependent upon “Setup Database & Security”. This can be interpreted by looking at the arrow between the two tasks. You should then see that there are 6 tasks that are dependent upon “Create Tables” by following the arrows leaving the “Create Tables” task. The task “Create Orders” form is dependent upon both “Create Tables” and “Set up Relationships” – this is shown by the 2 lines/arrows leaving those 2 tasks.
Interpret a Gantt chart Task – follow me Look at the next part of the Gantt Chart below:
paullong.net Project Plan.gan
Identify the longest task.
Describe each of the dependencies.
Identify how long the project will take.
Creating Gantt Charts
You may be asked in an examination to create a Gantt Chart. You will not have access to software to do this for you so you will have to draw the chart. Start by identifying the tasks which have no dependencies (predecessors). These tasks can be started straight away and the lengths drawn in. Then look at each of the other tasks and their dependencies and start to put those onto the diagram. The example below shows you how this can be done.
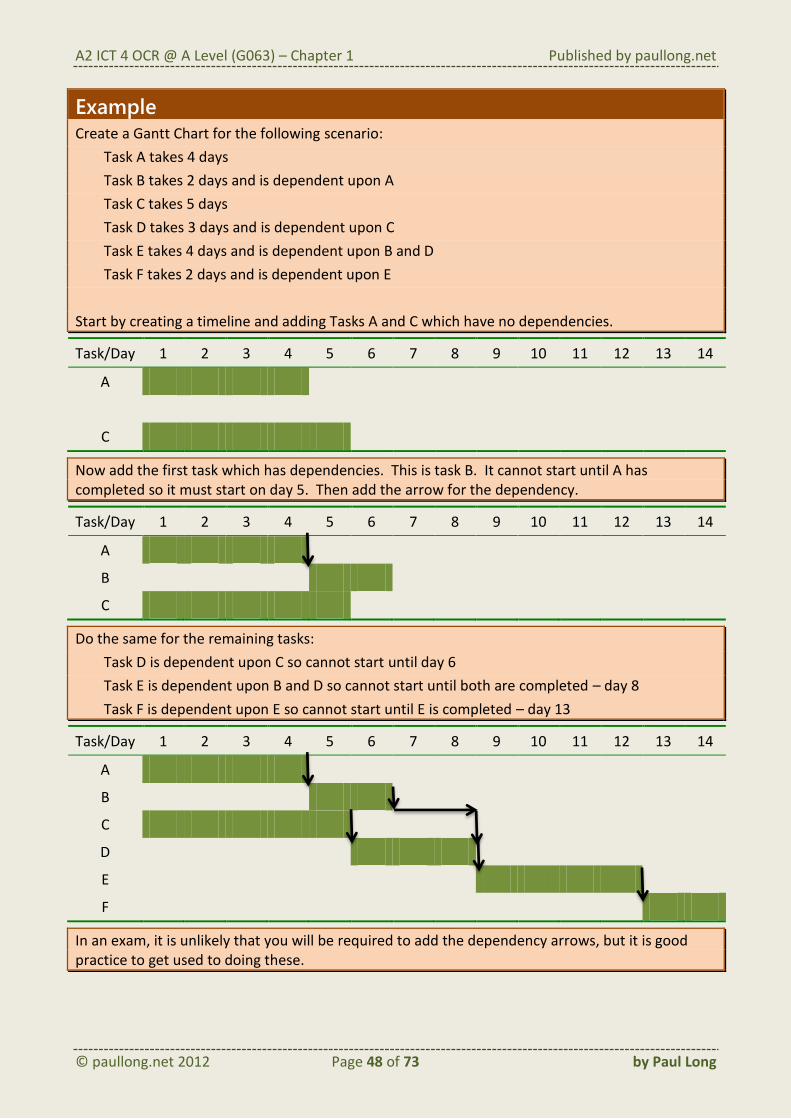
Example Create a Gantt Chart for the following scenario:
Task A takes 4 days
Task B takes 2 days and is dependent upon A
Task C takes 5 days
Task D takes 3 days and is dependent upon C
Task E takes 4 days and is dependent upon B and D
Task F takes 2 days and is dependent upon E
Start by creating a timeline and adding Tasks A and C which have no dependencies.
Task/Day 1 2 3 4 5 6 7 8 9 10 11 12 13 14
A
C
Now add the first task which has dependencies. This is task B. It cannot start until A has completed so it must start on day 5. Then add the arrow for the dependency.
Task/Day 1 2 3 4 5 6 7 8 9 10 11 12 13 14
A
B
C
Do the same for the remaining tasks:
Task D is dependent upon C so cannot start until day 6
Task E is dependent upon B and D so cannot start until both are completed – day 8
Task F is dependent upon E so cannot start until E is completed – day 13
Task/Day 1 2 3 4 5 6 7 8 9 10 11 12 13 14
A
B
C
D
E
F
In an exam, it is unlikely that you will be required to add the dependency arrows, but it is good practice to get used to doing these.
A2 ICT 4 OCR @ A Level (G063) – Chapter 1 Published by paullong.net
Task – follow me Create a Gantt Chart for the following scenario:
Task A takes 1 day
Task B takes 4 days
Task C takes 5 days and is dependent upon A
Task D takes 3 days and is dependent upon B
Task E takes 4 days and is dependent upon C and D
Task F takes 3 days and is dependent upon E
Task/Day 1 2 3 4 5 6 7 8 9 10 11 12 13 14
A
B
C
D
E
F
Add dependency arrows to the Gantt Chart.
Critical Path Analysis
Describing Critical Path Analysis Diagrams
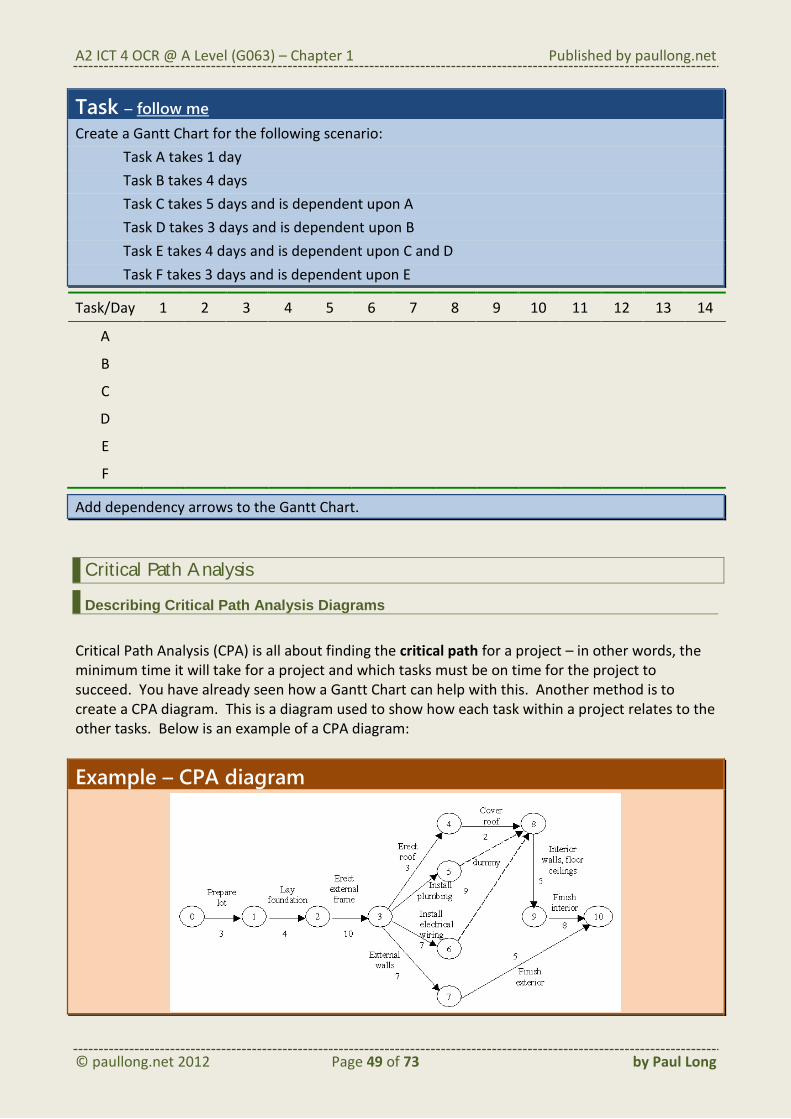
Critical Path Analysis (CPA) is all about finding the critical path for a project – in other words, the minimum time it will take for a project and which tasks must be on time for the project to succeed. You have already seen how a Gantt Chart can help with this. Another method is to create a CPA diagram. This is a diagram used to show how each task within a project relates to the other tasks. Below is an example of a CPA diagram:
There are many ways of creating this diagram, but this is the method preferred by OCR. Each of the tasks are listed by the lines. The numbers by the arrows represent the number of days each task takes. The numbers in circles represent milestones – these are points which have been reached within a project. Each arrow represents a dependency. CPA diagrams are used by Project Managers to see visually which tasks must be completed before others can commence. It shows the dependencies for each task and which tasks must be completed sequentially (one after another) and also which tasks can be completed concurrently (at the same time).
Example – Alternative CPA diagram An alternative method of producing a CPA diagram can be seen here.
Interpreting Critical Path Analysis Diagrams
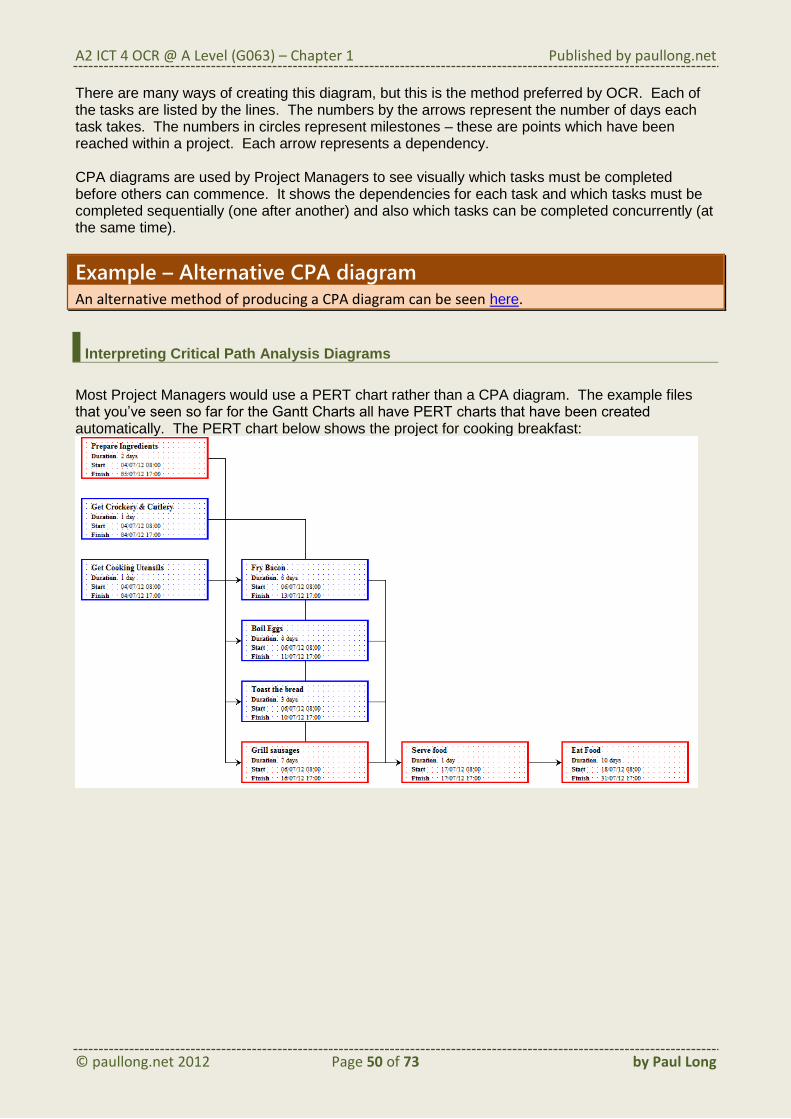
Most Project Managers would use a PERT chart rather than a CPA diagram. The example files that you’ve seen so far for the Gantt Charts all have PERT charts that have been created automatically. The PERT chart below shows the project for cooking breakfast:
Example – Interpreting a CPA diagram For the cooking breakfast example, we are going to use a style of CPA diagram that might typically be given in an examination.
0 represents that start of the project.
F represents the finish of the project.
When the ingredients are prepared and cooking utensils retrieved, milestone 1 is reached which is 2 minutes.
The longest task is to Eat Food which is 8 minutes
There are 3 shortest tasks of 1 minute each.
Between milestone 1 and milestone 2, there are 4 tasks. The longest of these is 7 minutes and so that forms the critical path.
To calculate the critical path, it is necessary to look at the longest time it takes to get to each milestone.
1) The longest task between 0 and 1 is Prepare Ingredients – 2 minutes
2) The longest task between 1 and 2 is Grill Sausages which is 7 minutes. However, there is another task of Getting the Cutlery but this is only 1 minute. Add the 7 minutes to the 2 minutes to get to milestone 1 and the critical path is 9 minutes so far.
3) Add the 1 minute to Serve the Food and the critical path is 10 minutes so far.
4) Add the 8 minutes to Eat Breakfast and the critical path is 18 minutes long. Therefore, 18 minutes should be allowed each morning for cooking and eating breakfast.
Calculate how long the project will take by following the critical path.
Creating Critical Path Analysis Diagrams
Example – Creating a CPA Diagram Create a CPA diagram for the following scenario:
Task A takes 4 days
Task B takes 2 days and is dependent upon A
Task C takes 5 days
Task D takes 3 days and is dependent upon C
Task E takes 4 days and is dependent upon B and D
Task F takes 2 days and is dependent upon E
This is the same set of tasks used to create the example Gantt chart. The best way to draw a CPA diagram is to work backwards from the final tasks and then draw on each dependency. It’s also wise to use a pencil and paper. Therefore, start with the finish and add on task F which takes 2 days.
You now have a milestone 2 days before F. Task F is only dependent upon task E, so task E can be added to the diagram:
Task E is dependent upon both B and D so you will have two arrows coming towards it:
B is dependent upon A so you can add the arrow for A and because A has no dependencies, you also know that you have reached the start:
Finally, you know that D is dependent upon C and so the arrow for C can be added and the milestones can be put in.
The critical path is worked out by looking at how long it takes to get to milestone 3. A+B is 4+2=6 days. C+D is 5+3=8 days. Therefore, it takes 8 days to get to milestone 3, another 2 days to get to milestone 4 and another 2 days to get to milestone F which means the critical path is 12 days long.
F
F
2
E
2
F
F
2
E
2
F
F
2
E
2 0
F
F
2 4
E
2 3 0
1
2
A2 ICT 4 OCR @ A Level (G063) – Chapter 1 Published by paullong.net
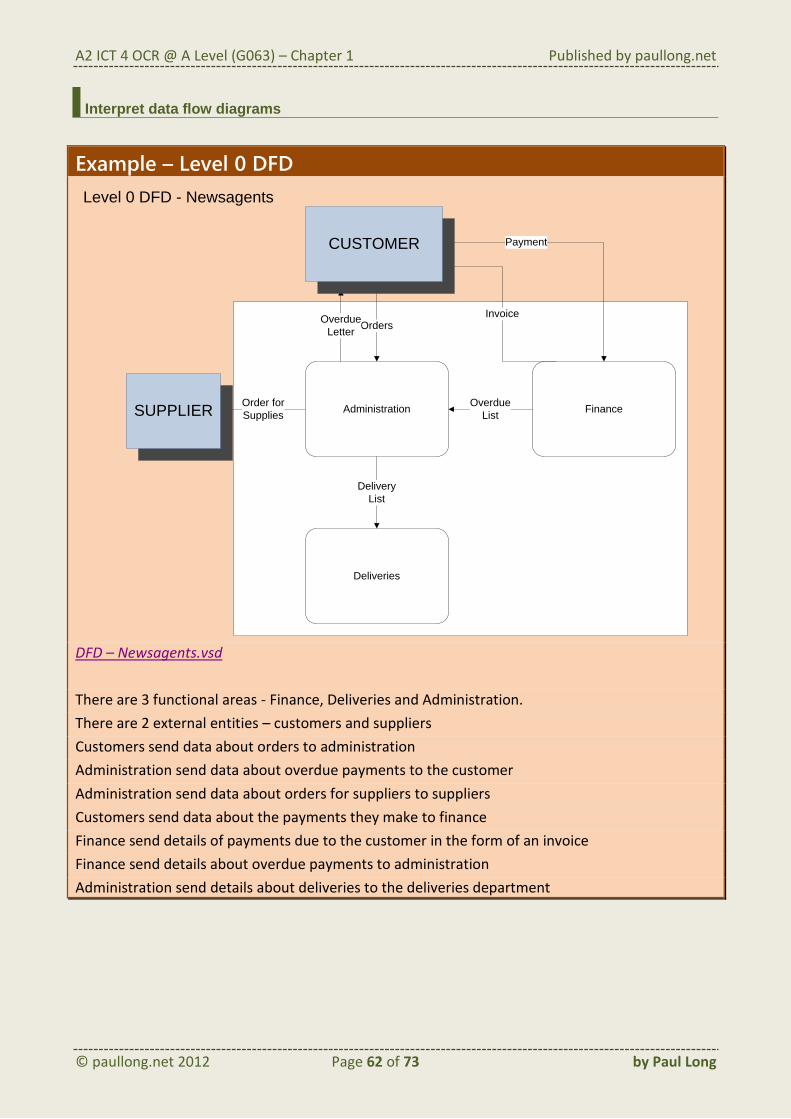
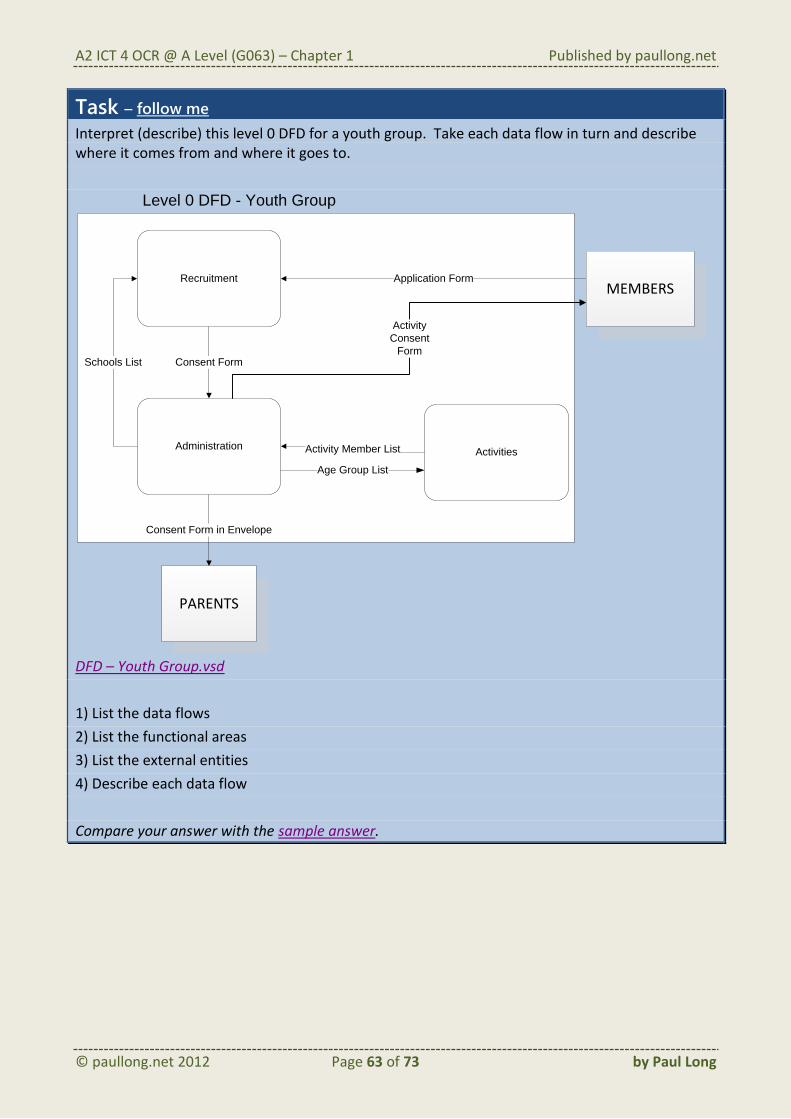
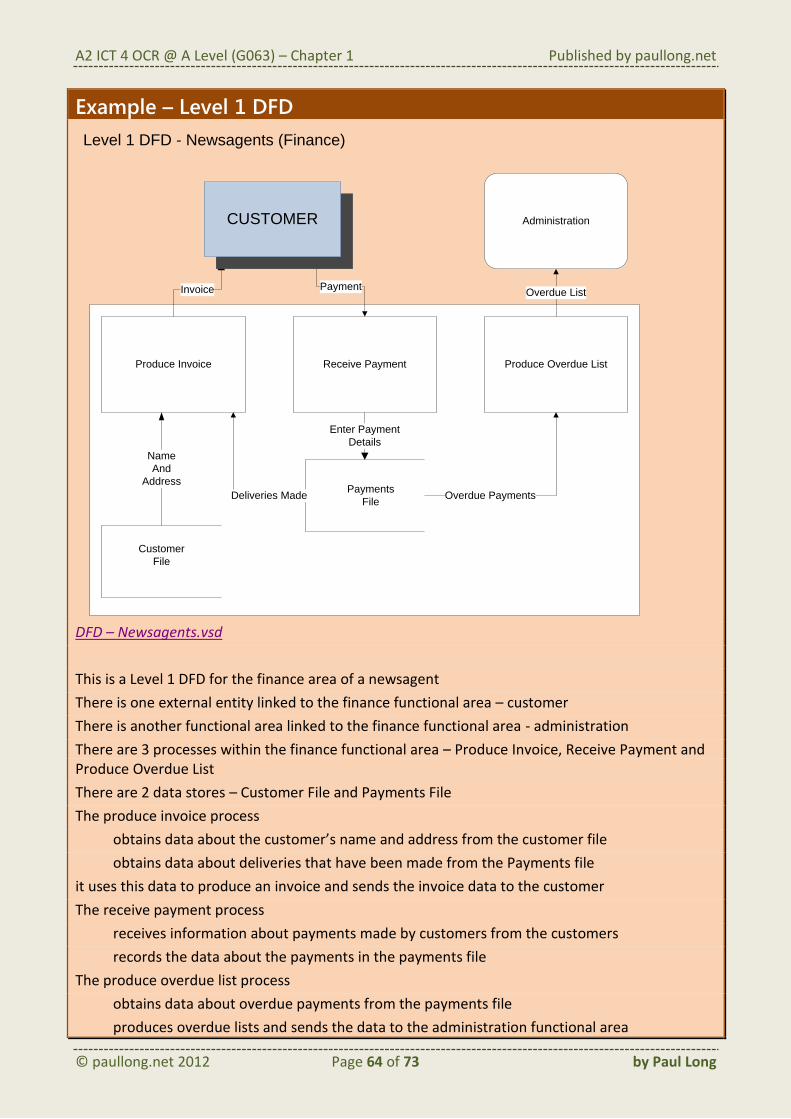
h. describe, interpret and create data flow diagrams and flowcharts, and for each explain its suitability for use in a given application.
During the analysis stage, diagrams are used as models to show what the current system looks like and how it works. Analysts and users can then use these diagrams to check that they both understand the current system in the same way. They can also be used during design to show how the new system should work. The designer can show the diagrams to the user and get feedback about whether this is what the user actually wants the new system to do. The diagrams can then be followed during the development stage. Although the focus in this section is on flow charts and data flow diagrams, you should also be aware that entity relationship diagrams (ERDs) are also used during analysis and design. You studied these at AS Level. For the exam, you will need to be able to:
describe the different types of diagrams – flowcharts and data flow diagrams
interpret a diagram to describe what it is showing
create a diagram based upon a given scenario
explain the suitability of each diagram for a purpose
Flowcharts
Describe flowcharts and explain their suitability
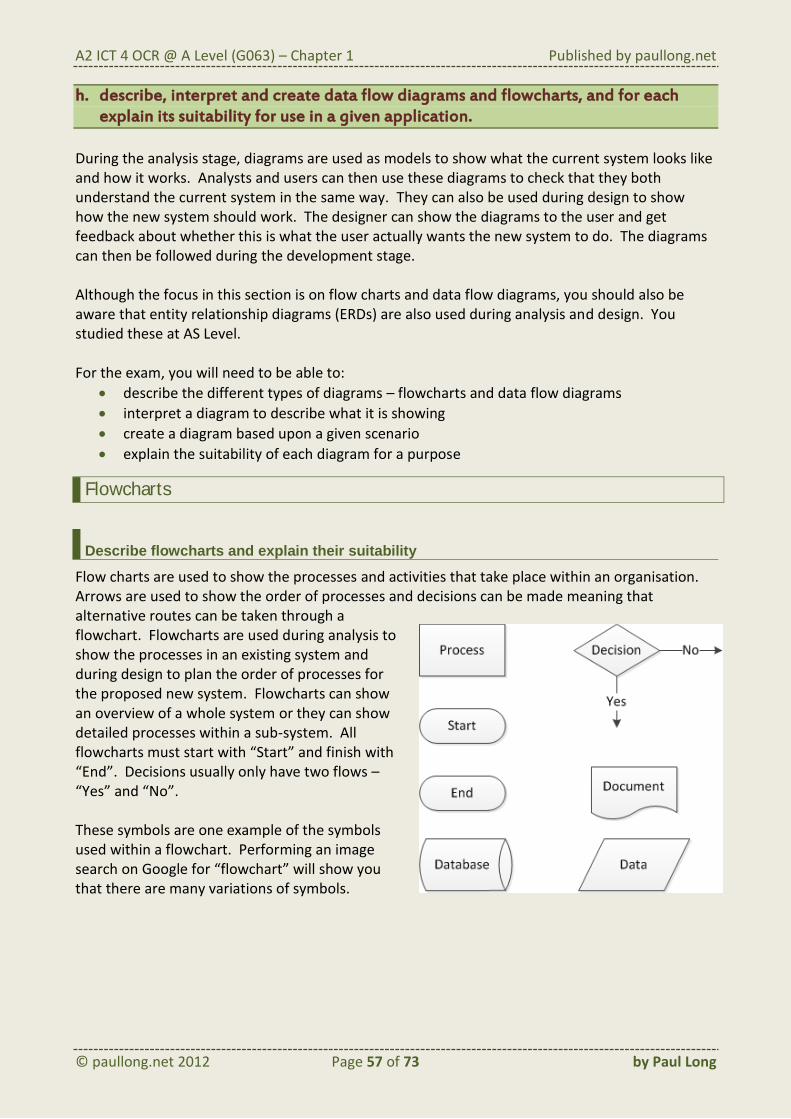
Flow charts are used to show the processes and activities that take place within an organisation. Arrows are used to show the order of processes and decisions can be made meaning that alternative routes can be taken through a flowchart. Flowcharts are used during analysis to show the processes in an existing system and during design to plan the order of processes for the proposed new system. Flowcharts can show an overview of a whole system or they can show detailed processes within a sub-system. All flowcharts must start with “Start” and finish with “End”. Decisions usually only have two flows – “Yes” and “No”. These symbols are one example of the symbols used within a flowchart. Performing an image search on Google for “flowchart” will show you that there are many variations of symbols.
A2 ICT 4 OCR @ A Level (G063) – Chapter 1 Published by paullong.net
In an exam, you might be shown a flowchart and asked to interpret it. Below is an example of how this could be done.
Example The flowchart below shows what happens when after a user has filled in an online website form to make a complaint to customer services. It shows the validation process that takes place.
User clicks submit
Is name box
empty?
Display
confirmation page
Inform user of
name errorY
N
Does e-mail
have @
symbol
Inform user of
email errorN
Y
User makes
changes
Is complaint
max 200
characters?
Inform user of
complaint errorN
Y
Is order code 7
characters
long?
Inform user of
emailerrorN
Y
Send data to
customer services
End
Start
This indicates the start of the process.
Process: the user clicks submit and then the validation begins.
Decision: a check is performed to see if the name box is empty.
Process: If it is, then the user is informed of the error and then another process allows the user to make changes. Before clicking submit again.
If the name box was not empty, then another decision is made to see if the e-mail address has an @ symbol included. If it does not have an @ symbol then the user is informed of the email error and then allowed to make changes before clicking submit again.
Similar decisions take place with regard to the length of the complaint text and the order code.
If all the checks are successful then the data is sent to customer services. The next process displays a confirmation page as an output (document) to the user before this section is completed (end).
In summary, the user submits their complaint, if there are errors then the user is informed of them before being allowed to submit the complaint again. If there are no errors then the data is sent to customer services and a confirmation page displayed.
A2 ICT 4 OCR @ A Level (G063) – Chapter 1 Published by paullong.net
When you create a flowchart, you should always start with the “Start” symbol. Identify the processes and the decisions. Now add the first process and continue to add on decisions and processes as per the scenario. Each decision will need to be a question with a “yes” or “no” route. If an output is produced, then use the output symbol. You can also use the data and database symbols, although it is unlikely that these will be used in an exam.
Task – follow me Create a flowchart for the following scenario:
A customer books a collection of a parcel from a delivery firm
If the booking is made before 3pm, the collection is made the same day, otherwise it is
made the next day
If the booking is made between 3pm Friday and 3pm Monday then it is collected on the
Monday
When the parcel is collected, the customer is given a receipt
The parcel is then taken to the local depot
If the parcel is to go to the local area, it is left at the depot overnight
If the parcel is for another area of the country, it is sent to a different depot
The parcel is then put onto a delivery van
The driver attempts to deliver the parcel
If the recipient is at home, the parcel is delivered
If the recipient is not at home, the parcel is returned to the depot so it can be delivered the
next day
You can see the answer in Visio format or JPEG format.
If you are finding this difficult, then try using part of the answer (Visio here or PDF here) and you can complete the rest.
Data Flow Diagrams
Describe data flow diagrams and explain their suitability
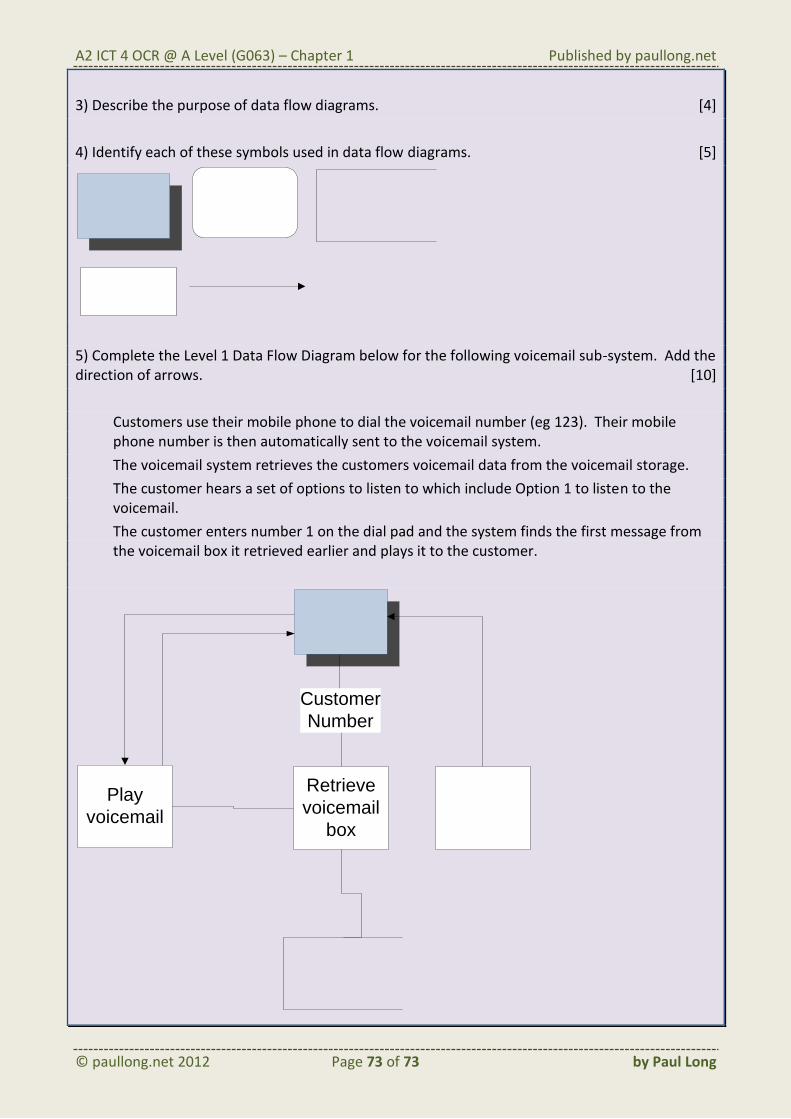
Data flow diagrams (DFD) are used to show how data flows within a system. They do not show processes that take place in order like a flow chart does. It’s all about the flow of data and how the data moves from one place to another. A data flow diagram consists of the following features:
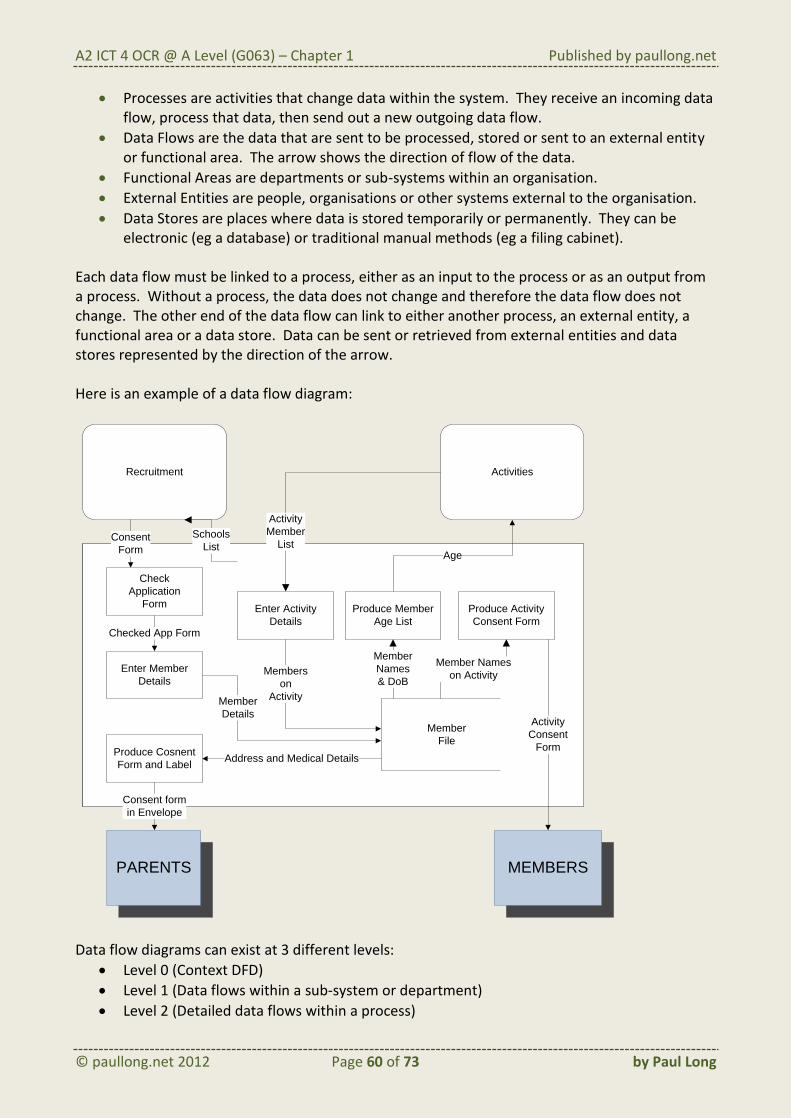
Processes are activities that change data within the system. They receive an incoming data flow, process that data, then send out a new outgoing data flow.
Data Flows are the data that are sent to be processed, stored or sent to an external entity or functional area. The arrow shows the direction of flow of the data.
Functional Areas are departments or sub-systems within an organisation.
External Entities are people, organisations or other systems external to the organisation.
Data Stores are places where data is stored temporarily or permanently. They can be electronic (eg a database) or traditional manual methods (eg a filing cabinet).
Each data flow must be linked to a process, either as an input to the process or as an output from a process. Without a process, the data does not change and therefore the data flow does not change. The other end of the data flow can link to either another process, an external entity, a functional area or a data store. Data can be sent or retrieved from external entities and data stores represented by the direction of the arrow. Here is an example of a data flow diagram:
Recruitment Activities
Check
Application
Form
Produce Cosnent
Form and Label
Enter Member
Details
Enter Activity
Details
Produce Member
Age List
Produce Activity
Consent Form
Member Names
on Activity
Member
Names
& DoBMembers
on
Activity
Activity
Member
ListAge
Activity
Consent
Form
Member
File
Schools
ListConsent
Form
Checked App Form
Consent form
in Envelope
Address and Medical Details
Member
Details
MEMBERSPARENTS
Data flow diagrams can exist at 3 different levels:
Level 0 (Context DFD)
Level 1 (Data flows within a sub-system or department)
Level 2 (Detailed data flows within a process)
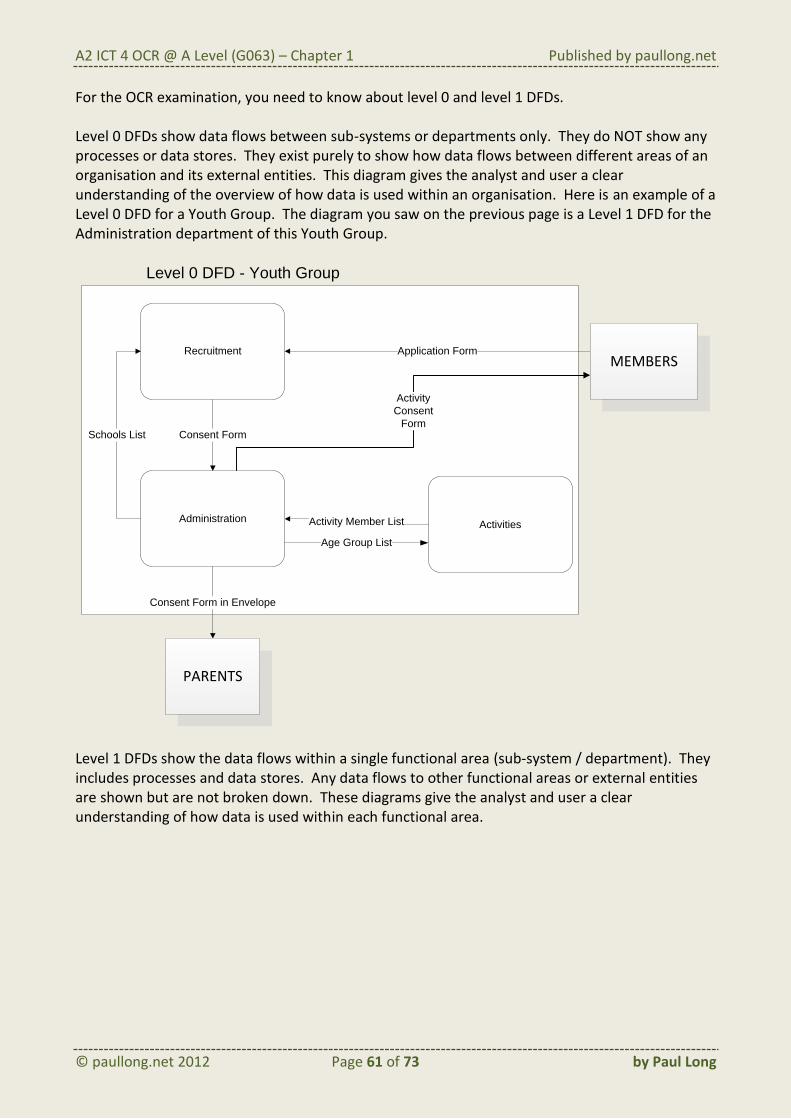
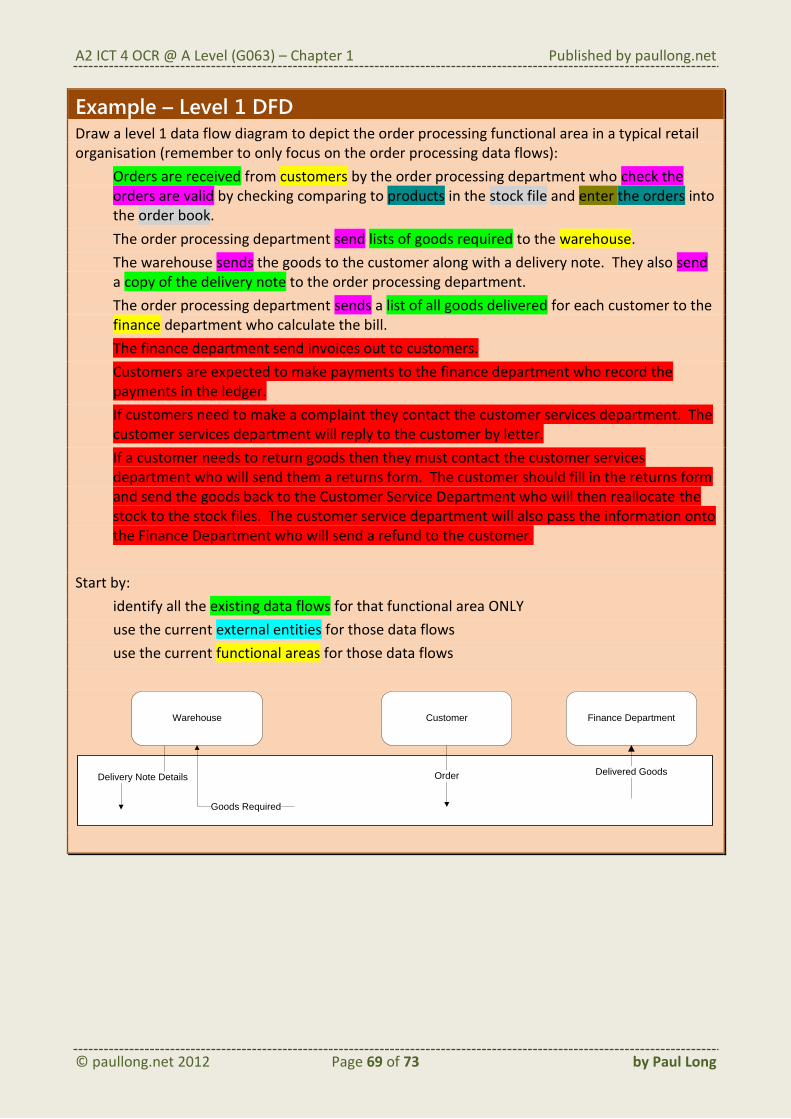
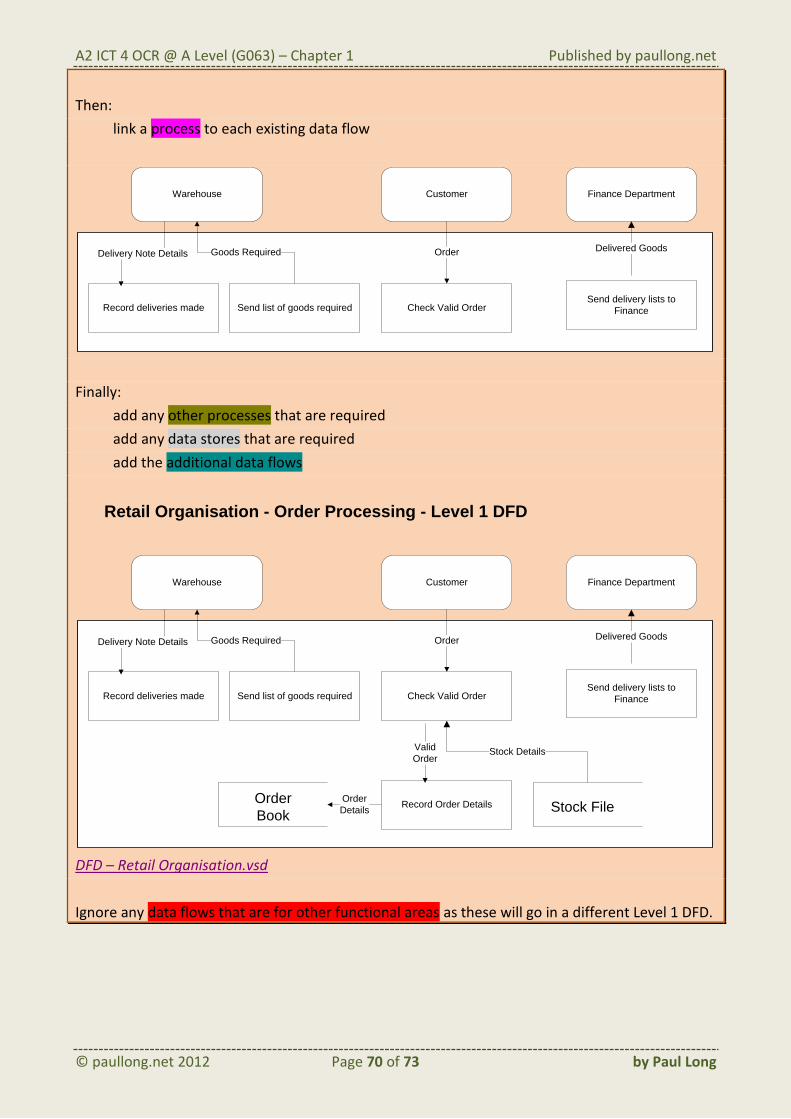
A2 ICT 4 OCR @ A Level (G063) – Chapter 1 Published by paullong.net
For the OCR examination, you need to know about level 0 and level 1 DFDs. Level 0 DFDs show data flows between sub-systems or departments only. They do NOT show any processes or data stores. They exist purely to show how data flows between different areas of an organisation and its external entities. This diagram gives the analyst and user a clear understanding of the overview of how data is used within an organisation. Here is an example of a Level 0 DFD for a Youth Group. The diagram you saw on the previous page is a Level 1 DFD for the Administration department of this Youth Group.
Recruitment
AdministrationActivities
Consent FormSchools List
Application Form
Consent Form in Envelope
Activity
Consent
Form
Activity Member List
Age Group List
Level 0 DFD - Youth Group
PARENTS
MEMBERS
Level 1 DFDs show the data flows within a single functional area (sub-system / department). They includes processes and data stores. Any data flows to other functional areas or external entities are shown but are not broken down. These diagrams give the analyst and user a clear understanding of how data is used within each functional area.
A2 ICT 4 OCR @ A Level (G063) – Chapter 1 Published by paullong.net
Interpret (describe) this level 1 DFD for the administration functional area of the youth group. Take each data flow in turn and describe where it comes from and where it goes to.
Recruitment Activities
Check
Application
Form
Produce Cosnent
Form and Label
Enter Member
Details
Enter Activity
Details
Produce Member
Age List
Produce Activity
Consent Form
Member Names
on Activity
Member
Names
& DoBMembers
on
Activity
Activity
Member
ListAge
Activity
Consent
Form
Member
File
Schools
ListConsent
Form
Checked App Form
Consent form
in Envelope
Address and Medical Details
Member
Details
Level 1 DFD - Youth Group (Administration)
MEMBERSPARENTS
DFD – Youth Group.vsd
1) List the data flows
2) List the processes
3) List the data stores
4) List the functional areas that are external to this process
To create a Level 0 DFD, start by identifying each:
Functional area (department / sub-system)
External entity Add the functional areas and external entities to a diagram but don’t link them yet. Ignore any processes at this stage (they are for level 1 DFDs. Now read the information gathered during analysis to create the data flows between functional areas and external entities. When you identify the data flows, bear in mind that you are focussing on data and not on physical objects. For example, if a customer receives a product in the post, it is the data that comes with that product that matters rather than the product itself. This would usually be the data on a delivery note.
Example – Level 0 DFD Draw a level 0 data flow diagram to depict the following data flows in a typical retail organisation:
Orders are received from customers by the order processing department who check the orders are valid and enter the orders into the order book.
The order processing department send lists of goods required to the warehouse.
The warehouse sends the goods to the customer along with a delivery note. They also send a copy of the delivery note to the order processing department.
The order processing department sends a list of all goods delivered for each customer to the finance department who calculate the bill.
The finance department send invoices out to customers.
Customers are expected to make payments to the finance department who record the payments in the ledger.
If customers need to make a complaint they contact the customer services department. The customer services department will reply to the customer by letter.
If a customer needs to return goods then they must contact the customer services department who will send them a returns form. The customer should fill in the returns form and send the goods back to the Customer Service Department who will then reallocate the stock to the stock files. The customer service department will also pass the information onto the Finance Department who will send a refund to the customer.
A2 ICT 4 OCR @ A Level (G063) – Chapter 1 Published by paullong.net
Task – follow me Draw a level 0 data flow diagram to depict the following data flows in a typical school:
An applicant to a school fills in an application form which is sent to the admissions tutor. The admissions tutor will decide whether to accept or reject the applicant and will send an appropriate letter to the student to inform them of the decision. Students who are accepted are recorded on the provisional student lists.
If an applicant accepts a place at the school then they fill in an acceptance form and send it to the Admissions Tutor who will update the provisional list.
The admissions tutor will contact a referee and ask for a reference to be sent in.
All applicants must take a test at an independent testing centre. The test scores are sent from the testing centre to the admissions tutor who checks to see if the score is above the required level.
Once a complete list of students is ready, the Admissions Tutor will pass the list onto the Sixth Form Administrator who records this information into the student record cards.
Once a place has been accepted by a student, the student must fill in a form to request the A Level courses they want to study. This is sent to the Sixth Form Administrator who records the name of each student in the class list.
If a class is full, the Sixth Form Administrator sends a decline note to the student who then has to fill in a change of course form to study something else.
Once all students have selected their courses, the Sixth Form Administrator sends out class lists to each department and a timetable to each student.
A suggested answer can be found here in Visio format or JPG format.
If you find this task difficult, you can try out the partially completed task instead.
Imagine a level 1 DFD as being an expanded window of a functional area. To create a Level 1 DFD:
identify all the existing data flows (from level 0 DFD) for that functional area ONLY
use the current external entities for those data flows
use the current functional areas for those data flows
link a process to each existing data flow
add any other processes that are required
add any data stores that are required
add the additional data flows Ignore any data flows that are for other functional areas as these will go in a different Level 1 DFD.
Example – Level 1 DFD Draw a level 1 data flow diagram to depict the order processing functional area in a typical retail organisation (remember to only focus on the order processing data flows):
Orders are received from customers by the order processing department who check the orders are valid by checking comparing to products in the stock file and enter the orders into the order book.
The order processing department send lists of goods required to the warehouse.
The warehouse sends the goods to the customer along with a delivery note. They also send a copy of the delivery note to the order processing department.
The order processing department sends a list of all goods delivered for each customer to the finance department who calculate the bill.
The finance department send invoices out to customers.
Customers are expected to make payments to the finance department who record the payments in the ledger.
If customers need to make a complaint they contact the customer services department. The customer services department will reply to the customer by letter.
If a customer needs to return goods then they must contact the customer services department who will send them a returns form. The customer should fill in the returns form and send the goods back to the Customer Service Department who will then reallocate the stock to the stock files. The customer service department will also pass the information onto the Finance Department who will send a refund to the customer.
Start by:
identify all the existing data flows for that functional area ONLY
use the current external entities for those data flows
use the current functional areas for those data flows
CustomerWarehouse Finance Department
Delivery Note Details
Goods Required
Order Delivered Goods
A2 ICT 4 OCR @ A Level (G063) – Chapter 1 Published by paullong.net
Task – follow me Draw a level 1 data flow diagram to depict the sixth form administrator functional area in a typical school (only focus on the sixth form administrator data flows):
An applicant to a school fills in an application form which is sent to the admissions tutor. The admissions tutor will decide whether to accept or reject the applicant and will send an appropriate letter to the student to inform them of the decision. Students who are accepted are recorded on the provisional student lists.
If an applicant accepts a place at the school then they fill in an acceptance form and send it to the Admissions Tutor who will update the provisional list.
The admissions tutor will contact a referee and ask for a reference to be sent in.
All applicants must take a test at an independent testing centre. The test scores are sent from the testing centre to the admissions tutor who checks to see if the score is above the required level.
Once a complete list of students is ready, the Admissions Tutor will pass the list onto the Sixth Form Administrator who records this information into the student record cards.
Once a place has been accepted by a student, the student must fill in a form to request the A Level courses they want to study. This is sent to the Sixth Form Administrator who records the name of each student in the class list.
If a class is full, the Sixth Form Administrator sends a decline note to the student who then has to fill in a change of course form to study something else.
Once all students have selected their courses, the Sixth Form Administrator sends out class lists to each department and a timetable to each student.
A suggested answer can be found here in Visio format or JPG format.
If you find this task difficult, you can try out the partially completed task instead.
1) Describe the processes and decisions that take place from the start of this flow chart up to and including “Select Borrower’s Name”. [6]
2) Complete the flowchart from “Select Borrower’s Name” based on the information below: [10]
Peter will then need to select the book. He will do this by scanning the barcode. If the barcode is recognised then he can move on to the next stage, if not then he will need to re-scan the barcode.
He will then need to decide the date the book must be returned. He will be presented with a date that shows him a default date of one month in advance. If he wants to accept this then he clicks on “Accept Date”. If he wants a different date, then he must enter the new date by selecting from an on-screen calendar, then clicking on OK.
Finally, Peter will be asked by the computer if the book should be loaned out. He will be prompted with “Yes” or “No”. If he clicks “Yes”, then the loan is recorded in the database. If he clicks “No” then the loan will be cleared.
3) Describe the purpose of data flow diagrams. [4]
4) Identify each of these symbols used in data flow diagrams. [5]
5) Complete the Level 1 Data Flow Diagram below for the following voicemail sub-system. Add the direction of arrows. [10]
Customers use their mobile phone to dial the voicemail number (eg 123). Their mobile phone number is then automatically sent to the voicemail system.
The voicemail system retrieves the customers voicemail data from the voicemail storage.
The customer hears a set of options to listen to which include Option 1 to listen to the voicemail.
The customer enters number 1 on the dial pad and the system finds the first message from the voicemail box it retrieved earlier and plays it to the customer.