1 Toyota Smarthome Untrimmed: Real-World Untrimmed Videos for Activity Detection Rui Dai, Srijan Das, Saurav Sharma, Luca Minciullo, Lorenzo Garattoni, Francois Bremond, Gianpiero Francesca Abstract—Designing activity detection systems that can be successfully deployed in daily-living environments require datasets that characterizes the challenges typical of real-world settings. In this work, we introduce a new untrimmed daily-living dataset that features several real-world challenges: Toyota Smarthome Untrimmed (TSU). TSU contains a wide variety of activities performed in a spontaneous manner. Activities are collected in real-world settings, which results in non-optimal viewpoints. The dataset contains dense annotations including elementary, composite activities and activities involving interaction with objects. We provide an analysis of the real-world challenges featured by TSUdataset, highlighting the open issues for detection algorithms. We show that the current state-of-the-art methods fail to achieve satisfactory performance on TSU dataset. We release the dataset for research use at https://project.inria.fr/toyotasmarthome Index Terms—untrimmed videos, activity detection, activities of daily living, real-world settings. ✦ 1 TOYOTA SMARTHOME DATASET This work aims at building a large scale dataset with daily- living activities performed in a natural manner. Activities performed in a spontaneous manner lead to many real- world challenges that are often ignored by the vision com- munity. This includes low inter-class due to presence of similar activities and high intra-class variance, low camera framing, low resolution, long tail distribution of activities and occlusions. To this end, we propose Toyota Smarthome Untrimmed dataset, which provides spontaneous activities with rich and dense annotations to address the detection of complex activities in real-world scenarios. 1.1 Data collection 1.1.1 Collection Setup We use 7 Microsoft Kinect sensors in the recording phase. The apartment plan and camera locations are shown in Fig. 5. Cameras 1 and 2 cover the dinning room area, 4 and 5 the living room, 3, 6 and 7 the kitchen. Thus, we have a coverage over the entire apartment from at least 2 distinct viewing angles. The videos are recorded at 20 frames per second, the size of RGB is VGA (640×480), the standard resolution in most real-world scenarios. The dataset offers 3 modalities: RGB, depth and 3D skeleton (i.e. pose) (see fig. 2). For the 3D skeletons, we fine-tune LCR-Net++ [3] on this dataset and then extract the 2D skeletons. Finally these 2D skeletons are processed through VideoPose3D [4] to extract the 3D skeletons. We observe that this mechanism extracts • R. Dai, S. Das. S. Sharma and F. Bremond are with Inria and Universite cote d’zaur, 2004 Route des Lucioles, 06902 Valbonne, France. E-mail: {rui.dai, srijan.das, saurav.sharma, francois.bremond}@inria.fr • L. Minciullo, L. Garattoni . and G. Francesca are with Toyota Motor Europe, Hoge Wei 33, B - 1930 Zaventem, Belgium. 3D poses of better quality compared to those obtained using depth or LCRNet++. 1.1.2 Collection protocol One of the key applications of daily-living activity detection is older patient monitoring. Thus, in our dataset, we invited 18 volunteers to our dataset recording sessions. The age of the volunteers ranges between 60 and 80 years old. Each volunteer was recorded for 8 hours in one day starting from morning at 9 a.m. until afternoon at 5 p.m.. On the day of recording, the volunteer arrived in the apartment at 8 a.m. and had a visit to get acquainted with the place and the household equipment such as coffee machine, television, re- mote control, etc.. The volunteers also received an informal description of what it was expected with reference to having meals and interacting with anything in the apartment. The idea was to create a picture of a normal day at home. No further guidance was provided about how the activities should be performed. In total, we recorded more than 1000 hours of video data. Based on these data we prepared two datasets: Toyota Smarthome dataset [5], previously published, and Toyota Smarthome Untrimmed dataset that is introduced in this paper. 1.2 Toyota Smarthome Trimmed dataset Toyota Smarthome Trimmed [5] has been designed for the activity classification task. It consists of 16K short RGB+D clips of 31 activity classes. Each clip is about 12.5 sec. long and contains only one activity. Unlike previous datasets [6], [7], activities were performed in a natural manner. As a result, the dataset poses a unique combination of chal- lenges: high intra-class variation, high class imbalance, and activities with similar motion and high duration variance. Activities were annotated with both coarse and fine-grained labels. These characteristics differentiate Toyota Smarthome Trimmed from other datasets for activity classification.
Transcript
1
Toyota Smarthome Untrimmed: Real-WorldUntrimmed Videos for Activity Detection
Abstract—Designing activity detection systems that can be successfully deployed in daily-living environments require datasets thatcharacterizes the challenges typical of real-world settings. In this work, we introduce a new untrimmed daily-living dataset that featuresseveral real-world challenges: Toyota Smarthome Untrimmed (TSU). TSU contains a wide variety of activities performed in aspontaneous manner. Activities are collected in real-world settings, which results in non-optimal viewpoints. The dataset containsdense annotations including elementary, composite activities and activities involving interaction with objects. We provide an analysis ofthe real-world challenges featured by TSUdataset, highlighting the open issues for detection algorithms. We show that the currentstate-of-the-art methods fail to achieve satisfactory performance on TSU dataset. We release the dataset for research use athttps://project.inria.fr/toyotasmarthome
Index Terms—untrimmed videos, activity detection, activities of daily living, real-world settings.
F
1 TOYOTA SMARTHOME DATASET
This work aims at building a large scale dataset with daily-living activities performed in a natural manner. Activitiesperformed in a spontaneous manner lead to many real-world challenges that are often ignored by the vision com-munity. This includes low inter-class due to presence ofsimilar activities and high intra-class variance, low cameraframing, low resolution, long tail distribution of activitiesand occlusions. To this end, we propose Toyota SmarthomeUntrimmed dataset, which provides spontaneous activitieswith rich and dense annotations to address the detection ofcomplex activities in real-world scenarios.
1.1 Data collection1.1.1 Collection SetupWe use 7 Microsoft Kinect sensors in the recording phase.The apartment plan and camera locations are shown inFig. 5. Cameras 1 and 2 cover the dinning room area, 4 and5 the living room, 3, 6 and 7 the kitchen. Thus, we have acoverage over the entire apartment from at least 2 distinctviewing angles. The videos are recorded at 20 frames persecond, the size of RGB is VGA (640×480), the standardresolution in most real-world scenarios. The dataset offers3 modalities: RGB, depth and 3D skeleton (i.e. pose) (seefig. 2).
For the 3D skeletons, we fine-tune LCR-Net++ [3] on thisdataset and then extract the 2D skeletons. Finally these 2Dskeletons are processed through VideoPose3D [4] to extractthe 3D skeletons. We observe that this mechanism extracts
• R. Dai, S. Das. S. Sharma and F. Bremond are with Inria and Universitecote d’zaur, 2004 Route des Lucioles, 06902 Valbonne, France.E-mail: {rui.dai, srijan.das, saurav.sharma, francois.bremond}@inria.fr
• L. Minciullo, L. Garattoni . and G. Francesca are with Toyota MotorEurope, Hoge Wei 33, B - 1930 Zaventem, Belgium.
3D poses of better quality compared to those obtained usingdepth or LCRNet++.
1.1.2 Collection protocolOne of the key applications of daily-living activity detectionis older patient monitoring. Thus, in our dataset, we invited18 volunteers to our dataset recording sessions. The age ofthe volunteers ranges between 60 and 80 years old. Eachvolunteer was recorded for 8 hours in one day starting frommorning at 9 a.m. until afternoon at 5 p.m.. On the day ofrecording, the volunteer arrived in the apartment at 8 a.m.and had a visit to get acquainted with the place and thehousehold equipment such as coffee machine, television, re-mote control, etc.. The volunteers also received an informaldescription of what it was expected with reference to havingmeals and interacting with anything in the apartment. Theidea was to create a picture of a normal day at home. Nofurther guidance was provided about how the activitiesshould be performed.
In total, we recorded more than 1000 hours of videodata. Based on these data we prepared two datasets: ToyotaSmarthome dataset [5], previously published, and ToyotaSmarthome Untrimmed dataset that is introduced in thispaper.
1.2 Toyota Smarthome Trimmed datasetToyota Smarthome Trimmed [5] has been designed for theactivity classification task. It consists of 16K short RGB+Dclips of 31 activity classes. Each clip is about 12.5 sec. longand contains only one activity. Unlike previous datasets [6],[7], activities were performed in a natural manner. As aresult, the dataset poses a unique combination of chal-lenges: high intra-class variation, high class imbalance, andactivities with similar motion and high duration variance.Activities were annotated with both coarse and fine-grainedlabels. These characteristics differentiate Toyota SmarthomeTrimmed from other datasets for activity classification.
Cut bread Spread butter Drink from cup Eat at table
Use fridge
Drink from bottle Drink from can
Object-based activities
Multi-view
Concurrent activities
Use Telephone
Walk
Use Telephone
Write
Eat bread
Read
Watch TV
Use laptop
High temporal variation
5 mins
Use tablet
10 minsUse glasses Write
3 seconds
Camera framing
Ch
all
eng
es
Stir the pot
Camera 6 Camera 3 2 seconds
Inter-class Intra-class
SmarthomePKUMMD
SmarthomeCharades
Use drawer
Use telephone
Cut bread
Sp
on
tan
eou
s b
eha
vio
rs
(ii)
(i)
(iii)
(1)
(2)
(3)
(4)
(5)
(6)
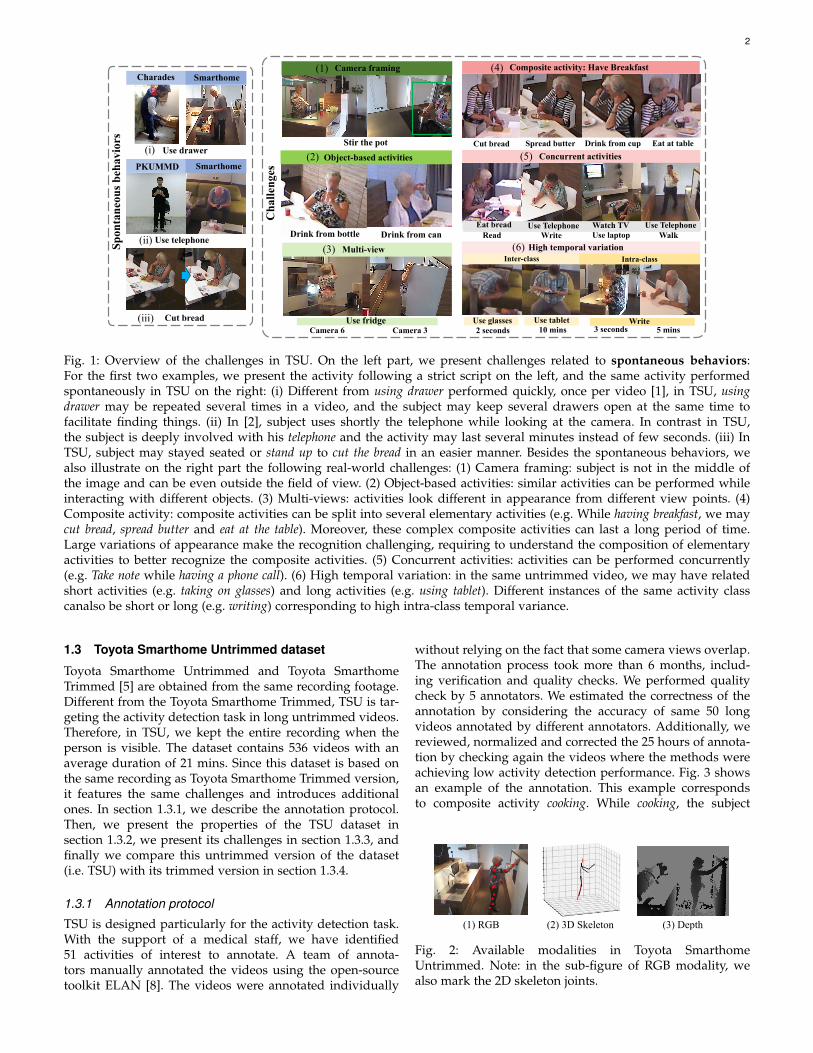
Fig. 1: Overview of the challenges in TSU. On the left part, we present challenges related to spontaneous behaviors:For the first two examples, we present the activity following a strict script on the left, and the same activity performedspontaneously in TSU on the right: (i) Different from using drawer performed quickly, once per video [1], in TSU, usingdrawer may be repeated several times in a video, and the subject may keep several drawers open at the same time tofacilitate finding things. (ii) In [2], subject uses shortly the telephone while looking at the camera. In contrast in TSU,the subject is deeply involved with his telephone and the activity may last several minutes instead of few seconds. (iii) InTSU, subject may stayed seated or stand up to cut the bread in an easier manner. Besides the spontaneous behaviors, wealso illustrate on the right part the following real-world challenges: (1) Camera framing: subject is not in the middle ofthe image and can be even outside the field of view. (2) Object-based activities: similar activities can be performed whileinteracting with different objects. (3) Multi-views: activities look different in appearance from different view points. (4)Composite activity: composite activities can be split into several elementary activities (e.g. While having breakfast, we maycut bread, spread butter and eat at the table). Moreover, these complex composite activities can last a long period of time.Large variations of appearance make the recognition challenging, requiring to understand the composition of elementaryactivities to better recognize the composite activities. (5) Concurrent activities: activities can be performed concurrently(e.g. Take note while having a phone call). (6) High temporal variation: in the same untrimmed video, we may have relatedshort activities (e.g. taking on glasses) and long activities (e.g. using tablet). Different instances of the same activity classcanalso be short or long (e.g. writing) corresponding to high intra-class temporal variance.
1.3 Toyota Smarthome Untrimmed dataset
Toyota Smarthome Untrimmed and Toyota SmarthomeTrimmed [5] are obtained from the same recording footage.Different from the Toyota Smarthome Trimmed, TSU is tar-geting the activity detection task in long untrimmed videos.Therefore, in TSU, we kept the entire recording when theperson is visible. The dataset contains 536 videos with anaverage duration of 21 mins. Since this dataset is based onthe same recording as Toyota Smarthome Trimmed version,it features the same challenges and introduces additionalones. In section 1.3.1, we describe the annotation protocol.Then, we present the properties of the TSU dataset insection 1.3.2, we present its challenges in section 1.3.3, andfinally we compare this untrimmed version of the dataset(i.e. TSU) with its trimmed version in section 1.3.4.
1.3.1 Annotation protocol
TSU is designed particularly for the activity detection task.With the support of a medical staff, we have identified51 activities of interest to annotate. A team of annota-tors manually annotated the videos using the open-sourcetoolkit ELAN [8]. The videos were annotated individually
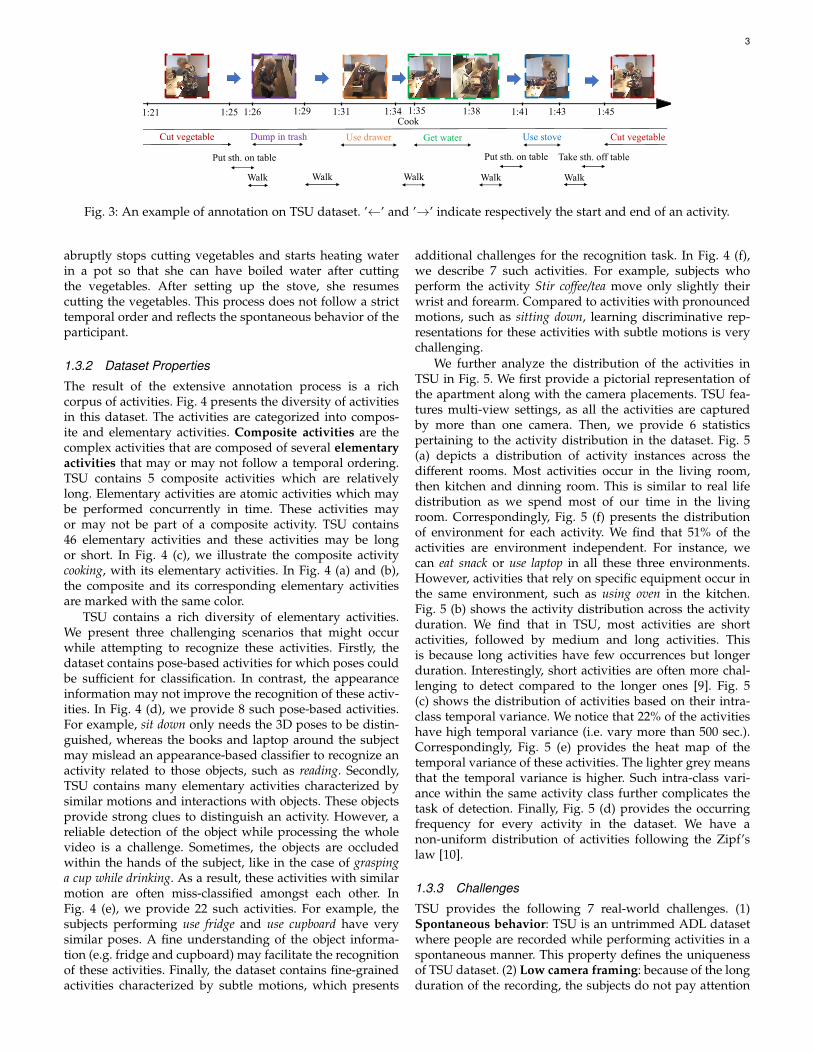
without relying on the fact that some camera views overlap.The annotation process took more than 6 months, includ-ing verification and quality checks. We performed qualitycheck by 5 annotators. We estimated the correctness of theannotation by considering the accuracy of same 50 longvideos annotated by different annotators. Additionally, wereviewed, normalized and corrected the 25 hours of annota-tion by checking again the videos where the methods wereachieving low activity detection performance. Fig. 3 showsan example of the annotation. This example correspondsto composite activity cooking. While cooking, the subject
(1) RGB (3) Depth (2) 3D Skeleton
Fig. 2: Available modalities in Toyota SmarthomeUntrimmed. Note: in the sub-figure of RGB modality, wealso mark the 2D skeleton joints.
Fig. 3: An example of annotation on TSU dataset. ’←’ and ’→’ indicate respectively the start and end of an activity.
abruptly stops cutting vegetables and starts heating waterin a pot so that she can have boiled water after cuttingthe vegetables. After setting up the stove, she resumescutting the vegetables. This process does not follow a stricttemporal order and reflects the spontaneous behavior of theparticipant.
1.3.2 Dataset Properties
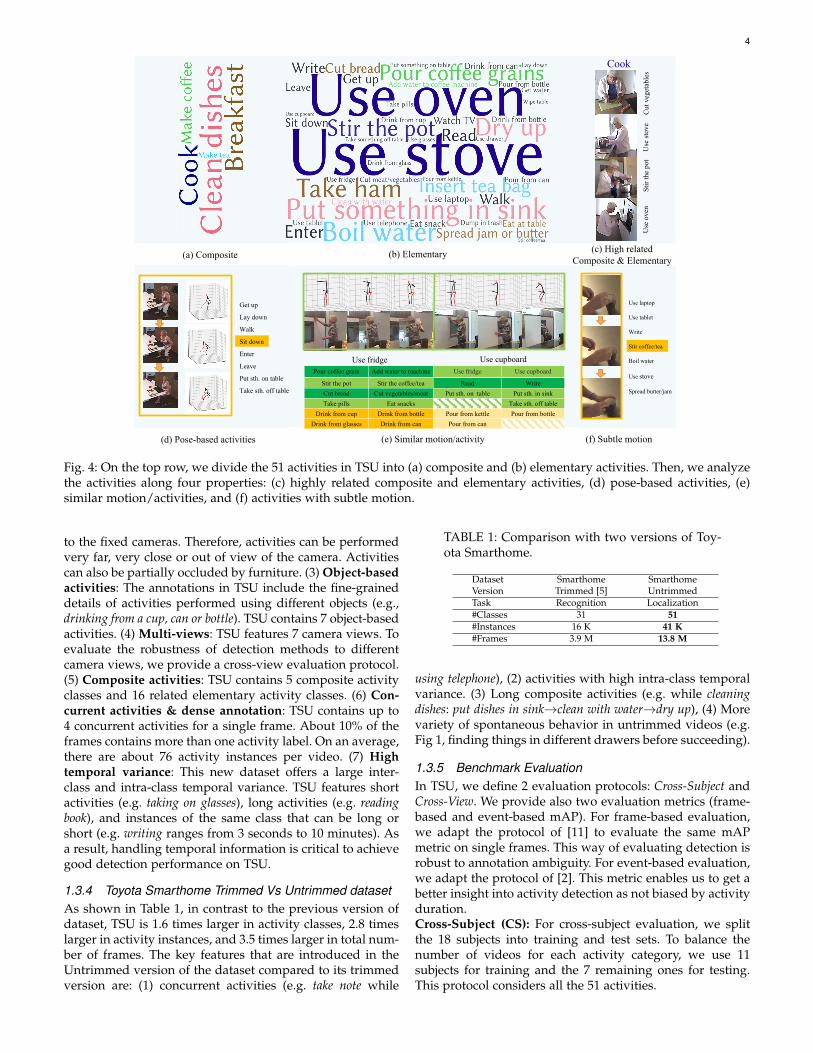
The result of the extensive annotation process is a richcorpus of activities. Fig. 4 presents the diversity of activitiesin this dataset. The activities are categorized into compos-ite and elementary activities. Composite activities are thecomplex activities that are composed of several elementaryactivities that may or may not follow a temporal ordering.TSU contains 5 composite activities which are relativelylong. Elementary activities are atomic activities which maybe performed concurrently in time. These activities mayor may not be part of a composite activity. TSU contains46 elementary activities and these activities may be longor short. In Fig. 4 (c), we illustrate the composite activitycooking, with its elementary activities. In Fig. 4 (a) and (b),the composite and its corresponding elementary activitiesare marked with the same color.
TSU contains a rich diversity of elementary activities.We present three challenging scenarios that might occurwhile attempting to recognize these activities. Firstly, thedataset contains pose-based activities for which poses couldbe sufficient for classification. In contrast, the appearanceinformation may not improve the recognition of these activ-ities. In Fig. 4 (d), we provide 8 such pose-based activities.For example, sit down only needs the 3D poses to be distin-guished, whereas the books and laptop around the subjectmay mislead an appearance-based classifier to recognize anactivity related to those objects, such as reading. Secondly,TSU contains many elementary activities characterized bysimilar motions and interactions with objects. These objectsprovide strong clues to distinguish an activity. However, areliable detection of the object while processing the wholevideo is a challenge. Sometimes, the objects are occludedwithin the hands of the subject, like in the case of graspinga cup while drinking. As a result, these activities with similarmotion are often miss-classified amongst each other. InFig. 4 (e), we provide 22 such activities. For example, thesubjects performing use fridge and use cupboard have verysimilar poses. A fine understanding of the object informa-tion (e.g. fridge and cupboard) may facilitate the recognitionof these activities. Finally, the dataset contains fine-grainedactivities characterized by subtle motions, which presents
additional challenges for the recognition task. In Fig. 4 (f),we describe 7 such activities. For example, subjects whoperform the activity Stir coffee/tea move only slightly theirwrist and forearm. Compared to activities with pronouncedmotions, such as sitting down, learning discriminative rep-resentations for these activities with subtle motions is verychallenging.
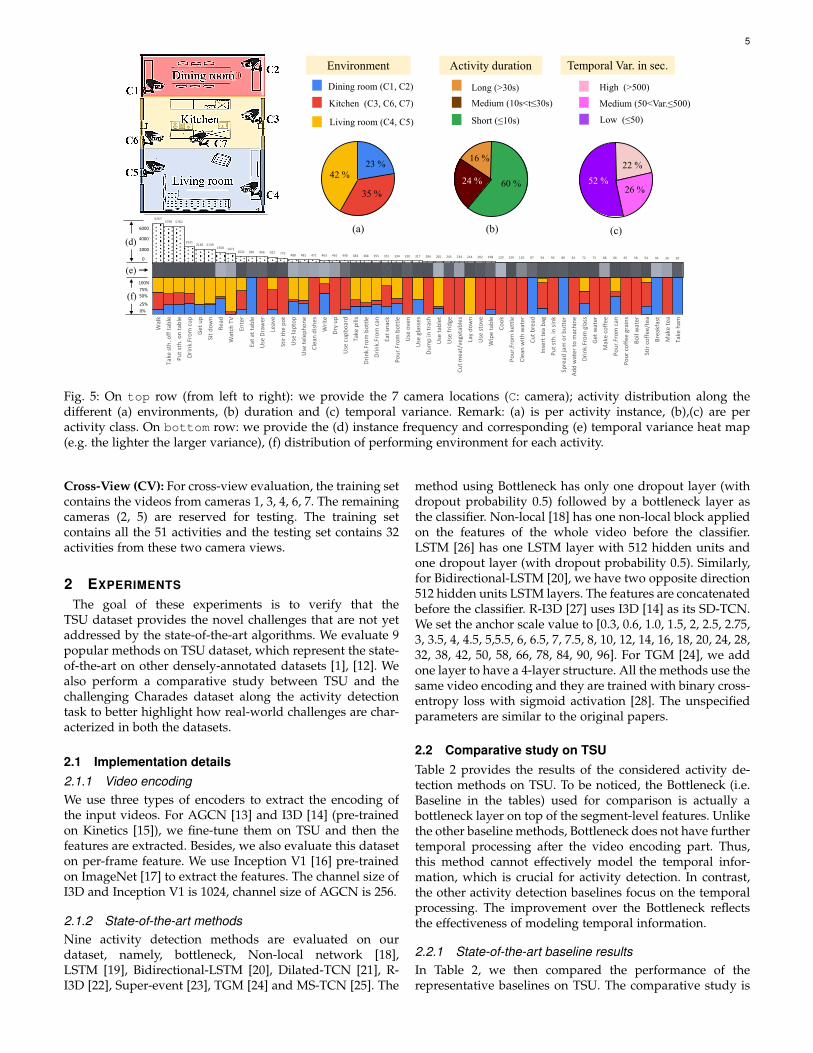
We further analyze the distribution of the activities inTSU in Fig. 5. We first provide a pictorial representation ofthe apartment along with the camera placements. TSU fea-tures multi-view settings, as all the activities are capturedby more than one camera. Then, we provide 6 statisticspertaining to the activity distribution in the dataset. Fig. 5(a) depicts a distribution of activity instances across thedifferent rooms. Most activities occur in the living room,then kitchen and dinning room. This is similar to real lifedistribution as we spend most of our time in the livingroom. Correspondingly, Fig. 5 (f) presents the distributionof environment for each activity. We find that 51% of theactivities are environment independent. For instance, wecan eat snack or use laptop in all these three environments.However, activities that rely on specific equipment occur inthe same environment, such as using oven in the kitchen.Fig. 5 (b) shows the activity distribution across the activityduration. We find that in TSU, most activities are shortactivities, followed by medium and long activities. Thisis because long activities have few occurrences but longerduration. Interestingly, short activities are often more chal-lenging to detect compared to the longer ones [9]. Fig. 5(c) shows the distribution of activities based on their intra-class temporal variance. We notice that 22% of the activitieshave high temporal variance (i.e. vary more than 500 sec.).Correspondingly, Fig. 5 (e) provides the heat map of thetemporal variance of these activities. The lighter grey meansthat the temporal variance is higher. Such intra-class vari-ance within the same activity class further complicates thetask of detection. Finally, Fig. 5 (d) provides the occurringfrequency for every activity in the dataset. We have anon-uniform distribution of activities following the Zipf’slaw [10].
1.3.3 Challenges
TSU provides the following 7 real-world challenges. (1)Spontaneous behavior: TSU is an untrimmed ADL datasetwhere people are recorded while performing activities in aspontaneous manner. This property defines the uniquenessof TSU dataset. (2) Low camera framing: because of the longduration of the recording, the subjects do not pay attention
4
(a) Composite (b) Elementary
(e) Similar motion/activity
Pour coffee grain Add water to machine Use fridge Use cupboard
Stir the pot Stir the coffee/tea Read Write
Cut bread Cut vegetables/meat Put sth. on table Put sth. in sink
Take pills Eat snacks Take sth. off table
Drink from cup Drink from bottle Pour from kettle Pour from bottle
Drink from glasses Drink from can Pour from can
(f) Subtle motion
Use laptop
Use tablet
Write
Stir coffee/tea
Boil water
Use stove
Spread butter/jam
Use fridge Use cupboard
Cut
veg
etab
les
Sti
r th
e pot
Use
sto
ve
Use
oven
Cook
(c) High related
Composite & Elementary
Get up
Lay down
Walk
Sit down
Enter
Leave
Put sth. on table
Take sth. off table
(d) Pose-based activities
Fig. 4: On the top row, we divide the 51 activities in TSU into (a) composite and (b) elementary activities. Then, we analyzethe activities along four properties: (c) highly related composite and elementary activities, (d) pose-based activities, (e)similar motion/activities, and (f) activities with subtle motion.
to the fixed cameras. Therefore, activities can be performedvery far, very close or out of view of the camera. Activitiescan also be partially occluded by furniture. (3) Object-basedactivities: The annotations in TSU include the fine-graineddetails of activities performed using different objects (e.g.,drinking from a cup, can or bottle). TSU contains 7 object-basedactivities. (4) Multi-views: TSU features 7 camera views. Toevaluate the robustness of detection methods to differentcamera views, we provide a cross-view evaluation protocol.(5) Composite activities: TSU contains 5 composite activityclasses and 16 related elementary activity classes. (6) Con-current activities & dense annotation: TSU contains up to4 concurrent activities for a single frame. About 10% of theframes contains more than one activity label. On an average,there are about 76 activity instances per video. (7) Hightemporal variance: This new dataset offers a large inter-class and intra-class temporal variance. TSU features shortactivities (e.g. taking on glasses), long activities (e.g. readingbook), and instances of the same class that can be long orshort (e.g. writing ranges from 3 seconds to 10 minutes). Asa result, handling temporal information is critical to achievegood detection performance on TSU.
1.3.4 Toyota Smarthome Trimmed Vs Untrimmed datasetAs shown in Table 1, in contrast to the previous version ofdataset, TSU is 1.6 times larger in activity classes, 2.8 timeslarger in activity instances, and 3.5 times larger in total num-ber of frames. The key features that are introduced in theUntrimmed version of the dataset compared to its trimmedversion are: (1) concurrent activities (e.g. take note while
TABLE 1: Comparison with two versions of Toy-ota Smarthome.
Dataset Smarthome SmarthomeVersion Trimmed [5] UntrimmedTask Recognition Localization#Classes 31 51#Instances 16 K 41 K#Frames 3.9 M 13.8 M
using telephone), (2) activities with high intra-class temporalvariance. (3) Long composite activities (e.g. while cleaningdishes: put dishes in sink→clean with water→dry up), (4) Morevariety of spontaneous behavior in untrimmed videos (e.g.Fig 1, finding things in different drawers before succeeding).
1.3.5 Benchmark EvaluationIn TSU, we define 2 evaluation protocols: Cross-Subject andCross-View. We provide also two evaluation metrics (frame-based and event-based mAP). For frame-based evaluation,we adapt the protocol of [11] to evaluate the same mAPmetric on single frames. This way of evaluating detection isrobust to annotation ambiguity. For event-based evaluation,we adapt the protocol of [2]. This metric enables us to get abetter insight into activity detection as not biased by activityduration.Cross-Subject (CS): For cross-subject evaluation, we splitthe 18 subjects into training and test sets. To balance thenumber of videos for each activity category, we use 11subjects for training and the 7 remaining ones for testing.This protocol considers all the 51 activities.
5
(e)
C1
C2
C3
C6 C7
C4
C5
Dining room
Kitchen
Living room42 %
23 %
35 %
Long (>30s)
Medium (10s<t≤30s)
6000
0
100%
25%
0%
(d)4000
2000
(f)75%
50%
Dining room (C1, C2)
Kitchen (C3, C6, C7)
Living room (C4, C5)
Environment Activity duration Temporal Var. in sec.
Fig. 5: On top row (from left to right): we provide the 7 camera locations (C: camera); activity distribution along thedifferent (a) environments, (b) duration and (c) temporal variance. Remark: (a) is per activity instance, (b),(c) are peractivity class. On bottom row: we provide the (d) instance frequency and corresponding (e) temporal variance heat map(e.g. the lighter the larger variance), (f) distribution of performing environment for each activity.
Cross-View (CV): For cross-view evaluation, the training setcontains the videos from cameras 1, 3, 4, 6, 7. The remainingcameras (2, 5) are reserved for testing. The training setcontains all the 51 activities and the testing set contains 32activities from these two camera views.
2 EXPERIMENTS
The goal of these experiments is to verify that theTSU dataset provides the novel challenges that are not yetaddressed by the state-of-the-art algorithms. We evaluate 9popular methods on TSU dataset, which represent the state-of-the-art on other densely-annotated datasets [1], [12]. Wealso perform a comparative study between TSU and thechallenging Charades dataset along the activity detectiontask to better highlight how real-world challenges are char-acterized in both the datasets.
2.1 Implementation details2.1.1 Video encodingWe use three types of encoders to extract the encoding ofthe input videos. For AGCN [13] and I3D [14] (pre-trainedon Kinetics [15]), we fine-tune them on TSU and then thefeatures are extracted. Besides, we also evaluate this dataseton per-frame feature. We use Inception V1 [16] pre-trainedon ImageNet [17] to extract the features. The channel size ofI3D and Inception V1 is 1024, channel size of AGCN is 256.
2.1.2 State-of-the-art methodsNine activity detection methods are evaluated on ourdataset, namely, bottleneck, Non-local network [18],LSTM [19], Bidirectional-LSTM [20], Dilated-TCN [21], R-I3D [22], Super-event [23], TGM [24] and MS-TCN [25]. The
method using Bottleneck has only one dropout layer (withdropout probability 0.5) followed by a bottleneck layer asthe classifier. Non-local [18] has one non-local block appliedon the features of the whole video before the classifier.LSTM [26] has one LSTM layer with 512 hidden units andone dropout layer (with dropout probability 0.5). Similarly,for Bidirectional-LSTM [20], we have two opposite direction512 hidden units LSTM layers. The features are concatenatedbefore the classifier. R-I3D [27] uses I3D [14] as its SD-TCN.We set the anchor scale value to [0.3, 0.6, 1.0, 1.5, 2, 2.5, 2.75,3, 3.5, 4, 4.5, 5,5.5, 6, 6.5, 7, 7.5, 8, 10, 12, 14, 16, 18, 20, 24, 28,32, 38, 42, 50, 58, 66, 78, 84, 90, 96]. For TGM [24], we addone layer to have a 4-layer structure. All the methods use thesame video encoding and they are trained with binary cross-entropy loss with sigmoid activation [28]. The unspecifiedparameters are similar to the original papers.
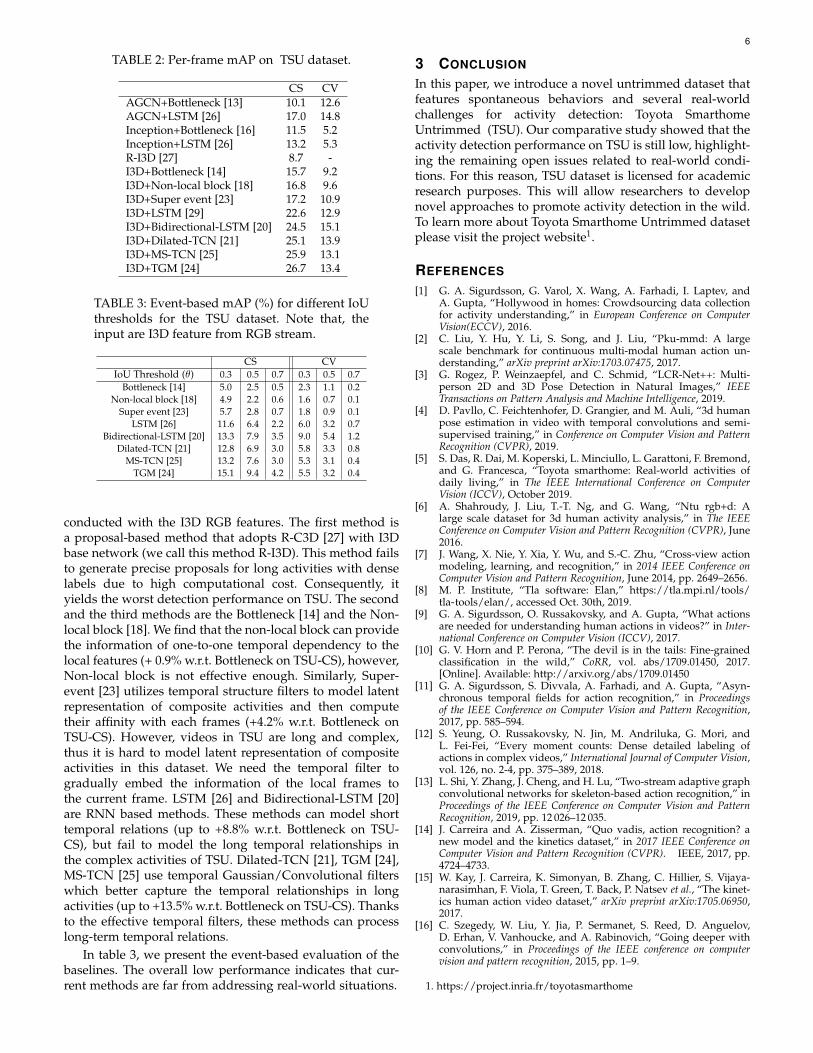
2.2 Comparative study on TSUTable 2 provides the results of the considered activity de-tection methods on TSU. To be noticed, the Bottleneck (i.e.Baseline in the tables) used for comparison is actually abottleneck layer on top of the segment-level features. Unlikethe other baseline methods, Bottleneck does not have furthertemporal processing after the video encoding part. Thus,this method cannot effectively model the temporal infor-mation, which is crucial for activity detection. In contrast,the other activity detection baselines focus on the temporalprocessing. The improvement over the Bottleneck reflectsthe effectiveness of modeling temporal information.
2.2.1 State-of-the-art baseline resultsIn Table 2, we then compared the performance of therepresentative baselines on TSU. The comparative study is
conducted with the I3D RGB features. The first method isa proposal-based method that adopts R-C3D [27] with I3Dbase network (we call this method R-I3D). This method failsto generate precise proposals for long activities with denselabels due to high computational cost. Consequently, ityields the worst detection performance on TSU. The secondand the third methods are the Bottleneck [14] and the Non-local block [18]. We find that the non-local block can providethe information of one-to-one temporal dependency to thelocal features (+ 0.9% w.r.t. Bottleneck on TSU-CS), however,Non-local block is not effective enough. Similarly, Super-event [23] utilizes temporal structure filters to model latentrepresentation of composite activities and then computetheir affinity with each frames (+4.2% w.r.t. Bottleneck onTSU-CS). However, videos in TSU are long and complex,thus it is hard to model latent representation of compositeactivities in this dataset. We need the temporal filter togradually embed the information of the local frames tothe current frame. LSTM [26] and Bidirectional-LSTM [20]are RNN based methods. These methods can model shorttemporal relations (up to +8.8% w.r.t. Bottleneck on TSU-CS), but fail to model the long temporal relationships inthe complex activities of TSU. Dilated-TCN [21], TGM [24],MS-TCN [25] use temporal Gaussian/Convolutional filterswhich better capture the temporal relationships in longactivities (up to +13.5% w.r.t. Bottleneck on TSU-CS). Thanksto the effective temporal filters, these methods can processlong-term temporal relations.
In table 3, we present the event-based evaluation of thebaselines. The overall low performance indicates that cur-rent methods are far from addressing real-world situations.
3 CONCLUSION
In this paper, we introduce a novel untrimmed dataset thatfeatures spontaneous behaviors and several real-worldchallenges for activity detection: Toyota SmarthomeUntrimmed (TSU). Our comparative study showed that theactivity detection performance on TSU is still low, highlight-ing the remaining open issues related to real-world condi-tions. For this reason, TSU dataset is licensed for academicresearch purposes. This will allow researchers to developnovel approaches to promote activity detection in the wild.To learn more about Toyota Smarthome Untrimmed datasetplease visit the project website1.
REFERENCES
[1] G. A. Sigurdsson, G. Varol, X. Wang, A. Farhadi, I. Laptev, andA. Gupta, “Hollywood in homes: Crowdsourcing data collectionfor activity understanding,” in European Conference on ComputerVision(ECCV), 2016.
[2] C. Liu, Y. Hu, Y. Li, S. Song, and J. Liu, “Pku-mmd: A largescale benchmark for continuous multi-modal human action un-derstanding,” arXiv preprint arXiv:1703.07475, 2017.
[3] G. Rogez, P. Weinzaepfel, and C. Schmid, “LCR-Net++: Multi-person 2D and 3D Pose Detection in Natural Images,” IEEETransactions on Pattern Analysis and Machine Intelligence, 2019.
[4] D. Pavllo, C. Feichtenhofer, D. Grangier, and M. Auli, “3d humanpose estimation in video with temporal convolutions and semi-supervised training,” in Conference on Computer Vision and PatternRecognition (CVPR), 2019.
[5] S. Das, R. Dai, M. Koperski, L. Minciullo, L. Garattoni, F. Bremond,and G. Francesca, “Toyota smarthome: Real-world activities ofdaily living,” in The IEEE International Conference on ComputerVision (ICCV), October 2019.
[6] A. Shahroudy, J. Liu, T.-T. Ng, and G. Wang, “Ntu rgb+d: Alarge scale dataset for 3d human activity analysis,” in The IEEEConference on Computer Vision and Pattern Recognition (CVPR), June2016.
[7] J. Wang, X. Nie, Y. Xia, Y. Wu, and S.-C. Zhu, “Cross-view actionmodeling, learning, and recognition,” in 2014 IEEE Conference onComputer Vision and Pattern Recognition, June 2014, pp. 2649–2656.
[8] M. P. Institute, “Tla software: Elan,” https://tla.mpi.nl/tools/tla-tools/elan/, accessed Oct. 30th, 2019.
[9] G. A. Sigurdsson, O. Russakovsky, and A. Gupta, “What actionsare needed for understanding human actions in videos?” in Inter-national Conference on Computer Vision (ICCV), 2017.
[10] G. V. Horn and P. Perona, “The devil is in the tails: Fine-grainedclassification in the wild,” CoRR, vol. abs/1709.01450, 2017.[Online]. Available: http://arxiv.org/abs/1709.01450
[11] G. A. Sigurdsson, S. Divvala, A. Farhadi, and A. Gupta, “Asyn-chronous temporal fields for action recognition,” in Proceedingsof the IEEE Conference on Computer Vision and Pattern Recognition,2017, pp. 585–594.
[12] S. Yeung, O. Russakovsky, N. Jin, M. Andriluka, G. Mori, andL. Fei-Fei, “Every moment counts: Dense detailed labeling ofactions in complex videos,” International Journal of Computer Vision,vol. 126, no. 2-4, pp. 375–389, 2018.
[13] L. Shi, Y. Zhang, J. Cheng, and H. Lu, “Two-stream adaptive graphconvolutional networks for skeleton-based action recognition,” inProceedings of the IEEE Conference on Computer Vision and PatternRecognition, 2019, pp. 12 026–12 035.
[14] J. Carreira and A. Zisserman, “Quo vadis, action recognition? anew model and the kinetics dataset,” in 2017 IEEE Conference onComputer Vision and Pattern Recognition (CVPR). IEEE, 2017, pp.4724–4733.
[15] W. Kay, J. Carreira, K. Simonyan, B. Zhang, C. Hillier, S. Vijaya-narasimhan, F. Viola, T. Green, T. Back, P. Natsev et al., “The kinet-ics human action video dataset,” arXiv preprint arXiv:1705.06950,2017.
[16] C. Szegedy, W. Liu, Y. Jia, P. Sermanet, S. Reed, D. Anguelov,D. Erhan, V. Vanhoucke, and A. Rabinovich, “Going deeper withconvolutions,” in Proceedings of the IEEE conference on computervision and pattern recognition, 2015, pp. 1–9.
[17] J. Deng, W. Dong, R. Socher, L.-J. Li, K. Li, and L. Fei-Fei, “Ima-geNet: A Large-Scale Hierarchical Image Database,” in CVPR09,2009.
[18] X. Wang, R. B. Girshick, A. Gupta, and K. He, “Non-local neu-ral networks,” 2018 IEEE/CVF Conference on Computer Vision andPattern Recognition, pp. 7794–7803, 2018.
[19] S. Hochreiter and J. Schmidhuber, “Long short-term memory,”Neural Comput., vol. 9, no. 8, pp. 1735–1780, Nov. 1997. [Online].Available: http://dx.doi.org/10.1162/neco.1997.9.8.1735
[20] A. Graves and J. Schmidhuber, “Framewise phoneme classificationwith bidirectional lstm and other neural network architectures,”Neural networks, vol. 18, no. 5-6, pp. 602–610, 2005.
[21] C. Lea, M. D. Flynn, R. Vidal, A. Reiter, and G. D. Hager,“Temporal convolutional networks for action segmentation anddetection,” in proceedings of the IEEE Conference on Computer Visionand Pattern Recognition, 2017, pp. 156–165.
[22] D. Tran, L. Bourdev, R. Fergus, L. Torresani, and M. Paluri,“Learning spatiotemporal features with 3d convolutionalnetworks,” in Proceedings of the 2015 IEEE International Conferenceon Computer Vision (ICCV), ser. ICCV ’15. Washington, DC, USA:IEEE Computer Society, 2015, pp. 4489–4497. [Online]. Available:http://dx.doi.org/10.1109/ICCV.2015.510
[23] A. Piergiovanni and M. S. Ryoo, “Learning latent super-events todetect multiple activities in videos,” in International Conference onMachine Learning (ICML), 2018.
[24] ——, “Temporal gaussian mixture layer for videos,” in Proceedingsof the IEEE Conference on Computer Vision and Pattern Recognition,2019.
[25] Y. A. Farha and J. Gall, “Ms-tcn: Multi-stage temporal convolu-tional network for action segmentation,” in Proceedings of the IEEEConference on Computer Vision and Pattern Recognition, 2019, pp.3575–3584.
[26] S. Hochreiter and J. Schmidhuber, “Long short-term memory,”Neural computation, vol. 9, no. 8, pp. 1735–1780, 1997.
[27] H. Xu, A. Das, and K. Saenko, “R-c3d: Region convolutional 3dnetwork for temporal activity detection,” in Proceedings of the IEEEinternational conference on computer vision, 2017, pp. 5783–5792.
[28] J. Nam, J. Kim, E. L. Mencıa, I. Gurevych, and J. Furnkranz,“Large-scale multi-label text classification—revisiting neural net-works,” in Joint european conference on machine learning and knowl-edge discovery in databases. Springer, 2014, pp. 437–452.
[29] B. Mahasseni and S. Todorovic, “Regularizing long short termmemory with 3d human-skeleton sequences for action recogni-tion,” in Proceedings of the IEEE Conference on Computer Vision andPattern Recognition, 2016, pp. 3054–3062.


![Temporal Activity Detection in Untrimmed Videos with ... · learning rates for non-convex optimization. arXiv preprint arXiv:1502.04390, 2015. [3] Bernard Ghanem Fabian Caba Heilbron,](https://static.documents.pub/doc/80x56/5ec67a4adb0d1917dc626c54/temporal-activity-detection-in-untrimmed-videos-with-learning-rates-for-non-convex.jpg)


