50
1 Using the Cigar Box® Profit calculations made easy by Olivier van Lieshout Global Facts www.globalfacts.nl
| Date post: | 27-Dec-2015 |
| Category: |
Documents |
| Upload: | kelly-horton |
| View: | 229 times |
| Download: | 0 times |

1
Using the Cigar Box®
Profit calculations made easy
by Olivier van LieshoutGlobal Facts
www.globalfacts.nl

2
Cigar Box method
CB1: cost price for one single product
CB2: cost price for a range of products
CB3: cost price monitoring on a daily basis
CB4: investment analysis
CB5: value chain analysis
3
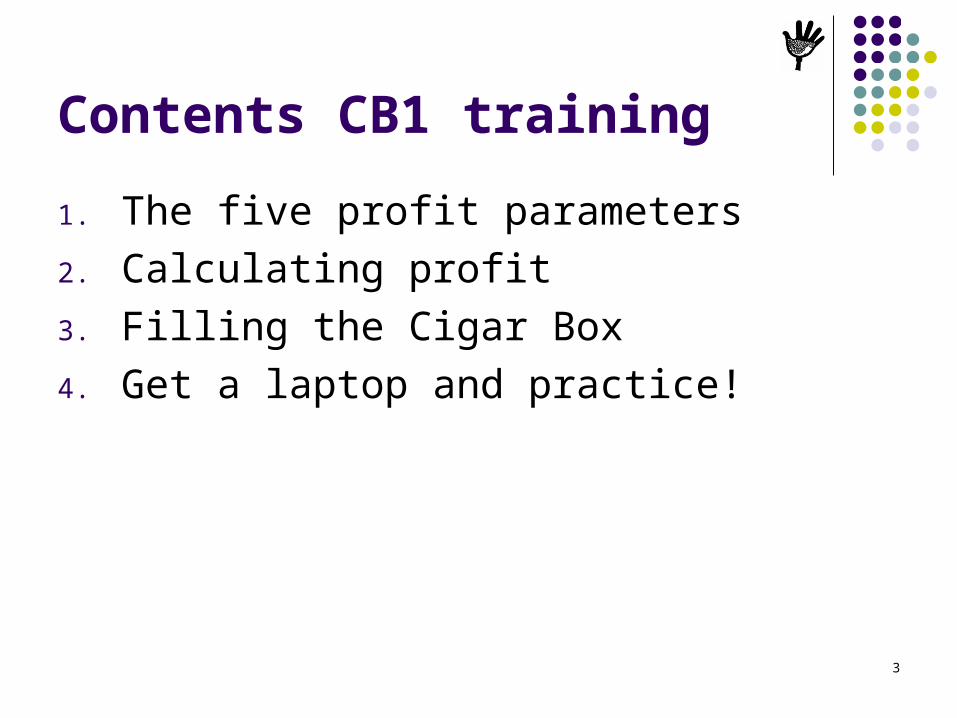
Contents CB1 training
1. The five profit parameters
2. Calculating profit
3. Filling the Cigar Box
4. Get a laptop and practice!

4
Part 1
The five profit parameters
Learning objectives:
1. There are only five profit parameters.2. Difference variable and fixed costs.3. Difference bookkeeping and cost accounting.

5
How to calculate profit ?
1. P = price
2. q = quantity sold
3. VC = variable cost (raw materials, processing, packaging)
4. FC = fixed cost (depreciation, interests, overhead)
5. Tax = taxes, duties (creative bookkeeping, connections, …)
PROFIT / LOSS
REVENUES - COSTS
- Tax(5)
q(2)
P(1)
VC(3)
FC(4)x +
REVENUES UP
COSTS DOWN

6
Profit parameters
There are ONLY FIVE parameters P Price (per unit) VC Variable cost (per unit) q Quantity (in units per period) FC Fixed cost (per period) T Tax % of profit (per period)
Note: q, FC, T must always refer to the same period.
But four can be influenced by the entrepreneur!
7
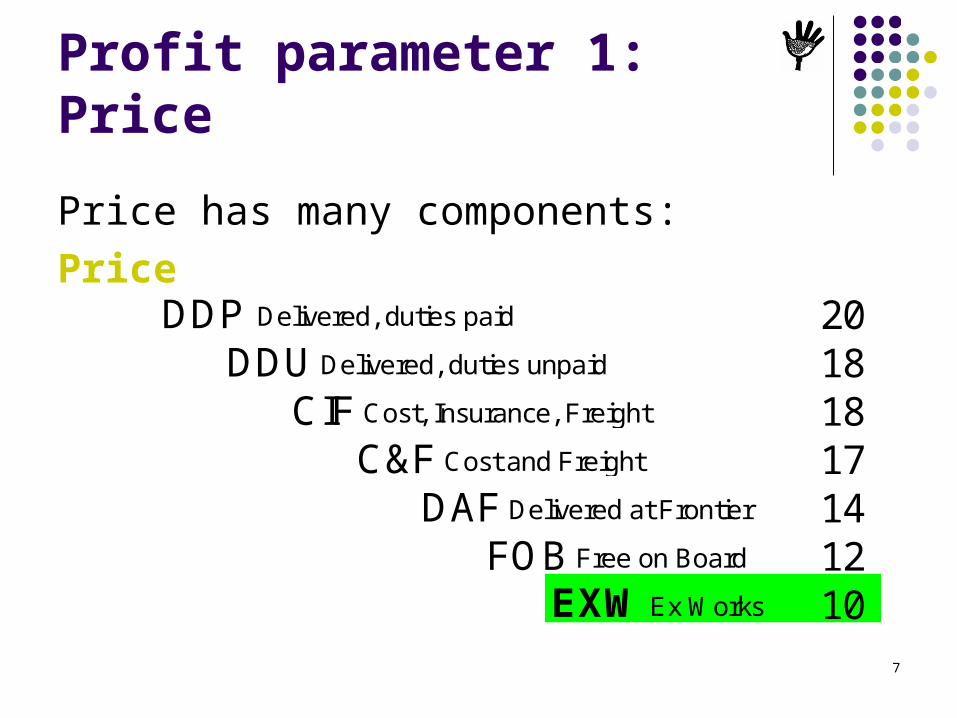
Profit parameter 1: Price
Price has many components:
PriceDDP Delivered, duties paid 20
DDU Delivered, duties unpaid 18CIF Cost, Insurance, Freight 18
C&F Cost and Freight 17DAF Delivered at Frontier 14
FOB Free on Board 12EXW Ex Works 10
8
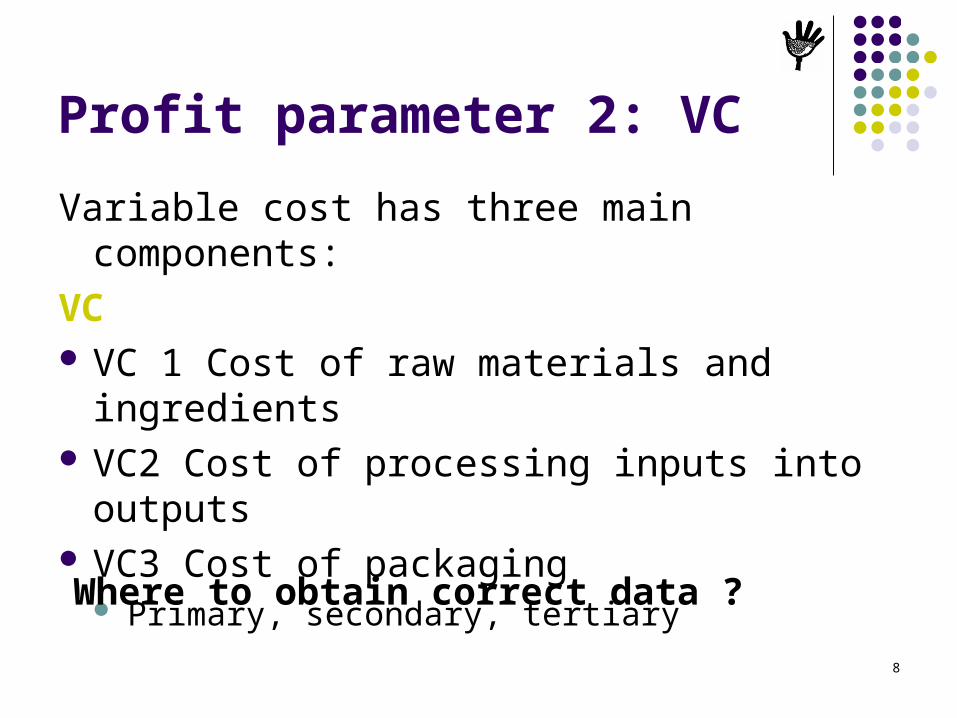
Profit parameter 2: VC
Variable cost has three main components:
VC VC 1 Cost of raw materials and ingredients VC2 Cost of processing inputs into outputs VC3 Cost of packaging
Primary, secondary, tertiary
Where to obtain correct data ?

9
Profit parameter 3: quantity
q = actual quantity sold per period
qCAP = quantity at full capacity utilization
quantity/hour * hours/day * days/year (harvest season)
3 ton/hour * 22 hours/day * 90 days/yr = 5940 ton/year
qBE = break-even quantity, where profit = 0
10
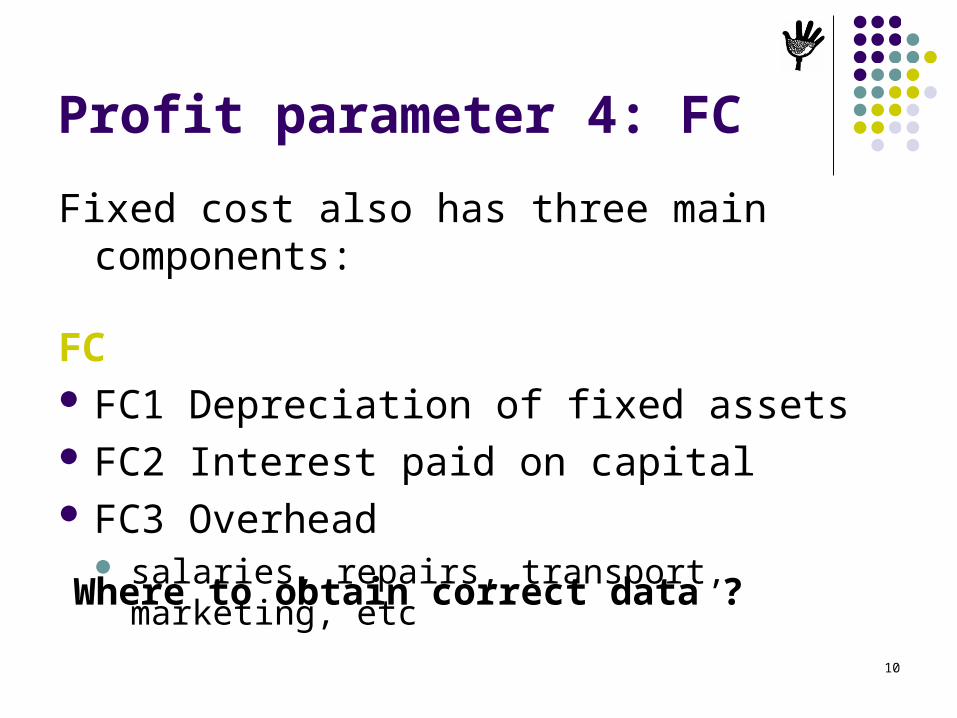
Profit parameter 4: FC
Fixed cost also has three main components:
FC FC1 Depreciation of fixed assets FC2 Interest paid on capital FC3 Overhead
salaries, repairs, transport, marketing, etc
Where to obtain correct data ?

11
Recognize costs - exercise
1. Ingredients
2. Road tax
3. Labels
4. Bank charges
5. Machine repair
6. Raw material transport
7. Depreciation
8. Social tax
9. Diesel for the boiler
10. Electricity in the factory
11. Electricity in the office
12. Casual labor
13. Management salary
14. Detergents and gloves
15. Interest on loans
16. Carton boxes
Are the following Variable or Fixed costs?
12
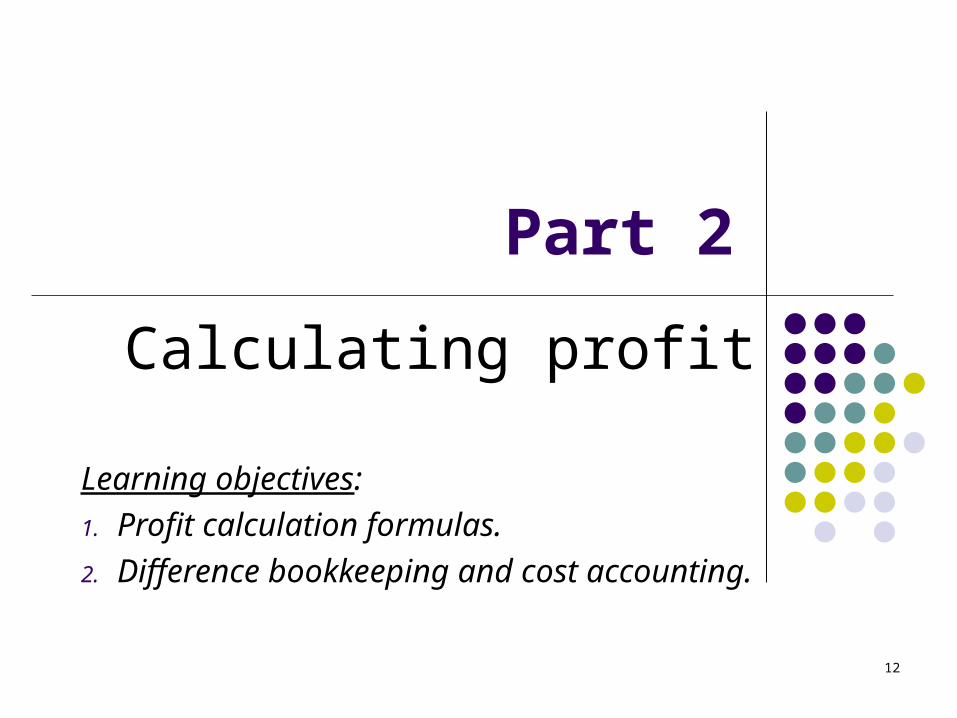
Part 2
Calculating profit
Learning objectives:
1. Profit calculation formulas.
2. Difference bookkeeping and cost accounting.

13
How to calculate profit ?
1. P = price
2. q = quantity sold
3. VC = variable cost (raw materials, processing, packaging)
4. FC = fixed cost (depreciation, interests, overhead)
5. Tax = taxes, duties (creative bookkeeping, connections, …)
PROFIT / LOSS
REVENUES - COSTS
- Tax(5)
q(2)
P(1)
VC(3)
FC(4)x +
REVENUES UP
COSTS DOWN

14
Profit formula
Profit = Revenues – Total costs Formula: Profit = P*q – (VC*q + FC)
= Bookkeeping formula
“Total revenue, minus total cost is profit”
15
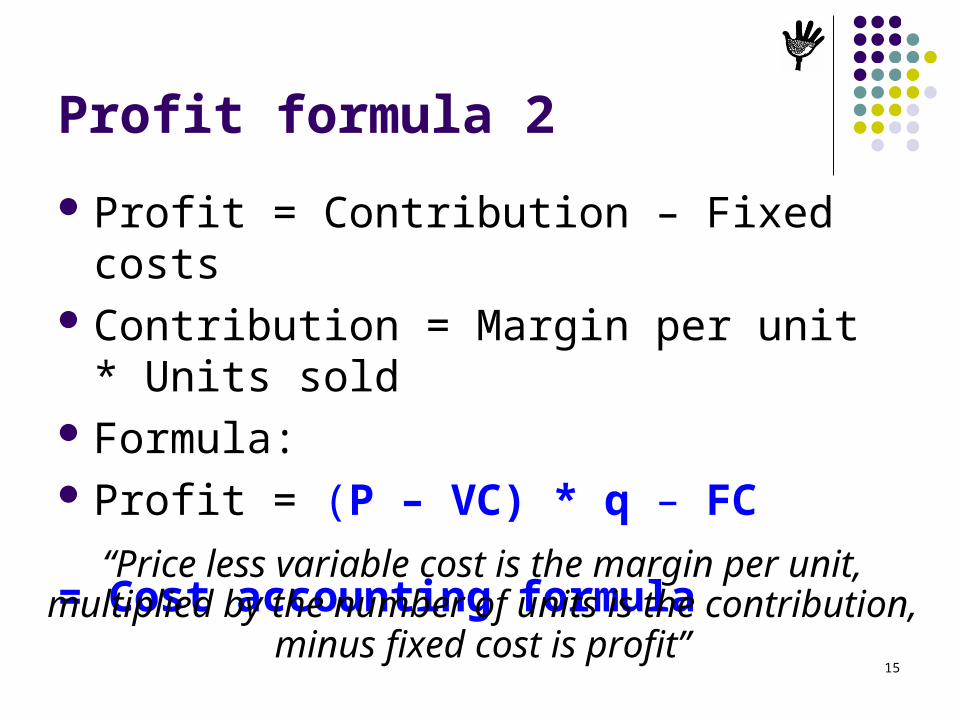
Profit formula 2
Profit = Contribution – Fixed costs Contribution = Margin per unit * Units sold Formula: Profit = (P – VC) * q – FC
= Cost accounting formula
“Price less variable cost is the margin per unit, multiplied by the number of units is the contribution,
minus fixed cost is profit”
16
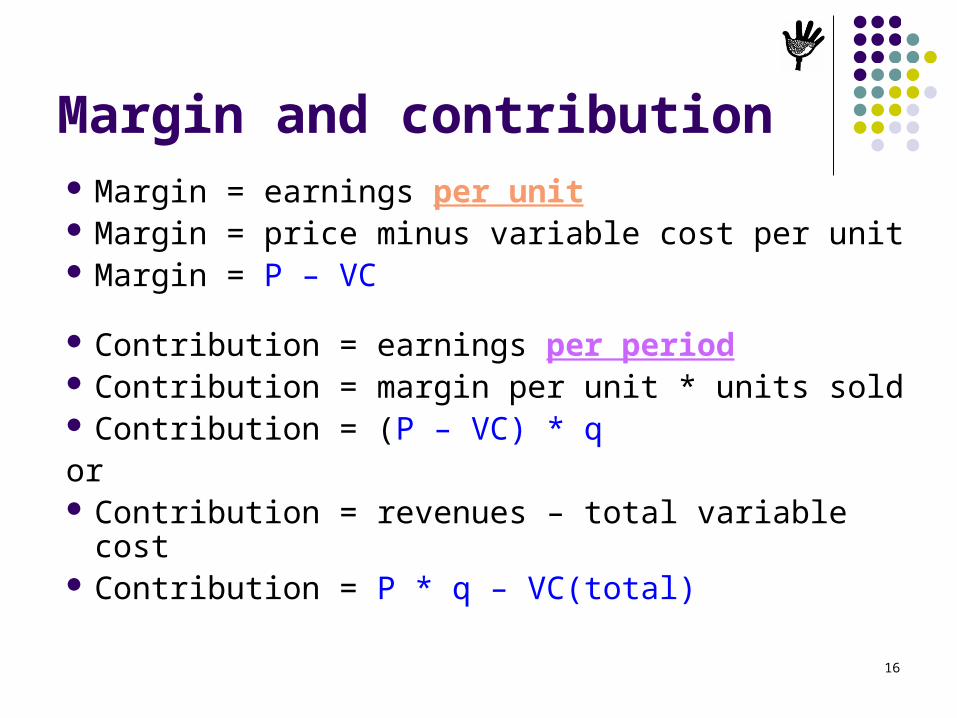
Margin and contribution Margin = earnings per unit Margin = price minus variable cost per unit Margin = P – VC
Contribution = earnings per period Contribution = margin per unit * units sold Contribution = (P – VC) * q or Contribution = revenues – total variable cost Contribution = P * q – VC(total)
17
Comparison
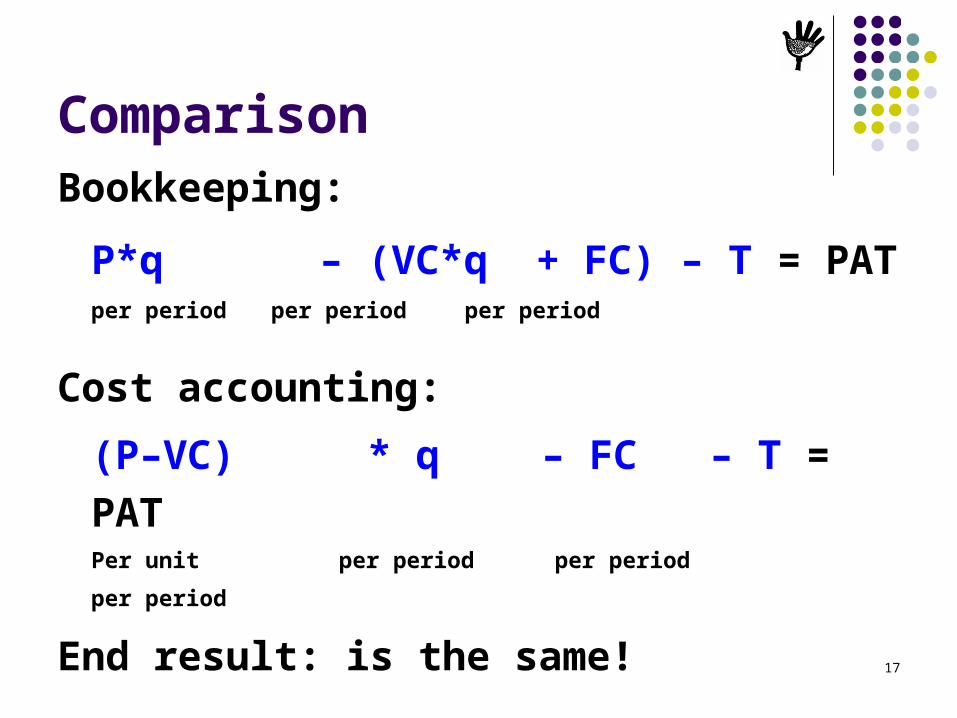
Bookkeeping:
P*q – (VC*q + FC) – T = PATper period per period per period
Cost accounting:
(P–VC) * q – FC – T = PATPer unit per period per period
per period
End result: is the same!
18
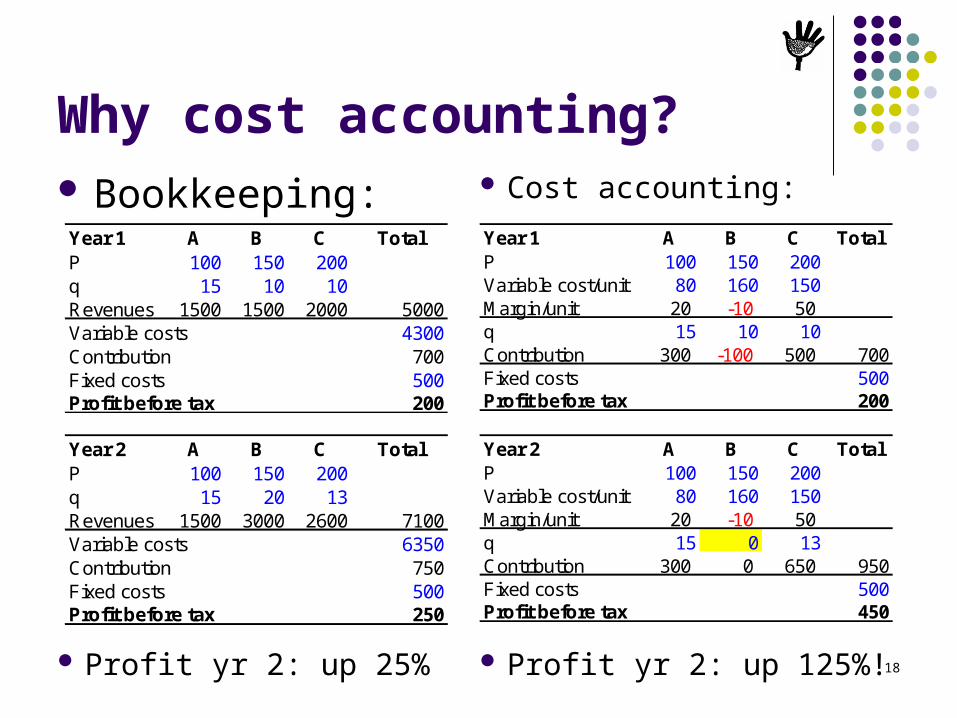
Why cost accounting? Bookkeeping: Cost accounting:
Year 1 A B C TotalP 100 150 200Variable cost/unit 80 160 150Margin/unit 20 -10 50q 15 10 10Contribution 300 -100 500 700Fixed costs 500Profit before tax 200
Profit yr 2: up 25% Profit yr 2: up 125%!
Year 2 A B C TotalP 100 150 200Variable cost/unit 80 160 150Margin/unit 20 -10 50q 15 0 13Contribution 300 0 650 950Fixed costs 500Profit before tax 450
Year 1 A B C TotalP 100 150 200q 15 10 10Revenues 1500 1500 2000 5000Variable costs 4300Contribution 700Fixed costs 500Profit before tax 200
Year 2 A B C TotalP 100 150 200q 15 20 13Revenues 1500 3000 2600 7100Variable costs 6350Contribution 750Fixed costs 500Profit before tax 250

19
Sensitivity analysis
Despite fluctuations in P, q, VC and FC….
Total cost must be less than revenues Contribution must be more than the fixed cost Profit before tax > 10% Break-even volume must be assured
in sales in supply of the most important raw material
20
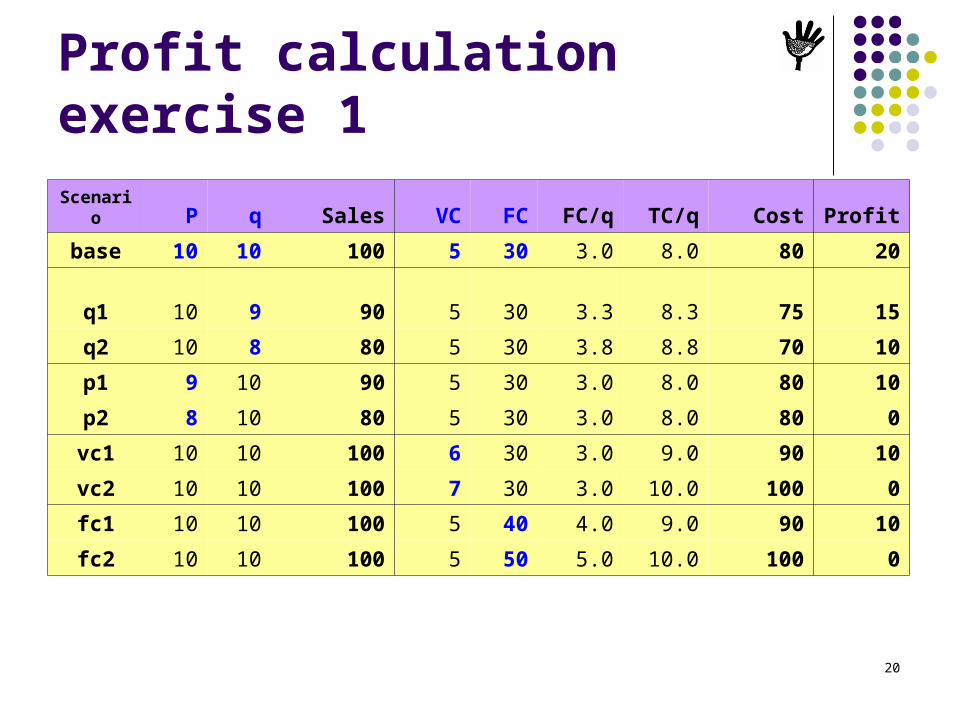
Profit calculation exercise 1
Scenario P q Sales VC FC FC/q TC/q Cost Profit
base 10 10 100 5 30 3.0 8.0 80 20
q1 10 9 90 5 30 3.3 8.3 75 15
q2 10 8 80 5 30 3.8 8.8 70 10
p1 9 10 90 5 30 3.0 8.0 80 10
p2 8 10 80 5 30 3.0 8.0 80 0
vc1 10 10 100 6 30 3.0 9.0 90 10
vc2 10 10 100 7 30 3.0 10.0 100 0
fc1 10 10 100 5 40 4.0 9.0 90 10
fc2 10 10 100 5 50 5.0 10.0 100 0

21
Profit parameters (repetition)
There are ONLY FIVE parameters P Price (per unit) VC Variable cost (per unit) q Quantity (in units per period) FC Fixed cost (per period) Tax Tax % of profit (per period)
Not more!
22
Part 3
Using the Cigar Box
Learning objectives: 1. Filling the Cigar Box;2. Analyze the results!3. Importance of capacity utilization.

23
CIGAR BOX 1 - Tomato paste 25 Brix, aseptic bags of 220 kg in steel drumsUSD USD
per ton per yearPrice (DDP Moscow) 1,000 Total Revenue 2,721,600 Import duties, 10% 100 Total Cost 2,554,377 Transport, sales commission 3% 144 Profit Before Tax 167,223 Price (EXW) 756 Profitability % 6%
Price (Raw Material, delivered factory) 71 Asset value 1,800,000 Processing ratio 6.0 Depreciation % 7.8%Raw Material cost 429 70% FC1 140,000 41%Other ingredients 12 2%VC1 441 72% Debt (40% of Asset value) 720,000
Interest rate 18.7%Production cost per hour (steam, electricity) 124 FC2 134,400 39%Production volume per hour (ton/hour) 2VC2 62 10% Number of FTE employed 15
Salaries staff incl. social taxes 50,000 15%Cost of packing (aseptic bag, drum) 21.8 Other overhead, repairs, maintenance 20,000 6%Number of drums per ton 4.5 FC3 70,000 20%VC3 99 16%
FC 344,400 100%FG losses % 2.0% FC % attributed to product 100.0%VC 614 100% FC (attributed to product) 344,400
Gross margin 142 Volume sold q (ton) 3,600 Gross margin % 19% Contribution 511,623
Variable cost 614 87% Break even volume (sales) 2,423 Break even volume (raw material) 21,600
Fixed Cost / q 96 13%Output capacity per hour in ton 2.0
Total Cost / q 710 100% Working hours per day 22 Length of harvesting season in days 110
Profit / q 46 Max. output capacity per year 4,840 Capacity utilization % 74.4%
Note: figures in blue are assumptions; figures in pink are calculated in another sheet; figures in black are formulas
P
VCFC
qcontribution
profit
P-VC
profit per unit
Break-even
Capacity Utilization

24
Sales price P Sales Price = Amount per unit, INCO-term City. Tomato paste price = USD 1000 per ton, DDP Moscow. DDP = delivered, duties paid. Delivered to Moscow in this case. The import duties in Russia are 10% or USD 100 per ton. Transport and commission amount to USD 144 per ton. Hence the Price EXW = 1000-100-144 = USD 756 per ton.
USDper ton
Price (DDP Moscow) 1,000 100%Import duties, 10% 100 10%Transport, sales commission 3% 144 14%Price (EXW) 756 76%
25
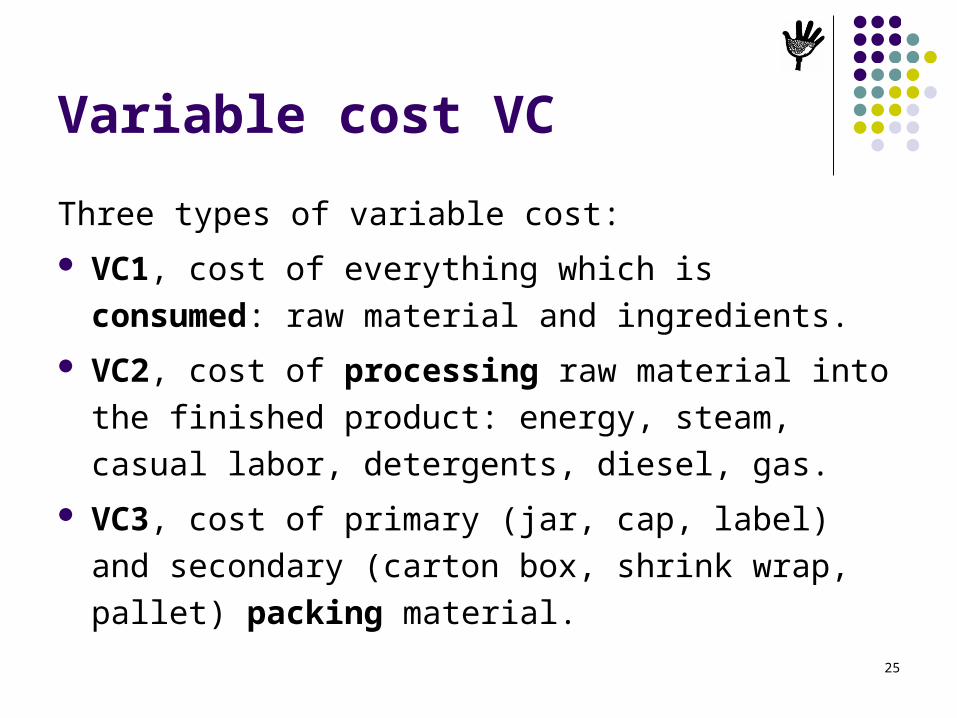
Variable cost VC
Three types of variable cost:
VC1, cost of everything which is consumed: raw
material and ingredients.
VC2, cost of processing raw material into the
finished product: energy, steam, casual labor,
detergents, diesel, gas.
VC3, cost of primary (jar, cap, label) and secondary
(carton box, shrink wrap, pallet) packing material.

26
Raw material & ingredients VC1
The price of the raw material, delivered to the factory = 71/ton. The processing ratio is the quantity of raw material needed for
one unit of finished good. Here: 6 kg tomato for 1 kg of paste. Raw material cost = 71 * 6 = 429 The higher the losses, the higher the processing ratio, the more
costly the finished good. Calculate the cost of all other ingredients in the recipe: 12 VC1 = 429 + 12 = 441.
Price (Raw Material, delivered factory) 71Processing ratio (kg RM for 1 kg FG) 6.0Raw Material cost 429 70%Other ingredients 12 2%VC1 441 72%

27
Processing costVC2 Calculating VC2 is not easy. Processing cost are calculated per hour. And divided by the production volume in units per hour. To arrive at the processing cost per unit. One must measure the use of steam, electricity, casual labor. Not just guess it! And measure the output per hour. Not just guess it! Get the correct data! After that, calculation is easy: 124 / 2 = 62
Production cost per hour (steam, electricity) 124 Production volume per hour (ton/hour) 2VC2 62 10%

28
Packing costVC3
Packing cost are calculated per sales unit: 1 aseptic bag in 1 steel drum = 3.2 + 18.6 = 21.8;
Other examples of sales units: 24 bottles per carton = 24*(bottle + cap + label) + 1 box + 1 sticker; 10 sachets per bag = 10*sachet + 1 bag + 1 adhesive sticker
Calculate the number of sales units per unit of calculation: unit of calculation is ton = 1000 kg 4.4 drums of 225 kg per ton: 1000 / 225 = 4.4 add the packing losses, say 2.2%, multiply 4.4 by 102.2% = 4.5
VC3 = cost of packing * number of packs per unit = 21.8 * 4.5 = 99
Cost of packing (aseptic bag, drum) 21.8Number of drums per ton 4.5VC3 99 16%

29
Total variable costVC
VC = VC1 + VC2 + VC3 Finished good losses
Warehouse losses, theft, pilferage, etc…. If there are 2% losses, enter 2% in FG losses % box.
VC = (VC1 + VC2 + VC3) * (1+ FG losses %) VC = (441 + 62 + 99) * 1.02 = 614
VC1 - Raw material & Ingredients 441 72%VC2 - Processing cost 62 10%VC3 - Primary & secondary packaging 99 16%
FG losses % 2.0%VC 614 100%
30
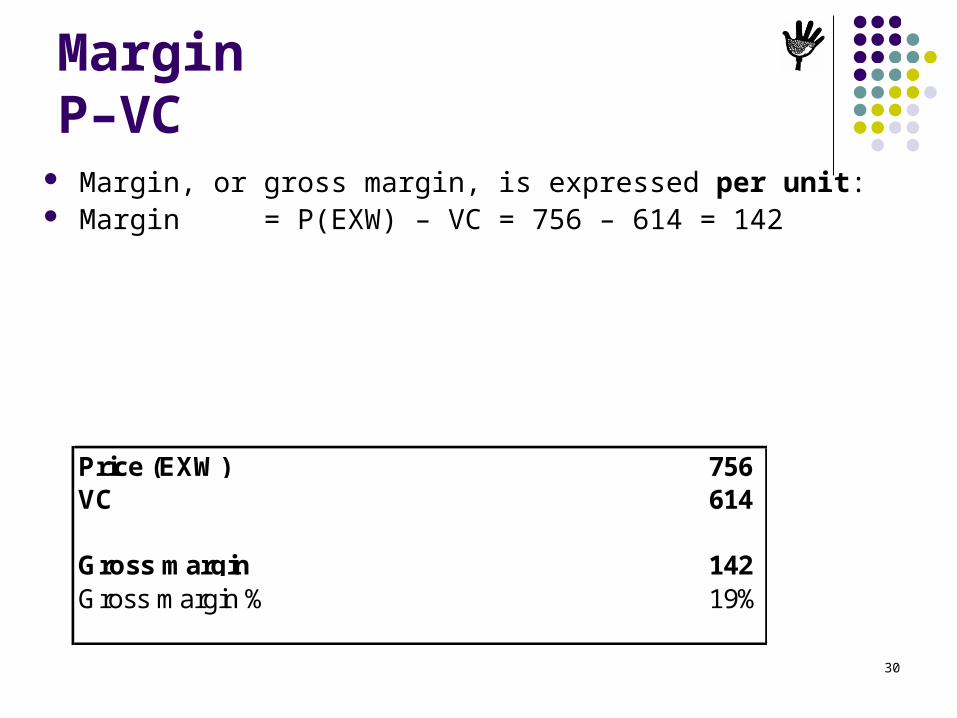
MarginP–VC
Margin, or gross margin, is expressed per unit: Margin = P(EXW) – VC = 756 – 614 = 142
Price (EXW) 756 VC 614
Gross margin 142 Gross margin % 19%

31
Margin %(P–VC) / P * 100%
Margin % = Margin / P(EXW) * 100% = 142 / 756 = 19% Margin % helps us to evaluate, if a margin is risky or not. Usual risk levels in food processing and manufacturing are:
Margin % Level Comment
<15% Very risky
Only acceptable when the production process parameters and all prices are fully under control.
15-25% Risky Only acceptable if production and price fluctuations are within 5-10% range.
25-35% Normal
35-45% Robust
45-70% Very robust
>70% Unlikely Check your calculations again!

32
Contribution(P–VC) * q
The volume, or quantity sold is expressed in units per period. In this example, 3600 ton of tomato based are sold. Contribution is expressed per period: Contribution = Margin per unit * quantity per period =
= 142 * 3600 = 511,623
Gross margin 142 Volume sold q (ton) 3,600 Gross margin % 19% Contribution 511,623
33
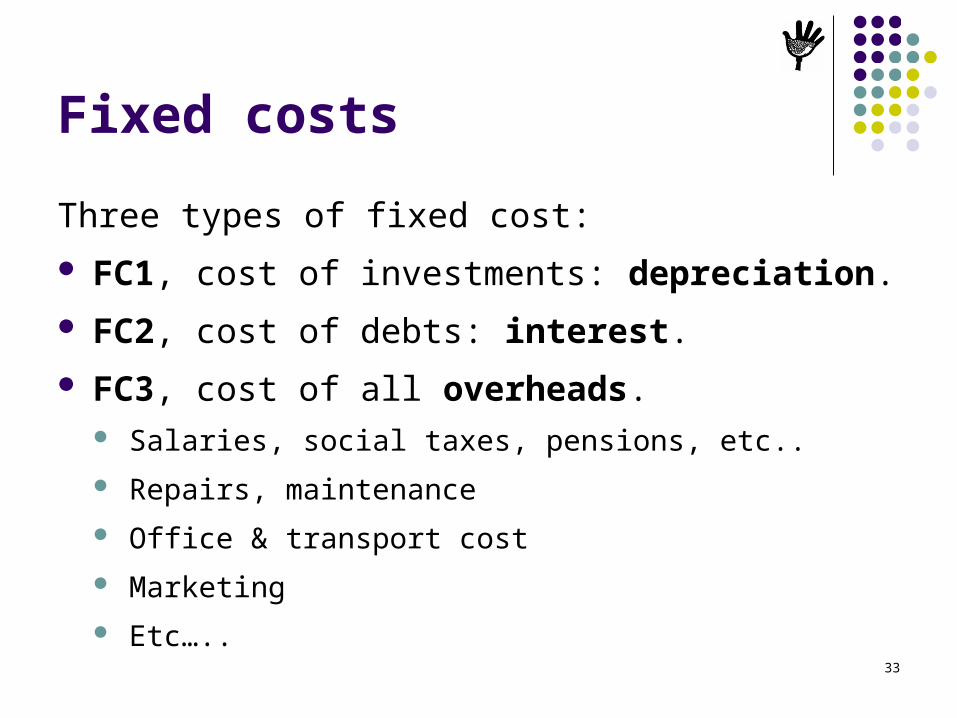
Fixed costs
Three types of fixed cost:
FC1, cost of investments: depreciation.
FC2, cost of debts: interest.
FC3, cost of all overheads. Salaries, social taxes, pensions, etc..
Repairs, maintenance
Office & transport cost
Marketing
Etc…..

34
DepreciationFC1
Use a realistic value for the productive assets. For a tomato processing company this is about 1.8 million. Use a realistic depreciation rate. Here: the replacement period of the factory is 12.8 years. The depreciation = 1 / 12.8 * 100% = 7.8% FC1 = Asset value * depreciation % = 1,800,000 * 7.8% = 140,000
Asset value 1,800,000 Depreciation % 7.8%FC1 140,000 41%
35
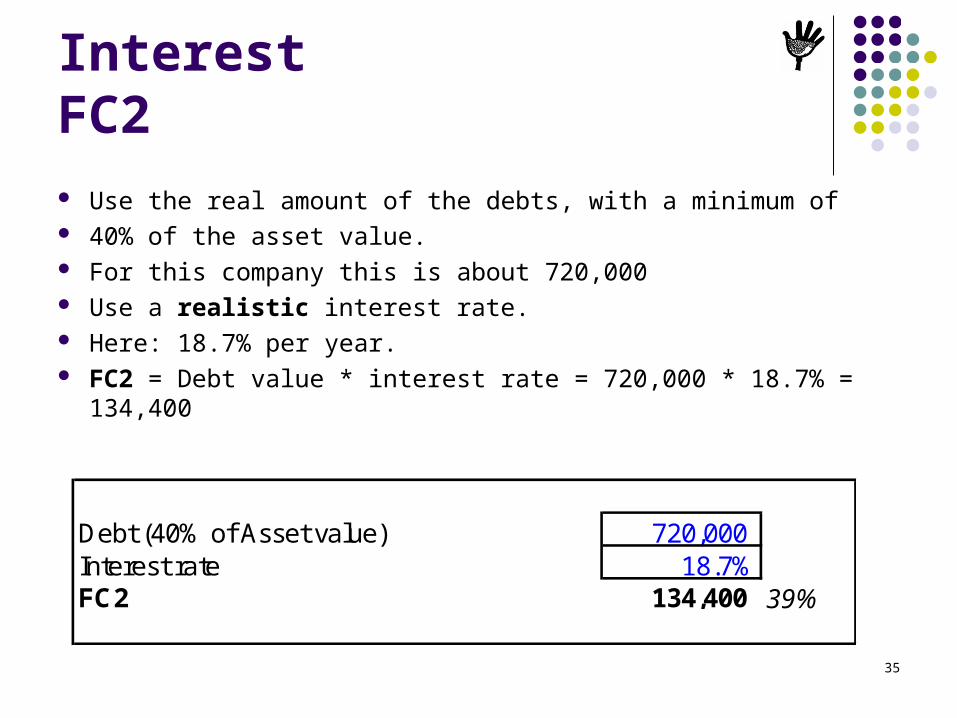
InterestFC2
Use the real amount of the debts, with a minimum of 40% of the asset value. For this company this is about 720,000 Use a realistic interest rate. Here: 18.7% per year. FC2 = Debt value * interest rate = 720,000 * 18.7% = 134,400
Debt (40% of Asset value) 720,000 Interest rate 18.7%FC2 134,400 39%

36
OverheadFC3 Enter the number of full-time equivalent staff (FTE)
10 workers, working 6 months per year = 10 * 6/12 = 5 FTE 10 workers, working 4 months per year = 10 * 4/12 =
Calculate their salaries, incl. all taxes and emoluments: 50,000 Calculate one lump sum amount for all other overheads: 20,000 FC3 = salaries + all other overhead = 50,000 + 20,000 = 70,000
Number of FTE employed 15 Salaries staff incl. social taxes 50,000 15%Other overhead, repairs, maintenance 20,000 6%FC3 70,000 20%
3.3 FTE
37
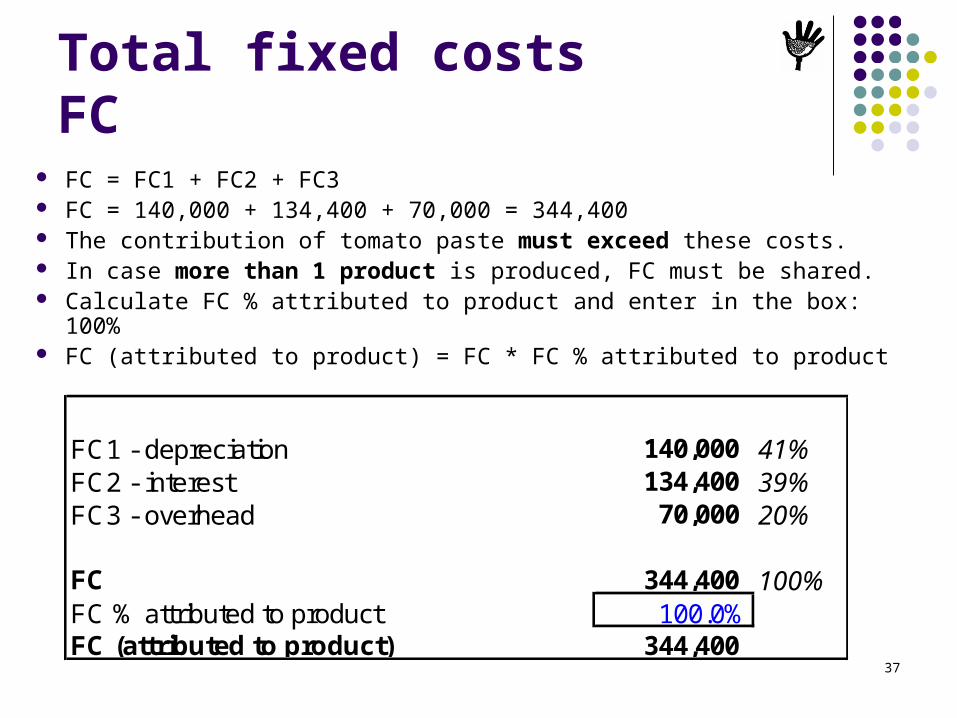
Total fixed costsFC
FC1 - depreciation 140,000 41%FC2 - interest 134,400 39%FC3 - overhead 70,000 20%
FC 344,400 100%FC % attributed to product 100.0%FC (attributed to product) 344,400
FC = FC1 + FC2 + FC3 FC = 140,000 + 134,400 + 70,000 = 344,400 The contribution of tomato paste must exceed these costs. In case more than 1 product is produced, FC must be shared. Calculate FC % attributed to product and enter in the box: 100% FC (attributed to product) = FC * FC % attributed to product
38
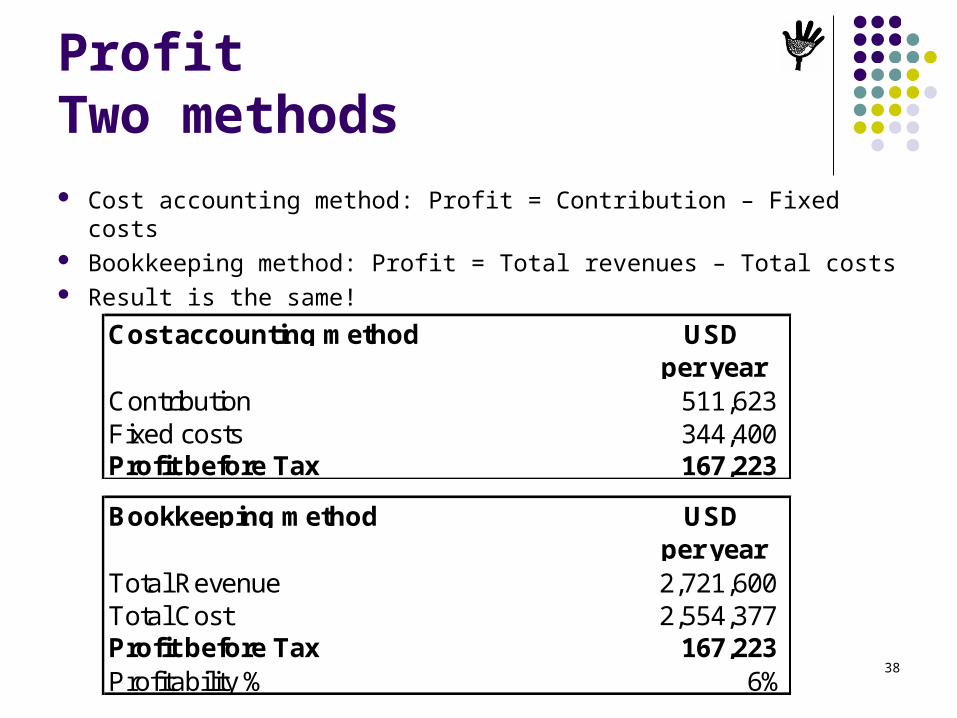
ProfitTwo methods
Cost accounting method: Profit = Contribution – Fixed costs Bookkeeping method: Profit = Total revenues – Total costs Result is the same!
Cost accounting method USDper year
Contribution 511,623 Fixed costs 344,400 Profit before Tax 167,223
Total Revenue 2,721,600 Total Cost 2,554,377
Profitability % 6%
Contribution 511,623 Fixed costs 344,400
Bookkeeping method USDper year
Total Revenue 2,721,600 Total Cost 2,554,377 Profit before Tax 167,223 Profitability % 6%

39
SummaryCost price
Cost price = total cost per unit
Variable Cost per unit (VC) 614 87%
Fixed Cost per unit (FC/q) 96 13%
Total Cost per unit (VC+FC/q) 710 100%
Price (EXW) 756
Profit per unit (P-VC-FC/q) 46 6%
40
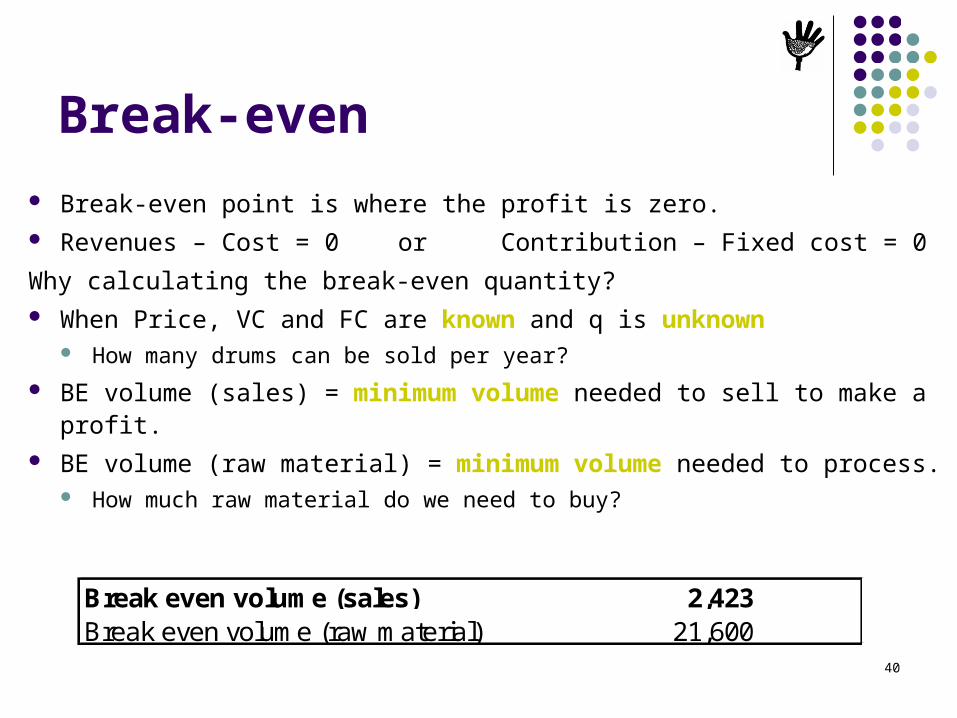
Break-even
Break-even point is where the profit is zero. Revenues – Cost = 0 or Contribution – Fixed cost = 0
Why calculating the break-even quantity? When Price, VC and FC are known and q is unknown
How many drums can be sold per year?
BE volume (sales) = minimum volume needed to sell to make a profit. BE volume (raw material) = minimum volume needed to process.
How much raw material do we need to buy?
Break even volume (sales) 2,423 Break even volume (raw material) 21,600

41
Capacity
q = quantity sold = 3,600 tons of paste per year
qCAP = quantity produced at full capacity utilization
quantity/hour * hours/day * days/year (harvest season)
2 ton/hour * 22 hours/day * 110 days/yr = 4,840 ton/year
utilization = q / qCAP * 100% = 3,600 / 4,840 = 74.4%
Volume sold q (ton) 3,600
Output capacity per hour in ton 2.0 Working hours per day 22 Length of harvesting season in days 110Max. output capacity per year 4,840 Capacity utilization % 74.4%
42
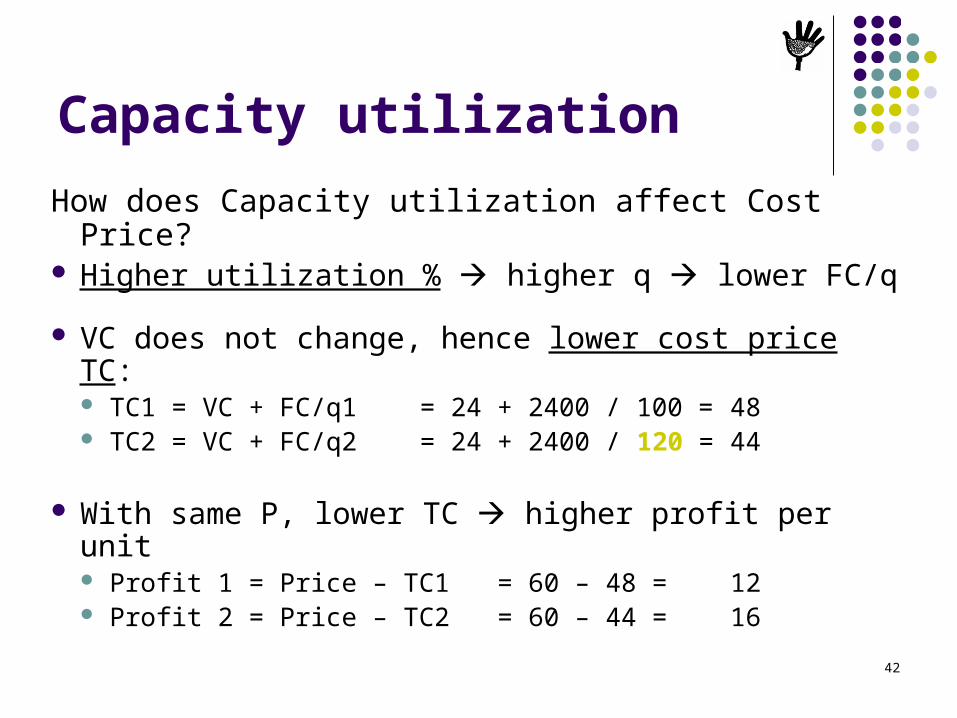
Capacity utilization
How does Capacity utilization affect Cost Price? Higher utilization % higher q lower FC/q
VC does not change, hence lower cost price TC: TC1 = VC + FC/q1 = 24 + 2400 / 100 = 48 TC2 = VC + FC/q2 = 24 + 2400 / 120 = 44
With same P, lower TC higher profit per unit Profit 1 = Price – TC1 = 60 – 48 = 12 Profit 2 = Price – TC2 = 60 – 44 = 16
43
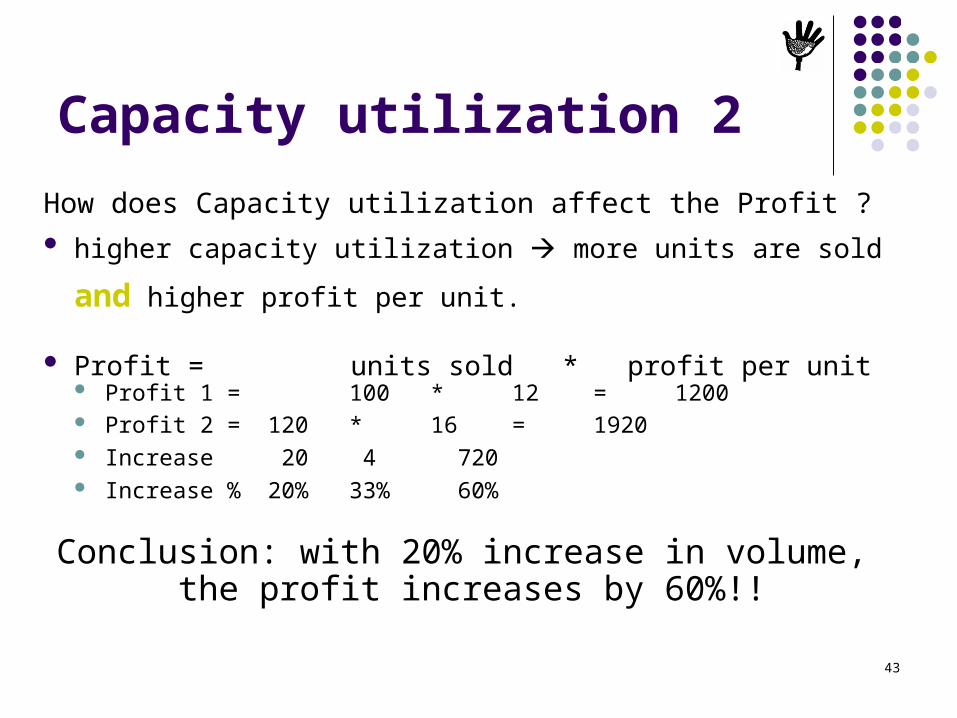
Capacity utilization 2
How does Capacity utilization affect the Profit ? higher capacity utilization more units are sold
and higher profit per unit.
Profit = units sold * profit per unit Profit 1 = 100 * 12 = 1200 Profit 2 = 120 * 16 = 1920 Increase 20 4 720 Increase % 20% 33% 60%
Conclusion: with 20% increase in volume, the profit increases by 60%!!

44
Part 4
Practice
Learning objective: 1. Each person, with own laptop and CB1
installed, able to obtain correct data from the sources provided and fill in into CB1
2. Able to carry out a series of sensitivity tests.

45
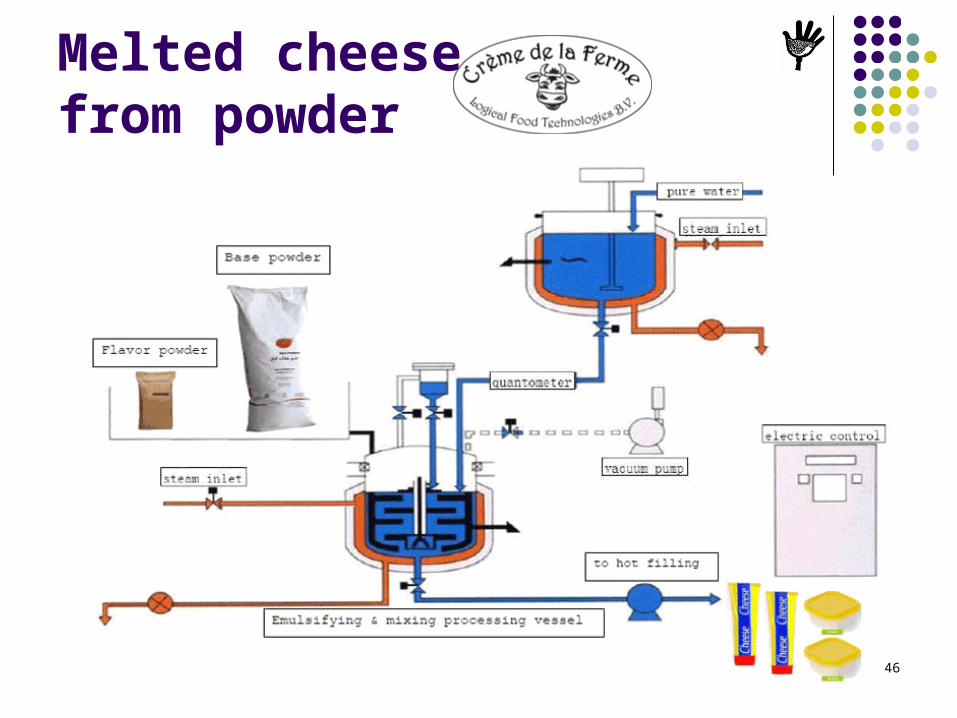
Crème de la FermeLogical Food Technologies B.V. has developed Crème de la Ferme. Crème de la Ferme is an instant cheese powder consisting of fresh natural healthy traceable ingredients. The powder is a mixture of milk powder and natural or natural identical flavors. The instant cheese powder is dissolved in hot water and pasteurized, which gives a stable healthy cheese spread that should be hot-filled and sealed. With the use of a base and flavor powder a variety of cheese flavors can be produced easily.
Crème de la Ferme cheese base powder is supplied in 25 kg bags and the cheese flavor powder is supplied in 2,5 kg bags. The bags are made of a multi-layer paper with a poly inner liner. The base and flavor powders are mixed with 110 – 125% water. This gives the client the possibility to produce cheese spread locally at a very competitive price.
Cheddar, Gouda, Emmentaler, ParmesanGoat cheese, Mozzarella, Camembert Feta, Cream cheese
Local licensees / purchasers of Crème de la Ferme have opportunity to add local herbs, spices, etc to enlarge their product range.
Cost for freight, local legislative requirements, import duties, certification for Halal, Kosher, or GOS are charged extra.http://www.cdlf.nl/
46
Melted cheese from powder

47
Productionand Filling Production takes place in
batches of 50-80 kg. Batch processing time is 7
minutes, or about 8-9 batches per hour.
During one batch, the equipment consumes about €1,25 in steam and electricity.
Six workers are needed per 8 hour shift.
The product can be sold at €5,80 per kg in the shop.
The filler can do 4,800 cups per hour.
Cup size can vary from 100 to 250 gram.
The price for a cup, seal and label is: 100 gram = €0,085 150 gram = €0,10
A carton box takes: 100 gram = 18 cups 150 gram = 12 cups
Box + label cost €0,50

48
Recipe and Investment
Ingredient Recipe Cost per Kg Cost in batch %1 CDLF Instant Gouda Flavor 5.5 kg 14.40 79.22 45.1%2 Base powder FCMP (DDP) 20.0 kg 4.75 95.00 54.1%3 Water 30.6 kg 0.05 1.53 0.9%4 - 0.0%8 - 0.0%
BATCH 56.10 kg 175.75 100.0%
Investment Price EUR % Depreciation1 Mix & smelt unit 60,000 10% 6,000 2 Inline homogeniser 15,000 10% 1,500 3 UHT pasterurizer 65,000 10% 6,500 4 Cup filler (4800/hr) 105,000 10% 10,500 5 Utilities 130,000 10% 13,000 6 Building 250,000 5% 12,500 78
BATCH 625,000 8.0% 50,000

49
CB1Fill in the data
Gouda Melted Cheese in 150 gram cups. Fill in the Cigar Box using the data above. Make your own assumptions where needed. Time needed:
Experienced person: 5 minutes Learner: ??
Good luck!

50
CIGAR BOX 1 - Gouda Melted Cheese, (sterilized 4800 cups/hour) in cups of 150gr, 12 per carton box (1.8 kg) Nov-10- -
per ton per yearPrice (Retail price, delivered) 5,800 Total Revenue 2,148,679 VAT 6% 328 Total Cost 1,983,537 Transport cost 100 Profit Before Tax 165,142 Price (EXW) 5,372 Profitability % 8%
Price (Gouda CDLF, DDP factory) 16,579 Asset value 625,000 Processing ratio 0.10 Depreciation % 8.0%Raw Material cost 1,625 37% FC1 50,000 22%Other ingredients, DDP factory 1,721 39%VC1 3,346 76% Debt (40% of Asset value) 250,000
Interest rate 15.0%Production cost per hour (gas, electricity) 10.71 FC2 37,500 17%Production volume per hour (ton/hour) 0.48VC2 22 0.5% Number of FTE (8hr/day) employed 12
Salaries staff incl. social taxes 86,400 39%Other overhead, repairs, maintenance 50,000 22%
Cost of packing (cup, seal, label, box) 1.70 FC3 136,400 61%Number of bags per ton 556VC3 944 21% FC 223,900 100%
FC % attributed to product 100.0%FG losses % 2.0%VC 4,399 100% FC (attributed to product) 223,900
Gross margin 973 Volume sold q (ton) 400 Gross margin % 18% Contribution 389,042
Variable cost 4,399 89% Break even volume (sales) 230 Break even volume (raw material) 39
Fixed Cost / q 560 11%Output capacity per hour in ton 0.48
Total Cost / q 4,959 100% Operating hours per day 8 Working days per year 250
Profit / q 413 Max. output capacity per year 962 Capacity utilization % 41.6%
Note: figures in blue are assumptions; figures in pink are calculated in another sheet; figures in black are formulas


