1 Workshop: Development and Use of Outcome-based Measures in Government Planning & Reporting September 28 th , 2006 Winnipeg, Manitoba Presented by: Manitoba Treasury Board Secretariat , Office of the Provincial Comptroller of Manitoba, and The International Institute for Sustainable Development (IISD)
Transcript
1
Workshop:Development and Use of
Outcome-based Measures in Government Planning & Reporting
September 28th, 2006 Winnipeg, Manitoba
Presented by:
Manitoba Treasury Board Secretariat ,Office of the Provincial Comptroller of Manitoba, and
The International Institute for Sustainable Development (IISD)
2
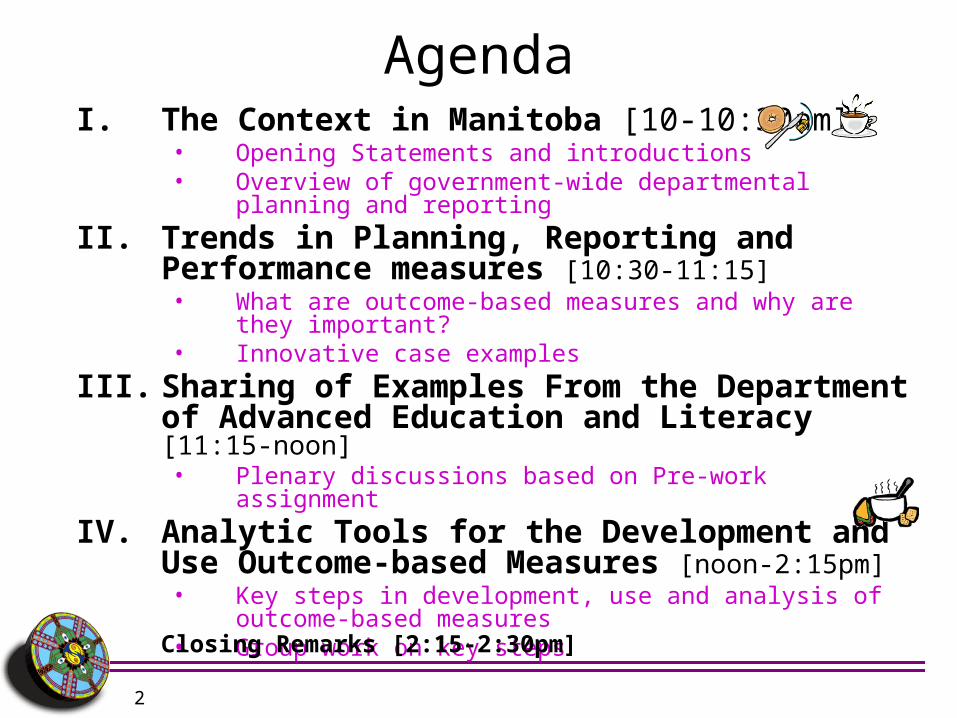
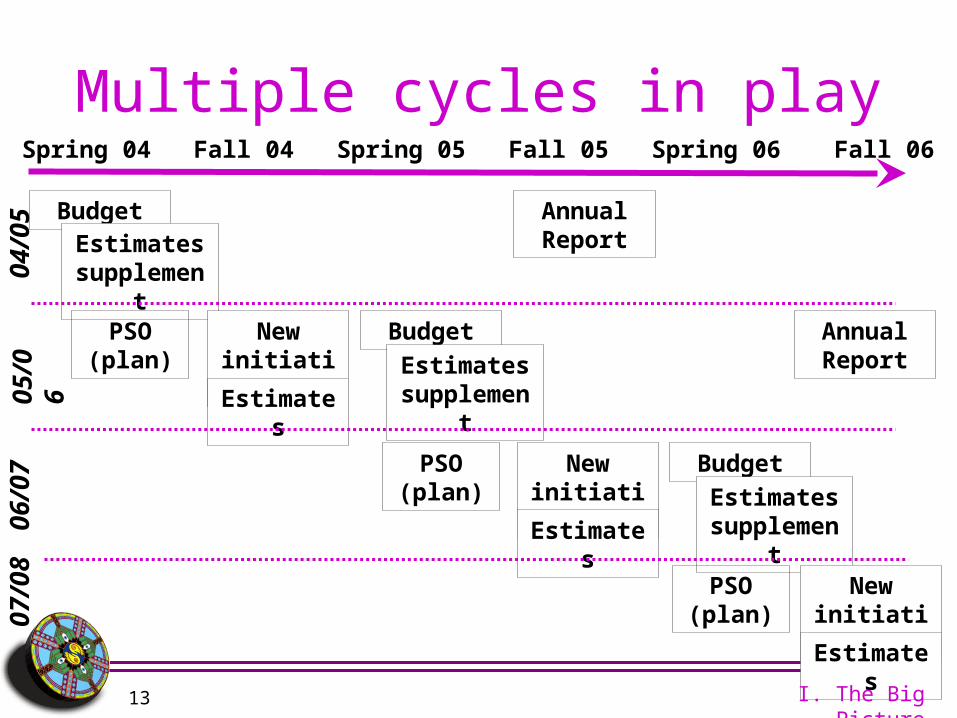
AgendaI. The Context in Manitoba [10-10:30am]
• Opening Statements and introductions• Overview of government-wide departmental planning and
reporting
II. Trends in Planning, Reporting and Performance measures [10:30-11:15]• What are outcome-based measures and why are they
important?• Innovative case examples
III. Sharing of Examples From the Department of Advanced Education and Literacy [11:15-noon]• Plenary discussions based on Pre-work assignment
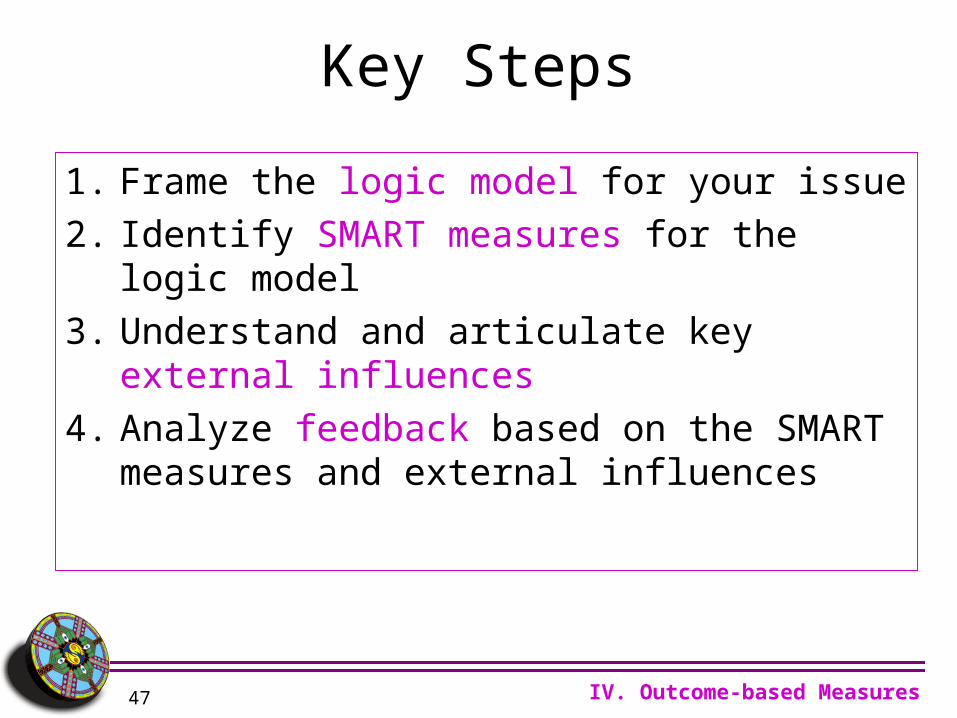
IV. Analytic Tools for the Development and Use Outcome-based Measures [noon-2:15pm]• Key steps in development, use and analysis of outcome-based
A. What are outcome measures and why are they important?
Our People
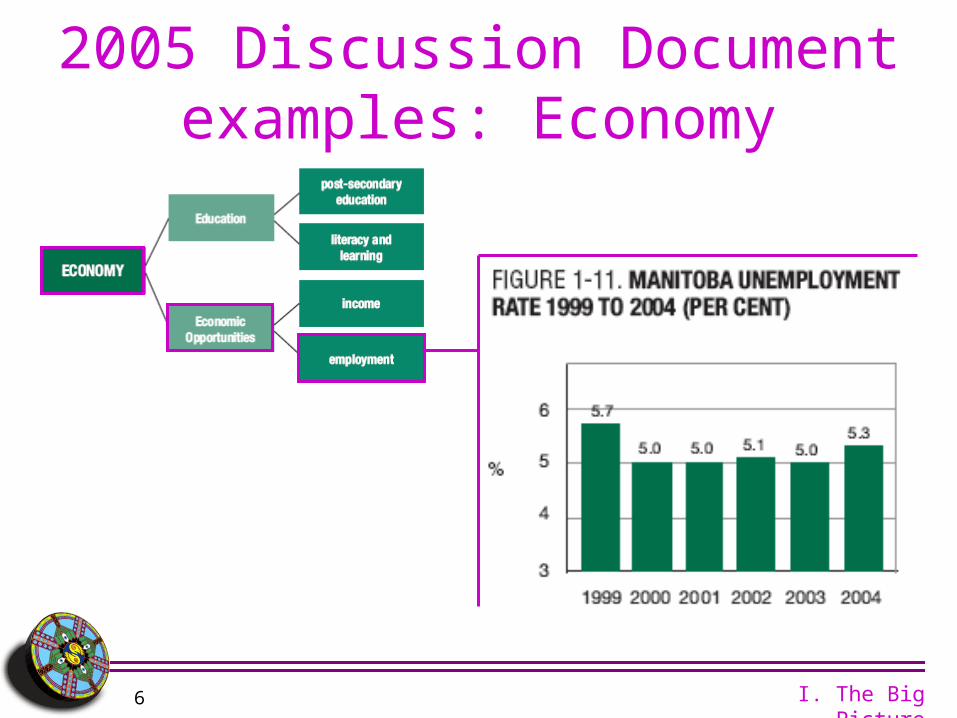
Our Economy
Our Environment
de•vel•op (di•vel′əp) v.t. 1. To expand or bring out the potentialities, capabilities, etc.
II. Trends in Reporting
Experience has shown that a pathway to sustainability cannot be charted in advance. Rather, the pathway must be navigated through processes of learning and adaptation.
National Academy of Science 1999. Our Common Journey: A Transition Toward Sustainability.
• Nations starting to develop information systems to gauge societal wellbeing and sustainability
The United Kingdom
Norway
II. Trends in Reporting
21
Vision
Priorities andObjectives
Plans
Implementation Budgets
Monitoring
Evaluation andImprovement
SD Principles
Inter-generational consideration
Systems thinking
Multi-stakeholder participation
Adaptive managementDepartmental,
Thematic
National SD Strategy Process
Vision
Priorities andObjectives
Plans
Implementation Budgets
Monitoring
Evaluation andImprovement
Accountability Principles
Transparency
Efficiency
Accountability Departmental,
Thematic
Government Accountability
SystemsSustainable
Development Principles
Accountability Principles
22
• Provinces and states using societal goal and outcome-based planning and budgeting systems
Oregon
Alberta
IISD Provincial and State Level Perspective
II. Trends in Reporting
23
IISD Community-level Perspective
• Communities creating new forms of social infrastructure to navigate quality of life and sustainability
Orlando– Healthy Community Indicators Initiative
of Greater Orlando
Winnipeg– Quality of Life Indicators System concept
being proposed by range of community stakeholders
II. Trends in Reporting
24
Output The result of an activity
IntermediateOutcome
Short to medium-term consequence of an output
High-levelOutcome
ActivityProcesses and Inputs of a policy, program, or project
Hybrid from three different logic models (Canadian International Development Agency, Province of Alberta, State of Oregon)
Contributing to society’s wellbeing and
sustainability objectives
External influences
Feedback
Change in wellbeing conditions (economic, social and environmental)
accountability
Key Priority Areas
Logic Model
High-level Outcomes
Actions
High-level Objectives
25
OutputThe result of an activity
IntermediateOutcome
Short to medium-term consequence of an output
High-levelObjectives
Change in well-being conditions (economic, social and environmental)
ActionsProcesses and Inputs of a policy, program or project
Stream water quality
(turbidity)
Rate of soil erosion by
water
Kilometers of river bank with
vegetation
% of re-vegetation programs completed
Environmental Social
Key Priority Areas Healthy, sustainable
surroundings
Quality Jobs
Example Measures
Children entering school ready to learn
% children enrolled in Pre-K
program
Demographic surveys for Head-
start program completed
Head-start program
implemented
26
Climbing the Steps toward Performance Management
Mission/GoalsObjectives
PerformanceMeasures
Analysis for Continuous
Improvement
Mission statements declare the agency’s long-range intent; its purpose. Although the goals expressed in a mission statement may help shape the agency’s values and its organizational culture, they often are imprecise and sometimes even a bit vague.
Objectives are unambiguous statements of the agency’s performance intentions, expressed in measurable terms, usually with an implied or explicit timeframe.
Performance measures indicate how much or how well the agency is doing. Ideally, they track the agency’s progress toward achieving its objectives.
Many agencies compare this month’s or this year’s performance measures to those of the past. Some are beginning to make comparisons with other agencies and to begin the process of benchmarking.
(From Gov. of Alberta 1996)
II. Trends in Reporting
27
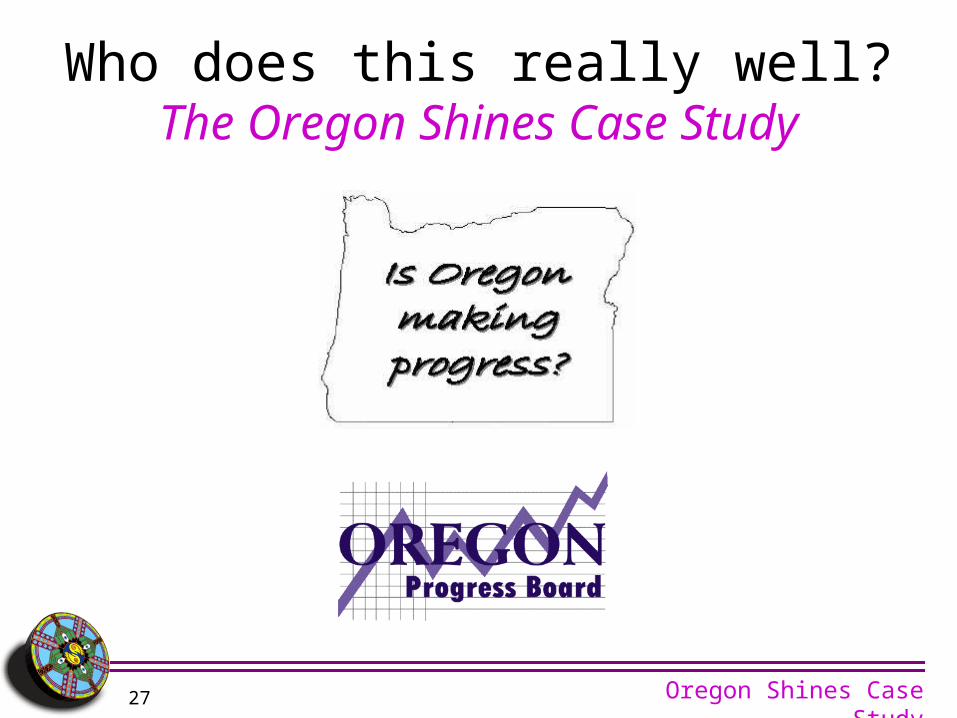
Who does this really well?The Oregon Shines Case Study
Oregon Shines Case Study
28
Oregon Shines
Oregon's Strategic Plan- Oregon Shines (1989)- Updated every eight years
- Encompasses the entire stateOregon Progress Board
- independent agency created to be the steward of Oregon Shines
- law mandates Board to report biennially
- chaired by governor
Oregon Shines Case StudyFrom Conrad (2005)
29
Vision – “Oregon Shines II”
Economy: Quality jobs for all Oregonians
People: Safe, caring andengaged communities
Environment: Healthy, sustainable surroundings
Oregon Shines Case StudyFrom Conrad (2005)
30
Oregon BenchmarksMeasures for how Oregon as a whole is doing.
• Quality Jobs for All Oregonians– Economy (#1-17)– Education (#18-29)
• Engaged, Safe & Caring Communities– Civic Engagement (#29-38)– Social Support (#39-60)– Public Safety (#60-67)
• Healthy, Sustainable Surroundings– Community Development (#68-74)– Environment (#75-90)
Oregon Shines Case StudyFrom Conrad (2005)
High-levelObjectives
Key Priority Areas
31
High Level Outcomes
(Benchmarks)
Is work happening? Outputs
Is society benefiting?
IntermediateOutcomes
Are strategies working?
Linking Government to the Benchmarks
Oregon Shines Case StudyFrom Conrad (2005)
32 Oregon Shines Case Study
http://www.oregon.gov/DAS/OPB/
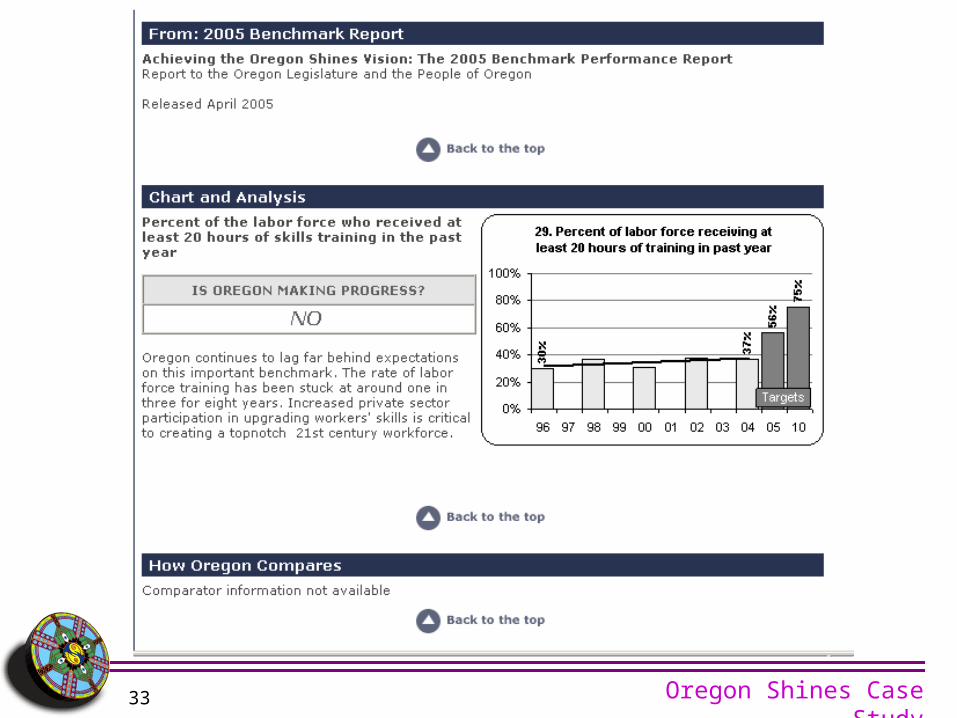
33 Oregon Shines Case Study
34 Oregon Shines Case Study
35 Oregon Shines Case Study
36
Goal #1: Quality Jobs for All Oregonians
Oregon Shines Goals & Benchmarks
Dept of Community Colleges and Workforce
Development
OutputThe result of an activity
IntermediateOutcome
Short to medium-term consequence of an output
High-levelObjectives
Change in well-being conditions (economic, social and environmental)
ActionsProcesses and Inputs of a policy, program or project
Key Priority Areas
Dept Goal #2: Oregon’s workforce is well trained and has access to a wide variety
of training programs
Benchmark #29
Workforce skill development
project
Percent of participants ranking WIA funded current workforce
Analysis: Water quality improving. Quality of water flowing into province has improved significantly.
Analysis: Could be due to less bank vegetation, change in crop or extreme series of extreme rainfall events
Analysis: Cropland expansion could be reason or natural disease. Need to research further
95%
Feedback: Water quality improving but not due to program. Other factors counteracted program such as expanded cropland and reduced zero tillage
• Quality of water flowing into MB• Treatment plant effectiveness
Key Priority Area
Safe drinking water, enjoyable recreation
58
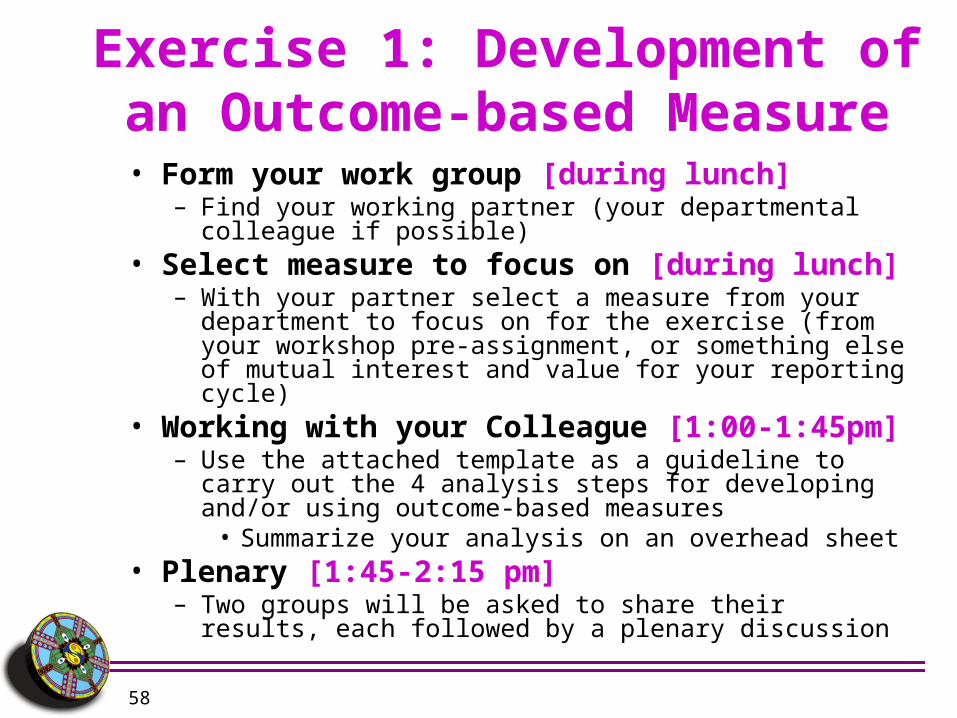
Exercise 1: Development of an Outcome-based Measure
• Form your work group [during lunch]– Find your working partner (your departmental colleague if
possible)• Select measure to focus on [during lunch]
– With your partner select a measure from your department to focus on for the exercise (from your workshop pre-assignment, or something else of mutual interest and value for your reporting cycle)
• Working with your Colleague [1:00-1:45pm]– Use the attached template as a guideline to carry out the 4
analysis steps for developing and/or using outcome-based measures
• Summarize your analysis on an overhead sheet• Plenary [1:45-2:15 pm]
– Two groups will be asked to share their results, each followed by a plenary discussion
59
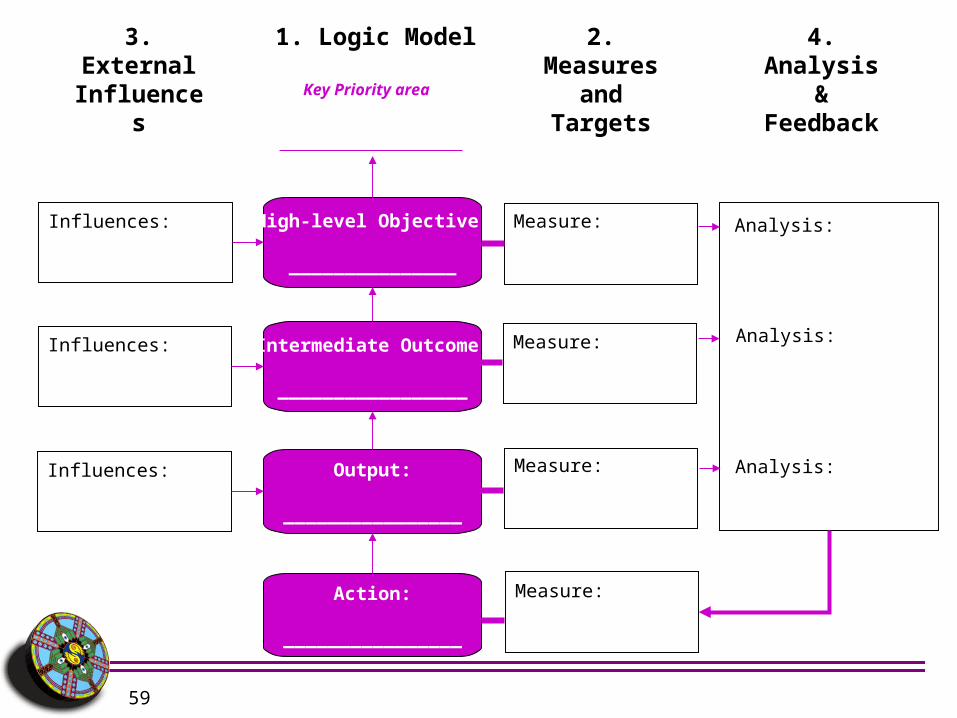
Output:
________________
Intermediate Outcome:
_________________
High-level Objective:
_______________
Action:
________________
2. Measures and Targets
Measure:
Measure:
Measure:
1. Logic Model3. External Influences
Influences:
Influences:
Influences:
4. Analysis & Feedback
Measure:
Analysis:
Analysis:
Analysis:
Key Priority area
60
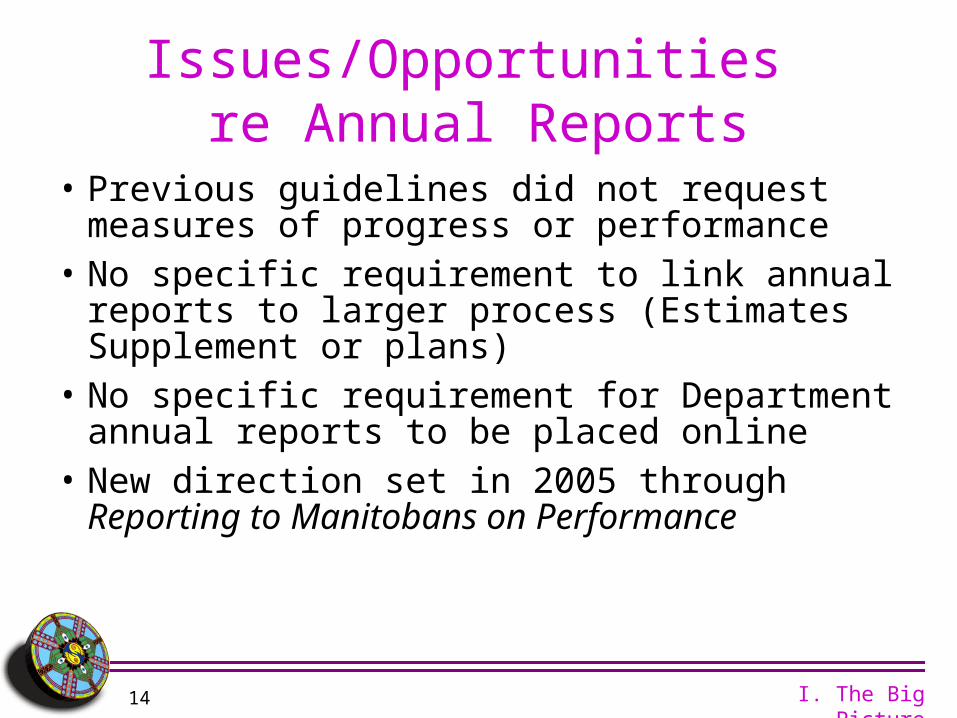
Expectations for this past round of Department Annual Reports (2005-06)
New: Section featuring department performance reporting
New: Central review of the new section
New: Annual Reports to be consistently available online
61
What was required for the new section of the Report?
• Five progress or performance measures• The few critical indicators that illustrate
progress against desired outcomes• Ideally, those that support key Department
priorities• Could be drawn from previous PSOs,
Reporting to Manitobans on Performance document, or other sources
62
Overview of Key Questions That Needed to Be Addressed
What is Being Measured and
How? (A)
Why is it Important to Measure? (B)
What is the most Recent Available
Value for this Indicator? (C)
What is the Trend over
time for this Indicator? (D)
Comments/Recent
Actions/Report Links (E)
1.
2.
3.
4.
5.
63
Illustrative ExampleWhat is being
Measured and How?
Why is it Important
to Measure this?
What is the Most Recent Available
Value for this Indicator?
What is the Trend over time
for this Indicator?
Comments / recent actions /
report links
Access to health services by measuring the percentage of Manitobans reporting “no difficulty” in accessing health services.
One key determinant of population health is its access to quality health services. This measure assesses access only.
For 2003 (most recent survey data), % of Manitobans who reported “no difficulty” accessing: Health information or advice: 82% Immediate care: 75% Routine care: 81%
ImprovingWait times for key procedures have reduced significantly over the last five years. See page X of the report for details.The source of these data is the Statistics Canada Health Access Survey. There is no directly comparable study prior to 2003. The study will be repeated in 20xx.
See page X of the report for a discussion of recent actions addressing access to health services.
NOTE: All information above is adapted from Reporting to Manitobans on Performance 2005 Discussion Document, and is meant for illustrative purposes only.
64
Closing Statements and Next Steps
• Workshop evaluation process
• First thoughts from the group on further capacity building?
65
ReferencesGovernment of Alberta 2005-06 Annual Report – Measuring Up.
Manitoba Provincial Sustainability Report. Government of Manitoba [http://www.gov.mb.ca/conservation/sustainabilityreport/]
Oregon Progress Board: www.oregon.gov/DAS/OPB
Rita Conrad 2005. Results Oriented Strategic Planning: A Framework for Developing Effective Performance Measurement. Presentation to the Botswana Delegation, Salem, Oregon, September 29, 2005.
Rita Conrad 2005. Oregon’s Experience with Performance Reporting. AGA’s First National Performance Management Conference. Oregon Progress Board, November 14 2005.
Reporting to Manitoba on Performance: 2005 Discussion Report. [http://www.gov.mb.ca/finance/mbperformance/index.html]