21
www.EvDBT.com Tuning PL/SQL procedures using DBMS_PROFILER 20-August 2009 Tim Gorman Evergreen Database Technologies, Inc. Northern California Oracle Users Group
| Date post: | 23-Dec-2015 |
| Category: |
Documents |
| Upload: | david-thompson |
| View: | 215 times |
| Download: | 0 times |
www.EvDBT.com1
Tuning PL/SQL procedures using DBMS_PROFILER
20-August 2009
Tim GormanEvergreen Database Technologies, Inc.
Northern CaliforniaOracle Users Group

www.EvDBT.com2
Agenda
• Overview of tuning tools in Oracle– Tuning SQL
–SQL Trace
–TKPROF
–Oracle Trace Analyzer
–Method-R Profiler (www.method-r.com)
– Tuning PL/SQL
–DBMS_PROFILER
– Log4plsql
– ???

www.EvDBT.com3
Overview of performance tuning
• In order to improve anything, you have to measure it– Is it processing?
– If so, what exactly is it doing?
– Is it waiting on something?
– If so, what exactly is it waiting for?
• Performance tuning is not an art, but a science– Instrumentation is key
www.EvDBT.com4
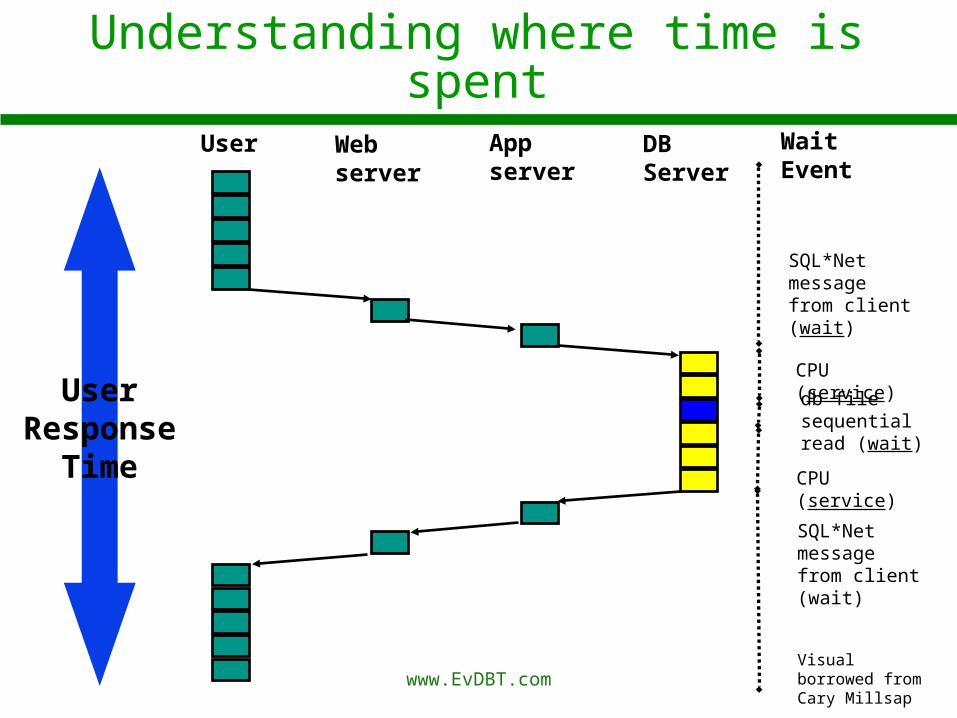
Understanding where time is spent
User Web server App server DB Server
SQL*Net message from client (wait)
SQL*Net message from client (wait)
CPU (service)
CPU (service)
db file sequential read (wait)
Wait Event
UserResponse
Time
Visual borrowed from Cary Millsap
www.EvDBT.com5
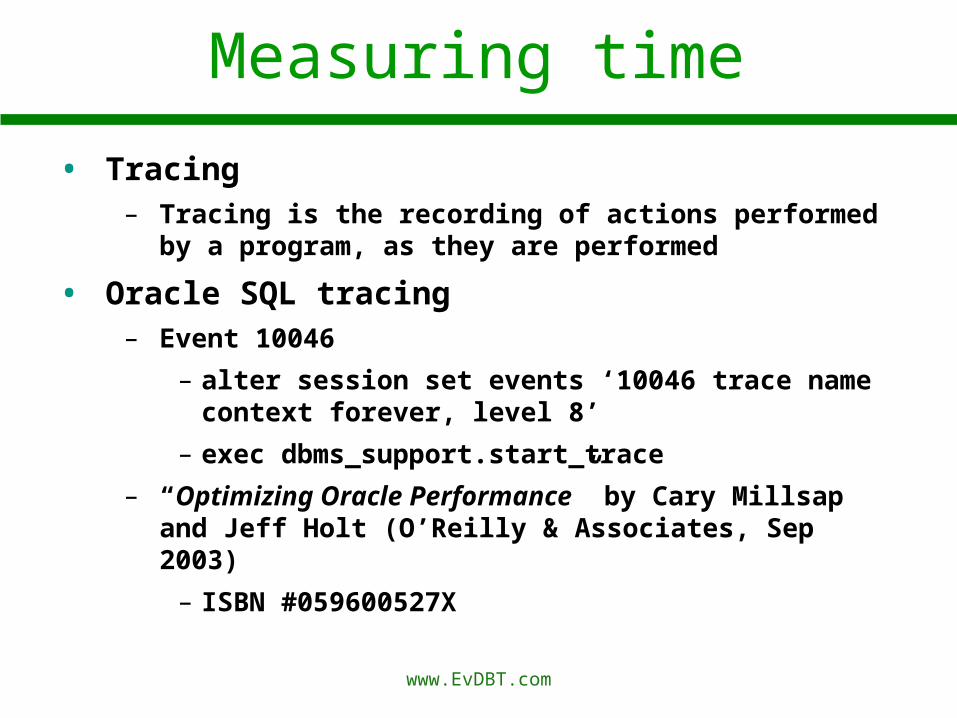
Measuring time
• Tracing– Tracing is the recording of actions performed by a
program, as they are performed
• Oracle SQL tracing– Event 10046
– alter session set events ‘10046 trace name context forever, level 8’
– exec dbms_support.start_trace
– “Optimizing Oracle Performance” by Cary Millsap and Jeff Holt (O’Reilly & Associates, Sep 2003)
– ISBN #059600527X

www.EvDBT.com6
Summarizing tracing data
• Recording every action performed by a program generates huge volumes of data to analyze– Forest and trees
– Look at the trees for diagnosing failures
– Look at the forest to tune performance
• Application profiling– LOG4PLSQL on http://log4plsql.sourceforge.net/
– “C”/”C++” programs: UNIX “prof” utility
– Java programs: EJP on http://www.sourceforge.net
– Commercial products from http://www.semdesigns.com
– profilers for Java, C#, C++, C, COBOL, other languages
– TKPROF for SQL trace data
– Method-R Profiler http://www.method-r.com/software/profiler-info
• Profiling is the summarization of trace data

www.EvDBT.com7
Profiling
• Using the UNIX “prof” utility as an example:– Compile a “C” program using the “-p” option
to the “cc” compiler command
–When compiled/linked program is executed, trace information is output to a file specified by $PROFDIR environment variable (default is “./mon.out”)
– UNIX “prof” utility then reads trace information and produces a summarized “profile report” which summarizes:
–Number of calls to functions
–Amount of time spent in each function

www.EvDBT.com8
Profiling
• SQL Trace is another example– SQL trace is enabled on a session
– All SQL statements executed in that session dump trace information to a “.trc” file in USER_DUMP_DEST
– TKPROF program simply reads information in the “.trc” file and summarizes it, displaying:
– Execution counts
– CPU and elapsed times
– Number of physical, logical I/O
– Number of rows fetched
– Number of waits and time waited

www.EvDBT.com9
What if the problem is not SQL?
• SQL statements perform work in the database– Summarizing SQL trace info is the best tool for
tuning SQL
• What if the performance problem was in:– The network? Operating system? DB instance?
–Database wait events can help
– An application program, such as:
– Java, C#, C++, C, COBOL, Fortran, Lisp?
–PL/SQL?

www.EvDBT.com10
DBMS_PROFILER
• Introduced with Oracle8i (circa 1998)
• Not installed automatically– Some files in “$ORACLE_HOME/rdbms/admin”
– Documented in MetaLink note #243755.1
–Download “prof.zip” from MetaLink
– “Oracle PL/SQL Supplied Packages” reference on “DBMS_PROFILER”
• Generates trace data in PL/SQL programs– Trace data saved to tables in database
– SQL*Plus script produces summarized “profile report” as HTML

www.EvDBT.com11
DBMS_PROFILER
• Files found in “$ORACLE_HOME/rdbms/admin”
• SQL*Plus script “profload.sql” creates the package DBMS_PROFILER– Run once for global setup on database
– Must be performed by SYS user
– Also validates package after creation
• SQL*Plus script “proftab.sql” creates tables to store trace data– Create private sets of tables for each user
– Each user has the three tables and single sequence
– Create a “global set” of tables for all users
– DBA is responsible for granting appropriate permissions and creating synonyms for the three tables and the single sequence

www.EvDBT.com12
DBMS_PROFILER
• Important extra files provided in “prof.zip”– SQL*Plus script “profiler.sql”
–Queries data generated by runs of the DBMS_PROFILER package
–Generates HTML profiler report as output
– SQL*Plus script “profgsrc.sql”
–Extracts the source of a stored package, procedure, or function to an ASCII text file for editing
–So that DBMS_PROFILER procedures can be added to that source code…

www.EvDBT.com13
Using DBMS_PROFILER
• Initial setup:– DBMS_PROFILER package has been created by
the DBA using “profload.sql”…
– developer/user has created the tables using “proftab.sql”
• Add profiler procedures to PL/SQL source– Procedure START_PROFILER(‘run-comment’)
– Procedure STOP_PROFILER
• Recompile and run the procedure

www.EvDBT.com14
Using DBMS_PROFILER
• After running an instrumented PL/SQL program:– Execute the SQL*Plus script “profiler.sql”
– It will display each session’s RUN-ID, a timestamp, and the RUN-COMMENT
–Choose the appropriate RUN-ID
–Produces spooled output to a file named “profiler_<RUNID>.html”
www.EvDBT.com15
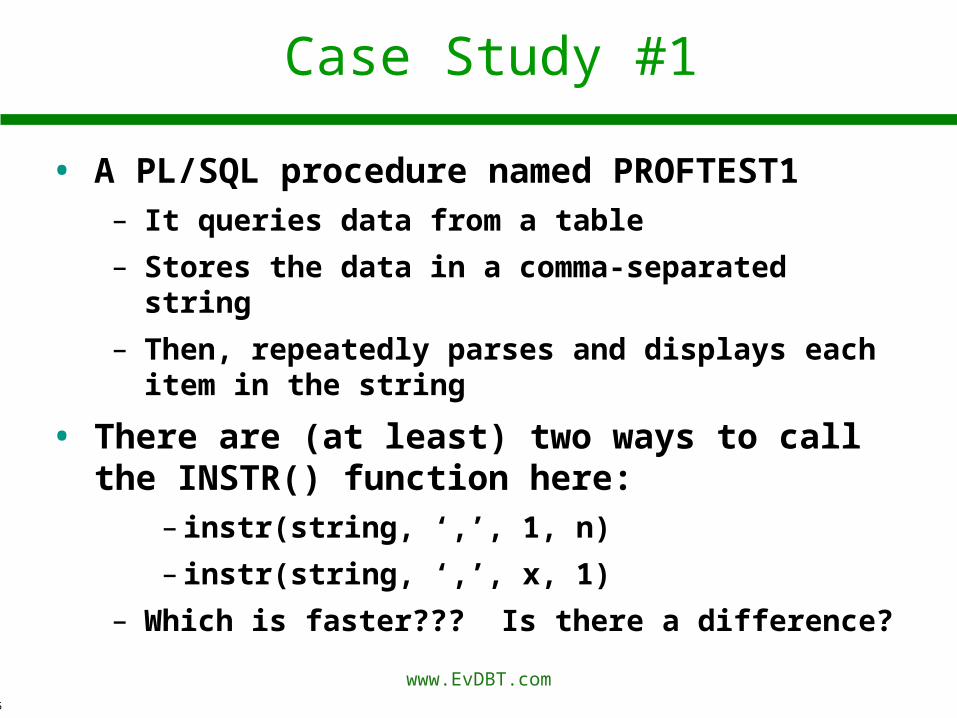
Case Study #1
• A PL/SQL procedure named PROFTEST1– It queries data from a table
– Stores the data in a comma-separated string
– Then, repeatedly parses and displays each item in the string
• There are (at least) two ways to call the INSTR() function here:
–instr(string, ‘,’, 1, n)
–instr(string, ‘,’, x, 1)
– Which is faster??? Is there a difference?

www.EvDBT.com16
Case Study #1
• Files:– proftest1.sql
– DDL to create stored procedure and table
– Including use of DBMS_PROFILER
– run_proftest1.sql
– SQL*Plus script to run the test
– proftest1.tkp
– Output from tkprof <trc-file> <tkp-file> sort=prsela,exeela,fchela explain=<un>/<pwd>
– proftest1_19.html
– proftest1_20.html
www.EvDBT.com17
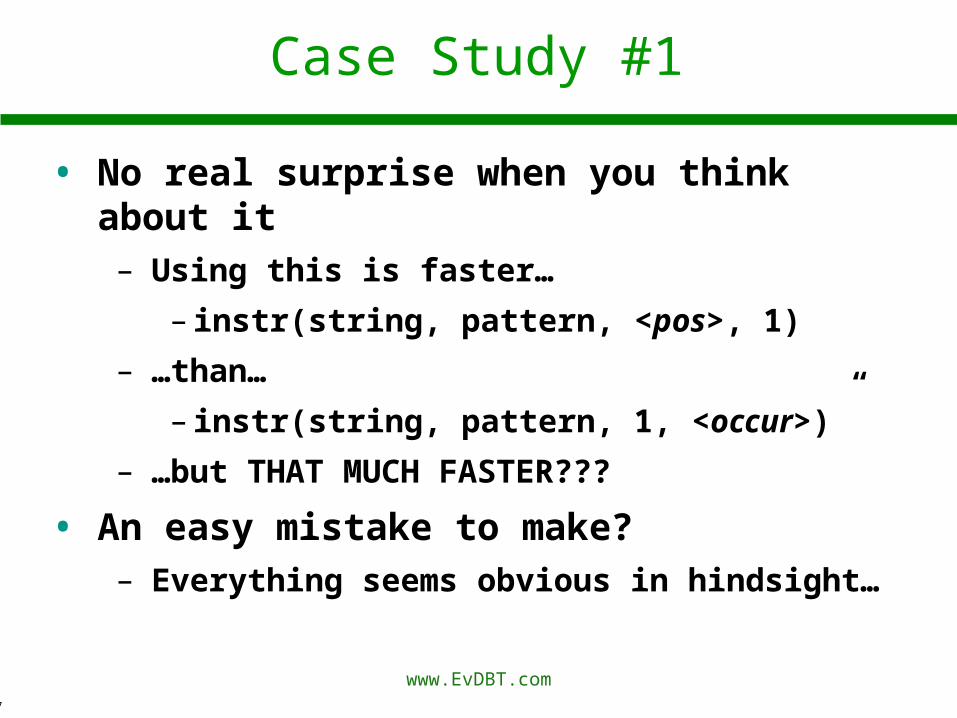
Case Study #1
• No real surprise when you think about it– Using this is faster…
–instr(string, pattern, <pos>, 1)
– …than…
–instr(string, pattern, 1, <occur>)”
– …but THAT MUCH FASTER???
• An easy mistake to make?– Everything seems obvious in hindsight…
www.EvDBT.com18
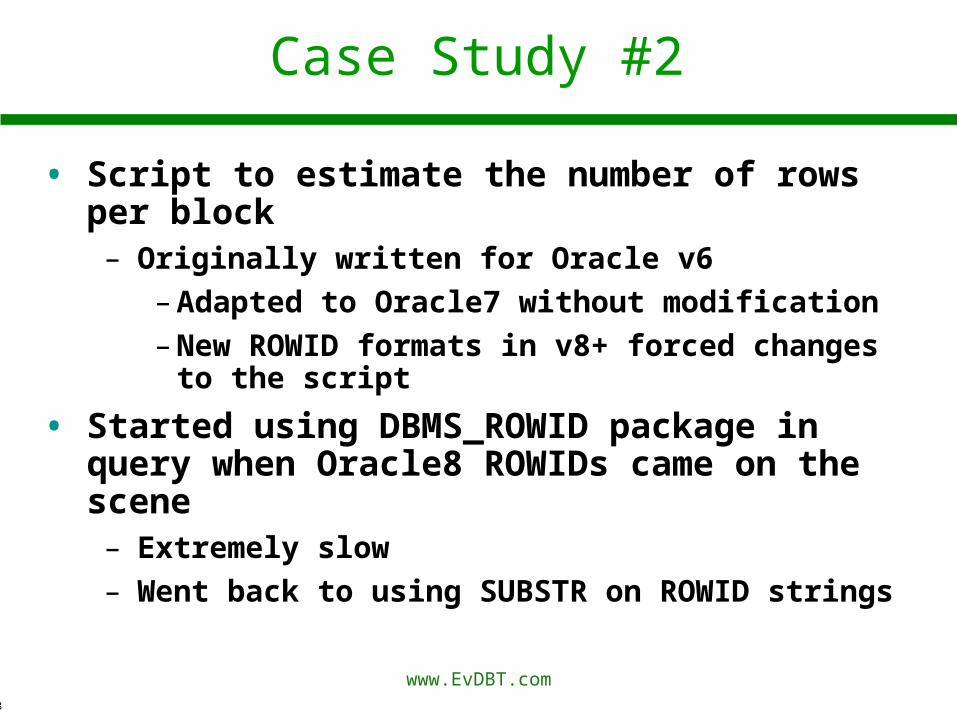
Case Study #2
• Script to estimate the number of rows per block– Originally written for Oracle v6
–Adapted to Oracle7 without modification
–New ROWID formats in v8+ forced changes to the script
• Started using DBMS_ROWID package in query when Oracle8 ROWIDs came on the scene– Extremely slow
– Went back to using SUBSTR on ROWID strings

www.EvDBT.com19
Case Study #2
• Files:– proftest2.sql
– DDL to create stored procedure and table
– Including use of DBMS_SUPPORT and DBMS_PROFILER
– run_proftest2.sql
– SQL*Plus script to run the test
– proftest2.tkp
– Output from tkprof <trc-file> <tkp-file> sort=prsela,exeela,fchela explain=<un>/<pwd>
– proftest2_1.html
– proftest2_2.html
www.EvDBT.com20
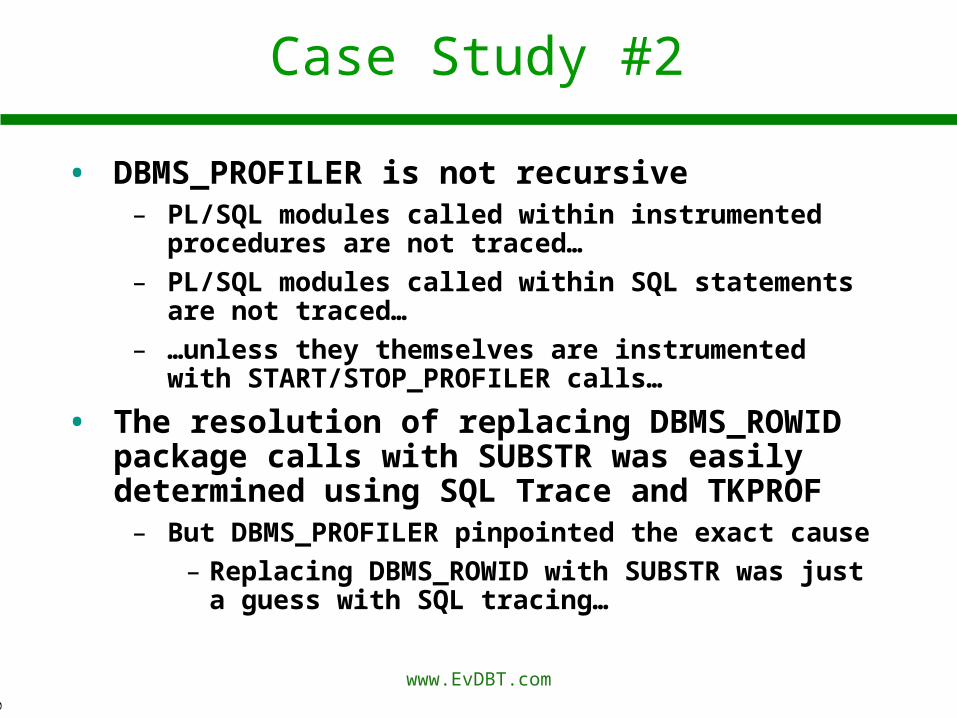
Case Study #2
• DBMS_PROFILER is not recursive– PL/SQL modules called within instrumented procedures
are not traced…
– PL/SQL modules called within SQL statements are not traced…
– …unless they themselves are instrumented with START/STOP_PROFILER calls…
• The resolution of replacing DBMS_ROWID package calls with SUBSTR was easily determined using SQL Trace and TKPROF– But DBMS_PROFILER pinpointed the exact cause
– Replacing DBMS_ROWID with SUBSTR was just a guess with SQL tracing…


