10-701 Final Exam, Spring 2007 1. Personal info: • Name: • Andrew account: • E-mail address: 2. There should be 16 numbered pages in this exam (including this cover sheet). 3. You can use any material you brought: any book, class notes, your print outs of class materials that are on the class website, including my annotated slides and relevant readings, and Andrew Moore’s tutorials. You cannot use materials brought by other students. Calculators are allowed, but no laptops, PDAs, phones or Internet access. 4. If you need more room to work out your answer to a question, use the back of the page and clearly mark on the front of the page if we are to look at what’s on the back. 5. Work efficiently. Some questions are easier, some more difficult. Be sure to give yourself time to answer all of the easy ones, and avoid getting bogged down in the more difficult ones before you have answered the easier ones. 6. Note there are extra-credit sub-questions. The grade curve will be made without considering students’ extra credit points. The extra credit will then be used to try to bump your grade up without affecting anyone else’s grade. 7. You have 180 minutes. 8. Good luck! Question Topic Max. score Score 1 Short questions 21 + 0.911 extra 2 SVM and slacks 16 3 GNB 8 4 Feature Selection 10 5 Irrelevant Features 14 + 3 extra 6 Neural Nets 16 + 5 extra 7 Learning theory 15 1
Transcript
10-701 Final Exam, Spring 2007
1. Personal info:
• Name:
• Andrew account:
• E-mail address:
2. There should be 16 numbered pages in this exam (including this cover sheet).
3. You can use any material you brought: any book, class notes, your print outs of classmaterials that are on the class website, including my annotated slides and relevantreadings, and Andrew Moore’s tutorials. You cannot use materials brought by otherstudents. Calculators are allowed, but no laptops, PDAs, phones or Internet access.
4. If you need more room to work out your answer to a question, use the back of the pageand clearly mark on the front of the page if we are to look at what’s on the back.
5. Work efficiently. Some questions are easier, some more difficult. Be sure to give yourselftime to answer all of the easy ones, and avoid getting bogged down in the more difficultones before you have answered the easier ones.
6. Note there are extra-credit sub-questions. The grade curve will be made withoutconsidering students’ extra credit points. The extra credit will then be used to try tobump your grade up without affecting anyone else’s grade.
7. You have 180 minutes.
8. Good luck!
Question Topic Max. score Score
1 Short questions 21 + 0.911 extra2 SVM and slacks 163 GNB 84 Feature Selection 105 Irrelevant Features 14 + 3 extra6 Neural Nets 16 + 5 extra7 Learning theory 15
1
1 [ Points] Short Questions
The following short questions should be answered with at most two sentences, and/or apicture. For the (true/false) questions, answer true or false. If you answer true, provide ashort justification, if false explain why or provide a small counterexample.
1. [ points] Your billionaire friend needs your help. She needs to classify job applicationsinto good/bad categories, and also to detect job applicants who lie in their applicationsusing density estimation to detect outliers. To meet these needs, do you recommendusing a discriminative or generative classifier? Why?
2. [ points] Your billionaire friend also wants to classify software applications to detectbug-prone applications using features of the source code. This pilot project only hasa few applications to be used as training data, though. To create the most accurateclassifier, do you recommend using a discriminative or generative classifier? Why?
3. [ points] Finally, your billionaire friend also wants to classify companies to decidewhich one to acquire. This project has lots of training data based on several decadesof research. To create the most accurate classifier, do you recommend using a discrim-inative or generative classifier? Why?
4. [ points] Assume that we are using some classifier of fixed complexity. Draw a graphshowing two curves: test error vs. the number of training examples and cross-validation
2
guestrin
Pencil
guestrin
Pencil
guestrin
Pencil
guestrin
Pencil
guestrin
Pencil
guestrin
Pencil
guestrin
Pencil
guestrin
Pencil
guestrin
Pencil
error vs. the number of training examples.
5. [ points] Assume that we are using an SVM classifier with a Gaussian kernel. Drawa graph showing two curves: training error vs. kernel bandwidth and test error vs.kernel bandwidth
6. [ points] Assume that we are modeling a number of random variables using a BayesianNetwork with n edges. Draw a graph showing two curves: Bias of the estimate of thejoint probability vs. n and variance of the estimate of the joint probability vs. n.
7. [ points]
(a) Both PCA and linear regression can be thought of as algorithms for minimizing asum of squared errors. Explain which error is being minimized in each algorithm.
8. [ points] A long time ago there was a village amidst hundreds of lakes. Two typesof fish lived in the region, but only one type in each lake. These types of fish bothlooked exactly the same, smelled exactly the same when cooked, and had the exactsame delicious taste - except one was poisonous and would kill any villager who ateit. The only other difference between the fish was their effect on the pH (acidity) ofthe lake they occupy. The pH for lakes occupied by the non-poisonous type of fish wasdistributed according to a Gaussian with unknown mean (µsafe) and variance (σ2
safe)
3
guestrin
Pencil
guestrin
Pencil
guestrin
Pencil
guestrin
Pencil
guestrin
Pencil
guestrin
Pencil
guestrin
Pencil
guestrin
Pencil
guestrin
Pencil
guestrin
Pencil
guestrin
Pencil
guestrin
Pencil
guestrin
Pencil
guestrin
Pencil
guestrin
Pencil
guestrin
Pencil
guestrin
Pencil
guestrin
Pencil
guestrin
Pencil
guestrin
Pencil
guestrin
Pencil
guestrin
Pencil
and the pH for lakes occupied by the poisonous type was distributed according to adifferent Gaussian with unknown mean (µdeadly) and variance (σ2
deadly). (Poisonous fishtended to cause slightly more acidic conditions).
Naturally, the villagers turned to machine learning for help. However, there was muchdebate about the right way to apply EM to their problem. For each of the follow-ing procedures, indicate whether it is an accurate implementation of Expectation-Maximization and will provide a reasonable estimate for parameters µ and σ2 for eachclass.
(a) Guess initial values of µ and σ2 for each class. (1) For each lake, find the mostlikely class of fish for the lake. (2) Update the µ and σ2 values using their max-imum likelihood estimates based on these predictions. Iterate (1) and (2) untilconvergence.
(b) For each lake, guess an initial probability that it is safe. (1) Using these prob-abilities, find the maximum likelihood estimates for the µ and σ values for eachclass. (2) Use these estimates of µ and σ to reestimate lake safety probabilities.Iterate (1) and (2) until convergence.
(c) Compute the mean and variance of the pH levels across all lakes. Use these valuesfor the µ and σ2 value of each class of fish. (1) Use the µ and σ2 values of eachclass to compute the belief that each lake contains poisonous fish. (2) Find themaximum likelihood values for µ and σ2. Iterate (1) and (2) until convergence.
4
guestrin
Pencil
guestrin
Pencil
guestrin
Pencil
guestrin
Pencil
guestrin
Pencil
guestrin
Pencil
guestrin
Pencil
guestrin
Pencil
guestrin
Pencil
guestrin
Pencil
guestrin
Pencil
guestrin
Pencil
guestrin
Pencil
guestrin
Pencil
guestrin
Pencil
guestrin
Pencil
guestrin
Pencil
guestrin
Pencil
guestrin
Pencil
2 [ points] Reinforcement Learning
Consider the following Markov Decision Process:
S1 S2 S3 S4 S5
r = 1
r = 1
r = 1
r = 1
r = 1
r = 1
r = 10
r = 1
We have states S1, S2, S3, S4, and S5. We have actions Left and Right, and the chosenaction happens with probability 1. In S1 the only option is to go back to S2, and similarly inS5 we can only go back to S4. The reward for taking any action is r = 1, except for takingaction Right from state S4, which has a reward r = 10. For all parts of this problem, assumethat γ = 0.8.
1. What is the optimal policy for this MDP?
2. What is V ∗(S5)? It is acceptable to state it in terms of γ, but not in terms of statevalues.
3. Consider executing Q-learning on this MDP. Assume that the Q values for all (state,action)pairs are initialized to 0, that α = 0.5, and that Q-learning uses a greedy explorationpolicy, meaning that it always chooses the action with maximum Q value. The algo-rithm breaks ties by choosing Left. What are the first 10 (state, action) pairs if our
5
guestrin
Pencil
robot learns using Q-learning and starts in state S3 (e.g. (S3, Left), (S2, Right), (S3, Right), . . . )?
4. Now consider executing Rmax on this MDP. Assume that we trust an observed P (x′|x, a)transition probability after a single observation, that the value of Rmax = 100, and thatwe update our policy each time we observe a transition. Also, assume that Rmax breaksties by choosing a policy of Left. What are the first 10 (state, action) pairs if our robotlearns using Rmax and starts in state S3 (e.g. (S3, Left), (S2, Right), (S3, Right), . . . )?
6
3 [ Points] Bayes Net Structure Learning
Finding the most likely Bayes Net structure given data is generally intractable. However, ifcertain restrictions are imposed on the structure, the most likely one can be found efficiently.One such restriction imposes a fixed ordering on the variables of the Bayes Net. This orderingrestricts all edges to be directed forward in the ordering. For example, an edge X → Y canonly exist if X comes before Y in the ordering.
1. We’ll now explore the effect that the ordering has on the number of parameters andindependence assumptions of Bayes Nets. In each box you are given a Bayes Net thatobeys a fixed ordering ABCD (1A and 1B).
Draw a Bayes Net (part 2A) for the fixed ordering DCBA that can model the samedistribution as the Bayes Net of part 1A. It should have no additional independenceassumptions that are not present in part 1A, but also no unnecessary edges. Repeatfor 1B and 2B.
Count the number of parameters in each Bayes Net. Each variable is binary - itcan take on 2 values.
Identify an independence assumption of Bayes Net 1A that doesn’t exist in BayesNet 2A, if such an independence assumption exists. Repeat for Bayes Nets 1B and 2B.
Hint: Pay close attention to V-structures - both existing ones and ones you create!!!
Number of parameters for Bayes Net 1A Number of parameters for Bayes Net 1B
Number of parameters for Bayes Net 2A Number of parameters for Bayes Net 2B
List an independence assumption of List an independence assumption of1A not present in 2A (if there is one) 1B not present in 2B (if there is one)
7
guestrin
Pencil
guestrin
Pencil
guestrin
Pencil
guestrin
Pencil
guestrin
Pencil
guestrin
Pencil
guestrin
Pencil
guestrin
Pencil
guestrin
Pencil
guestrin
Pencil
guestrin
Pencil
guestrin
Pencil
guestrin
Pencil
guestrin
Pencil
guestrin
Pencil
guestrin
Pencil
guestrin
Pencil
guestrin
Pencil
guestrin
Pencil
guestrin
Pencil
guestrin
Pencil
guestrin
Pencil
guestrin
Pencil
guestrin
Pencil
guestrin
Pencil
guestrin
Pencil
guestrin
Pencil
2. Given a fixed ordering over variables: X1, X2, X3, ..., Xn, show that the choice of parentsπn is independent of the choice of other parents π1, ...πn−1. In other words, show that:
maxπ1,...,πnlog P (X1, ..., Xn|π1, ..., πn) =
maxπnf(X1, ..., Xn, πn) + maxπ1,...,πn−1
g(X1, ..., Xn, π1, ..., πn−1)
for some functions f and g.
8
guestrin
Pencil
guestrin
Pencil
guestrin
Pencil
guestrin
Pencil
guestrin
Pencil
guestrin
Pencil
guestrin
Pencil
guestrin
Pencil
guestrin
Pencil
guestrin
Pencil
guestrin
Pencil
guestrin
Pencil
guestrin
Pencil
guestrin
Pencil
guestrin
Pencil
guestrin
Pencil
guestrin
Pencil
guestrin
Pencil
guestrin
Pencil
guestrin
Pencil
guestrin
Pencil
guestrin
Pencil
guestrin
Pencil
guestrin
Pencil
guestrin
Pencil
guestrin
Pencil
guestrin
Pencil
guestrin
Pencil
guestrin
Pencil
guestrin
Pencil
guestrin
Pencil
guestrin
Pencil
3. For fixed orderings with a limit of k on the number of parents for each node, the beststructure can be obtained by combinatoric search. For each variable, all subsets ofvariables from earlier in the ordering of size k or less are considered. For each set,log P (child|parents) is computed. We saw in part 1 of this question that the orderingcan change the number of parameters required to model the joint probability. In thisquestion we’ll consider the efficiency of modifying the ordering. This approach can beused to greedily search for a good ordering of variables.
Consider the scenario where you are given a fixed ordering and the most likely BayesNet structure for that fixed ordering. We would like to find the most likely structureafter we switch two adjacent variables in the ordering. How many calculations oflog P (child|parent) would this require in the worst case? Explain.
Local swapping of variables is prone to getting stuck in local maxima. Instead, let’sconsider changing the fixed ordering so that the two variables we swap have j variablesin between. How many log P (child|parent) calculations are required to find the mostlikely structure for this new ordering in the worst case? Explain.
9
guestrin
Pencil
guestrin
Pencil
guestrin
Pencil
guestrin
Pencil
guestrin
Pencil
guestrin
Pencil
guestrin
Pencil
guestrin
Pencil
guestrin
Pencil
guestrin
Pencil
guestrin
Pencil
guestrin
Pencil
guestrin
Pencil
guestrin
Pencil
guestrin
Pencil
guestrin
Pencil
guestrin
Pencil
guestrin
Pencil
guestrin
Pencil
guestrin
Pencil
guestrin
Pencil
guestrin
Pencil
guestrin
Pencil
guestrin
Pencil
guestrin
Pencil
guestrin
Pencil
guestrin
Pencil
guestrin
Pencil
guestrin
Pencil
guestrin
Pencil
guestrin
Pencil
guestrin
Pencil
guestrin
Pencil
guestrin
Pencil
guestrin
Pencil
guestrin
Pencil
guestrin
Pencil
guestrin
Pencil
guestrin
Pencil
guestrin
Pencil
guestrin
Pencil
guestrin
Pencil
4 [ Points] Decision Trees
In class, we discussed greedy algorithms for learning decision trees from training data. Thesealgorithms partition the feature space into labeled regions by greedily optimizing some metric(information gain) in hope of producing simple trees that partition the feature space intoregions that perfectly classify the training data. As with most greedy approaches, if weconsider finding a good tree with a limited depth, this approach is not guaranteed to producethe set of regions that best maximize this metric.
We can always be less greedy. Instead of greedily making one decision and then greedilymaking the next decision, we can consider the outcome of all possible pairs of those twodecisions and choose the best of those. We’ll now explore the benefits and costs of being lessgreedy.
In a standard decision tree, each level of the recursion will find one decision boundary(e.g., X=3) that partitions the feature space into two regions (e.g., X > 3, X ≤ 3) so tomaximize the metric. Each region is then partitioned recursively using the same procedure.
In a point-based look-ahead decision tree, the feature space is partitioned into fourregions by a single point (e.g., X, Y = (3, 4) gives regions [X > 3, Y > 4], [X > 3, Y ≤4], [X ≤ 3, Y > 4], and [X ≤ 3, Y ≤ 4].
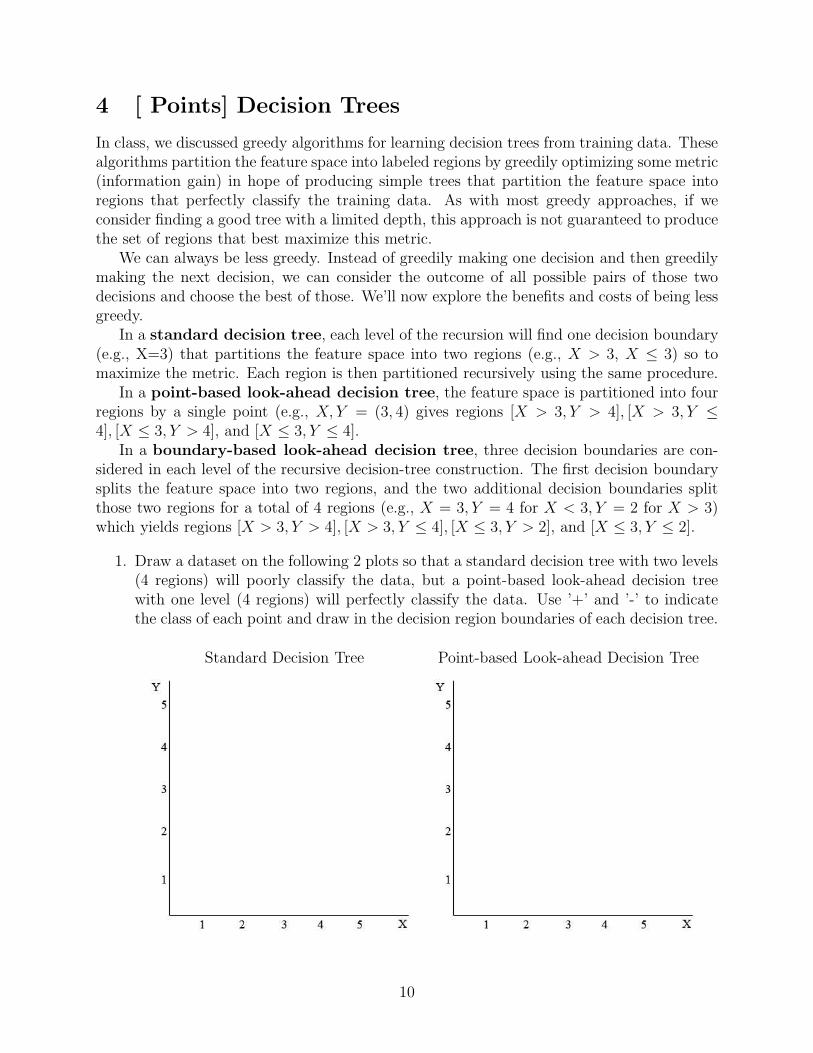
In a boundary-based look-ahead decision tree, three decision boundaries are con-sidered in each level of the recursive decision-tree construction. The first decision boundarysplits the feature space into two regions, and the two additional decision boundaries splitthose two regions for a total of 4 regions (e.g., X = 3, Y = 4 for X < 3, Y = 2 for X > 3)which yields regions [X > 3, Y > 4], [X > 3, Y ≤ 4], [X ≤ 3, Y > 2], and [X ≤ 3, Y ≤ 2].
1. Draw a dataset on the following 2 plots so that a standard decision tree with two levels(4 regions) will poorly classify the data, but a point-based look-ahead decision treewith one level (4 regions) will perfectly classify the data. Use ’+’ and ’-’ to indicatethe class of each point and draw in the decision region boundaries of each decision tree.
Standard Decision Tree Point-based Look-ahead Decision Tree
10
guestrin
Pencil
guestrin
Pencil
guestrin
Pencil
guestrin
Pencil
guestrin
Pencil
guestrin
Pencil
guestrin
Pencil
guestrin
Pencil
guestrin
Pencil
guestrin
Pencil
2. Now draw a dataset on the following 2 plots so that a point-based look-ahead decisiontree with one level (4 regions) will poorly classify the data, but a boundary-based look-ahead decision tree with one level (4 regions) will perfectly classify the data. Use ’+’and ’-’ to indicate the class of each point and draw in the decision region boundariesof each decision tree.
Point-based Look-ahead Decision Tree Boundary-based Look-ahead Decision Tree
3. Now provide the running time required for one level of the partitioning in the variousdecision tree variants. Assume there are D points in the training set all with uniqueX and Y values. Explain your reasoning.
Standard Decision Tree
Point-Based Look-ahead Decision Tree
Boundary-Based Look-ahead Decision Tree
11
guestrin
Pencil
guestrin
Pencil
guestrin
Pencil
guestrin
Pencil
guestrin
Pencil
guestrin
Pencil
guestrin
Pencil
guestrin
Pencil
guestrin
Pencil
guestrin
Pencil
guestrin
Pencil
guestrin
Pencil
guestrin
Pencil
guestrin
Pencil
guestrin
Pencil
guestrin
Pencil
5 Neural Networks
Recall the two types of Neural Network activation functions from Homework 2, the linearactivation function and the hard threshold:
• linear y = w0 +∑
i wixi,
• hard threshold
y =
{
1 if w0 +∑
i wixi ≥ 0,
0 otherwise.(1)
1. Which of the following functions can be exactly represented by a neural network withone hidden layer which uses linear and/or hard threshold activation functions? Foreach case, justify your answer.
(a) polynomials of degree one
(b) hinge loss (h(x) = max(1-x,0))
(c) polynomials of degree two
(d) piecewise constant functions
12
guestrin
Pencil
guestrin
Pencil
guestrin
Pencil
guestrin
Pencil
guestrin
Pencil
guestrin
Pencil
guestrin
Pencil
guestrin
Pencil
guestrin
Pencil
guestrin
Pencil
guestrin
Pencil
guestrin
Pencil
guestrin
Pencil
guestrin
Pencil
guestrin
Pencil
guestrin
Pencil
guestrin
Pencil
guestrin
Pencil
guestrin
Pencil
guestrin
Pencil
guestrin
Pencil
guestrin
Pencil
guestrin
Pencil
guestrin
Pencil
guestrin
Pencil
guestrin
Pencil
guestrin
Pencil
6 [ points] VC Dimentia
Given a hypothesis class H, the VC dimension, V C(H) is defined to be the size of thelargest set that is shattered by H. If H can shatter arbitrarily large sets, then we say thatV C(H) = ∞.
1. It is sometimes useful to think of VC dimension as being related to the number ofparameters needed to specify an element of H. For example, what is the VC dimensionof the set of hypotheses of the following form?
hα(x) =
{
1 if αdxd + αd−1x
d−1 + · · ·+ α0 > 00 otherwise
Justify your answer.
Hint: think polynomial basis functions
2. Despite the result from part (1), the VC dimension is not always so nicely relatedto the number of parameters. For any positive integer M , can you come up with ahypothesis class which takes M parameters but has VC dimension 1?
Hint: Think of how you might encode several parameters with just one parameter.
13
guestrin
Pencil
guestrin
Pencil
guestrin
Pencil
guestrin
Pencil
guestrin
Pencil
guestrin
Pencil
guestrin
Pencil
guestrin
Pencil
guestrin
Pencil
guestrin
Pencil
guestrin
Pencil
guestrin
Pencil
guestrin
Pencil
guestrin
Pencil
guestrin
Pencil
guestrin
Pencil
guestrin
Pencil
guestrin
Pencil
guestrin
Pencil
guestrin
Pencil
guestrin
Pencil
guestrin
Pencil
guestrin
Pencil
guestrin
Pencil
guestrin
Pencil
guestrin
Pencil
guestrin
Pencil
guestrin
Pencil
guestrin
Pencil
guestrin
Pencil
guestrin
Pencil
guestrin
Pencil
guestrin
Pencil
guestrin
Pencil
guestrin
Pencil
3. Consider the class of hypotheses of the form:
hα(x) =
{
1 if sin(αx) > 00 otherwise
You will show that this one-parameter hypothesis class has infinite VC dimension.
To do this, show that given the datapoints X = {xi = 10−i, i = 1, . . . , n}, any set oflabels yi ∈ {0, 1} can be realized by hα by setting
α =
(
1 +n∑
i=1
(1 − ti)10i
)
· π
For example, if n = 5 and yi = (1, 1, 1, 1, 0), then α = (100001)π.
Hint: On intervals of the form (mπ, (m + 1)π), the sine function takes positive valuesif m is even and negative values if m is odd.