13
13 February 2015 By: Andrew Stotz, CFA and Sornsak Kongcharoenpanich SAMPLE Profitable Growth analysis: 10 companies
| Date post: | 16-Jul-2015 |
| Category: |
Business |
| Upload: | andrew-stotz-cfa |
| View: | 259 times |
| Download: | 0 times |
13 February 2015By: Andrew Stotz, CFA and Sornsak Kongcharoenpanich
SAMPLE
Profitable Growth analysis: 10 companies

13 February 2015 2Source: A. Stotz Investment Research
A. Stotz Profitable Growth
'10 '11 '12 '13 '14
2 3 1 1 1
'10 '11 '12 '13 '14 '10 '11 '12 '13 '14
2 3 1 1 1 8 6 3 4 5
'10 '11 '12 '13 '14 '10 '11 '12 '13 '14 '10 '11 '12 '13 '14 '10 '11 '12 '13 '14
4 4 3 4 4 3 3 2 2 2 8 6 5 5 4 9 8 2 3 6
Profitable growth
Asset utilization Profit margin Sales growth Margin change
Profitability Growth
Profitable growth: growth with minimum asset useWhy: The way to be world class and sustainable in the long runRisk: One without the other is not enough
Profitability: ROA – generating the most profit out of your assetsWhy: Getting more out of assets means you need less capitalRisk: Only high returns, but no asset growth, is not sustainable
Growth: EPS growth – the market values it and so should youWhy: Grow earnings to grow firm valueRisk: Focus on short-term results is not a sustainable strategy
Profit margin: cost control to expand marginWhy: Internal improvement of efficiency and profitabilityRisk: Too tight cost control prevents growth
Sales growth: externally driven EPS growthWhy: Essential to grow your businessRisk: Growth without profit doesn’t win in the long run
Asset utilization: amount of revenue per unit of assetsWhy: Careful asset growth preserves capital Risk: Too tight asset policy prevents growth
Margin change: internally driven EPS growthWhy: Getting more profit from every saleRisk: Too high prices, or low costs could hurt sales growth
13 February 2015 3
Profitable Growth
'10 '11 '12 '13 '14
1
2 1
3 1 2
4 2 3 1
5 3 4 2
6 4 5 3 1
7 5 6 4 2
8 6 7 5 3
9 7 8 6 4
10 8 9 7 5
9 10 8 6
10 9 7
10 8
9
10
Source: A. Stotz Investment Research.
Note: 1 = top ranking and 10 = worst. Most recent year’s data is based on the last 12 months of published data.
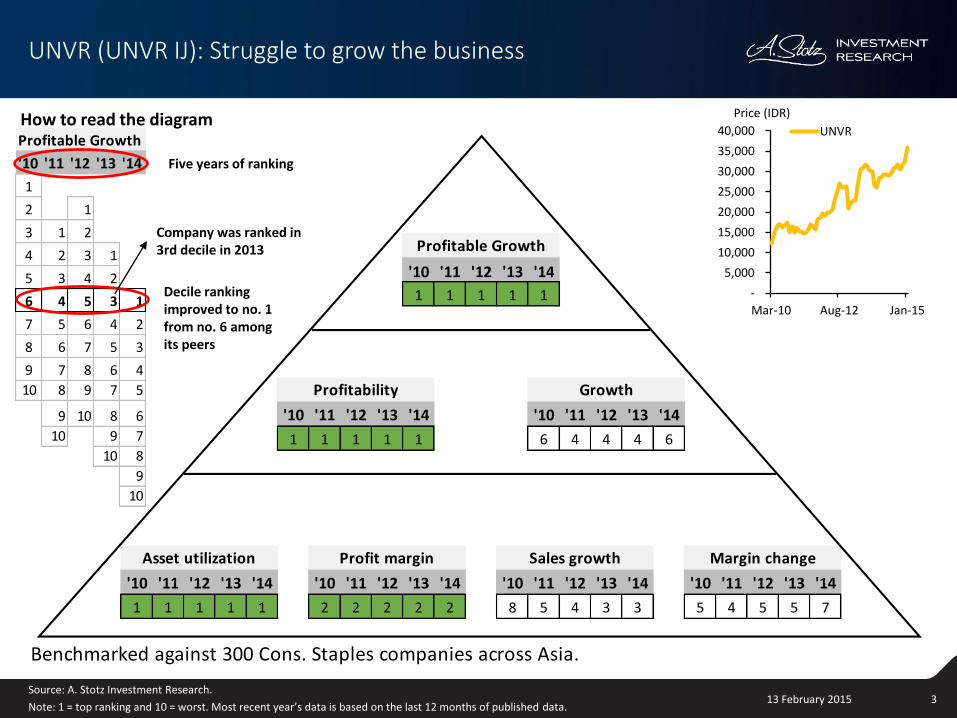
UNVR (UNVR IJ): Struggle to grow the business
'10 '11 '12 '13 '14
1 1 1 1 1
'10 '11 '12 '13 '14 '10 '11 '12 '13 '14
1 1 1 1 1 6 4 4 4 6
'10 '11 '12 '13 '14 '10 '11 '12 '13 '14 '10 '11 '12 '13 '14 '10 '11 '12 '13 '14
1 1 1 1 1 2 2 2 2 2 8 5 4 3 3 5 4 5 5 7
Benchmarked against 300 Cons. Staples companies across Asia.
Profitable Growth
Asset utilization Profit margin Sales growth Margin change
Profitability Growth
-
5,000
10,000
15,000
20,000
25,000
30,000
35,000
40,000
Mar-10 Aug-12 Jan-15
UNVR
Price (IDR)
Five years of ranking
Decile ranking improved to no. 1 from no. 6 among its peers
How to read the diagram
Company was ranked in 3rd decile in 2013
13 February 2015 4Source: A. Stotz Investment Research.
Note: 1 = top ranking and 10 = worst. Most recent year’s data is based on the last 12 months of published data.
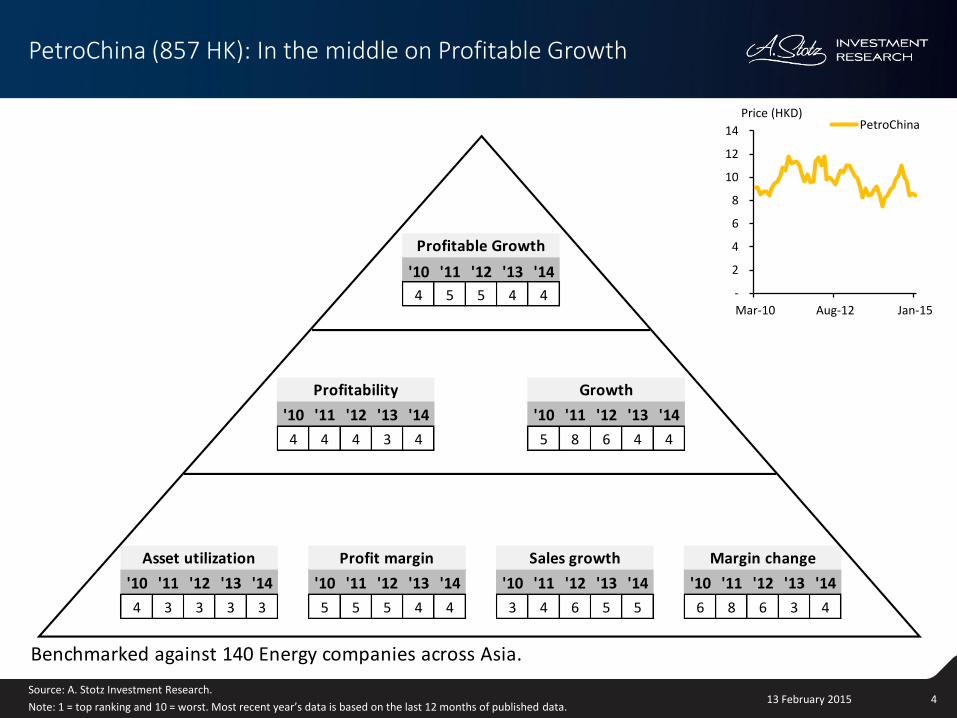
PetroChina (857 HK): In the middle on Profitable Growth
'10 '11 '12 '13 '14
4 5 5 4 4
'10 '11 '12 '13 '14 '10 '11 '12 '13 '14
4 4 4 3 4 5 8 6 4 4
'10 '11 '12 '13 '14 '10 '11 '12 '13 '14 '10 '11 '12 '13 '14 '10 '11 '12 '13 '14
4 3 3 3 3 5 5 5 4 4 3 4 6 5 5 6 8 6 3 4
Benchmarked against 140 Energy companies across Asia.
Profitable Growth
Asset utilization Profit margin Sales growth Margin change
Profitability Growth
-
2
4
6
8
10
12
14
Mar-10 Aug-12 Jan-15
PetroChinaPrice (HKD)

13 February 2015 5Source: A. Stotz Investment Research.
Note: 1 = top ranking and 10 = worst. Most recent year’s data is based on the last 12 months of published data.
MPPA (MPPA IJ): Continuous improvement on Profitable Growth
'10 '11 '12 '13 '14
1 9 5 4 3
'10 '11 '12 '13 '14 '10 '11 '12 '13 '14
8 9 7 4 3 9 9 1 2 4
'10 '11 '12 '13 '14 '10 '11 '12 '13 '14 '10 '11 '12 '13 '14 '10 '11 '12 '13 '14
6 6 3 1 1 8 9 8 7 6 10 8 2 5 3 6 7 3 3 4
Benchmarked against 730 Cons. Disc. companies across Asia.
Profitable Growth
Asset utilization Profit margin Sales growth Margin change
Profitability Growth
-
500
1,000
1,500
2,000
2,500
3,000
3,500
4,000
Mar-10 Aug-12 Jan-15
MPPAPrice (IDR)

13 February 2015 6
'10 '11 '12 '13 '14
10 10 10 1 1
'10 '11 '12 '13 '14 '10 '11 '12 '13 '14
10 10 10 1 1 6 9 3 1 1
'10 '11 '12 '13 '14 '10 '11 '12 '13 '14 '10 '11 '12 '13 '14 '10 '11 '12 '13 '14
10 10 9 6 6 10 10 10 1 1 7 8 7 1 1 3 10 1 1 1
Benchmarked against 770 Info Tech companies across Asia.
Profitable Growth
Asset utilization Profit margin Sales growth Margin change
Profitability Growth
Source: A. Stotz Investment Research.
Note: 1 = top ranking and 10 = worst. Most recent year’s data is based on the last 12 months of published data.
Inotera (3474 TT): Profitable Growth jumps to 1st from 10th decile
-
10
20
30
40
50
60
Mar-10 Aug-12 Jan-15
InoteraPrice (TWD)

13 February 2015 7Source: A. Stotz Investment Research.
Note: 1 = top ranking and 10 = worst. Most recent year’s data is based on the last 12 months of published data.
Medy (086900 KS): Profitability and growth are in sync
'10 '11 '12 '13 '14
1 1 1 1 1
'10 '11 '12 '13 '14 '10 '11 '12 '13 '14
1 1 1 1 1 6 7 2 7 1
'10 '11 '12 '13 '14 '10 '11 '12 '13 '14 '10 '11 '12 '13 '14 '10 '11 '12 '13 '14
7 8 6 6 6 1 1 1 1 1 4 8 1 7 1 8 9 3 9 1
Benchmarked against 280 Health Care companies across Asia.
Profitable Growth
Asset utilization Profit margin Sales growth Margin change
Profitability Growth
-
50,000
100,000
150,000
200,000
250,000
300,000
350,000
400,000
Mar-10 Aug-12 Jan-15
Medy
Price (KRW)

13 February 2015 8Source: A. Stotz Investment Research.
Note: 1 = top ranking and 10 = worst. Most recent year’s data is based on the last 12 months of published data.
SIA (SIA SP): Struggling to get Profitable Growth
'11 '12 '13 '14 '14
4 8 7 7 8
'11 '12 '13 '14 '14 '11 '12 '13 '14 '14
6 8 7 6 7 1 9 4 5 8
'11 '12 '13 '14 '14 '11 '12 '13 '14 '14 '11 '12 '13 '14 '14 '11 '12 '13 '14 '14
7 6 5 5 5 5 8 7 7 7 7 8 6 7 7 2 9 3 5 7
Benchmarked against 930 Industrials companies across Asia.
Profitable Growth
Asset utilization Profit margin Sales growth Margin change
Profitability Growth
-
2
4
6
8
10
12
14
16
18
Mar-10 Aug-12 Jan-15
SIA
Price (SGD)
13 February 2015 9Source: A. Stotz Investment Research.
Note: 1 = top ranking and 10 = worst. Most recent year’s data is based on the last 12 months of published data.
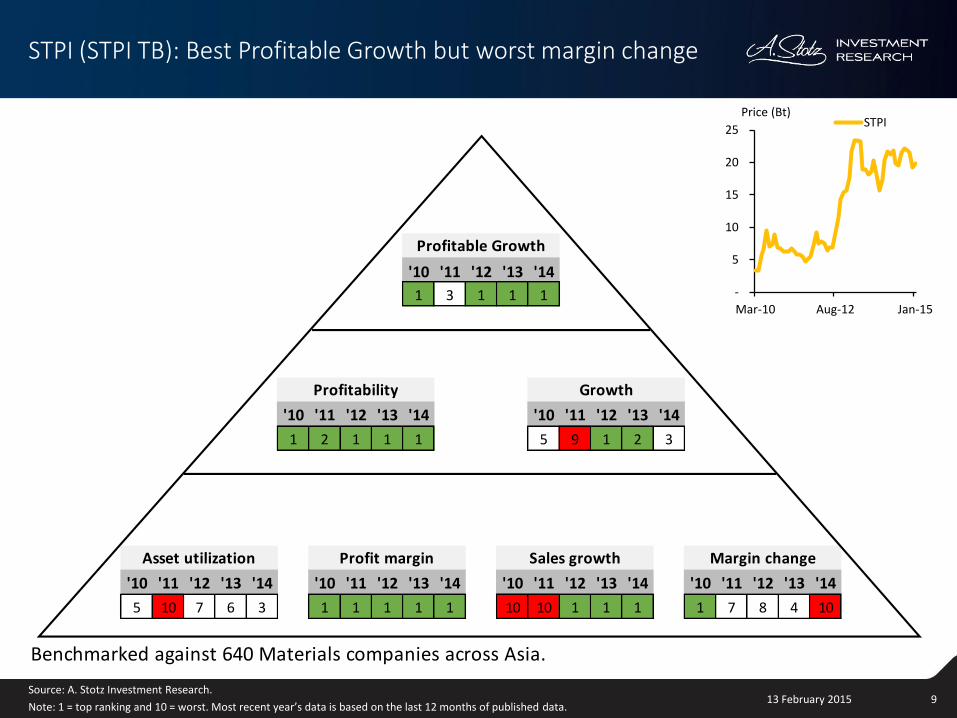
STPI (STPI TB): Best Profitable Growth but worst margin change
'10 '11 '12 '13 '14
1 3 1 1 1
'10 '11 '12 '13 '14 '10 '11 '12 '13 '14
1 2 1 1 1 5 9 1 2 3
'10 '11 '12 '13 '14 '10 '11 '12 '13 '14 '10 '11 '12 '13 '14 '10 '11 '12 '13 '14
5 10 7 6 3 1 1 1 1 1 10 10 1 1 1 1 7 8 4 10
Benchmarked against 640 Materials companies across Asia.
Profitable Growth
Asset utilization Profit margin Sales growth Margin change
Profitability Growth
-
5
10
15
20
25
Mar-10 Aug-12 Jan-15
STPIPrice (Bt)

13 February 2015 10Source: A. Stotz Investment Research.
Note: 1 = top ranking and 10 = worst. Most recent year’s data is based on the last 12 months of published data.
VLL (VLL PM): Room for improvement in growth
'10 '11 '12 '13 '14
5 4 3 3 3
'10 '11 '12 '13 '14 '10 '11 '12 '13 '14
5 4 3 3 3 6 5 4 5 4
'10 '11 '12 '13 '14 '10 '11 '12 '13 '14 '10 '11 '12 '13 '14 '10 '11 '12 '13 '14
5 4 4 4 4 4 5 4 4 4 6 5 5 5 4 6 6 4 6 5
Benchmarked against 360 Real Estate companies across Asia.
Profitable Growth
Asset utilization Profit margin Sales growth Margin change
Profitability Growth
-
1
2
3
4
5
6
7
8
Mar-10 Aug-12 Jan-15
VLLPrice (PHP)
13 February 2015 11Source: A. Stotz Investment Research.
Note: 1 = top ranking and 10 = worst. Most recent year’s data is based on the last 12 months of published data.
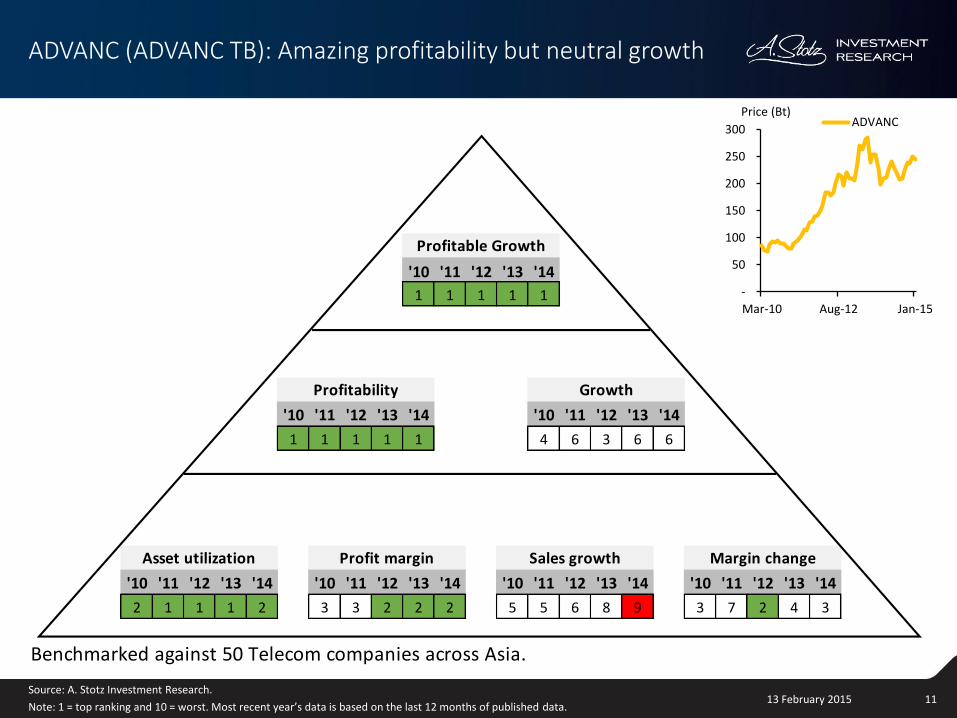
ADVANC (ADVANC TB): Amazing profitability but neutral growth
'10 '11 '12 '13 '14
1 1 1 1 1
'10 '11 '12 '13 '14 '10 '11 '12 '13 '14
1 1 1 1 1 4 6 3 6 6
'10 '11 '12 '13 '14 '10 '11 '12 '13 '14 '10 '11 '12 '13 '14 '10 '11 '12 '13 '14
2 1 1 1 2 3 3 2 2 2 5 5 6 8 9 3 7 2 4 3
Benchmarked against 50 Telecom companies across Asia.
Profitable Growth
Asset utilization Profit margin Sales growth Margin change
Profitability Growth
-
50
100
150
200
250
300
Mar-10 Aug-12 Jan-15
ADVANCPrice (Bt)
13 February 2015 12Source: A. Stotz Investment Research.
Note: 1 = top ranking and 10 = worst. Most recent year’s data is based on the last 12 months of published data.
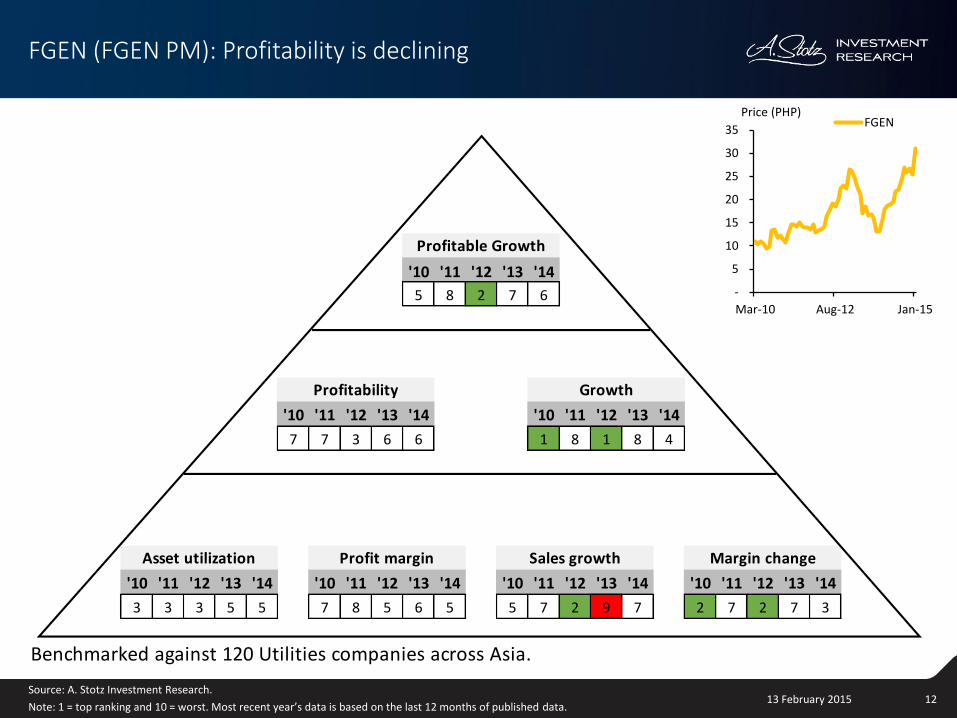
FGEN (FGEN PM): Profitability is declining
'10 '11 '12 '13 '14
5 8 2 7 6
'10 '11 '12 '13 '14 '10 '11 '12 '13 '14
7 7 3 6 6 1 8 1 8 4
'10 '11 '12 '13 '14 '10 '11 '12 '13 '14 '10 '11 '12 '13 '14 '10 '11 '12 '13 '14
3 3 3 5 5 7 8 5 6 5 5 7 2 9 7 2 7 2 7 3
Benchmarked against 120 Utilities companies across Asia.
Profitable Growth
Asset utilization Profit margin Sales growth Margin change
Profitability Growth
-
5
10
15
20
25
30
35
Mar-10 Aug-12 Jan-15
FGENPrice (PHP)

1313 February 2015
www.astotz.com
Click here to read the White Paper


