1.0 EXISTING SYSTEM ANALYSIS The EXISTING SYSTEM ANALYSIS began with public ratification of the study work plan, and the identification of transportation issues and public attitudes. Existing transportation system characteristics were then reviewed based on available information, plus new data obtained from three major surveys. Based on this input, a realistic view of existing transportation conditions in the WALTS area was developed. Stantec 1.1
Transcript
1.0 EXISTING SYSTEM ANALYSIS
The EXISTING SYSTEM ANALYSIS began with public ratification of the study work plan, and the identification of transportation issues and public attitudes. Existing transportation system characteristics were then reviewed based on available information, plus new data obtained from three major surveys. Based on this input, a realistic view of existing transportation conditions in the WALTS area was developed.
Stantec 1.1
1.1 STUDY DIRECTION
1.1.1 TRANSPORTATION STUDY PURPOSE
The purpose of the Windsor Area Long-Range Transportation Study (WALTS) is to formulate a Transportation Master Plan to guide the future development of transportation services in the Windsor area. This involves analyzing twenty-year growth and development trends in Windsor, plus LaSalle, Sandwich South, Tecumseh, St. Clair Beach and Maidstone Township. The Study will determine the impact that population, employment and land use growth will have on roads, transit, cycling and pedestrian facilities, along with access to air, marine, rail and trucking services. Associated with this is the need to manage travel demands in ways that reflect community objectives and respects the environment.
An associated purpose of the Study is to provide input into the City of Windsor new Official Plan, and background for other involved Official Plans. This is done in part by integrating the WALTS process with the City’s Official Plan Review (Vision in Action). Finally, the WALTS process must be conducted in response to the Province’s Environmental Assessment Process for Municipal Roads (see Section 1.1.3 below).
1.1.2 STRATEGIC TRANSPORTATION OBJECTIVE
The City’s primary objective for its transportation system was established as part of the City’s new Community Strategic Plan, conducted in 1996. In this Plan, one of the City’s key objectives under the theme of Sustainable Healthy Community is:
To provide transportation systems that enhance physical mobility and better serve the economic and social needs of the community
1.1.3 THE CLASS ENVIRONMENTAL ASSESSMENT PROCESS
WALTS follows the Class EA process in addressing transportation system needs from an overall network perspective. It is intended to satisfy Phases 1 and 2 of the existing Class EA Process For Municipal Roads in the following ways, as well as the new Municipal Class EA being reviewed by the Minister of the Environment:
Stantec 1.2
• Phase 1 identifies the problems or deficiencies associated with the Windsor area transportation systems, thereby establishing the “Need and Justification” for system improvements, and begins the public consultation process.
• Phase 2 identifies various alternative solutions available to solve the system problems and deficiencies, and establishes the preferred solutions taking into account public and agency input, along with evaluation criteria representing the economic, socio-cultural and natural environments.
The new Class EA recognizes the need in many cases to begin the infrastructure planning process by considering groups of related projects as part of an overall system, such as a transportation system, prior to dealing with specific projects. In this way, “the need and justification for individual projects and the associated broader context, are better defined”.
This master plan examines the overall Windsor area transportation system, and outlines a framework for planning of subsequent projects and/or developments. As such, WALTS addresses Phases 1 and 2 of the Municipal Class EA process. The WALTS planning process follows the Planning and Design process of the Class EA, and the key principles of successful environmental planning. Public and agency consultation began early in the process, and continued in a number of ways throughout the study. Transportation system problems were identified, and a range of potential alternative solutions were evaluated, leading to the selection of the preferred set of alternatives presented in the Section 4 Master Plan.
The EA Branch of the Ontario Ministry of Environment was officially notified of the WALTS study process in May of 1997 (see Technical Appendix 1), including an intention that this process will satisfy Phase 1 and 2 of the Class EA Process.
In identifying the individual projects making up this Master Plan, the applicable schedule for each project is also determined by the Plan. Based on the extensive and comprehensive scope of this Master Plan, and the full range of alternative considered, the Phases 1 and 2 requirements for each recommended project making up this Master Plan have been satisfied. This means that for Schedule B and C projects, Phases 1 and 2 need not be revisited. For Schedule C projects, the Class EA process is expected to continue at Phase 3. For Schedule B projects, consultation and documentation requirements must be fulfilled. In this way, according to the new Class EA, “the Master Plan would be used in support of further work carried out for
Stantec 1.3
specific Schedule B projects, and further work in Phases 3 and 4 for specific Schedule C projects.”
Another important feature of an infrastructure master plan is that it allows an integrated process with other planning initiatives, such as the new Windsor and area official plans prepared during and subsequent to WALTS. Also, because the Master Plan takes a system-wide approach to infrastructure planning, it provides the basis for planning of related improvements that become evident during the process. An example here would be the coordinated improvement of surface roadway and underground infrastructure together as part of a project-specific roadway improvement. In this way, WALTS recommendations can be used in association with, or to further substantiate, related infrastructure improvements.
1.1.4 ADVISORY COMMITTEE
The WALTS study was conducted under the direction of a Technical Advisory Committee made up of the following members:
Windsor Traffic Engineering:John Tofflemire Wesley Hicks, Chair Mike Palanaki Steve Bittner
Windsor Planning: Bob Hayes Doug Caruso Bruce Singbush
County of Essex: Stuart Kelch
Ministry of Transportation: Emilio Duran (to 1998) Justin Terry
Windsor Public Works: Tedd Szalay Mario Sonego Mark Winterton
Windsor Parks & Recreation: Faye Langmaid
Transit Windsor: Bob Goody
The Study consultant team was led by Stantec Consulting Ltd. (formerly IMC Consulting Group Inc.) of Kitchener, Ontario with Don Drackley as the Project Manager. In addition to this Technical Advisory Committee, organized public input to the study was provided at strategic points by a Transportation Task Force, established by the City of Windsor as part of their Vision In Action Official Plan update process. This Task Force included twelve community representatives from the business, community and environmental advocacy sectors, plus City Council and involved staff.
Stantec 1.4
1.2. SUMMARY OF TRANSPORTATION ISSUES
1.2.1 PUBLIC CONSULTATION
Since commencing the WALTS Study in April 1997, the consultant team spoke with a multitude of civic officials and local interests about the issues and challenges currently facing the Windsor area transportation systems. Organized public input on issues and expectations was provided from six main sources:
1. The Transportation Task Force, formed as part of the Official Plan Review process, provide input on issues;
2. Community comments on the state of the transportation system were gathered as part of the 1997 Household Travel Survey conducted as part of the WALTS Study;
3. Input was provided at an Introductory Public Meeting held on April 10, 1997, based on advertising in the Windsor Star (see Technical Appendix 1);
4. A WALTS study web page was set up by the City, providing an opportunity for community input (very limited use);
5. Significant public input on issues was provided at a large WALTS Planning Workshop held on July 24, 1997, and at a stakeholders meeting on July 20, 1998 on findings and preliminary conclusions (see Technical Appendix 1);
6. Three joint WALTS/Windsor Official Plan pubic open houses were conducted on February 9, 16 and 23, 1999 to discuss both draft reports (see Technical Appendix 1), and;
7. Ongoing public input was provided via citizen requests for information or submission of comments to either City Council, or the Traffic Engineering Department through to the WALTS consulting team.
1.2.2 PUBLIC ISSUES
No one overriding issue facing the area transportation systems was identified through the public consultation activities. Rather, the WALTS Study was faced with a number of individual issues that either remain chronically unresolved from the past,
Stantec 1.5
or have recently emerged. When combined, they reflect ongoing public concerns that must be addressed, where possible, in the WALTS Study. These issues, coming from either a technical or community perspective, are summarized as follows in no order of importance:
Technical Issues
• the chronic lack of a high-volume access roadway corridor linking the City Centre with points to the south;
• the functional obstructions caused by the area rail mainlines on east-west arterial corridors, and on the Dougall Avenue north-south corridor;
• extension of the Lauzon Parkway ultimately to Highway 401;
• traffic growth resulting from suburban community development, i.e. East Riverside, LaSalle (County urban interface), North Talbot/Cousineau;
• the need for and optimum location of a third river crossing;
• impact that an Ambassador Bridge widening would have on Huron Church Road traffic volumes, Level-Of-Service and abutting land use; and
• the relatively poor condition of many roadway surfaces and sub-standard roadway design characteristics (i.e. rural cross-sections on roadways from previous boundary restructuring);
Community Issues
• the ability of “sensitive” roadways, such as Riverside Drive East and West, to accommodate growing traffic volumes without changing their streetscape character and impacting on adjacent land use;
• the financial ability of the City and area to maintain an expanded roadway system (i.e. E.C. Row Expressway), and improve/expand roadway capacity where required;
• the economic and other impacts of a third river crossing on affected lands, the Ambassador Bridge and the Detroit/Windsor Tunnel;
• impact of Truck Routes;
• waterfront access and uses;
• determining a realistic role for public transit in the Windsor area, establishing associated performance targets and providing the necessary capital and operation funding to support these objectives in light of provincial subsidy elimination;
Stantec 1.6
• implementing City of Windsor, County of Essex, Town of LaSalle and Township of Sandwich South bicycle system and sidewalks plans in terms of appropriate routes, required capital funding and associated community support; and
• the impact of motorized traffic growth on the environmental quality of the Windsor area.
Cross Border Issues
• large and growing costs resulting from cross-border infrastructure and institutional deficiencies that impact bilateral trade and travel;
• problems will continue to escalate as trade and traffic volumes continue to grow;
• major border-crossing infrastructure deficiencies due to combination of high volume and urban location, leading to unacceptable levels of congestion and delay;
• there is as yet no satisfactory definition of international trade corridors on which to base cross-border infrastructure decision making, and
• difficulties defining trade corridors on a transportation and economic basis because available data is not intended for that purpose.
Stantec 1.7
1.3 EXISTING TRANSPORTATION SYSTEMS
1.3.1 PREVIOUS TRANSPORTATION STUDIES
The last major update to the planning of transportation systems in Windsor was the Windsor Urban Transportation Study (WUTS) in 1980. This study recommended the following additions to the major road network:
• E.C. Row Expressway from Highway 18 to Highway 2;
• Lauzon Parkway between existing Lauzon Road and County Road 42;
• Downtown Arterial between Riverside Drive and Dougall/Ouellette Avenue;
• Reconstruction and widening of several major roads such as Huron Church Road, Howard Avenue and Walker Road;
• Create a “Scenic Parkway” along Riverside Drive and leave nearby Wyandotte Street as a major arterial; and
• Extensions to several major roadways such as Wyandotte Street, Cabana Street and Banwell Road.
WUTS Studies (1980, 1987)
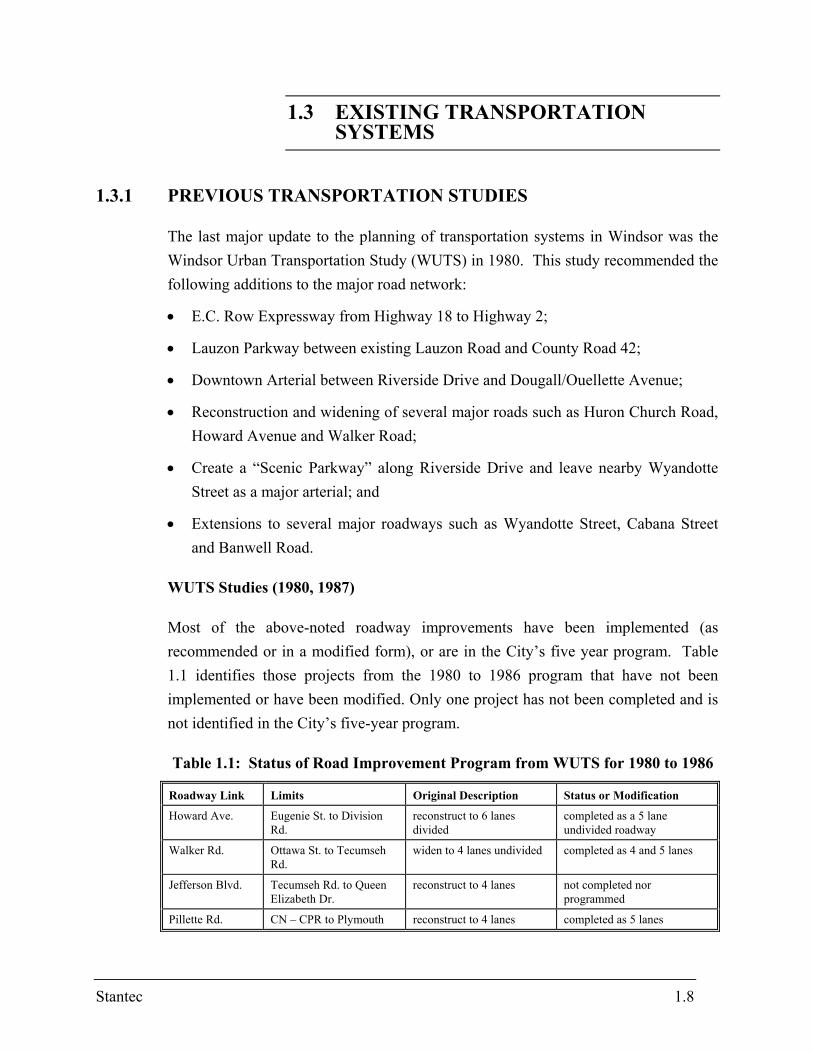
Most of the above-noted roadway improvements have been implemented (as recommended or in a modified form), or are in the City’s five year program. Table 1.1 identifies those projects from the 1980 to 1986 program that have not been implemented or have been modified. Only one project has not been completed and is not identified in the City’s five-year program.
Table 1.1: Status of Road Improvement Program from WUTS for 1980 to 1986
Roadway Link Limits Original Description Status or Modification
Howard Ave. Eugenie St. to Division Rd.
reconstruct to 6 lanes divided
completed as a 5 lane undivided roadway
Walker Rd. Ottawa St. to Tecumseh Rd.
widen to 4 lanes undivided completed as 4 and 5 lanes
Jefferson Blvd. Tecumseh Rd. to Queen Elizabeth Dr.
reconstruct to 4 lanes not completed nor programmed
Pillette Rd. CN – CPR to Plymouth reconstruct to 4 lanes completed as 5 lanes
Stantec 1.8
Similarly, a number of the longer term improvements have been implemented. The following table identifies those recommendations that have been modified or not included in the current plans for the City.
Table 1.2: Status of Road Improvements from WUTS II for 1987 to Target Year
Roadway Link Limits Original Description of Improvement
Status or Modification
Campbell Ave. Wyandotte to Totten St. Prohibit parking during peak hours and widen to 4 lanes
not completed or programmed
Dominion Blvd. Totten St. to Northwood St. Construct new four lane roadway
not completed or programmed; looking at new alignment
Howard Ave. Cataraqui St. to Hanna Prohibit parking during peak hours, widen to five lanes with median
not completed or programmed
Foch Ave. to Eugenie St. reconstruct to 4 lanes undivided
completed as 5 lane undivided from Memorial to E C Row (1997)
Wyandotte St. Riverdale Ave. to Manning Rd.
construct new 2 lane road not completed or programmed
Giles Blvd. Downtown Arterial to Walker Rd.
upgrade to continuous road not completed or programmed
Dougall Ave. West Grand to South of Norfolk
widen to 6 lanes divided completed as 5 lanes undivided
Walker Rd. Division to Provincial Rd. widen to 4 lanes undivided ESR in place for 5 lane undivided
Pillette Rd. Wyandotte St. to South National Rd.
widen for separate turn lanes
not completed or programmed
Sprucewood Ave Malden Rd. to Todd Lane construct new 2 lane road not completed but identified in LaSalle Secondary Plan
Essex County Road 42
Boundary to Lauzon widen to 4 lanes not completed (not programmed by County )
In addition to the improvements that were implemented from this earlier study, the City carried out improvements to two other corridors, namely:
• channelization of Central Avenue from E.C. Row Expressway to Grand Marais Road East at signalized intersection; and
• widening Lauzon Road from two to four lanes between the Little River Boulevard and Tecumseh Road.
Stantec 1.9
Central Corridor Transportation Study
Following the WUTS studies, the City of Windsor examined the downtown area in more detail to determine the need for improvements based on changes in land use. The City of Windsor Central Corridor Transportation Study (1988) identified improvements in the Huron Church and Walker Road corridors. The following summarizes the Study’s major recommendations:
Dougall Avenue Corridor - was presented as a Downtown Arterial Corridor modified to terminate at Giles Boulevard which would function as the east-west distributor. In addition, the extension of Edinborough Street west to Dougall Avenue was recommended. Development of the various options for the Downtown Arterial Corridor was, and still is dependent on the consolidation of the St. Lawrence and Hudson (previously CP rail) mainline with the CASO line, along with possible removal of the Essex Terminal Railway line in this area, thereby eliminating rail crossings across the Corridor. The current status of such relocations or consolidations is dealt with in Section 3.6 of the Report. It is clear that any further downtown corridor planning should not assume that the necessary rail changes will in fact happen.
Howard Avenue Corridor - called for the widening of Howard Avenue to 5 lanes from Grand Marais to Eugenie (done), widen McDougall Street to 4 lanes from Howard to Tecumseh (in current five year plan), and widen McDougall Street and Windsor Avenue to three lanes and operate as a one-way pair as far north as Wyandotte Street East. It was felt that these changes could be made independent of any rail system changes.
Walker Road - would be widened to four lanes from Ottawa Street to Riverside Drive East (not programmed).
Dominion/Cameron Corridor - would connect Dominion Blvd. To Cameron Blvd. And a realigned Tecumseh Road by means of extending through the rail yards. Ultimately Cameron Blvd. Would extend through to Wyandotte Street. Once again, this would require relocation of the CASO rail yard west of Crawford Avenue.
Stantec 1.10
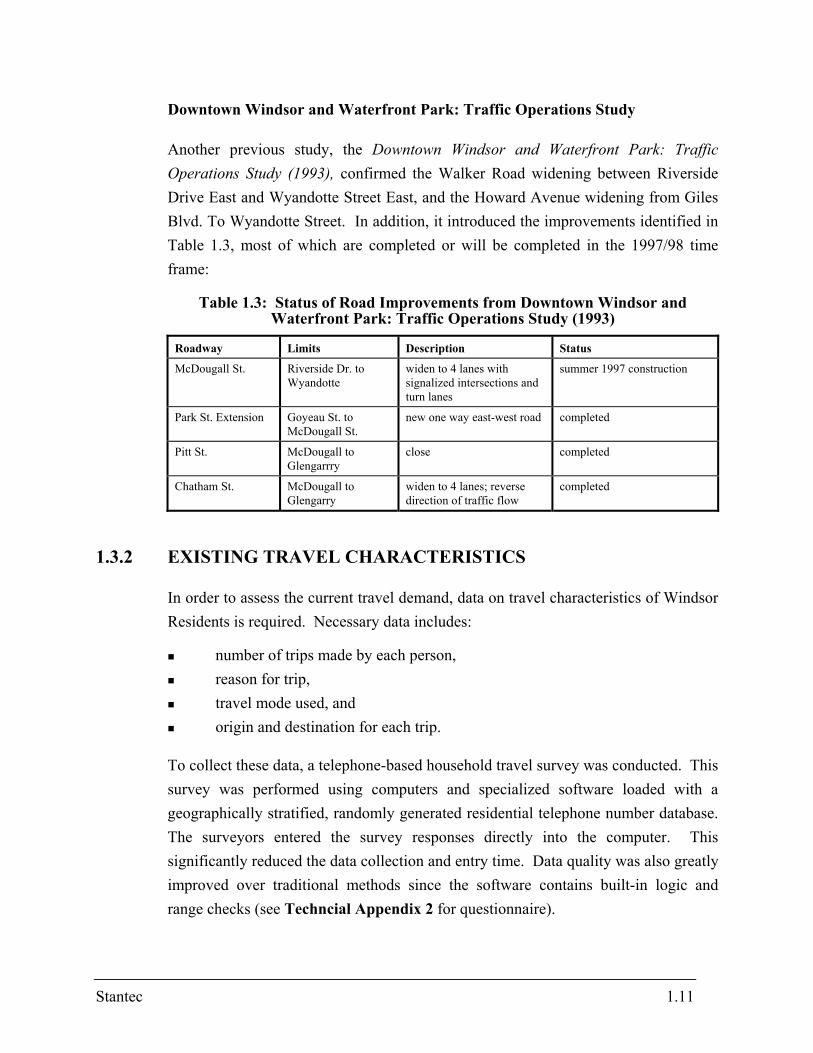
Downtown Windsor and Waterfront Park: Traffic Operations Study
Another previous study, the Downtown Windsor and Waterfront Park: Traffic Operations Study (1993), confirmed the Walker Road widening between Riverside Drive East and Wyandotte Street East, and the Howard Avenue widening from Giles Blvd. To Wyandotte Street. In addition, it introduced the improvements identified in Table 1.3, most of which are completed or will be completed in the 1997/98 time frame:
Table 1.3: Status of Road Improvements from Downtown Windsor and Waterfront Park: Traffic Operations Study (1993)
Roadway Limits Description Status
McDougall St. Riverside Dr. to Wyandotte
widen to 4 lanes with signalized intersections and turn lanes
summer 1997 construction
Park St. Extension Goyeau St. to McDougall St.
new one way east-west road completed
Pitt St. McDougall to Glengarrry
close completed
Chatham St. McDougall to Glengarry
widen to 4 lanes; reverse direction of traffic flow
completed
1.3.2 EXISTING TRAVEL CHARACTERISTICS
In order to assess the current travel demand, data on travel characteristics of Windsor Residents is required. Necessary data includes:
number of trips made by each person, reason for trip, travel mode used, and origin and destination for each trip.
To collect these data, a telephone-based household travel survey was conducted. This survey was performed using computers and specialized software loaded with a geographically stratified, randomly generated residential telephone number database. The surveyors entered the survey responses directly into the computer. This significantly reduced the data collection and entry time. Data quality was also greatly improved over traditional methods since the software contains built-in logic and range checks (see Techncial Appendix 2 for questionnaire).
Stantec 1.11
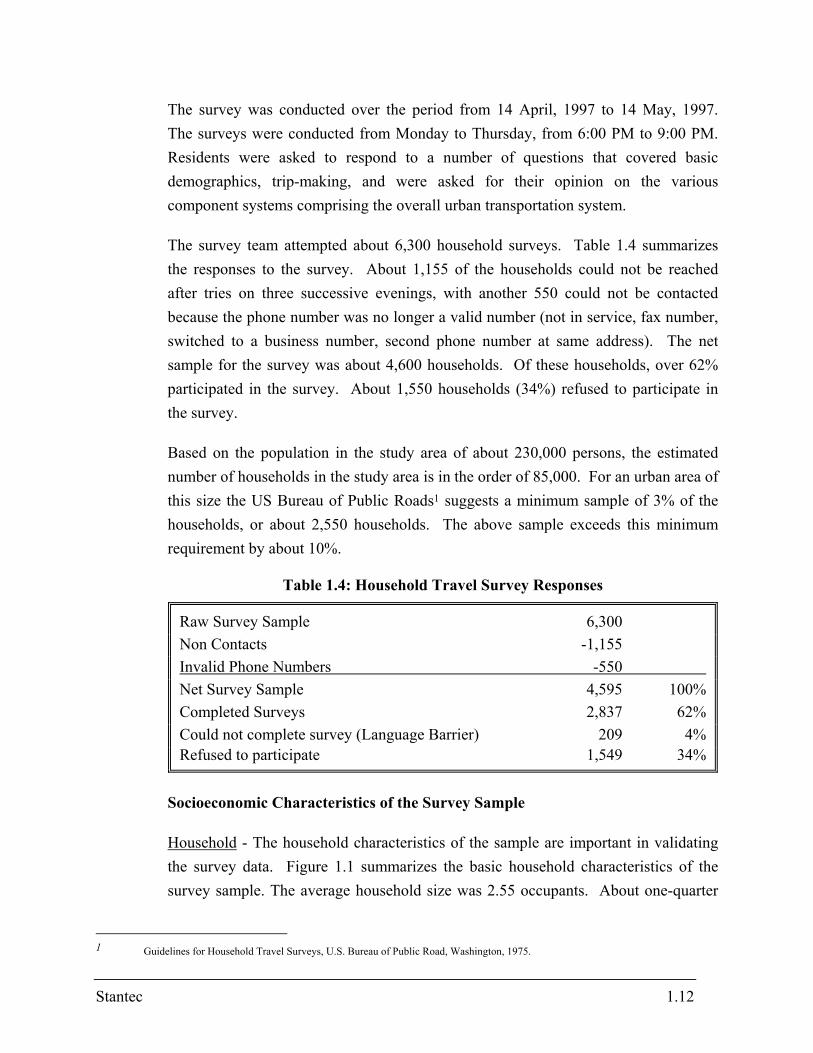
The survey was conducted over the period from 14 April, 1997 to 14 May, 1997. The surveys were conducted from Monday to Thursday, from 6:00 PM to 9:00 PM. Residents were asked to respond to a number of questions that covered basic demographics, trip-making, and were asked for their opinion on the various component systems comprising the overall urban transportation system.
The survey team attempted about 6,300 household surveys. Table 1.4 summarizes the responses to the survey. About 1,155 of the households could not be reached after tries on three successive evenings, with another 550 could not be contacted because the phone number was no longer a valid number (not in service, fax number, switched to a business number, second phone number at same address). The net sample for the survey was about 4,600 households. Of these households, over 62% participated in the survey. About 1,550 households (34%) refused to participate in the survey.
Based on the population in the study area of about 230,000 persons, the estimated number of households in the study area is in the order of 85,000. For an urban area of this size the US Bureau of Public Roads1 suggests a minimum sample of 3% of the households, or about 2,550 households. The above sample exceeds this minimum requirement by about 10%.
Table 1.4: Household Travel Survey Responses
Raw Survey Sample 6,300 Non Contacts -1,155 Invalid Phone Numbers -550 Net Survey Sample 4,595 100% Completed Surveys 2,837 62% Could not complete survey (Language Barrier) 209 4% Refused to participate 1,549 34%
Socioeconomic Characteristics of the Survey Sample
Household - The household characteristics of the sample are important in validating the survey data. Figure 1.1 summarizes the basic household characteristics of the survey sample. The average household size was 2.55 occupants. About one-quarter
1 Guidelines for Household Travel Surveys, U.S. Bureau of Public Road, Washington, 1975.
Stantec 1.12
of the homes surveyed has a single occupant, with about one-third having two residents and fewer than 10% having 5 or more people.
Most of the households responding to the survey were single family dwellings (75%). About 17% of the survey sample came from apartment-dwellers, while the remaining 8% were from duplex, semi-detached, townhouse, or mobile homes.
Household Size
125%
233%
316%
416%
5 and Over10%
Household Type
Apartme17%
Duplex/Sem3%
Single Family75%
Other2%Townhouse
3%
Figure 1.1: Household Characteristics of Survey Sample
Population and Employment - Figure 1.2 illustrates the cohort distribution within the survey sample. About 53% of the sample were female, about 30% were in the 25-45 age group, while about 14% were seniors. Figure 1.2 also illustrates the distribution of employment status for the survey sample. Full-time workers accounted for about 35% of respondents, while retired persons accounted for about 20%.
Population Distribution
20%
14%
13%
16%
12%
8%
16%
17%
17%
16%
16%
13%
7%
13%
0% 5% 10% 15% 20% 25%
0-15
16-25
26-35
36-45
46-55
56-65
Over 65
Female
Male
Employment Distribution
35%
23%
6%
3%
20%
2%
6%
5%
0% 5% 10% 15% 20% 25% 30% 35% 40%
Full-Time
Student
Homemaker
Unemployed
Retired
Self-Employed
Part-Time
Other
Figure 1.2: Population and Employment Characteristics of Survey Sample
Stantec 1.13
Travel Characteristics of Survey Sample
The amount of traffic on a the transportation system is directly related to a number of key factors including:
vehicle availability,
time of day,
the number of trips made per person, and
mode choice (i.e. car vs. transit, walk, and bike).
Vehicle Availability - Private vehicle availability is a measure of the likelihood of a household producing automobile trips. Figure 1.3 compares the distribution of bicycles and private vehicles of Windsor households.
Figure 1.3 illustrates that over half of the households in Windsor do not have any bicycles, while only 14% do not own an automobile. The average number of private vehicles per household was about 1.4 while on average each household had 1 bicycle. Interestingly, of the households reporting owning at least one car, or at least 1 bicycle, the average number of private vehicle was about 1.6 while the number of bicycles per household jumped to 2.2.
Bicycle Ownership
None53%
115%
216%
37% 4 and O
9%
Vehicle Ownership
None14%
142%
234%
37% 4 and Over
3%
Figure 1.3: Comparison of Private Vehicle and Bicycle Ownership in Windsor
Stantec 1.14
Temporal Distribution
Over the course of a day, the variation in automobile traffic generally follows a curve much like the one shown in Figure 1.4. There are generally two peak periods of travel during the day. These are traditionally associated with travel to and from home and places of employment. Therefore peaking about the traditional “9 to 5” jobs is expected. The morning peak period is generally 70-80% of the afternoon peak period and about half the duration. This varies by municipality.
Figure 1.4 :Typical Temporal Distribution of Traffic
For Windsor, temporal data have been collected at a number of sites across the City. The peak periods vary by location, as they may be influenced by the type of land uses in the area. Based on these observations the peak period for travel in Windsor appears to be between 3:30 PM and 6:30 PM. This is supported by observations in the household travel survey, which showed that automobile travel is highest between 3:00 PM and 4:00 PM.
Trip Rates - The individual number of trips per person varies by time of day. Since population remains constant, the trip rate function follows the temporal distribution of trips noted above. Preliminary results from the household travel survey show that for the PM peak period (3:00 PM to 4:00 PM) the person trips per person was observed to be about 0.38. This compares favourably to similar data collected for example in
Stantec 1.15
Brantford (0.33) and St. Thomas (0.34). ITE trip rates (0.50) are generally much higher than those observed in travel surveys.
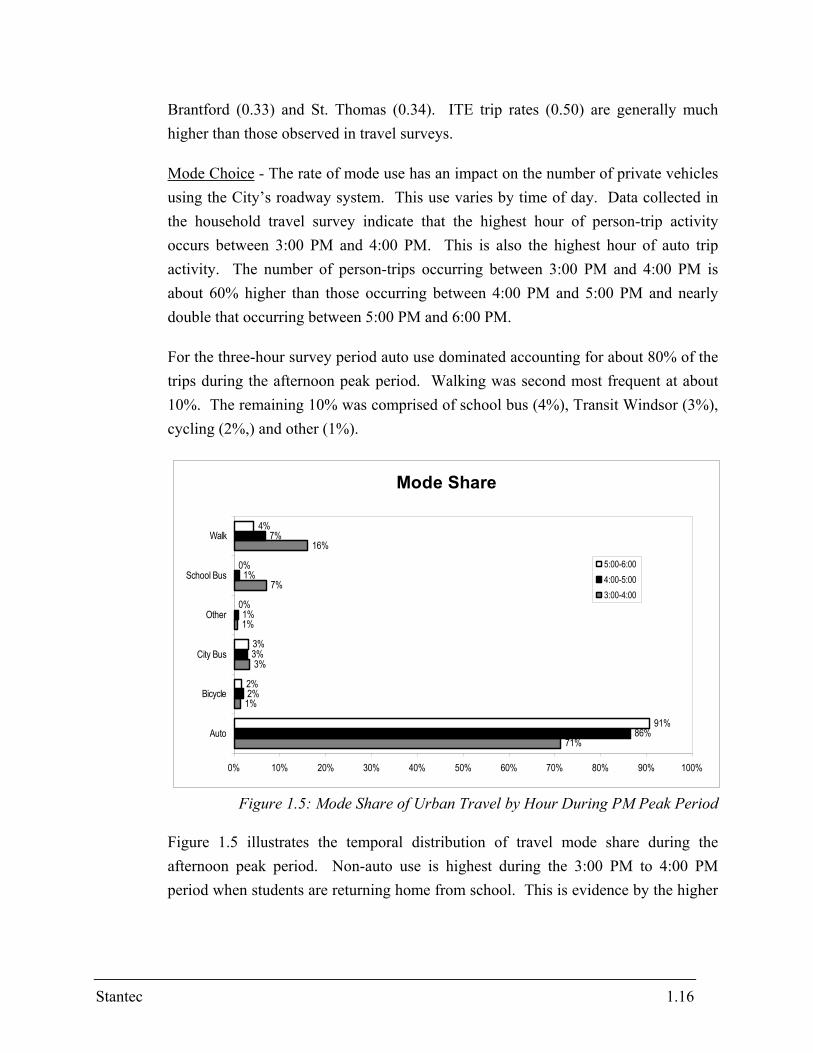
Mode Choice - The rate of mode use has an impact on the number of private vehicles using the City’s roadway system. This use varies by time of day. Data collected in the household travel survey indicate that the highest hour of person-trip activity occurs between 3:00 PM and 4:00 PM. This is also the highest hour of auto trip activity. The number of person-trips occurring between 3:00 PM and 4:00 PM is about 60% higher than those occurring between 4:00 PM and 5:00 PM and nearly double that occurring between 5:00 PM and 6:00 PM.
For the three-hour survey period auto use dominated accounting for about 80% of the trips during the afternoon peak period. Walking was second most frequent at about 10%. The remaining 10% was comprised of school bus (4%), Transit Windsor (3%), cycling (2%,) and other (1%).
Mode Share
71%
1%
3%
1%
7%
16%
86%
2%
3%
1%
1%
7%
91%
2%
3%
0%
0%
4%
0% 10% 20% 30% 40% 50% 60% 70% 80% 90% 100%
Auto
Bicycle
City Bus
Other
School Bus
Walk
5:00-6:004:00-5:003:00-4:00
Figure 1.5: Mode Share of Urban Travel by Hour During PM Peak Period
Figure 1.5 illustrates the temporal distribution of travel mode share during the afternoon peak period. Non-auto use is highest during the 3:00 PM to 4:00 PM period when students are returning home from school. This is evidence by the higher
Stantec 1.16
proportions of walking and school bus trips during that hour. Travel on the urban transit system remains constant at about 3% of all person-trips during each of the hours.
Public Opinion
As part of the household survey, opinions were solicited. Respondents were asked their degree of satisfaction with five key components of the urban transportation system (NOTE: “City” Residents” refers to City of Windsor, “Non-City” refers to County of Essex):
• the physical condition of the roadways,
• the bicycle system (on-road and off-road, Ganatcho Trail etc.),
• the pedestrian system,
• traffic conditions, and
• the transit system.
City Residents
64%
20%
16%
33%
12%
35%
75%
79%
66%
85%
1%
4%
5%
1%
3%
0% 10% 20% 30% 40% 50% 60% 70% 80% 90%
Roads
Bicycle
Pedestrian
Traffic
Transit
Very Satisfied
Satisfied
Not Satisfied
Non-City Residents
63%
37%
39%
50%
30%
34%
55%
58%
47%
69%
3%
8%
3%
3%
2%
0% 10% 20% 30% 40% 50% 60% 70% 80%
Roads
Bicycle
Pedestrian
Traffic
Transit
Very Satisfied
Satisfied
Not Satisfied
Figure 1.6: System Satisfaction Levels
The two graphics in Figure 1.6 illustrate the responses to the opinion survey, differentiating between City and Non-City residents. Generally the Non-City residents expressed more dissatisfaction. City residents were generally satisfied the transit, pedestrian, and cycling systems. About one-third of the City residents expressed concern over traffic conditions, while nearly two-thirds registered complaints with regard to the condition of the roadway system. Non-City residents
Stantec 1.17
also expressed concern over the conditions of the roadway system. Many complaints were also focused on the lack of pedestrian and cycling trails.
1.3.3 MAJOR ROADWAY NETWORK
This section of the Report describes the existing major roadway system within the study area. Traffic flows along the road system are described, including the growth pattern and the improvements that have been identified in the City’s planning documents and various other studies. This is based on information provided by the City of Windsor, area municipalities and the Province of Ontario, including the following reports used as resources:
Environmental Assessment Reports
• Tecumseh Road West: Subway Structures at Wellington Ave, 1994.
• Tecumseh Road West Corridor Master Plan (1995).
• Walker Road Improvements: Division Road to Highway 3 (1994).
• Dougall Avenue Improvements: West Grand Boulevard to Roseland Drive (1990).
• Riverside Drive East: St. Rose to Strabane Ave (1996).
• Tecumseh Road East: Jefferson Blvd. To Banwell Road (1996).
• McDougall Avenue: Riverside East to Wyandotte Street Extension (1997)
Traffic Operational Reports
• Downtown Windsor and Waterfront Park Traffic Operations Study (1993).
• E.C. Row Expressway: Traffic Evaluation and Planning Study (1993).
• Central Corridor Transportation Study (1988).
Area Planning Studies
• Windsor Urban Transportation Study: Report on Phase II (1988).
• Windsor City Centre Infrastructure Master Plan (1996).
Road Needs Studies
• Township of Sandwich South and Essex County Road Needs Studies.
Stantec 1.18
Other Reports
• Trade and Traffic Across the Eastern US-Canada Border (1997), An Assessment Prepared for the Eastern Border Transportation Coalition and Member Agencies (Parsons Brinckerhoff Quade & Douglas, Inc., May 2, 1997).
• Windsor City Centre: Infrastructure Master Plan (1996).
Official Plans • City of Windsor. • Town of LaSalle. • Township of Maidstone. • Village of St. Clair Beach. • Town of Tecumseh. • Township of Sandwich South.
Roadway Inventory
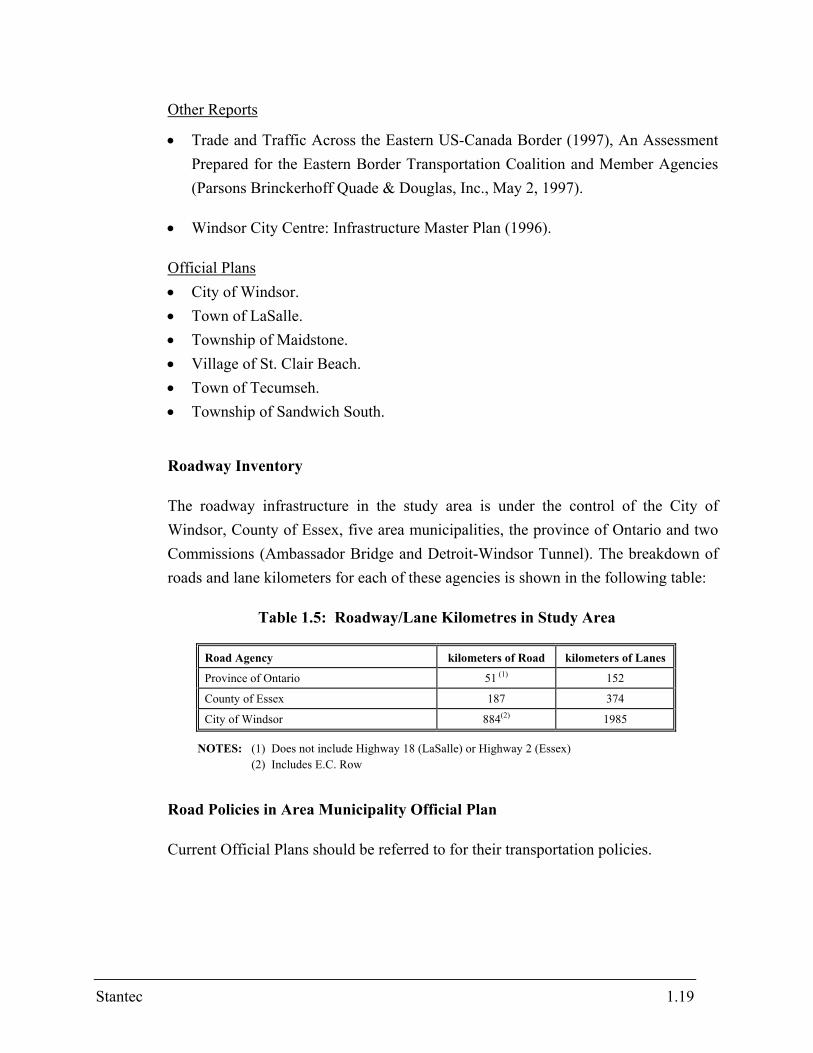
The roadway infrastructure in the study area is under the control of the City of Windsor, County of Essex, five area municipalities, the province of Ontario and two Commissions (Ambassador Bridge and Detroit-Windsor Tunnel). The breakdown of roads and lane kilometers for each of these agencies is shown in the following table:
Table 1.5: Roadway/Lane Kilometres in Study Area
Road Agency kilometers of Road kilometers of Lanes
Province of Ontario 51 (1) 152
County of Essex 187 374
City of Windsor 884(2) 1985
NOTES: (1) Does not include Highway 18 (LaSalle) or Highway 2 (Essex) (2) Includes E.C. Row
Road Policies in Area Municipality Official Plan
Current Official Plans should be referred to for their transportation policies.
Stantec 1.19
Traffic Flows
Daily traffic volumes on the major roadways in the study area were obtained from the City of Windsor, County of Essex and MTO. The information provided was limited as not all agencies had current and historical data for all roadways. The following is a summary of the traffic data provided by each agency:
• City of Windsor: Annual Average Daily Traffic various years from 1984 to 1996
• County of Essex: Annual Average Daily Traffic 1983, 1988, 1993
• MTO: Annual Average Daily traffic 1990 to 1994
Where information for a particular year was unavailable, the value was interpolated or extrapolated using linear trends.
Cross-Border Traffic - Information on border crossing was derived from information in the report Trade and Traffic Across the Eastern US-Canada Border prepared by Parsons Brinckerhoff Quade and Douglas, Inc., May 2, 1997. This document provides information on the annual volume of cars and trucks crossing the Ambassador Bridge and Detroit-Windsor tunnel in 1995, and the aggregated volume across all Michigan border crossings (including Sarnia and Sault Ste. Marie) for the year 1984, 1992, 1993, 1994, and 1995. The following conclusions are presented in the report regarding cross-border traffic flows:
Annual Traffic Crossing into United States in 1995 (one-way):
• 4.7 into United States at the Ambassador Bridge (including 1.1 million trucks)
• Ambassador Bridge is busiest crossing in Canada and ranks fifth in North America
• 4.3 million into United States at the Windsor Tunnel (including 0.1 million trucks)
• Detroit-Windsor Tunnel is second busiest crossing in Canada and ranks seventh in North America.
Stantec 1.20
Two-Way Volume for all Michigan Border Crossings in 1995:
• 22.7 million two way movements for all Michigan crossings (including 3.8 million trucks)
• 47% of all Canada-US crossings in 1995 occur at the Ontario/Michigan Border
• two-thirds of crossings to/from Michigan occur through Windsor
• annual bi-directional traffic has increased 67% between 1988 and 1995
• annual bi-directional traffic has increased 5% between 1992 and 1995.
Based on this information, it is estimated that the 1995 daily traffic at the Windsor border crossings was 23,600 through the Tunnel and 25,800 across the Bridge.
Growth in Daily Traffic - The change in daily Windsor traffic was examined for the period between 1990 and 1996. The Study area boundary and western Windsor were chosen for this comparison as shown in Figure 1.7. Table 1.6 shows the daily traffic at these cordon locations from 1990 to 1996. The greatest traffic increase occurs at the west end of the study area’s southern boundary with a 9% annual growth rate in traffic volumes. The south end of the eastern boundary (includes Highway 401) experienced a 5% annual growth in this time period.
At the western Windsor cordon, the traffic volumes are much higher than at the boundary cordon, however the growth in traffic is not as great. The west end of the south City boundary grows at about 5% per annum, while growth in the south-central area is at 3.6% per annum. The growth is slowest across the Walker Screenline where it is 2.6% in the south and unchanged in the north.
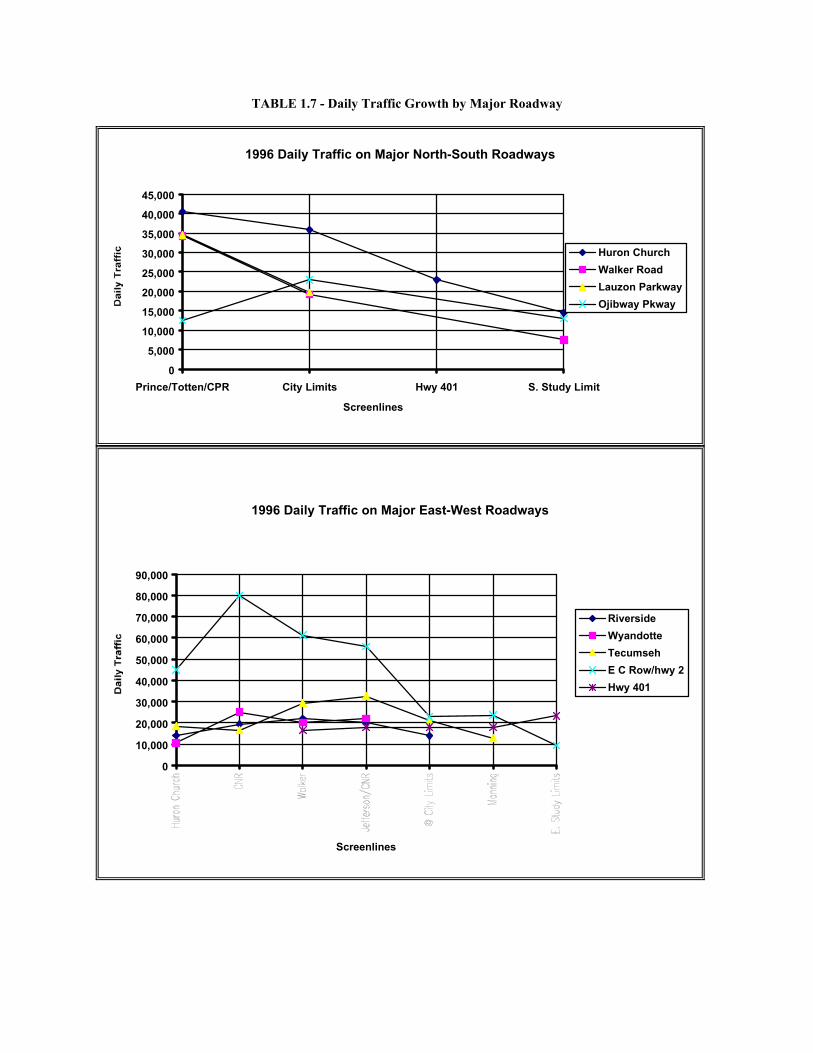
The 1996 daily traffic flows on the major north south and east-west corridors in the study area are shown on Table 1.7. This represents the corridors with the highest flows at the screenlines. The daily traffic on the north-south roadways generally decreases farther from the City Centre. It is clear that Huron Church Road and Lauzon Parkway have the highest traffic flows for this group of corridors.
In examining the east-west roadways it is noted that E.C. Row Expressway carries the greatest amount of traffic within the City limits, decreasing towards the eastern boundary. Tecumseh Road carries the next greatest amount of traffic east of Walker Road, while Riverside Drive and Wyandotte Street carry more traffic west of Walker
Stantec 1.21
TABLE 1.6 - Daily Traffic Growth
Daily Traffic at Study Area Boundary
0
5,000
10,000
15,000
20,000
25,000
30,000
35,000
40,000
1990 1991 1992 1993 1994 1995 1996
Dai
ly T
raffi
c South eastSouth centralSouth westEast northEast south
Daily Traffic in Western Windsor
0
20,000
40,000
60,000
80,000
100,000
120,000
1990 1991 1992 1993 1994 1995 1996
Dai
ly tr
affic
South westSouth centralWalker northWalker south
TABLE 1.7 - Daily Traffic Growth by Major Roadway
1996 Daily Traffic on Major North-South Roadways
0
5,000
10,000
15,000
20,000
25,000
30,000
35,000
40,000
45,000
Prince/Totten/CPR City Limits Hwy 401 S. Study Limit
Road, which does not decrease throughout the City. Highway 401 carries a consistent volume of traffic within the study area, the largest volume of all east-west roadways.
Roadway Network Capacity
Roadway network planning accommodates traffic demands from a global perspective. Roadway demands and capacities are assessed at screenlines, which represent locations in the network where capacity is most critical for the total network performance. The screenlines in this analysis include those used in the previous WUTS in order to provide a comparative basis for the assessment of the network performance, as shown on Figure 1.8.
The capacity of a screenline is determined as the sum of the capacity of the roadways crossing it. Table 1.8 presents the capacity for each of the screenlines, as they existed in 1980, and as they currently exist based on roadway improvements since that time.
Table 1.8: Screenline Capacities (vehicles per hour)
Screenline 1980 WUTS Capacity (2-way)
1997 WALTS Capacity (2-way)
Rationale for Change
Prince Street 5,300 5,300
Totten Street 4,000 6,000 Huron Church widened to 6 lanes
CPR West 8,800 8,800
CPR Central 5,600 5,600
CPR/EC Row East 10,400 10,400
Total Prince-Totten-CPR-EC Row
34,100 36,100 6% increase
S. City Limit West 8,800 8,800
S. City Limit Central 12,700 12,700
C. R. 42 8,000 8,000
Total S. Limit/CR 42 29,500 29,500 0% increase
Huron Church North 10,200 10,200
Huron Church South 4,200 8,800 E.C. Row widened to 4 lanes
Total Huron Church 14,400 19,000 32% increase
CPR/Crawford 9,100 9,100
Walker-north 13,000 13,000
Walker-south 12,200 16,800 E.C. Row widened to 4 lanes
Total Walker 25,200 29,800 18% increase
CNR/Jefferson 11,400 16,000 EC Row at 4 lanes 14% increase
East City Limit 6,800 11,000 Hwy. 2 at 4 lanes
Stantec 1.22
62% increase
This table shows a significant change in capacity (18 to 62%) for east-west corridors since the 1980 study. This is due to the expansion of the E.C. Row corridor. By comparison, the change in capacity for the north-south corridors is only moderate (6%), resulting from the widening at Huron Church Road.
Five Year Improvement Plans
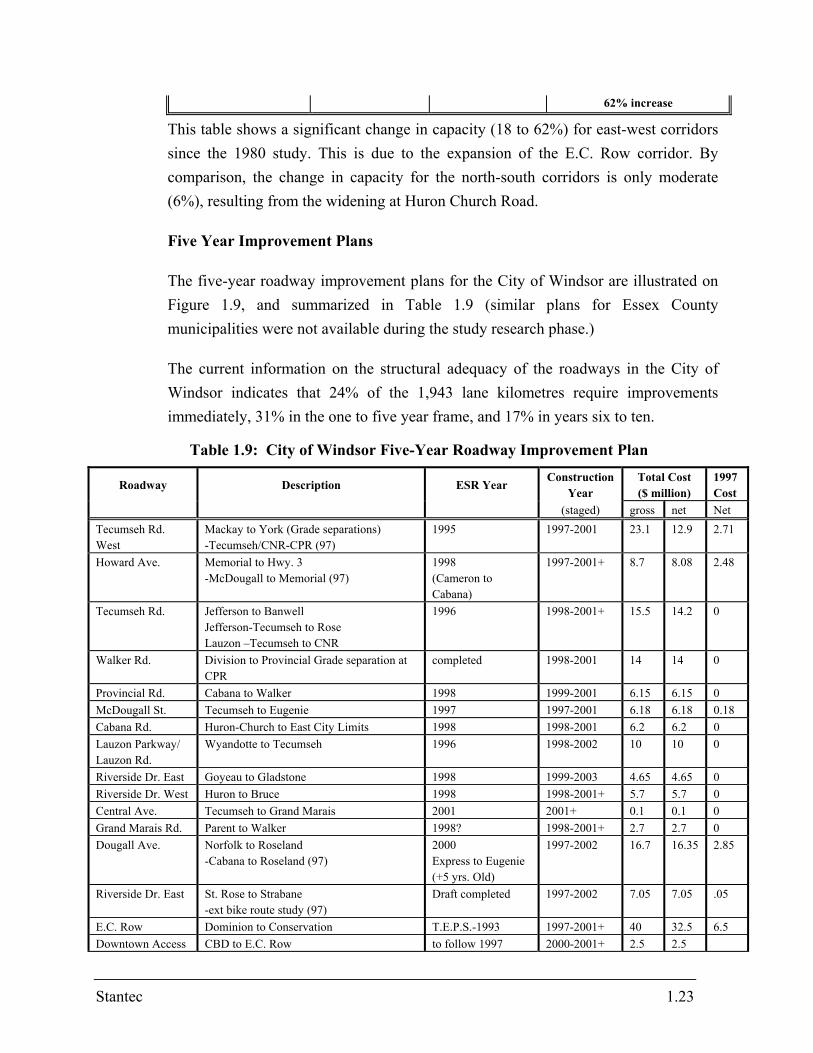
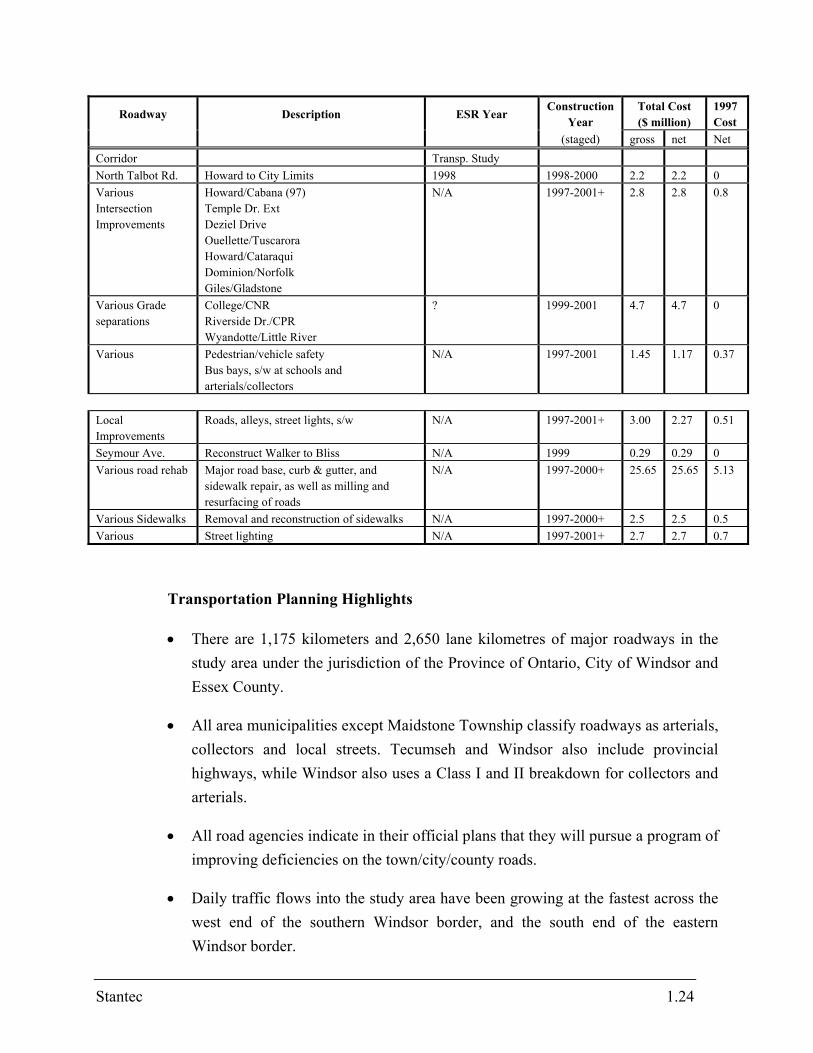
The five-year roadway improvement plans for the City of Windsor are illustrated on Figure 1.9, and summarized in Table 1.9 (similar plans for Essex County municipalities were not available during the study research phase.)
The current information on the structural adequacy of the roadways in the City of Windsor indicates that 24% of the 1,943 lane kilometres require improvements immediately, 31% in the one to five year frame, and 17% in years six to ten.
Table 1.9: City of Windsor Five-Year Roadway Improvement Plan
Roadway Description ESR Year Construction
Year Total Cost ($ million)
1997 Cost
(staged) gross net Net Tecumseh Rd. West
Mackay to York (Grade separations) -Tecumseh/CNR-CPR (97)
1995 1997-2001 23.1 12.9 2.71
Howard Ave. Memorial to Hwy. 3 -McDougall to Memorial (97)
1998 (Cameron to Cabana)
1997-2001+ 8.7 8.08 2.48
Tecumseh Rd. Jefferson to Banwell Jefferson-Tecumseh to Rose Lauzon –Tecumseh to CNR
1996 1998-2001+ 15.5 14.2 0
Walker Rd. Division to Provincial Grade separation at CPR
completed 1998-2001 14 14 0
Provincial Rd. Cabana to Walker 1998 1999-2001 6.15 6.15 0 McDougall St. Tecumseh to Eugenie 1997 1997-2001 6.18 6.18 0.18 Cabana Rd. Huron-Church to East City Limits 1998 1998-2001 6.2 6.2 0 Lauzon Parkway/ Lauzon Rd.
Wyandotte to Tecumseh 1996 1998-2002 10 10 0
Riverside Dr. East Goyeau to Gladstone 1998 1999-2003 4.65 4.65 0 Riverside Dr. West Huron to Bruce 1998 1998-2001+ 5.7 5.7 0 Central Ave. Tecumseh to Grand Marais 2001 2001+ 0.1 0.1 0 Grand Marais Rd. Parent to Walker 1998? 1998-2001+ 2.7 2.7 0 Dougall Ave. Norfolk to Roseland
-Cabana to Roseland (97) 2000 Express to Eugenie (+5 yrs. Old)
1997-2002 16.7 16.35 2.85
Riverside Dr. East St. Rose to Strabane -ext bike route study (97)
Draft completed 1997-2002 7.05 7.05 .05
E.C. Row Dominion to Conservation T.E.P.S.-1993 1997-2001+ 40 32.5 6.5 Downtown Access CBD to E.C. Row to follow 1997 2000-2001+ 2.5 2.5
Stantec 1.23
Roadway Description ESR Year Construction
Year Total Cost ($ million)
1997 Cost
(staged) gross net Net Corridor Transp. Study North Talbot Rd. Howard to City Limits 1998 1998-2000 2.2 2.2 0 Various Intersection Improvements
College/CNR Riverside Dr./CPR Wyandotte/Little River
? 1999-2001 4.7 4.7 0
Various Pedestrian/vehicle safety Bus bays, s/w at schools and arterials/collectors
N/A 1997-2001 1.45 1.17 0.37
Local Improvements
Roads, alleys, street lights, s/w N/A 1997-2001+ 3.00 2.27 0.51
Seymour Ave. Reconstruct Walker to Bliss N/A 1999 0.29 0.29 0 Various road rehab Major road base, curb & gutter, and
sidewalk repair, as well as milling and resurfacing of roads
N/A 1997-2000+ 25.65 25.65 5.13
Various Sidewalks Removal and reconstruction of sidewalks N/A 1997-2000+ 2.5 2.5 0.5 Various Street lighting N/A 1997-2001+ 2.7 2.7 0.7
Transportation Planning Highlights
• There are 1,175 kilometers and 2,650 lane kilometres of major roadways in the study area under the jurisdiction of the Province of Ontario, City of Windsor and Essex County.
• All area municipalities except Maidstone Township classify roadways as arterials, collectors and local streets. Tecumseh and Windsor also include provincial highways, while Windsor also uses a Class I and II breakdown for collectors and arterials.
• All road agencies indicate in their official plans that they will pursue a program of improving deficiencies on the town/city/county roads.
• Daily traffic flows into the study area have been growing at the fastest across the west end of the southern Windsor border, and the south end of the eastern Windsor border.
Stantec 1.24
• Daily traffic across the US-Canada border is estimated at 49,400, with about 52% using the Ambassador Bridge.
• The 1996 estimated daily traffic flows on the major east-west road ways in City of Windsor include: E.C. Row Expressway east of Howard 80,000 Tecumseh Road at Jefferson 33,000 Wyandotte Street east of Crawford 25,000 Riverside Drive east of Walker 22,000
• The 1996 estimated daily traffic flows on the major north-south routes are: Huron Church Road south of Malden 40,000
Walker Road north of Grand Marais 35,000 Lauzon Parkway south of Forest 35,000 Ojibway Parkway south of Spruce 25,000
• Outside the City of Windsor the 1996 daily traffic in the major corridors are: Highway 401 at east border 22,000 Highway 3 east of Hwy 401 22,000 Highway 18 at south Study area border 13,000 Highway 2 at east Study area border 10,000
• In 1997, the City of Windsor programmed work to begin on 6 roadway projects (including Environmental Assessments) with a net cost of $14.8 million. The net cost of the total work programmed is $151.5 million. In addition, there are local improvements totaling $42 million in the five year plan.
• There are some 11 road improvement projects that were identified in the 1980 WUTS that have not as yet been programmed.
1.3.4 TRANSIT SYSTEM
For the purposes of the WALTS Study, this summary review of Transit Windsor provides a background to where transit has been within the City, and the state of the system today. A full report on the Assessment of Public Transit Services in Windsor (C.H. Prentice, June 1997) is enclosed as Technical Appendix 3 to this Report.
However, the more important and relevant issue facing public and transit is the future role of public transit within the City and area, its realistic expectations and what
Stantec 1.25
policy directions and resources will be necessary to achieve those expectations in the future. These issues will be discussed in a subsequent Report detailing Transit Windsor's future directions.
Current Condition
Transit Windsor, formed in 1977, is administered by a five-member Board of Directors appointed by City Council. The Board is responsible for policy development and the overall management and performance of the transit system. The net cost to operate the transit service is funded by the City of Windsor for which the Transit Windsor Board must seek approval annually.
While the Transit Windsor Board generally acts autonomously from other municipal services, there is frequent dialogue and joint activities between City departments and the management staff at Transit Windsor. The Board does have regular contact with City Council, a level of communication which has increased over the past few years, and major service changes are presented to Council for information.
The conventional transit system serves Windsor with 12 regular routes plus two express routes. It also provides an international service to Detroit through the Detroit-Windsor Tunnel. Hours of service are 19 per weekday, 18.5 on Saturdays and 16 on Sundays and Holidays. Service frequencies are generally 30 minutes or better in peak hours and a mix of between 30 and 60 minutes during off-peak and evening hours. Saturday service levels are between 30 and 60 minutes (more frequent on the important Transitway 1A, 1C and Crosstown 2 routes). Additional trips are provided during peak hours for University, College and high school students.
The specialized transit service is provided by a separate agency, Handi-Transit, which has 10 full-time and 16 part-time employees and 13 accessible small buses. A total of 48,873 trips were taken on the system in 1994, with 49,109 in 1995.
Over the past five years, transit service levels have been adjusted to respond to previous declines in transit ridership and fiscal constraints established by the City. However, in 1996, transit ridership increased by 6.1% over 1995, a trend which is continuing into 1997. To the end of April 1997, ridership is up 13.6% over the same period in 1996.
Stantec 1.26
An operational review of Transit Windsor services was last conducted in 1993. A number of the transit service and administrative recommendations from that study have been implemented. One area which still requires review and assessment is the three transit terminals (west side, downtown and east side); their role, location and design.
Assessment of Transit Windsor
Windsor is an automobile-dominated city, more so than other urban areas, and is largely a reflection of the city's prominence as an automotive manufacturing centre. As a result, there is a higher tendency towards automobile use, accommodation and preference for car use in the city. This has tended to lower the priority for developing and emphasizing the use of transit in Windsor.
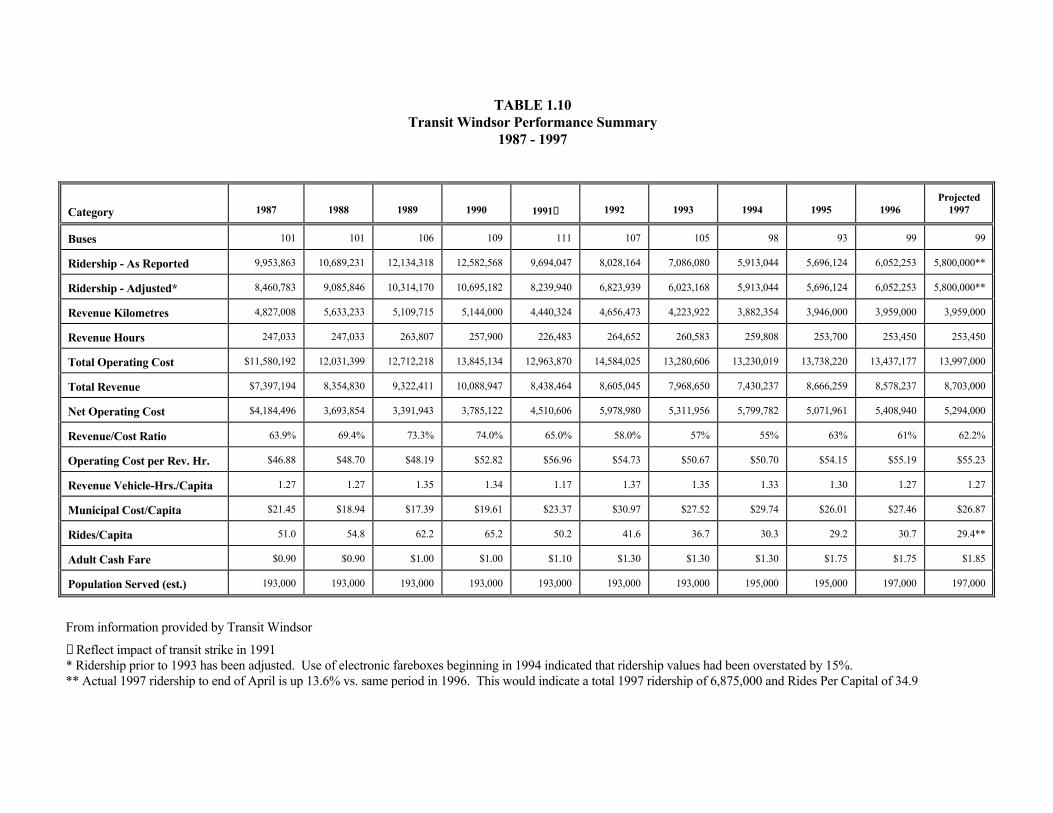
This is shown on Table 1.10, which summarizes the performance of Transit Windsor over the past 10 years. The key qualitative and quantitative measurements which indicate the performance of Transit Windsor over this time period are:
• Revenue/Cost ratio - the measure of financial performance;
• Rides per Capita - the measure of transit use;
• Revenue-Hours per Capita - the measure of the level of service provided; and
• Municipal Cost per Capita - the measure of the cost to the community.
Notwithstanding the operating environment for public transit in Windsor, the overall performance of the transit system was generally of a high order until 1991. The performance trends for Transit Windsor evident in Table 1.10 illustrate that up to 1990, the transit system had a high level of ridership, peaking at 12,582,568 and attaining a revenue/cost (R/C) ratio of 74.0%. This coincided with a high Rides Per Capita rate of 65.2, a high level of service provided to the community and a low municipal cost of $19.61.
Overall, the performance of the transit system since 1991 in all measurement categories has fallen significantly, although the R/C ratio has recovered moderately through both expenditure reductions and large fare increases. At the same time, while higher than pre-1991 levels, the municipal cost/capita has fallen and stabilized in the $27.00 range.
Population Served (est.) 193,000 193,000 193,000 193,000 193,000 193,000 193,000 195,000 195,000 197,000 197,000
From information provided by Transit Windsor
✝ Reflect impact of transit strike in 1991 * Ridership prior to 1993 has been adjusted. Use of electronic fareboxes beginning in 1994 indicated that ridership values had been overstated by 15%. ** Actual 1997 ridership to end of April is up 13.6% vs. same period in 1996. This would indicate a total 1997 ridership of 6,875,000 and Rides Per Capital of 34.9
It should be noted that much of the ridership loss and fall in the R/C ratio between 1991 and 1993 compared to 1990 was the result of reduced use of transit by the local school boards and social services agencies. For example, up to 1990, revenue from school board and social services pass sales totaled $4.17 million, or approximately 40% of total revenues. In 1996, revenues from these two sources totaled $1.44 million (Social Services - $1.14 million, school boards - $0.3 million) or 12.8% of total revenues.
The introduction of electronic fareboxes in 1992 with fast fare processors indicated that the method of calculating ridership had been overstated by approximately 15%. Therefore, ridership values for the years prior to 1994 have been reduced by 15% and are presented as "Ridership - Adjusted" in Table 1.10.
There are several reasons for the decline in Transit Windsor's performance, all of which underscore the impact of the many factors which often are beyond managerial control. These include:
• the decline in the Ontario economy which reduced employment, government and consumer spending;
• the gradually changing demographic and socio-economic structure of society which has changed travel characteristics, and replaced a large segment of traditional full-time jobs with part-time and home-based work activities;.
• the changing socio-economic and employment structure of the economy that has altered travel and commuting patterns with many more trips being taken during off-peak and evening hours when transit service has traditionally not been as frequent or attractive; and
• the recession also reduced economic activity to the degree that fewer trips were being made in general.
In response to these market changes, Transit Windsor reduced Revenue Kilometres by 20% and Revenue Vehicle-Hours (service levels) by 17%. As a result, ridership has dropped by almost 40% (using the revised ridership values). The difference in the degree of Revenue Vehicle-Hour and Revenue-Kilometre reduction indicates that service efficiency, in terms of Revenue-Kilometers per Revenue Vehicle-Hour, has declined somewhat. (There were changes in the method of calculating Revenue
Stantec 1.28
Vehicle-Hours over the years prior to 1992 which understated the actual Revenue Vehicle Hours.)
To meet municipal financial constraints and to offset the loss of revenue resulting from reduced use of transit by the social service agencies and school boards, transit fares have increased significantly between 1992 and 1995, with the basic fare (adult) rising from $1.30 to $1.75. They have increased further as of January 1, 1997 (adult increasing to $1.85).
The declining birth rate and aging population affects two of public transit's key ridership markets to the degree that this market segment is producing fewer potential trips. The lower birth rate means fewer children and students are using transit, while at the other end of the age scale, the growing seniors population generally make fewer trips. Those seniors who do have relatively better health, and sufficient disposable income to permit car ownership.
With the aging population, however, will come a greater need to meet the needs of those with disabilities.
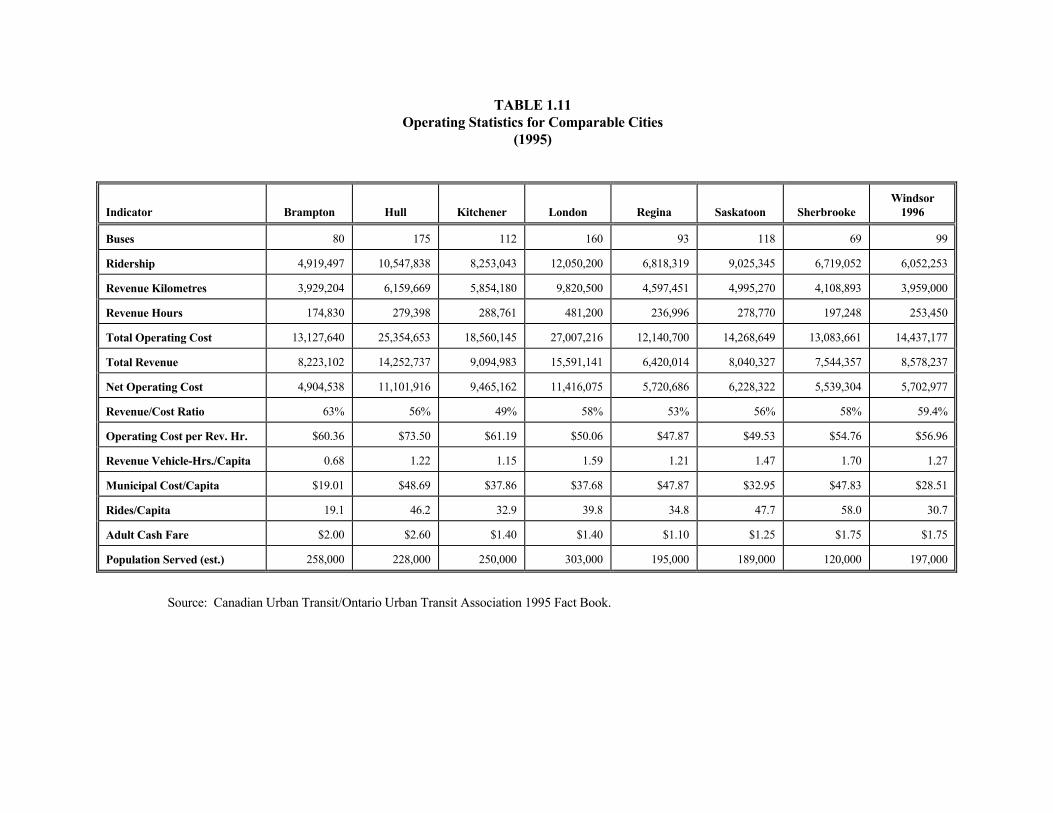
Comparison with Other Municipalities - In order to place Transit Windsor's current performance in context, Table 1.11 presents the key performance statistics for transit systems in medium size municipalities across Canada. Although the population range is wide (120,000 to 303,000), it is instructive to note the variations in ridership levels, rides per capital, service levels, financial performance and municipal cost per capita that can occur amongst cities. Direct comparison with other municipalities is difficult since the characteristics of each city are different. Therefore, no attempt is made here to do so. However, the performance of other transit systems presents an indication of the range of performance, or level of expectation, that might reasonably be made with regard to Transit Windsor.
On the basis of the information presented in Table 1.10, the following can be concluded about Transit Windsor's performance:
• it has a high R/C ratio, and thus good financial performance;
• its cost per capita is low;
• the operating cost per Revenue Vehicle-Hour is in the median range and can be considered positive;
Stantec 1.29
TABLE 1.11 Operating Statistics for Comparable Cities
Population Served (est.) 258,000 228,000 250,000 303,000 195,000 189,000 120,000 197,000
Source: Canadian Urban Transit/Ontario Urban Transit Association 1995 Fact Book.
• the level of service (Rev. Veh.-Hrs./capita) is lower than the median;
• rides per capita are low; and
• transit fares are higher than average.
Like several of the other cities (Regina, Sherbrooke, London and Kitchener), Windsor is a university city, which is an important factor in ridership levels. Also, each of the municipalities (except Brampton) are unaffected by larger urban centres, such as those in the Greater Toronto or Montreal areas, and thus provide a reasonable basis for judging the performance of Windsor's transit system.
Operational Issues - While an Operations Review in 1993 addressed a number of operational and administrative issues, there remains a number of issues which need to be assessed. These include:
• the supply of parking and parking rates in the downtown area;
• the effect of railway crossings on transit service operations and reliability;
• opportunities for integrating Handi-Transit service with the conventional service including resource and facility sharing;
• the introduction of a downtown shuttle service in co-operation with the downtown business district;
• an inter-modal transportation centre;
• transit signalization priority on major arterials, and
• land use planning.
With regard to opportunities to integrate Handi-Transit and Transit Windsor services, this could be considered in such areas as vehicle servicing, storage and fueling, trip reservation and dispatching and sharing of office space at the Transit Windsor facility.
Each of these issues will be considered in the next phase of the WALTS study within the context of the role of the transit system.
Stantec 1.30
Key Factors Influencing The Transit System Performance
Public transit operates within a complex socio-economic, geographic and political environment, each condition of which will influence the performance of a transit system over time.
Socio-Economic Factors - centre on population and employment trends including income levels, sources of employment and the demand for and availability of labour skills.
Geographic Factors - in the urban transit setting comprise the urban form of the municipality, its land-use patterns and street layout.
Political Factors - include municipal policies such as the Official Plan and other statements which guide and influence decision-making in the municipality, and the degree of direction and priority given to those responsible for the delivery of transit service. The 1996 City of Windsor Community Strategic Plan is an additional important document for influencing future direction in all facets of the City's life and services.
The current process of boundary restructuring will also have an important influence on the City's future direction and on its transportation and public transit services.
Issues such as De-Regulation of public transportation, the Casino operation and the concept of Community Transportation, will have an impact on the delivery of public transit service over the next two to three years.
The elimination of MTO funding may not result in a financial loss to the City, depending on the results of other changes in responsibilities between the Province and the Municipality. Decisions regarding priority for and provision of public transit should not be influenced by availability of MTO funding since transit has always been a municipal responsibility. The elimination of the MTO funding presents an appropriate time to consider the adoption of a suitable Revenue/Cost or Net Cost target for the transit system. This would improve the management and administration of the transit system.
Windsor Official Plan - The current City of Windsor Official Plan provides general objectives, policy statements and planning guidelines with regard to public transit and
Stantec 1.31
parking within the City. While it is comprehensive and provides good broad statements of intent and details specific objectives, the document would benefit from more specific targets with respect to ridership, walking distances and service levels. Conversely, these may best be covered by Transit Windsor through their own service standards.
Windsor Community Strategic Plan - This Plan establishes a vision for Windsor and a strategy for achieving this vision using a number of themes and objectives. Transportation, and specifically public transit, are considered as a component of the Sustainable Healthy Environment theme.
City Planning - Transit Windsor is included in the planning process and is given an opportunity to comment on all planning proposals, including secondary plans, re-zoning applications and minor redevelopment proposals. However, the degree to which transit requests are considered, or that development proposals embrace transit-supportive planning guidelines, such as those produced by the Transportation Association of Canada (TAC) and the Ontario Ministry of Transportation, have a significant impact on the transit system's ability to effectively and efficiently serve the community. At the same time, the impact on the ability to provide transit service into new areas and the cost implications on transit of various planning decisions (whether developer initiated or not) should be assessed in the City's overall evaluation of any development proposal.
By including the public transit system in an inclusive planning and decision-making process, the impact of City policy decisions in all areas of its jurisdiction (planning, parking supply, tourism, etc.) on the transit system can be determined. For example, policies which are not transit-supportive, such as increasing the parking supply, setting parking fees which are lower than the basic transit fare or encouraging development practices which are not transit-supportive, could be the basis for reducing the transit system's Revenue/Cost ratio and justification for a higher municipal cost.
Transit Windsor Route Planning Policies and Servicing Standards
Transit Windsor has established a new set of policies and standards for it’s operation (1998) that are used by transit staff to manage the transit system. They also serve as the basis for Transit Windsor Board governance of the transit system.
Stantec 1.32
In addition to goals and objectives, the new policies include more detailed planning guidelines and service standards dealing with:
• Financial Objectives • Planning Guidelines: • Service Standards
- Hours/Frequency of Service - Vehicle Loading - Schedule Adherence - Vehicle Accidents - Service Delays
- Service Area and Coverage - Transfers - New Service Warrants - Catchment Area Warrant - Route Directness - Bus Stop and Shelter Location - Subdivision Approvals
Future Issues
De-Regulation - of the public transportation industry effective January 1, 1998 is intended to eliminate barriers to providing more competitive services between cities. The notion of de-regulation has, however, given rise to the concept of private operators potentially providing public transit service within municipalities in competition with a municipal transit service. Indeed, the draft revised Municipal Act seems to encourage this approach.
In reality, the economics of public transit are such that services, unless selectively operated, are not self-sustaining. There is no competition within public transit for public transit users since the competition is the automobile user. Thus, private sector operators are likely to only be interested in providing public transit services where the net cost would be under-written by the municipal government.
Municipalities need to carefully consider their investment in their municipal transit systems and should take steps to adopt a comprehensive approach to retaining effective planning control over public transit within their jurisdiction in order to provide an integrated and co-ordinated public transit service.
Community Transportation - brings together the many transportation resources that are used by various organizations with the objective of increased efficiency and effectiveness in providing transportation services to a broader range of residents. The Province is encouraging the development of Community Transportation initiatives through its CTAP office (Community Transportation Action Program). A CTAP project is underway in Windsor and Essex County with a Transit Windsor staff
Stantec 1.33
member (R. Goody) as chair of the Committee. It has progressed beyond the research phase and is moving towards an implementation phase for a demonstration service.
Community Transportation may be able to augment Transit Windsor and Windsor Handi-Transit services in future, and there are likely to be opportunities for resource co-ordination and sharing to either reduce the cost of transportation generally, or to provide more trips within the same financial resources.
Municipal Restructuring - involves potential incorporation of neighbouring areas into the City of Windsor, and presents both opportunities and challenges for public transit. Areas that could be incorporated includes some "urban" areas, chiefly along the shore of Lake St. Clair, but most of the new area is rural. As a result, there is likely to be differing expectations of transit service levels for these areas. The City should consider adopting an urban and a rural definition for transit service. Included in this should be the possibility of extending conventional transit service or the provision of alternative transit services, such as may be possible through CTAP, within the Study area.
1.3.5 CYCLING AND PEDESTRIAN SYSTEMS AND POLICIES
Existing Cycling and Trails Systems
The City of Windsor has published a map called “Windsor Trails, Parks and Recreation Facilities” that illustrates the location of featured trails, including Ambassador/Assumption/Centennial Recreationway, Ganatchio Trail, Walker Homesite Trail, West Windsor Recreationway, College Ave. Recreationway, Russell Street Recreationway, and neighbourhood walking paths. On-road bikeways that currently exist in Windsor are predominantly on-road bicycle routes and wide shared lanes. The featured trails and on-road bikeways are illustrated on Figure 1.10.
Trail corridors outside the City of Windsor, including rail-trails and the future Trans-Canada Trail, are also illustrated on Figure 1.10.
The Ministry of Transportation’s Southwestern Ontario Transportation Perspective, dated (1996), documents the use and role of bicycles and pedestrians in the context of a broad large-scale transportation overview for the region. The study recognizes their limitation for use in longer, inter-city trip making, but also their viability, especially
Stantec 1.34
cycling, in cities with significant university or college populations, and as popular recreation activities within tourism corridors.
Cycling and Pedestrian Plans, Goals, Objectives and Policies
The following documents were reviewed in 1997 with respect to goals, objectives and policies pertaining to cycling and walking:
• The City of Windsor Community Strategic Plan, 1996.
• Official Plan of the Corporation of the City of Windsor, July 1996.
• Town of Tecumseh Official Plan, February 1996.
• Town of LaSalle Official Plan Consolidation, July 1993.
• Township of Sandwich South Official Plan (Final Draft), January 1997.
• The Official Plan of the Township of Maidstone.
• Village of St. Clair Beach Official Plan, December 1989.
The City of Windsor is comprehensive in addressing walking and cycling in all areas of their Community Strategic Plan and Official Plan. Reference should be made to the current Official Plans of the other Study area municipalities for Goals, Objectives and Policies related to cycling and walking.
For cycling, the objectives found in the Windsor Official Plan are based on the recommendations of the 1990 Bicycle Use Development Study. In general, with regard to Bicycle Policies - Section 7, the Official Plan states that:
• the City of Windsor had begun the challenging process of developing state-of-the-art bicycle travel programs and facilities for a broad range of citizens based on the following objectives:
(i) Further foster or create demand for using bicycles by as many citizens as possible.
(ii) Commit to ongoing development of a compact network of high profile bicycle facilities as identified in the Bicycle Use Development Study’s Master Plan.
(iii) Recognize that provision of facilities alone is not an adequate approach to bicycle transportation, and that the four principles for improved bicycle use are engineering, education, enforcement and encouragement.
Stantec 1.35
(iv) Improve and implement City of Windsor bicycle policies and planning initiatives.
Detailed policies describe the City’s commitment to the role of bicycle transportation, future program development, education encouragement and safety policies, design guidelines, and bicycles in the downtown.
In general with regard to Pedestrian Policies, Section 7.8, the Official Plan states that:
• objectives for pedestrian facilities within Windsor reflect a variety of opportunities and limitations:
(i) Commit to the continued development of convenient and safe pedestrian movement systems.
(ii) Ensure that pedestrian routes are accessible to all segments of the community at all times, including users of motorized wheelchairs and carts.
(iii) Encourage walking as an alternative to automobile use over a variety of distances within the community.
Detailed Official Plan policies describe the City’s commitment to providing pedestrian facilities including recreationways and trails, integration with other transportation systems, urban design considerations, and policies on the Detroit River crossing.
The other WALTS municipalities deal predominantly with pedestrians and somewhat with cyclists, but to a much lesser extent than Windsor in their Official Plans. Reference should be made to goals and policies of these Official Plans.
Existing linear trail systems within the study area are shown on Figure 1.10.
The City of Windsor adopted a new sidewalk policy in the Manual of Development Requirements in August 1995. It requires that in new plans of subdivisions, sidewalks are required on:
• both sides of arterials, collectors, and streets accessing schools, parks and commercial developments, and;
• on one side of local streets, other than “minor local” streets unless they lead to schools or parks (minor local street is defined as any street for which a minimum right-of-way width of 15 metres (50 feet) is permitted as per Public Works Drawing AS-228 and which qualifies for 7.4 metre (24 foot) wide pavement).
Stantec 1.36
1.3.6 RAILWAY SYSTEM
This assessment of the existing rail systems in the Windsor area was conducted for IMC Consulting Group Inc. by David Hackston and Richard Lake from The Research and Traffic Group.
Windsor is currently served by three Canadian mainline freight railways (Canadian National, St. Lawrence and Hudson Railway which is part of the CP family, and CASO which is used by CN, plus a local short-line operator, the Essex Terminal Railway. The US-based CSX line has been abandoned. In addition, VIA Rail provides rail passenger service from Windsor to Toronto and other points in Canada by connections with its service between Windsor and Toronto.
At present, there are three rail lines entering Windsor from the east, as shown on Figure 1.11:
• The former CN Chatham subdivision which is the most northerly of the lines, part of which has been acquired by VIA Rail;
• The St. Lawrence and Hudson line which is to the south of the CN/VIA line; and
• The CASO (jointly owned by CN and CP) line which is used by CN to access Windsor and previously the tunnel to Detroit.
The Essex Terminal Railway traverses Windsor and connects local industry with each of the railways. There are also several rail yards in and around Windsor required for two purposes; to facilitate through traffic and to serve shippers in the area. Table 1.12 and the two paragraphs that follow have been updated from a 1995 RTG report for the province of Ontario.2
Table 1.12: Identified Major Rail Shippers
Location Company Product and Comments
Windsor Chrysler Canada Minivans, full size vans, trucks
Ford Motors Engines (5 plants)
ADM-Agri Ind. Veg. oils and meals; canola and soybeans in, major expansion
Canadian Rock Salt salt
Canadian Salt salt
2 Hackston, David, Richard Lake and John Heads, Southern Ontario-Rural Rail Rationalization, Ontario Ministry of Transportation and
Ontario Ministry of Agriculture, Food and Rural Affairs, March 1995, pp. 76-7.
Stantec 1.37
K Scrap Resources Scrap metal processing
Zalev Brothers Limited Scrap metal processing
Morterm Material handling operation; lumber transfer yard, steel, auto parts.
Green Forest Lumber Lumber transfer yard
Van de Hogen Lumber transfer yard
Gateway Lumber transfer yard
Amherstburg General Chemicals Soda ash, calcium chloride
Windsor and nearby Amherstburg industries generate a mixture of automobile, chemical and food related traffic. The major shippers indicated in Table 1.12 were identified with the assistance of the Essex Terminal Railway.
In addition to the majors listed above, there are several smaller but important rail shippers located at Windsor and Amherstburg. These include Dainty Foods, Hiram Walker, Canadianoxy Industrial Chemicals Limited Partnership, and Allied Signal.
Running Rights and Joint Track Usage
Windsor has probably benefited more than any other location in Canada from the railways’ use of running rights. Notwithstanding the number of railway lines in and around the city, there would have been many more if each railway company had owned its own facilities. Important for the Transportation Plan, there would appear to be, at least on the surface, room for additional consolidation of railway plant. Plant rationalization for branch and main lines is covered later in this report. Future consolidation of yard and transfer facilities in Windsor, particularly with the continuing efforts of CN and CP to eliminate underutilized facilities in Eastern Canada would appear to be a good possibility.
The enabling statutory provisions for such a rationalization are contained in sections 138 and 139 of the Canada Transportation Act, included in Technical Appendix 4 of this Report.
Cross-Border Rail Service to Michigan
The major feature of railway infrastructure in the Windsor area is the Detroit River Tunnel which is jointly owned by CN and CP. It is accessed via the CASO line from CN’s Vanderwater Yard and via a lead track from the CP mainline Windsor Yard onto the CASO between the Vanderwater Yard and the Windsor portal to the tunnel.
Stantec 1.38
The tunnel is a two tube facility with one tube having recently been enlarged to permit the movement of large sized loads, particularly auto parts box cars, multi-level auto racks and double-stacked import/export containers. At present it is unable to handle double-stacked domestic containers because of their greater height and some bi-level auto racks.3 The enlargement of this tunnel and the completion of the new CN tunnel at Sarnia have led to the elimination of cross river rail barge operations at both locations.
Since the opening of the new tunnel at Sarnia, CN has rerouted its major through service via that facility. Trains that used to operate through Windsor, particularly to Chicago and west, now move through Sarnia, and recently the CSX and NS have commenced run-trough service over the CN line to Sarnia and through the new tunnel. These changes have reduced the number of trains through Windsor and through the Detroit River tunnel. Current tunnel usage is by the CSX, NS and ConRail which each operate a puller service between Detroit and Windsor and by CP for both its line haul and puller operations. CN does not operate through service through the Windsor tunnel. CN’s traffic through the tunnel between is handled by the CSX puller. The Essex Terminal blocks cars (train preparation) for the NS and CSX puller operations.
The Windsor - Detroit tunnel is now utilized primarily by CP with minor use by CN and some use by the U.S. based railroads for connections with Canadian railways and to service industry located in Windsor.
Current Policies & Practices in the Provision of Grade-Separated Rail Crossings
The only formalized policies with respect to the financing of grade separations lie within the purview of the federal government. The Railway Safety Act, section 13, provides an avenue for an application for a grant with the Minister of Transport. If approved, a grant of up to eighty percent of the cost associated with the grade separation including the cost of relocating a public road is awarded.
A Transport Canada official indicated that they have not authorized any grants for grade separation in recent years, preferring instead to fund improved level crossings
3 Bi-levels are used for the transport of vans and light trucks and tri-levels are used for the transport of automobiles.
Stantec 1.39
which are seen as providing a greater safety return on the amount of money available for funding.
Ontario does not have any explicit policy with respect to assisting with the funding of grade separations. Funding decisions are approached on a case-by-case basis.
With the number of level crossings in Windsor, crossing safety is very important. This involves crossing protection and the warning of an approaching train (whistling).
Emerging Trends That May Affect the Windsor Area
Rail Freight
The major factors that could affect the railway network in and around Windsor include:
• Changes to the utilization of the Detroit River Tunnel;
• Installation of intermodal transportation facilities at Windsor;
• Increases in Canada-U.S. intermodal transportation;
• Changes to the rail transportation of motor vehicles; and
• Railway consolidation and abandonment (see next section).
Changes to Utilization of the Detroit River Tunnel - For almost 100 years the rail tunnel between Windsor and Detroit has served as the main rail access route for movement between Ontario and nearby states, including transport between the western U.S. and eastern Canada. With the increase in dimensions of one tube, rail car ferries were eliminated, adding more traffic to the tunnel. Acting in the other direction, the new CN tunnel at Sarnia with its larger dimensions and easier access is attracting rail traffic away from the Windsor tunnel. CN is now routing virtually all its traffic through Sarnia and the CSX, which formerly used the Windsor tunnel and its rail car barge at Sarnia, is now routing trains through the Sarnia tunnel. The Norfolk Southern and the CSX which formerly operated over the CASO and through the Windsor tunnel are now routing their through service via Sarnia.4
4 For NS, this presumably requires running rights in the U.S. (probably over the GTW) to connect between Port Huron and the NS lines around Detroit.
Stantec 1.40
The St. Lawrence and Hudson subsidiary of the CP is the only railway operating in this part of Canada which is tied to the Windsor tunnel. Notwithstanding, CN, CSX and NS would probably continue to make limited use of the Windsor tunnel because of the desire to maintain traffic from and to the major motor vehicle industry on both sides of the border. A further complication is the proposed takeover and partition of ConRail by the CSX and the NS. While neither owns any lines in Windsor, the acquisition of ConRail, if approved, may lead to a reduction or outright elimination of through service in Canada by CSX and NS who would be able to route trains south of the lakes on former ConRail lines.
Installation of Intermodal Transportation Facilities at Windsor - Intermodal is the fastest growing segment of rail freight services in Canada. As particular box cars reach the end of their useful life, the railways are replacing them with intermodal containers. The standard rail container used in domestic service is 48 feet long, similar to many highway trailers. The railways move a few 53 foot containers (current highway standard trailer length), largely leased by major retailers such as Canadian Tire and The Bay/Zellers. At present, the only facility for the loading/unloading of intermodal trailers and containers in Windsor is a small transfer facility located in the St. L&H’s Windsor yard. In addition, CP has an intermodal facility in Detroit which also serves Windsor. CN’s intermodal transfers are either made at Detroit or at Brampton with over-the-road movement between these locations and Windsor. The major U.S. railroads also have intermodal transfer facilities at Detroit and can truck across the border to serve Windsor based industries.
Because of the large dimensions involved in most motor vehicle and parts transportation, it is unlikely that the rail portion of these movements would be shifted to intermodal. Other shippers, on the other hand, could utilize rail intermodal were it to be made attractive.
Increases in Canada-US Intermodal Transportation - Very little intermodal traffic between Canada and the U.S. originates or terminates at Windsor. There are, however, large volumes of intermodal traffic through the rail facilities at Windsor, including the tunnel. Most of this transport is for the CP family of companies as CN favours the uses of its tunnel at Sarnia. The CP traffic comprises two elements:
• Import/export traffic through the Port of Montreal and primarily destined to or originated in the U.S. midwest; and
Stantec 1.41
• North American intermodal traffic also moving into/out of the U.S. midwest.
The expanded dimensions of one tube at Windsor are sufficient for the movement of most double-stacked import/export containers but insufficient for the movement of double-stacked North American traffic and some bi-level auto industry traffic. To handle such traffic, CP must route other than through the Windsor tunnel, probably over the Niagara frontier. CN can handle both types of intermodal traffic through the tunnel at Sarnia. This means that the tunnel at Windsor will probably experience less traffic growth than will the tunnel at Sarnia.
Changes to the Rail Transportation of Motor Vehicles - At present, the major auto manufacturers truck vehicles assembled at Detroit area plants across the river for loading onto rail at Windsor for delivery to Canadian points. This provides additional rail traffic for the auto plants at Windsor and for the Canadian railways. If the flow were to change, there would be a significant reduction in rail transport into and out of Windsor which could ultimately lead to the elimination of rail sidings at the plants.
Passenger Rail
At present, VIA Rail provides rail service between Toronto and Windsor with four departures and four arrivals on most week days. This service comes into Windsor on the former CN Chatham subdivision. VIA owns the track between Bloomfield (Chatham) and Tecumseh; CN has retained ownership from Tecumseh to Windsor. Between Chatham and Windsor, the quality of this track is below that of most CN and CP main lines (including the St. Lawrence and Hudson line into Windsor).5 This limits speed to a maximum of 80 miles per hour, and ride quality is also affected. Of course, having exclusive use of most of the track allows VIA to operate at its optimal speed (which differs from that for freight where 60 mph tends to be the limit, even on very good track) and without interference delays. In our view, the net effect is better service than VIA could provide over the St. Lawrence and Hudson line into Windsor.
The future of passenger rail service to Windsor is tied to VIA and whatever may happen to it.6 In our view, the London-Windsor leg of the Toronto-Windsor service
5 Hackston, Lake and Heads, op cit.
6 VIA’s purchase of part of the CN Chatham subdivision may be only a short term situation. Long-term, VIA may wish to have access to the tunnel and Detroit. The easiest way to accomplish this would be to obtain running rights over the CP Windsor subdivision from London or Chatham and to utilize the former CASO station in Windsor from which tunnel access can also be obtained.
Stantec 1.42
is particularly vulnerable to any further substantial cuts to VIA’s subsidy. Enhanced service provided by a higher technology system is also a possibility should the current political momentum be reversed.
A decision by CN to divest the balance of the Chatham subdivision, from which it receives little benefit, could put pressure on VIA’s use of this route and station. Some of the property concerned is potentially valuable urban real estate and VIA could have five options:
• buy the line from London (or Komoka) to Chatham and from Tecumseh to Windsor;
• operate over CP between London and Chatham, the VIA portion from Chatham to Tecumseh and to buy the line from Tecumseh to Windsor;
• move its operations to the CP line at London and operate to the former CASO station in Windsor;
• move its operations to utilize the CSX line from Chatham to Fargo and the CASO from Fargo to Windsor; or
• terminate operations between London and Windsor.
With government payments to VIA declining, VIA’s ability to buy additional lines may be limited as may continuation of all existing services. All other things being equal, the most flexible alternative would appear to be the third bullet as this would provide straight line access to Windsor with the potential option of tunnel access should the need arise. The fourth bullet would also provide access to the tunnel but over a more circuitous route.
In recent years there have been several studies into high-speed rail (HSR) passenger service in the Quebec City-Windsor corridor. The most recent was conducted by a partnership of the Ontario, Quebec and federal governments.7 There is continuing interest, particularly on the part of Bombardier and the Quebec government, in such a project and further studies may be conducted. In our view, only Quebec-Montreal-Ottawa-Toronto seems to have any intermediate term prospect, and even the justification for this would have to weigh national unity (integration) benefits highly.
7 Transport Canada, Government du Quebec and Ministry of Transportation of Ontario, Quebec - Ontario High Speed Rail Project, Final Report, August 1995. The supporting detailed reports, including routing and station location are yet to be released.
Stantec 1.43
Regardless, any serious development of such a system would probably not happen until well into the next decade.
According to the Ontario-Quebec-federal study, an HSR route is most likely to use the CP (St. Lawrence and Hudson) corridor, rather than the existing VIA route, into Windsor. Presumably, CP’s freight would use the CASO routing, which would seem quite feasible. The HSR routing was chosen and the Windsor station tentatively located so that the trains might ultimately travel on through the tunnel to Detroit and link up with potential U.S. HSR corridors. We understand that a station location in the vicinity of Memorial Drive east of Walker Road is tentatively envisaged. It would not, however, be safe to assume this route and station location for planning purposes. The 1991 Ontario-Quebec study8 concluded that the present VIA routing and station would be suitable for HSR.
Federal and Provincial Policies
In the aggregate, there are many government policies that could affect rail transportation in the Windsor area. In this report we have already mentioned, or will mention, several including railway crossings and line transfer and abandonment. It is not our intention, nor do we consider it to be within our mandate to go beyond the bounds of rail policy. We would in passing note that highway motor vehicle transport has a major impact on the volume of rail freight transport and the relationship is very complex including federal and provincial policies on fuel taxes, hours of work regulations and trailer size and weight regulation. The level of competition is also affected by truck regulation in adjoining jurisdictions such as Michigan.
The one additional legislative factor we would like to mention is regulated railway interswitching. Interswitching is the term used to denote the movement of a rail car between a shipper’s location on one railway and the line of another railway. It does not apply to en-route switching between two railways. Windsor is an exception to the general rule since the Essex Terminal Railway is exempt from the Railway Interswitching Regulations established pursuant to the Canada Transportation Act. Where CN and CP provide interswitching services, they are bound by the provisions of these regulations. The ETR, rather than receiving regulated interswitching rates,
8
Carmen, Bob, et al, Ontario/Quebec Rapid Train Task Force Final Report, May 31, 1991.
Stantec 1.44
effectively receives a division (share) of the rate charged by the line-haul railway. The statutory provisions on interswitching are included in Tecnical Appendix 4.
Rail Rationalization and Consolidation Possibilities
Pursuant to the Canada Transportation Act (CTA) of 1996, the transfer of ownership of rail lines and rail line rationalization has become much simpler and faster. The statutory provisions apply to main line and branch line tracks but not to yard tracks, sidings, or lines auxiliary to railway operations. For the lines covered by the Act, the railway must give public notice of its intention to sell or abandon the selected line or line segment. This is done through the preparation of a three year plan.
We have obtained a copy of the relevant three year plans for each of Canadian National, Canadian Pacific and the St. Lawrence and Hudson.
• The Canadian National three year plan shows that operations on the CASO from Fargo east to Hewitt will be discontinued. Fargo West to the tunnel at Windsor is listed as being retained.
• The Canadian Pacific three year plan does not indicate any changes to lines in the Windsor area.
• The St. Lawrence and Hudson three year plan lists the CASO (referred to as the Waterford subdivision) as being discontinued as described in the first bullet.
None of the plans of CN, CP or ETR indicate divestiture or discontinuance of any lines governed by the CTA during the three year period for the Windsor area. This, in itself, is not a guarantee that additional lines will not be added to the abandonment plans as the railways from time to time amend the plans. Updates for the CN and CP plans can be obtained from their respective web sites.
The designated line(s) must be both advertised for sale, lease or transfer and the intention to discontinue announced. Interested parties are to be given at least 60 days in which to make their interest known. If VIA operates on the line, any agreement with VIA must be noted. If VIA does not signify agreement to any transfer, any agreement with VIA terminates when the line is transferred. The divesting company has four months to negotiate following the expiry of the advertised notice period.
Stantec 1.45
Before abandonment, the railway must also offer the line to federal, provincial and municipal governments, to be used by them for any purpose, at its salvage value. Where the railway has complied with the process and no agreement has been reached with another party, the railway can discontinue operations and has no further obligation pursuant to the CTA. The complete provisions of the CTA are contained in Technical Appendix 4.
Notwithstanding the foregoing, there is more rail plant in Windsor than is needed. The three lines coming in from the east could probably be consolidated into two at the most, and perhaps one. Tunnel access can be gained from either the CASO (Fargo to Windsor line) or from CP (Chatham to Windsor line). At present the CASO line is used by CN from Fargo to Windsor, but only for access to Windsor based industries. CN does not operate through the Windsor tunnel. Consolidation on the CP line would provide the possibility of rationalizing additional CN trackage between Chatham and Komoka (where the line to Sarnia separates from the CN line to Chatham)9 A long-term solution would require some restructuring and possibly rationalization of rail facilities in Windsor.
The Essex Terminal operates across Windsor, provides direct rail service to most of the plants using railway services and provides much interswitching for the several lines operating into the city. As the line-haul carriers continue to consolidate and rationalize plant, it is probable that the ETR will increase its role as the switching carrier in Windsor.
WALTS Study Considerations
• Although CN, CSX and NS use the tunnel for traffic between Windsor and the United States, they no longer use it for their through services between Canada and the U.S. The CP family is the only rail system tied to using the tunnel for through movements.
9 The complicating factor with this route selection would result from the existence of the CN Leamington subdivision (Comber to Leamington) which handles traffic primarily for H.J. Heinz. Continued rail shipments by Heinz are contingent on an adequate supply of insulated box cars. These cars are old and the railways have not been replacing them. If the CASO from Fargo to Windsor were to be considered for abandonment, and continued operation of the Leamington subdivision were to be necessary, extension of the Leamington sub to connect with the CP Windsor sub may be necessary. We have not studied this option but bring it forward merely to indicate the relationship between the Fargo to Windsor section of the CASO and the Leamington sub.
Stantec 1.46
• Traffic through the rail tunnel to Detroit (and the rest of the United States) has declined and dimensional limitations restrict the size of rail shipments that can use the tunnel.
• Federal funding of grade separations is unlikely.
• Changes to the distribution pattern of automobiles from the Detroit area to Canadian destinations would affect the need for rail services and infrastructure in Windsor.
• VIA may soon be faced with having to decide on the route and station to be used or perhaps even on continued operation to Windsor.
• Previous studies into the potential for High Speed Passenger Rail (HSR) service have favoured an alignment approximating the CP route from Chatham.
• The non-listing of any Windsor area lines in the three-year plans of the railways does not guarantee that subsequent amendments will not include one or more of these lines.
• The CP route from Chatham is the most logical line for retention. The CASO would be second choice and whose operation may be extended because of the traffic from the Leamington subdivision.
The Essex Terminal will continue to provide most industrial switching and may assume a greater role as the line-haul carriers consolidate operations. Reduction of ETR plant is unlikely.
1.3.7 AIRPORT ACCESS
While the Windsor Airport is currently owned and operated by Transport Canada, the Ministry intends to privatize the Airport by transferring it to a local airport authority or other type of private owner and/or operator. While this privatization may result in new initiatives and opportunities at the Airport, the site will continue to require suitable ground access from the Windsor area roadway system for the movement of passengers, greeters/wellwishers, goods and other airport users.
In 1996, the Airport accommodated a total of some two million passengers. For these and other Airport users, roadway access to the Airport is required from three basic market areas; the Windsor urban area, the Detroit area and the surrounding Ontario rural area.
Stantec 1.47
Windsor Urban Area Access
The Windsor urban area is provided access to the Airport by the City/County major roadway system, most notably Walker Road and Division Road. Walker Road is the key ground access link to the Airport from the downtown, and from Highway 401. It serves the general Aviation area at the Airport, and links with Division Road to provide the only direct access to the Terminal Building.
Airport officials have noted concern over the physical condition and traffic volumes on Walker Road between Highway 401 and Division Street. Furthermore, these conditions and volumes are expected to increase in magnitude as the commercial “power centre” entertainment complex in the Walker Road/Provincial Road area continues to develop. In the case of Division Road, it is perceived to provide adequate Airport access capability at this time, but is expected to deteriorate in association with Airport area development. One such development is in the East Airport Lands proposed for industrial and/or recreational uses. Located in the southeast quadrant of the Airport site, this area has an estimate employment capacity of from 250 to 600 employees. It is also expected that this development, along with the planned Twin Oaks Industrial Park immediately east of the Airport will require the widening of Lauzon Parkway, between Division Road and the City Boundary along the east Airport boundary, from two to four lanes.
Detroit Area Access
Another important source of Airport users is the Detroit area. It is estimated that up to 25% of all Airport passengers originate over the border.10 The reasons are threefold; more convenient access and facilities at Windsor compared to Detroit’s Metro Airport, better service to Canadian destinations via Pearson International Airport (Toronto), and air fare advantages on some Windsor and Toronto-based flights. In terms of travel convenience, Windsor is being actively marketed as a convenient short-haul alternative to Metro Airport since downtown Detroit is only 20 minutes by auto from the Windsor Airport, compared to one hour from Metro. Also, as the Windsor/Detroit area’s casino business expands, its associated market area will expand some 600 miles. It is expected that this will add to the Windsor Airport passenger growth, especially on junket-style services to the casinos. Finally, access
10 Based on discussions with Airport Manager Allan Graham, and Development Manager Bill Baker, May, 1997
Stantec 1.48
to the border from Windsor Airport is an important advantage for courier and some air cargo business operators who may be attracted to the Airport.
This cross-border advantage for Windsor air service relies on the City’s major roadway system to provide the convenient ground linkages. These are provided mainly by Huron Church Road and the E.C. Row Expressway from the Ambassador Bridge, and the Ouellette/Dougall/Cabana/Division and Wyandotte/Walker/Division links from the Tunnel. Ensuring adequate capacities and levels of service on these links is essential to the continued marketing and growth of air service at Windsor Airport.
Rural Area Access
Highways 401, 2 and 3, along with the County road system all provide adequate access to and from Windsor Airport from outlying rural areas and communities. In fact, one of the Airport’s main operational advantages is the convenient ground access provided by this rural roadway system. Therefore, it is important that County roads in proximity to the Airport, for example Division Road/County Road 42 which experiences between 10,000 and 12,000 vehicle per day11, remain capable of accommodating Airport traffic. According to Airport planning and development concepts, extension of Jefferson Boulevard south to Division Road (County Road 42) is proposed for improved airport business access.
1.3.8 MARINE PORT ACCESS
As the transfer point of bulk cargo, marine ports within the Study area require convenient access to the major roadway system for truck traffic. The two types of ports requiring this access are the Port of Windsor area off Sandwich Street and Ojibway Parkway, and other marine facilities along the Detroit River/Lake St. Clair. At the Port of Windsor, most bulk products found in this area, for example salt and aggregates, are consumed or originate within the Windsor area. In distributing these products throughout the area, the primary roadway routes to and from the Port area are Russell Street to Huron Church Road via local residential streets such as Detroit Street, and Ojibway Parkway directly to the E.C. Row Expressway and other major arterial roads. Sandwich Street is not a designated truck route, in part because of the
11 ibid
Stantec 1.49
Sandwich Town commercial redevelopment occurring along this arterial road. Port of Windsor officials noted a concern about truck routes and routing in the Port area.12
A local group is proposing the construction of a second bridge crossing of the river to Prospect Avenue in the Port area, with direct access to Ojibway Parkway. However, access on the Detroit side from this proposed bridge to I-75 would involve more complex roadway and land use issues.
There are other minor aggregate marine facilities along the Detroit River/Lake St. Clair shoreline, the two most notably being at Hiram Walker and adjacent to Sandpoint Park off Riverside Drive East. The Sandpoint site allows aggregates to be delivered within the eastern half of the Windsor area, rather than from the Port of Windsor to the west. One current example of this is the need for aggregate delivery to the large Riverside East development areas nearby the Sandpoint site. Of concern is the functional and visual impacts that this truck traffic has on the surrounding residential community, and on Riverside Drive East which does not have the capacity to accommodate heavy truck traffic.
Finally, there are a number of public and private docking facilities along the Detroit River/Lake St. Clair shoreline for pleasure boating. To date, no roadway access issues have been raised regarding these operations, with Riverside Drive East and West serving most of these facilities. A general lack of enough docking facilities to meet current pleasure boating demands has been noted, but is beyond the scope of the WALTS study to address.
1.3.9 TRUCK ROUTES
The current truck routes in Windsor are shown in Figure 1.12. The City of Windsor bylaw states that “when properly worded or marked signs have been erected and are on display, no vehicle having a gross weight of four thousand five hundred kilograms or more shall be operated on any highway in the City of Windsor other than the highways set out in Schedule H”. The exceptions include delivery/receiving, or loading/unloading, provided the trucks use the shortest route between the truck route and the destination. City of Windsor trucks, emergency vehicles, public transit vehicles, coal and oil delivery vehicles, and privately owned commercial vehicles to/from the residence of the owner are also exempt.
12 Based on discussions with Port Manager Dave Cree, May, 1997
Stantec 1.50
There have been twelve bylaw modifications to the truck routes between 1988 and 1996. As a result, there have been deletions affecting twelve roadways, amendments affecting five roads, and seven roadways added to the truck route system. Comparing the truck route system in the 1980 WUTS report, it is noted that the major modifications have been the deletion of truck routes in the downtown area (such as Sandwich Street, Riverside Drive, and parts of Ouellette, Dougall and McDougall), and the addition of roads such as Jefferson, Lauzon Parkway, and in the expanding industrial areas near the E.C. Row Expressway. The expansion of the E.C. Row Expressway to Highway 18 in the west and Highway 2 in the east has provided a major corridor for commercial traffic linking with the provincial highways and the border crossings.
Stantec 1.51
1.4 CROSS-BORDER TRANSPORTATION
1.4.1 CROSS-BORDER
Much of the current information about cross-border traffic at Windsor has been obtained from the recent study entitled Trade and Traffic Across the Eastern US-Canada Border, prepared by Parsons Brinckerhoff Quade & Douglas, Inc. in March 1997 for the Eastern Border Transportation Coalition (EBTC). This study shows that along the US/Canada border, the crossings with the highest number of entries from Canada are the Detroit-Windsor Tunnel, the Ambassador Bridge, and the Peace Bridge. The Tunnel accommodated 4.2 million autos entering the US in 1995, followed by the Bridge with 3.6 million autos. The Bridge also had the busiest commercial crossings (trucks) in North America, followed by the Blue Water Bridge at Sarnia/Port Huron. There are nine (9) major factors attributed to this crossing volume:
1. Change in the Canada/US currency exchange rates;
2. Variations in cross-border prices of key grocery items, including gasoline and cigarettes;
3. The competitiveness of Canadian stores and their hours of service that encouraged Canadian shoppers to visit the US for retail purchases;
4. Changes in Canadian travel patterns, compared to US travel patterns, caused by the falling relative value of the Canadian dollar, and aggressive marketing and pricing by Canadian retailers;
5. Canadian reduction or elimination of duties on a number of higher-cost consumer appliance goods, reducing prices in Canada to a level closer to that seen in US border states;
6. Casino gambling on the Canadian side has caused large increases at Detroit/Windsor crossings in 1995/96;
7. Truck traffic has increased largely due to increases in industrial production in Canada and the US;
Stantec 1.52
8. NAFTA has had a substantial impact on facilitating specialization and cross-border sourcing of components and finished goods in non-automotive industries, and;
9. In both the auto and other industries, continued use of just-in-time inventory shipments, with more frequent shipments of smaller quantities, has lead to increased cross-border traffic.
The study shows that the Ambassador Bridge has historically dominated truck crossing across the Canada/US border. However, the truck traffic growth rate at the Blue Water Bridge in Sarnia has been orders of magnitude higher over the past decade. As a result, the Blue Water Bridge now carries almost half the volume of the Ambassador Bridge, up from only 20% 15 years ago. The study extrapolates this trend into the future, resulting in a forecast showing the toll bridges carrying an equal amount of truck traffic by the year 2015.
The EBTC study concludes with five (5) issues facing the cross-border transportation question:
1. Economic Cost - Can local, regional and national economies afford to pay the large and growing costs resulting from cross-border infrastructure and institutional deficiencies that impact bilateral trade and travel?
2. Institutional Questions - Although the cross border services have improved their efficiency to expedite traffic flows, especially for the frequent user, problems will continue to escalate as trade and traffic volumes continue to grow. This means that more effort is still needed to create greater cross-border efficiencies.
3. Infrastructure - The major border-crossing infrastructure deficiencies are at Detroit-Windsor, and the Niagara areas. This is because of a combination of high volumes and their urban location, often leading to unacceptable levels of congestion and delay.
4. International Trade and Transportation Corridors - The EBTC study concludes that from a user perspective, as opposed to a political perspective, there is as yet no satisfactory definition of international trade corridors on which to base cross-border infrastructure decision-making at Detroit-Windsor.
Stantec 1.53
Stantec 1.54
5. Data Deficiencies - One reason, among others, given as to why it is difficult to define trade corridors on a transportation and economic basis is that sufficient statistical and survey evidence does not exist, mainly because available data is not intended for this purpose.