A7621-011:CRC-Syq.6.29 Page 1 1.0 INTRODUCTION Aluminum cylinders are widely used in different gas and beverage services, under water diving (SCUBA), Fireman breathing (SCBA), medical (O2), beverage (CO2), and industrial gases (toxic and nontoxic). Cylinders made of aluminum alloy 6351-T6 are known to be susceptible to sustained load cracking (SLC) in the neck and shoulder area of the cylinders. Research and Special Programs Administration (RSPA) has been notified of nine SLC related ruptures of DOT-3AL cylinders made out of aluminum alloy 6351-T6 in the past 14 years. Four of the nine ruptures resulted in serious injuries. Investigations conducted by both industry and the Department of Transportation (DOT) have indicated that although as a whole these cylinders are safe, as is the case with any such product some safety issues remain. Research and Special Programs Administration (RSPA) issued several safety advisory notices for high pressure aluminum seamless and aluminum composite hoop-wrapped cylinders made of the 6351-T6 aluminum alloy: “RSPA estimates that approximately seven million cylinders have been manufactured using aluminum alloy 6351-T6. RSPA presently does not know which cylinders among this population have the potential for similar failure. Cylinders made of aluminum alloy 6351-T6 are known to be susceptible to sustained load cracking (SLC) in the neck and shoulder area of the cylinder.” Federal Register: July 26, 1994 DEPARTMENT OF TRANSPORTATION Research and Special Programs Administration Notice No. 94-7 Since issuing these advisory notices further work into the nature of sustained load cracking (SLC) has offered new insight into its causes and effects. However, one key factor in preventing further damage from this type of failure has to date been missing: a reliable method of early detection. Several nondestructive testing (NDT) methods of inspection have been developed, but their efficacy has not been established. In response the RSPA contracted the Nondestructive Testing Information Analysis Center (NTIAC) to quantitatively evaluate three common methods of cylinder inspection: visual testing (VT), eddy current testing (ET), and ultrasonic testing (UT). Conducting an extensive round-robin testing procedure, NTIAC evaluated the performance of each technique in terms of its accuracy and reliability in detecting flaws in the neck and shoulder region of the cylinder. This report is a summary of our findings and concludes with a recommendation to the RSPA on a testing technique and procedure. 2.0 BACKGROUND 2.1 Significance of the Problem Those SCUBA and SCBA compressed gas cylinders made of the 6351 alloy and heat treated to the T-6 temper condition have shown a tendency to develop sustained-load cracking (SLC). While the exact cause and mechanism of SLC is not yet fully understood, it is believed
Transcript
A7621-011:CRC-Syq.6.29Page 1
1.0 INTRODUCTION
Aluminum cylinders are widely used in different gas and beverage services, underwater diving (SCUBA), Fireman breathing (SCBA), medical (O2), beverage (CO2), andindustrial gases (toxic and nontoxic).
Cylinders made of aluminum alloy 6351-T6 are known to be susceptible to sustainedload cracking (SLC) in the neck and shoulder area of the cylinders. Research and SpecialPrograms Administration (RSPA) has been notified of nine SLC related ruptures of DOT-3ALcylinders made out of aluminum alloy 6351-T6 in the past 14 years. Four of the nine rupturesresulted in serious injuries. Investigations conducted by both industry and the Department ofTransportation (DOT) have indicated that although as a whole these cylinders are safe, as is thecase with any such product some safety issues remain. Research and Special ProgramsAdministration (RSPA) issued several safety advisory notices for high pressure aluminumseamless and aluminum composite hoop-wrapped cylinders made of the 6351-T6 aluminumalloy:
“RSPA estimates that approximately seven million cylinders have beenmanufactured using aluminum alloy 6351-T6. RSPA presently does not knowwhich cylinders among this population have the potential for similar failure.Cylinders made of aluminum alloy 6351-T6 are known to be susceptible tosustained load cracking (SLC) in the neck and shoulder area of the cylinder.”
Federal Register: July 26, 1994DEPARTMENT OF TRANSPORTATIONResearch and Special Programs AdministrationNotice No. 94-7
Since issuing these advisory notices further work into the nature of sustained loadcracking (SLC) has offered new insight into its causes and effects. However, one key factor inpreventing further damage from this type of failure has to date been missing: a reliable methodof early detection. Several nondestructive testing (NDT) methods of inspection have beendeveloped, but their efficacy has not been established.
In response the RSPA contracted the Nondestructive Testing Information AnalysisCenter (NTIAC) to quantitatively evaluate three common methods of cylinder inspection:visual testing (VT), eddy current testing (ET), and ultrasonic testing (UT). Conducting anextensive round-robin testing procedure, NTIAC evaluated the performance of each techniquein terms of its accuracy and reliability in detecting flaws in the neck and shoulder region of thecylinder. This report is a summary of our findings and concludes with a recommendation tothe RSPA on a testing technique and procedure.
2.0 BACKGROUND2.1 Significance of the Problem
Those SCUBA and SCBA compressed gas cylinders made of the 6351 alloy and heattreated to the T-6 temper condition have shown a tendency to develop sustained-load cracking(SLC). While the exact cause and mechanism of SLC is not yet fully understood, it is believed
A7621-011:CRC-Syq.6.29Page 2
that the cracks primarily originate from the bottom of the neck in the crown of the cylinder. Thecrack propagates outward both radially and axially, as shown in Figure 2-1. In those cylindersthat are found to contain multiple cracks, the most common configuration is for two cracks todevelop approximately 180° apart from one another. It is thought that the cracks propagateslowly as a form of creep cracking mechanism: originally it was held that the cracks occurredonly in those cylinders with high levels of lead and bismuth, although SLC has been found incylinders with much lower lead levels.
Radial propagationCrack initiation
CrackAxialpropagation
Figure 2-1. Illustration of the Site of Crack Initiation and its Propagationthrough the Cylinder
By far the most common failure mode is in bottle leaking, which occurs when the crackbreaks the outer surface of the cylinder, allowing the compressed gas to escape. In a fewisolated incidents, however, the failure mode was rupture rather than leak.
2.2 Methods of Inspection2.2.1 Visual Testing (VT)
The most commonly-practiced form ofnondestructive inspection in use today isvisual inspection, due primarily to itssimplicity and low cost. Visual testing (VT)typically uses a source of light and a dentalmirror to inspect the neck and shoulders ofthe cylinder. A crack is seen as a thin,“feathery” line that propagates axially up theneck of the bottle, which is distinguishablefrom a scratch in that a scratch is typicallystraighter and brighter. Common practiceacross all the methods of NDT is that anycrack that is seen to cross more than two threads is a severe flaw that warrants scrapping thebottle. Figure 2-2 shows a crack detected during a visual inspection (the contrast of the picturehas been artificially heightened to illustrate the position of the crack).
Figure 2-2. VT Equipment used toVisually Inspect the Compressed Gas
Cylinders for this Project
Reflectionof crack
A7621-011:CRC-Syq.6.29Page 3
Another definition common across the inspection techniques is the definition of a fold inthe bottle. Formed during the initial manufacture of the bottle, a fold can appear as a flawduring an inspection, but are not considered as flaws. As such, the successful inspectiontechnique must take into consideration the existence of folds in its execution.
A7621-011:CRC-Syq.6.29Page 4
2.2.2 Eddy Current Testing (ET)
The second most commonly-practiced method of NDE for SCUBA and SCBAcompressed gas cylinders is eddy current inspection. Several commercial systems are availableon the market today. These systems are becoming more popular with dive shops and othergroups that routinely conduct cylinder inspections, as it is held that ET is a more sensitivemethod of inspection than visual inspection. Eddy current inspections of compressed gascylinders are conducted by threading a plastic probe into the neck of the cylinder: the probecontains an eddy current sensor radially oriented in order to provide the highest level ofsensitivity to the axial propagation of the crack (Figure 2-3).
A typical eddy current systemmeasures the impedance of a sample: inthe presence of a flaw the eddy currentsin the sample are interrupted, causing achange in the complex impedance of thesample at this position. In theSCUBA/SCBA inspection systems, this isdisplayed as a “blip” on a B-scan LEDdisplay. In turning the plastic probethrough a complete revolution (i.e.,threading the probe in or out), a givenflaw’s signal will re-occur at the sameposition: a count of the total number ofsignals for this flaw gives the number ofthreads the flaw crosses. The ET
equipment used for this investigation is shown in Figures 2-4 and 2-5.
2.2.3 Ultrasonic Testing (UT)
This is another inspection method that can be used for SLC inspection of SCUBA/SCBAcylinders. Such systems were prototyped in the past, and are based upon similar designs usedfor inspecting industrial gas cylinders.
The system NTIAC used for this project sends the ultrtasonic shear wves energy aroundthe shoulders of the cylinder, which has the effect that the system is actually “looking” forward(i.e., clockwise) from its transducer position by approximately 90°. By looking at the shoulder,the ultrasonic system has the potential to detect a crack at the earliest stage, since it is lookingprimarily at the position most frequently observed as the site of crack initiation. In contrast,both VT and ET primarily inspect the threads in the neck of the cylinder, although VTinspectors are trained to inspect deeper into the bottle as well. As a side-effect of inspectingfrom the shoulders rather than the neck, UT inspection is not examining threaded neck of thecylinder for the size of a crack as do VT and ET, but rather detect SLC in the shoulder of thecylinder. The UT inspectors must have higher level of training to produce accurate flaw profile.A picture of the UT inspection “arm” is shown in Figure 2-6, and its placement and use on aSCBA bottle is shown in Figure 2-7.
Figure 2-3. Orientation of the Flaw withRespect to the Eddy Currents has a Direct
Bearing on the Detection of the Flaw
A7621-011:CRC-Syq.6.29Page 5
Figure 2-4. Eddy Current Equipment used in the Project. This is one of several systems thatare commercially available for eddy current inspection of thread regions. The authors, the
RSPA and the DOT do not endorse any specific system manufacturer.
Figure 2-5. Closeup of an Eddy Current Probe Threaded onto the Calibration Block
A7621-011:CRC-Syq.6.29Page 6
Figure 2-6. UT Inspection System, Consisting of One Pitch and One Catch Probe Inside aFluid-Filled Wheel
Figure 2-7. Example of a UT Inspection In Progress
A7621-011:CRC-Syq.6.29Page 7
3.0 TEST PROCEDURE3.1 Nondestructive Testing
The original outline of the testing procedure is illustrated in Figure 3-1. To initiate theproject NTIAC arranged to have 51 cylinders1 shipped from Luxfer’s California and NorthCarolina facilities for the test population. These cylinders varied in their age and condition,having been used in the field for some time prior to being “condemned” by an inspector andsent back to Luxfer. The cylinders were to be first inspected via the three methods of NDT, afterwhich destructive testing would be used to gauge their results.
Since the ultimate goal of this research is to evaluate three NDT techniques andrecommend a testing technique that can be used by people in the field, it is of utmostimportance to go beyond the traditional scope of NDT. In many other NDT applications, theequipment and testing is conducted by someone with years of experience and training. In thiscase, however, the NDT method is to be employed by people unfamiliar with NDT as adiscipline, such as a part-time high school student working afternoons in a local dive shop. Assuch, NTIAC and RSPA both recognized the need to explore the dependence of skill on eachinspection technique: an inspector can receive a minimum amount of training before he or sheis deemed fit to practice the technique.
Each inspection technique was thus undertaken by an inspector of one of three skill levels:• Expert (designated as “X”): the inspector is either the system vendor, a
representative of the manufacturing company, or someone with years of experiencein the specific technique.
• Skilled (“S”): the inspector has no experience with the specific inspection techniqueas applied to SCUBA/SCBA cylinders, but is familiar with NDT and other types ofinspection.
• Technician (“T”): although familiar with general laboratory practices, the inspectoris not familiar with NDT or its associated technologies.
Table 3-1 indicates each of the NDT inspections performed during the project, along withtheir designation.
Table 3-1. Nine Different NDT Inspections were Conducted for each of the 51 CylindersSkill LevelNDT TechniqueExpert (X) Skilled (S) Technician (T)
Visual Testing(VT)
VTX VTS VTT
Eddy CurrentTesting (ET)
ETX ETS ETT
Ultrasonic UTX UTS UTT
1 The original contract with RSPA stipulated that at least 50 cylinders were to be acquired.Luxfer had one extra bottle available for this project, and as such while the work plan in Figure3-1 indicates that 50 cylinders were to be inspected the actual total was 51 cylinders.
A7621-011:CRC-Syq.6.29Page 8
Testing (UT)
Each of these inspections followed the same procedure. Each inspector was briefed onthe requirements for their inspection: specifically, to identify all the flaws in each bottle anddetermine a size for each, whether expressed in thread counts (VT and ET) or as small, medium,or large (UT). This departs from the procedure used in the field, in the sense that a single flawover two threads in size is sufficient cause to condemn a bottle. The inspector was walkedthrough a sample inspection by the test coordinator, for the purpose of illustrating the datarecording procedure. Once the inspector indicated they understood the requirements and theprocedure they began the inspection, with periodic check-ins from the test coordinator.
A7621-011:CRC-Syq.6.29Page 9
Acquire 50 bottles
NDT Destructive Tests
Etching MachiningBlind Inspections:
VTETUT
Detection
Flaw Sizing
Size of Flaws
Ability to detect f laws Ability to size flaws
RecommendedNDT Procedure
Figure 3-1. Illustration of the Test Progression Used in the Project
The data recording procedure was as follows. When an inspector found a flaw, the firststep was to use a piece of masking tape to mark on the outside of the bottle the approximate
A7621-011:CRC-Syq.6.29Page 10
angular position of the flaw.1 The inspector was then to make a determination of the size of theflaw, which was done according to the technique:
• A VT inspector visually counted the number of threads the flaw was seen to cross.
• ET inspectors threaded the probe in and out of the neck of the bottle: each time thesystem found the signal represents one crossed thread, and so counting the number of“blips” gives the number of threads the flaw crosses.
• UT inspectors either called the flaw as small, medium, or large (UTX), or recorded thesignal’s duration as the wheel rotates past the flaw (UTS, UTT).
Once this was completed for each flaw found on the bottle, the inspector filled in a datasheet for the inspection. The inspector would choose to simply tabulate their findings on theleft side of the page, including any comments, and/or to visually indicate the flaw positionsusing the representative overhead view of the cylinder on the right. Each data sheet records thetechnique, date, and bottle number, and was signed by the inspector. Once the data sheet hadbeen completed, the inspector took the bottle (with the tape markings still on it) and the datasheet and moved it to the side for later recording.
The compilation of the test data was the responsibility of the test coordinator. Each datasheet recorded by the inspector was compared against the markings left upon the bottle by theinspector. This was done for two reasons: first, to ensure that the angles recorded on the datasheet matched the angles indicated by the tape markings; and second, to act as a method of databackup. In the event of the loss or destruction of the data sheet, the markings on the bottlewould be used to fill out a replacement. This redundancy of data ensured that no inspectionresults were lost. It is also noteworthy that the test coordinator did not participate in any of theinspections, to avoid biasing the results. The test coordinator did participate in the instructionalsessions conducted by system vendors in preparation for writing this report, but otherwise didnot conduct any testing nor shared any preliminary results with the inspectors.
The compiled NDT inspection spreadsheet was used for subsequent analysis. By far themost important factor for inspections of this type is “detectability,” the ability to detect flawsreliably. Since the destructive analysis was to occur after the analysis of the NDT results, andonly on a subset of cylinders, certain assumptions were made as described in the Resultssection. Also important for a method of NDT is its ability to accurately size a flaw, although inthis case flaw sizing is secondary to detectability in that, by current field practices, any flawover 2 threads in size rejects the bottle: field inspectors will typically only size a flaw as far as todetermine whether it is 2 threads or larger and will accept/reject a bottle on this basis. Gaugingan inspection’s flaw sizing ability relies on input from the destructive tests, in that the results ofthe destructive analysis for a given bottle are compared with the flaw size as reported by theNDT inspector. The procedure for destructive analysis is described in the following section.
3.2 Destructive Analysis
1 Each bottle was marked with a 0° reference point prior to the inspections.
A7621-011:CRC-Syq.6.29Page 11
The purpose of the destructive analysis is to provide some quantifiable benchmarkresults for quantitatively determining the performance of each inspector. Two types of analysiswere conducted, each of which is discussed in turn.
EtchingSeveral cylinders were selected from our test population for destructive testing. Criteria
for selecting this subset include• Representing a range of crack sizes, from the very small to the very large;
• Using no more than two cracks per bottle, of which the cracks must lie approximately 180°apart
• Including both SCUBA and SCBA compressed gas cylinders in the study; and
• Using cylinders for which there was widespread agreement on the position of a crack (i.e.,that there was in fact a crack at the position indicated).
Once a visual inspection verified the existence of a crack in the marked position(s) thecylinder head was removed for easier preparation. Each head was immersed separately in asolution of 10% NaOH for approximately 20 minutes, or until upon visual inspection the headswere seen to have been cleaned of debris.
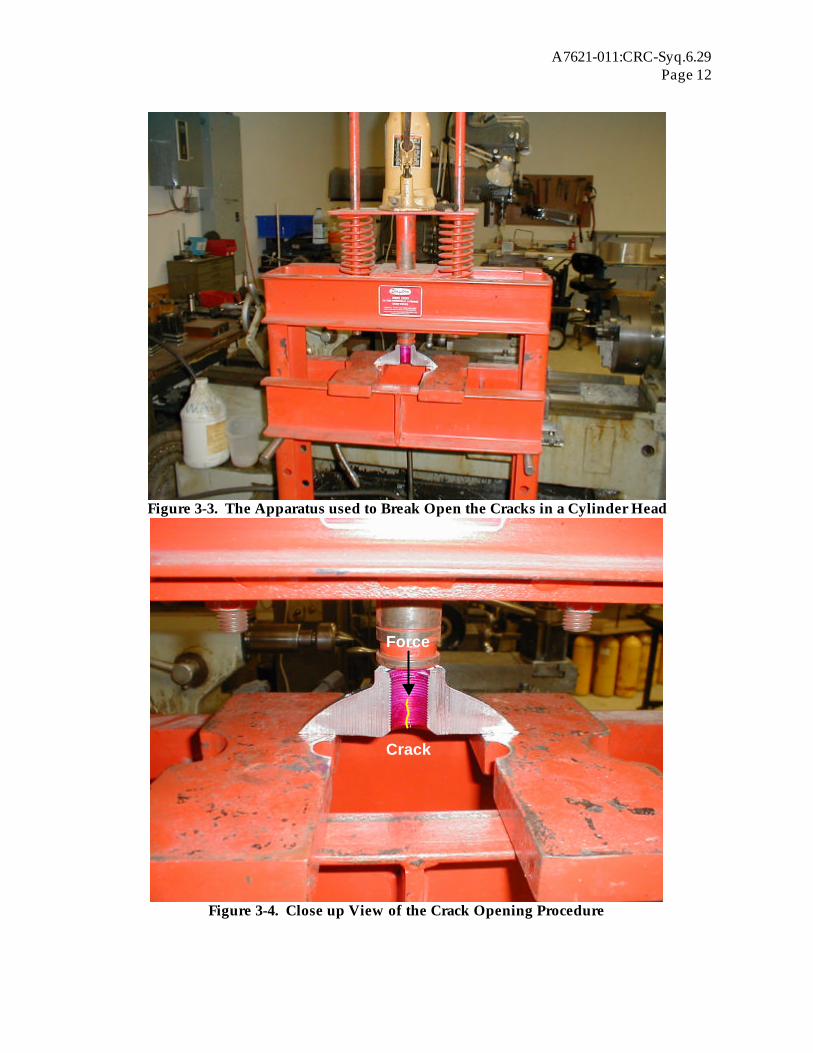
The cleaned and etched cylinder head was then cut in half along a line perpendicular toany existing cracks (Figure 3-2). Each half of the cylinder head thus included a single crack, whichwas broken open by applying a force directly over the crack as shown in Figures 3-3 and 3-4. Priorto this, however, each half was placed in a vacuum chamber for 15-20 minutes, during which timea dye penetrant was drawn inside the crack. The dye thus indicates the extent of the crack afterthe crack faces are broken open.
Crack
Crack
Direction of cut
Figure 3-2. Each Cylinder Head was Cut to Isolate the Cracks of Interest
A7621-011:CRC-Syq.6.29Page 12
Figure 3-3. The Apparatus used to Break Open the Cracks in a Cylinder Head
Figure 3-4. Close up View of the Crack Opening Procedure
Crack
Force
A7621-011:CRC-Syq.6.29Page 13
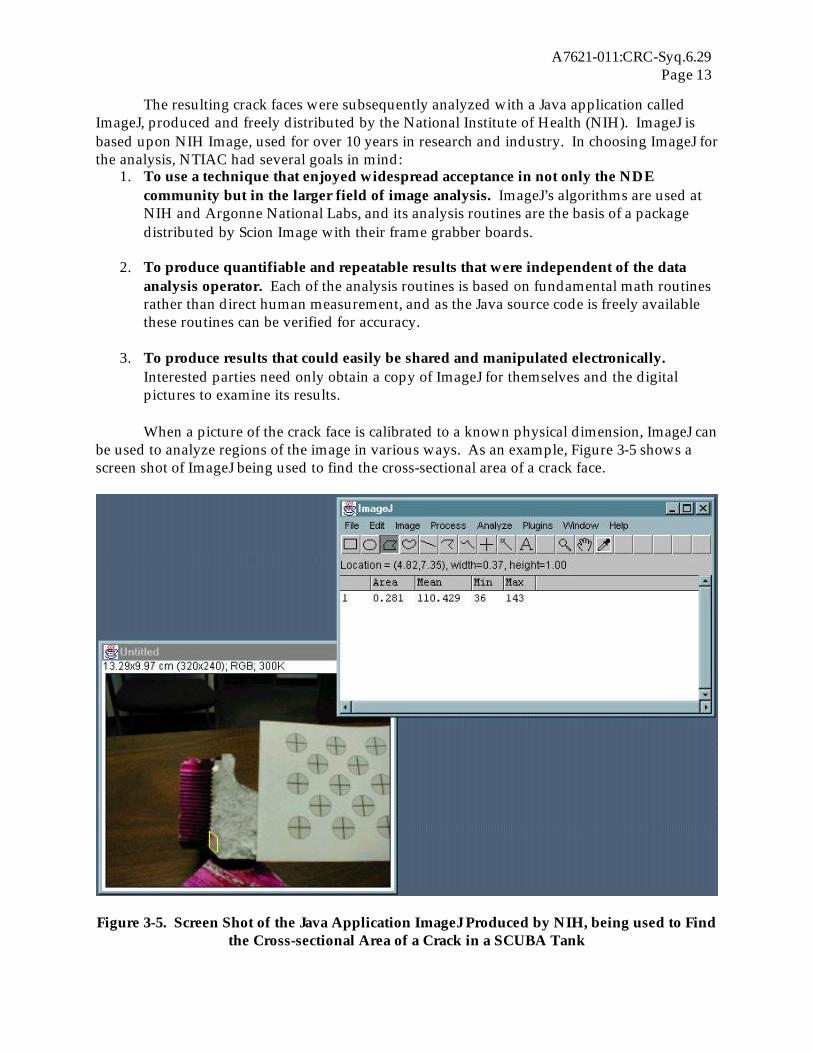
The resulting crack faces were subsequently analyzed with a Java application calledImageJ, produced and freely distributed by the National Institute of Health (NIH). ImageJ isbased upon NIH Image, used for over 10 years in research and industry. In choosing ImageJ forthe analysis, NTIAC had several goals in mind:
1. To use a technique that enjoyed widespread acceptance in not only the NDEcommunity but in the larger field of image analysis. ImageJ’s algorithms are used atNIH and Argonne National Labs, and its analysis routines are the basis of a packagedistributed by Scion Image with their frame grabber boards.
2. To produce quantifiable and repeatable results that were independent of the dataanalysis operator. Each of the analysis routines is based on fundamental math routinesrather than direct human measurement, and as the Java source code is freely availablethese routines can be verified for accuracy.
3. To produce results that could easily be shared and manipulated electronically.Interested parties need only obtain a copy of ImageJ for themselves and the digitalpictures to examine its results.
When a picture of the crack face is calibrated to a known physical dimension, ImageJ canbe used to analyze regions of the image in various ways. As an example, Figure 3-5 shows ascreen shot of ImageJ being used to find the cross-sectional area of a crack face.
Figure 3-5. Screen Shot of the Java Application ImageJ Produced by NIH, being used to Findthe Cross-sectional Area of a Crack in a SCUBA Tank
A7621-011:CRC-Syq.6.29Page 14
In each of the pictures, a grid pattern was included to assist in calibration within ImageJ.Each of the circles seen in the crack image in Figure 3-5 is of a known diameter of 1.00centimeters. The calibration procedure is then to measure the diameter of a circle in thepicture’s horizontal and the vertical directions in order to correct for the picture’s aspect ratio.The extent of the crack was determined visually, but for purposes of verifying repeatability, theextent of the crack face shown in Figure 3-6 was determined by additionally plotting a grayscaleprofile of the crack. The crack’s deepest point of penetration into the aluminum was measuredvisually in ImageJ at approximately 0.50 centimeters: the profile plot of Figure 3-6 estimatesthis extent at 0.48 centimeters. Thus, visually determining the extent of the crack was seen toagree quite well with the alternative procedure.
The pictures of each crack face were taken with a standard digital camera. Each facewas arranged so as to provide maximum contrast between the crack face and the virginaluminum. In the case of a wide crack, this task was made simpler because of the greater depthof penetration of the dye. For a tight crack, however, the dye was not able to penetrate asdeeply into the crack, and as a result it becomes necessary to pay more attention to the ambientlighting while photographing the crack face. In all cases, it was noted that a certain degree ofclarity was lost in going from the actual object to a digital photograph, and again in printing ahard copy of the photo, and as such NTIAC will ship the actual cracks with its final report to theRSPA.
Figure 3-6. Measuring the Extent of a Crack. The highlighted region shows the approximateextent of the crack along the line in the upper left image.
A7621-011:CRC-Syq.6.29Page 15
MachiningAs part of the destructive analysis undertaken during this effort to quantitatively evaluate thevarious methods of nondestructive testing, NTIAC contracted Bryant-Lee Associates of SanAntonio, Texas to conduct electrical discharge machining (EDM) tests of two cylinders, P4205(SCUBA) and T94863 (SCBA). Their full report is presented as an appendix, but is summarizedboth here and under the Results section of this report for convenience.
The following procedure was used to section and measure the samples:1. Before the samples were EDM-machined, the samples were red-dye penetrant inspected to
determine the approximate crack length along the bore and the depth into the cylinder.Figure 3-7 shows the cracks identified by inspection. Sample A had a crack visuallyobserved about 0.31-inch from the reference surface (shown in Figure 3-8) and about 0.94-inch radial crack from the ID bore. Sample B had a visible crack that was about 1.1-inchfrom the reference surface and 0.63-inch radial crack from the ID bore.
2. The yellow paint on the cylinders, shown in Figure 3-9, was stripped from the OD surface.
3. The two cylinder samples, T94863 (Sample A) and P4205 (Sample B), were EDM-machined. The EDM setup is shown in Figure 3-10.
4. The EDM-machined wafers were a nominal 0.100-inch thick face-to-face (about 0.85-inchwafer thickness and 0.015-inch EDM cut width).
5. EDM wafers were parallel to reference surface, shown in Figure 3-8.
6. Each wafer was vibroengraved with a wafer number; for example, A1, A2, B1, B2, etc.Cylinder T94863 had 14 EDM wafers and Cylinder P4205 had 20 wafers.
7. BLA measured and recorded the distance from reference surface for each EDM wafer.
8. To examine the crack tip, if present, each wafer was manually sanded and polished ondiamond polishing wheels to a 1-micron finish.
9. The as-polished position was estimated by adding the amount of metal removed to theEDM wafer position.
10. Each wafer was examined for a crack using a stereomicroscope. The crack tip wasdetermined by examining the wafer using a metallograph at 50x.
11. BLA determined the crack depth by measuring the distance from the ID bore (thread crest)to the crack tip. For wafers that exceeded the borehole, the crack depth was measuredfrom the ID surface, for example; wafers A11 and B16.
A7621-011:CRC-Syq.6.29Page 16
(A)
(B)
Figure 3-7. Photographs of the Red-Dye Penetrant Indication for (A) Cylinder SamplesT94863 and (B) P4205. Arrows indicate cracks.
A7621-011:CRC-Syq.6.29Page 17
Figure 3-8. Sketch Showing how the EDM Wafers were Taken
A7621-011:CRC-Syq.6.29Page 18
(A)
(B)
Figure 3-9. Photographs of Cylinder Sample T94863 and P4205 Showing a) the OD Surfaceand b) the ID Surface
A7621-011:CRC-Syq.6.29Page 19
(A)
(B)Figure 3-10. EDM Set-Up for Cylinder Sample
A7621-011:CRC-Syq.6.29Page 20
4.0 RESULTS4.1 Detectability
The NDE data were analyzed by making two key assumptions:1. Any flaw that was detected by 7 or more inspectors was real; and
2. Any flaw that was detected by 3 or fewer inspectors was not real.
An inspector was said to have detected the flaw if the angular position he or sherecorded for the flaw was within a pre-determined angular range of the mean angular positionof the flaw.
Results are summarized in Tables 4-1 and 4-2. To gauge the performance of eachinspector it is easiest to look to the far right column, the Normalized or Reliability Index2. Thisnumber represents the number of false calls (whether a false negative or a false positive) that aninspector would make on 100 inspections. The results of the VE testing, a combination of visualand eddy current, are obtained by taking the best results of the VT and ET for each column,which reflects the proposed system of conducting one test and confirming with the other. Ascan be seen, VET ranked highest amongst all the inspections.
To compare techniques across skill levels and vice versa, two extra sets of data wereproduced, representing averages for the particular skill level or technique in question. Resultswere within expected parameters.
Table 4-1. Summary of Results Using an Angular Width of ±20°
FalseCalled % Missed % Rank Positives % Rank Index Rank
Real Flaws: Total 77 False Calls: Total 95False Call
Normalized Index
DiscussionIn general terms, the eddy current system is designed to find any and all anomalies in a
cylinder: this is borne out by the data, which show that while ET has the lowest incidence ofmissed real flaws it also had the second highest incidence of false positives. In contrast, VT hadthe second lowest incidence of missed flaws and the lowest incidence of false positives, whileUT missed the most real flaws and had the highest rate of false positives. This is likely due tothe fact that the UT system requires trained inspector to understand the entry angle of the shearwaves and usage of the UT system in order to determine the size and position of a flaw. Theactual position of a flaw must be calculated in accordance skip distances of shear waves for thecurved surface (shoulder of the cylinder).
The detectability study suggests that the best option in terms of an approach toinspecting these cylinders is in the “VE” technique, in which eddy current testing and visualtesting are combined in a single procedure. It was observed that ET followed by VT producesthe desirability effect of high detection rates with both few false positives and few falsenegatives.
4.2 Flaw Sizing (Comparison with Etching Procedure)
The cylinders chosen for analysis are summarized in Table 4-3. Crack positions andsizes are reported as the mean values indicated for those NDE techniques that detected thecrack. It is difficult to compare flaw positions reported by NDE with those found during thedestructive analysis since the destructive analysis effectively assumes the same flaw positions.It can be said, however, that in neither the etching procedure nor in the machining procedureconducted by Bryant-lee was a flaw not found during the destructive analysis. These results areto be compared with the results of the etching analysis conducted by NTIAC to providequantifiable information about the size of the flaws in this subset of cylinders.
A7621-011:CRC-Syq.6.29Page 22
Table 4-3. Cylinders Chosen for the Flaw Sizing Analysis
Bottle Number Bottle TypeMean Crack Positions[Degrees fromReference Point]
Figures 4-1 to 4-12 graphically display the results of this analysis as summarized inTable 4-4, both in terms of the actual inspections and in terms of skill level and technique. Eachinspection technique is a “spoke” on the wheel: a red data point indicates a negative sizedifference (i.e., the inspection reported a smaller flaw than what was measured destructively), agreen data point is a positive size difference (the inspection reported a larger flaw than themeasured). Each circle out from the center of the figure represents a 10% difference from theactual measured flaw size: a red data point on the third circle from the center on the VTX spokethus indicates that for this particular bottle the expert visual inspection returned a flaw size thatwas 30% smaller than the actual measured flaw size.
Table 4-4 introduces the Mean Absolute Discrepancy (MAD) as a measure of thetechnique’s success in sizing a crack. The MAD score is the absolute value of the averagediscrepancy between the reported flaw size and the actual flaw size: a MAD of 25% means thaton average the technique will report a flaw that is 25% off (larger or smaller than) of the actualsize as determined via destructive analysis.
A7621-011:CRC-Syq.6.29Page 23
Table 4-4. Summary of the Flaw Sizing Study
In 83% of the samples, both the average and median absolute error in thread count was one or two threads regardless of the totalcrack length. Similarly, 83% of average flaw lengths were undersized.
A7621-011:CRC-Syq.6.29Page 24
Figure 4-1. Reported Flaw Size for the Crack in SCUBA Bottle P157756 for Each Inspection
Figure 4-2. Average Flaw Sizes for the Crack in P157756 for Technique and Skill Level
A7621-011:CRC-Syq.6.29Page 25
Figure 4-3. Reported Flaw Size for the Crack in SCUBA Bottle P16297 for Each Inspection
Figure 4-4. Average Flaw Sizes for the Crack in P16297 for Technique and Skill Level
A7621-011:CRC-Syq.6.29Page 26
Figure 4-5. Reported Flaw Size for the First Crack in SCUBA Bottle P101050 for EachInspection
Figure 4-6. Average Flaw Sizes for the First Crack in P101050 for Technique and Skill Level
A7621-011:CRC-Syq.6.29Page 27
Figure 4-7. Reported Flaw Size for the Second Crack in SCUBA Bottle P101050 For EachInspection
Figure 4-8. Average Flaw Sizes for the Second Crack in P101050 for Technique and SkillLevel
A7621-011:CRC-Syq.6.29Page 28
Figure 4-9. Reported Flaw Size for the First Crack in SCBA Bottle T58636 for Each Inspection
Figure 4-10. Average Flaw Sizes for the First Crack in T58636 for Technique and Skill Level
A7621-011:CRC-Syq.6.29Page 29
Figure 4-11. Reported Flaw Size for the Second Crack in SCBA Bottle T58636 for EachInspection
Figure 4-12. Average Flaw Sizes for the Second Crack in T58636 for Technique and SkillLevel
A7621-011:CRC-Syq.6.29Page 30
VTX
ETX
UTXVTS
ETS
UTS
VTT
ETT
UTTVETX
VETS
VETT
58.09%
Figure 4-13. Mean Absolute Discrepancy (MAD) Results by Inspection
ET
UTT
S
X VT
Figure 4-14. Mean Absolute Discrepancy (MAD) Results by Technique and Skill Level
Discussion
A7621-011:CRC-Syq.6.29Page 31
Little overall difference in terms of sizing ability can be seen between the inspectiontechniques: ET, VT, and VET all have a MAD of roughly 25%. Of the three, ET appears to holdthe most promise in terms of accurate sizing, but again this difference is very slight: on theorder of 1%.
Ultrasonic testing (UT) finished last with a MAD of approximately 35%. As UT does notuse the same manner of counting threads in returning a flaw size, it is worthwhile to explore theprocedure used to obtain a thread count from UT data. For each flaw call, an average threadsize was determined by taking the mean of the flaw sizes reported by all the visual and eddycurrent testers. Similarly, for the same flaw, the mean of the ultrasonic signal durations wastaken. In both cases, the standard deviation from the mean was also calculated.
Based on this data, a subset was taken that represented the highest level of correlationfor the mean flaw size. Quantitatively, this was done by using only those data points for whichthe uncertainty in the mean flaw size was 20% or lower. Using this subset, a plot of the UTduration call versus the ET/VT thread call was produced (Figure 4-15).
Based upon this plot, a trendline was produced that most closely approximated the data.This line is then used as the translation between duration and thread size, and was found to beof the form 7704.20041.00274.00006.0 23 +−+−= xxxy , in which x is the flaw size in signalduration reported by the UT inspector, and y is the corresponding flaw size in threads for thesame flaw. Since the other methods do not count fractions of threads, in the final stage ofcalibration y is taken as an integer.
The UTX inspection (ultrasonic testing conducted by the system vendor) did not employa duration call but rather the inspector opted to record a flaw as small, medium, or large. Aquick tally of the detected real flaws indicated the following size ranges:
• A small flaw was between 2 to 5 threads.
• A medium-sized flaw was between 6-9 threads.
• A large flaw was over 10 threads.
The convention used for the sizing study was to label a small flaw as 4 threads, amedium as 7, and a large as 10 threads. This introduces a certain level of discrepancy into theanalysis, but these numbers were chosen both because they represent the middle of theirrespective size ranges and because they agreed most closely with experimental data.
It is noteworthy that the accuracy in determining a flaw size does not directly correlatewith the axial length (i.e., number of crossed threads) of a flaw: in the above figures, a bluearrow signifies a “direct hit,” in which the technique correctly gauged the size of the flaw.Some of the cracks, having an axial length of only three threads, were nonetheless correctlysized by more than one inspector. This is likely a reflection of the width of the crack, i.e., howtightly the crack faces met.
In inspections of SCUBA/SCBA cylinders it is common practice to quote an aspect ratiowhen describing SLC features. In Table 4-5 the aspect ratios of some of the cracks are
A7621-011:CRC-Syq.6.29Page 32
calculated, where the aspect ratio is taken as width:length. As can be seen from Table 4-5, thecracks were quite varied in terms of their geometries. In addition, one particular bottle brokenopen to demonstrate the etching process was later found to have an aspect ratio of 3.00:1.
The results of Bryant-Lee Associates’ EDM analysis of the two cylinders is presented infull in their attached report and is summarized here for convenience.
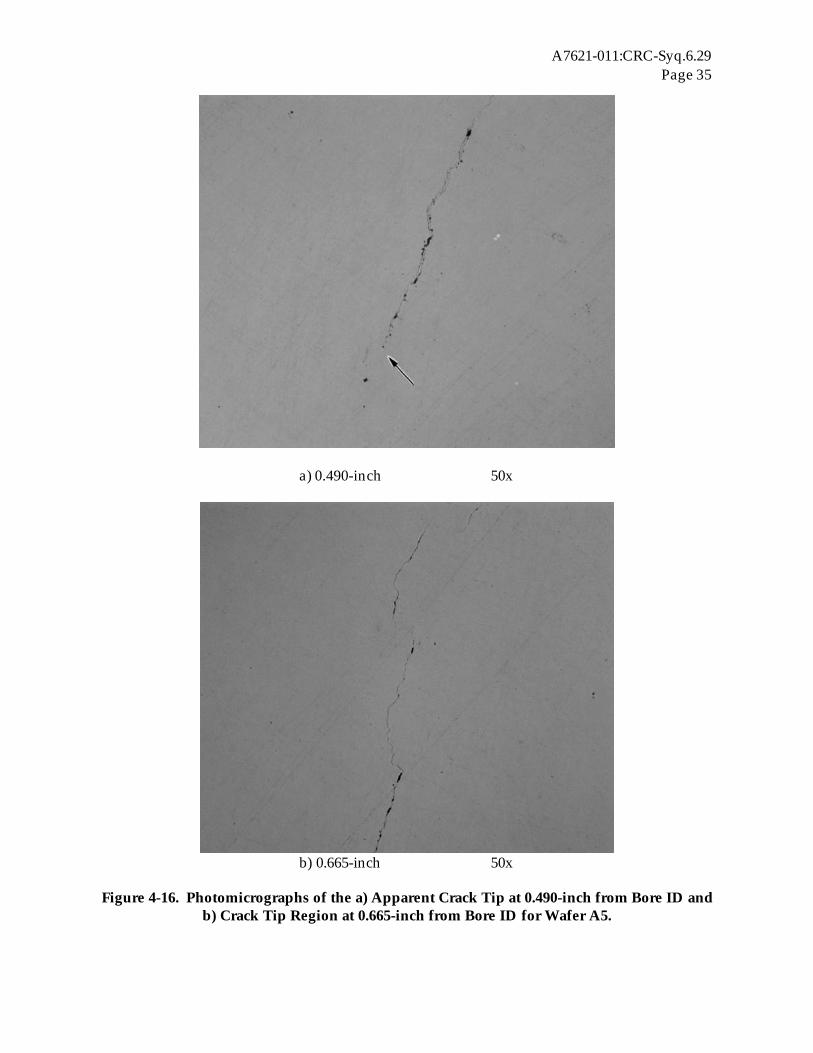
BLA’s determination of crack depths is found in Tables 4-6 and 4-7 for T94863 andP4205, respectively. Columns six and seven define the crack position and crack depth.BLA observed that the actual crack tip sometimes exceeded the observed continuous crack atlow magnifications. On some wafers, such as wafer A5, the continuous crack stopped at about0.490-inch deep. However, this was not the crack tip. The crack tip was actually at 0.711-inchdeep. Discontinuous, tight cracks extended beyond the continuous crack. Figure 4-16 showsthe apparent crack tip at 0.490-inch deep and discontinuous cracking at 0.665-inch deep.
Table 4-6. Wafer Location and Crack Depth for T94863
Figure 4-16. Photomicrographs of the a) Apparent Crack Tip at 0.490-inch from Bore ID andb) Crack Tip Region at 0.665-inch from Bore ID for Wafer A5.
A7621-011:CRC-Syq.6.29Page 36
From Table 4-6 it can be seen that the crack in SCBA bottle T94863 begins 0.149” fromthe reference surface, which actually puts the crack above the first thread of the bottle. Anaccurate assessment of the flaw size would then put the crack as being 14 threads or larger:Table 4-8 lists the actual flaw sizes as reported by the inspectors. Similar analysis for P4205gives a thread count of approximately 13 threads, and the actual results from the NDEinspections are presented in Table 4-9.
Table 4-8. Reported Flaw Size for the Flaw in SCBA Bottle T94863, for Which the ActualFlaw Size is Approximately 14 Threads
As can be seen, there exists a wide variance between the reported flaw sizes frominspector to inspector. This can perhaps be attributed to the geometry of the flaw (i.e. how“tight” the crack faces are, etc.), and also to operator error due to fatigue, and should perhaps beconsidered as a future research goal to study in greater detail.
5.0 CONCLUSIONS AND RECOMMENDATIONS
NTIAC’s investigation into the nondestructive inspection of aluminum gas cylindersfollowed this procedure:
A7621-011:CRC-Syq.6.29Page 37
1. Fifty-one (51) cylinders were nondestructively inspected via visual, eddy current, andultrasonic testing for sustained load cracking (SLC). Each technique was employed bythree inspectors of three different skill levels: expert, NDE specialist, and technician.The inspections were tallied and recorded by the test coordinator.
2. A subset of these fifty-one cylinders were set aside for destructive analysis. Twomethods of destructive analysis were used: etching, in which the cracks are forced openmechanically after having been exposed to a dyed penetrant; and EDM analysis, inwhich successive layers of the cylinder are machined away to arrive at the actual depthof the crack.
3. The results of the NDE phase of the project were analyzed for two factors: the ability todetect cracks and the ability to size cracks. Each inspector was ranked according tothese measurements by their Reliability Index (RI), the number of false calls an inspectorwould make per 100 flaws; and by their Mean Absolute Discrepancy (MAD), whichmeasures the absolute discrepancy between an inspector’s flaw size estimation and theactual flaw size as determined by destructive analysis.
The results of this investigation can be summarized as follows:• In most cases, an inspection technique exhibited either a good RI or MAD but not both,
reflective of the design and nature of the inspection technique. The best inspectiontechnique therefore is to combine two inspection techniques into a single procedure asexplained below.
• The level of skill of an inspector is a crucial factor in terms of both the RI and MAD ofthe inspection, but the importance of skill varied between the three techniques. Theultrasonic equipment was seen to have the highest degree of dependence upon skilllevel, in that only the system vendor’s representative was able to perform at an adequatelevel.
• Of the two measures of an inspector’s performance, the Reliability Index (RI) is the moreimportant. In practice an inspector is not interested in the extent of a flaw other thandetermining its existence: a bottle with a flaw found to be 2 threads in size isautomatically rejected without further investigation.
Based upon the results compiled by NTIAC as part of this project, our recommendationis to adopt the combined visual and eddy current testing (designated VET) as the standard forinspection of aluminum gas cylinders. Figure 5-1 provides a graphical summary of the overallresults of the project; Figure 5-2 illustrates the averages across technique and skill levelrespectively.
Combination VET inspection is conducted by first inspecting the cylinder with the eddycurrent system, then by visual testing. This order is important since on average eddy currenttesting has the lowest rate of false negatives, about half the rate of visual testing. At the sametime, however, eddy current testing also has a much higher rate of false positives (i.e., detectinga non-existent flaw), which is improved dramatically by confirming with visual testing. Theprocedure is then: if eddy current testing indicates a flaw, the user then removes the eddycurrent system from the cylinder and attempts to confirm the flaw visually. If the flaw is notvisually detected, it is deemed to be a false positive on the part of the eddy current system andso the cylinder is not rejected based on this false positive.
A7621-011:CRC-Syq.6.29Page 38
0.00
10.00
20.00
30.00
40.00
50.00
60.00
70.00
0 5 10 15 20 25 30
Reliability Index (RI)
Mea
n A
bso
lute
Dis
crep
ancy
(M
AD
) [%
]
VETX VTX
VETS
ETS
UTX
VTS
ETX
VETT
VTT
UTS
UTT
ETT
Figure 5-1. Summary of the Test Results, Plotting Each Technique’s Mean AbsoluteDiscrepancy (MAD) Against it’s Reliability Index (RI). An ideal technique would be plotted
at the origin (0,0), representing a technique that has no false calls and that perfectly sizesevery flaw it detects.
Wor
se
Better
A7621-011:CRC-Syq.6.29Page 39
0.00
5.00
10.00
15.00
20.00
25.00
30.00
35.00
40.00
0 5 10 15 20 25
Reliability Index (RI)
Mea
n A
bso
lute
Dis
crep
ancy
(M
AD
) [%
]
By TechniqueBy Skill Level
VET VTET
UT
Expert (X)
Skilled (S) Technician (T)
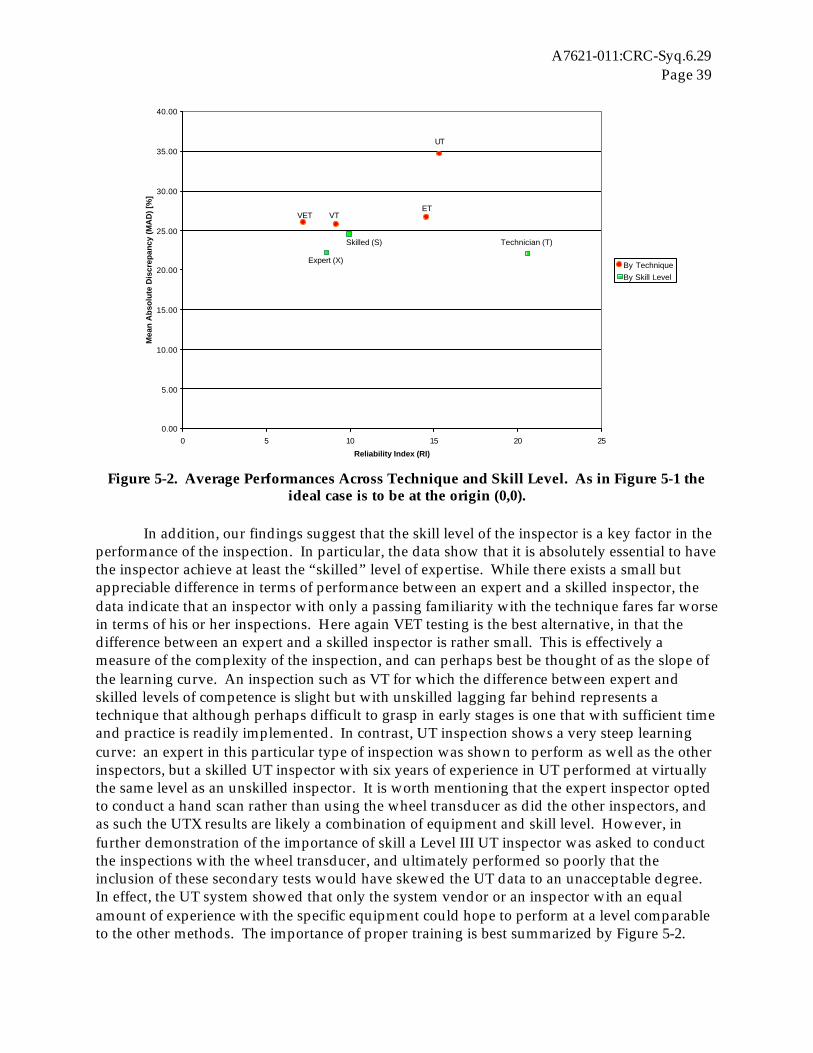
Figure 5-2. Average Performances Across Technique and Skill Level. As in Figure 5-1 theideal case is to be at the origin (0,0).
In addition, our findings suggest that the skill level of the inspector is a key factor in theperformance of the inspection. In particular, the data show that it is absolutely essential to havethe inspector achieve at least the “skilled” level of expertise. While there exists a small butappreciable difference in terms of performance between an expert and a skilled inspector, thedata indicate that an inspector with only a passing familiarity with the technique fares far worsein terms of his or her inspections. Here again VET testing is the best alternative, in that thedifference between an expert and a skilled inspector is rather small. This is effectively ameasure of the complexity of the inspection, and can perhaps best be thought of as the slope ofthe learning curve. An inspection such as VT for which the difference between expert andskilled levels of competence is slight but with unskilled lagging far behind represents atechnique that although perhaps difficult to grasp in early stages is one that with sufficient timeand practice is readily implemented. In contrast, UT inspection shows a very steep learningcurve: an expert in this particular type of inspection was shown to perform as well as the otherinspectors, but a skilled UT inspector with six years of experience in UT performed at virtuallythe same level as an unskilled inspector. It is worth mentioning that the expert inspector optedto conduct a hand scan rather than using the wheel transducer as did the other inspectors, andas such the UTX results are likely a combination of equipment and skill level. However, infurther demonstration of the importance of skill a Level III UT inspector was asked to conductthe inspections with the wheel transducer, and ultimately performed so poorly that theinclusion of these secondary tests would have skewed the UT data to an unacceptable degree.In effect, the UT system showed that only the system vendor or an inspector with an equalamount of experience with the specific equipment could hope to perform at a level comparableto the other methods. The importance of proper training is best summarized by Figure 5-2.
A7621-011:CRC-Syq.6.29Page 40
By far the greatest spread in terms of performance across skill level is shown in eddycurrent testing, with a RI∆ of approximately 10 between each skill level (Figure 5-1). It isinteresting to note that the skilled inspector actually performed better than the expert inspectorin terms of RI, which can be attributed to the expert attempting to not miss any flaws, whichresulted in a much higher level of false negatives. In addition, both the expert and thetechnician eddy current inspectors expressed some difficulty in locating the last thread in acylinder: it is conceivable that some of the flaws reported by the expert and technician wereactually indications that the probe had left the threaded region of the neck. In any case, thedifference in skill levels serves to emphasize the importance of proper training for eddy currenttesting.
To summarize, the Nondestructive Testing Information Analysis Center recommendscombined visual and eddy current testing (VET) for these reasons:• In the field it is ultimately more important to find a flaw than to accurately size it. The VET
technique had the best Reliability Index (RI) at 7.37, meaning that for every 100 inspectionan average of 7.37 false calls will be made. In contrast, the second best technique was VT,which would make an average of 9.11 false calls per 100 inspections, which roughlycorresponds to two additional cylinders per 100 inspected that are properly accepted orcondemned.
• In terms of the secondary issue of flaw sizing, the VET technique ranks behind only VT witha Mean Absolute Discrepancy (MAD) of 26.09%, meaning that on average the flaw size VETreports is 26.09% larger or smaller than the actual flaw size, which is only slightly betterthan the MAD of VT of 25.85%.
• It does not require that the inspector be an expert in the technique, but rather that he or shebe trained sufficiently to be described as “skilled.”


![Mr. Heldman’s Apparatus, Quantitatively Horological and Otherwise/HSN/HSN...Mr. Heldman’s Apparatus, Quantitatively In a previous Horological Science Newsletter, [2007-5], I reported](https://static.documents.pub/doc/80x56/5f40b413bf9ef16185449b76/mr-heldmanas-apparatus-horological-and-otherwisehsnhsn-mr-heldmanas.jpg)


