50
1 0 Population Dynamics
| Date post: | 18-Dec-2015 |
| Category: |
Documents |
| Upload: | anastasia-barrett |
| View: | 233 times |
| Download: | 3 times |
10Population Dynamics
10 Population Dynamics
• Case Study: A Sea in Trouble
• Patterns of Population Growth
• Delayed Density Dependence
• Population Extinction
• Metapopulations
• Case Study Revisited
• Connections in Nature: From Bottom to Top, and Back Again

Introduction
Populations can change in size as a result of four processes: Birth, death, immigration, and emigration.
Nt = Population size at time tB = Number of birthsD = Number of deathsI = Number of immigrantsE = Number of emigrants
EIDBNN tt 1
Patterns of Population Growth
These four patterns of population growth are not mutually exclusive, and a single population can experience each of them at different points in time.
Concept 10.1: Populations exhibit a wide range of growth patterns, including exponential growth, logistic growth, fluctuations, and regular cycles.

Figure 10.3 Colonizing the New World
Patterns of Population Growth
Species such as the cattle egret typically colonize new geographic regions by long-distance or jump dispersal events.
Then, local populations expand by short-distance dispersal events.

Figure 10.4 Population Growth Can Resemble a Logistic Curve

Patterns of Population Growth
In the logistic equation
K is assumed to be constant. K is the population size for which birth and death rates are equal.
K
NrN
dt
dN1

Patterns of Population Growth
For K to be a constant, birth rates and death rates must be constant over time at any given density.
This rarely happens in nature. Birth and death rates do vary over time, thus we expect carrying capacity to fluctuate.

Figure 10.5 Why We Expect Carrying Capacity to Fluctuate

Figure 10.6 Population Fluctuations

Patterns of Population Growth
For some populations, fluctuations can be large.
Populations may explode, causing a population outbreak.
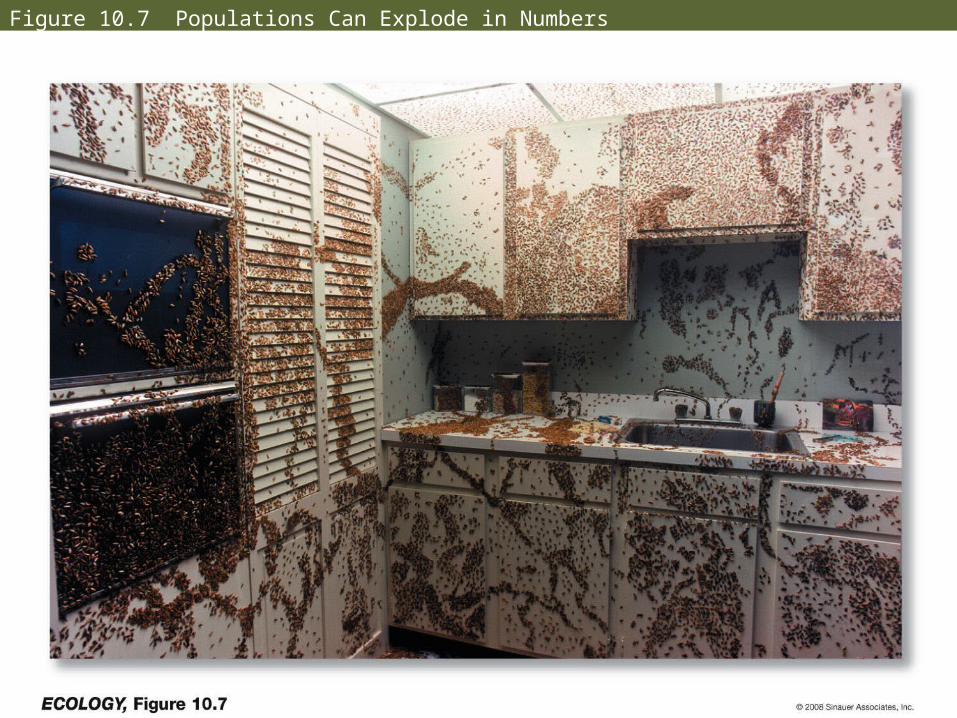
Figure 10.7 Populations Can Explode in Numbers

Patterns of Population Growth
Population Cycles
Some populations have alternating periods of high and low abundance at regular intervals.
Populations of small rodents such as lemmings and voles typically reach a peak every 3–5 years.
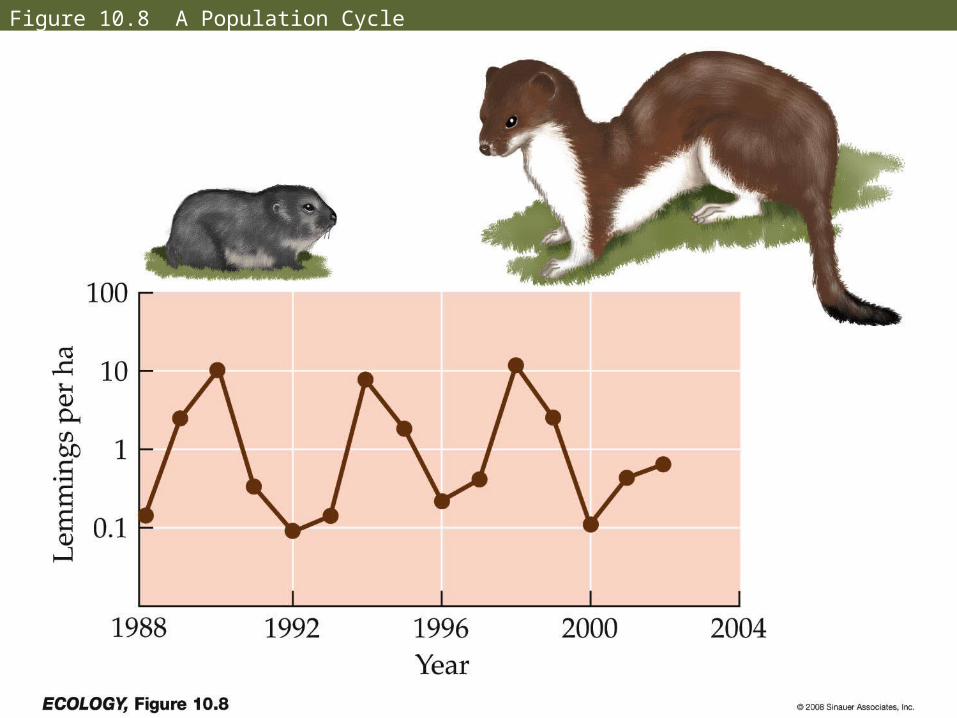
Figure 10.8 A Population Cycle

Patterns of Population Growth
In other studies, predator removal had no effect on population cycles.
Factors that drive population cycles may vary from place to place, and with different species.

Delayed Density Dependence
The effects of population density often have a lag time or delay.
Commonly, the number of individuals born in a given time period is influenced by population densities that were present several time periods ago.
Concept 10.2: Delayed density dependence can cause populations to fluctuate in size.
Delayed Density Dependence
Delayed density dependence: Delays in the effect that density has on population size.
Delayed density dependence can contribute to population fluctuations.

Delayed Density Dependence
The logistic equation can be modified to include time lags:
N(t-τ) = population size at time t-τ in the past.
K
tNrN
dt
dN )(1

Delayed Density Dependence
The occurrence of fluctuations depends on the values of r and τ (time lag = tau).
Robert May (1976) found that when rτ is small (0 < rτ < 0.368), no fluctuation results.
At intermediate levels, (0.368 < rτ < 1.57), damped oscillations result.

Figure 10.9 Logistic Growth Curves with Delayed Density Dependence

Figure 10.10 A Nicholson’s Blowflies

Figure 10.10 B Nicholson’s Blowflies

Population Extinction
Many factors can drive populations to extinction:
Predictable (deterministic) factors, as well as fluctuation in population growth rate, population size, and chance events.
Concept 10.3: The risk of extinction increases greatly in small populations.

Figure 10.11 Fluctuations Can Drive Small Populations Extinct
Population Extinction
Variation in λ in the simulations was determined by the standard deviation (σ) of the growth rate, which was set to 0.4.

Population Extinction
When variable environmental conditions result in large fluctuations in a population’s growth rate, the risk of extinction of the population increases.
Small populations are at greatest risk.

Figure 10.12 Extinction in Small Populations (Part 1)

Figure 10.12 Extinction in Small Populations (Part 2)

Population Extinction
Genetic drift—chance events influence which alleles are passed on to the next generation.

Population Extinction
Small populations are vulnerable to the effects of genetic drift for three reasons:
1. Loss of genetic variability reduces the ability of a population to respond to future environmental change.
2. Genetic drift can cause harmful alleles to occur at high frequencies.
Population Extinction
3. Small populations show a high frequency of inbreeding (mating between related individuals).
Inbreeding tends to increase the frequency of homozygotes, including those that have two copies of a harmful allele, which can lead to reduced reproductive success.

Figure 10.13 A Plague of Flies

Population Extinction
Demographic stochasticity—chance events related to the survival and reproduction of individuals.
For example, in a population of 10 individuals, if a storm wipes out 6, the 40% survival rate may be much lower than the rate predicted on average for that species.

Population Extinction
Allee effects—population growth rate decreases as population density decreases; individuals have difficulty finding mates at low population densities.
In small populations, Allee effects can cause the population growth rate to drop, which causes the population size to decrease even further.

Population Extinction
Environmental stochasticity—unpredictable changes in the environment.
Environmental variation that results in population fluctuation is more likely to cause extinction when the population size is small.

Figure 10.15 Environmental Stochasticity and Population Size

Metapopulations
For many species, areas of suitable habitat exist as a series of favorable sites that are spatially isolated from one another.
Concept 10.4: Many species have a metapopulation structure in which sets of spatially isolated populations are linked by dispersal.

Metapopulations
Metapopulations—spatially isolated populations that are linked by the dispersal of individuals or gametes.
Metapopulations are characterized by repeated extinctions and colonizations.

Figure 10.16 The Metapopulation Concept
Metapopulations
Populations of some species are prone to extinction for two reasons:
1. The landscapes they live in are patchy (making dispersal between populations difficult).
2. Environmental conditions often change in a rapid and unpredictable manner.

Metapopulations
But the species persists because the metapopulation includes populations that are going extinct and new populations established by colonization.

Metapopulations
This leads to a fundamental insight: For a metapopulation to persist for a long time, the ratio e/c must be less than 1.
Some patches will be occupied as long as the colonization rate is greater than the extinction rate; otherwise, the metapopulation will collapse and all populations in it will become extinct.
Metapopulations
It led to research on key issues:
• How to estimate factors that influence patch colonization and extinction.
• Importance of the spatial arrangement of suitable patches.
• Extent to which the landscape between habitat patches affects dispersal.
• How to determine whether empty patches are suitable habitat or not.
Metapopulations
Habitat fragmentation—large tracts of habitat are converted to spatially isolated habitat fragments by human activities, resulting in a metapopulation structure.
Patches may become ever smaller and more isolated, reducing colonization rate and increasing extinction rate. The e/c ratio increases.

Figure 10.17 The Northern Spotted Owl

Figure 10.18 Colonization in a Butterfly Metapopulation
Metapopulations
Isolation by distance can affect chance of extinction—a patch that is near an occupied patch may receive immigrants repeatedly, making extinction less likely.
High rates of immigration to protect a population from extinction is known as the rescue effect.
Connections in Nature: From Bottom to Top, and Back Again
The fall and rise of the Black Sea ecosystem illustrates two important types of causation in ecological communities:
• Bottom-up control—increased nutrient inputs caused eutrophication and increased phytoplankton biomass, decreased oxygen, fish die-offs, etc.
Connections in Nature: From Bottom to Top, and Back Again
• Top-down control—the top predators Mnemiopsis and Beroe altered key features of the ecosystem.
In many ecosystems both top-down and bottom-up controls interact to shape how ecosystems work.


