A n aI y ze P has e 389 Non-Parametric Methods The most commonly used statistical tests (t-tests, Z-tests, ANOVA, etc.) are based on a number of assumptions (see testing assumptions above). Non-parametric tests, while not assumption-free, make no assumption of a specific distribution for the population. The qualifiers (assuming) for non-parametric tests are always much less restrictive than for their parametric counterparts. For example, classical ANOVA requires the assump- tions of mutually independent random samples drawn from normal distributions that have equal variances, while the non-parametric counterparts require only the assump- tion that the samples come from any identical continuous distributions. Also, classical statistical methods are strictly valid only for data measured on interval or ratio scales, while non-parametric statistics apply to frequency or count data and to data measured on nominal or ordinal scales. Since interval and ratio data can be transformed to nomi- nal or ordinal data, non-parametric methods are valid in all cases where classical meth- ods are valid; the reverse is not true. Ordinal and nominal data are very common in Six Sigma work. Nearly all customer and employee surveys, product quality ratings, and many other activities produce ordinal and nominal data. So if non-parametric methods are so great, why do we ever use parametric meth- ods? When the assumptions hold, parametric tests will provide greater power than non-parametric tests. That is, the probability of rejecting Ho when it is false is higher with parametric tests than with a non-parametric test using the same sample size. How- ever, if the assumptions do not hold, then non-parametric tests may have considerably greater power than their parametric counterparts. It should be noted that non-parametric tests perform comparisons using medians rather than means, ranks rather than measurements, and signs of difference rather than Sta Graph EOtor WlI"ldow Het! BasIc Stat1StJcs j Regesslcn MJOVA DOE Control Chats QL9tyToois R€labity /5UrviV aI MU1iviJ"late lime SerIeS EDA Power a"Id sa mple Size • 8 9 10 11 12 13 14 15 FIGURE 10.43 Minitab's non-parametric tests. I l!J 1 2 I C3 I l-Sample W\k:oxon ... Mam-Whtney... Krusk.3I-Wais" . Mood's Mo!dai1 nst ,. Fnedm(ll,., RLnsTest., Parwtse INera()aS .. . Pai"wtse Dllferences ... PaTwIse Slopes ... I C4 ! I
Transcript
A n a I y z e P has e 389
Non-Parametric Methods The most commonly used statistical tests (t-tests, Z-tests, ANOVA, etc.) are based on a number of assumptions (see testing assumptions above). Non-parametric tests, while not assumption-free, make no assumption of a specific distribution for the population. The qualifiers (assuming) for non-parametric tests are always much less restrictive than for their parametric counterparts. For example, classical ANOVA requires the assumptions of mutually independent random samples drawn from normal distributions that have equal variances, while the non-parametric counterparts require only the assumption that the samples come from any identical continuous distributions. Also, classical statistical methods are strictly valid only for data measured on interval or ratio scales, while non-parametric statistics apply to frequency or count data and to data measured on nominal or ordinal scales. Since interval and ratio data can be transformed to nominal or ordinal data, non-parametric methods are valid in all cases where classical methods are valid; the reverse is not true. Ordinal and nominal data are very common in Six Sigma work. Nearly all customer and employee surveys, product quality ratings, and many other activities produce ordinal and nominal data.
So if non-parametric methods are so great, why do we ever use parametric methods? When the assumptions hold, parametric tests will provide greater power than non-parametric tests. That is, the probability of rejecting Ho when it is false is higher with parametric tests than with a non-parametric test using the same sample size. However, if the assumptions do not hold, then non-parametric tests may have considerably greater power than their parametric counterparts.
It should be noted that non-parametric tests perform comparisons using medians rather than means, ranks rather than measurements, and signs of difference rather than
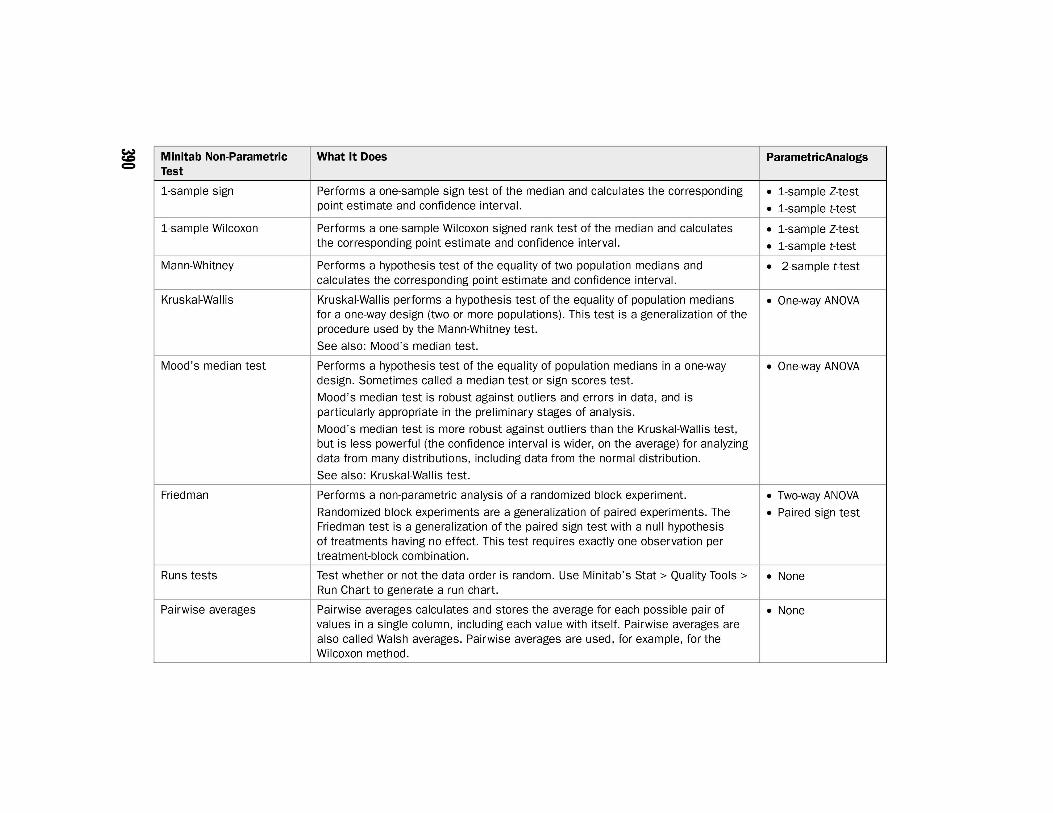
Performs a one-sample sign test of the median and calculates the corresponding • i-sample Z-test point estimate and confidence interval. • i-sample t-test
Performs a one-sample Wilcoxon signed rank test of the median and calculates • i-sample Z-test the corresponding point estimate and confidence interval. • i-sample t-test
Performs a hypothesis test of the equality of two population medians and • 2-sample t-test calculates the corresponding point estimate and confidence interval.
Kruskal-Wallis performs a hypothesis test of the equality of population medians • One-way ANOVA for a one-way design (two or more populations). This test is a generalization of the procedure used by the Mann-Whitney test.
See also: Mood's median test.
Performs a hypothesis test of the equality of population medians in a one-way • One-way ANOVA design. Sometimes called a median test or sign scores test.
Mood's median test is robust against outliers and errors in data, and is particularly appropriate in the preliminary stages of analysis.
Mood's median test is more robust against outliers than the Kruskal-Wallis test, but is less powerful (the confidence interval is wider, on the average) for analyzing data from many distributions, including data from the normal distribution.
See also: Kruskal-Wallis test.
Performs a non-parametric analysis of a randomized block experiment. • Two-way ANOVA Randomized block experiments are a generalization of paired experiments. The • Paired sign test Friedman test is a generalization of the paired sign test with a null hypothesis of treatments having no effect. This test requires exactly one observation per treatment-block combination.
Test whether or not the data order is random. Use Minitab's Stat> Quality Tools> • None Run Chart to generate a run chart.
Pairwise averages calculates and stores the average for each possible pair of • None values in a single column, including each value with itself. Pairwise averages are also called Walsh averages. Pairwise averages are used, for example, for the Wilcoxon method.
CN C,C) .......
Pairwise differences Pairwise differences calculates and stores the differences between all possible pairs of values formed from two columns. These differences are useful for non-parametric tests and confidence intervals. For example, the point estimate given by Mann-Whitney can be computed as the median of the differences.
Pairwise slopes Pairwise slopes calculates and stores the slope between all possible pairs of points, where a row in y-x columns defines a point in the plane. This procedure is useful for finding robust estimates of the slope of a line through the data.
Levene's test Test for equal variances. This method considers the distances of the observations from their sample median rather than their sample mean. Using the sample median rather than the sample mean makes the test more robust for smaller samples.
Non-parametric Dist Analyzes times-to-failure when no distribution can be found to fit the (censored) Analysis-Censored Data data. Tests for the equality of survival curves.
Hazard plots-non- If data are right censored, plots empirical hazard function or actuarial estimates. parametric distribution If data are arbitrarily censored, plots actuarial estimates. analysis
TABLE 10.17 Applications for Minitab's Non-Parametric Tests *
• None
• Simple linear regression
• Bartlett's test
• Parametric Dist Analysis-Censored data
• Hazard plots-parametric distribution analysis
392 C hap te r Ten
measured differences. In addition to not requiring any distributional assumptions, these statistics are also more robust to outliers and extreme values.
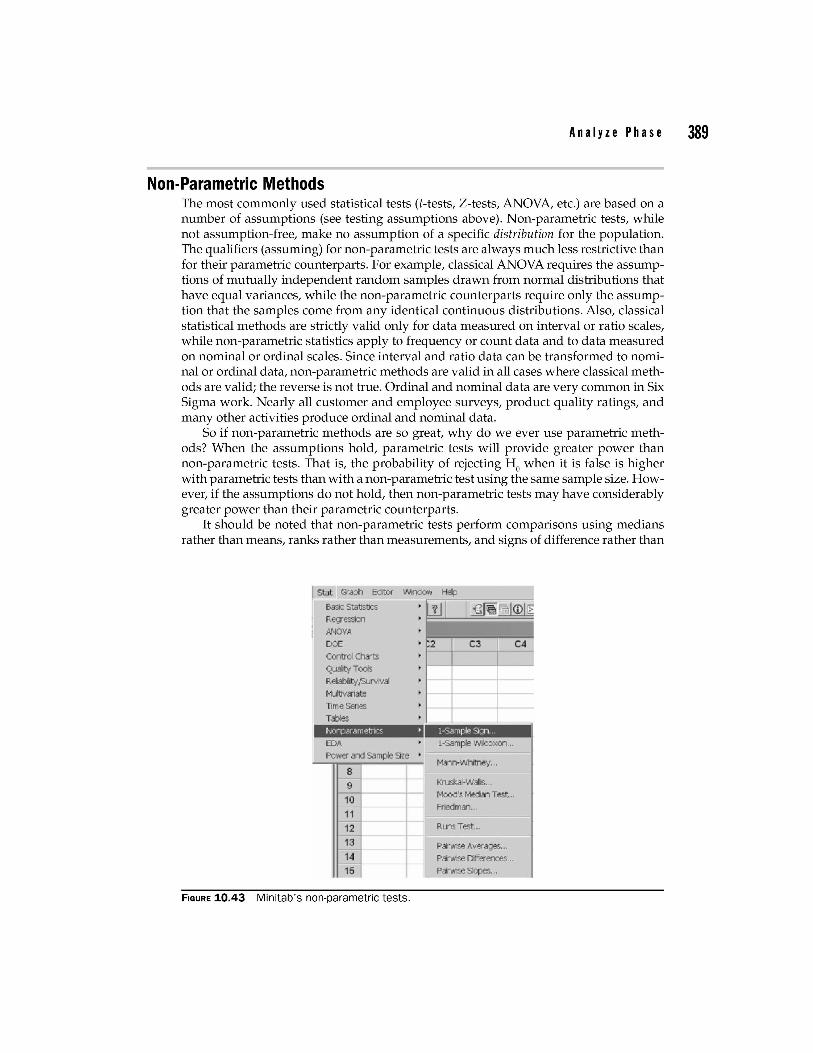
The subject of non-parametric statistics is a big one and there are many entire books written about it. We can't hope to cover the entire subject in a book about Six Sigma. Instead, we briefly describe the non-parametric tests performed by Minitab (Fig. 10.43). Minitab's non-parametric tests cover a reasonably wide range of applications to Six Sigma work, as shown in Table 10.17.
Guidelines on When to Use Non-Parametric Tests Use non-parametric analysis when any of the following are true (Gibbons, 1993):
• The data are counts or frequencies of different types of outcomes.
• The data are measured on a nominal scale.
• The data are measured on an ordinal scale.
• The assumptions required for the validity of the corresponding parametric pro-cedure are not met or cannot be verified.
• The shape of the distribution from which the sample is drawn is unknown.
• The sample size is small.
• The measurements are imprecise.
• There are outliers and/ or extreme values in the data, making the median more representative than the mean.
Use a parametric procedure when both of the following are true:
• The data are collected and analyzed using an interval or ratio scale of measurement.
• All of the assumptions required for the validity of that parametric procedure can be verified.