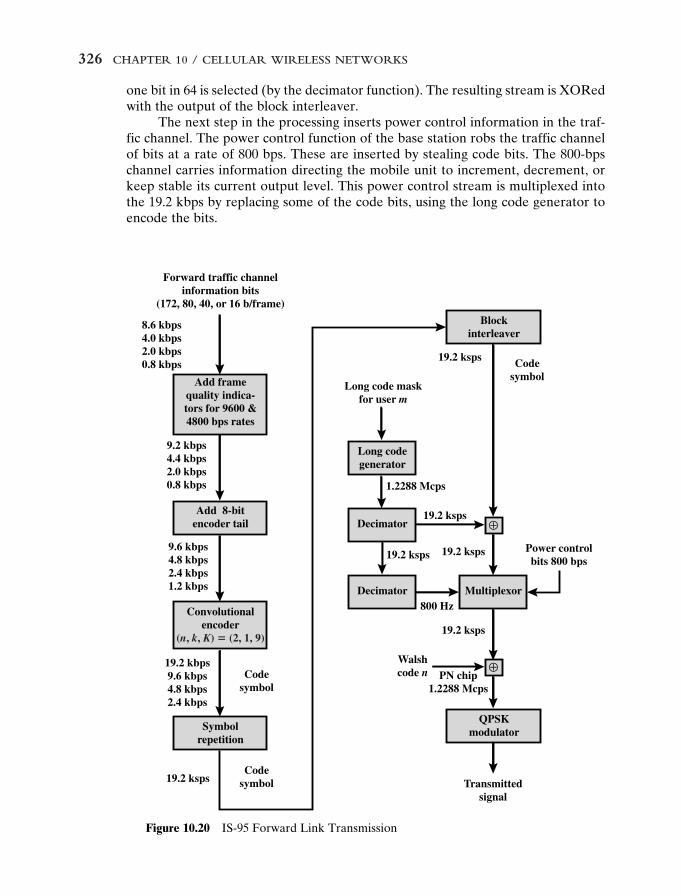
CHAPTER 10 CELLULAR W IRELESS NETWORKS 10.1 Principles of Cellular Networks 10.2 First-Generation Analog 10.3 Second-Generation TDMA 10.4 Second-Generation CDMA 10.5 Third-Generation Systems 10.6 Recommended Reading and Web Sites 10.7 Key Terms, Review Questions, and Problems
Transcript
CHAPTER10CELLULAR WIRELESSNETWORKS
10.1 Principles of Cellular Networks
10.2 First-Generation Analog
10.3 Second-Generation TDMA
10.4 Second-Generation CDMA
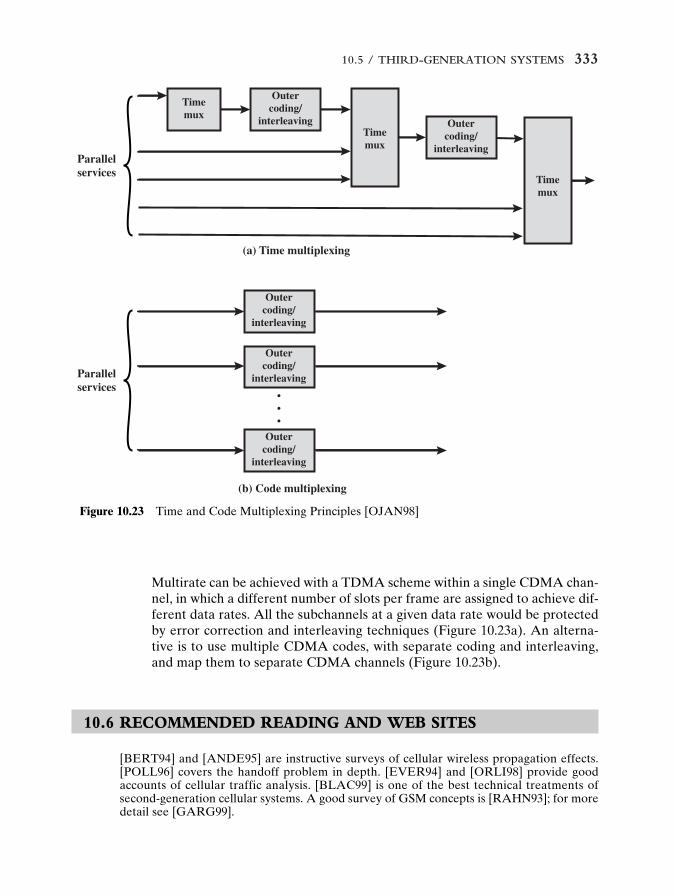
10.5 Third-Generation Systems
10.6 Recommended Reading and Web Sites
10.7 Key Terms, Review Questions, and Problems
10 Stallings I 5/15/01 1:30 PM Page 283
Prentice Hall
The following may be UNCORRECTED PAGE PROOFS.
284 CHAPTER 10 / CELLULAR WIRELESS NETWORKS
Of all the tremendous advances in data communications and telecommu-nications, perhaps the most revolutionary is the development of cellularnetworks. Cellular technology is the foundation of mobile wireless commu-
nications and supports users in locations that are not easily served by wired networks.Cellular technology is the underlying technology for mobile telephones, personal com-munications systems, wireless Internet and wireless Web applications, and much more.
We begin this chapter with a look at the basic principles used in all cellular net-works. Then we look at specific cellular technologies and standards, which are con-veniently grouped into three generations. The first-generation is analog based and,while still widely used, is passing from the scene. The dominant technology today isthe digital second-generation systems. Finally, third-generation high-speed digitalsystems have begun to emerge.
10.1 PRINCIPLES OF CELLULAR NETWORKS
Cellular radio is a technique that was developed to increase the capacity availablefor mobile radio telephone service. Prior to the introduction of cellular radio, mobileradio telephone service was only provided by a high-power transmitter/receiver. Atypical system would support about 25 channels with an effective radius of about 80km. The way to increase the capacity of the system is to use lower-power systemswith shorter radius and to use numerous transmitters/receivers. We begin this sec-tion with a look at the organization of cellular systems and then examine some ofthe details of their implementation.
Cellular Network Organization
The essence of a cellular network is the use of multiple low-power transmitters, onthe order of 100 W or less. Because the range of such a transmitter is small, an areacan be divided into cells, each one served by its own antenna. Each cell is allocateda band of frequencies and is served by a base station, consisting of transmitter,receiver, and control unit. Adjacent cells are assigned different frequencies to avoidinterference or crosstalk. However, cells sufficiently distant from each other can usethe same frequency band.
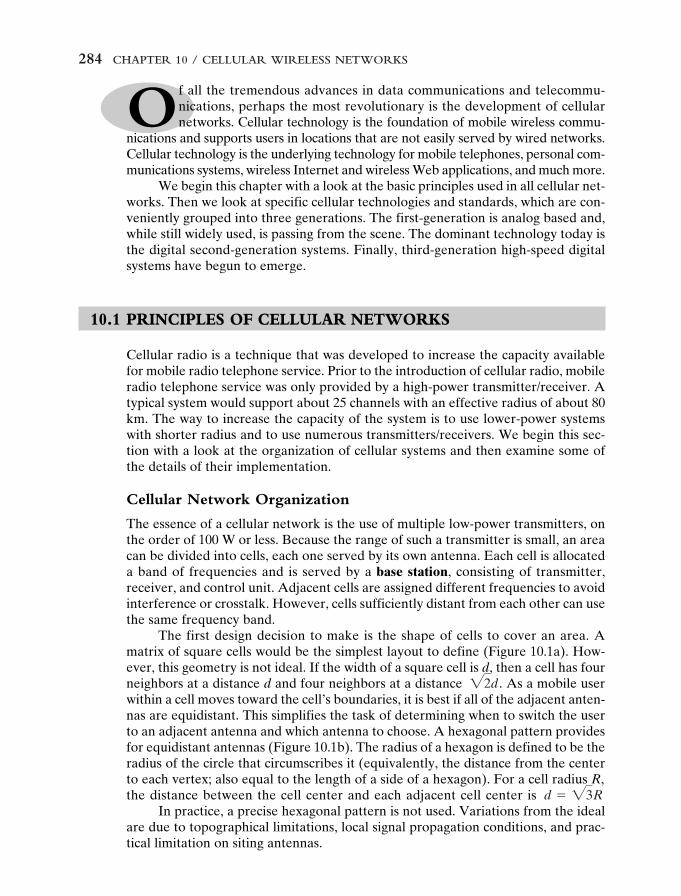
The first design decision to make is the shape of cells to cover an area. Amatrix of square cells would be the simplest layout to define (Figure 10.1a). How-ever, this geometry is not ideal. If the width of a square cell is d, then a cell has fourneighbors at a distance d and four neighbors at a distance . As a mobile user within a cell moves toward the cell’s boundaries, it is best if all of the adjacent anten-nas are equidistant. This simplifies the task of determining when to switch the userto an adjacent antenna and which antenna to choose. A hexagonal pattern providesfor equidistant antennas (Figure 10.1b). The radius of a hexagon is defined to be theradius of the circle that circumscribes it (equivalently, the distance from the centerto each vertex; also equal to the length of a side of a hexagon). For a cell radius R,the distance between the cell center and each adjacent cell center is
In practice, a precise hexagonal pattern is not used. Variations from the idealare due to topographical limitations, local signal propagation conditions, and prac-tical limitation on siting antennas.
d � 23R
22d
10 Stallings I 5/15/01 1:30 PM Page 284
10.1 / PRINCIPLES OF CELLULAR NETWORKS 285
d
Rdd
d
dd
d
d
d
d
1.414 d 1.414
d
1.414
d 1.414 d
(a) Square pattern (b) Hexagonal pattern
Figure 10.1 Cellular Geometries
With a wireless cellular system, you are limited in how often you can use thesame frequency for different communications because the signals, not being con-strained, can interfere with one another even if geographically separated. Systemssupporting a large number of communications simultaneously need mechanisms toconserve spectrum.
Frequency Reuse
In a cellular system, each cell has a base transceiver. The transmission poweris carefully controlled (to the extent that it is possible in the highly variable mobilecommunication environment) to allow communication within the cell using a givenfrequency while limiting the power at that frequency that escapes the cell into adja-cent ones. The objective is to use the same frequency in other nearby cells, thusallowing the frequency to be used for multiple simultaneous conversations. Gener-ally, 10 to 50 frequencies are assigned to each cell, depending on the traffic expected.
The essential issue, of course, is to determine how many cells must intervenebetween two cells using the same frequency so that the two cells do not interferewith each other. Various patterns of frequency reuse are possible. Figure 10.2 showssome examples. If the pattern consists of N cells and each cell is assigned the samenumber of frequencies, each cell can have K/N frequencies, where K is the totalnumber of frequencies allotted to the system. For AMPS, K � 395, and N � 7 is thesmallest pattern that can provide sufficient isolation between two uses of the samefrequency. This implies that there can be at most 57 frequencies per cell on average.
In characterizing frequency reuse, the following parameters are commonly used:
D � minimum distance between centers of cells that use the same band of frequencies (called cochannels)
R � radius of a cell
d � distance between centers of adjacent cells ( )N � number of cells in a repetitious pattern (each cell in the pattern uses a
unique band of frequencies), termed the reuse factor
d � 23R
10 Stallings I 5/15/01 1:30 PM Page 285
286 CHAPTER 10 / CELLULAR WIRELESS NETWORKS
(c) Black cells indicate a frequency reuse for N = 19
546
371
2
546
371
2
546
371
2546
371
25
46
371
2
546
37 1
2
546
371
2
(b) Frequency reuse pattern for N = 7
1
123
42
4
3
31
42
31
42
31
42
31
42
31
42
(a) Frequency reuse pattern for N = 4
Circle withradius D
Figure 10.2 Frequency Reuse Patterns
In a hexagonal cell pattern, only the following values of N are possible:
N � I2 � J2 � (I � J), I, J � 0, 1, 2, 3, . . .
Hence, possible values of N are 1, 3, 4, 7, 9, 12, 13, 16, 19, 21, etc. The follow-ing relationship holds:
This can also be expressed as .
Increasing Capacity
In time, as more customers use the system, traffic may build up so that thereare not enough frequencies assigned to a cell to handle its calls. A number ofapproaches have been used to cope with this situation, including the following:
D>d � 2N
D
R� 23N
10 Stallings I 5/15/01 1:30 PM Page 286
10.1 / PRINCIPLES OF CELLULAR NETWORKS 287
Figure 10.3 Cell Splitting
• Adding new channels: Typically, when a system is set up in a region, not all ofthe channels are used, and growth and expansion can be managed in anorderly fashion by adding new channels.
• Frequency borrowing: In the simplest case, frequencies are taken from adja-cent cells by congested cells. The frequencies can also be assigned to cellsdynamically.
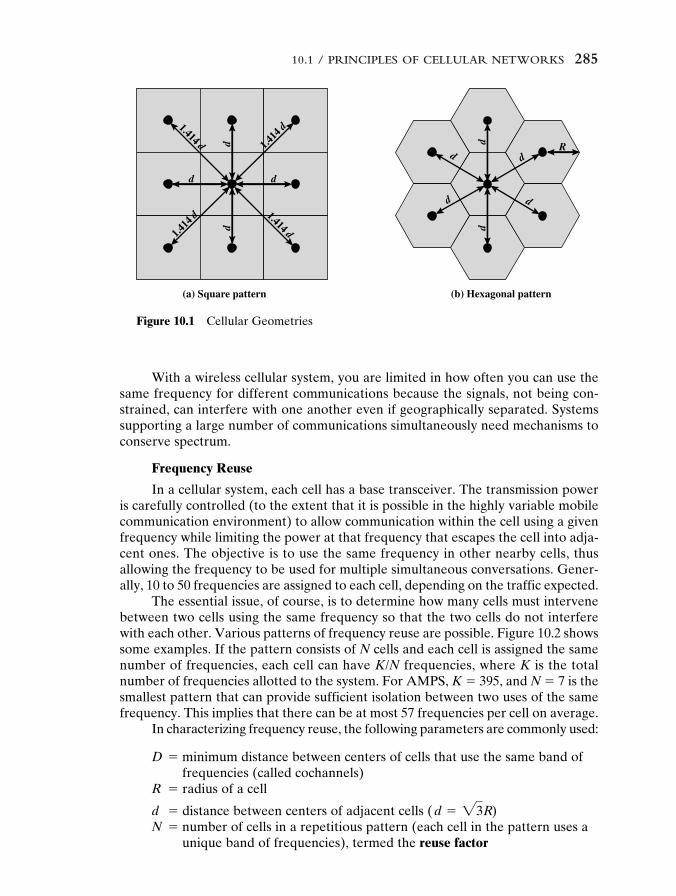
• Cell splitting: In practice, the distribution of traffic and topographic featuresis not uniform, and this presents opportunities of capacity increase. Cells inareas of high usage can be split into smaller cells. Generally, the originalcells are about 6.5 to 13 km in size. The smaller cells can themselves besplit; however, 1.5-km cells are close to the practical minimum size as a gen-eral solution (but see the subsequent discussion of microcells). To use asmaller cell, the power level used must be reduced to keep the signal withinthe cell. Also, as the mobile units move, they pass from cell to cell, whichrequires transferring of the call from one base transceiver to another. Thisprocess is called a handoff. As the cells get smaller, these handoffs becomemuch more frequent. Figure 10.3 indicates schematically how cells can bedivided to provide more capacity. A radius reduction by a factor of F reducesthe coverage area and increases the required number of base stations by afactor of F2.
• Cell sectoring: With cell sectoring, a cell is divided into a number of wedge-shaped sectors, each with its own set of channels, typically 3 or 6 sectors percell. Each sector is assigned a separate subset of the cell’s channels, and direc-tional antennas at the base station are used to focus on each sector.
• Microcells: As cells become smaller, antennas move from the tops of tall build-ings or hills, to the tops of small buildings or the sides of large buildings, andfinally to lamp posts, where they form microcells. Each decrease in cell sizeis accompanied by a reduction in the radiated power levels from the basestations and the mobile units. Microcells are useful in city streets in congestedareas, along highways, and inside large public buildings.
10 Stallings I 5/15/01 1:30 PM Page 287
288 CHAPTER 10 / CELLULAR WIRELESS NETWORKS
Macrocell Microcell
Cell radius 1 to 20 km 0.1 to 1 km
Transmission power 1 to 10 W 0.1 to 1 W
Average delay spread 0.1 to 10 �s 10 to 100 ns
Maximum bit rate 0.3 Mbps 1 Mbps
Table 10.1 Typical Parameters for Macrocells and Microcells [ANDE95]
Table 10.1 suggests typical parameters for traditional cells, called macrocells,and microcells with current technology. The average delay spread refers to multi-path delay spread (i.e., the same signal follows different paths and there is a timedelay between the earliest and latest arrival of the signal at the receiver). As indi-cated, the use of smaller cells enables the use of lower power and provides superiorpropagation conditions.
Example. [HAAS00]. Assume a system of 32 cells with a cell radius of 1.6 km, a total of32 cells, a total frequency bandwidth that supports 336 traffic channels, and a reuse factorof N � 7. If there are 32 total cells, what geographic area is covered, how many channelsare there per cell, and what is the total number of concurrent calls that can be handled?Repeat for a cell radius of 0.8 km and 128 cells.
Figure 10.4a shows an approximately square pattern. The area of a hexagon ofradius R is . A hexagon of radius 1.6 km has an area of 6.65 km2, and the total area covered is 6.65 � 32 � 213 km2. For N � 7, the number of channels per cell is336 /7 � 48, for a total channel capacity of 48 � 32 � 1536 channels. For the layout ofFigure 10.4b, the area covered is 1.66 � 128 � 213 km2. The number of channels per cellis 336/7 � 48, for a total channel capacity of 48 � 128 � 6144 channels.
1.5R223
(b) Cell radius � 0.8 km(a) Cell radius � 1.6 km
Width � 21 � 0.8 � 16.8 km
Hei
ght �
10
�
3 �
0.8
� 1
3.9
km
Width � 11 � 1.6 � 17.6 km
Hei
ght �
5 �
3
� 1
.6 �
13.
9 km
Figure 10.4 Frequency Reuse Example
10 Stallings I 5/15/01 1:30 PM Page 288
10.1 / PRINCIPLES OF CELLULAR NETWORKS 289
Operation of Cellular Systems
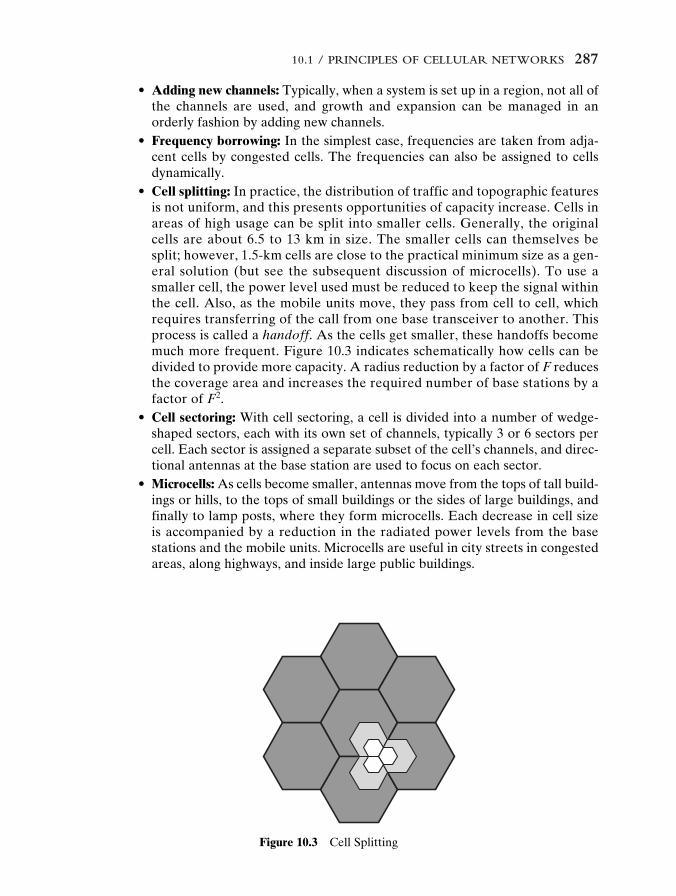
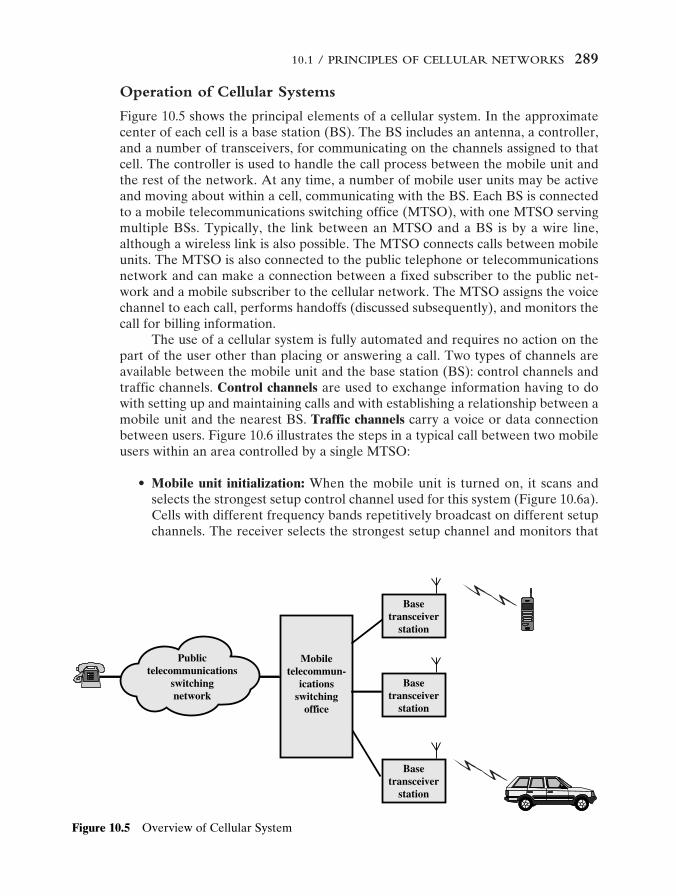
Figure 10.5 shows the principal elements of a cellular system. In the approximatecenter of each cell is a base station (BS). The BS includes an antenna, a controller,and a number of transceivers, for communicating on the channels assigned to thatcell. The controller is used to handle the call process between the mobile unit andthe rest of the network. At any time, a number of mobile user units may be activeand moving about within a cell, communicating with the BS. Each BS is connectedto a mobile telecommunications switching office (MTSO), with one MTSO servingmultiple BSs. Typically, the link between an MTSO and a BS is by a wire line,although a wireless link is also possible. The MTSO connects calls between mobileunits. The MTSO is also connected to the public telephone or telecommunicationsnetwork and can make a connection between a fixed subscriber to the public net-work and a mobile subscriber to the cellular network. The MTSO assigns the voicechannel to each call, performs handoffs (discussed subsequently), and monitors thecall for billing information.
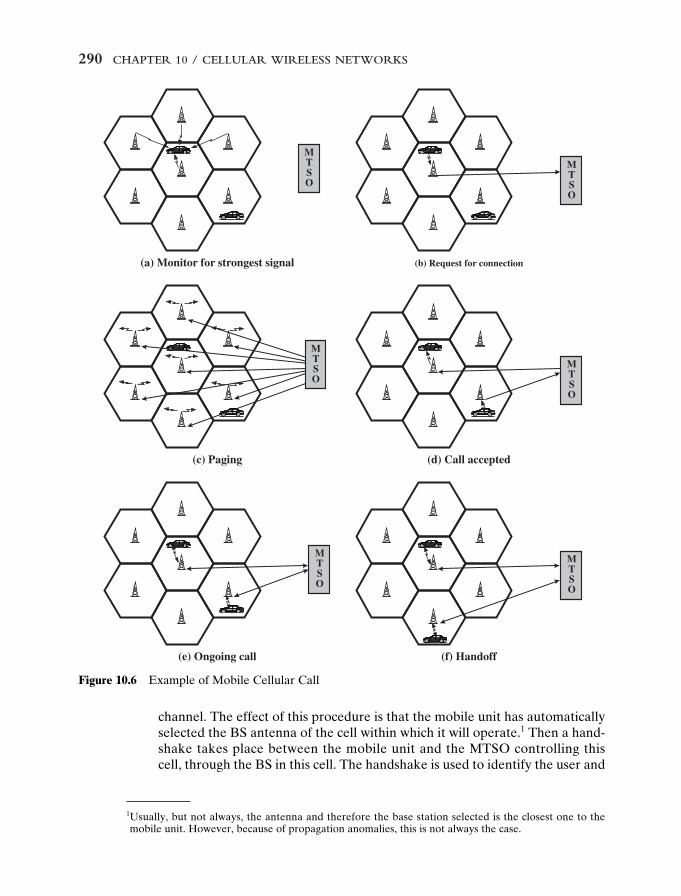
The use of a cellular system is fully automated and requires no action on thepart of the user other than placing or answering a call. Two types of channels areavailable between the mobile unit and the base station (BS): control channels andtraffic channels. Control channels are used to exchange information having to dowith setting up and maintaining calls and with establishing a relationship between amobile unit and the nearest BS. Traffic channels carry a voice or data connectionbetween users. Figure 10.6 illustrates the steps in a typical call between two mobileusers within an area controlled by a single MTSO:
• Mobile unit initialization: When the mobile unit is turned on, it scans andselects the strongest setup control channel used for this system (Figure 10.6a).Cells with different frequency bands repetitively broadcast on different setupchannels. The receiver selects the strongest setup channel and monitors that
Basetransceiver
station
Basetransceiver
station
Mobiletelecommun-
icationsswitching
office
Publictelecommunications
switchingnetwork
Basetransceiver
station
Figure 10.5 Overview of Cellular System
10 Stallings I 5/15/01 1:30 PM Page 289
290 CHAPTER 10 / CELLULAR WIRELESS NETWORKS
(a) Monitor for strongest signal
(c) Paging (d) Call accepted
(b) Request for connection
MTSO
MTSO
MTSO
(e) Ongoing call
MTSO
(f) Handoff
MTSO
MTSO
Figure 10.6 Example of Mobile Cellular Call
1Usually, but not always, the antenna and therefore the base station selected is the closest one to themobile unit. However, because of propagation anomalies, this is not always the case.
channel. The effect of this procedure is that the mobile unit has automaticallyselected the BS antenna of the cell within which it will operate.1 Then a hand-shake takes place between the mobile unit and the MTSO controlling thiscell, through the BS in this cell. The handshake is used to identify the user and
10 Stallings I 5/15/01 1:30 PM Page 290
10.1 / PRINCIPLES OF CELLULAR NETWORKS 291
register its location. As long as the mobile unit is on, this scanning procedureis repeated periodically to account for the motion of the unit. If the unit entersa new cell, then a new BS is selected. In addition, the mobile unit is monitor-ing for pages, discussed subsequently.
• Mobile-originated call: A mobile unit originates a call by sending the numberof the called unit on the preselected setup channel (Figure 10.6b). The receiverat the mobile unit first checks that the setup channel is idle by examining infor-mation in the forward (from the BS) channel. When an idle is detected, themobile may transmit on the corresponding reverse (to BS) channel. The BSsends the request to the MTSO.
• Paging: The MTSO then attempts to complete the connection to the calledunit. The MTSO sends a paging message to certain BSs depending on thecalled mobile number (Figure 10.6c). Each BS transmits the paging signal onits own assigned setup channel.
• Call accepted: The called mobile unit recognizes its number on the setup chan-nel being monitored and responds to that BS, which sends the response to theMTSO. The MTSO sets up a circuit between the calling and called BSs. At thesame time, the MTSO selects an available traffic channel within each BS’s celland notifies each BS, which in turn notifies its mobile unit (Figure 10.6d). Thetwo mobile units tune to their respective assigned channels.
• Ongoing call: While the connection is maintained, the two mobile unitsexchange voice or data signals, going through their respective BSs and theMTSO (Figure 10.6e).
• Handoff: If a mobile unit moves out of range of one cell and into the range ofanother during a connection, the traffic channel has to change to one assignedto the BS in the new cell (Figure 10.6f). The system makes this change with-out either interrupting the call or alerting the user.
Other functions performed by the system but not illustrated in Figure 10.6include the following:
• Call blocking: During the mobile-initiated call stage, if all the traffic channelsassigned to the nearest BS are busy, then the mobile unit makes a preconfig-ured number of repeated attempts. After a certain number of failed tries, abusy tone is returned to the user.
• Call termination: When one of the two users hangs up, the MTSO is informedand the traffic channels at the two BSs are released.
• Call drop: During a connection, because of interference or weak signal spotsin certain areas, if the BS cannot maintain the minimum required signalstrength for a certain period of time, the traffic channel to the user is droppedand the MTSO is informed.
• Calls to/from fixed and remote mobile subscriber: The MTSO connects to thepublic switched telephone network. Thus, the MTSO can set up a connectionbetween a mobile user in its area and a fixed subscriber via the telephone net-work. Further, the MTSO can connect to a remote MTSO via the telephone
10 Stallings I 5/15/01 1:30 PM Page 291
292 CHAPTER 10 / CELLULAR WIRELESS NETWORKS
network or via dedicated lines and set up a connection between a mobile userin its area and a remote mobile user.
Mobile Radio Propagation Effects
Mobile radio communication introduces complexities not found in wire communi-cation or in fixed wireless communication. Two general areas of concern are signalstrength and signal propagation effects.
• Signal strength: The strength of the signal between the base station and themobile unit must be strong enough to maintain signal quality at the receiverbut no so strong as to create too much cochannel interference with channelsin another cell using the same frequency band. Several complicating factorsexist. Human-made noise varies considerably, resulting in a variable noiselevel. For example, automobile ignition noise in the cellular frequency rangeis greater in the city than in a suburban area. Other signal sources vary fromplace to place. The signal strength varies as a function of distance from the BSto a point within its cell. Moreover, the signal strength varies dynamically asthe mobile unit moves.
• Fading: Even if signal strength is within an effective range, signal propagationeffects may disrupt the signal and cause errors. Section 5.4 discussed fadingand various countermeasures.
In designing a cellular layout, the communications engineer must take accountof these various propagation effects, the desired maximum transmit power level atthe base station and the mobile units, the typical height of the mobile unit antenna,and the available height of the BS antenna. These factors will determine the size ofthe individual cell. Unfortunately, as just described, the propagation effects aredynamic and difficult to predict. The best that can be done is to come up with amodel based on empirical data and to apply that model to a given environment todevelop guidelines for cell size. One of the most widely used models was developedby Okumura et al. [OKUM68] and subsequently refined by Hata [HATA80]. Theoriginal was a detailed analysis of the Tokyo area and produced path loss informa-tion for an urban environment. Hata’s model is an empirical formulation that takesinto account a variety of environments and conditions. For an urban environment,predicted path loss is
fc � carrier frequency in MHz from 150 to 1500 MHzht � height of transmitting antenna (base station) in m, from 30 to 300 mhr � height of receiving antenna (mobile station) in m, from 1 to 10 md � propagation distance between antennas in km, from 1 to 20 km
A(hr) � correction factor for mobile antenna height
For a small or medium-sized city, the correction factor is given by
10 Stallings I 5/15/01 1:30 PM Page 292
10.1 / PRINCIPLES OF CELLULAR NETWORKS 293
A(hr) � (1.1 log fc � 0.7) hr � (1.56 log fc � 0.8) dB
and for a large city it is given by
A(hr) � 8.29[log(1.54 hr)]2 � 1.1 dB for fc � 300 MHz
A(hr) � 3.2[log(11.75 hr)]2 � 4.97 dB for fc � 300 MHz
To estimate the path loss in a suburban area, the formula for urban path lossin Equation (10.1) is modified as
The Okumura/Hata model is considered to be among the best in terms of accuracyin path loss prediction and provides a practical means of estimating path loss in awide variety of situations [FREE97, RAPP97].
Example. [FREE97]. Let fc � 900 MHz, ht � 40 m, hr � 5 m, and d � 10 km. Estimate thepath loss for a medium-size city.
Handoff2 is the procedure changing the assignment of a mobile unit from one BS toanother as the mobile moves from one cell to another. Handoff is handled in dif-ferent ways in different systems and involves a number of factors. Here we give abrief overview.
Handoff may be network initiated, in which the decision is made solely by thenetwork measurements of received signals from the mobile unit. Alternatively,mobile-assisted handoff schemes enable the mobile unit to participate in the hand-off decision by providing feedback to the network concerning signals received at themobile unit. In either case, a number of different performance metrics may be usedto make the decision. [HAAS00] lists the following:
• Cell blocking probability: The probability of a new call being blocked, due toheavy load on the BS traffic capacity. In this case, the mobile unit is handedoff to a neighboring cell based not on signal quality but on traffic capacity.
2The term handoff is used in U.S. cellular standards documents. ITU documents use the term handover,and both terms appear in the technical literature. The meanings are the same.
10 Stallings I 5/15/01 1:30 PM Page 293
294 CHAPTER 10 / CELLULAR WIRELESS NETWORKS
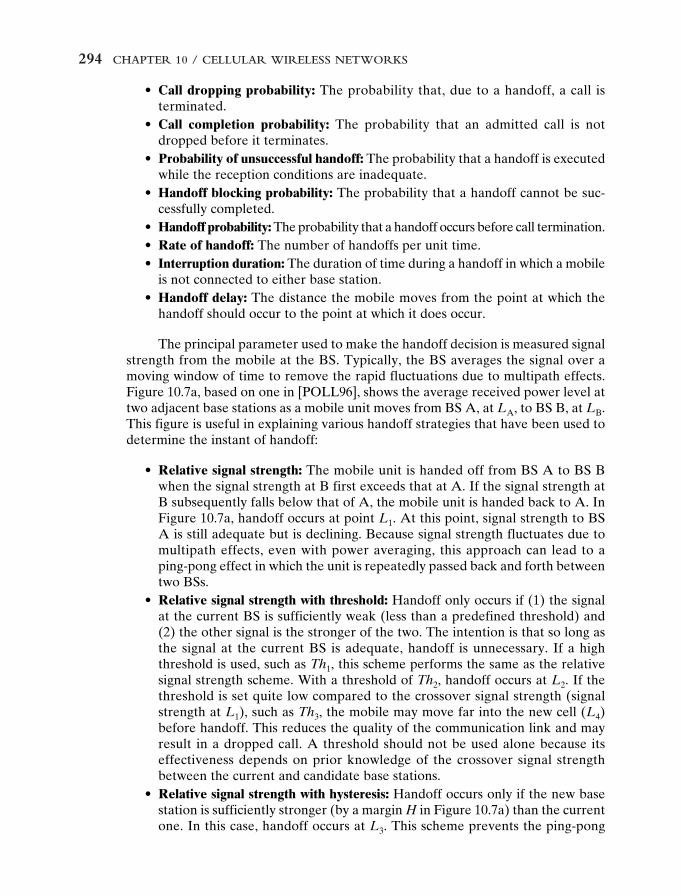
• Call dropping probability: The probability that, due to a handoff, a call isterminated.
• Call completion probability: The probability that an admitted call is notdropped before it terminates.
• Probability of unsuccessful handoff: The probability that a handoff is executedwhile the reception conditions are inadequate.
• Handoff blocking probability: The probability that a handoff cannot be suc-cessfully completed.
• Handoff probability: The probability that a handoff occurs before call termination.• Rate of handoff: The number of handoffs per unit time.• Interruption duration: The duration of time during a handoff in which a mobile
is not connected to either base station.• Handoff delay: The distance the mobile moves from the point at which the
handoff should occur to the point at which it does occur.
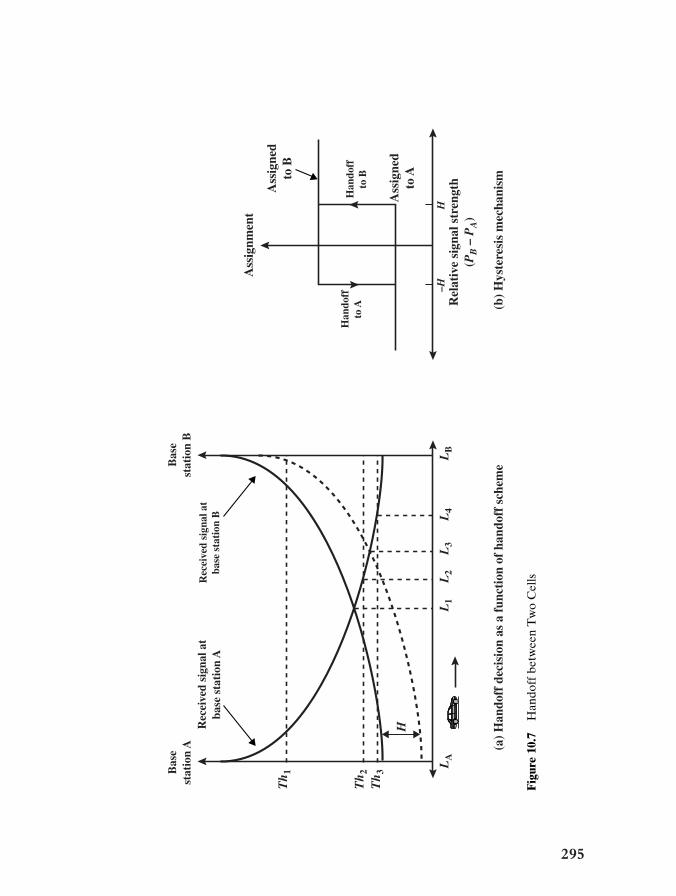
The principal parameter used to make the handoff decision is measured signalstrength from the mobile at the BS. Typically, the BS averages the signal over amoving window of time to remove the rapid fluctuations due to multipath effects.Figure 10.7a, based on one in [POLL96], shows the average received power level attwo adjacent base stations as a mobile unit moves from BS A, at LA, to BS B, at LB.This figure is useful in explaining various handoff strategies that have been used todetermine the instant of handoff:
• Relative signal strength: The mobile unit is handed off from BS A to BS Bwhen the signal strength at B first exceeds that at A. If the signal strength atB subsequently falls below that of A, the mobile unit is handed back to A. InFigure 10.7a, handoff occurs at point L1. At this point, signal strength to BSA is still adequate but is declining. Because signal strength fluctuates due tomultipath effects, even with power averaging, this approach can lead to aping-pong effect in which the unit is repeatedly passed back and forth betweentwo BSs.
• Relative signal strength with threshold: Handoff only occurs if (1) the signalat the current BS is sufficiently weak (less than a predefined threshold) and(2) the other signal is the stronger of the two. The intention is that so long asthe signal at the current BS is adequate, handoff is unnecessary. If a highthreshold is used, such as Th1, this scheme performs the same as the relativesignal strength scheme. With a threshold of Th2, handoff occurs at L2. If thethreshold is set quite low compared to the crossover signal strength (signalstrength at L1), such as Th3, the mobile may move far into the new cell (L4)before handoff. This reduces the quality of the communication link and mayresult in a dropped call. A threshold should not be used alone because itseffectiveness depends on prior knowledge of the crossover signal strengthbetween the current and candidate base stations.
• Relative signal strength with hysteresis: Handoff occurs only if the new basestation is sufficiently stronger (by a margin H in Figure 10.7a) than the currentone. In this case, handoff occurs at L3. This scheme prevents the ping-pong
10 Stallings I 5/15/01 1:30 PM Page 294
295
(a)
Han
doff
dec
isio
n as
a f
unct
ion
of h
ando
ff s
chem
e(b
) H
yste
resi
s m
echa
nism
Rec
eive
d si
gnal
at
base
sta
tion
AR
ecei
ved
sign
al a
tba
se s
tati
on B
Rel
ativ
e si
gnal
str
engt
h(P
B –
PA
)
Han
doff
to B
Han
doff
to A
Ass
ignm
ent
Th 1
Th 2
H
Th 3
L1
LA
LB
L2
L3
L4
Ass
igne
dto
A
Bas
est
atio
n A
Bas
est
atio
n B
–HH
Ass
igne
dto
B
Fig
ure
10.7
Han
doff
bet
wee
n T
wo
Cel
ls
10 Stallings I 5/15/01 1:30 PM Page 295
effect, because once handoff occurs, the effect of the margin H is reversed. Theterm hysteresis refers to a phenomenon known as relay hysteresis and can beappreciated with the aid of Figure 10.7b. We can think of the handoff mecha-nism as having two states. While the mobile is assigned to BS A, the mecha-nism will generate a handoff when the relative signal strength reaches orexceeds the H. Once the mobile is assigned to B, it remains so until the rela-tive signal strength falls below �H, at which point it is handed back to A. Theonly disadvantage of this scheme is that the first handoff may still be unnec-essary if BS A still has sufficient signal strength.
• Relative signal strength with hysteresis and threshold: Handoff occurs only if(1) the current signal level drops below a threshold, and (2) the target base sta-tion is stronger than the current one by a hysteresis margin H. In our exam-ple, handoff occurs at L3 if the threshold is either Th1 or Th2 and at L4 if thethreshold is at Th3.
• Prediction techniques: The handoff decision is based on the expected futurevalue of the received signal strength.
The handoff decision is complicated by the use of power control techniques,which enable the BS dynamically to adjust the power transmitted by the mobile.This topic is discussed next.
Power Control
A number of design issues make it desirable to include a dynamic power controlcapability in a cellular system:
1. The received power must be sufficiently above the background noise for effec-tive communication, which dictates the required transmitted power. As themobile unit moves away from the transmitter, the received power declines dueto normal attenuation. In addition, the effects of reflection, diffraction, andscattering can cause rapid changes in received power levels over small dis-tances. This is because the power level is the sum from signals coming from anumber of different paths and the phases of those paths are random, some-times adding and sometimes subtracting. As the mobile unit moves, the con-tributions along various paths change.
2. At the same time, it is desirable to minimize the power in the transmitted sig-nal from the mobile, to reduce cochannel interference (interference with chan-nels on the same frequency in remote cells), alleviate health concerns, and savebattery power.
3. In spread spectrum (SS) systems using code division multiple access (CDMA),it is desirable to equalize the received power level from all mobile units at theBS. This is crucial to system performance because all users have the same fre-quency allocation.
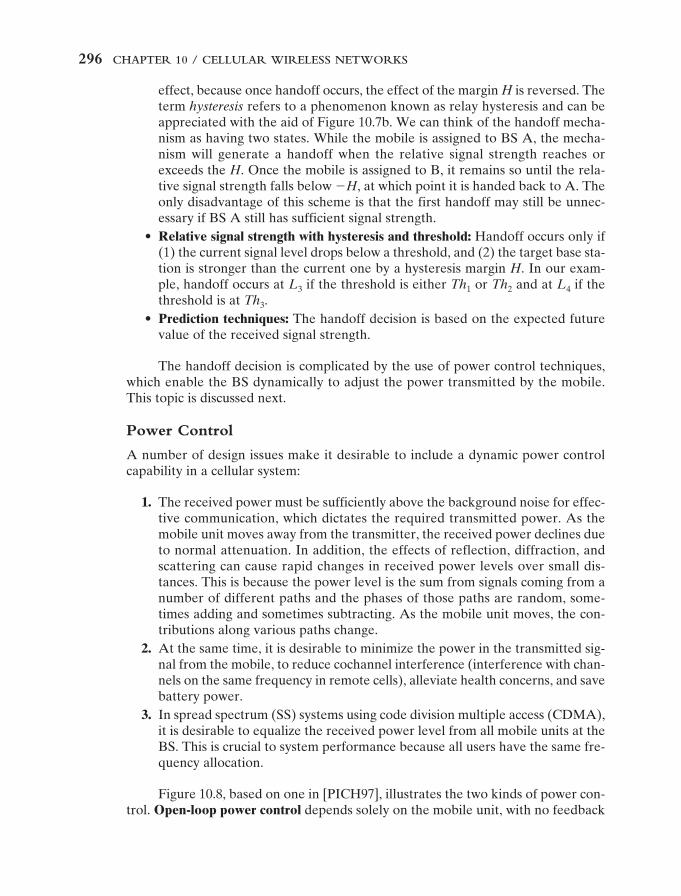
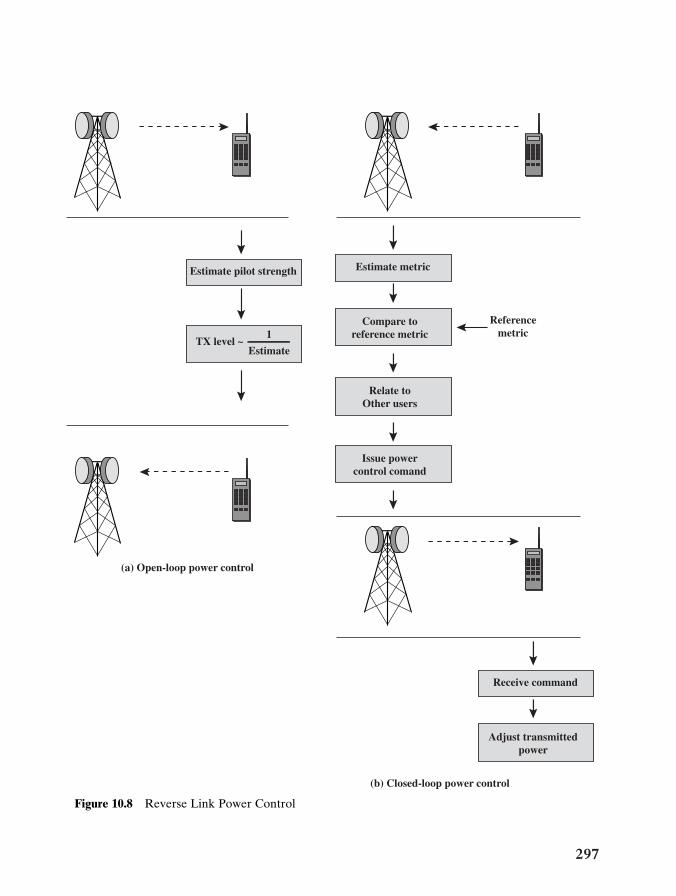
Figure 10.8, based on one in [PICH97], illustrates the two kinds of power con-trol. Open-loop power control depends solely on the mobile unit, with no feedback
296 CHAPTER 10 / CELLULAR WIRELESS NETWORKS
10 Stallings I 5/15/01 1:30 PM Page 296
297
Estimate pilot strength
TX level ~ 1
Estimate
Receive command
Adjust transmittedpower
Estimate metric
Compare toreference metric
Referencemetric
Relate toOther users
Issue powercontrol comand
(a) Open-loop power control
(b) Closed-loop power control
Figure 10.8 Reverse Link Power Control
10 Stallings I 5/15/01 1:30 PM Page 297
298 CHAPTER 10 / CELLULAR WIRELESS NETWORKS
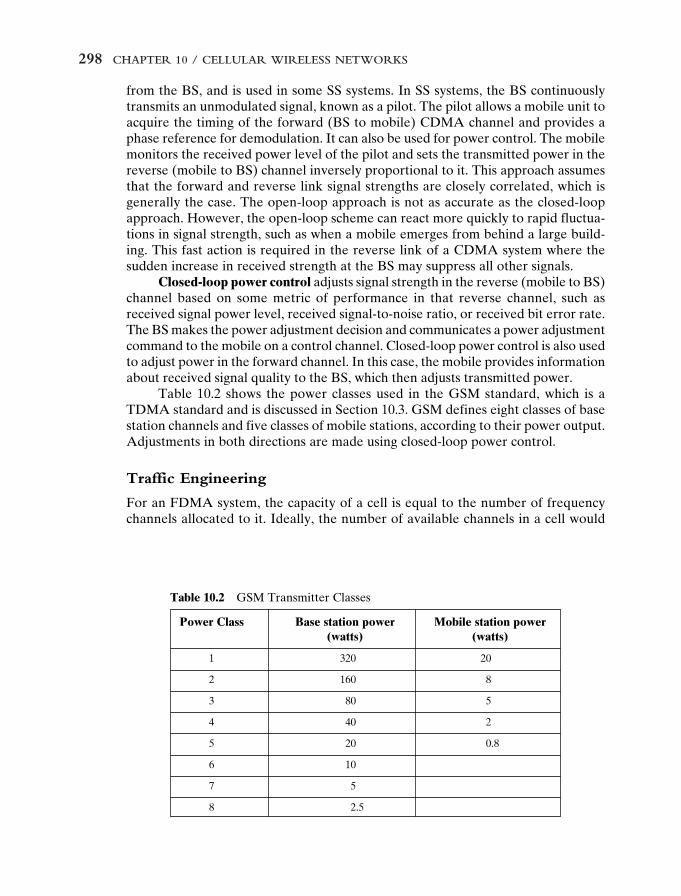
Power Class Base station power Mobile station power(watts) (watts)
1 320 20
2 160 8
3 80 5
4 40 2
5 20 0.8
6 10
7 5
8 2.5
Table 10.2 GSM Transmitter Classes
from the BS, and is used in some SS systems. In SS systems, the BS continuouslytransmits an unmodulated signal, known as a pilot. The pilot allows a mobile unit toacquire the timing of the forward (BS to mobile) CDMA channel and provides aphase reference for demodulation. It can also be used for power control. The mobilemonitors the received power level of the pilot and sets the transmitted power in thereverse (mobile to BS) channel inversely proportional to it. This approach assumesthat the forward and reverse link signal strengths are closely correlated, which isgenerally the case. The open-loop approach is not as accurate as the closed-loopapproach. However, the open-loop scheme can react more quickly to rapid fluctua-tions in signal strength, such as when a mobile emerges from behind a large build-ing. This fast action is required in the reverse link of a CDMA system where thesudden increase in received strength at the BS may suppress all other signals.
Closed-loop power control adjusts signal strength in the reverse (mobile to BS)channel based on some metric of performance in that reverse channel, such asreceived signal power level, received signal-to-noise ratio, or received bit error rate.The BS makes the power adjustment decision and communicates a power adjustmentcommand to the mobile on a control channel. Closed-loop power control is also usedto adjust power in the forward channel. In this case, the mobile provides informationabout received signal quality to the BS, which then adjusts transmitted power.
Table 10.2 shows the power classes used in the GSM standard, which is aTDMA standard and is discussed in Section 10.3. GSM defines eight classes of basestation channels and five classes of mobile stations, according to their power output.Adjustments in both directions are made using closed-loop power control.
Traffic Engineering
For an FDMA system, the capacity of a cell is equal to the number of frequencychannels allocated to it. Ideally, the number of available channels in a cell would
10 Stallings I 5/15/01 1:30 PM Page 298
10.1 / PRINCIPLES OF CELLULAR NETWORKS 299
equal the total number of subscribers who could be active at any time. In practice, itis not feasible to have the capacity to handle any possible load at all times. Fortu-nately, not all subscribers place calls at the same time and so it is reasonable to sizethe network to be able to handle some expected level of load. This is the disciplineof traffic engineering.
Traffic engineering concepts were developed in the design of telephoneswitches and circuit-switching telephone networks, but the concepts equally applyto cellular networks. Consider a cell able to handle N simultaneous users (capacityof N channels) that has L potential subscribers (L mobile units). If L < N, the sys-tem is referred to as nonblocking; all calls can be handled all the time. If L > N, thesystem is blocking; a subscriber may attempt a call and find the capacity fully in useand therefore be blocked. For a blocking system, the fundamental performancequestions we wish to answer are as follows:
1. What is the degree of blocking; that is, what is the probability that a callrequest will be blocked? Alternatively, what capacity (N) is needed to achievea certain upper bound on the probability of blocking?
2. If blocked calls are queued for service, what is the average delay? Alterna-tively, what capacity is needed to achieve a certain average delay?
In this subsection, we briefly introduce the relevant traffic engineering conceptsand give an example of their use. Appendix B examines the subject in more detail.
Two parameters determine the amount of load presented to a system:
� the mean rate of calls (connection requests) attempted per unit timeh � the mean holding time per successful call
The basic measure of traffic is the traffic intensity, expressed in a dimension-less unit, the erlang:
A � h
A can be interpreted in several ways. It is a normalized version of : A equalsthe average number of calls arriving during the average holding period. We can alsoview the cell as a multiserver queuing system where the number of servers is equalto the channel capacity N. The average service time at a server is h. A basic rela-tionship in a multiserver queue is h � N, where is server utilization, or the frac-tion of time that a server is busy. Therefore A � N and is a measure of the averagenumber of channels required.
Example. If the calling rate averages 20 calls per minute and the average holding time is3 minutes, then A � 60. We would expect a cell with a capacity of 120 channels to be abouthalf utilized at any given time. A switch of capacity 50 would clearly be inadequate. Acapacity of 60 would meet the average demand but, because of fluctuations around themean rate A, this capacity would at times be inadequate.
10 Stallings I 5/15/01 1:30 PM Page 299
300 CHAPTER 10 / CELLULAR WIRELESS NETWORKS
Typically, a blocking system is sized to deal with some upper limit of trafficintensity. It is generally thought unreasonable to size for the highest surge of traf-fic anticipated; rather, the common practice is to size the system to meet the aver-age rate encountered during a busy hour. The busy hour is the 60-minute periodduring the day when the traffic is highest, in the long run. ITU-T recommends tak-ing the average of the busy hour traffic on the 30 busiest days of the year, called the“mean busy-hour traffic,” and using that quantity to size the system. The NorthAmerican practice is to take the average over the 10 busiest days. These are typi-cally measurements of carried rather than offered traffic and can only be used toestimate the true load.
The parameter A, as a measure of busy-hour traffic, serves as input to a traf-fic model. The model is then used to answer questions such as those posed in thebeginning of this subsection. There are two key factors that determine the natureof the model:
• The manner in which blocked calls are handled• The number of traffic sources
Example. To clarify these concepts, consider Figure 10.9, which shows the pattern of activ-ity in a cell of capacity 10 channels over a period of 1 hour. The rate of calls per minuteis 97/60. The average holding time per call, in minutes, is 294/97. Thus A � (97/60) �(294/97) � 4.9 erlangs. Another way of viewing the parameter A is that it is the meannumber of calls in progress. Thus, on average, 4.9 channels are engaged. The latter inter-pretation, however, is true only in the nonblocking case. The parameter was defined asthe rate of calls attempted, not carried traffic.
0Channel
1
2
3
4
5
6
7
8
9
10
5 10 15 20 25 30
Minutes
Minutes
Note: Horizontal lines indicate occupied periods to the nearest 1/2 minute
Occupiedtime
(mins)
Numberof calls
35 40 45 50 55
51
47
43
39
34
28
22
15
9
6
294Totals
17
16
14
12
11
10
7
5
3
2
97
60
0 5 10 15 20 25 30 35 40 45 50 55 60
Figure 10.9 Example Distribution of Traffic in a Cell with Capacity 10
10 Stallings I 5/15/01 1:30 PM Page 300
10.1 / PRINCIPLES OF CELLULAR NETWORKS 301
Blocked calls may be handled in one of two ways. First, blocked calls can beput in a queue awaiting a free channel; this is referred to as lost calls delayed (LCD),although in fact the call is not lost, merely delayed. Second, a blocked call can berejected and dropped. This in turn leads to two assumptions about the action of theuser. If the user hangs up and waits some random time interval before another callattempt, this is known as lost calls cleared (LCC). If the user repeatedly attemptscalling, it is known as lost calls held (LCH). For each of these blocking options, for-mulas have been developed that characterize the performance of the system. For cel-lular systems, the LCC model is generally used and is generally the most accurate.
The second key element of a traffic model is whether the number of users isassumed to be finite or infinite. For an infinite source model, there is assumed to bea fixed arrival rate. For the finite source case, the arrival rate will depend on thenumber of sources already engaged. In particular, if the total pool of users is L, eachof which generates calls at an average rate of /L, then, when the cell is totally idle,the arrival rate is . However, if there are K users occupied at time t, then the instan-taneous arrival rate at that time is (L � K)/L. Infinite source models are analyti-cally easier to deal with. The infinite source assumption is reasonable when thenumber of sources is at least 5 to 10 times the capacity of the system.
Infinite Sources, Lost Calls Cleared
For an infinite source LCC model, the key parameter of interest is the proba-bility of loss, or grade of service. Thus a grade of service of 0.01 means that, duringa busy hour, the probability that an attempted call is blocked is 0.01. Values in therange 0.01 to 0.001 are generally considered quite good.
The equation of infinite source LCC, known as Erlang B, has the following form:
where
A� offered traffic, erlangsN� number of serversP� probability of blocking (grade of service)
This equation is easily programmed, and tables of values are readily available.Table 10.3 is an extract from such a table. Given the offered load and number ofservers, the grade of service can be calculated or determined from a table. Moreoften, the inverse problem is of interest: determining the amount of traffic that canbe handled by a given capacity to produce a given grade of service. Another prob-lem is to determine the capacity required to handle a given amount of traffic at agiven grade of service. For both these problems, tables or suitable trial-and-errorprograms are needed.
Two important points can be deduced from Table 10.3:
P �
AN
N!
aN
x�0
Ax
x!
10 Stallings I 5/15/01 1:30 PM Page 301
302 CHAPTER 10 / CELLULAR WIRELESS NETWORKS
Example. To illustrate the first point, consider two cells, each with a capacity of 10 chan-nels. They have a joint capacity of 20 channels and can handle a combined offered trafficintensity of 6.86 for a grade of service of 0.002. However, a single cell of capacity 20 chan-nels will handle 10.07 erlangs at a grade of service of 0.002. To illustrate the second point,consider a cell of 10 channels giving a grade of service of 0.002 for a load of 3.43 erlangs. A30% increase in traffic reduces the grade of service to 0.01. However, for a cell of capacity70 channels, only a 10% increase in traffic reduces the grade of service from 0.002 to 0.01.
All of the preceding discussion deals with offered traffic. If sizing is done onthe basis of system measurement, all that we are likely to have is carried traffic. Aprogram can readily be developed that accepts carried traffic as input and then per-forms a seeking algorithm to work backward to offered traffic. The relationshipbetween carried traffic C and offered traffic A is:
C � A(1 � P)
For small value of P, A is a good approximation of C.
Effect of Handoff
One complication in cellular traffic models not found in other such models isthe effect of handoff. This is illustrated in Figure 10.10. The arrival rate of calls at acell has two components: new calls placed by mobile units in the cell (1), and calls
Capacity (erlangs) for grade of service of
Number of P = 0.02 P = 0.01 P = 0.005 P = 0.002 P = 0.001servers (N) (1/50) 1/100) (1/200) (1/500) (1/1000)
1 0.02 0.01 0.005 0.002 0.001
4 1.09 0.87 0.7 0.53 0.43
5 1.66 1.36 1.13 0.9 0.76
10 5.08 4.46 3.96 3.43 3.09
20 13.19 12.03 11.10 10.07 9.41
24 16.64 15.27 14.21 13.01 12.24
40 31.0 29.0 27.3 25.7 24.5
70 59.13 56.1 53.7 51.0 49.2
100 87.97 84.1 80.9 77.4 75.2
Table 10.3 Erlang B Table
1. A larger-capacity system is more efficient than a smaller-capacity one for agiven grade of service.
2. A larger-capacity system is more susceptible to reduction of the grade of service.
10 Stallings I 5/15/01 1:30 PM Page 302
10.2 / FIRST-GENERATION ANALOG 303
λ1 µ1
µ2λ2
New callarrival
Handoverarrival
Callcompletion
Callhandoff
Figure 10.10 Cell Traffic Model
handed off to the cell for mobile units entering the cell while connected (2). Thetotal arrival rate is � 1 � 2. Similarly, the completion rate consists of calls beingterminated and calls being handed off. The model must be adjusted accordingly toobtain overall arrival rates and holding times.
10.2 FIRST-GENERATION ANALOG
The original cellular telephone networks provided analog traffic channels; theseare now referred to as first-generation systems. Since the early 1980s the mostcommon first-generation system in North America has been the Advanced MobilePhone Service (AMPS) developed by AT&T. This approach is also common inSouth America, Australia, and China. Although gradually being replaced by second-generation systems, AMPS is still in common use. In this section, we provide anoverview of AMPS.
Spectral Allocation
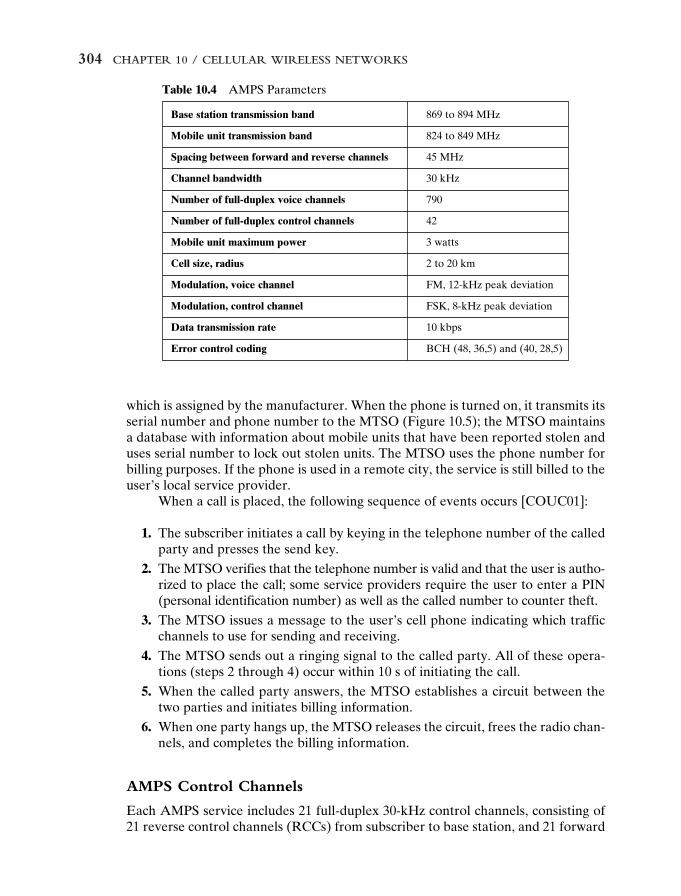
In North America, two 25-MHz bands are allocated to AMPS (Table 10.4), one fortransmission from the base station to the mobile unit (869–894 MHz), the other fortransmission from the mobile to the base station (824–849 MHz). Each of these bandsis split in two to encourage competition (i.e., so that in each market two operatorscan be accommodated). An operator is allocated only 12.5 MHz in each direction forits system. The channels are spaced 30 kHz apart, which allows a total of 416 chan-nels per operator. Twenty-one channels are allocated for control, leaving 395 to carrycalls. The control channels are data channels operating at 10 kbps. The conversationchannels carry the conversations in analog using frequency modulation. Controlinformation is also sent on the conversation channels in bursts as data. This numberof channels is inadequate for most major markets, so some way must be found eitherto use less bandwidth per conversation or to reuse frequencies. Both approacheshave been taken in the various approaches to mobile telephony. For AMPS, fre-quency reuse is exploited.
Operation
Each AMPS-capable cellular telephone includes a numeric assignment module(NAM) in read-only memory. The NAM contains the telephone number of thephone, which is assigned by the service provider, and the serial number of the phone,
10 Stallings I 5/15/01 1:30 PM Page 303
304 CHAPTER 10 / CELLULAR WIRELESS NETWORKS
Base station transmission band 869 to 894 MHz
Mobile unit transmission band 824 to 849 MHz
Spacing between forward and reverse channels 45 MHz
Modulation, control channel FSK, 8-kHz peak deviation
Data transmission rate 10 kbps
Error control coding BCH (48, 36,5) and (40, 28,5)
Table 10.4 AMPS Parameters
which is assigned by the manufacturer. When the phone is turned on, it transmits itsserial number and phone number to the MTSO (Figure 10.5); the MTSO maintainsa database with information about mobile units that have been reported stolen anduses serial number to lock out stolen units. The MTSO uses the phone number forbilling purposes. If the phone is used in a remote city, the service is still billed to theuser’s local service provider.
When a call is placed, the following sequence of events occurs [COUC01]:
1. The subscriber initiates a call by keying in the telephone number of the calledparty and presses the send key.
2. The MTSO verifies that the telephone number is valid and that the user is autho-rized to place the call; some service providers require the user to enter a PIN(personal identification number) as well as the called number to counter theft.
3. The MTSO issues a message to the user’s cell phone indicating which trafficchannels to use for sending and receiving.
4. The MTSO sends out a ringing signal to the called party. All of these opera-tions (steps 2 through 4) occur within 10 s of initiating the call.
5. When the called party answers, the MTSO establishes a circuit between thetwo parties and initiates billing information.
6. When one party hangs up, the MTSO releases the circuit, frees the radio chan-nels, and completes the billing information.
AMPS Control Channels
Each AMPS service includes 21 full-duplex 30-kHz control channels, consisting of21 reverse control channels (RCCs) from subscriber to base station, and 21 forward
10 Stallings I 5/15/01 1:30 PM Page 304
10.3 / SECOND-GENERATION TDMA 305
channels base station to subscriber. These channels transmit digital data using FSK.In both channels, data are transmitted in frames.
Figure 10.11a shows the RCC frame structure. The frame begins with a 48-bitprecursor, consisting of a 30-bit bit sync field of alternating ones and zeros, an 11 bitword sync field (11100010010), and a 7-bit digital color code (DCC). The DCC isused to distinguish transmissions in cochannel cells; it is a unique identifier of a basestation and acts as a destination address for an RCC frame. Following the precur-sor, the frame contains from one to 6 words of data. Each word contains 36 data bitsand is encoded using a shortened version of an (n, k, t) � (63, 51, 5) BCH block code(see Table 8.4). In this shortened version, 12 check bits are added to the 36 data bitsto form a 48-bit word. To further increase reliability, each word is transmitted fivetimes in the same frame, and a majority logic is used to recover the word at the basestation. When all the overhead is taken into account, the data rate is on the orderof a few hundred bits per second. Examples of RCC messages include origination,page response, and order confirmation.
The FCC frame structure (Figure 10.11b) starts with a 10-bit bit sync and an11-bit word sync. Each frame contains two words of data. Each word is encodedusing BCH and contains 28 data bits and 12 check bits. Again, for reliability, eachword is repeated five times. In addition, each FCC frame provides informationabout the status (idle or busy) of the corresponding RCC frame through thebusy/idle bits that are inserted every tenth bit in the frame. This brings the totalframe size to 463 bits. At the 10-kbps signaling rate, the data rate (excluding over-head) is about 1.2 kbps. FCC messages include paging messages and frequencyassignment messages.
Finally, control information can be transmitted over a voice channel during aconversation. The mobile unit or the base station can insert a burst of data by turn-ing off the voice FM transmission for about 100 ms and replacing it with an FSK-encoded message. These messages are used to exchange urgent messages, such aschange power level and handoff.
10.3 SECOND-GENERATION TDMA
This section begins our study of second-generation cellular systems. We begin withan overview and then look in detail at one type of second-generation cellular system.
First- and Second-Generation Cellular Systems
First-generation cellular networks, such as AMPS, quickly became highly popular,threatening to swamp available capacity. Second-generation systems have beendeveloped to provide higher-quality signals, higher data rates for support of digitalservices, and greater capacity. [BLAC99] lists the following as the key differencesbetween the two generations:
• Digital traffic channels: The most notable difference between the two genera-tions is that first-generation systems are almost purely analog, whereas second-generation systems are digital. In particular, the first-generation systems are
10 Stallings I 5/15/01 1:30 PM Page 305
306
wor
d 1
wor
d A
wor
d B
wor
d A
wor
d B
wor
d A
wor
d B
wor
d A
wor
d B
wor
d A
wor
d B
wor
d 1
wor
d 1
wor
d 1
wor
d 1
wor
d 2
wor
d 2
wor
d2
wor
d 2
wor
d 2
• •
•
wor
d n
wor
d n
wor
d n
wor
d n
wor
d n
pre-
curs
or
48 bits
48 bits
240
bits
30 b
its11
1110
7 400
bits
240
bits
(a)
Rev
erse
con
trol
cha
nnel
fra
me
stru
ctur
e
(b)
For
war
d co
ntro
l cha
nnel
fra
me
stru
ctur
e
240
bits
40 bits
21 bits
wor
dsy
ncbi
tsy
nc
D C C
wor
dsy
ncbi
tsy
nc
Fig
ure
10.1
1A
MP
S C
ontr
ol C
hann
el F
ram
e F
orm
ats
10 Stallings I 5/15/01 1:30 PM Page 306
10.3 / SECOND-GENERATION TDMA 307
designed to support voice channels using FM; digital traffic is supported onlyby the use of a modem that converts the digital data into analog form. Second-generation systems provide digital traffic channels. These readily support dig-ital data; voice traffic is first encoded in digital form before transmitting. Ofcourse, for second-generation systems, the user traffic (data or digitized voice)must be converted to an analog signal for transmission between the mobileunit and the base station (e.g., see Figure 6.14).
• Encryption: Because all of the user traffic, as well as control traffic, is digitizedin second-generation systems, it is a relatively simple matter to encrypt all ofthe traffic to prevent eavesdropping. All second-generation systems providethis capability, whereas first-generation systems send user traffic in the clear,providing no security.
• Error detection and correction: The digital traffic stream of second-generationsystems also lends itself to the use of error detection and correction tech-niques, such as those discussed in Chapter 8. The result can be very clearvoice reception.
• Channel access: In first-generation systems, each cell supports a number ofchannels. At any given time a channel is allocated to only one user. Second-generation systems also provide multiple channels per cell, but each channelis dynamically shared by a number of users using time division multiple access(TDMA) or code division multiple access (CDMA). We look at TDMA-basedsystems in this section and CDMA-based systems in Section 10.4.
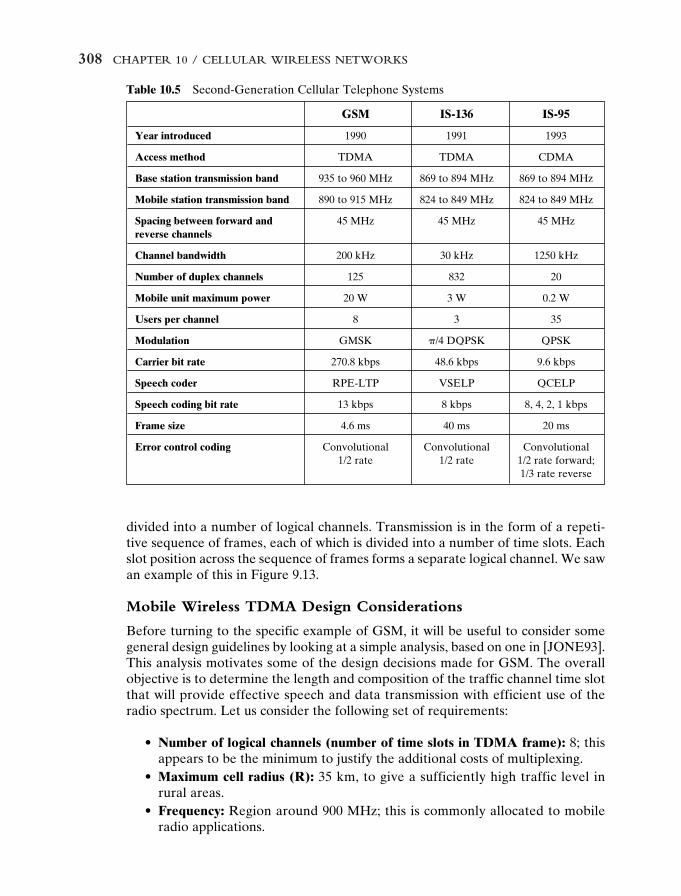
Beginning around 1990, a number of different second-generation systems havebeen deployed. Table 10.5 lists some key characteristics of three of the most impor-tant of these systems.
Time Division Multiple Access
First-generation cellular systems provide for the support of multiple users with fre-quency division multiple access (FDMA). FDMA was introduced in our discussionof satellite communications and the principle is the same here. FDMA for cellular sys-tems can be described as follows. Each cell is allocated a total of 2M channels of band-width � Hz each. Half the channels (the reverse channels) are used for transmissionfrom the mobile unit to the base station: fc, fc � �, fc � 2�, . . . , fc � (M � 1)�, wherefc is the center frequency of the lowest-frequency channel. The other half of the chan-nels (the forward channels) are used for transmission from the base station to themobile unit: fc, fc � � � ∆, fc � 2� � ∆, . . . , fc � (M � 1)� � ∆, where ∆ is the spacingbetween the reverse and forward channels. When a connection is set up for a mobileuser, the user is assigned two channels, at f and f � ∆, for full-duplex communication.This arrangement is quite wasteful, because much of the time one or both of the chan-nels are idle.
TDMA was also introduced in our discussion of satellite communications (e.g.,see Figure 9.14). TDMA for cellular systems can be described as follows. As withFDMA, each cell is allocated a number of channels, half reverse and half forward.Again, for full-duplex communication, a mobile unit is assigned capacity on match-ing reverse and forward channels. In addition, each physical channel is further sub-
10 Stallings I 5/15/01 1:30 PM Page 307
308 CHAPTER 10 / CELLULAR WIRELESS NETWORKS
GSM IS-136 IS-95
Year introduced 1990 1991 1993
Access method TDMA TDMA CDMA
Base station transmission band 935 to 960 MHz 869 to 894 MHz 869 to 894 MHz
Mobile station transmission band 890 to 915 MHz 824 to 849 MHz 824 to 849 MHz
Spacing between forward and 45 MHz 45 MHz 45 MHzreverse channels
Table 10.5 Second-Generation Cellular Telephone Systems
divided into a number of logical channels. Transmission is in the form of a repeti-tive sequence of frames, each of which is divided into a number of time slots. Eachslot position across the sequence of frames forms a separate logical channel. We sawan example of this in Figure 9.13.
Mobile Wireless TDMA Design Considerations
Before turning to the specific example of GSM, it will be useful to consider somegeneral design guidelines by looking at a simple analysis, based on one in [JONE93].This analysis motivates some of the design decisions made for GSM. The overallobjective is to determine the length and composition of the traffic channel time slotthat will provide effective speech and data transmission with efficient use of theradio spectrum. Let us consider the following set of requirements:
• Number of logical channels (number of time slots in TDMA frame): 8; thisappears to be the minimum to justify the additional costs of multiplexing.
• Maximum cell radius (R): 35 km, to give a sufficiently high traffic level inrural areas.
• Frequency: Region around 900 MHz; this is commonly allocated to mobileradio applications.
10 Stallings I 5/15/01 1:30 PM Page 308
10.3 / SECOND-GENERATION TDMA 309
• Maximum vehicle speed (Vm): 250 km/hr, or 69.4 m/s, to accommodate mobileunits on high-speed trains.
• Maximum coding delay: Approximately 20 ms, to avoid adding unduly todelays within the fixed network, which may involve satellite links.
• Maximum delay spread (∆m): 10 (s (in mountainous regions); this is the dif-ference in propagation delay among different multipath signals arriving at thesame antenna.
• Bandwidth: Not to exceed 200 kHz, corresponding to 25 kHz per channel (thecurrent spacing for analog FM cellular systems in Europe).
Figure 10.12 suggests the steps to be considered in designing the TDMA timeslot. We use this as a guide in the following discussion.
The speech coder must provide satisfactory speech quality at minimum datarate. The traditional form of speech coding to produce a digital bit stream is pulsecode modulation (PCM), which, as we saw in Section 6.4, results in a data rate of 64kbps. This rate is undesirably high for use in cellular radio. With current technology,a data rate of 12 kbps is reasonable for producing good-quality speech reproduction.
If we restrict the coding delay to 20 ms, then it would be acceptable to formthe encoded speech into blocks of 20 ms duration, or speech samples of 240 bits.
Speechcoding
Speechsample
Errorcorrection code
Speechblock
Burst design(duration)
Multiplexdesign
Final burstdesign
Maximum durationof speech field
Training sequencefor adaptive filter
Figure 10.12 Steps in Design of TDMA Time Slot
10 Stallings I 5/15/01 1:30 PM Page 309
310 CHAPTER 10 / CELLULAR WIRELESS NETWORKS
Data at 12 kbps could also be blocked in 240-bit units. Error correction can then beapplied to the 240-bit blocks.
For second-generation digital systems, convolutional error-correcting codesare commonly used with a code rate of 1/2. This overhead raises the number of bitsin a block to 480. In addition, there is a constraint factor of 5, meaning that 4 bitsmust be added to the data block to account for the length of the shift register (seeSection 8.3). This brings the speech block length to 488 bits.
With the parameters chosen so far, the minimum bit rate for an eight-channelsystem is
In fact, the bit rate will be somewhat higher to take care of other design considera-tions, discussed subsequently. This means that a data rate of greater than 200 kbpswill need to be carried in the available bandwidth of 200 kHz. In practice, such datarates cannot be achieved without the use of adaptive equalization. As was discussedin Section 5.4, in a mobile environment, adaptive equalization will require the inclu-sion of a new training sequence each time the mobile unit moves a distance suffi-cient to potentially cause changes in transmission path characteristics. Let us assumethat a training sequence is included in each time slot. A rough criterion suggestedin [JONE93] is that the phase angle of the carrier signal should be restricted to achange of 1/20th of a wavelength (an angle of �/10) after the training sequence. At900 MHz, the wavelength is 0.333m. We can calculate
We can take better advantage of the training sequence by transmitting 0.24 msof speech or data both before and after the training sequence and using the trainingsequence on the combined 0.48 ms of data.
Next, we need to determine the length of the training sequence. In the designof an equalizer for a multipath signal whose bandwidth is about equal to the bit rate(200 kHz, 200 kbps), a rule of thumb is that the number of taps on the equalizer(Figure 5.14) should be equal to 6 times the number of bits transmitted in the max-imum dispersal time (∆m � 0.01 ms). Thus, the amount of time in the time slotdevoted to the training sequence is 0.06 ms.
Now consider that a guard interval is needed at the end of each time slot toaccount for the differing amounts of delay between different mobile units and thebase station. Because eight mobile units share the same TDMA frame, it is necessaryto adjust the timing of the transmissions of the mobile units so that the transmissionfrom one unit does not interfere with adjacent time slots. It is the responsibility ofthe base station to provide synchronization information to each mobile unit toadjust relative delays to enforce the time slot structure of the TDMA frame. How-ever, the mobile units may be moving relative to the base station and relative to eachother, so a guard time is inserted in each time slot to account for these discrep-
Maximum transmission duration �l>20
Vm�
0.333>20
69.4� 0.24 ms
8 channels � 488 bits>channel
20 � 10�3 s� 195.2 kbps
10 Stallings I 5/15/01 1:30 PM Page 310
10.3 / SECOND-GENERATION TDMA 311
ancies. When a mobile first makes a connection through the base station, the basestation can provide the mobile unit with timing information based on the currentpropagation delay between the mobile unit and the base station. We would alsolike to add a guard time sufficient to avoid the need to frequently update thissynchronization information. We can calculate the guard time as follows. The aver-age telephone call is about 130 seconds [JONE93], so the radial distance towardor away from the base station that a mobile could cover is (130 s) � (69.4 m/s) �9022 m. The change in propagation delay caused by a movement of this distance is9022/(3 � 108 m/s) � 0.03 ms.
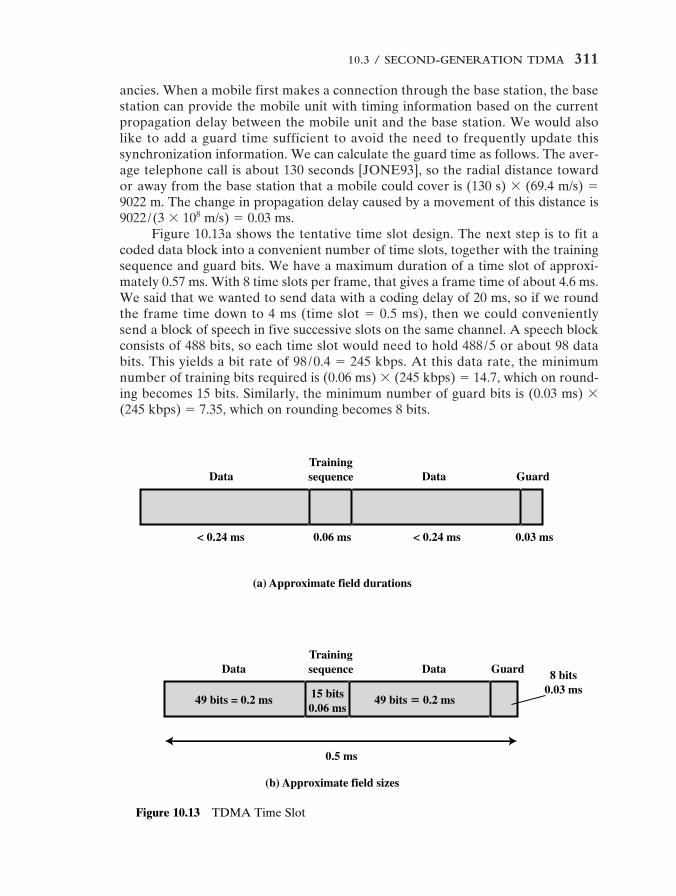
Figure 10.13a shows the tentative time slot design. The next step is to fit acoded data block into a convenient number of time slots, together with the trainingsequence and guard bits. We have a maximum duration of a time slot of approxi-mately 0.57 ms. With 8 time slots per frame, that gives a frame time of about 4.6 ms.We said that we wanted to send data with a coding delay of 20 ms, so if we roundthe frame time down to 4 ms (time slot � 0.5 ms), then we could convenientlysend a block of speech in five successive slots on the same channel. A speech blockconsists of 488 bits, so each time slot would need to hold 488/5 or about 98 databits. This yields a bit rate of 98 /0.4 � 245 kbps. At this data rate, the minimumnumber of training bits required is (0.06 ms) � (245 kbps) � 14.7, which on round-ing becomes 15 bits. Similarly, the minimum number of guard bits is (0.03 ms) �(245 kbps) � 7.35, which on rounding becomes 8 bits.
Data
Data
49 bits = 0.2 ms 49 bits � 0.2 ms15 bits0.06 ms
8 bits0.03 ms
0.5 ms
< 0.24 ms < 0.24 ms0.06 ms
(a) Approximate field durations
(b) Approximate field sizes
0.03 ms
Data
Data
Guard
Guard
Trainingsequence
Trainingsequence
Figure 10.13 TDMA Time Slot
10 Stallings I 5/15/01 1:30 PM Page 311
312 CHAPTER 10 / CELLULAR WIRELESS NETWORKS
The resulting frame structure is shown in Figure 10.13b. We have 121 bitstransmitted in 0.5 ms for a channel bit rate of 242 kbps.
Global System for Mobile Communications
Before the Global System for Mobile Communications (GSM) was developed, thecountries of Europe used a number of incompatible first-generation cellular phonetechnologies. GSM was developed to provide a common second-generation technol-ogy for Europe so that the same subscriber units could be used throughout the conti-nent. The technology has been extremely successful and is probably the most popularstandard, worldwide, for new implementations. GSM first appeared in 1990 inEurope. Similar systems have now been implemented in North and South America,Asia, North Africa, the Middle East, and Australia. The GSM Association claimednearly three-quarters of a billion subscribers worldwide at the end of 2000, the bulkof these in Europe and Asia Pacific, but with over 8 million in North America.
GSM Network Architecture
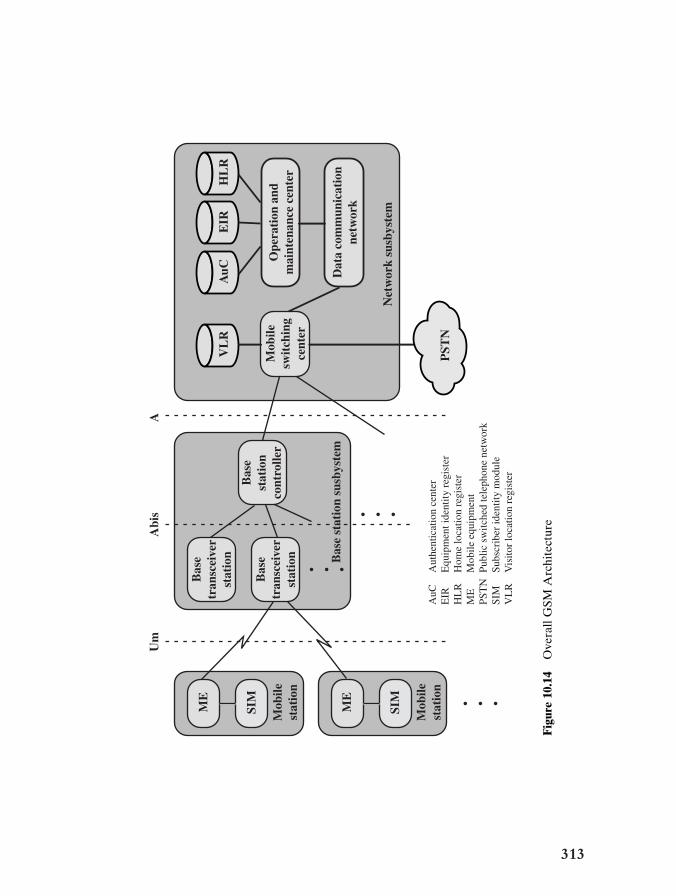
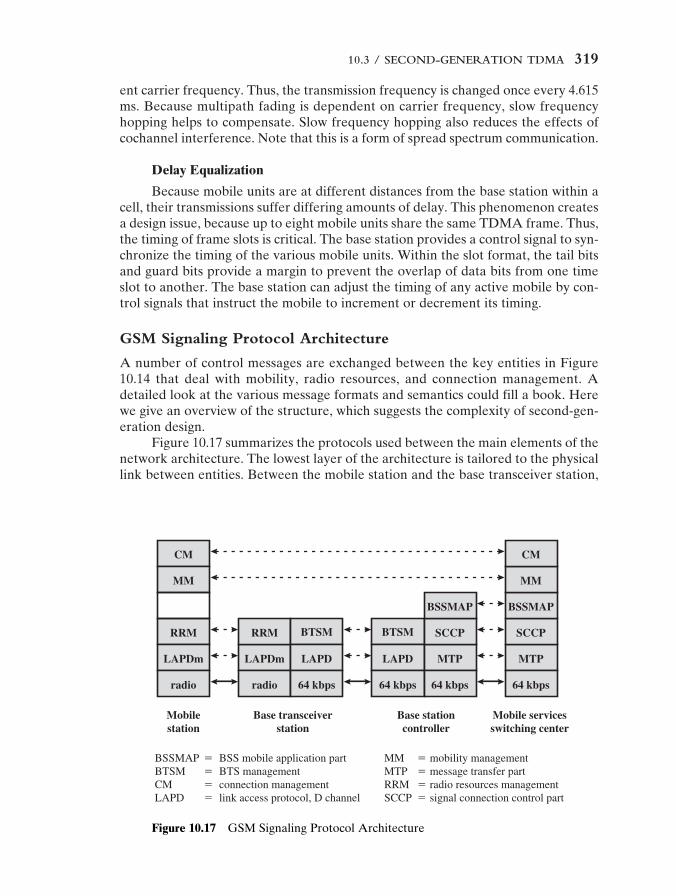
Figure 10.14 shows the key functional elements in the GSM system. The boundariesat Um, Abis, and A refer to interfaces between functional elements that are stan-dardized in the GSM documents. Thus, it is possible to buy equipment from differ-ent vendors with the expectation that they will successfully interoperate. Additionalinterfaces are also defined in the GSM standards but need not concern us here.
Mobile Station
A mobile station communicates across the Um interface, also known as the airinterface, with a base station transceiver in the same cell in which the mobile unit islocated. The mobile equipment (ME) refers to the physical terminal, such as a tele-phone or PCS (personal communications service) device, which includes the radiotransceiver, digital signal processors, and the subscriber identity module (SIM). TheSIM is a portable device in the form of a smart card or plug-in module that storesthe subscriber’s identification number, the networks the subscriber is authorized touse, encryption keys, and other information specific to the subscriber. The GSMsubscriber units are totally generic until an SIM is inserted. Therefore, a subscriberneed only carry his or her SIM to use a wide variety of subscriber devices in manycountries simply by inserting the SIM in the device to be used. In fact, except forcertain emergency communications, the subscriber units will not work without aSIM inserted. Thus, the SIMs roam, not necessarily the subscriber devices.
Base Station Subsystem
A base station subsystem (BSS) consists of a base station controller and oneor more base transceiver stations. Each base transceiver station (BTS) defines asingle cell; it includes a radio antenna, a radio transceiver, and a link to a basestation controller. A GSM cell can have a radius of between 100 m and 35 km,depending on the environment. A base station controller (BSC) may be collocatedwith a BTS or may control multiple BTS units and hence multiple cells. The BSC
10 Stallings I 5/15/01 1:30 PM Page 312
313
ME
Um
Abi
sA
AuC
Aut
hent
icat
ion
cent
erE
IRE
quip
men
t ide
ntity
reg
iste
rH
LR
Hom
e lo
catio
n re
gist
erM
EM
obile
equ
ipm
ent
PST
NPu
blic
sw
itche
d te
leph
one
netw
ork
SIM
Subs
crib
er id
entit
y m
odul
eV
LR
Vis
itor
loca
tion
regi
ster
SIM
Mob
ilest
atio
n
Bas
etr
ansc
eive
rst
atio
n
Bas
est
atio
nco
ntro
ller
Mob
ilesw
itch
ing
cent
er• • •
• • •
• • •
Bas
etr
ansc
eive
rst
atio
n
ME
SIM
Mob
ilest
atio
n
Bas
e st
atio
n su
sbys
tem
Net
wor
k su
sbys
tem
VL
RE
IRH
LR
AuC D
ata
com
mun
icat
ion
netw
ork
Ope
rati
on a
ndm
aint
enan
ce c
ente
r
PST
N
Fig
ure
10.1
4O
vera
ll G
SM A
rchi
tect
ure
10 Stallings I 5/15/01 1:30 PM Page 313
314 CHAPTER 10 / CELLULAR WIRELESS NETWORKS
reserves radio frequencies, manages the handoff of a mobile unit from one cell toanother within the BSS, and controls paging.
Network Subsystem
The network subsystem (NS) provides the link between the cellular networkand the public switched telecommunications networks. The NS controls handoffsbetween cells in different BSSs, authenticates users and validates their accounts, andincludes functions for enabling worldwide roaming of mobile users. The central ele-ment of the NS is the mobile switching center (MSC). It is supported by four data-bases that it controls:
• Home location register (HLR) database: The HLR stores information, bothpermanent and temporary, about each of the subscribers that “belongs” to it(i.e., for which the subscriber has its telephone number associated with theswitching center).
• Visitor location register (VLR) database: One important, temporary piece ofinformation is the location of the subscriber. The location is determined by theVLR into which the subscriber is entered. The visitor location register main-tains information about subscribers that are currently physically in the regioncovered by the switching center. It records whether or not the subscriber isactive and other parameters associated with the subscriber. For a call comingto the subscriber, the system uses the telephone number associated with thesubscriber to identify the home switching center of the subscriber. This switch-ing center can find in its HLR the switching center in which the subscriber iscurrently physically located. For a call coming from the subscriber, the VLRis used to initiate the call. Even if the subscriber is in the area covered by itshome switching center, it is also represented in the switching center’s VLR, forconsistency.
• Authentication center database (AuC): This database is used for authentica-tion activities of the system; for example, it holds the authentication andencryption keys for all the subscribers in both the home and visitor location reg-isters. The center controls access to user data as well as being used for authen-tication when a subscriber joins a network. GSM transmission is encrypted, soit is private. A stream cipher, A5, is used to encrypt the transmission from sub-scriber to base transceiver. However, the conversation is in the clear in the land-line network. Another cipher, A3, is used for authentication.
• Equipment identity register database (EIR): The EIR keeps track of the typeof equipment that exists at the mobile station. It also plays a role in security(e.g., blocking calls from stolen mobile stations and preventing use of the net-work by stations that have not been approved).
Radio Link Aspects
The GSM spectral allocation is 25 MHz for base transmission (935–960 MHz) and25 MHz for mobile transmission (890–915 MHz). Other GSM bands have alsobeen defined outside Europe. Users access the network using a combination of
10 Stallings I 5/15/01 1:30 PM Page 314
10.3 / SECOND-GENERATION TDMA 315
frequency division multiple access (FDMA) and time division multiple access(TDMA) (both are discussed in the next section). There are radio-frequency carri-ers every 200 kHz, which provide for 125 full-duplex channels. The channels aremodulated at a data rate of 270.833 kbps. As with AMPS, there are two types ofchannels, traffic and control.
TDMA Format
GSM uses a complex hierarchy of TDMA frames to define logical channels(Figure 10.15). Fundamentally, each 200-kHz frequency band is divided into 8 log-ical channels defined by the repetitive occurrence of time slots.
At the lowest level is the time slot, also called a burst period, which has a dura-tion of 15/26 ms, or approximately 0.577 ms. With a bit rate of 270.833 kbps, eachtime slot has a length of 156.25 bits. The time slot includes the following fields:
• Trail bits: Allow synchronization of transmissions from mobile units located atdifferent distances from the base station, as explained subsequently.
• Encrypted bits: Data is encrypted in blocks by conventional encryption of 114plaintext bits into 114 ciphertext bits; the encrypted bits are then placed in two57-bit fields in the time slot.
• Stealing bit: Used to indicate whether this block contains data or is “stolen”for urgent control signaling.
• Training sequence: Used to adapt the parameters of the receiver to the cur-rent path propagation characteristics and to select the strongest signal in caseof multipath propagation. The training sequence is a known bit pattern thatdiffers for different adjacent cells. It enables the mobile units and base stationsto determine that the received signal is from the correct transmitter and not astrong interfering transmitter. In addition, the training sequence is used formultipath equalization, which is used to extract the desired signal fromunwanted reflections. By determining how the known training sequence ismodified by multipath fading, the rest of the signal is processed to compensatefor these effects.
• Guard bits: Used to avoid overlapping with other bursts due to differentpath delays.
The time slot format shown in Figure 10.15 is called a normal burst and car-ries user data traffic (compare Figure 10.13b). Other burst formats are used for con-trol signaling.
Moving up the frame format hierarchy, 8-slot TDMA frames are typicallyorganized into a 26-frame multiframe. One of the frames in the multiframe is usedfor control signaling and another is currently unused, leaving 24 frames for data traf-fic. Thus, each traffic channel receives one slot per frame and 24 frames per 120-msmultiframe. The resulting data rate is
114 bits>slot � 24 slots>multiframe
120 ms>multiframe� 22.8 kbps
10 Stallings I 5/15/01 1:30 PM Page 315
316
2047 25
240
12
2046
0
01
2
12
3
5049
1 hy
perf
ram
e �
204
8 su
perf
ram
es ≈
3 h
ours
, 29
min
utes
• •
•
• •
•
• •
•
1 su
perf
ram
e �
51
mul
tifr
ames
= 6
.12
s
01
225
24•
•
•
1 m
ulti
fram
e �
26
fram
es �
120
ms
1 fr
ame
� 8
tim
e sl
ots
� 4
.615
ms
1 ti
mes
lot
� 1
56.2
5 bi
t du
rati
ons
� 0
.577
ms
01
250
49•
•
•
1 m
ulti
fram
e �
51
fram
es �
235
ms
1 su
perf
ram
e �
26
mul
tifr
ames
� 6
.12
s
01
23
45
67
3
trai
lbi
tsst
ealin
gbi
tst
ealin
gbi
t
3 trai
lbi
ts8.25
guar
dbi
ts
57 e
ncry
pted
bit
s57
enc
rypt
ed b
its
26 t
rain
ing
seq
Fig
ure
10.1
5G
SM F
ram
e F
orm
at
10 Stallings I 5/15/01 1:30 PM Page 316
10.3 / SECOND-GENERATION TDMA 317
The GSM specification also allows half-rate traffic channels, with two trafficchannels each occupying one time slot in 12 of the 26 frames. With the use of half-rate speech coders, this effectively doubles the capacity of the system. There is alsoa 51-frame multiframe used for control traffic.
Speech coding
Figure 10.16 provides an overview of the processing of speech signals for trans-mission over a logical traffic channel. We look at each of these steps in turn.
The speech signal is compressed using an algorithm known as Regular PulseExcited—Linear Predictive Coder (RPE-LPE) [KROO86]. In essence, data fromprevious samples are used to predict the current sample. Each sample is then encodedto consist of bits representing the coefficients of the linear combination of previoussamples plus an encoded form of the difference between the predicted and actualsample. The result of the use of this code is to produce 260 bits every 20 ms, for a raw
Speechcoding
Transmitter Receiver
Channelcoding
Bit inter-leaving
Encryp-tion
Burstassembly
Modu-lation
Radio waves
Speechdecoding
Channeldecoding
Bit deinter-leaving
Decryp-tion
Burstdisassembly
Delayequalization
Demodu-lation
Figure 10.16 GSM Speech Signal Processing
10 Stallings I 5/15/01 1:30 PM Page 317
318 CHAPTER 10 / CELLULAR WIRELESS NETWORKS
data rate of 13 kbps. From the point of view of the quality of the speech produced bythis encoding, the bits in the 260-bit block can be divided into three classes:
• Class Ia: 50 bits, most sensitive to bit errors• Class Ib: 132 bits, moderately sensitive to bit errors• Class II: 78 bits, least sensitive to bit errors
The first 50 bits are protected by a 3-bit cyclic redundancy check (CRC) errordetection code. If an error is detected, the entire sample is discarded and replacedby a modified version of the preceding block. These 53 bits plus the 132 class 1bbits, plus a 4-bit tail sequence, are then protected by a convolutional (1, 2, 5) error-correcting code, resulting in 189 � 2 � 378 bits. The remaining 78 bits are unpro-tected and are appended to the protected bit to produce a block of 456 bits, witha resulting data rate of 456/20 ms � 22.8 kbps, which is the GSM traffic channeldata rate.
To add protection against burst errors, each 456-bit block is divided into eight57-bit blocks, which are transmitted in eight consecutive time slots. Because eachtime slot can carry two 57-bit blocks, each burst carries data from two differentspeech samples.
Following these steps, the speech data are encrypted 114 bits at a time, assem-bled into time slots (burst assembly), and finally modulated for transmission. Themodulation scheme, Gaussian minimum shift keying (GMSK), is a form of fre-quency shift keying (FSK).
Data Encoding
Digital data are processed in a similar fashion as applied to speech signals.Data are processed in blocks of 240 bits every 20 ms, for a data rate of 12 kbps.Depending on the way logical channels are defined, the actual supported data ratesare 9.6, 4,8, and 2.4 kbps. Each block is augmented by four tail bits. A (1, 2, 5) con-volutional code is used to produce a block of 244 � 2 � 488 bits. Then 32 bits of thisblock are dropped (puncturing), leaving a block of 456 bits. A bit interleavingscheme is then used to spread the data over multiple bursts, again to reduce theeffects of burst noise. The 488 bits are spread over 22 bursts in the following fashion:
• The 1st and 22nd bursts carry 6 bits each• The 2nd and 21st bursts carry 12 bits each• The 3rd and 20th bursts carry 18 bits each• The 4th through 19th bursts carry 24 bits each
The result is that each burst carries information from 5 or 6 consecutive datablocks.
Slow Frequency Hopping
We have said that a given traffic channel is assigned a given frequency chan-nel for transmission and reception. This is not strictly correct. GSM and many othercellular schemes use a technique known as slow frequency hopping to improve sig-nal quality. Each successive TDMA frame in a given channel is carried on a differ-
10 Stallings I 5/15/01 1:30 PM Page 318
10.3 / SECOND-GENERATION TDMA 319
ent carrier frequency. Thus, the transmission frequency is changed once every 4.615ms. Because multipath fading is dependent on carrier frequency, slow frequencyhopping helps to compensate. Slow frequency hopping also reduces the effects ofcochannel interference. Note that this is a form of spread spectrum communication.
Delay Equalization
Because mobile units are at different distances from the base station within acell, their transmissions suffer differing amounts of delay. This phenomenon createsa design issue, because up to eight mobile units share the same TDMA frame. Thus,the timing of frame slots is critical. The base station provides a control signal to syn-chronize the timing of the various mobile units. Within the slot format, the tail bitsand guard bits provide a margin to prevent the overlap of data bits from one timeslot to another. The base station can adjust the timing of any active mobile by con-trol signals that instruct the mobile to increment or decrement its timing.
GSM Signaling Protocol Architecture
A number of control messages are exchanged between the key entities in Figure10.14 that deal with mobility, radio resources, and connection management. Adetailed look at the various message formats and semantics could fill a book. Herewe give an overview of the structure, which suggests the complexity of second-gen-eration design.
Figure 10.17 summarizes the protocols used between the main elements of thenetwork architecture. The lowest layer of the architecture is tailored to the physicallink between entities. Between the mobile station and the base transceiver station,
CM
MM
RRM
LAPDm
radio
Mobilestation
BSSMAP � BSS mobile application partBTSM � BTS managementCM � connection managementLAPD � link access protocol, D channel
LAPDm
RRM
radio
LAPD
BTSM BTSM
64 kbps
Base transceiverstation
LAPD
64 kbps
MTP
SCCP
BSSMAP
64 kbps
Base stationcontroller
MTP
SCCP
BSSMAP
MM
CM
64 kbps
Mobile servicesswitching center
MM � mobility managementMTP � message transfer partRRM � radio resources managementSCCP � signal connection control part
Figure 10.17 GSM Signaling Protocol Architecture
10 Stallings I 5/15/01 1:30 PM Page 319
320 CHAPTER 10 / CELLULAR WIRELESS NETWORKS
the radio link discussed in preceding subsections carries higher-level data inside theTDMA format. Between other entities a standard 64-kbps digital channel is used.
At the link layer, a data link control protocol (see Figure 4.3) known asLAPDm is used. This is a modified version of the LAPD protocol defined for theIntegrated Services Digital Network (ISDN). The remaining links use the normalLAPD protocol. In essence, LAPD is designed to convert a potentially unreliablephysical link into a reliable data link. It does this by using a cyclic redundancy checkto perform error detection (discussed in Section 8.1) and automatic repeat request(ARQ) to retransmit damaged frames (discussed in Section 8.4).3
Above the link layer are a number of protocols that provide specific functions.These include the following:
• Radio resource management: Controls the setup, maintenance, and termina-tion of radio channels, including handoffs.
• Mobility management: Manages the location updating and registration proce-dures, as well as security and authentication.
• Connection management: Handles the setup, maintenance, and termination ofcalls (connections between end users).
• Mobile application part (MAP): Handles most of the signaling between differ-ent entities in the fixed part of the network, such as between the HLR and VLR.
• BTS management: Performs various management and administrative functionsat the base transceiver station, under the control of the base station controller.
The MAP does not run directly on top of the link layer but rather on top oftwo intermediate protocols, SCCP and MTP. These latter protocols are part ofSignaling System Number 7, which is a set of protocols designed to provide controlsignaling within digital circuit-switching networks, such as digital public telecom-munications networks. These protocols provide general functions used by variousapplications, including MAP.
10.4 SECOND-GENERATION CDMA
Code division multiple access (CDMA) is a spread spectrum–based technique formultiplexing, introduced in Section 7.4, that provides an alternative to TDMA forsecond-generation cellular networks. We begin this section with an overview ofthe advantages of the CDMA approach and then look at the most widely used scheme,IS-95.
Code Division Multiple Access
CDMA for cellular systems can be described as follows. As with FDMA, each cellis allocated a frequency bandwidth, which is split into two parts, half for reverse
3See Appendix D for a discussion of data link control protocols.
10 Stallings I 5/15/01 1:30 PM Page 320
10.4 / SECOND-GENERATION CDMA 321
(mobile unit to base station) and half for forward (base station to mobile unit). Forfull-duplex communication, a mobile unit uses both reverse and forward channels.Transmission is in the form of direct-sequence spread spectrum (DS-SS), which usesa chipping code to increase the data rate of the transmission, resulting in anincreased signal bandwidth. Multiple access is provided by assigning orthogonalchipping codes to multiple users, so that the receiver can recover the transmissionof an individual unit from multiple transmissions.
CDMA has a number of advantages for a cellular network:
• Frequency diversity: Because the transmission is spread out over a largerbandwidth, frequency-dependent transmission impairments, such as noisebursts and selective fading, have less effect on the signal.
• Multipath resistance: In addition to the ability of DS-SS to overcome multi-path fading by frequency diversity, the chipping codes used for CDMA notonly exhibit low cross correlation but also low autocorrelation. Therefore, aversion of the signal that is delayed by more than one chip interval does notinterfere with the dominant signal as much as in other multipath environments.
• Privacy: Because spread spectrum is obtained by the use of noiselike signals,where each user has a unique code, privacy is inherent.
• Graceful degradation: With FDMA or TDMA, a fixed number of users can accessthe system simultaneously. However, with CDMA, as more users access thesystem simultaneously, the noise level and hence the error rate increases; onlygradually does the system degrade to the point of an unacceptable error rate.
A number of drawbacks of CDMA cellular should also be mentioned:
• Self-jamming: Unless all of the mobile users are perfectly synchronized, thearriving transmissions from multiple users will not be perfectly aligned on chipboundaries. Thus the spreading sequences of the different users are notorthogonal and there is some level of cross correlation. This is distinct fromeither TDMA or FDMA, in which for reasonable time or frequency guard-bands, respectively, the received signals are orthogonal or nearly so.
• Near-far problem: Signals closer to the receiver are received with less attenua-tion than signals farther away. Given the lack of complete orthogonality, thetransmissions from the more remote mobile units may be more difficult torecover. Thus, power control techniques are very important in a CDMA system.
• Soft handoff: As is discussed subsequently, a smooth handoff from one cell tothe next requires that the mobile acquires the new cell before it relinquishesthe old. This is referred to as a soft handoff and is more complex than the hardhandoff used in FDMA and TDMA schemes.
Mobile Wireless CDMA Design Considerations
Before turning to the specific example of GSM, it will be useful to consider somegeneral design elements of a CDMA cellular system.
10 Stallings I 5/15/01 1:30 PM Page 321
322 CHAPTER 10 / CELLULAR WIRELESS NETWORKS
RAKE Receiver
In a multipath environment, which is common in cellular systems, if the mul-tiple versions of a signal arrive more than one chip interval apart from each other,the receiver can recover the signal by correlating the chip sequence with the domi-nant incoming signal. The remaining signals are treated as noise. However, even bet-ter performance can be achieved if the receiver attempts to recover the signals frommultiple paths and then combine them, with suitable delays. This principle is usedin the RAKE receiver.
Figure 10.18 illustrates the principle of the RAKE receiver. The originalbinary signal to be transmitted is spread by the exclusive-OR (XOR) operation withthe transmitter’s chipping code. The spread sequence is then modulated for trans-mission over the wireless channel. Because of multipath effects, the channel gener-ates multiple copies of the signal, each with a different amount of time delay ( 1, 2,etc), and each with a different attenuation factors (a1, a2, etc.). At the receiver, thecombined signal is demodulated. The demodulated chip stream is then fed into mul-tiple correlators, each delayed by a different amount. These signals are then com-bined using weighting factors estimated from the channel.
⊕
Codegenerator
Binarydata
Modulator
Demodulator
Multipath channel
τ1 a1
τ2
τ3
a2 Σ
a3
RAKE receiver
a'1
c(t – τ1)
a'2 Σ
a'3
⊕
c(t – τ2)
⊕
c(t – τ3)
⊕
Figure 10.18 Principle of RAKE Receiver [PRAS98]
10 Stallings I 5/15/01 1:30 PM Page 322
10.4 / SECOND-GENERATION CDMA 323
Soft Handoff
In an FDMA or TDMA system, neighboring cells use different portions of theavailable frequency spectrum (i.e., the frequency reuse factor N is greater than 1,typically 7). When the signal strength of a neighboring cell exceeds that of the cur-rent cell, plus a threshold, the mobile station is instructed to switch to a new fre-quency band that is within the allocation of the new cell. This is referred to as a hardhandoff. In a typical CDMA cellular system, spatial separation of frequencies is notused (i.e., N � 1), because most of the time the interference from neighboring cellswill not prohibit correct reception of a DS-SS signal.
In soft handoff, a mobile station is temporarily connected to more than onebase station simultaneously. A mobile unit may start out assigned to a single cell. Ifthe unit enters a region in which the transmissions from two base stations are com-parable (within some threshold of each other), the mobile unit enters the soft hand-off state in which it is connected to the two base stations. The mobile unit remainsin this state until one base station clearly predominates, at which time it is assignedexclusively to that cell.
While in the soft handoff state, the transmissions from the mobile unit reach-ing the two base stations are both sent on to the mobile switching center, whichestimates the quality of the two signals and selects one. The switch sends data ordigitized speech signals to both base stations, which transmit them to the mobileunit. The mobile unit combines the two incoming signals to recover the information.
IS-95
The most widely used second-generation CDMA scheme is IS-95, which is primar-ily deployed in North America. Table 10.5 lists some key parameters of the IS-95system. The transmission structures on the forward and reverse links differ and aredescribed separately.
IS-95 Forward Link
Table 10.6 lists forward link channel parameters. The forward link consists of up to64 logical CDMA channels each occupying the same 1228-kHz bandwidth (Figure10.19a). The forward link supports four types of channels:
• Pilot (channel 0): A continuous signal on a single channel. This channel allowsthe mobile unit to acquire timing information, provides phase reference for thedemodulation process, and provides a means for signal strength comparison forthe purpose of handoff determination. The pilot channel consists of all zeros.
• Synchronization (channel 32): A 1200-bps channel used by the mobile stationto obtain identification information about the cellular system (system time,long code state, protocol revision, etc.).
• Paging (channels 1 to 7): Contain messages for one or more mobile stations.• Traffic (channels 8 to 31 and 33 to 63): The forward channel supports 55 traf-
fic channels. The original specification supported data rates of up to 9600 bps.A subsequent revision added a second set of rates up to 14,400 bps.
10 Stallings I 5/15/01 1:30 PM Page 323
324
Cha
nnel
Sync
Pag
ing
Tra
ffic
Rat
e Se
t 1
Tra
ffic
Rat
e Se
t 2
Dat
a ra
te (
bps)
1200
4800
9600
1200
2400
4800
9600
1800
3600
7200
1440
0
Cod
e re
peti
tion
22
18
42
18
42
1
Mod
ulat
ion
sym
bol r
ate
(sps
)48
0019
,200
19,2
0019
,200
19,2
0019
,200
19,2
0019
,200
19,2
0019
,200
19,2
00
PN
chi
ps/ m
odul
atio
n sy
mbo
l25
664
6464
6464
6464
6464
64
PN
chi
ps/b
it10
2425
612
810
2451
225
612
868
2.67
341.
3317
0.67
85.3
3
Tab
le10
.6IS
-95
For
war
d L
ink
Cha
nnel
Par
amet
ers
10 Stallings I 5/15/01 1:30 PM Page 324
10.4 / SECOND-GENERATION CDMA 325
Note that all of these channels use the same bandwidth. The chipping code isused to distinguish among the different channels. For the forward channel, the chip-ping codes are the 64 orthogonal 64-bit codes derived from a 64 � 64 Walsh matrix(discussed in Section 7.5; see Figure 7.17).
Figure 10.20 shows the processing steps for transmission on a forward trafficchannel using rate set 1. For voice traffic, the speech is encoded at a data rate of8550 bps. After additional bits are added for error detection, the rate is 9600 bps.The full channel capacity is not used when the user is not speaking. During quietperiods the data rate is lowered to as low as 1200 bps. The 2400-bps rate is used totransmit transients in the background noise, and the 4800 bps rate is used to mix dig-itized speech and signaling data.
The data or digitized speech is transmitted in 20-ms blocks with forward errorcorrection provided by a convolutional encoder with rate 1/2, thus doubling the effec-tive data rate to a maximum of 19.2 kbps. For lower data rates, the encoder outputbits (called code symbols) are replicated to yield the 19.2-kbps rate. The data are theninterleaved in blocks to reduce the effects of errors by spreading them out.
Following the interleaver, the data bits are scrambled. The purpose of this isto serve as a privacy mask and also to prevent the sending of repetitive patterns,which in turn reduces the probability of users sending at peak power at the sametime. The scrambling is accomplished by means of a long code that is generated asa pseudorandom number from a 42-bit long shift register. The shift register is ini-tialized with the user’s electronic serial number. The output of the long code gen-erator is at a rate of 1.2288 Mbps, which is 64 times the rate of 19.2 kbps, so only
Pilot channel
1.228 MHz
01
789
313233
63
Paging channel
Paging channelTraffic channel 1Traffic channel 2
••
•
••
Traffic channel 24Synchronization channel
Traffic channel 25
Traffic channel 55
(a) Forward channels
Wal
sh c
ode
Access channel
1.228 MHz
12
≥ 32123
≥ 62
Access channel
Access channel
•••••
•••••
Traffic channelTraffic channelTraffic channel
Traffic channel
(b) Reverse channels
Dis
tinc
t lo
ng c
ode
Use
r-sp
ecif
ic lo
ng c
ode
Figure 10.19 IS-95 Channel Structure
10 Stallings I 5/15/01 1:30 PM Page 325
326 CHAPTER 10 / CELLULAR WIRELESS NETWORKS
one bit in 64 is selected (by the decimator function). The resulting stream is XORedwith the output of the block interleaver.
The next step in the processing inserts power control information in the traf-fic channel. The power control function of the base station robs the traffic channelof bits at a rate of 800 bps. These are inserted by stealing code bits. The 800-bpschannel carries information directing the mobile unit to increment, decrement, orkeep stable its current output level. This power control stream is multiplexed intothe 19.2 kbps by replacing some of the code bits, using the long code generator toencode the bits.
Add framequality indica-tors for 9600 &4800 bps rates
8.6 kbps4.0 kbps2.0 kbps0.8 kbps
9.6 kbps4.8 kbps2.4 kbps1.2 kbps
19.2 kbps9.6 kbps4.8 kbps2.4 kbps
Codesymbol
19.2 ksps
800 Hz
19.2 ksps
19.2 ksps
19.2 ksps
Codesymbol
19.2 ksps
19.2 ksps
Codesymbol
9.2 kbps4.4 kbps2.0 kbps0.8 kbps
Add 8-bitencoder tail
Convolutionalencoder
(n, k, K) � (2, 1, 9)
QPSKmodulator
Long codegenerator
Long code maskfor user m
Power controlbits 800 bps
Transmittedsignal
PN chip1.2288 Mcps
1.2288 Mcps
Walshcode n
Symbolrepetition
Blockinterleaver
Forward traffic channelinformation bits
(172, 80, 40, or 16 b/frame)
Decimator
Decimator Multiplexor
⊕
⊕
Figure 10.20 IS-95 Forward Link Transmission
10 Stallings I 5/15/01 1:30 PM Page 326
10.4 / SECOND-GENERATION CDMA 327
The next step in the process is the DS-SS function, which spreads the 19.2 kbpsto a rate of 1.2288 Mbps using one row of the 64 � 64 Walsh matrix. One row of thematrix is assigned to a mobile station during call setup. If a 0 bit is presented to theXOR function, then the 64 bits of the assigned row are sent. If a 1 is presented, thenthe bitwise XOR of the row is sent. Thus, the final bit rate is 1.2288 Mbps. This dig-ital bit stream is then modulated onto the carrier using a QPSK modulation scheme.Recall from Chapter 6 that QPSK involves creating two bits streams that are sepa-rately modulated (see Figure 6.6). In the IS-95 scheme, the data are split into I andQ (in-phase and quadrature) channels and the data in each channel are XORed witha unique short code. The short codes are generated as pseudorandom numbers froma 15-bit long shift register.
IS-95 Reverse Link
Table 10.7 lists reverse link channel parameters. The reverse link consists of up to 94logical CDMA channels each occupying the same 1228-kHz bandwidth (Figure 10.19b).The reverse link supports up to 32 access channels and up to 62 traffic channels.
The traffic channels in the reverse link are mobile unique. Each station has aunique long code mask based on its electronic serial number. The long code maskis a 42-bit number, so there are 242 � 1 different masks. The access channel is usedby a mobile to initiate a call, to respond to a paging channel message from the basestation, and for a location update.
Figure 10.21 shows the processing steps for transmission on a reverse trafficchannel using rate set 1. The first few steps are the same as for the forward channel.For the reverse channel, the convolutional encoder has a rate of 1/3, thus tripling theeffective data rate to a maximum of 28.8 kbps. The data are then block interleaved.
The next step is a spreading of the data using the Walsh matrix. The way inwhich the matrix is used, and its purpose, are different than that of the forwardchannel. In the reverse channel, the data coming out of the block interleaver aregrouped in units of 6 bits. Each 6-bit unit serves as an index to select a row of the64 � 64 Walsh matrix (26 � 64), and that row is substituted for the input. Thus thedata rate is expanded by a factor of 64/6 to 307.2 kbps. The purpose of this encodingis to improve reception at the base station. Because the 64 possible codings areorthogonal, the block coding enhances the decision-making algorithm at the receiverand is also computationally efficient (see [PETE95] for details). We can view thisWalsh modulation as a form of block error-correcting code with (n, k) � (64, 6) anddmin � 32. In fact, all distances are 32.
The data burst randomizer is implemented to help reduce interference fromother mobile stations (see [BLAC99] for a discussion). The operation involves usingthe long code mask to smooth the data out over each 20-ms frame.
The next step in the process is the DS-SS function. In the case of the reversechannel, the long code unique to the mobile is XORed with the output of therandomizer to produce the 1.2288-Mbps final data stream. This digital bit stream isthen modulated onto the carrier using an orthogonal QPSK modulation scheme.This differs from the forward channel in the use of a delay element in the modula-tor (Figure 6.6) to produce orthogonality. The reason the modulators are differentis that in the forward channel, the spreading codes are orthogonal, all coming from
10 Stallings I 5/15/01 1:30 PM Page 327
328
Cha
nnel
Acc
ess
Tra
ffic
-Rat
e Se
t 1
Tra
ffic
-Rat
e Se
t 2
Dat
a ra
te (
bps)
4800
1200
2400
4800
9600
1800
3600
7200
1440
0
Cod
e ra
te1/
31/
31/
31/
31/
31/
21/
21/
21/
2
Sym
bol r
ate
befo
re r
epet
itio
n (s
ps)
14,4
0036
0072
0014
,400
28,8
0036
0072
0014
,400
28,8
00
Sym
bol r
epet
itio
n2
84
21
84
21
Sym
bol r
ate
afte
r re
peti
tion
(sp
s)28
,800
28,8
0028
,800
28,8
0028
,800
28,8
0028
,800
28,8
0028
,800
Tra
nsm
it d
uty
cycl
e1
1/8
1/4
1/2
11/
81/
41/
21
Cod
e sy
mbo
ls/m
odul
atio
n sy
mbo
l6
66
66
66
66
PN
chi
ps/ m
odul
atio
n sy
mbo
l25
625
625
625
625
625
625
625
625
6
PN
chi
ps/b
it25
612
812
812
812
825
6/3
256/
325
6/3
256/
3
Tab
le10
.7IS
-95
Rev
erse
Lin
k C
hann
el P
aram
eter
s
10 Stallings I 5/15/01 1:30 PM Page 328
10.5 / THIRD-GENERATION SYSTEMS 329
the Walsh matrix, whereas in the reverse channel, orthogonality of the spreadingcodes is not guaranteed.
10.5 THIRD-GENERATION SYSTEMS
The objective of the third-generation (3G) of wireless communication is to providefairly high-speed wireless communications to support multimedia, data, and videoin addition to voice. The ITU’s International Mobile Telecommunications for the
Add framequality indica-tors for 9600 &4800 bps rates
8.6 kbps4.0 kbps2.0 kbps0.8 kbps
9.6 kbps4.8 kbps2.4 kbps1.2 kbps
28.8 kbps14.4 kbps7.2 kbps3.6 kbps
Codesymbol
28.8 kspsCode
symbol
28.8 kspsCode
symbol
4.8 ksps(307.2 kcps)
Modulationsymbol
(Walsh chip)
9.2 kbps4.4 kbps2.0 kbps0.8 kbps
Add 8-bitencoder tail
Convolutionalencoder
(n, k, K) � (3, 1, 9)
64-aryorthogonalmodulator
Data burstrandomizer
OQPSKmodulator
Long codegenerator
Long codemask
Transmittedsignal
PN chip1.2288 Mpbs
Symbolrepetition
Blockinterleaver
Reverse traffic channelinformation bits
(172, 80, 40, or 16 b/frame)
⊕
Figure 10.21 IS-95 Reverse Link Transmission
10 Stallings I 5/15/01 1:30 PM Page 329
330 CHAPTER 10 / CELLULAR WIRELESS NETWORKS
year 2000 (IMT-2000) initiative has defined the ITU’s view of third-generation capa-bilities as follows:
• Voice quality comparable to the public switched telephone network• 144 kbps data rate available to users in high-speed motor vehicles over large areas• 384 kbps available to pedestrians standing or moving slowly over small areas• Support (to be phased in) for 2.048 Mbps for office use• Symmetrical and asymmetrical data transmission rates• Support for both packet switched and circuit switched data services• An adaptive interface to the Internet to reflect efficiently the common asym-
metry between inbound and outbound traffic• More efficient use of the available spectrum in general• Support for a wide variety of mobile equipment• Flexibility to allow the introduction of new services and technologies
More generally, one of the driving forces of modern communication technology isthe trend toward universal personal telecommunications and universal communica-tions access. The first concept refers to the ability of a person to identify himself orherself easily and use conveniently any communication system in an entire country,over a continent, or even globally, in terms of a single account. The second refers tothe capability of using one’s terminal in a wide variety of environments to connectto information services (e.g., to have a portable terminal that will work in the office,on the street, and on airplanes equally well). This revolution in personal computingwill obviously involve wireless communication in a fundamental way. The GSM cel-lular telephony with its subscriber identity module, for example, is a large steptoward these goals.
Personal communications services (PCSs) and personal communication net-works (PCNs) are names attached to these concepts of global wireless communica-tions, and they also form objectives for third-generation wireless.
Generally, the technology planned is digital using time division multipleaccess or code-division multiple access to provide efficient use of the spectrum andhigh capacity.
PCS handsets are designed to be low power and relatively small and light. Effortsare being made internationally to allow the same terminals to be used worldwide.
Alternative Interfaces
Figure 10.22 shows the alternative schemes that have been adopted as part of IMT-2000. The specification covers a set of radio interfaces for optimized performance indifferent radio environments. A major reason for the inclusion of five alternativeswas to enable a smooth evolution from existing first- and second-generation systems.
The five alternatives reflect the evolution from the second-generation. Two ofthe specifications grow out of the work at the European Telecommunications Stan-dards Institute (ETSI) to develop a UMTS (universal mobile telecommunicationssystem) as Europe’s 3G wireless standard. UMTS includes two standards. One of
10 Stallings I 5/15/01 1:30 PM Page 330
10.5 / THIRD-GENERATION SYSTEMS 331
these is known as Wideband CDMA, or W-CDMA. This scheme fully exploitsCDMA technology to provide high data rates with efficient use of bandwidth. Table10.8 shows some of the key parameters of W-CDMA. The other European effortunder UMTS is known as IMT-TC, or TD-CDMA. This approach is a combinationof W-CDMA and TDMA technology. IMT-TC is intended to provide an upgradepath for the TDMA-based GSM systems.
Another CDMA-based system, known as cdma2000, has a North Americanorigin. This scheme is similar to, but incompatible with, W-CDMA, in part becausethe standards use different chip rates. Also, cdma2000 uses a technique known asmulticarrier, not used with W-CDMA.
We have looked at some of the technologies that appear in these 3G systemselsewhere in the book. These include turbo codes (Section 8.3), and Gold codes andvariable-length spreading codes (Section 7.5).
Two other interface specifications are shown in Figure 10.22. IMT-SC is pri-marily designed for TDMA-only networks. IMT-FC can be used by both TDMAand FDMA carriers to provide some 3G services; it is an outgrowth of the DigitalEuropean Cordless Telecommunications (DECT) standard, discussed in Chapter 11.
CDMA Design Considerations
The dominant technology for 3G systems is CDMA. Although three differentCDMA schemes have been adopted, they share some common design issues.[OJAN98] lists the following:
• Bandwidth: An important design goal for all 3G systems is to limit channelusage to 5 MHz. There are several reasons for this goal. On the one hand, a
Radio interface
IMT-DSdirect spread(W-CDMA)
IMT-MCmulticarrier(cdma2000)
IMT-TCtime code
(TD-CDMA)
IMT-SCsingle carrier
(TDD)
IMT-FTfrequency-time
(DECT+)
CDMA-basednetworks
TDMA-basednetworks
FDMA-basednetworks
Figure 10.22 IMT-2000 Terrestrial Radio Interfaces
Spreading (reverse) Same as forward, different time shifts in I and Q channels
Handover Soft handover
Table 10.8 W-CDMA Parameters
bandwidth of 5 MHz or more improves the receiver’s ability to resolve multi-path when compared to narrower bandwidths. On the other hand, availablespectrum is limited by competing needs, and 5 MHz is a reasonable upper limiton what can be allocated for 3G. Finally, 5 MHz is adequate for supportingdata rates of 144 and 384 kHz, the main targets for 3G services.
• Chip rate: Given the bandwidth, the chip rate depends on desired data rate,the need for error control, and bandwidth limitations. A chip rate of 3 Mcpsor more is reasonable given these design parameters.
• Multirate: The term multirate refers to the provision of multiple fixed-data-rate logical channels to a given user, in which different data rates are providedon different logical channels. Further, the traffic on each logical channel canbe switched independently through the wireless and fixed networks to differ-ent destinations. The advantage of multirate is that the system can flexibly sup-port multiple simultaneous applications from a given user and can efficientlyuse available capacity by only providing the capacity required for each service.
10 Stallings I 5/15/01 1:30 PM Page 332
10.5 / THIRD-GENERATION SYSTEMS 333
Timemux
Parallelservices
(a) Time multiplexing
(b) Code multiplexing
Outercoding/
interleaving
Outercoding/
interleaving
Outercoding/
interleaving
•••
Outercoding/
interleaving
Outercoding/
interleaving
Timemux
Timemux
Parallelservices
Figure 10.23 Time and Code Multiplexing Principles [OJAN98]
Multirate can be achieved with a TDMA scheme within a single CDMA chan-nel, in which a different number of slots per frame are assigned to achieve dif-ferent data rates. All the subchannels at a given data rate would be protectedby error correction and interleaving techniques (Figure 10.23a). An alterna-tive is to use multiple CDMA codes, with separate coding and interleaving,and map them to separate CDMA channels (Figure 10.23b).
10.6 RECOMMENDED READING AND WEB SITES
[BERT94] and [ANDE95] are instructive surveys of cellular wireless propagation effects.[POLL96] covers the handoff problem in depth. [EVER94] and [ORLI98] provide goodaccounts of cellular traffic analysis. [BLAC99] is one of the best technical treatments ofsecond-generation cellular systems. A good survey of GSM concepts is [RAHN93]; for moredetail see [GARG99].
10 Stallings I 5/15/01 1:30 PM Page 333
334 CHAPTER 10 / CELLULAR WIRELESS NETWORKS
ANDE95 Anderson, J.; Rappaport, T.; and Yoshida, S. “Propagation Measurements andModels for Wireless Communications Channels.” IEEE Communications Magazine,January 1995.
BERT94 Bertoni, H.; Honcharenko, W.; Maciel, L.; and Xia, H. “UHF PropagationPrediction for Wireless Personal Communications.” Proceedings of the IEEE, Sep-tember 1994.
BLAC99 Black, U. Second-generation Mobile and Wireless Networks. Upper SaddleRiver, NJ: Prentice Hall, 1999.
DINA98 Dinan, E., and Jabbari, B. “Spreading Codes for Direct Sequence CDMA andWideband CDMA Cellular Networks.” IEEE Communications Magazine, September1998.
EVER94 Everitt, D. “Traffic Engineering of the Radio Interface for Cellular Mobile Net-works.” Proceedings of the IEEE, September 1994.
GARG99 Garg, V., and Wilkes, J. Principles and Applications of GSM. Upper SaddleRiver, NJ: Prentice Hall, 1999.
OJAN98 Ojanpera, T., and Prasad, G. “An Overview of Air Interface Multiple Accessfor IMT-2000/UMTS.” IEEE Communications Magazine, September 1998.
ORLI98 Orlik, P., and Rappaport, S. “Traffic Performance and Mobility Modeling ofCellular Communications with Mixed Platforms and Highly Variable Mobilities.”Proceedings of the IEEE, July 1998.
POLL96 Pollini, G. “Trends in Handover Design.” IEEE Communications Magazine,March 1996.
PRAS00 Prasad, R.; Mohr, W.; and Konhauser, W., eds. Third-Generation Mobile Com-munication Systems. Boston: Artech House, 2000.
RAHN93 Rahnema, M. “Overview of the GSM System and Protocol Architecture.”IEEE Communications Magazine, April 1993.
TANT98 Tantaratana, S, and Ahmed, K., eds. Wireless Applications of Spread SpectrumSystems: Selected Readings. Piscataway, NJ: IEEE Press, 1998.
ZENG00 Zeng, M.; Annamalai, A.; and Bhargava, V. “Harmonization of Global Third-generation Mobile Systems. IEEE Communications Magazine, December 2000.
Recommended Web sites:
• Cellular Telecommunications and Internet Association: An industry consortiumthat provides information on successful applications of wireless technology
• GSM World: Lots of information and links concerning GSM• CDMA Development Group: Information and links for IS-95 and CDMA
generally• WOW-com: Site of the Cellular Telecommunications Industry Association
[TANT98] contains reprints of numerous important papers dealing with CDMA in cel-lular networks. [DINA98] provides an overview of both PN and orthogonal spreading codesfor cellular CDMA networks.
[OJAN98] provides an overview of key technical design considerations for 3G systems.Another useful survey is [ZENG00]. [PRAS00] is a much more detailed analysis.
10 Stallings I 5/15/01 1:30 PM Page 334
10.7 / KEY TERMS, REVIEW QUESTIONS, AND PROBLEMS 335
Review Questions
1 What geometric shape is used in cellular system design?2 What is the principle of frequency reuse in the context of a cellular network?3 List five ways of increasing the capacity of a cellular system.4 Explain the paging function of a cellular system.5 List and briefly define different performance metrics that may be used to make the
handoff decision.6 As a mobile unit in communication with base station moves, what factors determine
the need for power control and the amount of power adjustment?7 Explain the difference between open-loop and closed-loop power control.8 What is the difference between traffic intensity and the mean rate of calls in a system?9 What are the key differences between first- and second-generation cellular systems?
10 What are the advantages of using CDMA for a cellular network?11 What are the disadvantages of using CDMA for a cellular network?12 Explain the difference between hard and soft handoff.13 What are some key characteristics that distinguish third-generation cellular systems
from second-generation cellular systems?
Problems
1 Consider four different cellular systems that share the following characteristics. Thefrequency bands are 825 to 845 MHz for mobile unit transmission and 870 to 890 MHzfor base station transmission. A duplex circuit consists of one 30-kHz channel in eachdirection. The systems are distinguished by the reuse factor, which is 4, 7, 12, and 19,respectively.a. Suppose that in each of the systems, the cluster of cells (4, 7, 12, 19) is duplicated
16 times. Find the number of simultaneous communications that can be supportedby each system.
10.7 KEY TERMS, REVIEW QUESTIONS, AND PROBLEMS
Key Terms
Advanced Mobil Phone forward channel power controlService (AMPS) frequency reuse reuse factor
base station Global System for Mobile reverse channelblocking network Communications (GSM) second-generationcellular network handoff (2G) networkclosed-loop power handover soft handoff
control hard handoff third-generation (3G)code division multiple mobile radio network
access (CDMA) nonblocking network time division multiplefirst-generation (1G) open-loop power control access (TDMA)
network
10 Stallings I 5/15/01 1:30 PM Page 335
336 CHAPTER 10 / CELLULAR WIRELESS NETWORKS
b. Find the number of simultaneous communications that can be supported by a sin-gle cell in each system.
c. What is the area covered, in cells, by each system?d. Suppose the cell size is the same in all four systems and a fixed area of 100 cells is
covered by each system. Find the number of simultaneous communications that canbe supported by each system.
2 Describe a sequence of events similar to that of Figure 10.6 fora. a call from a mobile unit to a fixed subscriber.b. a call from a fixed subscriber to a mobile unit.
3 In the discussion of the handoff procedure based on relative signal strength withthreshold, it was pointed out that if the threshold is set quite low, such as Th3, themobile may move far into the new cell (L4). This reduces the quality of the commu-nication link and may result in a dropped call. Can you suggest another drawback tothis scheme?
4 Hysteresis is a technique commonly used in control systems. As an example, describethe hysteresis mechanism used in a household thermostat.
5 A telephony connection has a duration of 23 minutes. This is the only connectionmade by this caller during the course of an hour. How much is the amount of traffic,in Erlangs, of this connection?
6 Using Table 10.3, approximate the answers to the following. Also, in each case, givea description in words of the general problem being solved. Hint: Straight-line inter-polation is adequate.a. Given N � 20, A � 10.5, find P.b. Given N � 20, P � 0.015, find A.c. Given P � 0.005, A � 6, find N.
7 An analog cellular system has a total of 33 MHz of bandwidth and uses two 25-kHzsimplex (one-way) channels to provide full duplex voice and control channels.a. What is the number of channels available per cell for a frequency reuse factor of
(1) 4 cells, (2) 7 cells, and (3) 12 cells?b. Assume that 1 MHz is dedicated to control channels but that only one control
channel is needed per cell. Determine a reasonable distribution of control channelsand voice channels in each cell for the three frequency reuse factors of part (a).
8 As was mentioned, the one-way bandwidth available to a single operator in the AMPSsystem is 12.5 MHz with a channel bandwidth of 30 kHz and 21 control channels. Wewould like to calculate the efficiency with which this system utilizes bandwidth for aparticular installation. Use the following parameters:• Cell area � 8 km2
• Total coverage area � 4000 km2
• Frequency reuse factor � 7• Average number of calls per user during the busy hour � 1.2• Average holding time of a call � 100 s• Call blocking probability � 2%a. How many voice channels are there per cell?b. Use Table 10.3 and a simple straight-line interpolation to determine the total traf-
fic carried per cell, in Erlangs/cell. Then convert that to Erlangs/km2.c. Calculate the number of calls/hour/cell and the number of calls/hour/km2.d. Calculate the number of users/hour/cell and the number of users/hour/channel.e. A common definition of spectral efficiency with respect to modulation, or modu-
lation efficiency, in Erlangs/MHz/km2, is
10 Stallings I 5/15/01 1:30 PM Page 336
10.7 / KEY TERMS, REVIEW QUESTIONS, AND PROBLEMS 337
Determine the modulation efficiency for this system. 9 A cellular system uses FDMA with a spectrum allocation of 12.5 MHz in each direc-
tion, a guard band at the edge of the allocated spectrum of 10 kHz, and a channelbandwidth of 30 kHz. What is the number of available channels?
10 If 8 speech channels are supported on a single radio channel, and if no guard band isassumed, what is the number of simultaneous users that can be accommodated inGSM?
11 a. What is the duration of a bit in GSM?b. If a user is allocated one time slot per frame, what is the delay between successive
transmissions in successive frames? 12 If we consider the trailing bits, stealing bits, guard bits, and training bits in a GSM
frame as overhead, and the rest of the bits as data, then what is the percentage over-head in a GSM frame?
13 Using the definition of slow frequency hopping from Chapter 7, demonstrate thatGSM uses slow frequency hopping.
14 For a cellular system, FDMA spectral efficiency is defined as where
Bc � channel bandwidthBw � total bandwidth in one directionNT � total number of voice channels in the covered area
a. What is an upper bound on �a?b. Determine �a for the system of Problem 8.
15 Consider a 7-cell system covering an area of 3100 km2. The traffic in the seven cells isas follows:
ha �BcNT
Bw,
h �1Total traffic carried by the system 2
1Bandwidth 2 1Total coverage area 2
Each user generates an average of 0.03 Erlangs of traffic per hour, with a mean hold-ing time of 120 s. The system consists of a total of 395 channels and is designed for agrade of service of 0.02.a. Determine the number of subscribers in each cell.b. Determine the number of calls per hour per subscriber.c. Determine the number of calls per hour in each cell.d. Determine the number of channels required in each cell. Hint: You will need to
extrapolate using Table 10.3.e. Determine the total number of subscribers.f. Determine the average number of subscribers per channel.g. Determine the subscriber density per km2.h. Determine the total traffic (total Erlangs).i. Determine the Erlangs per km2.j. What is the radius of a cell?