55
Wake Bus Plan 10-Year Bus Operating and Capital Plan Adopted February 2019

Wake Bus Plan
10-Year Bus Operating and Capital Plan
Adopted February 2019


10-Year Bus Operating and Capital Plan Wake County Transit Plan
i
Table of Contents Page
10-Year Bus Operating Plan .................................................................................................... 1 Introduction ........................................................................................................................... 1 Transit Service Investments ................................................................................................... 2 Year-By-Year Implementation Schedule by Operator........................................................... 12
Capital Investment Program ................................................................................................. 22 Summary .............................................................................................................................. 22 Capital Investment Plan by Investment Type ....................................................................... 26 Program Costs ...................................................................................................................... 27 Capital Investments by Transit Operator .............................................................................. 29
Additional Bus Plan Elements ............................................................................................... 33 Operating Costs .................................................................................................................... 33 Capital Costs ......................................................................................................................... 34 Fares and Fare Revenue ....................................................................................................... 34
Appendix A: Wake Bus Plan Year-By-Year Appendix B: Wake Bus Plan Year-by-Year Capital Plan by Transit Provider Appendix C: Comments and Updated on Draft Versions of 10-Year Plan

10-Year Bus Operating and Capital Plan Wake County Transit Plan
ii
Table of Figures Page
Figure 1 Transit Service Investment: Year-By-Year Net Increase in Cost and Vehicle Revenue Hours ........................................................................................................ 3
Figure 2 2018 Wake Bus Network (Colors Refer to Service Frequency in Peak Periods) ....... 5 Figure 3 2024 Wake Bus Network (Colors Refer to Service Frequency in Peak Periods) ....... 6 Figure 4 2027 Wake Bus Network (Colors Refer to Service Frequency in Peak Periods) ....... 7 Figure 5 Wake Bus Plan – Ridership and Coverage Transition ............................................... 9 Figure 6 Wake Bus Plan – Frequent (15 minutes or better) Transit Service within
Walking Distance to Jobs and Population .............................................................. 10 Figure 7 Wake Bus Plan – Peak Period Transit Services within Walking Distance to Jobs
and Population ...................................................................................................... 10 Figure 8 Wake Bus Plan: Spending Customer Service Oriented Projects as a Portion of
All Capital Investments .......................................................................................... 11 Figure 9 GoCary Year-By-Year Service Changes ................................................................... 13 Figure 10 GoRaleigh Year-By-Year Service Changes .............................................................. 16 Figure 11 GoTriangle Year-By-Year Service Changes ............................................................. 20 Figure 12 Wake Bus Plan Capital Investment Schedule ......................................................... 23 Figure 13 Wake Bus Plan – Distribution of 10-Year Capital Investments by Project Type ..... 23 Figure 14 2027 Wake Bus Capital Infrastructure Network .................................................... 24 Figure 15 2027 Wake Bus Capital Infrastructure – Investments in Fixed Route (FR) Buses ... 26 Figure 16 GoCary’s Capital Investment Schedule .................................................................. 29 Figure 17 GoRaleigh’s Capital Investment Schedule .............................................................. 30 Figure 18 GoTriangle’s Capital Investment Schedule............................................................. 31 Figure 19 Additional Wake Bus Plan Operating Costs ............................................................ 34 Figure 20 Additional Wake Bus Plan Vehicle Costs ................................................................ 34 Figure 21 Wake Bus Plan: Estimated Fare Revenue ............................................................... 35

10-Year Bus Operating and Capital Plan Wake County Transit Plan
Page 1
10-Year Bus Operating PlanINTRODUCTION In 2016, voters in Wake County approved a tax package that will invest $2.3 billion in public transportation services over the 10-year period between 2017 and 2027. The combined investment strategy, branded as the Wake Transit Plan, reflects a vision for transit service development articulated as “Four Big Moves.” The Four Big Moves are:
Connect Regionally: Create cross-county connections by developing a combination of regional rail and businvestments. The investment plan reflects a Durham-Wake commuter rail project as well as a series ofregional express bus routes.
Connect All Wake County Communities: Connect municipalities in Wake County plus the ResearchTriangle Park (RTP) and Raleigh-Durham International Airport (RDU). This investment will include acombination of regional and express bus routes.
Frequent, Reliable Urban Mobility: Develop a frequent transit network in Wake County’s urban core. Thefrequent transit network will include development of bus rapid transit (BRT) services, plus high frequencybus services along major corridors in Wake County.
Enhanced Access to Transit: Directs investment to existing fixed-route services to make service moreconvenient. The investments include expanding transit operating hours, including providing more serviceon weekends more often. These investments also include capital projects that will improve the speed andreliability of bus service, make it easy for passengers to learn about the service and pay fares and createsafe, comfortable areas to wait for the bus.
As part of realizing the Four Big Moves, the Wake Transit Plan includes a series of investment goals that guide the development of the transit network:
Prioritize investment in ridership-justified routes, but continue investment in coverage routes.(Ridership routes concentrate service on a handful of corridors and operate fast direct service. Coverageroutes operate on more streets, less often. Service is less direct but people do not have to walk as far totheir stop.) The Wake Transit Plan sets a system-wide goal of 70% ridership routes and 30% coverageroutes.
Balance investments in transit infrastructure and new services to create a network that will be robustand viable in the long term. The Wake Transit Plan prioritizes service investments in high ridershipcorridors and emphasizes infrastructure investments that improve the speed and reliability of operations.The Wake Transit Plan (including bus services but also higher capacity transit modes like Bus Rapid Transitand Commuter Rail) expects to invest at least half (50%) of available funding to capital projects in the firstfive years of programming.
Ensure the majority of Wake County residents have access to reliable transit services. Specifically, theWake Transit Plan identifies a network that brings transit service within three-quarters of a mile (walkingdistance) of 54% of all Wake County residents and 80% of jobs in Wake County.
Focus investment on projects that will enhance customer service and the user experience. The WakeTransit Plan will prioritize accessibility, comfort, security, reliability, cleanliness, courtesy, andcommunication/wayfinding. Minimum investment targets for projects that enhance customer service and

10-Year Bus Operating and Capital Plan Wake County Transit Plan
Page 2
the user experience are set at roughly 20% for 2019 – 2021; 15% for 2022 – 2024; and 10% for 2025 to 20271.
While the Wake Transit Plan identifies major investment projects and sets strategic goals, it does not dictate or prescribe individual service projects or lay out an implementation schedule. Instead, the Wake Transit Plan’s Transit Planning Advisory Committee (TPAC) working through a Core Technical Team (CTT) developed the Wake Bus Plan to create a year-by-year investment plan and schedule of transit investments over the 10-year development period. The Wake Bus Plan focuses on bus services only and does not reflect investments in high capacity transit services, like Bus Rapid Transit and Commuter Rail.
The Wake Bus Plan was developed with significant community input that was collected in three phases: understanding consumer priorities (Fall 2017), sharing a plan for phasing in transit improvements (Spring 2018) and collecting comments on recommendations proposed between 2019 and 2024 (summer 2018). Ultimately, the recommended Wake Bus Plan reflects an iterative process of technical and financial analysis, community input, and CTT direction.
The resulting Wake Bus Plan schedules the investments, recommending a coordinated set of service and capital projects for implementation. Wake Bus Plan recommendations are summarized in this document in two sections – transit service investments and a corresponding transit capital program. Investments will guide programming for bus services and related capital investments that are implemented as part of annual Wake Transit Work Plans.
TRANSIT SERVICE INVESTMENTS The Wake Transit Plan recommends the investment schedule for transit service implementation between 2019 and 2027 (see Figure 1). The recommended service investments create a service hierarchy that largely reflects a system of four route types:
• Frequent Transit Routes –a network of 10 routes that will operate with 15-minute service and provide service for at least 18 hours a day. The Frequent Transit Routes will operate in Wake County’s densest and most developed corridors and are core services in the network. Frequent transit routes are shown in red in Wake Bus Plan maps.
• Local Routes – operate with 30-minute service for most of the day and will be available for 18 hours a day. These routes serve communities and corridors with moderate density and activity levels. Local bus routes are blue on Wake Bus Plan maps.
• Community (Core Regional) Routes – operate with 60-minute service for most of the day and will operate for up to 14 hours a day. These routes serve lower density corridors and communities and provide connections to the Frequent Transit Network. Community Routes are green on Wake Bus Plan maps.
• Express Services – operate during peak period times, roughly between 6:00 AM and 9:00 AM and between 4:00 PM and 7:00 PM on weekdays. Express routes provide faster, more direct service with fewer stops and connect people to dense job centers.
1 Investments in projects that enhance customer service and the user experience are largely expected to be capital projects. Thus, this investment target is likely to be a subset of the capital investment goal.

10-Year Bus Operating and Capital Plan Wake County Transit Plan
Page 3
The Wake Bus Plan recommends a steady investment over the 10-year period, increasing annual spending on Wake County bus service from over $30 million to approximately $85 million (see Figure 1). The increased spending increases annual hours of bus service from roughly 300,000 annual hours to 800,000 annual hours of service. The financial and bus service hour investment reflects fixed route bus service for all transit service in Wake County includes federal, state and local funds .
Figure 1 Transit Service Investment: Year-By-Year Net Increase in Cost and Vehicle Revenue Hours
The Wake Bus Plan recommends the phasing and implementation of bus services between 2019 and 2027. A year-by-year listing of service investments by service type (frequent, local, express, etc.) by transit provider is included as Appendix A. An overview of how the network will be implemented countywide is shown in a series of maps that highlight the bus network in 2018 (Figure 2), 2024 (Figure 3), and 2027 (Figure 4).
0
100,000
200,000
300,000
400,000
500,000
600,000
700,000
800,000
900,000
$-
$10
$20
$30
$40
$50
$60
$70
$80
$90
An
nu
al R
even
ue
Ho
urs
An
nu
al O
per
atin
g C
ost
Mill
ion
s
Annual Cost Annual Revenue Hours

10-Year Bus Operating and Capital Plan Wake County Transit Plan
Page 4
This page intentionally left blank.

10-Year Bus Operating and Capital Plan Wake County Transit Plan
Page 5
Figure 2 2018 Wake Bus Network (Colors Refer to Service Frequency in Peak Periods)

10-Year Bus Operating and Capital Plan Wake County Transit Plan
Page 6
Figure 3 2024 Wake Bus Network (Colors Refer to Service Frequency in Peak Periods)

10-Year Bus Operating and Capital Plan Wake County Transit Plan
Page 7
Figure 42027 Wake Bus Network (Colors Refer to Service Frequency in Peak Periods)

10-Year Bus Operating and Capital Plan Wake County Transit Plan
Page 8
This page intentionally left blank.

10-Year Bus Operating and Capital Plan Wake County Transit Plan
Page 9
Wake Bus Plan – Progress Towards Goals Goal 1: The Wake Transit Plan sets a system-wide goal of 70% ridership routes and 30% coverage routes.
The Wake Bus Plan will transition Wake County bus network from one that primarily provides coverage-oriented service to one that provides a more productivity-oriented system. In 2018, Wake County’s bus network reflected a split where approximately 74% of bus services provided coverage with 26% of the resources dedicated to productivity routes. By 2027, this balance will be transposed, so that about 65% of resources will fund productivity-oriented service and 35% of the resources will be oriented to providing coverage (see Figure 5). This shifts a large portion of the transit investment in Wake County to the routes that serve riders most efficiently.
Figure 5 Wake Bus Plan – Ridership and Coverage Transition
Goal 2: The Wake Transit Plan (including bus services but also higher capacity transit modes like Bus Rapid Transit and Commuter Rail) expects to invest at least half (50%) of available funding to capital projects in the first five years of programming.
The Wake Transit Plan programmed nearly $309 million in capital investments associated with new buses, bus maintenance facilities, passenger facilities and technologies. Approximately 73% of the capital program – nearly $226 million is scheduled for the first five years of the Bus Plan, between 2018 and 2023. The capital plan includes the purchase of clean fuel buses, development of passenger facilities (transit centers, enhanced transfer facilities, park and ride lots and bus stops) and construction of bus maintenance facilities. Investments in new technologies, including updated fare payment and real time bus information systems are also scheduled during this timeframe.
Goal 3: The Wake Transit Plan identifies a network that brings transit service within three-quarters of a mile (walking distance) of 54% of all Wake County residents and 80% of jobs in Wake County.
One of the clearly stated goals of the Wake Transit Plan is to increase the percentage of Wake County residents and jobs within three-quarters of a mile of bus service. The Wake Transit Plan measured access to transit in terms of both the frequent bus network and transit services available during peak periods.
The Wake Transit Plan defines frequent bus service as service with a bus arriving every 15 minutes (or more frequently). The Bus Plan makes a significant investment in frequent bus service. As a result, the percent of the population within ¾ of a mile of a frequent transit route more than doubles from 8% in 2018 to 21% in 2027. A similar impact is made on employment. In 2018, 20% of all jobs in Wake County are within ¾ of a mile of transit; by 2027, 45% of Wake County jobs are within ¾ mile of frequent transit service (see Figure 6).

10-Year Bus Operating and Capital Plan Wake County Transit Plan
Page 10
Peak period transit services operate during times when travel demand is greatest, defined as traditional commuter times, or 7:00 am to 9:00 am and 4:00 pm to 6:00 pm. The Wake Transit Plan invests in peak period travel with increased service on existing routes and by implementing new routes so all towns in Wake County have access to commuter bus service. In 2018, 57% of Wake County residents have access to bus service. With additional investments in bus services, 65% of Wake County residents will be within ¾ mile of peak period bus service. Eighty-eight percent of the jobs in Wake County are within ¾ of a mile of bus service in 2019. This increases to 93% by 2027 (see Figure 7).
Figure 6 Wake Bus Plan – Frequent (15 minutes or better) Transit Service within Walking Distance to Jobs and Population
Source: Nelson\Nygaard Consulting Associated Estimates were made using the recommended transit network. Underlying population and employment data for 2015 is from US Census and LEHD. Future year data extrapolated from CAMPO Travel Demand Model 2040 forecasts.
Figure 7 Wake Bus Plan – Peak Period Transit Services within Walking Distance to Jobs and Population
Source: Nelson\Nygaard Consulting Associated Estimates were made using the recommended transit network. Underlying population and employment data for 2015 is from US Census and LEHD. Future year data extrapolated from CAMPO Travel Demand Model 2040 forecasts.

10-Year Bus Operating and Capital Plan Wake County Transit Plan
Page 11
Goal 4: Minimum investment targets for projects that enhance customer service and the user experience are set at roughly 20% for 2018 – 2021; 15% for 2022 – 2024; and 10% for 2025 to 20272.
The Wake Transit Plan’s customer service investments include spending on passenger facilities and investments in new technologies that make it easier to know when the next bus arrives and pay for fares. Technology investments also include corridor improvements to strengthen bus service speed and reliability. Other customer service projects include improving and strengthening Wake County’s passenger facilities. The Wake Transit Plan will improve bus stops, passenger transfer locations and park and ride lots across Wake County with better, safer and more comfortable facilities. Of the nearly $309 million in capital investments, the Wake Transit Plan allocates roughly $117 million to vehicle purchases and the remaining $191 million on projects like maintenance facilities, passenger amenities and new technology systems. Over the 10-year period, projects designed to enhance customer service represent approximately $118 million, or about 40% of all Wake Transit Plan funded capital investments. The investment schedule reflects spending (see Figure 8):
Figure 8 Wake Bus Plan: Spending Customer Service Oriented Projects as a Portion of All Capital Investments
Source: Nelson\Nygaard Consulting Associates
2 Investments in projects that enhance customer service and the user experience are largely expected to be capital projects. Thus, this investment target is likely to be a subset of the capital investment goal.
$-
$20,000,000
$40,000,000
$60,000,000
$80,000,000
$100,000,000
$120,000,000
$140,000,000
$160,000,000
$180,000,000
$200,000,000
2018-2021 2022-2024 2025-2027
Customer Service Investments Remaining Capital Projects (Vehicles, Maintenance Facilities, etc.)

Page 12
10-Year Bus Operating and Capital Plan Wake County Transit Plan
YEAR-BY-YEAR IMPLEMENTATION SCHEDULE BY OPERATOR The three fixed-route transit service providers in Wake County, GoCary, GoRaleigh and GoTriangle, are collaborating to implement the Wake Transit Plan. The network will become increasingly integrated as more bus routes connect not only in downtown Raleigh, but at transit centers, park and ride lots and transfer points located throughout the network.
This section summarizes the year-by-year service implementation plans for GoCary, GoRaleigh, and GoTriangle and provides net changes in annual bus revenue hours and estimated costs by route by year. Data shown in this document reflect the costs and hours associated with fixed route service only. These amounts may be different from bus revenue hours and costs shown in other Wake Transit Plan documents, including annual work plans. Differences may reflect a variety of factors, including cost estimation methods and assumptions and/or assumptions about the implementation schedule.
In a handful of cases, responsibility for managing or operating bus routes will change from one transit provider to another. Services transferred between transit providers largely reflect geographic proximity to the route and will increase the operating efficiency of the network overall. In most cases, the transfer of operating / management responsibility is from GoTriangle to GoRaleigh, or GoTriangle to GoCary.
GoCary GoCary operates six fixed routes plus a series of eligibility-based door-to-door services. Fixed route services consist of four routes that span outward in cardinal directions from the downtown transit center, Cary Depot, and two routes that operate in a bidirectional loop along Maynard Road. GoCary also provides paratransit service for individuals unable to use fixed-route bus services, in accordance with the federal Americans with Disabilities Act (ADA).
GoCary Service in the Wake Transit Plan
To date, GoCary services have largely been limited to the Town’s municipal borders. However, with implementation of the Wake Bus Plan, GoCary will operate service in other parts of western Wake County.
Through alignment changes and service additions, the primary goals for GoCary service are serving new areas, improving regional connectivity, and increasing access to employment and commercial clusters. To that end, GoCary intends to expand service from six local routes and one peak-only express route to seven local routes, two regional routes and one express route. GoCary is also planning the following changes:
Service along the entirety of the Maynard loop is transitioned to service along parts of the loop to moredirectly serve activity centers.
GoCary will operate Route HSX connecting Holly Springs, Apex, and Cary; new express service betweenDowntown Cary and the Airport; new service in Morrisville slated for 2027.
Several alignment changes are proposed to streamline service and reduce route deviations andoperational hazards on current Routes 3, 4, 5, and 6.
Division of operating agency: It was originally assumed that GoRaleigh would operate the Hillsboroughroute as well as its two branches (Trinity and Buck Jones). While GoRaleigh maintains operation of theHillsborough trunk route, GoCary will operate the branches. The branches provide direct access todowntown Cary.
Two new local routes are proposed to connect downtown Cary to frequent service in Raleigh alongHillsborough Street: one route via Trinity Road and one via Buck Jones Road.

Page 13
10-Year Bus Operating and Capital Plan Wake County Transit Plan
In addition to service changes funded by the Wake Transit Plan, GoCary is implementing new services that will be funded entirely by the Town of Cary. These new services may include increasing the span of service on certain routes and expanding the frequency on Route 7 Weston Parkway from hourly to 30-minute service on weekdays and Saturday. GoCary will also implement a microtransit zone in West Cary that offers demand response style service that offers pick-ups and drop-offs at 14 designated nodes. These service improvements will be funded entirely by the Town of Cary. However, if the expanded service meets the standards set by the Wake Bus Plan Service Guidelines and Performance Measures, the Town of Cary may apply for Wake Transit Plan funding.
Public Feedback on GoCary Service Proposals
During three rounds of public outreach for GoCary service proposals, the following themes emerged:
Expanding service to new areas such as west Cary is of particularly high priority.
Offer more frequent peak period service.
Provide Express connection between downtown Cary and the airport.
Increase regional connectivity throughout the Towns of western Wake County.
Provide direct access to employment and commercial hubs.
In response to these comments, the following changes were made to the plan:
Route 7 Weston Parkway will provide service to areas currently underserved.
Route 1 Crossroads will provide service largely to areas currently served by Route 1 and 2 Maynard but ata 30-minute frequency rather than the existing 60-minute frequency. Additionally, Route HSX will offernew peak period service between Holly Springs, Apex, and Cary.
A revised express service between Cary and the airport and revised Morrisville service will improveregional connectivity.
Routes 1, 3, 4, 5, and 6 will all be streamlined to provide more direct service to activity hubs.
GoCary Service Investments: 2017 - 2027
GoCary’s year-by-year schedule of transit investments (see Figure 9) will increase GoCary’s annual operating budget from $2.4 million in 2017 to $6 million in 2027. Revenue vehicle hours will increase from approximately 34,000 annual hours to 72,000. In the table below, investments (revenue hours, operating costs, and peak vehicles) are expressed as an increase or decrease from the previous year.
Figure 9 GoCary Year-By-Year Service Changes
Service Change Route Type
Net Annual Revenue
Hours
Net Annual Operating
Costs Net Peak Vehicles
Fiscal Year 2019
Route 1 Maynard CW eliminated Local (5,724) ($483,257) (1)
Route 2 Maynard CCW eliminated Local (5,724) ($483,257) (1)
Route 1 Crossroads service begins Local 11,831 $999,023 2
Route 3 Harrison alignment change Local 0 $0 0
Route 4 High House minor straightening Local 0 $0 0

10-Year Bus Operating and Capital Plan Wake County Transit Plan
Page 14
Service Change Route Type
Net Annual Revenue
Hours
Net Annual Operating
Costs Net Peak Vehicles
Route 5 Kildaire Farm minor straightening Local 0 $0 0
Route 5 KFX Kildaire Farm Express - Eliminated
Express PM Peak Only
(383) ($32,509) (1)
Route 6 Buck Jones alignment change, renamed to Route 9B Local 0 $0 0
Route 7 Weston Parkway (reflects half-year of service / 6 month investment only) Local 3,627 $308,262 2
Subtotal 3,627 $308,262 1
Fiscal Year 2020
Route HSX Holly Springs-Apex-Cary Express service begins
Express Peak Periods Only
3,231 $266,574 2
Subtotal 3,231 $266,574 2
Fiscal Year 2021
Route 9B Buck Jones (previously Route 6) Span Increased Local 2,206 $233,479 0
Subtotal 2,206 $233,479 0
Fiscal Year 2024
New Route 9A Trinity Local 12,178 $1,171,030 2
Subtotal 12,178 $1,171,030 2
Fiscal Year 2027
New Morrisville Route Core Regional 5,011 $518,905 1
New Cary-Airport Route Core Regional 11,664 $1,207,845 2
Subtotal 16,675 $1,726,750 3
Source: Nelson\Nygaard Consulting Associates
Notes: Assumes 365 days of service (255 weekdays, 52 Saturdays, 58 Sundays/Holidays). Does not include projects funded entirely by the Town of Cary. Net annual revenue hours and net annual operating cost for FY2019 service changes, with the exception of Route 7 Weston Parkway, are annualized amounts. However, the amounts shown will be prorated based on the actual implementation schedule.
GoRaleigh GoRaleigh, a division of the City of Raleigh’s Transportation Department, is the largest transit provider in Wake County. Historically, GoRaleigh has operated almost exclusively within the Raleigh City limits. It also operates a handful of services under contract to GoTriangle and the Town of Wake Forest that extend beyond its municipal boundaries. In 2018, GoRaleigh operated 29 fixed bus routes within the City of Raleigh and 5 routes under contract to GoTriangle. GoRaleigh also provides paratransit service for individuals unable to use fixed-route bus services, in accordance with the federal Americans with Disabilities Act (ADA).

10-Year Bus Operating and Capital Plan Wake County Transit Plan
Page 15
GoRaleigh Service in the Wake Transit Plan
The Wake Transit Plan investments will significantly expand GoRaleigh’s bus operations, increasing service by more than threefold between 2017 and 2027, as measured by vehicle revenue service hours (VRH). A majority of the additional investment in GoRaleigh’s network is associated with the Frequent Transit Network. The Frequent Transit Network consists of 10 routes, which will operate with 15-minute service during peak periods and midday. Frequent Transit Network routes will be available up to 18 hours per day.
Many of GoRaleigh’s routes will continue to serve the downtown GoRaleigh station, but there will also be increased service and connections available at other transit centers and transfer points, including Triangle Town Center, Midtown Transit Center, East Raleigh Transit Center, NC State Fairgrounds and Crabtree Valley Mall.
Public Feedback on GoRaleigh Service Proposals
The following themes emerged from public input on GoRaleigh service proposals:
The original plans for serving southwest Raleigh were insufficient given demand.
Investment in bus stops and passenger facilities should be increased.
All service improvements should be phased in as soon as possible.
In response to these comments, the following changes were made to the plan:
The plan for southwest Raleigh was changed significantly, including the addition of a frequent all-dayservice on the existing Route 11 Avent Ferry. Implementation of this frequent transit network route isscheduled for FY26.
Investment in bus stops and passenger facilities was increased.
All implementation was accelerated as much as possible within available resources, and most of thefrequent network will be in place by 2024.
GoRaleigh Investment Schedule
Recommended service investments in GoRaleigh’s operations are intended to meet the Wake Transit Plan goals as quickly and effectively as possible and work within available funding. This implementation schedule will increase GoRaleigh’s annual operating budget and vehicle revenue hours significantly over the ten-year period. In 2017, GoRaleigh’s operating budget was $18.3 million and included roughly 222,000 annual revenue vehicle hours (RVH). By 2027, GoRaleigh’s operating budget will increase to nearly $51 million with nearly 600,000 annual RVH. The Wake Bus Plan investment schedule does reflect planned BRT service (BRT investments are included in the Major Investment Strategy).
Transit service projects by year are included together with changes in annual revenue hours, operating costs, and peak vehicles (see Figure 10) expressed as an increase or decrease from the previous year. Since the new GoRaleigh network is substantially changed, many new routes replace portions of existing routes; in these cases the allocation of net costs to each route below are indicative only.
GoRaleigh will also assume responsibility for express routes that connect communities on the eastern side of Wake County with downtown Raleigh. These express routes include new service (Rolesville) as well as existing routes formerly managed by GoTriangle (Knightdale, Garner, Zebulon/Wendell, Wake Forest and Fuquay-Varina). Assigning service to GoRaleigh increases the efficiency of the bus network overall. It also means that in addition to new funding provided by the Wake Transit Plan, some funding invested by GoTriangle will transfer to GoRaleigh (see Figure 10).

10-Year Bus Operating and Capital Plan Wake County Transit Plan
Page 16
Figure 10 GoRaleigh Year-By-Year Service Changes
Service Change Route Type Net Annual
Revenue Hours Net Annual
Operating Costs Net Peak Vehicles
Fiscal Year 2019 (implemented in January – data reflects 6 months of operations)
Route 17 Rock Quarry Local 6,819 $516,977 2
Route 18 Poole/Barwell Local 2,879 $151,080 0
Route 18S Poole Shortline Local
Peak Periods Only 1,530 $516,977 2
Route 19 MLK Sunnybrook Frequent 7,988 $151,196 2
Route 4 Rex Hospital Local 1,400 ($297,223) (1)
Route 26 Edwards Mill Local 3,868 $484,263 2
Route 27 Blue Ridge Local 6,089 $484,263 2
Route 36 Creedmoor Local 6,089 $484,263 2
Route ZWX Zebulon Express (Note: Reflects cost to Wake Transit Plan only. Actual costs require transfer of $178,910 from GoTriangle to GoRaleigh)
Express 0 $0 0
Subtotal 36,662 $2,491,796 11
Fiscal Year 2020 (all FY19 services operate for the full year in FY20)
Route 33 New Hope-Knightdale (Note: Reflects costs to Wake Transit Plan only. Actual costs include annual transfer of $96,912 from GoTriangle to GoRaleigh (elimination of KRX – Knightdale Express))
Local 2,280 $210,644 0
Route 401 Rolesville Express 1,530 $140,652 1
Route 20/20L Garner and Garner South (Note: Reflects cost to Wake Transit Plan only. Actual costs require annual transfer of $138,446 from GoTriangle to GoRaleigh (elimination of Route 102))
Local 13,029 $1,197,752 2
Subtotal 16,839 $1,489,048 3
Fiscal Year 2021
Route 9 Hillsborough Frequent 20,527 $1,934,217 4
Subtotal 20,527 $1,934,217 4

10-Year Bus Operating and Capital Plan Wake County Transit Plan
Page 17
Service Change Route Type Net Annual
Revenue Hours Net Annual
Operating Costs Net Peak Vehicles
Fiscal Year 2023
Route 33 New Hope-Knightdale (add weekend) Local 1,476 $155,358 0
Route 34 Wake Tech North Local 3,825 $378,668 1
Route 2 Falls of Neuse Local 10,137 $1,003,525 1
Route 2L Falls of Neuse North Local 5,301 $524,790 1
Route 25 Durant Local 6,819 $675,069 1
Route 32 Lynn-Spring Forest Local 1,676 $165,897 0
Route 29 Garner Wake Tech
Local, operates only on certain days in place of
40X
1,020 $100,978 0
Route WFX Wake Forest Express (Note: Reflects cost to Wake Transit Plan only. Actual costs require transfer of $237,576 from GoTriangle to GoRaleigh)
Express 0 $0 0
Route FRX Fuquay Express (Note: No new net effects for Wake Bus Plan in FY23; however, Wake funds shift from GoTriangle to GoRaleigh, annual FY23 amount is $448,391)
Express 0 $0 0
Subtotal 30,254 $3,004,285 4
Fiscal Year 2024
Route 21 Caraleigh Local 5,743 $587,160 1
Route 6 Glenwood Frequent 10,582 $1,078,188 1
Route 6L Glenwood North Local 10,670 $1,082,721 1
Route 6La Glenwood Pleasant Valley Local-Peak Period only 1,530 $155,254 1
Route 8 Six Forks Midtown (Reflects half-year of service / 6 month investment only)
Frequent 7,109 $725,797 2
Route 8L Six Forks North (Reflects half-year of service / 6 month investment only)
Local 6,089 $617,870 2
Route 16 Centennial-Midtown (Reflects half-year of service / 6 month investment only)
Frequent 8,787 $896,045 2

10-Year Bus Operating and Capital Plan Wake County Transit Plan
Page 18
Service Change Route Type Net Annual
Revenue Hours Net Annual
Operating Costs Net Peak Vehicles
Route 5 Biltmore Hills Frequent 6,299 $643,610 1
Route 20/20L Garner and Garner South (add frequency and weekend) Local 11,281 $1,180,692 1
Subtotal 68,090 $6,967,337 12
Fiscal Year 2025
Route 27 Blue Ridge (add frequency) (Reflects half-year of service / 6 month investment only)
Frequent 12,178 $1,297,528 2
Subtotal 12,178 $1,297,528 2
Fiscal Year 2026
Route 11 Avent Ferry Frequent 15,058 $1,605,384 1
Route 31 Southwest Local 4,489 $478,620 1
Route 12 Method Local 65 $6,937 0
Route 3 Glascock Frequent 18,890 $2,013,846 2
Route 10 Raleigh Blvd. Local 7,002 $746,485 1
Route 23 Millbrook Local 13,750 $1,465,917 1
Subtotal 59,254 $6,317,189 6
Fiscal Year 2027
Route 24 New Hope-Crabtree Frequent 49,152 $5,371,110 8
Route 14 Atlantic Local 13,745 $1,501,959 2
Route 28 New Hope-Triangle Local 18,915 $2,066,919 2
Subtotal 81,812 $8,939,988 12
Source: Nelson\Nygaard Consulting Associates
GoTriangle Agency Overview
GoTriangle provides regional transit service connecting Wake, Durham, and Orange Counties. GoTriangle operates thirteen bus routes in Wake County, connecting Raleigh, Cary, and RTP with communities in other parts of the county and beyond. GoTriangle also provides paratransit service for individuals unable to use fixed-route bus services, in accordance with the federal Americans with Disabilities Act (ADA).
GoTriangle Service in the Wake Transit Plan
Over the ten years of the plan, GoTriangle bus service is consolidated into a few core routes with all-day, seven-day-a-week service, with continued or improved service on most existing commuter routes operated during rush

10-Year Bus Operating and Capital Plan Wake County Transit Plan
Page 19
hours on weekdays. A new connection between Cary, Morrisville, and the RTC is also created. Some existing services will be replaced by new or improved GoCary and GoRaleigh services.
While the GoTriangle 10-year operating plan remains fundamentally consistent with the 2016 Wake Transit Plan, a few changes were made during plan development to incorporate public feedback and better align services with demand. Changes from the 2016 Wake Transit Plan include:
Additional service on DRX Durham-Raleigh Express and CRX Chapel Hill-Raleigh Express: these popularroutes have experienced continued ridership growth and some trips are above capacity. Additional tripswill help accommodate more passengers and build ridership for the future commuter rail line.
Additional service on NRX North Raleigh Express: Planned investments in additional park-and-ridefacilities along I-540 will support ridership on additional trips on this newly aligned express route betweenNorth Raleigh and RTP.

10-Year Bus Operating and Capital Plan Wake County Transit Plan
Page 20
Public Feedback on GoTriangle Service Proposals
During public outreach for GoTriangle service proposals, the following themes emerged:
Prioritize regional connections to communities that do not already have local transit service (make theseinvestments in earlier years of the plan).
Expand service on express routes.
Maintain weekday peak service between Raleigh and the RTC as it is today.
In response to these comments, the following changes were made to the plan:
New services to Rolesville, Holly Springs, and Morrisville are proposed for implementation within the firstthree years of the plan.
Express services between Raleigh and Durham and between north Raleigh and RTP are proposed toreceive additional trips.
Peak service between Raleigh and the RTC (Route 105) is proposed to remain unchanged.
Changes in GoTriangle Service Investments and Fleet over Time
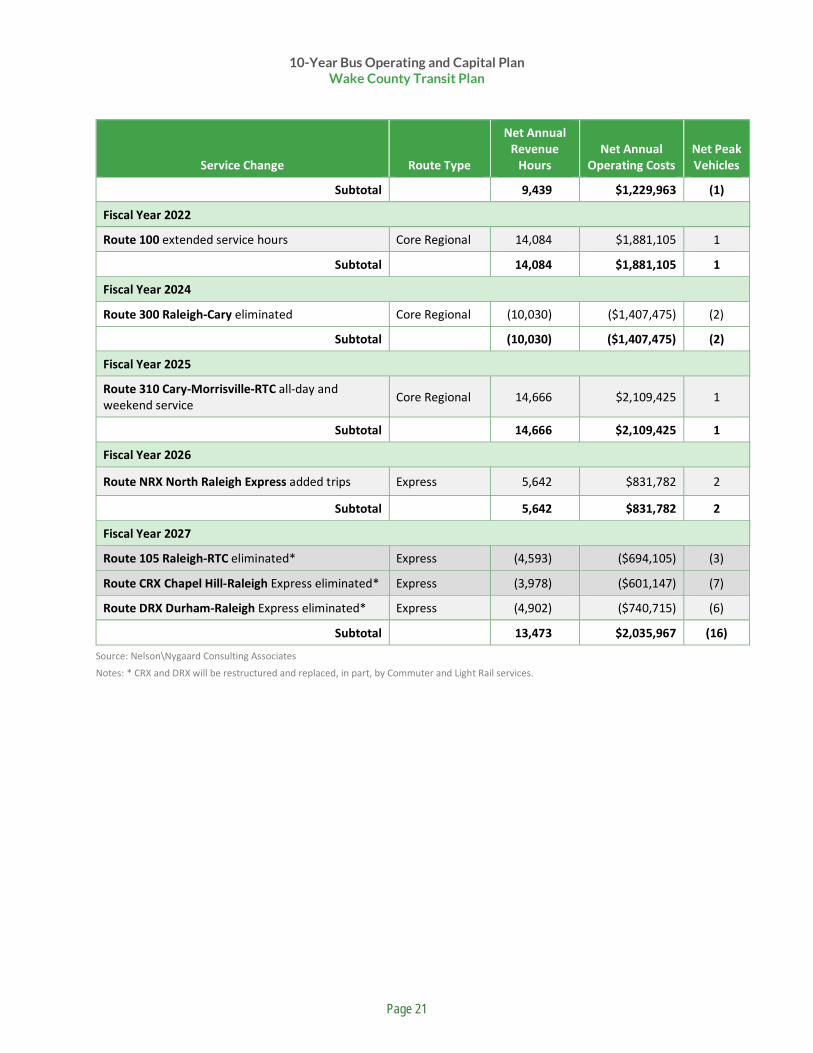
Figure 11 below provides a summary of GoTriangle route changes by year of implementation. Investments (revenue hours, operating costs, and peak vehicles) are expressed as an increase or decrease from the previous year.
Figure 11 GoTriangle Year-By-Year Service Changes
Service Change Route Type
Net Annual Revenue
Hours Net Annual
Operating Costs Net Peak Vehicles
Fiscal Year 2019
Route 100 Raleigh-RTC extended Sunday service Core Regional 212 $26,352 0
Route 300 Cary-Raleigh extended Sunday service Core Regional 67 $8,345 0
Route CRX Chapel Hill-Raleigh Express improved frequency Express 426 $52,896 2
Route DRX Durham-Raleigh Express improved frequency Express 1,701 $211,028 2
Subtotal 2,274 $282,194 4
Fiscal Year 2020
Route 310 Cary-Morrisville-RTC service begins Core Regional 6,280 $798,313 1
Route 311 Apex-RTC alignment change and frequency reduction Express (272) ($34,616) (1)
Subtotal 6,008 $763,697 0
Fiscal Year 2021
Route 305 Apex-Raleigh all-day and weekend service Core Regional 13,706 $1,785,969 3
Route 301 Cary-Raleigh eliminated Express (4,267) ($556,006) (4)
10-Year Bus Operating and Capital Plan Wake County Transit Plan
Page 21
Service Change Route Type
Net Annual Revenue
Hours Net Annual
Operating Costs Net Peak Vehicles
Subtotal 9,439 $1,229,963 (1)
Fiscal Year 2022
Route 100 extended service hours Core Regional 14,084 $1,881,105 1
Subtotal 14,084 $1,881,105 1
Fiscal Year 2024
Route 300 Raleigh-Cary eliminated Core Regional (10,030) ($1,407,475) (2)
Subtotal (10,030) ($1,407,475) (2)
Fiscal Year 2025
Route 310 Cary-Morrisville-RTC all-day and weekend service Core Regional 14,666 $2,109,425 1
Subtotal 14,666 $2,109,425 1
Fiscal Year 2026
Route NRX North Raleigh Express added trips Express 5,642 $831,782 2
Subtotal 5,642 $831,782 2
Fiscal Year 2027
Route 105 Raleigh-RTC eliminated* Express (4,593) ($694,105) (3)
Route CRX Chapel Hill-Raleigh Express eliminated* Express (3,978) ($601,147) (7)
Route DRX Durham-Raleigh Express eliminated* Express (4,902) ($740,715) (6)
Subtotal 13,473 $2,035,967 (16)
Source: Nelson\Nygaard Consulting Associates
Notes: * CRX and DRX will be restructured and replaced, in part, by Commuter and Light Rail services.

10-Year Bus Operating and Capital Plan Wake County Transit Plan
Page 22
Capital Investment Program The Bus Plan recommends the development and phasing of transit service investments between 2019 and 2027. The capital plan supports service implementation with investments in passenger facilities and supporting infrastructure required to make the transit service more accessible, safer, and easier to use. Investments are designed to support bus operations with a robust vehicle replacement plan and investments in existing and new maintenance facilities. The investment plan also includes projects to improve service speed and reliability and ensure adequate maintenance support.
SUMMARY Capital investments are coordinated with transit service investments as much as possible so passengers will have safe, comfortable facilities that are accessible on foot and if appropriate, accessible by car. This means that most of the projects and investments occur in the first five years of the plan (FY19 – FY24).
The 10-year Capital Investment Plan directs $309 million in spending for transit projects (see Figure 12). The largest portion of the funding will be used to purchase buses, develop transit centers and build maintenance facilities (see Figure 13). The schedule includes investments and funding for:
162 fixed route buses and 124 vehicles to support ADA service
Four new transit maintenance facilities and updates to one existing facility
Eight transit centers, five of which are new locations, and three existing facilities that will be updated
1,000 bus stops, including development of new stops and updates to existing stops
New technologies including fare payment systems and corridor investments on those outside the BusRapid Transit corridors to improve bus speed and reliability.
The capital program will ensure that Wake County’s transit infrastructure is fully developed by 2027. It relies on Wake Transit Funding as well as federal and state funds to complete the full slate of recommended investments. The Wake Transit Plan also expects that transit agency partners will compete for grants at the federal, state and local level, including the Locally Administered Projects Program (LAPP). A listing of capital projects by implementation year and transit operator is included as Appendix B.

10-Year Bus Operating and Capital Plan Wake County Transit Plan
Page 23
Figure 12 Wake Bus Plan Capital Investment Schedule
Source: Nelson\Nygaard Consulting Associates
Figure 13 Wake Bus Plan – Distribution of 10-Year Capital Investments by Project Type
Source: Nelson\Nygaard Consulting Associates
$(20,000,000)
$-
$20,000,000
$40,000,000
$60,000,000
$80,000,000
$100,000,000
FY18 FY19 FY20 FY21 FY22 FY23 FY24 FY25 FY26 FY27
Infrastructure Vehicles
Maintenance Facilities
24%
Transit Centers20%
Park-and-Rides3%
Enhanced Transfer Points2%
Existing Bus Stops5%
New Bus Stops4%
Technology Investments
4%
Fixed-Route Buses33%
ADA Replacement Vehicles
5%

10-Year Bus Operating and Capital Plan Wake County Transit Plan
Page 24
Figure 14 2027 Wake Bus Capital Infrastructure Network

10-Year Bus Operating and Capital Plan Wake County Transit Plan
Page 25
This page intentionally left blank.

10-Year Bus Operating and Capital Plan Wake County Transit Plan
Page 26
CAPITAL INVESTMENT PLAN BY INVESTMENT TYPE Safe, comfortable, reliable and well-maintained vehicles are a fundamental part of a successful transit service. The Wake Bus Plan includes projects that will build new maintenance facilities and updating existing ones. It also plans for the purchase of 281 fixed route and ADA paratransit vehicles. The combined program will invest nearly $118 million in transit vehicles over the 10-year period. This accounts for 38% of the capital investment budget.
Fixed Route Buses The largest single portion of the capital program ($117 million) will be used to purchase 157 fixed route buses and 124 ADA paratransit vehicles. Investments in buses include a transition of fuel technology initially from diesel to Compressed Natural Gas (CNG), and newer technologies, as appropriate, in later years of the program.
Bus purchases are required to support the growth in transit services as well as replace vehicles that have reached the end of their useful life. Vehicle purchases are coordinated with the Wake Bus Plan service implementation schedule, meaning vehicle purchases are clustered at the beginning of the Wake Bus Plan (FY18 – FY21) and again towards the end of the investment period (FY24 – FY26) (see Figure 15). Wake Bus Plan fleet needs decline in FY27 when Commuter Rail is implemented, reducing the need for some express bus services, including portions of the Durham-Raleigh Express (DRX) and Chapel Hill-Raleigh Express (CRX). Vehicle purchases are programmed the year before changes in the fleet will occur to allow time for vehicles to be ordered and investments scheduled. In the case of GoTriangle, however, fleet changes to the CRX and DRX are programmed for FY27, the year they are expected to occur.
Figure 15 2027 Wake Bus Capital Infrastructure – Investments in Fixed Route (FR) Buses
-10
-5
0
5
10
15
20
25
30
FY18 FY19 FY20 FY21 FY22 FY23 FY24 FY25 FY26 FY27
FR Buses Replace Existing Fleet FR Buses Expansion FR Buses Leased (Expansion)

10-Year Bus Operating and Capital Plan Wake County Transit Plan
Page 27
ADA Buses A much smaller portion of the capital program ($14 million) will be used to purchase 124 accessible vehicles for deployment of ADA paratransit services and to support rural transit operated by GoWake Access. The slightly smaller fleet reflects the fact that most of GoRaleigh’s ADA service is provided through contracts with private providers who own their own vehicles.
Vehicle Maintenance Facilities The Wake Bus Plan includes plans to develop four new maintenance facilities and support upgrades to one existing facility. New facilities are programmed for GoCary, a shared GoRaleigh/GoWake Access facility and GoTriangle. The capital program also includes updates to GoRaleigh’s existing maintenance facility, both to develop a CNG fueling station and to improve circulation so the facility can accommodate a larger fleet. Investments in vehicle maintenance facilities are estimated at $74.2 million over the 10-year period. During implementation, transit partners will continue to investigate opportunities to share use of their facilities.
Transit Technology The Wake Bus Plan funds roughly $11 million in technology investments. These technologies are not fully determined in 2018, however, planned investments for FY19 and FY20 include investments in regional fare payment systems including mobile ticketing and smart card technology. Additional investments will be determined as the network builds out and the need for technology is identified.
PROGRAM COSTS In the Wake Bus Plan, passenger amenities are designed to make transit services more attractive, comfortable and safe and primarily refer to places where transit riders will get on and off bus services. The Wake Bus Plan includes investments in new and existing bus stops, as well as enhanced transfer points, park-and-ride lots, and transit centers. In total, roughly $106 million will be invested in passenger amenities, roughly 34% of the capital program.
Bus Stops The Wake Transit Plan provides funding to invest in bus stops. Funds are available to develop new bus stops and upgrade existing stops. Funding supports investment to:
Identify all bus stops with clear signage
Ensure new bus stops are accessible and meet the federal Americans with Disabilities (ADA) standards, where practical.
Upgrade existing bus stops to meet federal ADA standards, where practical.
Provide passenger amenities such as shelters and benches, depending on the level of passenger activity. Generally speaking, stops with more than 25 daily passenger boardings or more will be equipped with a shelter.
Enhanced Transfer Points The Wake Transit Plan identifies 19 locations as Enhanced Transfer Points, where passengers will transfer to/from frequent transit routes and/or between other Wake Transit Plan routes. Enhanced Transfer Points will:
Meet ADA accessibility standards

10-Year Bus Operating and Capital Plan Wake County Transit Plan
Page 28
Provide a package of passenger amenities that includes a transit shelters andbench; transit system signage and maps; lighting, emergency call boxes, securitycameras, bike storage, and trash bins.
Serve between 100 and 500 daily passenger boardings or more.
Park-and-Ride Facilities The Wake Transit Plan recommends developing a park-and-ride lot system to support the regional bus network. Capital investments will support developing new park-and-ride lots and upgrading existing facilities. At full implementation, the Wake Transit Plan recommends a network of 22 park-and-ride lots, including 16 existing lots and 7 new facilities. Investments in park-and-ride lots are scaled to reflect daily passenger boardings and the number of parking spaces available. Investments in park and ride lots will include:
• Ramps and platforms to ensure ADA accessibility.
Connecting sidewalk links as appropriate and where practical.
A package of passenger amenities that includes a transit shelter and bench; transitsystem signage and maps; lighting, emergency call boxes, security cameras, bikestorage and trash bins.
Transit Centers Transit Centers are major transfer locations where multiple routes converge. Most Transit Centers will be served by at least one frequent transit route. In some cases, Transit Centers will also include multimodal connections to bus rapid transit, rail services, park-and-ride lots, and bike and pedestrian trail networks.
The Wake Transit Plan identifies eight Transit Centers, three of which are existing facilities (GoRaleigh Station, Crabtree Valley Mall, Triangle Town Center) and five of which are new or substantially upgraded facilities (Raleigh Union Station Bus Facility, Cary Depot, Regional Transit Center (new location), East Raleigh Station and Midtown).
Existing Transit Centers will be upgraded to include:
A package of passenger amenities that includes accessible passenger boardingplatforms with shelters, benches, lighting, emergency call boxes, security camerasand public restrooms.
Passenger Information Systems that include signage and maps, real-timepassenger information, and ticket vending machines.
Depending on the location, multimodal connections such as sidewalk access, bikeracks and storage, and park-and-ride lots.
Transit Centers developed with Wake Transit Plan funding will include:
On-site staff for at least 12 hours per day.
A package of passenger amenities that includes accessible passenger boardingplatforms with shelters, benches, ticket vending machines, lighting, emergencycall boxes, security cameras and public restrooms.
Passenger Information Systems that include signage and maps, real-timepassenger information systems, and Wi-Fi connections.
Multimodal connections including sidewalk access, bike racks and storage, andpark-and-ride lots.

10-Year Bus Operating and Capital Plan Wake County Transit Plan
Page 29
The next sections of the plan summarize capital investments by the transit operator that will sponsor the investment in the annual work plan process.
CAPITAL INVESTMENTS BY TRANSIT OPERATOR
GoCary The Wake Bus Plan recommends GoCary’s capital program include roughly $39.7 million in investments (see Figure 16). These investments include development of two major facilities: a new maintenance facility ($20.8 million) and contributions towards a new multimodal center, Cary Depot ($10.2 million). Other investments in the GoCary system include enhanced transfer points, development of new bus stops, and updates to existing stops. No vehicle purchases are funded because GoCary currently leases vehicles as part of its operating contract.
Figure 16 GoCary’s Capital Investment Schedule
Year Expected Capital Investments And Project Development Annual Investment
(rounded)
FY18 Planning and Design - New Bus Maintenance Facility Planning and Design – Cary Depot
$2.0 million
FY19 Land Purchase – Cary Depot Bus Stop Improvements
$3.9 million
FY20 Construction - New Bus Maintenance Facility Bus Stop Improvements
$21.4 million
FY21 Construction – Cary Depot* Bus Stop Improvements
$7.8 million
FY22 Bus Stop Improvements $430,000
FY23 Enhanced Transfer Point: Crossroads Plaza Bus Stop Improvements
$1.1 million
FY24 Enhanced Transfer Point: Cary Towne Center Bus Stop Improvements
$800,000
FY25 Bus Stop Improvements $500,000
FY26 Bus Stop Improvements $500,000
FY27 Bus Stop Improvements $1.6 million
Total 10-year Period $39.7 million
Source: Nelson\Nygaard Consulting Associates
Note: * Represents a portion of overall project costs. Project costs will be shared with other users of the facility, including Amtrak, Commuter Rail, Bus Rapid Transit and multimodal activities.

10-Year Bus Operating and Capital Plan Wake County Transit Plan
Page 30
GoRaleigh The Wake Bus Plan recommends GoRaleigh’s capital program include roughly $162 million in investments (see Figure 17). The investment schedule includes maintenance facilities, vehicles, and passenger facilities (transit centers, enhanced transfer points and bus stops). GoRaleigh’s investment schedule also includes updates to its farebox technology to facilitate advanced fare collection strategies.
Figure 17 GoRaleigh’s Capital Investment Schedule
Year Expected Capital Investments and Project Development Annual Investment
(rounded)
FY18 Contribution towards GoRaleigh’s CNG fueling station Vehicle Purchases
$12.2 million
FY19 Planning and Design – Shared GoRaleigh/GoWake Access Maintenance Facility Planning and Design – East Raleigh Transit Center Move Hilltop Park and Ride to Wake Tech (Fuquay-Varina) Bus Stop Improvements Vehicle Purchases
$13.7 million
FY20 Final Design – Shared GoRaleigh/GoWake Access Maintenance Facility Planning and Design – Midtown Transit Center Enhanced Transfer Points (5 locations) Mobile Ticketing / Fare Box Updates Bus Stop Improvements Vehicle Purchases
$19.2 million
FY21 Construction – Shared GoRaleigh/GoWake Access Maintenance Facility Construction – East Raleigh Transit Center Construction - Midtown Transit Center Updates to Transit Centers (Crabtree Valley Mall and Triangle Town Center) Enhanced Transfer Points (4 locations) Bus Stop Improvements Vehicle Purchases
$39.4 million
FY22 Construction – Relocation of Triangle Town Center Enhanced Transfer Points (3 locations) Bus Stop Improvements Vehicle Purchases
$10.5 million
FY23 Construction – Updates to GoRaleigh Bus Maintenance Facility Enhanced Transfer Points (2 locations) Bus Stop Improvements Vehicle Purchases
$19.2 million
FY24 Bus Stop Improvements Vehicle Purchases
$7.0 million

10-Year Bus Operating and Capital Plan Wake County Transit Plan
Page 31
Year Expected Capital Investments and Project Development Annual Investment
(rounded)
FY25 Update Transit Center Infrastructure: Crabtree Valley Mall Bus Stop Improvements Vehicle Purchases
$20.5 million
FY26 Bus Stop Improvements Vehicle Purchases
$19.0 million
FY27 Update Transit Center Infrastructure: Triangle Town Center Bus Stop Improvements
$1.3 million
Total 10-year Period $161.0 million
Source: Nelson\Nygaard Consulting Associates
GoTriangle The Wake Bus Plan recommends funding GoTriangle’s capital program with roughly $82.5 million over the 10-year period (see Figure 18). More than half of these funds are associated with contributions towards two major projects: development of the Raleigh Union Station Bus Facility (RUSBUS) ($30.7 million) and development of a new vehicle maintenance facility ($24.7 million). The investment schedule also includes resources for park-and-ride lots, one enhanced transfer point and bus stops.
Figure 18 GoTriangle’s Capital Investment Schedule
Year Expected Capital Investments and Project Development Annual Investment
(rounded)
FY18 Planning and Design: GoTriangle Maintenance Facility Land Purchase: RUSBUS Investment in New Park-and-Ride Lots Vehicle Purchases
$6.8 million
FY19 Planning and Design: GoTriangle Paratransit Office Planning and Design: RUSBUS and Regional Transit Center Park-and-Ride Lot Planning Bus Stop Improvements Vehicle Purchases
$5.5 million
FY20 Construction: RUS BUS Updates / Improvements to Park-and-Ride Lots Bus Stop Improvements Vehicle Purchases
$16.5 million

10-Year Bus Operating and Capital Plan Wake County Transit Plan
Page 32
Year Expected Capital Investments and Project Development Annual Investment
(rounded)
FY21 Construction: RUS BUS Construction: Park-and-Ride Lot Facilities Construction: Regional Transit Center Updates / Improvements to Park-and-Ride Lots Enhanced Transfer Point (1 location) Bus Stop Improvements Vehicle Purchases
$26.3 million
FY22 Enhanced Transfer Points (1 location) Updates / Improvements to Park-and-Ride Lots Bus Stop Improvements Vehicle Purchases
$2.9 million
FY23 Planning and Design: Bus Maintenance Facility Updates / Improvements to Park-and-Ride Lots Enhanced Transfer Points (1 location) Bus Stop Improvements Vehicle Purchases
$4.2 million
FY24 Construction: Bus Maintenance Facility Construction: Park-and-Ride Lot Facility Updates / Improvements to Park-and-Ride Lots Bus Stop Improvements Vehicle Purchases
$18.2 million
FY25 Construction: Bus Maintenance Facility Updates / Improvements to Park-and-Ride Lots Bus Stop Improvements Vehicle Purchases
$12.8 million
FY26 Updates / Improvements to Park-and-Ride Lots Bus Stop Improvements Vehicle Purchases
$1.9 million
FY27 Bus Stop Improvements Reduction in Fleet Needs*
($13.3 million)
Total 10-year Period $82.0 million
Source: Nelson\Nygaard Consulting Associates
Note: * Reduction in GoTriangle’s fleet reflects the reduction in bus service associated with discontinuation of the CRX and DRX bus routes. Commuter rail will replace DRX and CRX services. For purposes of capital programming, the reduction in fleet size is shown as a savings. In practice, buses will likely be transferred or sold to other transit operators, so actual cost savings may differ from estimate.

10-Year Bus Operating and Capital Plan Wake County Transit Plan
Page 33
Additional Bus Plan Elements The Wake Transit Plan will incur operating and capital costs that are related to the bus service network, but not directly associated with fixed route service. These costs include providing paratransit and rural transit service as well as costs associated with maintaining capital investments. As part of preparing the Wake Bus Plan, the Core Technical Team estimated the impact of these ancillary costs. The CTT also developed ideas for coordinating fare levels across the transit providers and estimated fare revenue associated with the changes in ridership. High level costs and benefits are described briefly in the following text and highlighted in Tables 18 - 20.
OPERATING COSTS In addition to investments in the bus service network and capital infrastructure, the Wake Bus Plan tabulated costs associated with potential increased demand for complementary paratransit service, rural transportation needs and the costs associated with maintaining and operating new capital infrastructure.
Americans with Disabilities (ADA) Paratransit As part of operating fixed route transit service, GoCary, GoRaleigh and GoTriangle provide complementary demand response service for individuals unable to use fixed route services because of a disability. This service is accordance with the Americans with Disability Act (ADA).
The Wake Transit Plan will have an impact on ADA service in Wake County. Most of the Wake Bus Plan investments are in service frequency and span of service, so the Wake Bus Plan is not expected to result in large increases in the ADA service area. Instead, most of the additional service will be associated with trips required in the early morning and later into the evening. Cost estimates include the cost of managing and operating the service (see Table 18) as well as capital investments in vehicles (see Table 19).
Rural Transportation The Wake Bus Plan also assigned funds to support rural transportation. These resources will ensure that residents living in rural Wake County have access to additional general public transportation that is in line with expected need. Rural transportation needs are in addition to new services developed as part of the Community Funding Areas Program.
Funding allocated from the Wake Transit Plan is in addition to existing resources provided by the North Carolina Department of Transportation (NCDOT) and other federal funding programs. Funding is allocated to operating costs (see Table 18) and vehicles (see Table 19).
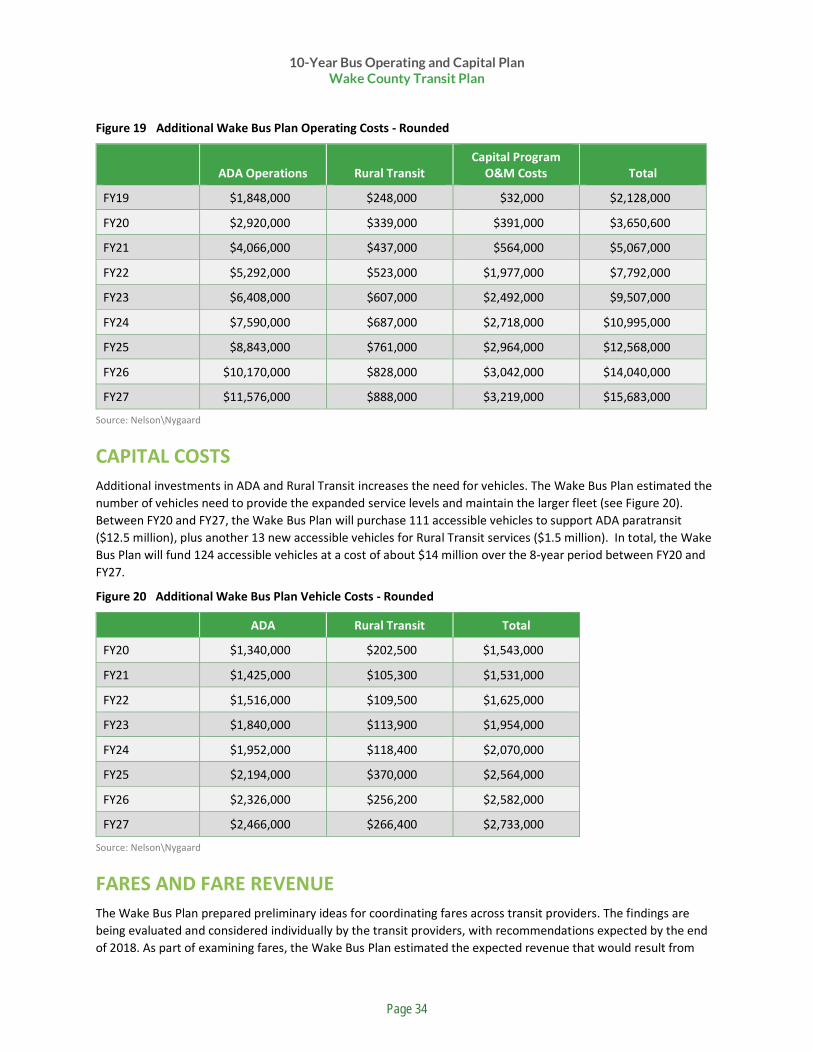
Operating and Maintenance The Wake Bus Plan includes an extensive capital program, including development of transit centers, park and ride lots, enhanced transfer points and bus stops. The Wake Bus Plan estimated the costs associated with maintaining these new facilities and incorporated them into the overall costs of the Wake Transit Plan.
Maintenance costs include activities such as trash removal and minor repairs. Operating and maintenance costs also include staffing costs associated with the new transit centers. In cases where the transit centers are already staffed but require additional staffing associated with longer operating hours, the cost of the additional staffing needs only are paid for with Wake Transit Plan funds. In total, operating and maintenance costs total about $17.4 million over the 10-year period.
10-Year Bus Operating and Capital Plan Wake County Transit Plan
Page 34
Figure 19 Additional Wake Bus Plan Operating Costs - Rounded
ADA Operations Rural Transit Capital Program
O&M Costs Total
FY19 $1,848,000 $248,000 $32,000 $2,128,000
FY20 $2,920,000 $339,000 $391,000 $3,650,600
FY21 $4,066,000 $437,000 $564,000 $5,067,000
FY22 $5,292,000 $523,000 $1,977,000 $7,792,000
FY23 $6,408,000 $607,000 $2,492,000 $9,507,000
FY24 $7,590,000 $687,000 $2,718,000 $10,995,000
FY25 $8,843,000 $761,000 $2,964,000 $12,568,000
FY26 $10,170,000 $828,000 $3,042,000 $14,040,000
FY27 $11,576,000 $888,000 $3,219,000 $15,683,000
Source: Nelson\Nygaard
CAPITAL COSTS Additional investments in ADA and Rural Transit increases the need for vehicles. The Wake Bus Plan estimated the number of vehicles need to provide the expanded service levels and maintain the larger fleet (see Figure 20). Between FY20 and FY27, the Wake Bus Plan will purchase 111 accessible vehicles to support ADA paratransit ($12.5 million), plus another 13 new accessible vehicles for Rural Transit services ($1.5 million). In total, the Wake Bus Plan will fund 124 accessible vehicles at a cost of about $14 million over the 8-year period between FY20 and FY27.
Figure 20 Additional Wake Bus Plan Vehicle Costs - Rounded
ADA Rural Transit Total
FY20 $1,340,000 $202,500 $1,543,000
FY21 $1,425,000 $105,300 $1,531,000
FY22 $1,516,000 $109,500 $1,625,000
FY23 $1,840,000 $113,900 $1,954,000
FY24 $1,952,000 $118,400 $2,070,000
FY25 $2,194,000 $370,000 $2,564,000
FY26 $2,326,000 $256,200 $2,582,000
FY27 $2,466,000 $266,400 $2,733,000
Source: Nelson\Nygaard
FARES AND FARE REVENUE The Wake Bus Plan prepared preliminary ideas for coordinating fares across transit providers. The findings are being evaluated and considered individually by the transit providers, with recommendations expected by the end of 2018. As part of examining fares, the Wake Bus Plan estimated the expected revenue that would result from

10-Year Bus Operating and Capital Plan Wake County Transit Plan
Page 35
Wake Bus Plan. The revenue estimates reflect the recommended implementation services, including Bus Rapid Transit, but not Commuter Rail. Revenue estimates also reflect the preliminary ideas for a coordinated fare strategy and assume a one-time 15% increase in fares over the 10-year period (see Figure 21).
Figure 21 Wake Bus Plan: Estimated Fare Revenue - Rounded
Fixed Route ADA Total
FY19 $5,250,000 $1,596,000 $6,846,000
FY20 $6,152,000 $1,654,000 $7,806,000
FY21 $6,643,000 $1,713,000 $8,356,000
FY22 $7,350,000 $1,775,000 $9,125,000
FY23 $7,651,000 $1,840,000 $9,491,000
FY24 $11,045,000 $2,192,000 $13,237,000
FY25 $12,760,000 $2,272,000 $15,032,000
FY26 $13,677,000 $2,355,000 $16,032,000
FY27 $16,448,000 $2,441,000 $18,889,000
Source: Nelson\Nygaard

APPENDIX A Wake Bus Plan Year-by-Year


10-Year Bus Operating and Capital Plan | Appendix AWake County Transit Plan
Legend: Color Coding Reflects Peak Period Frequency
Frequent Transit Network - 15 min svc Local Route - 30 min svc Local Route - 60 min svc Express – Peak Period svc only Core Regional Routes – 30 min svc
A-1
Appendix A: Wake Bus Plan Year-by-Year TRANSIT SERVICE IMPLEMENTATION SCHEDULE BY TRANSIT OPERATOR AND SERVICE TYPE
GoCary GoRaleigh GoTriangle
FY19
Route 1 Crossroads Route 3 Harrison (alignment change) Route 4 High House Route 5 Kildaire Farm Route 9B Buck Jones Route 7 Weston Parkway
Route 4 Rex Hospital Route 17 Rock Quarry Route 18 Poole / Barwell Route 18S Poole Route 19 Martin Luther King/Sunnybrook Route 26 Edwards Mill Route 27 Blue Ridge Route 36 Creedmoor
Route 100 Raleigh – RTC (increase service) Route 300 Cary-Raleigh (increase service) Route CRX Chapel Hill Express (increase service) Route DRX Durham Raleigh Express (increase service )
FY20 Route HSX Holly Springs-Apex-Cary Express Route 20 Garner / Route 20L Garner South
Route 33 New Hope – Knightdale Route 401 Rolesville
Route 310 RTC – Cary (interim) Route 311 Apex – RTC (service reduction) Route NRX North Raleigh Express
FY21 Route 9 Hillsborough Route 301 Cary – Raleigh (eliminated)
Route 305 Apex-Raleigh
FY22 Route 100 Raleigh-Airport – RTC (add service)

10-Year Bus Operating and Capital Plan | Appendix A Wake County Transit Plan
Legend: Color Coding Reflects Peak Period Frequency
Frequent Transit Network - 15 min svc Local Route - 30 min svc Local Route - 60 min svc Express – Peak Period svc only Core Regional Routes – 30 min svc
A-2
GoCary GoRaleigh GoTriangle
FY23
Route 2 Falls of Neuse Route 2L Falls of Neuse North Route 25 Durant Route 29 Garner-Wake Tech (replaces 40X on specific days) Route 32 Lynn-Spring Forest Route 33 New Hope/ Knightdale (add weekend) Route 34 Wake Tech North Route 40X Wake Tech Express Route FRX Fuquay Varina Express
FY24
Route 9A Trinity Route 5 Biltmore Hills Route 6 Glenwood Route 6L Glenwood North Route 6La Glenwood Pleasant Valley Route 8 Six Forks Midtown Route 8L Six Forks North Route 16 Centennial-Midtown Route 20 Garner (add frequency and weekend) Route 20L Garner South (add frequency and weekend) Route 21 Caraleigh
FY25 Route 27 Blue Ridge (add frequency) Route 310 Cary-Morrisville-RTC (add service)

10-Year Bus Operating and Capital Plan | Appendix AWake County Transit Plan
Legend: Color Coding Reflects Peak Period Frequency
Frequent Transit Network - 15 min svc Local Route - 30 min svc Local Route - 60 min svc Express – Peak Period svc only Core Regional Routes – 30 min svc
A-3
GoCary GoRaleigh GoTriangle
FY26
Route 3 Glascock Route 10 Raleigh Boulevard Route 11 Avent Ferry Route 12 Method Route 23 Millbrook Route 31 Southwest
Route NRX North Raleigh Express (add service)
FY27
Route Morrisville Route Cary-Airport
Route 14 Atlantic Route 24 New Hope – Crabtree Route 28 New Hope – Triangle
Route 105 Raleigh-RTC – (eliminated) Route 300 Raleigh – Cary (eliminated) Route CRX Chapel Hill-Raleigh Express (eliminated) Route DRX Durham-Raleigh Express (eliminated)


APPENDIX B WAKE BUS PLAN YEAR-BY-YEAR
CAPITAL PLAN BY TRANSIT PROVIDER


10-Year Bus Operating and Capital Plan | Appendix B Wake County Transit Plan
B-1
APPENDIX B: WAKE BUS PLAN YEAR-BY-YEAR CAPITAL PLAN BY TRANSIT PROVIDER Year GoCary GoTriangle GoRaleigh
FY18 Planning and Design: Bus Maintenance Facility Cary Depot
Planning and Design: GoTriangle Maintenance Facility Planning and Design: Raleigh Union Station Bus Facility (RUSBUS) Park and Ride Lot Planning Vehicle Purchases
Construction: CNG fueling station Vehicle Purchases
FY19 Planning and Design: Cary Depot Construction: Bus Stop Improvements
Planning: GoTriangle Paratransit Office Land Purchase: RUSBUS Construction: Regional Transit Center Park and Ride Lot Planning and Construction (including Wake Tech) Bus Stop Improvements Vehicle Purchases
Planning and Design: Shared GoRaleigh/GoWake Access Maintenance Facility Planning and Design: East Raleigh Transit Center Move Hilltop Park and Ride to Wake Tech Bus Stop Improvements Vehicle Purchases
FY20 Construction: Bus Maintenance Facility Bus Stop Improvements
Construction: RUS BUS Updates / Improvements to Park and Ride Lots Bus Stop Improvements Vehicle Purchases
Construction: Shared GoRaleigh/GoWake Access Maintenance Facility Planning and Design: Midtown Transit Center Mobile Ticketing / Farebox Updates Enhanced Transfer Points (5) Bus Stop Improvements Vehicle Purchases

10-Year Bus Operating and Capital Plan | Appendix B Wake County Transit Plan
B-2
Year GoCary GoTriangle GoRaleigh
FY21 Construction: Cary Depot Bus Stop Improvements
Construction: RUS BUS Apex Enhanced Transfer Point Park and Ride Lot Facilities Regional Transit Center Updates / Improvements to Park and Ride Lots Bus Stop Improvements Vehicle Purchases
Construction: Shared GoRaleigh/GoWake Access Maintenance Facility Construction: East Raleigh Transit Center Construction: Midtown Transit Center Updates to Crabtree Valley Mall and Triangle Town Center Enhanced Transfer Points (4) Bus Stop Improvements Vehicle Purchases
FY22 Bus Stop Improvements Enhanced Transfer Points Updates / Improvements to Park and Ride Lots Bus Stop Improvements Vehicle Purchases
Relocation of Triangle Town Center Enhanced Transfer Points (3) Bus Stop Improvements Vehicle Purchases
FY23 Enhanced Transfer Points (1) Bus Stop Improvements
Planning and Design: Bus Maintenance Facility Updates / Improvements to Park and Ride Lots Enhanced Transfer Points (1) Bus Stop Improvements Vehicle Purchases
Updates to GoRaleigh Bus Maintenance Facility Enhanced Transfer Points (2) Bus Stop Improvements Vehicle Purchases
FY24 Enhanced Transfer Points: (1) Bus Stop Improvements
Construction: Bus Maintenance Facility New and Updates / Improvements to Park and Ride Lots Bus Stop Improvements
Bus Stop Improvements Vehicle Purchases

10-Year Bus Operating and Capital Plan | Appendix B Wake County Transit Plan
B-3
Year GoCary GoTriangle GoRaleigh Vehicle Purchases
FY25 Bus Stop Improvements Bus Maintenance Facility Updates / Improvements to Park and Ride Lots Bus Stop Improvements Vehicle Purchases
Bus Stop Improvements Vehicle Purchases
FY26 Bus Stop Improvements Updates / Improvements to Park and Ride Lots Bus Stop Improvements Vehicle Purchases
Bus Stop Improvements Vehicle Purchases
FY27 Bus Stop Improvements Bus Stop Improvements Reduction in Fleet Needs
Bus Stop Improvements Vehicle Purchases
Source: Nelson\Nygaard Consulting Associates
APPENDIX C COMMENTS RECEIVED ON DRAFT
VERSIONS OF 10-YEAR PLAN SUMMARY


10-Year Bus Operating and Capital Plan | Appendix C Wake County Transit Plan
B-1
APPENDIX C: COMMENTS RECEIVED ON DRAFT VERSIONS OF 10-YEAR PLAN SUMMARY
Comment Received Consultant Team Response
Change to 'schedule of transit investments' Agreed – text has been updated Census is spelled wrong in this legend. Agreed – text has been updated Delete this extra 'and' Agreed – text has been updated Pluralize 'route' Agreed – text has been updated Delete 'were' Agreed – text has been updated Capitalize Town Agreed – text has been updated This description is inconsistent with other information in the plan. Cary is ultimately expanding service to 7 local routes (Routes 1, 3, 4, 5, 7, 9A and 9B), one express route (HSX) and 2 regional routes (Morrisville route and Cary-Airport route). Agreed – text has been updated Change comma after 'Cary' to semicolon and change comma after 'Airport' to semicolon Agreed – text has been updated
Add FY 2021 microtransit project in western Cary to this table
Text has been updated and mentions the microtransit project, but the funding was not included in the table because the project is not being funded with Wake Transit Plan resources.
At what point during the year are these service changes expected to occur, and based on that, do the revenue hours and operating costs in this table appropriately correspond to that? Some indication of what fraction of the year these services will be provided, as well as the corresponding numbers to go along with it would be more appropriate here. This would also make this Cary table more consistent with how services are laid out for the Raleigh table.
The Wake Bus Plan is not prescriptive to when service changes will occur within the year where they are programmed. There are exceptions to this rule. In some cases, the table explains where services are programmed for a 6 months during the first year of service. In addition, in years with significant service changes, the Wake Bus Plan assumes half of the service changes are expected to occur in the first half of the year, and the other half in the second half of the year.
From what source is this amount coming? The FY 2019 Work Plan, which assumes a half-year of funding for the Weston Route, appropriates $402,399 to the Weston Route, which is what I would expect the assumption to be here.
NN has worked with Cary to calculate service cost and found that the FY 19 Work Plan overestimated the cost of the Weston Route. The attached Weston Parkway Cost sheet provides our caculations used in the Western Wake COA.

10-Year Bus Operating and Capital Plan | Appendix C Wake County Transit Plan
B-2
This subtotal of hours does not compute with the net annual revenue hours shown in the table. Revised The subtotal net here should be 1 peak vehicles. Revised This subtotal does not compute with the net operating costs shown in the table. Revised Make the 't' lower case here Agreed. Text has been updated Change 'bus stops improvements' to 'bus stop improvements' in this table and throughout all tables in the document. Agreed. Text has been updated
Should we be assuming that we will be able to eliminate a full $15.8 million just because routes are eliminated on which those buses operate? If there will be 20 excess vehicles that were already operating to provide services and those services go away, how can we assume that we will immediately realize savings that equate to the full cost of 20 new vehicles because we won't have a use for vehicles already procured?
In 2018, the Wake Bus Plan assumes the CRX and DRX will be eliminated in 2027, so GoTriangle will need fewer vehicles. This change has been included in the financial model as an analytic step. However, we agree that in practice it is unlikely the vehicles will be sold and revenues deposited in the Wake Transit Plan funds. More likely, once the fleet reduction is confirmed and scheduled, GoTriangle will avoid purchasing new vehicles, and/or share decommissioned vehicles with other operators. In this way, savings will be realized by avoiding purchasing new vehicles.
Change GoRaleigh to GoTriangle. Agreed. Text has been updated Change 'project development' throughout the table to 'construction'. Also make sure 'bus stops improvements' is changed to 'bus stop improvements'. Agreed. Text has been updated Page 1: Get ride of number of munis; Can we get ride of "most developed" wording in Frequent bullet point Agreed. Text has been updated Page 7 Context needed for revenue vs cost figure Agreed. Text has been updated Page 9 The first two sentaences make it sound like Cary has 12 routes Agreed. Text has been updated Page 9 - Route 7 - riders could deive/walk to pick up so let's use underserved Agreed. Text has been updated Page 11 0 Pleae rewrite this line: Much of this investment is associated with the Agreed. Text has been updated

10-Year Bus Operating and Capital Plan | Appendix C Wake County Transit Plan
B-3
Frequent Transit Network, which is a network of 10 routes Page 11 - Expand on the new technologies bullet
Text updated in subsequent sections of the report
Page 17 - Using shades of green for pie chart just makes it more confusing and won't print well
Colors have been changed to reflect more variation and match document color palette
Page 19 - this looks like the bus map. Increase capital investment symbols so they stand out Maps have been updated. Page 21 - Remove electric and replace with newer technologies Agreed. Text has been updated Page 27 New Math? all tables have been checked and updated
Source: Nelson\Nygaard Consulting Associates


