134
| Date post: | 16-Dec-2015 |
| Category: |
Documents |
| Upload: | joseph-duran |
| View: | 229 times |
| Download: | 0 times |

Psychiatric and neurological conditionsBriana Mezuk, [email protected]
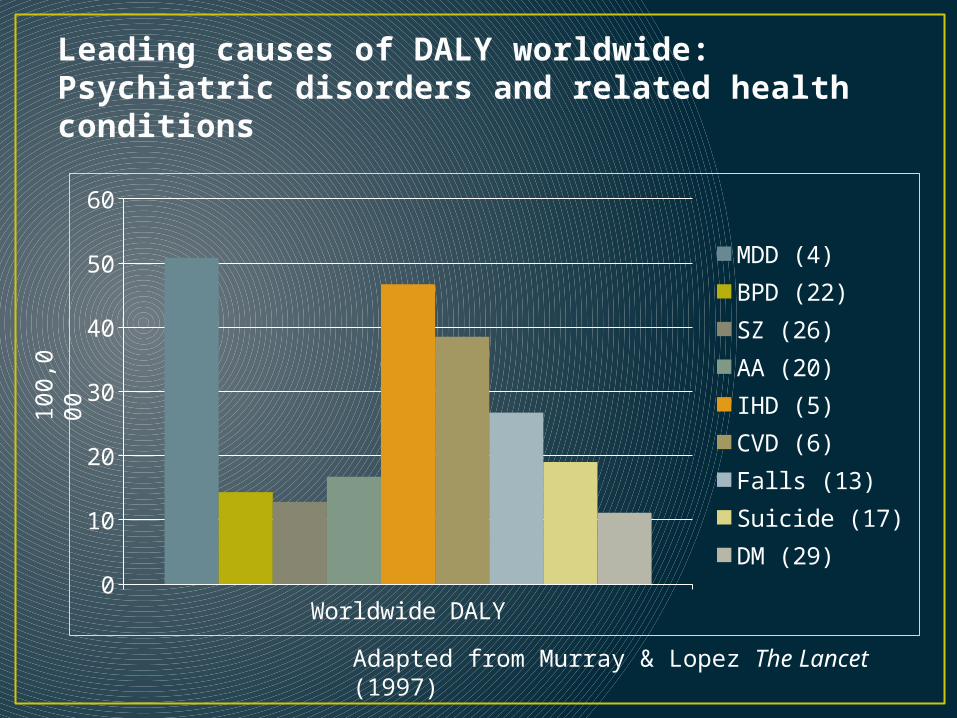
Leading causes of DALY worldwide:Psychiatric disorders and related health conditions
Worldwide DALY0
10
20
30
40
50
60
MDD (4)BPD (22)SZ (26)AA (20)IHD (5)CVD (6)Falls (13)Suicide (17)DM (29)
100,
000
Adapted from Murray & Lopez The Lancet (1997)
A brief survey• Q1: What is the most common psychiatric disorder
in the general population?• Q2: Are men and women equally likely to develop
a psychiatric disorder?• Q3: Do most disorders onset >30 years of age?• Q4: What proportion of people with a psychiatric
disorder get treatment?
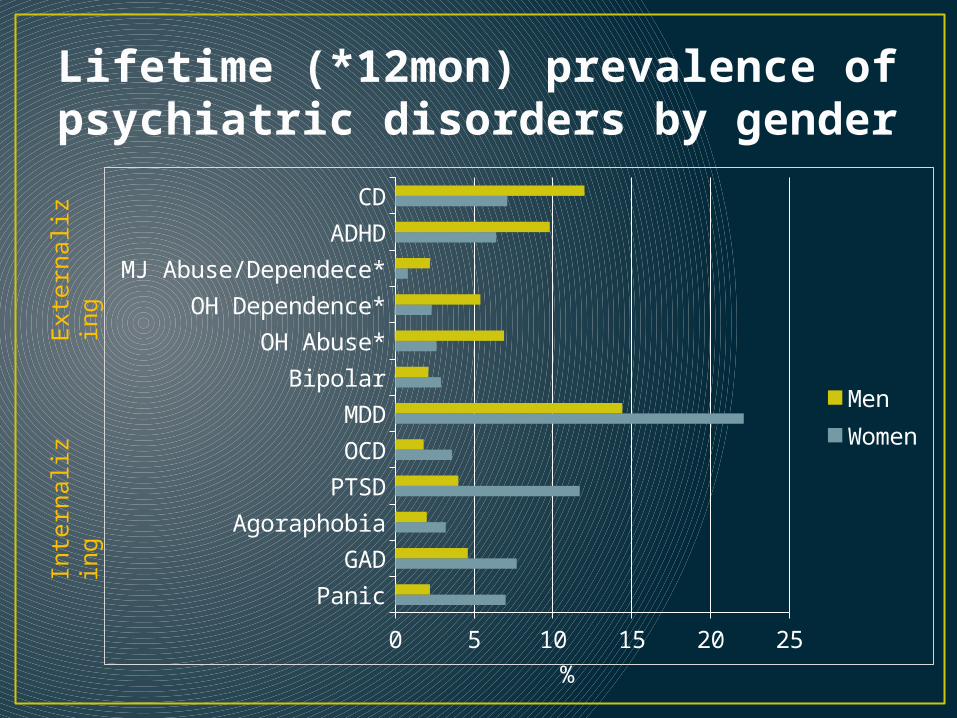
Lifetime (*12mon) prevalence of psychiatric disorders by gender
Panic
GAD
Agoraphobia
PTSD
OCD
MDD
Bipolar
OH Abuse*
OH Dependence*
MJ Abuse/Dependece*
ADHD
CD
0 5 10 15 20 25
MenWomen
Exte
rnaliz
ing
Inte
rnaliz
ing
%
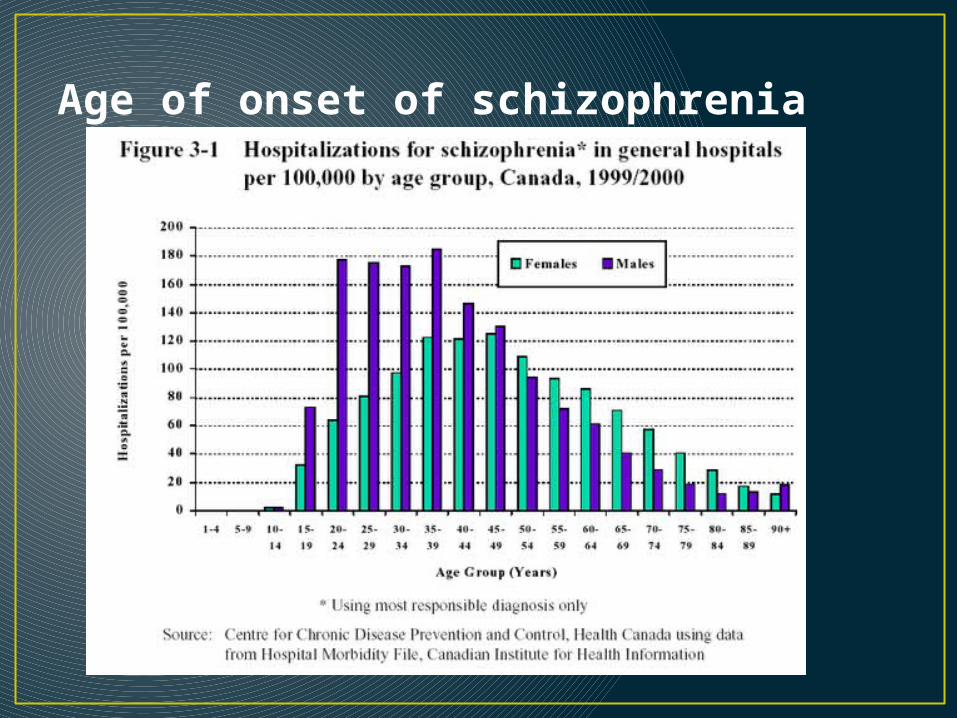
Age of onset of schizophrenia
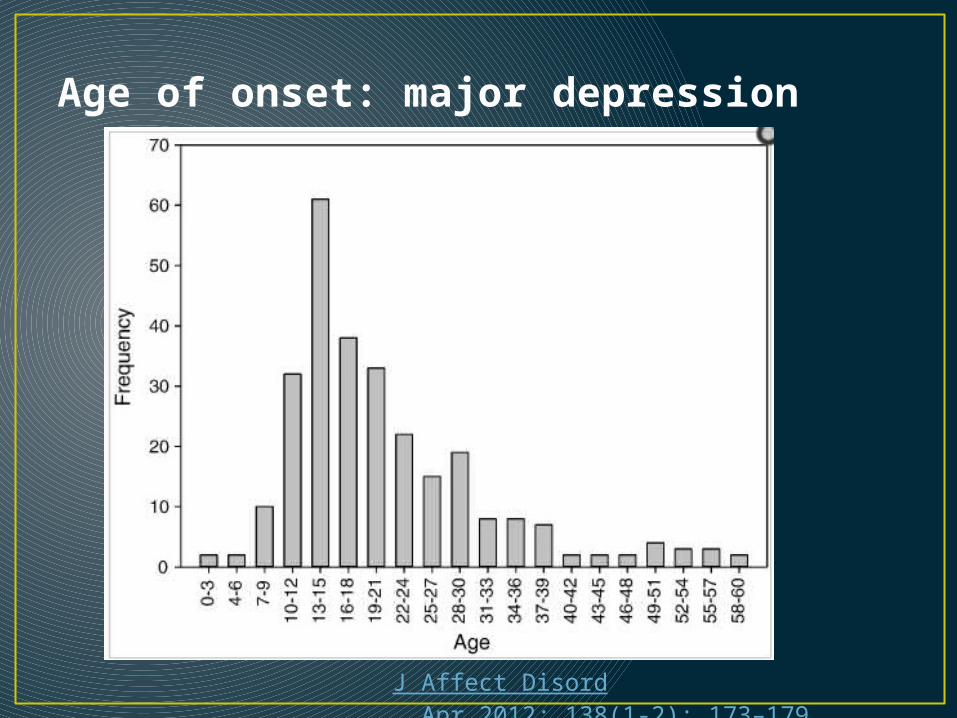
Age of onset: major depression
J Affect Disord. Apr 2012; 138(1-2): 173–179.
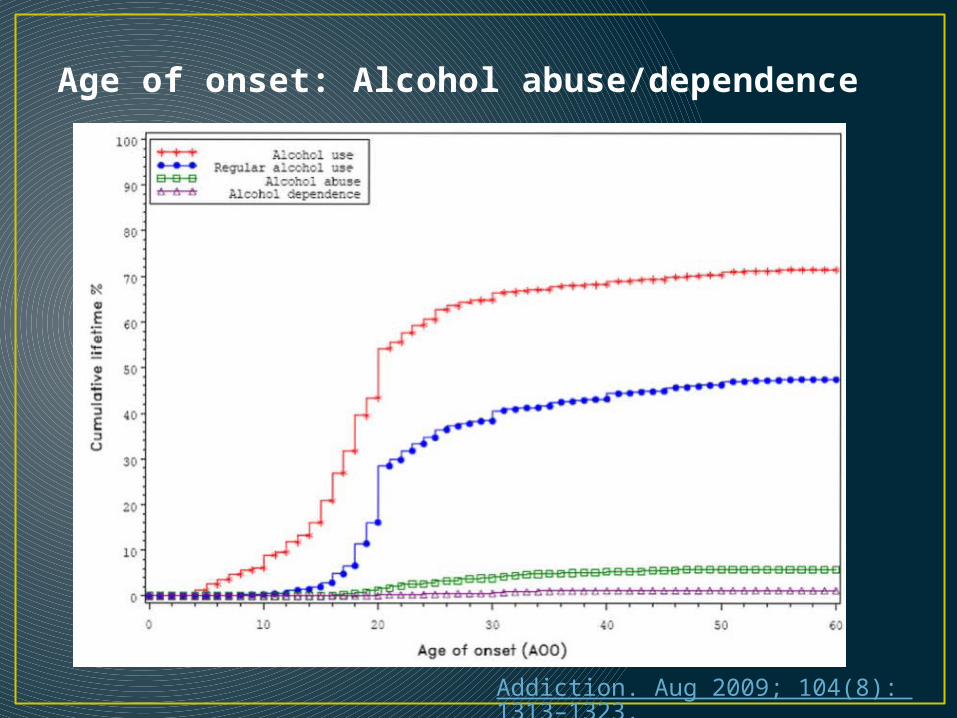
Age of onset: Alcohol abuse/dependence
Addiction. Aug 2009; 104(8): 1313–1323.
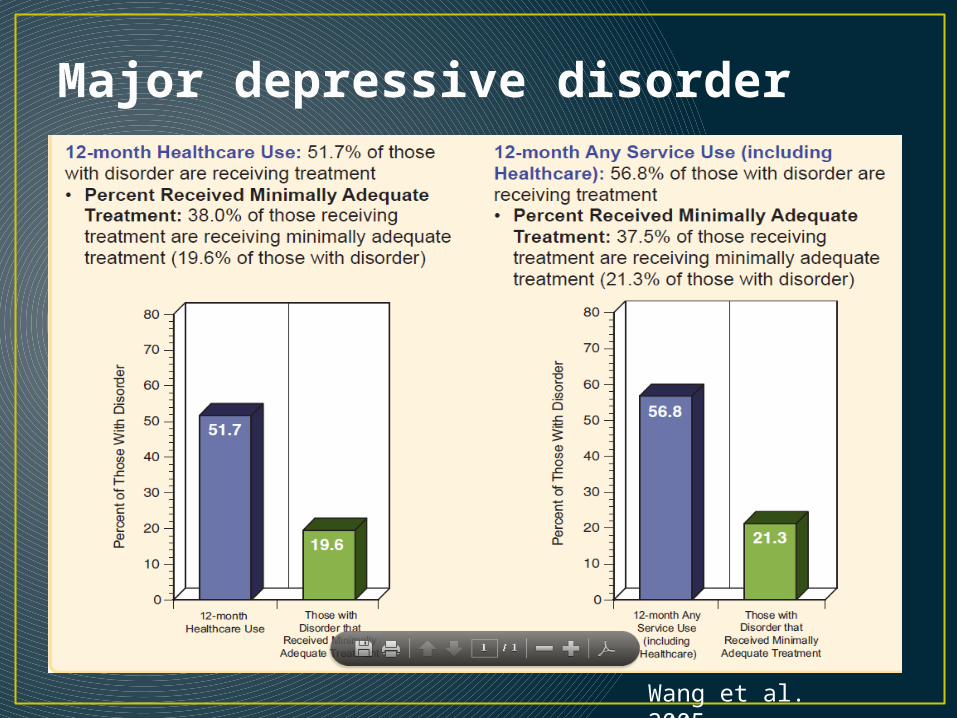
Major depressive disorder
Wang et al. 2005
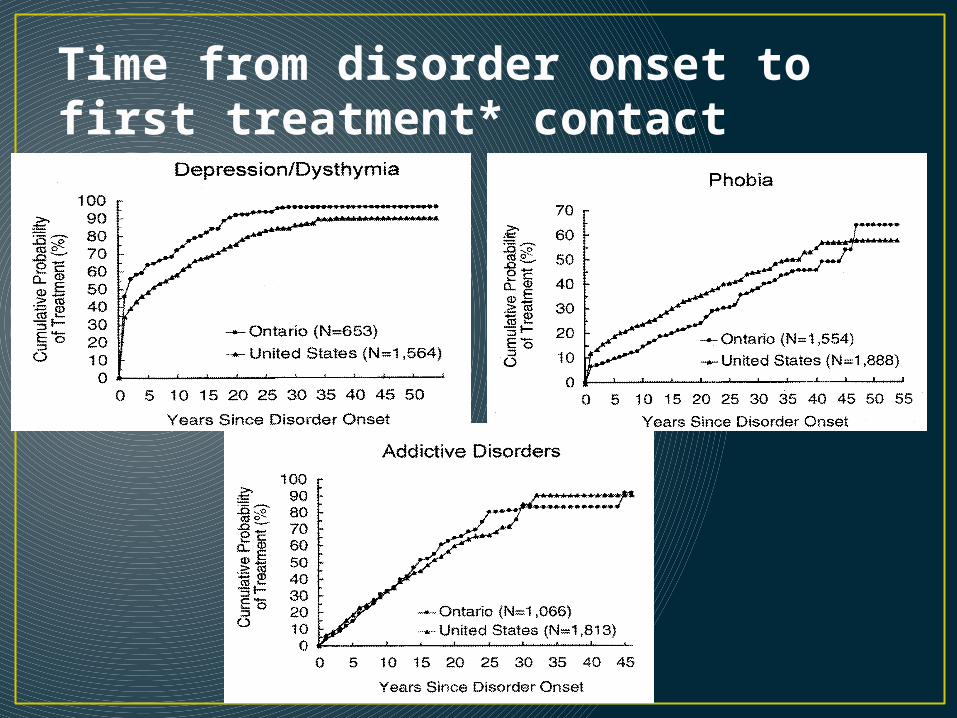
Time from disorder onset to first treatment* contact

Pathways to mental health care
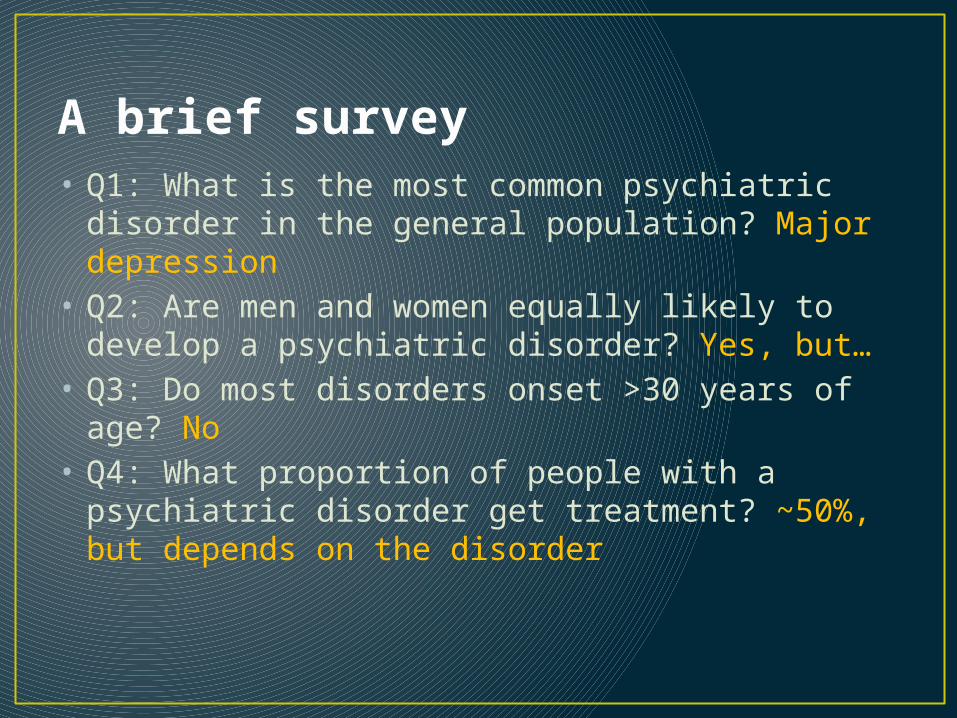
A brief survey• Q1: What is the most common psychiatric disorder
in the general population? Major depression• Q2: Are men and women equally likely to develop
a psychiatric disorder? Yes, but…• Q3: Do most disorders onset >30 years of age? No• Q4: What proportion of people with a psychiatric
disorder get treatment? ~50%, but depends on the disorder
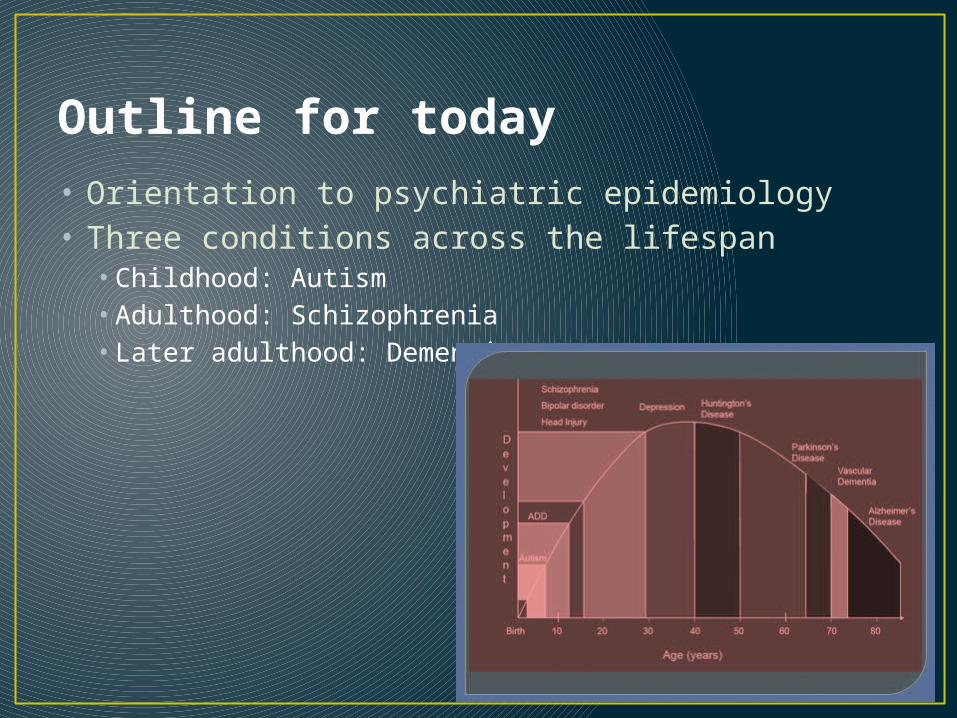
Outline for today• Orientation to psychiatric epidemiology• Three conditions across the lifespan
• Childhood: Autism• Adulthood: Schizophrenia• Later adulthood: Dementia
Getting oriented to psychiatric epidemiology
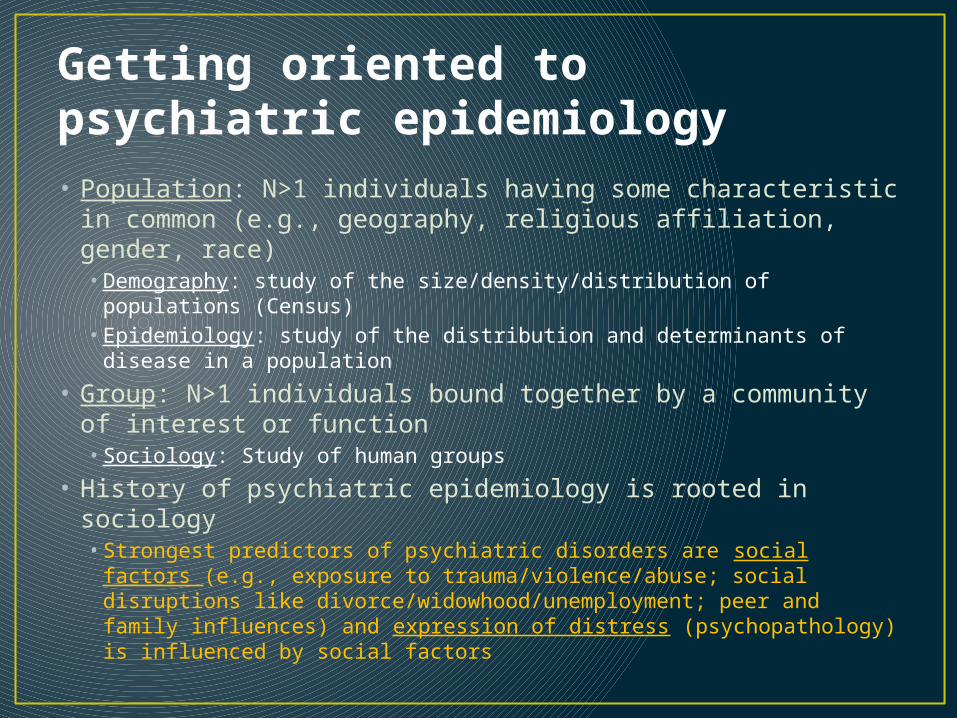
Getting oriented to psychiatric epidemiology• Population: N>1 individuals having some characteristic in
common (e.g., geography, religious affiliation, gender, race)• Demography: study of the size/density/distribution of populations
(Census)• Epidemiology: study of the distribution and determinants of
disease in a population
• Group: N>1 individuals bound together by a community of interest or function• Sociology: Study of human groups
• History of psychiatric epidemiology is rooted in sociology• Strongest predictors of psychiatric disorders are social factors (e.g.,
exposure to trauma/violence/abuse; social disruptions like divorce/widowhood/unemployment; peer and family influences) and expression of distress (psychopathology) is influenced by social factors
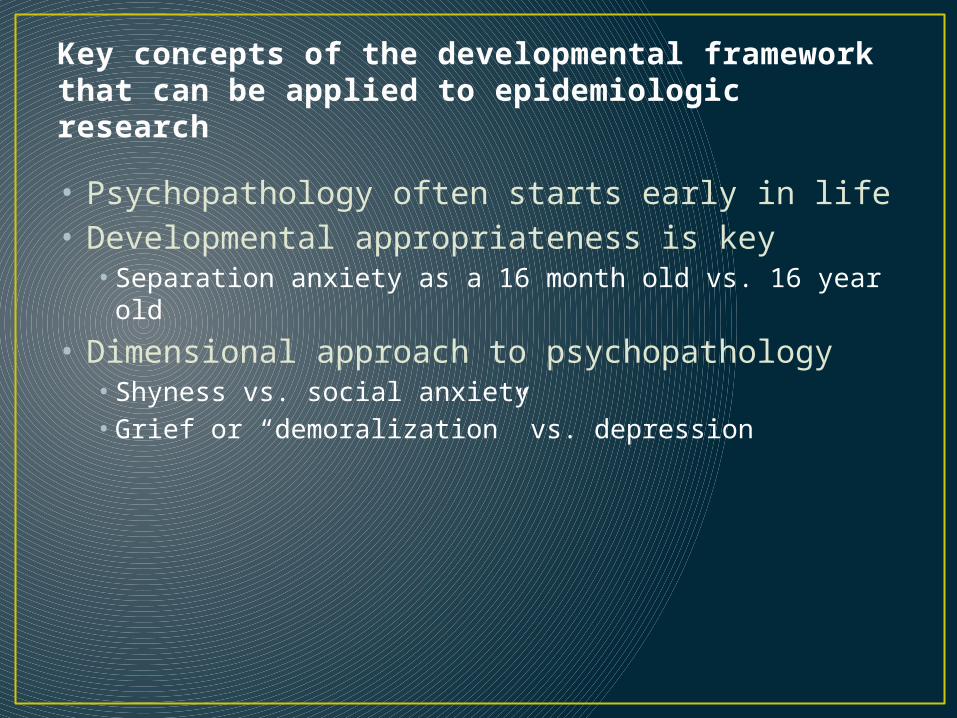
Key concepts of the developmental framework that can be applied to epidemiologic research
• Psychopathology often starts early in life• Developmental appropriateness is key
• Separation anxiety as a 16 month old vs. 16 year old
• Dimensional approach to psychopathology• Shyness vs. social anxiety• Grief or “demoralization” vs. depression

Key concepts of the developmental framework that can be applied to epidemiologic research
• Acute vs. cumulative events• Acute events can beget more events (ex. Lose home in hurricane ->
have to move -> lose social ties -> financial insecurity -> family disruption)
• Acute events aren’t always acute (ex. Divorce)
• Continuities vs. discontinuities across developmental periods• Conduct disorder and ASPD• Social isolation and psychotic disorder
• The effects of etiologic factors may be age-dependent• Sensitive periods (ex. Institutionalization, parental loss)
• The consequences of psychopathology may be age-dependent
• Development is a life-long process• Age – Period – Cohort
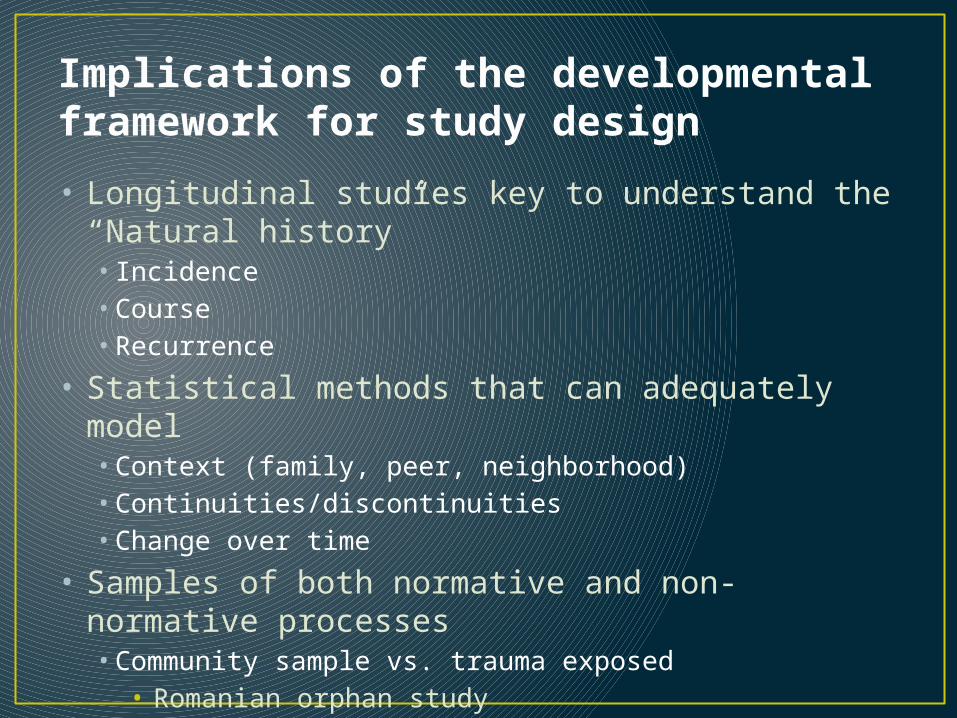
Implications of the developmental framework for study design
• Longitudinal studies key to understand the “Natural history”• Incidence• Course• Recurrence
• Statistical methods that can adequately model• Context (family, peer, neighborhood)• Continuities/discontinuities• Change over time
• Samples of both normative and non-normative processes• Community sample vs. trauma exposed
• Romanian orphan study
Childhood: Autism
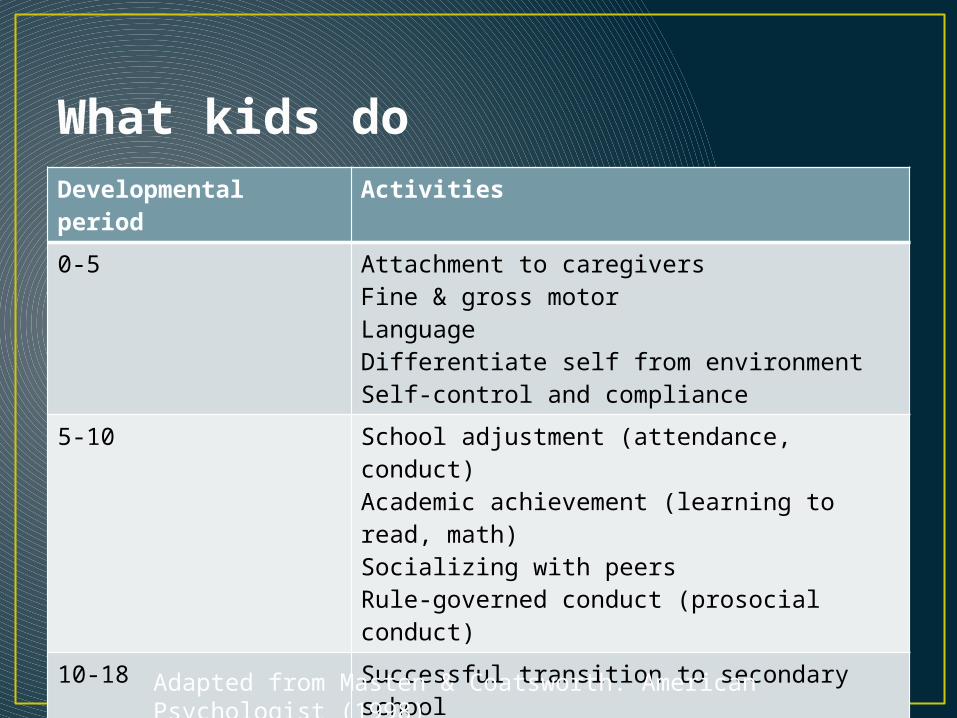
What kids doDevelopmental period
Activities
0-5 Attachment to caregiversFine & gross motorLanguageDifferentiate self from environmentSelf-control and compliance
5-10 School adjustment (attendance, conduct)Academic achievement (learning to read, math)Socializing with peersRule-governed conduct (prosocial conduct)
10-18 Successful transition to secondary schoolAcademic achievement/higher-order skillsInvolvement in prosocial extracurricular activitiesForming close relationships within & across genderForming cohesive sense of self-identity
Adapted from Masten & Coatsworth. American Psychologist (1998)

Issues specific to assessing children• Clinical appraisal combined with psychometrically-
robust measures is the best way to identify psychopathology in children <3
• Several domains of mental development need to be investigated
• Relationship context (parent/child) needs to be included in the assessment
• Diagnostic classification should include individual psychopathology as well as developmental and relational aspects
• Multiple source of information (parent, teacher, questionnaire, observation) is needed
Skovgaard et al. 2004

Autism• Case definition• Risk factors (including things that are NOT risk
factors)• An example of bad science: immunizations and autism• Gestational characteristics• Parental characteristics
• Methodologic issues: Explaining epidemics of “non-communicable” disorders• Diagnostic changes• Social changes
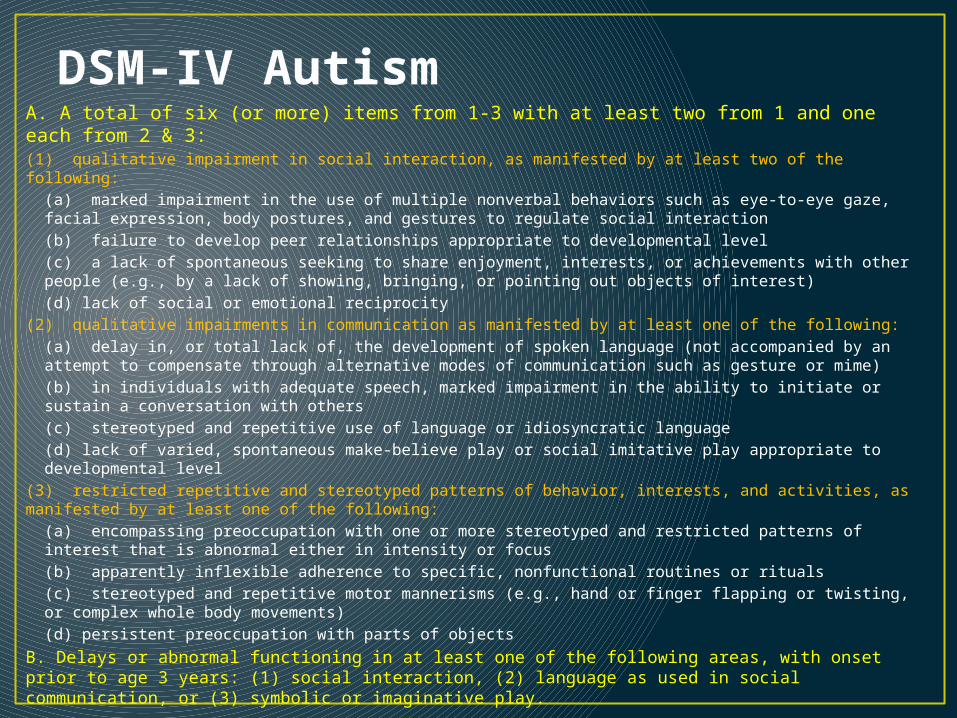
DSM-IV AutismA. A total of six (or more) items from 1-3 with at least two from 1 and one each from 2 & 3:(1) qualitative impairment in social interaction, as manifested by at least two of the following:
(a) marked impairment in the use of multiple nonverbal behaviors such as eye-to-eye gaze, facial expression, body postures, and gestures to regulate social interaction(b) failure to develop peer relationships appropriate to developmental level(c) a lack of spontaneous seeking to share enjoyment, interests, or achievements with other people (e.g., by a lack of showing, bringing, or pointing out objects of interest)(d) lack of social or emotional reciprocity
(2) qualitative impairments in communication as manifested by at least one of the following:(a) delay in, or total lack of, the development of spoken language (not accompanied by an attempt to compensate through alternative modes of communication such as gesture or mime)(b) in individuals with adequate speech, marked impairment in the ability to initiate or sustain a conversation with others(c) stereotyped and repetitive use of language or idiosyncratic language(d) lack of varied, spontaneous make-believe play or social imitative play appropriate to developmental level
(3) restricted repetitive and stereotyped patterns of behavior, interests, and activities, as manifested by at least one of the following:
(a) encompassing preoccupation with one or more stereotyped and restricted patterns of interest that is abnormal either in intensity or focus(b) apparently inflexible adherence to specific, nonfunctional routines or rituals(c) stereotyped and repetitive motor mannerisms (e.g., hand or finger flapping or twisting, or complex whole body movements)(d) persistent preoccupation with parts of objects
B. Delays or abnormal functioning in at least one of the following areas, with onset prior to age 3 years: (1) social interaction, (2) language as used in social communication, or (3) symbolic or imaginative play.
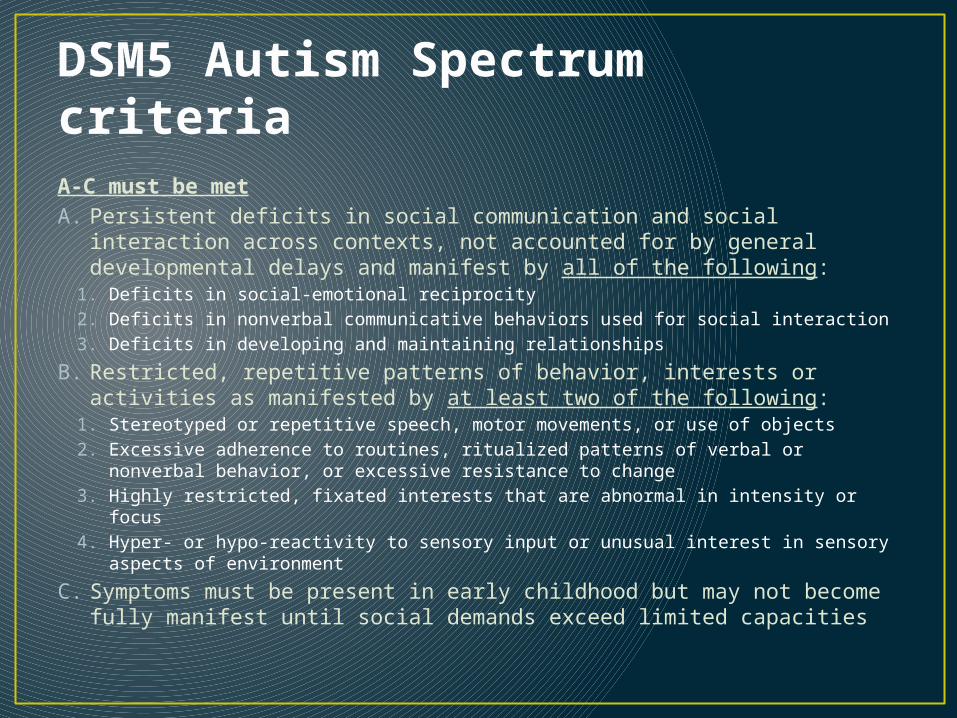
DSM5 Autism Spectrum criteriaA-C must be metA. Persistent deficits in social communication and social interaction
across contexts, not accounted for by general developmental delays and manifest by all of the following:
1. Deficits in social-emotional reciprocity2. Deficits in nonverbal communicative behaviors used for social interaction3. Deficits in developing and maintaining relationships
B. Restricted, repetitive patterns of behavior, interests or activities as manifested by at least two of the following:
1. Stereotyped or repetitive speech, motor movements, or use of objects2. Excessive adherence to routines, ritualized patterns of verbal or nonverbal
behavior, or excessive resistance to change3. Highly restricted, fixated interests that are abnormal in intensity or focus4. Hyper- or hypo-reactivity to sensory input or unusual interest in sensory aspects
of environment
C. Symptoms must be present in early childhood but may not become fully manifest until social demands exceed limited capacities
What does the “autism spectrum” look like?• http://youtu.be/FeGaffIJvHM• http://youtu.be/Iu7C5clA4q0
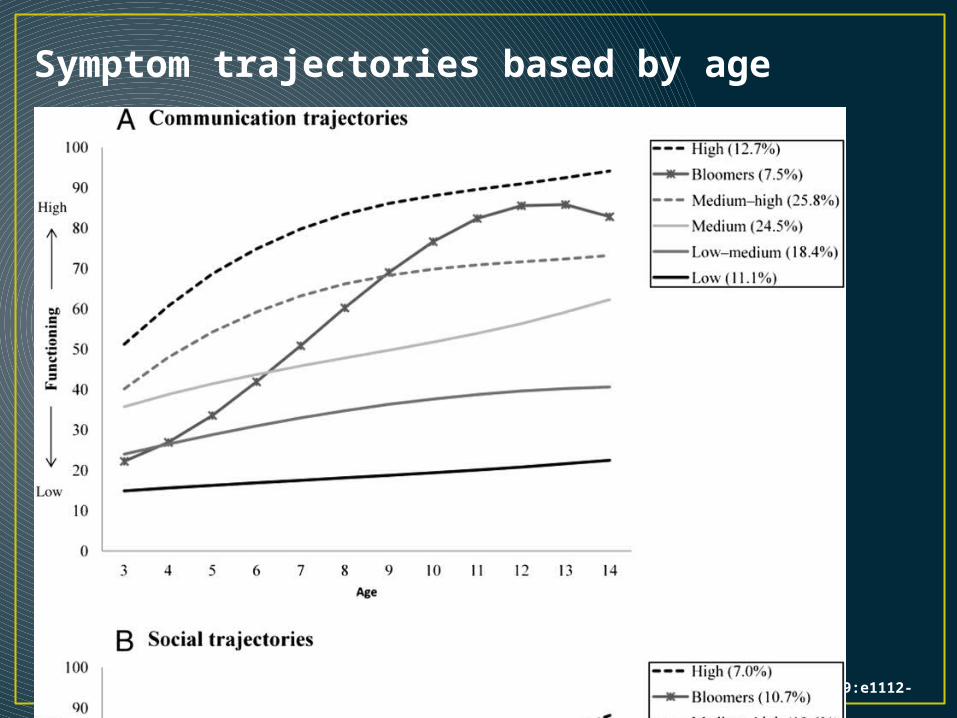
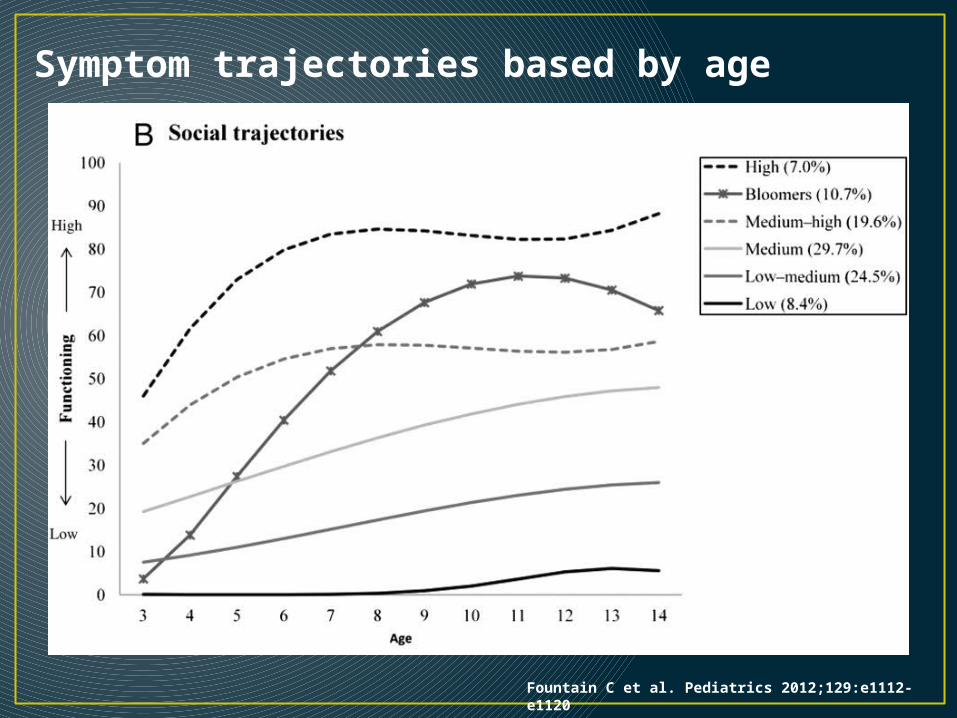
Symptom trajectories based by age
Fountain C et al. Pediatrics 2012;129:e1112-e1120
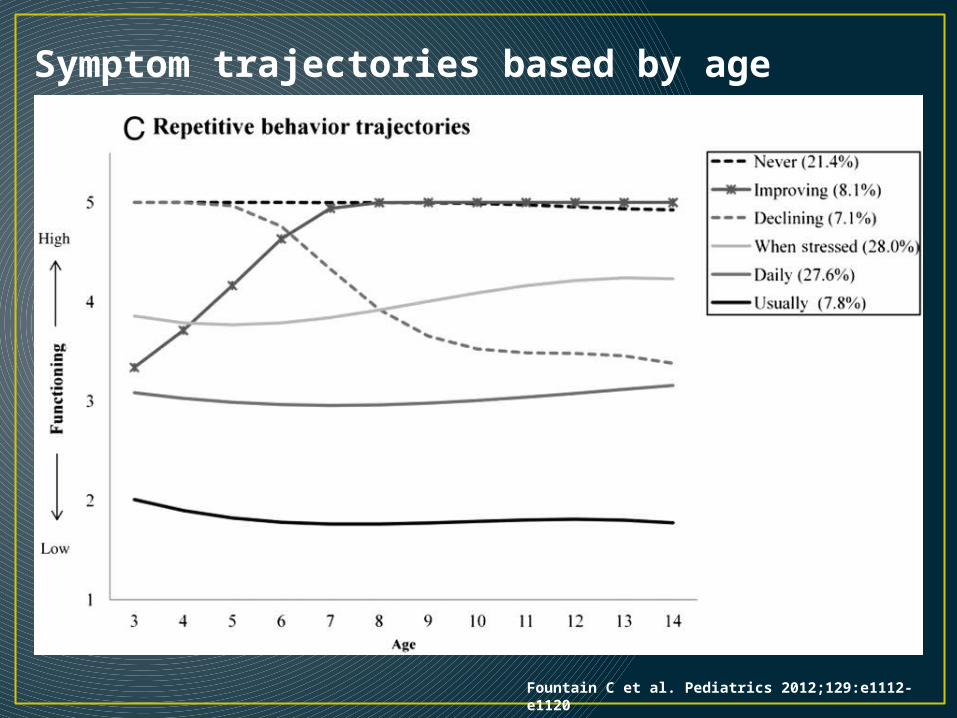
Symptom trajectories based by age
Fountain C et al. Pediatrics 2012;129:e1112-e1120
Symptom trajectories based by age
Fountain C et al. Pediatrics 2012;129:e1112-e1120

Descriptive epidemiology• 4:1 M to F ratio• Diagnosed between ages 1 – 5 years• Heritability between 50 – 75%
• Sticky issue: Singleton vs. multiple births comparable for developmental disorders?

Arch Pediatr Adolesc Med. 2007;161(4):372-377. doi:10.1001/archpedi.161.4.372
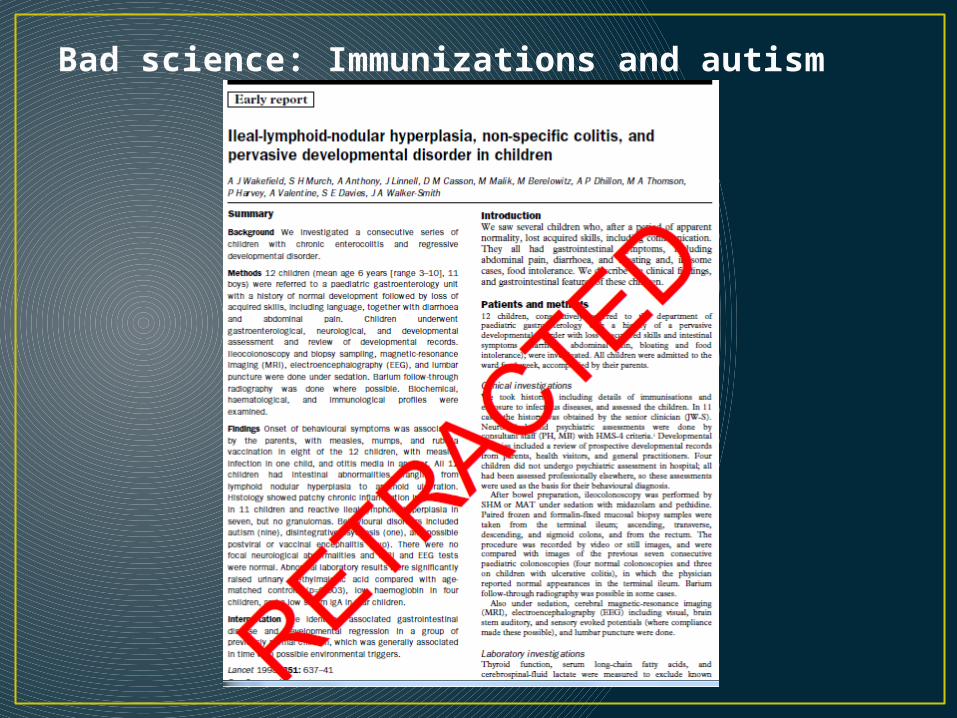
Bad science: Immunizations and autism
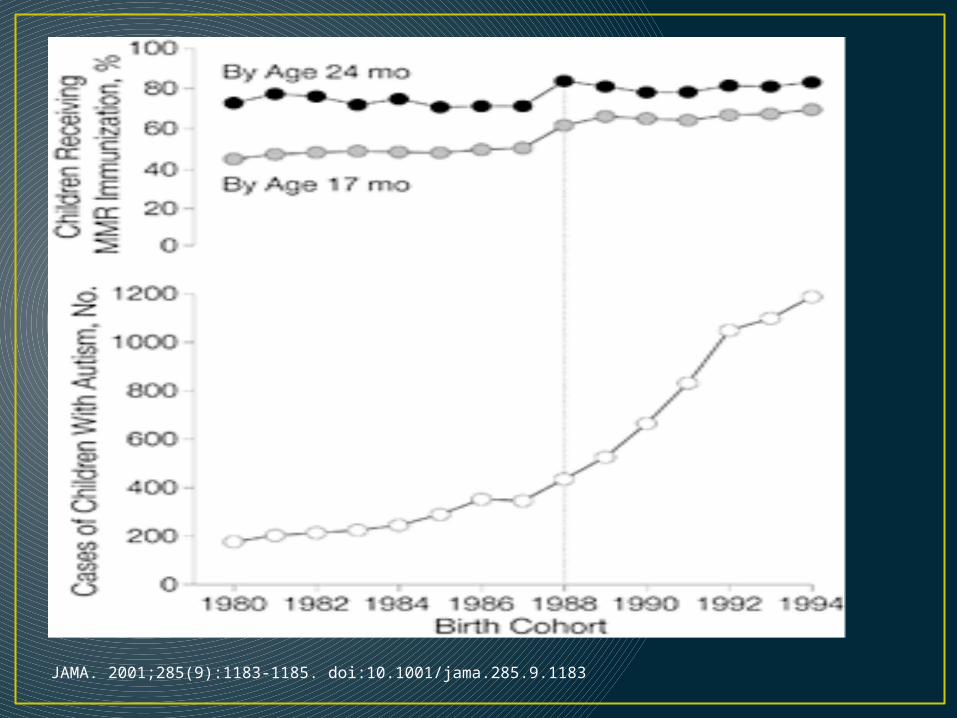
JAMA. 2001;285(9):1183-1185. doi:10.1001/jama.285.9.1183
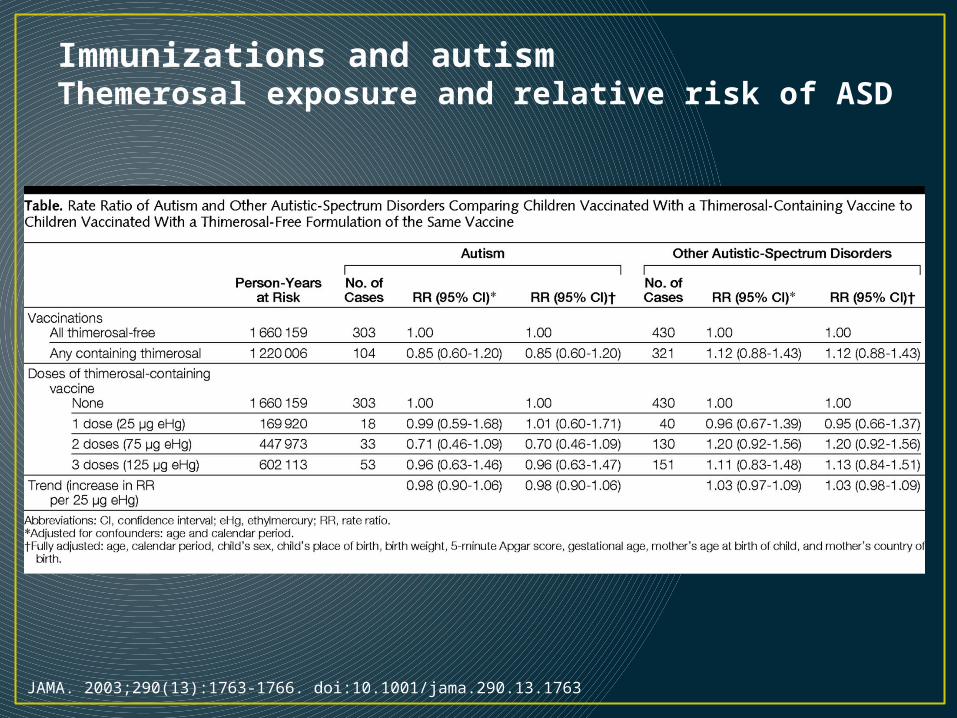
JAMA. 2003;290(13):1763-1766. doi:10.1001/jama.290.13.1763
Immunizations and autismThemerosal exposure and relative risk of ASD
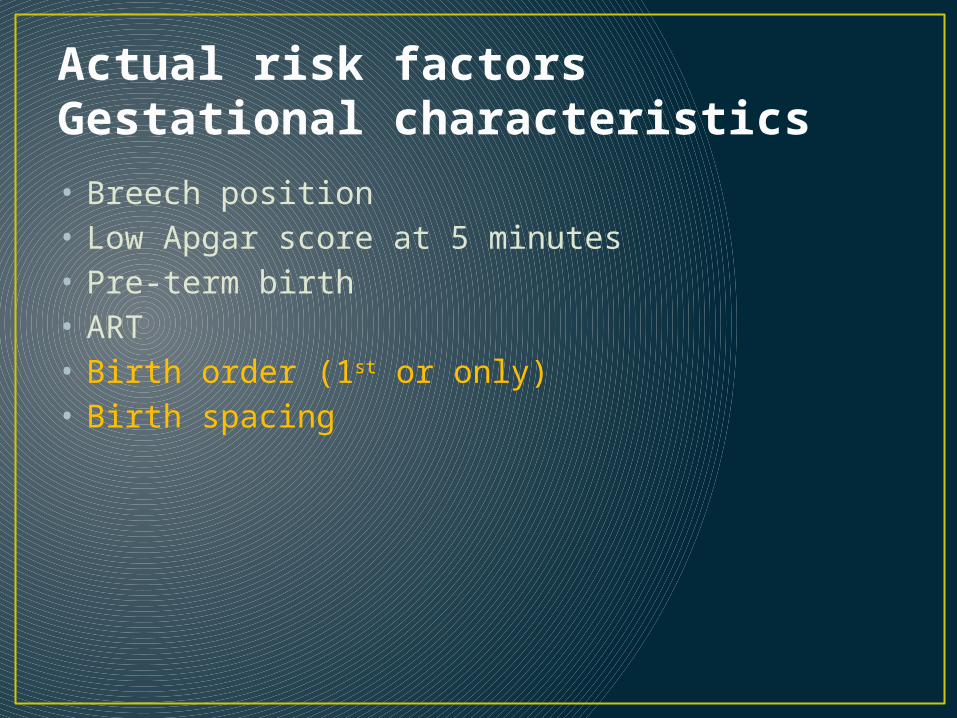
Actual risk factorsGestational characteristics• Breech position • Low Apgar score at 5 minutes• Pre-term birth• ART• Birth order (1st or only)• Birth spacing
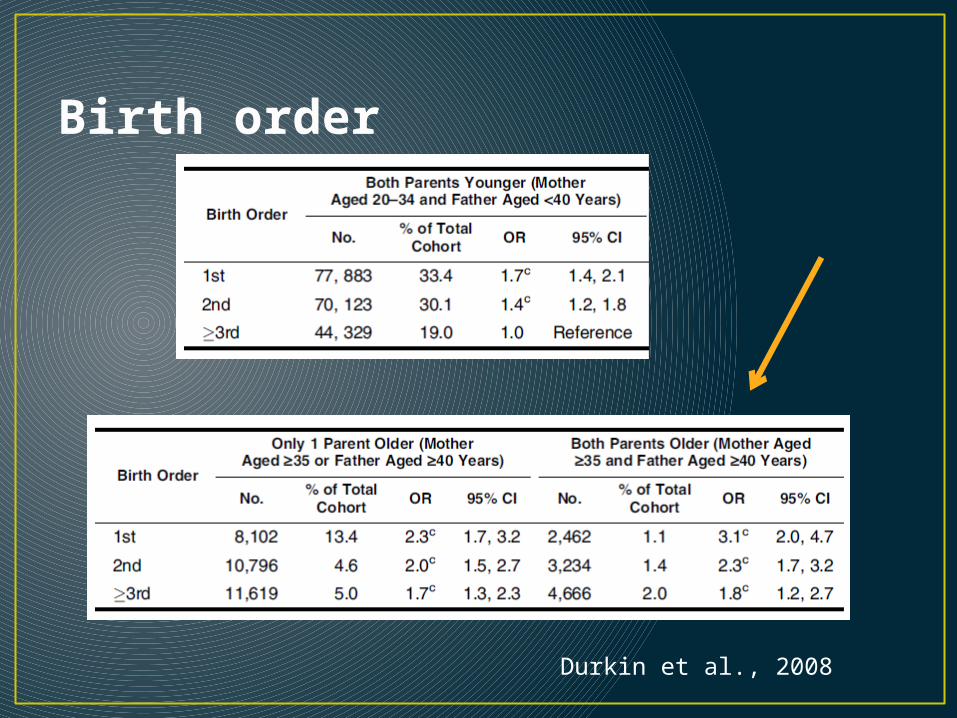
Birth order
Durkin et al., 2008
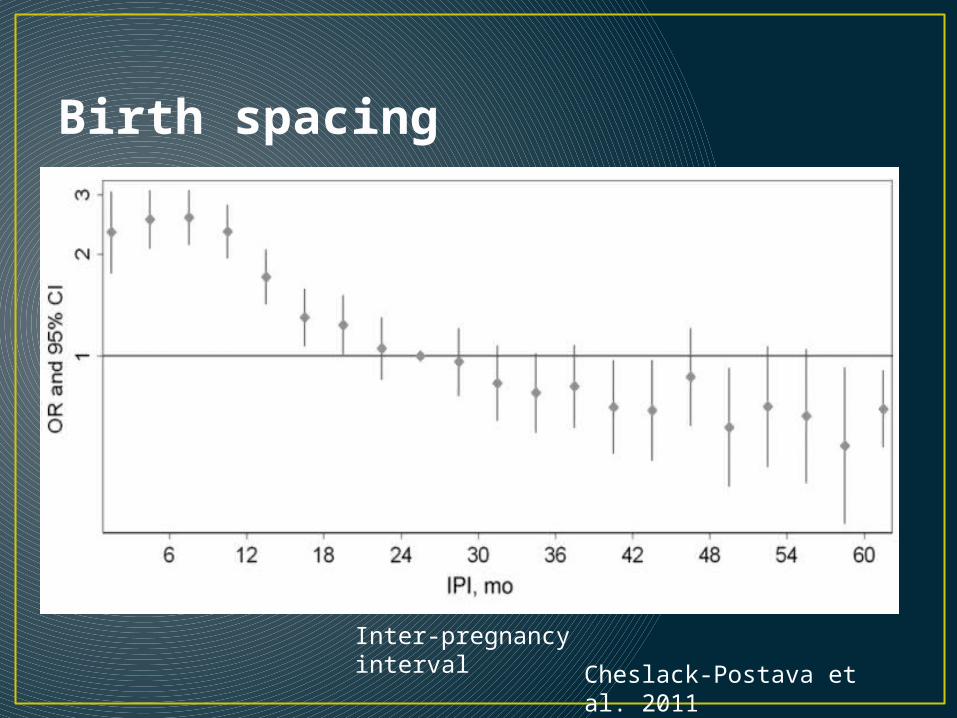
Birth spacing
Inter-pregnancy interval
Cheslack-Postava et al. 2011
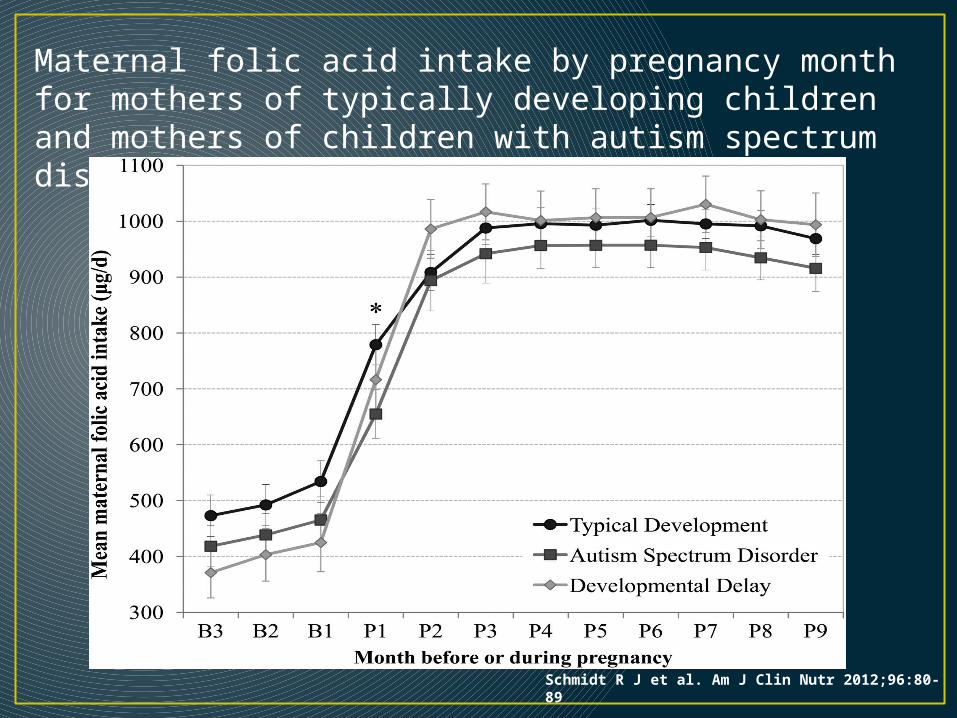
Maternal folic acid intake by pregnancy month for mothers of typically developing children and mothers of children with autism spectrum disorder or developmental delay.
Schmidt R J et al. Am J Clin Nutr 2012;96:80-89
Parental characteristics• Maternal age• Paternal age• Parental psychopathology
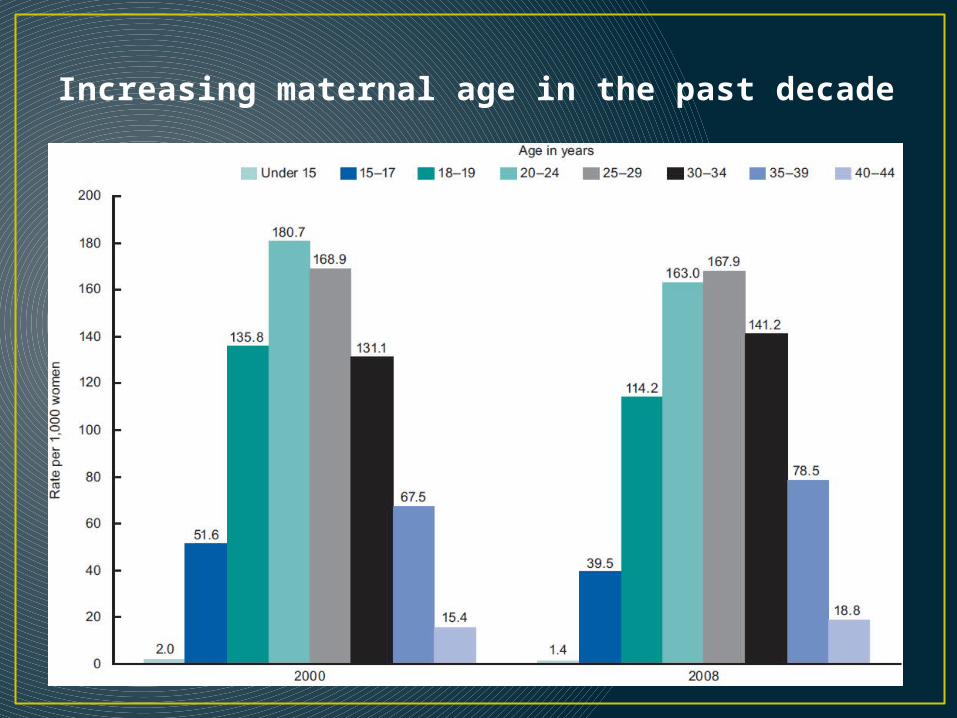
Increasing maternal age in the past decade
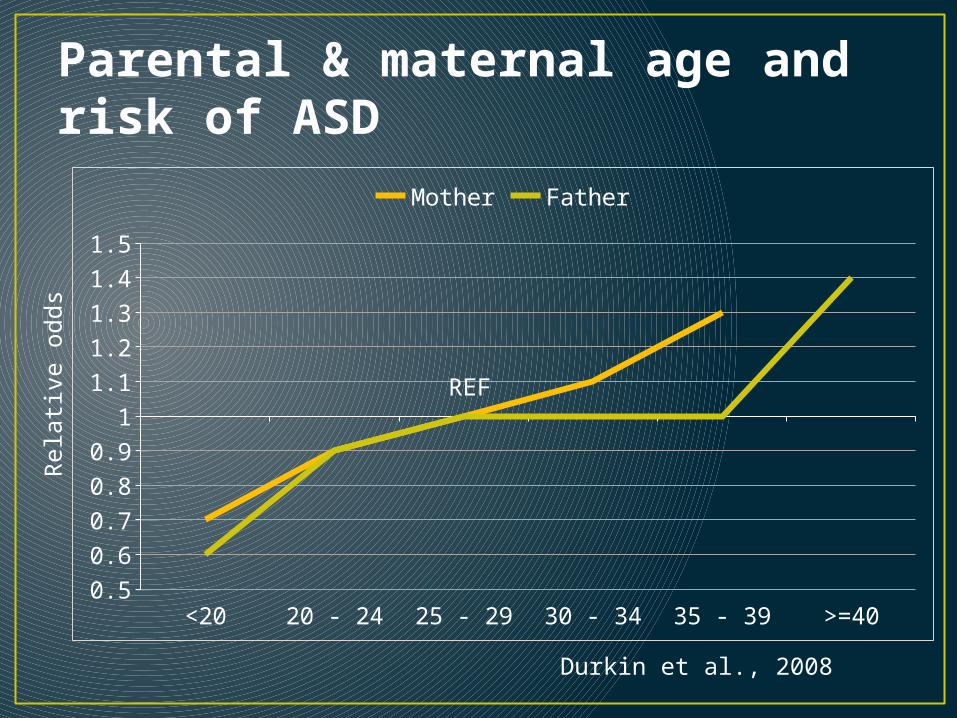
Parental & maternal age and risk of ASD
<20 20 - 24 25 - 29 30 - 34 35 - 39 >=400.5
0.6
0.7
0.8
0.9
1
1.1
1.2
1.3
1.4
1.5
Mother Father
REF
Rela
tive o
dds
Durkin et al., 2008
Unpacking paternal age• Older parents are more educated• Older partners make older parents
• Assortative mating of the socially-awkward?
• Older parents are more likely to have short-spaced births• Nutritional deficiency?
• More likely to use assisted reproductive technologies to conceive
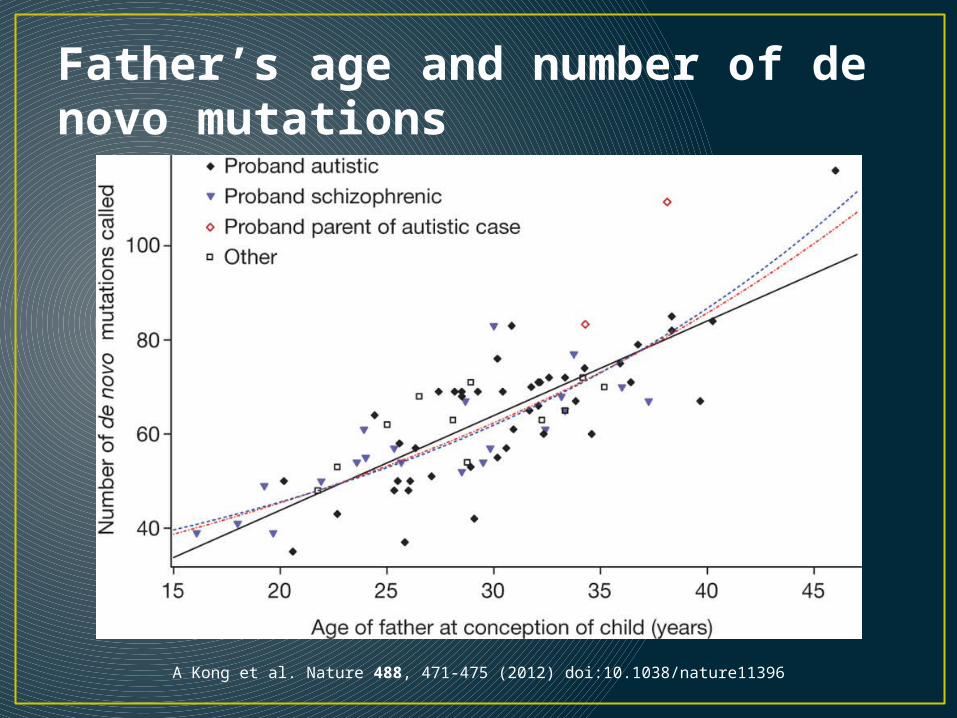
Father’s age and number of de novo mutations
A Kong et al. Nature 488, 471-475 (2012) doi:10.1038/nature11396
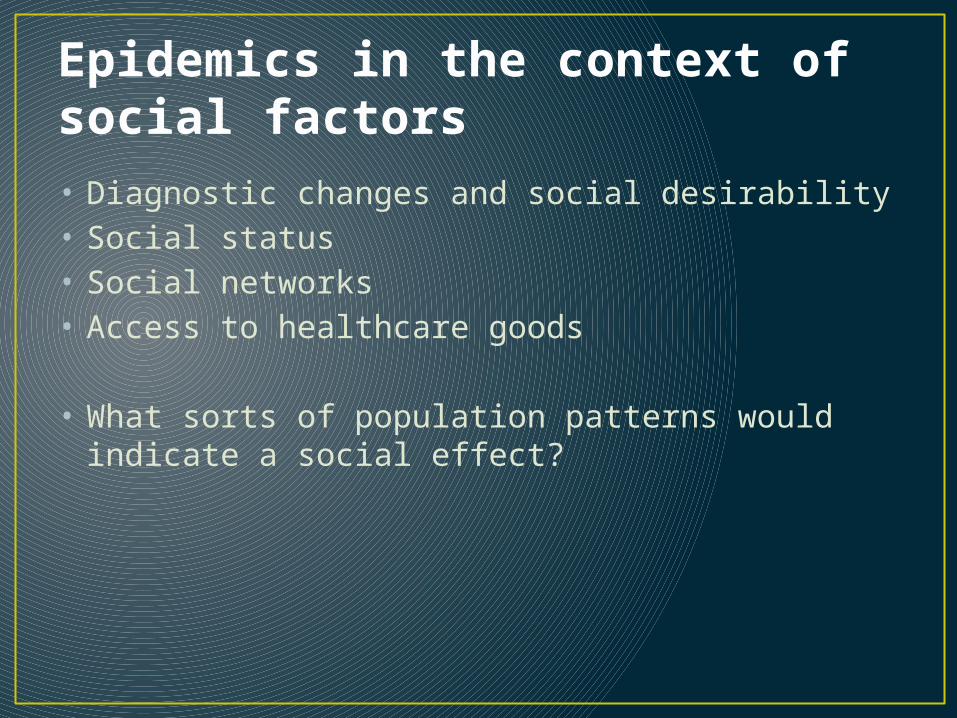
Epidemics in the context of social factors• Diagnostic changes and social desirability• Social status• Social networks• Access to healthcare goods
• What sorts of population patterns would indicate a social effect?
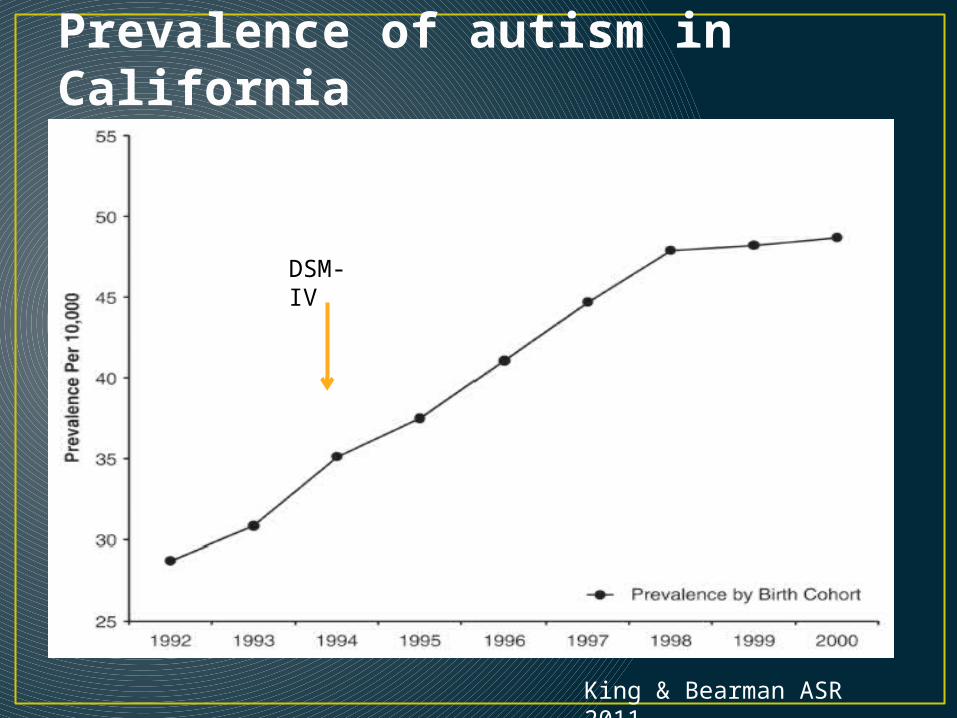
Prevalence of autism in California
King & Bearman ASR 2011
DSM-IV
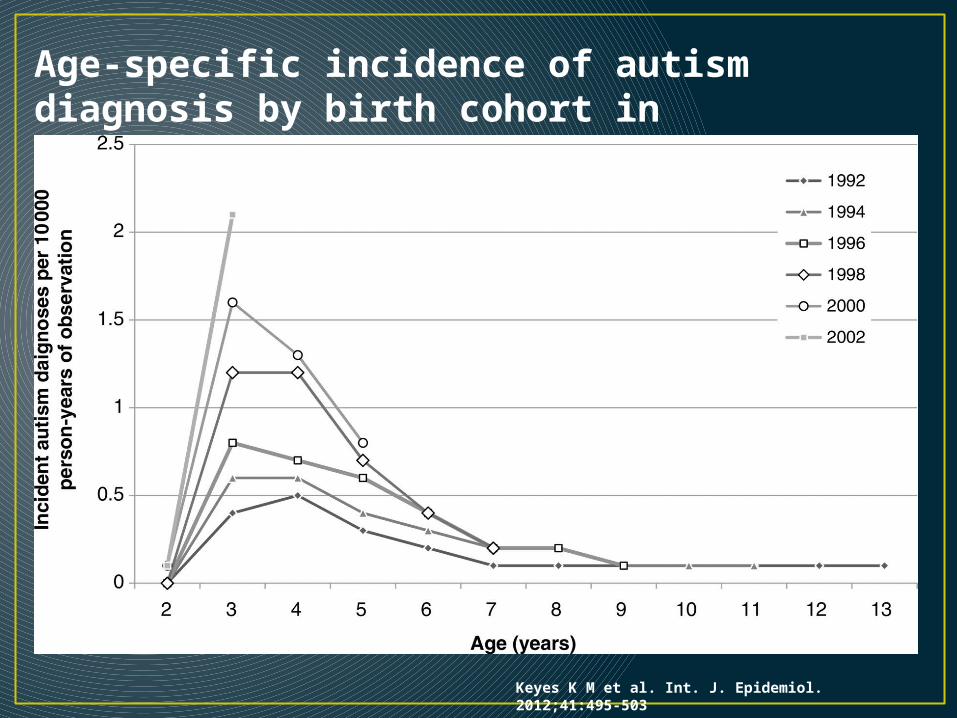
Age-specific incidence of autism diagnosis by birth cohort in California: 1992–2003.
Keyes K M et al. Int. J. Epidemiol. 2012;41:495-503
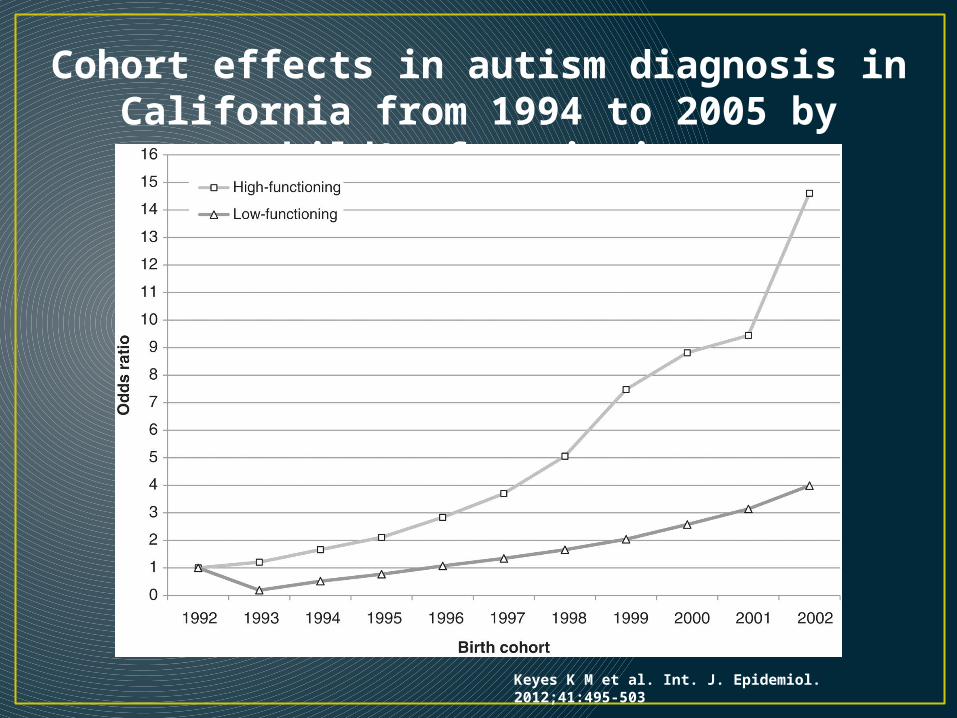
Cohort effects in autism diagnosis in California from 1994 to 2005 by child's functioning
Keyes K M et al. Int. J. Epidemiol. 2012;41:495-503
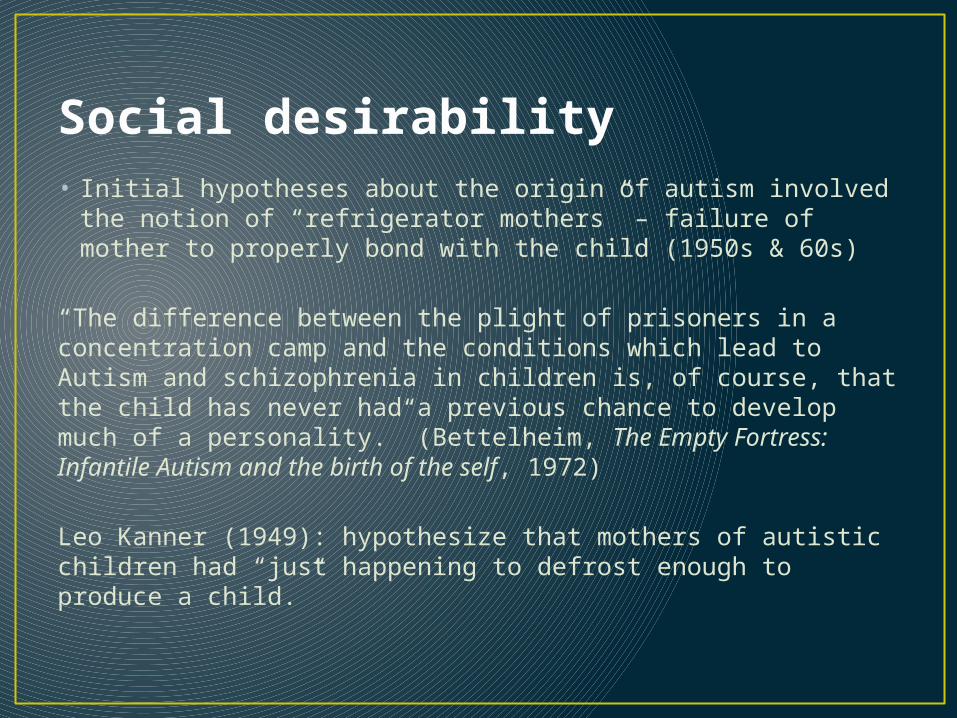
Social desirability• Initial hypotheses about the origin of autism involved the
notion of “refrigerator mothers” – failure of mother to properly bond with the child (1950s & 60s)
“The difference between the plight of prisoners in a concentration camp and the conditions which lead to Autism and schizophrenia in children is, of course, that the child has never had a previous chance to develop much of a personality.” (Bettelheim, The Empty Fortress: Infantile Autism and the birth of the self, 1972)
Leo Kanner (1949): hypothesize that mothers of autistic children had “just happening to defrost enough to produce a child.”

Cumulative incidence due to changing diagnostic criteria
King & Bearman IJE 2009
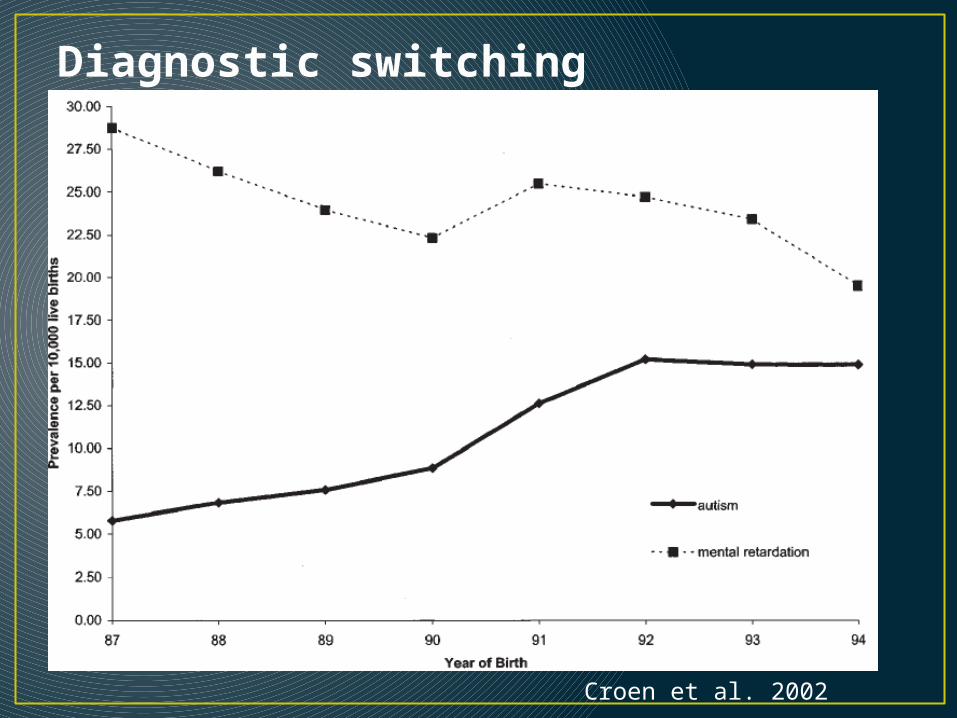
Diagnostic switching
Croen et al. 2002
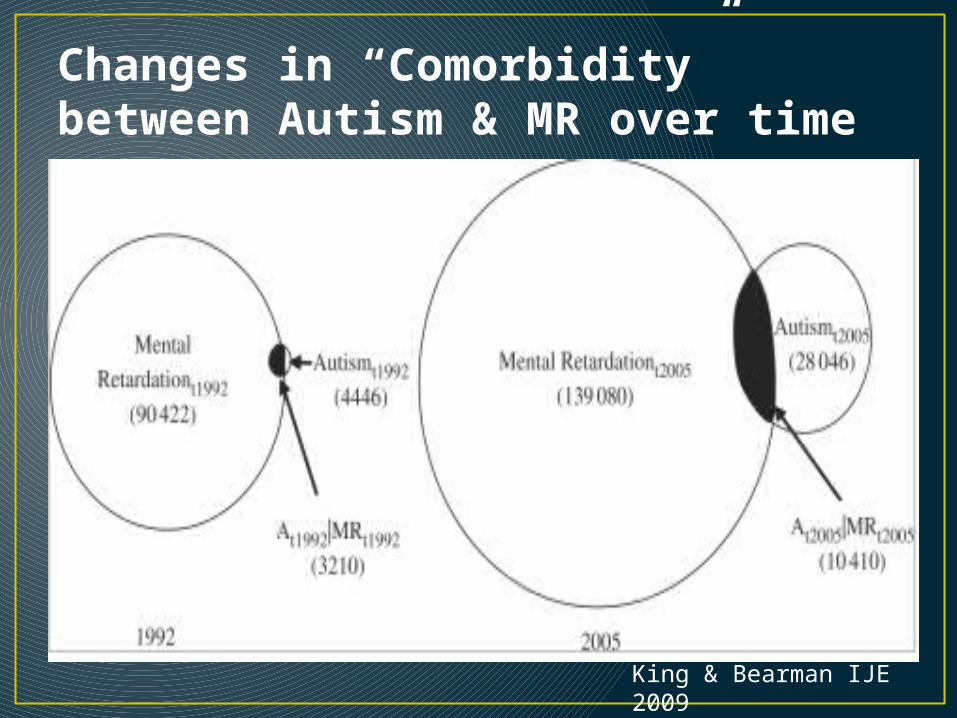
Changes in “Comorbidity” between Autism & MR over time
King & Bearman IJE 2009
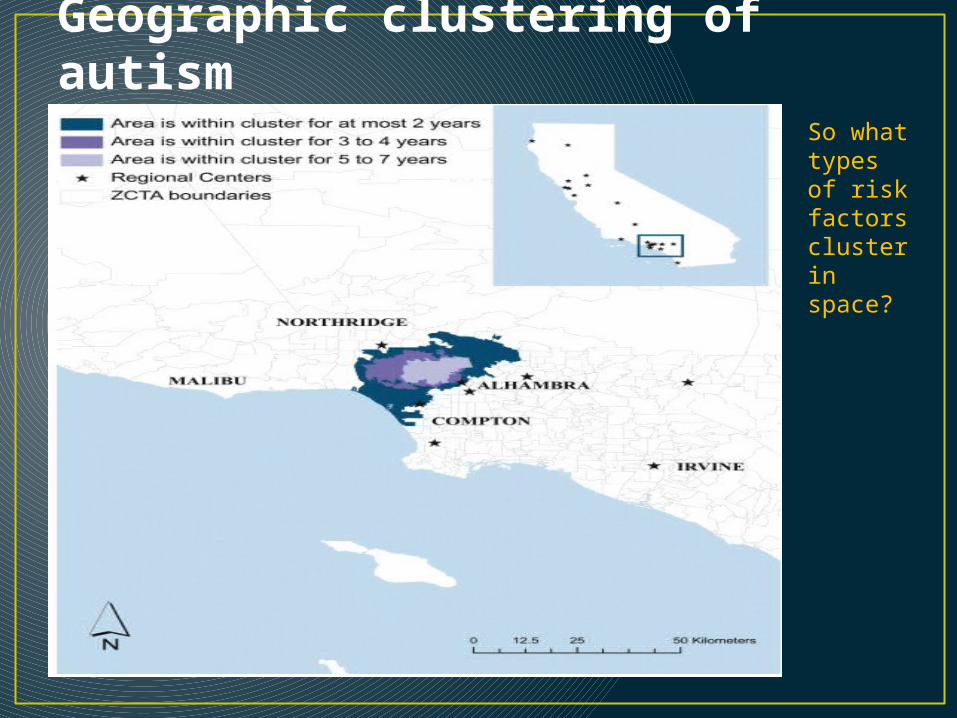
Geographic clustering of autism
So what types of risk factors cluster in space?
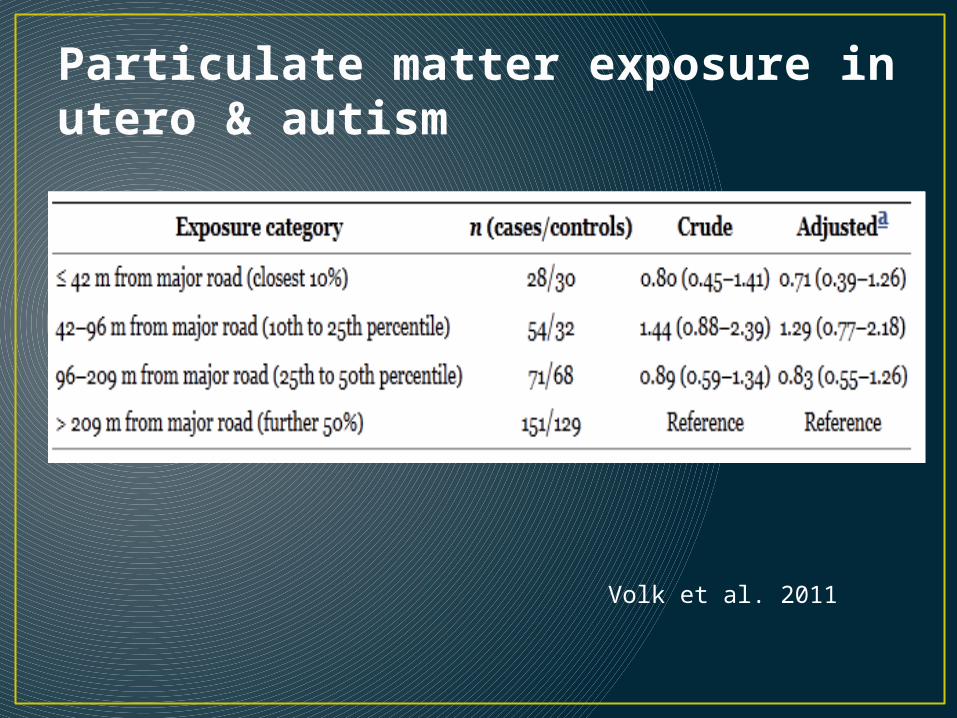
Particulate matter exposure in utero & autism
Volk et al. 2011
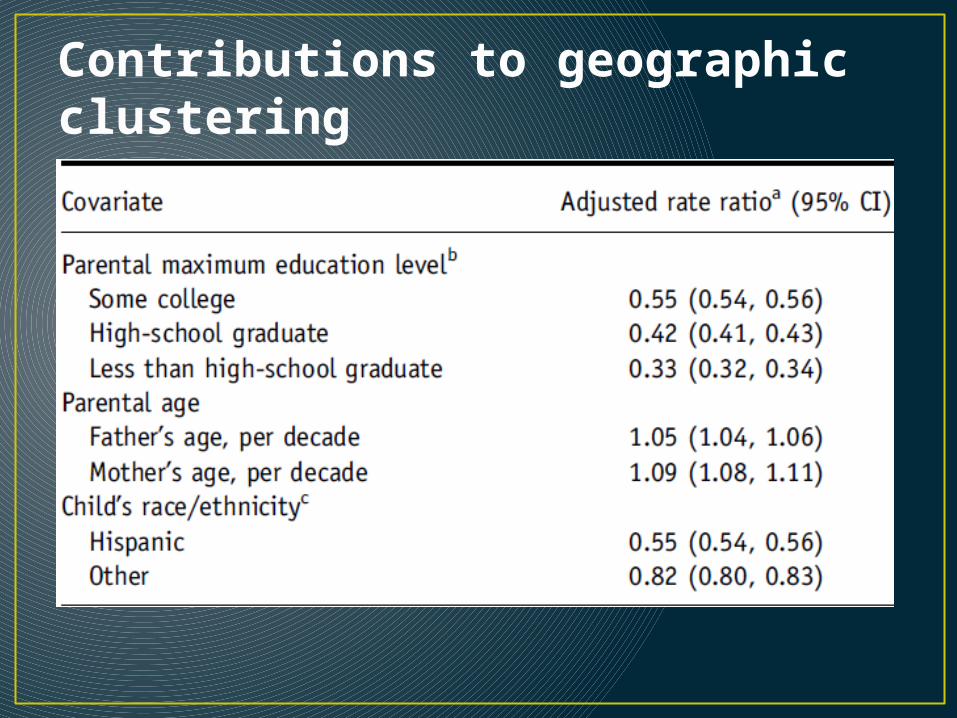
Contributions to geographic clustering
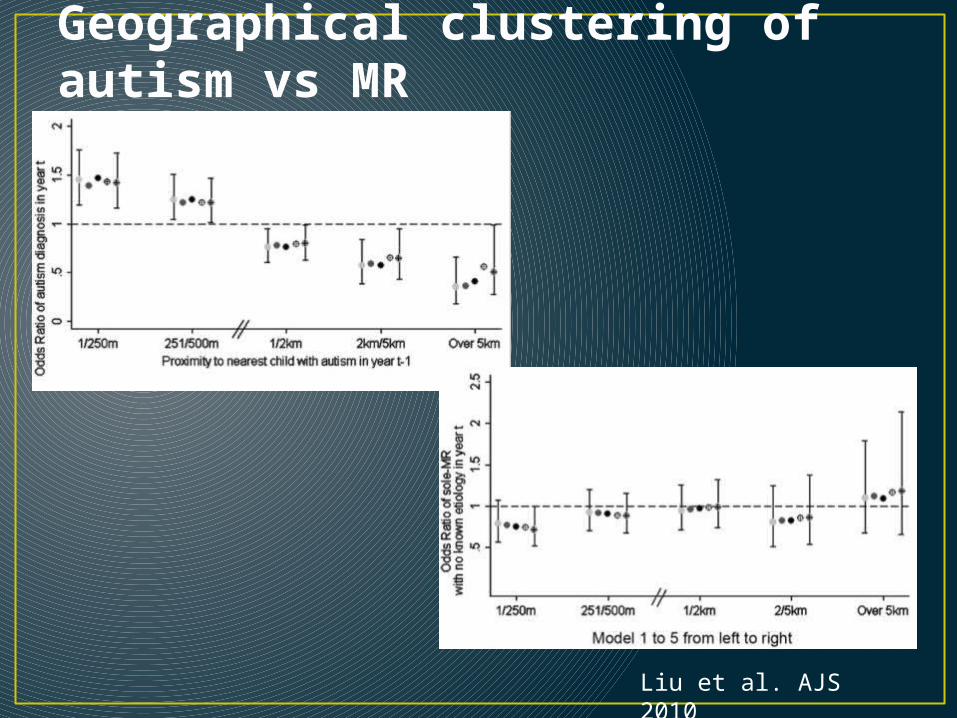
Geographical clustering of autism vs MR
Liu et al. AJS 2010
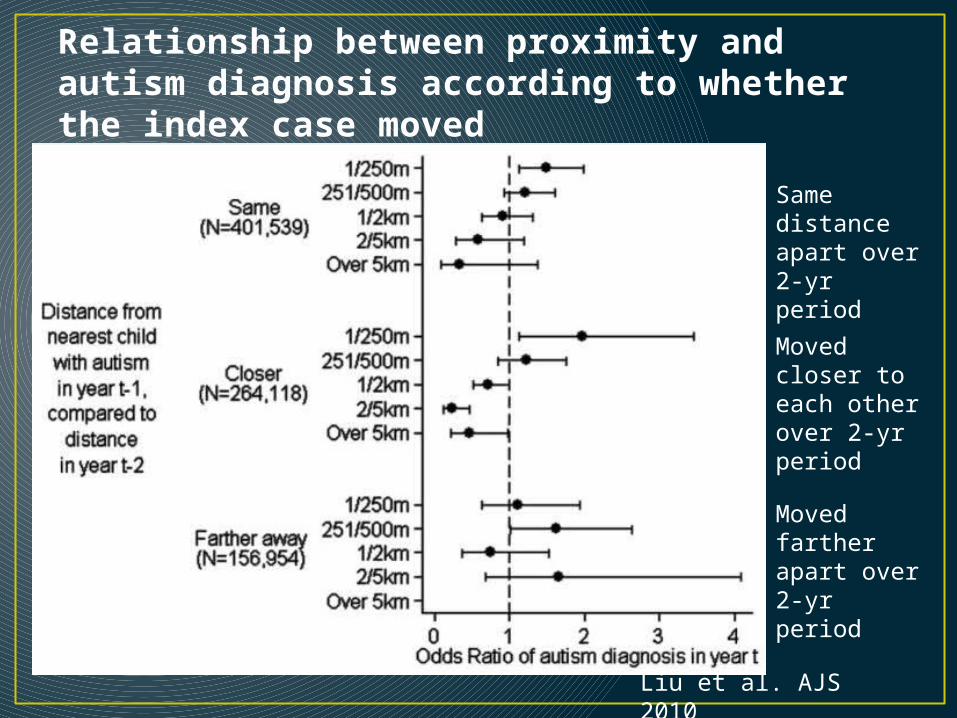
Relationship between proximity and autism diagnosis according to whether the index case moved
Same distance apart over 2-yr period
Moved closer to each other over 2-yr period
Moved farther apart over 2-yr period
Liu et al. AJS 2010

Social desirability by social class
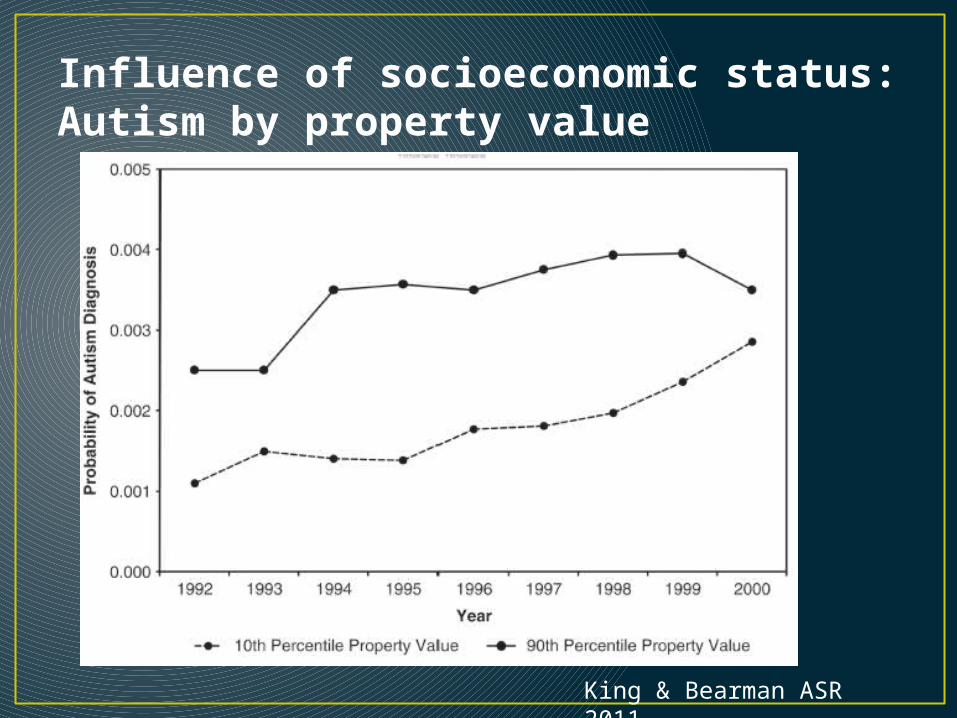
Influence of socioeconomic status:Autism by property value
King & Bearman ASR 2011
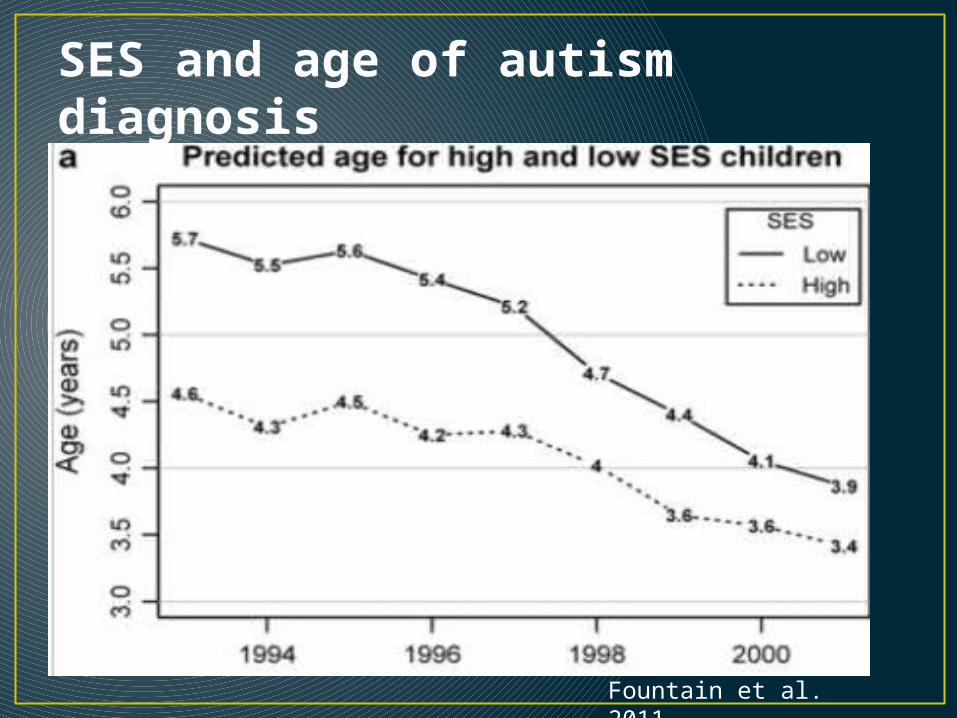
SES and age of autism diagnosis
Fountain et al. 2011
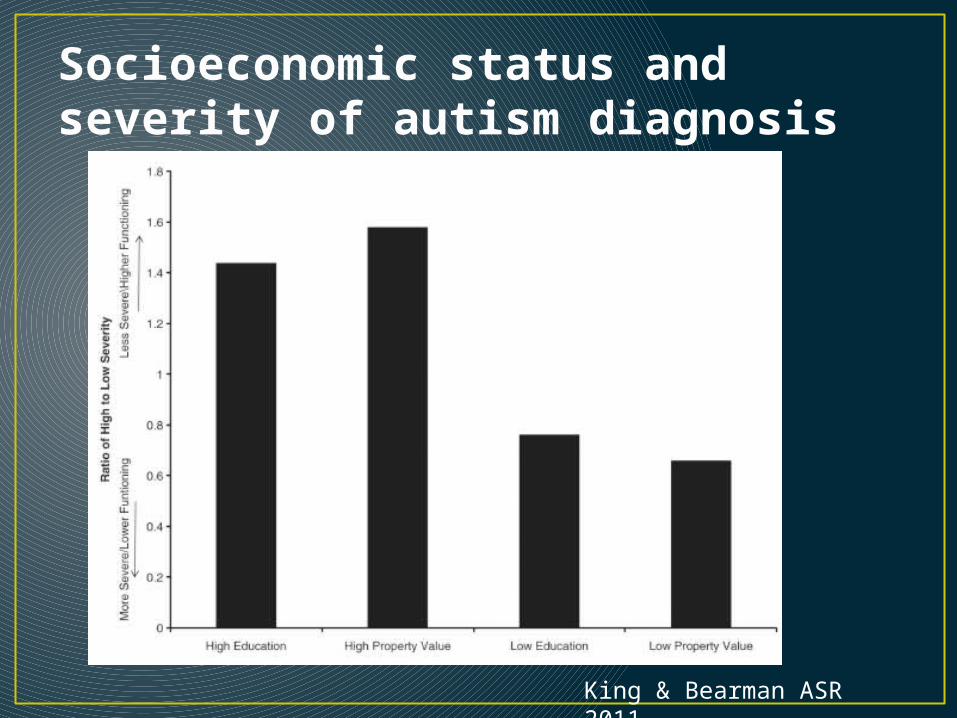
Socioeconomic status and severity of autism diagnosis
King & Bearman ASR 2011
SummarySocial factors and autism• Higher socioeconomic status is associated with:
• Geographic clustering• Earlier detection• Less severe forms
• Consistent (in a way) with Larsson et al. (2004): They did not find an association between parental age or SES and autism, but cases of autism included in the study were more severe (inpatient at children’s psychiatric hospital), which we know is NOT strongly associated with higher SES

Summary• Despite being a non-communicable disease, the autism
epidemic has many features common to infectious diseases• Epidemic increase + saturation of susceptible individuals• Geographic clustering
• When looking for the factors that are underlying an epidemic of a non-contagious disease, need to focus on risk factors that• Influence incidence, not prevalence• Have increased over time (either quantitatively or qualitatively)
• Aggregate in birth cohorts• Match the social patterning of the condition
• Ex: more prevalent among higher-functioning (less-severe) children with autism
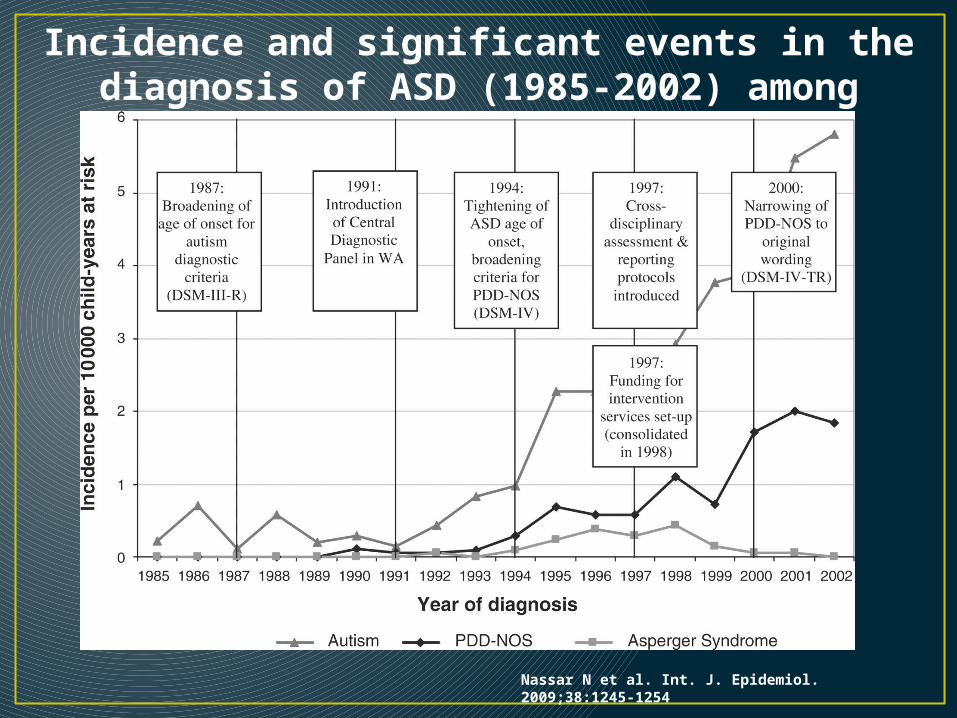
Incidence and significant events in the diagnosis of ASD (1985-2002) among children ≤8 years old.
Nassar N et al. Int. J. Epidemiol. 2009;38:1245-1254
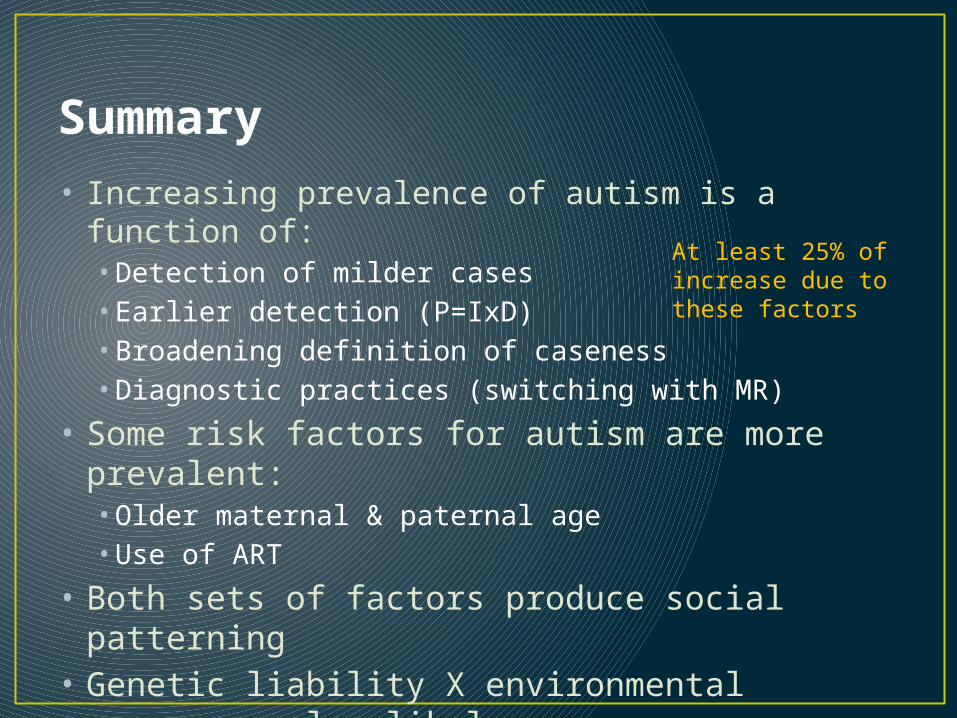
Summary• Increasing prevalence of autism is a function of:
• Detection of milder cases• Earlier detection (P=IxD)• Broadening definition of caseness• Diagnostic practices (switching with MR)
• Some risk factors for autism are more prevalent:• Older maternal & paternal age• Use of ART
• Both sets of factors produce social patterning• Genetic liability X environmental exposures also
likely
At least 25% of increase due to these factors
Young adulthood: Schizophrenia

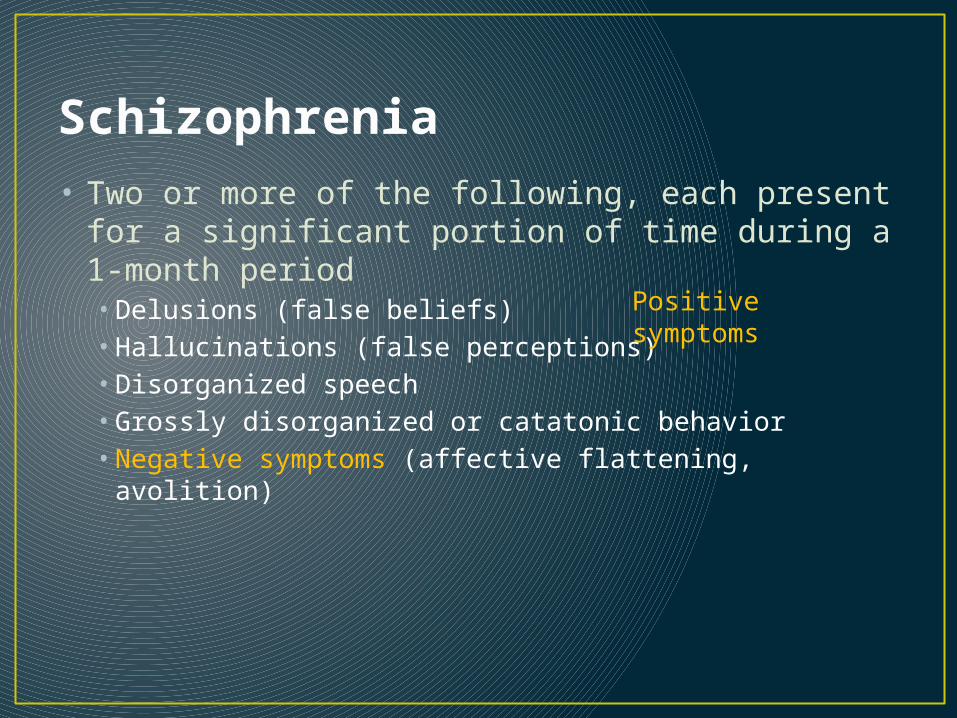
Schizophrenia• Two or more of the following, each present for a
significant portion of time during a 1-month period• Delusions (false beliefs)• Hallucinations (false perceptions)• Disorganized speech• Grossly disorganized or catatonic behavior• Negative symptoms (affective flattening, avolition)
Positive symptoms
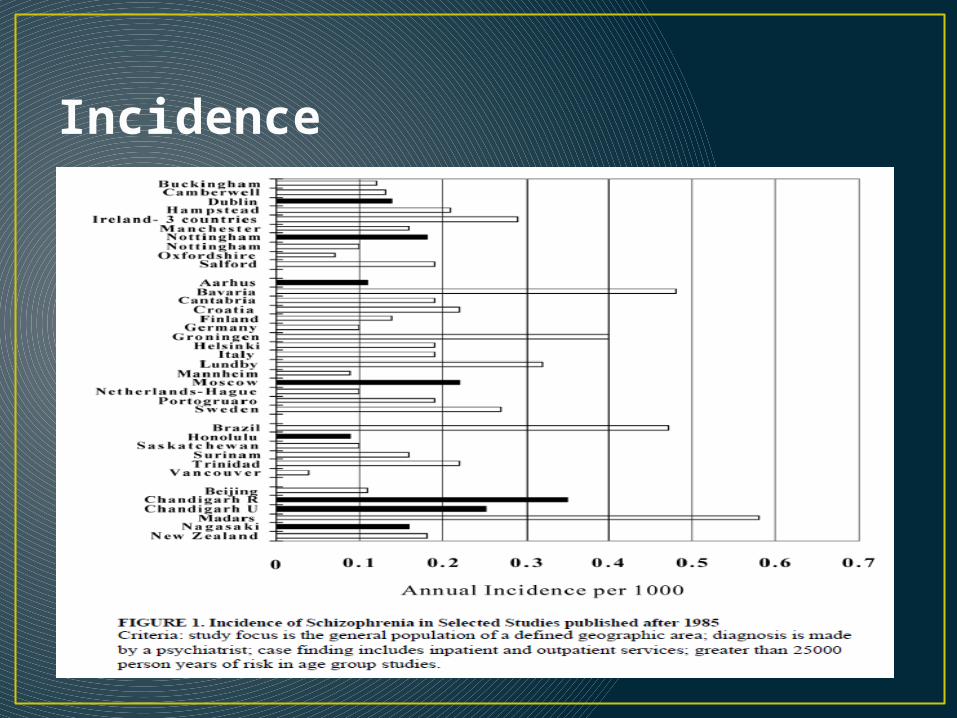
Incidence
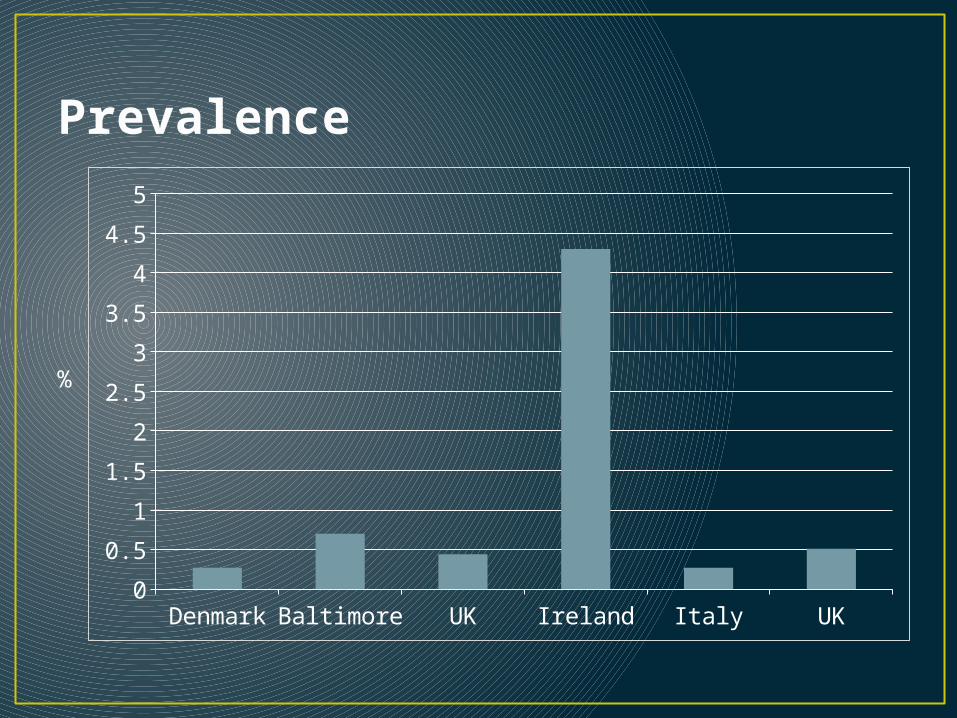
Prevalence
Denmark Baltimore UK Ireland Italy UK0
0.5
1
1.5
2
2.5
3
3.5
4
4.5
5
%
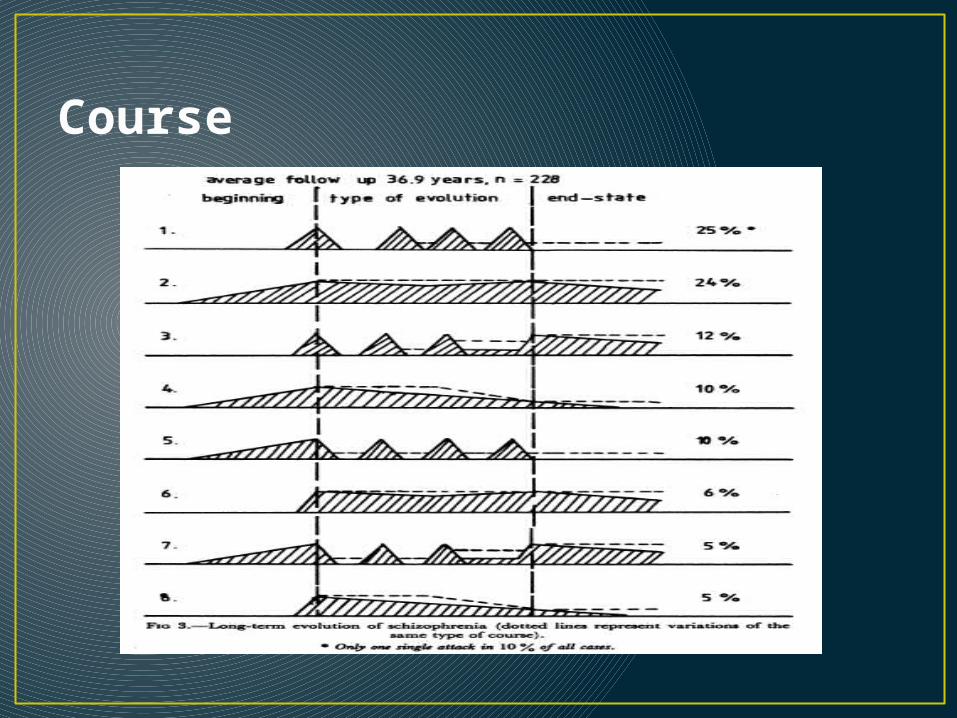
Course
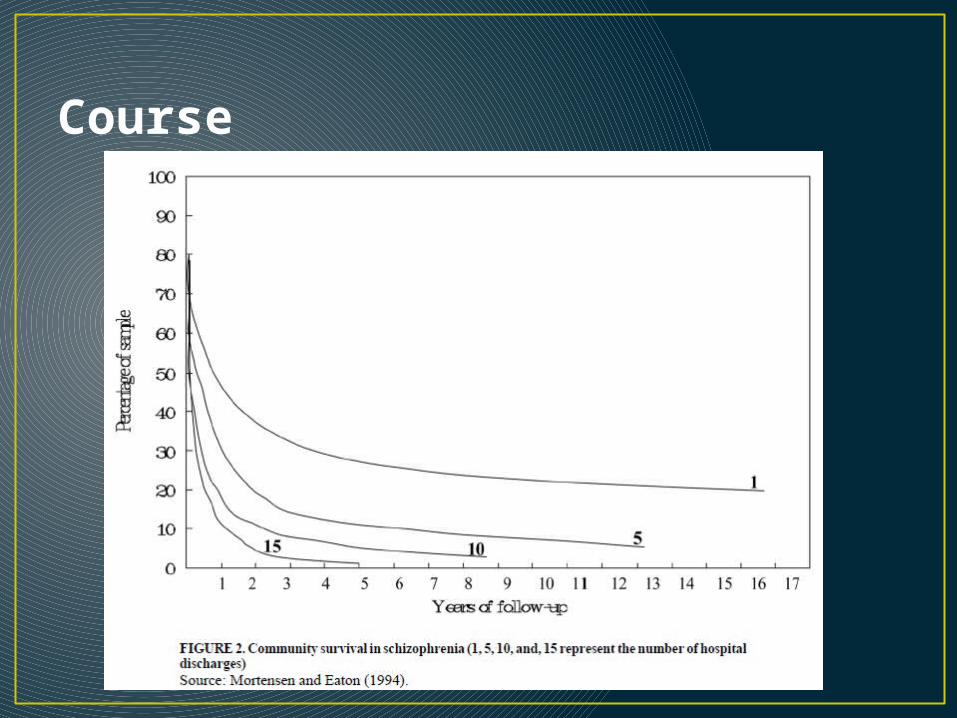
Course
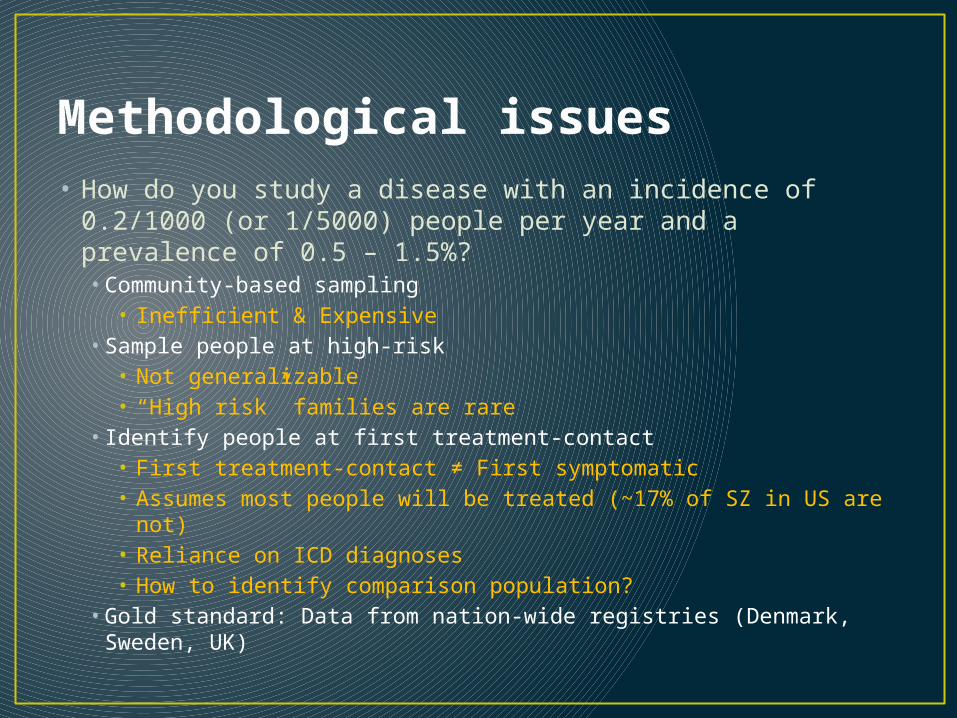
Methodological issues• How do you study a disease with an incidence of 0.2/1000
(or 1/5000) people per year and a prevalence of 0.5 – 1.5%?• Community-based sampling
• Inefficient & Expensive• Sample people at high-risk
• Not generalizable• “High risk” families are rare
• Identify people at first treatment-contact• First treatment-contact ≠ First symptomatic• Assumes most people will be treated (~17% of SZ in US are not)• Reliance on ICD diagnoses• How to identify comparison population?
• Gold standard: Data from nation-wide registries (Denmark, Sweden, UK)
Risk factors• Family history• Paternal age• Obstetric complications• Cannabis• Urbanicity• Ethnicity
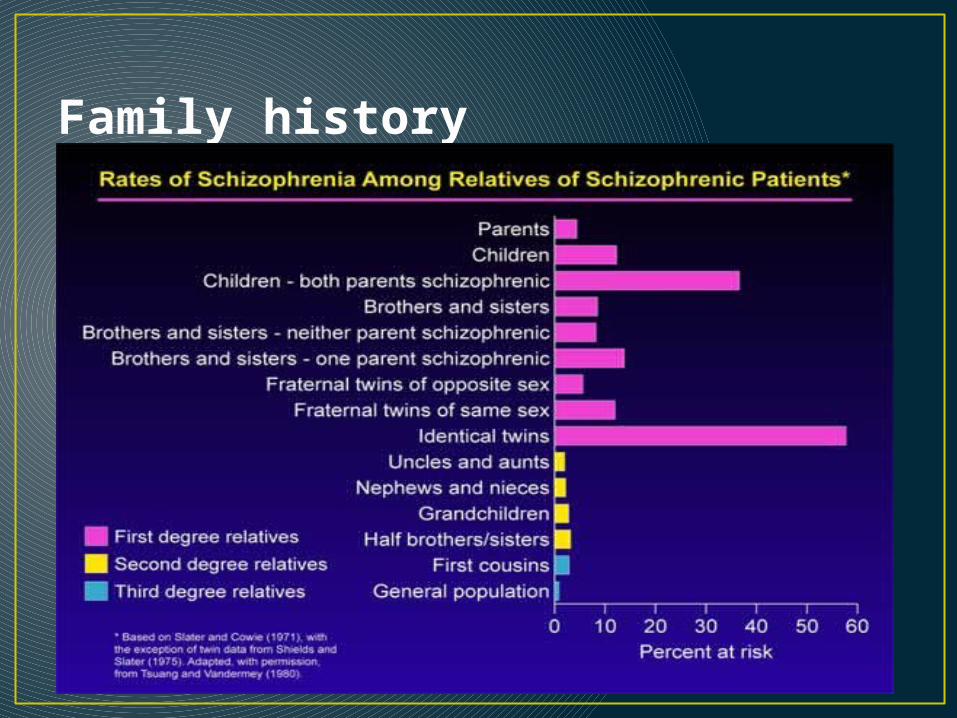
Family history
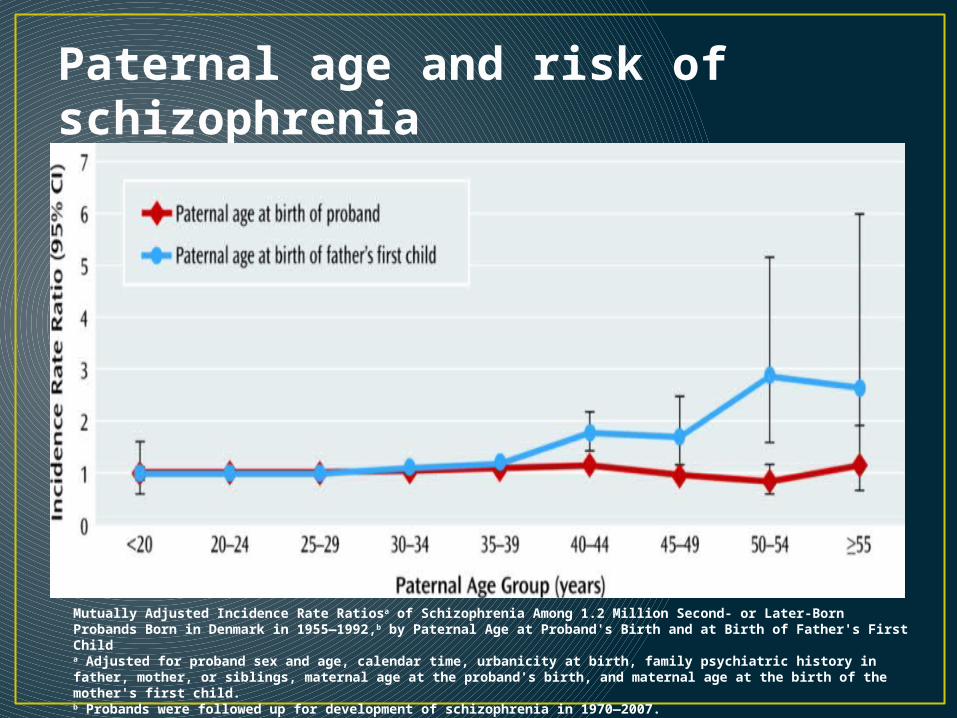
Paternal age and risk of schizophrenia
Mutually Adjusted Incidence Rate Ratiosa of Schizophrenia Among 1.2 Million Second- or Later-Born Probands Born in Denmark in 1955—1992,b by Paternal Age at Proband's Birth and at Birth of Father's First Childa Adjusted for proband sex and age, calendar time, urbanicity at birth, family psychiatric history in father, mother, or siblings, maternal age at the proband's birth, and maternal age at the birth of the mother's first child.b Probands were followed up for development of schizophrenia in 1970—2007.

Father’s age and number of de novo mutations
A Kong et al. Nature 488, 471-475 (2012) doi:10.1038/nature11396

Obstetric complications
Mat
erna
l flu
Mat
erna
l ana
emia
Pre-
ecla
mps
ia
Thre
aten
ed p
rem
atur
e de
liver
y
Haem
orrh
age
durin
g de
liver
y
Man
ual e
xtra
ctio
n
<37
wee
ks
<20
00 g
BW
SGA
0.1
1
10
Byrne et al. Schizophrenia Res 2007
RR
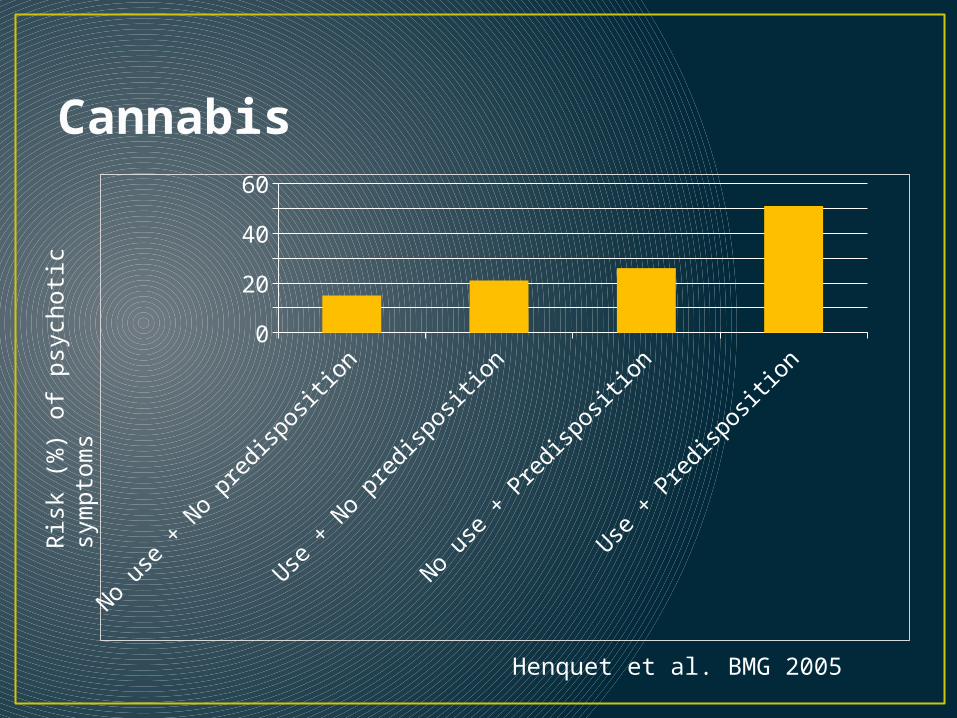
Cannabis
No us
e + N
o pr
edispo
sitio
n
Use +
No
pred
ispo
sitio
n
No us
e + P
redi
spos
ition
Use +
Pre
disp
ositi
on0
102030405060
Ris
k (%
) of
psy
choti
c sy
mpto
ms
Henquet et al. BMG 2005
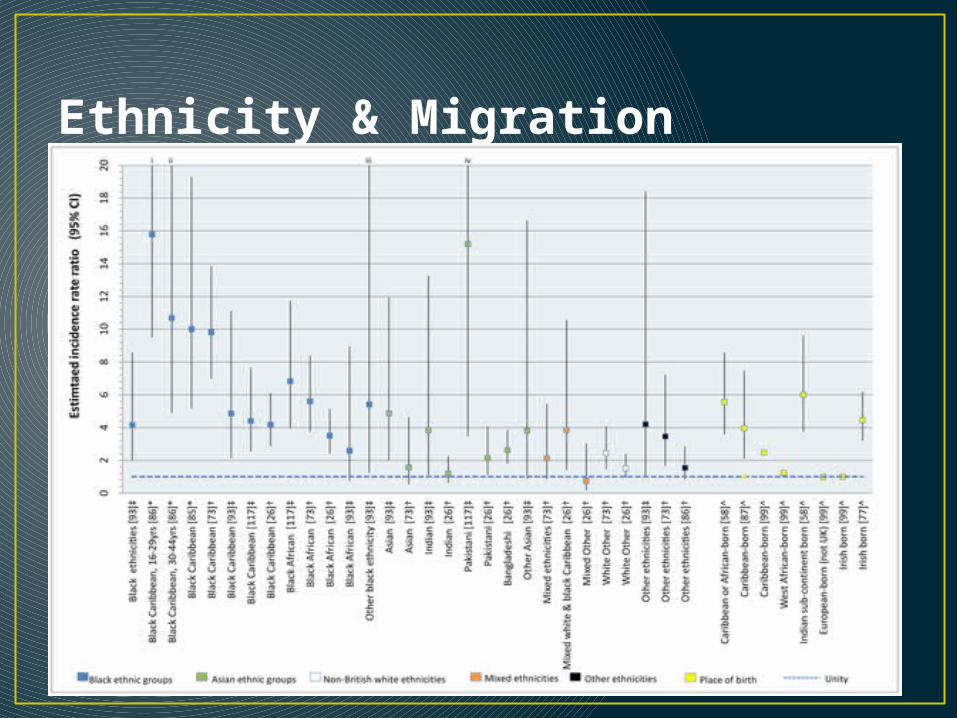
Ethnicity & Migration
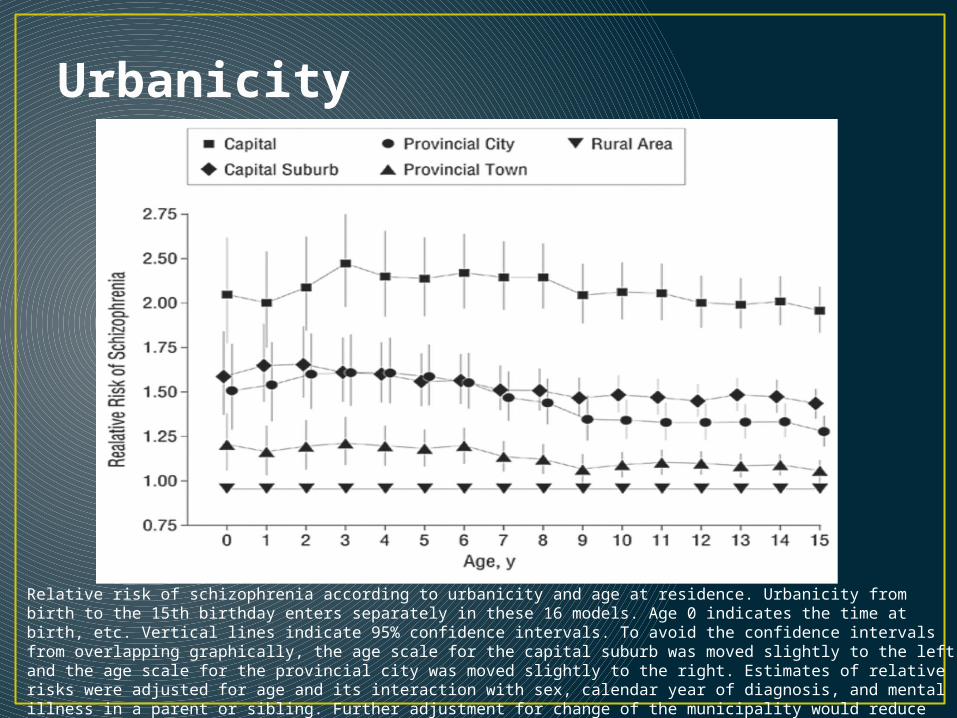
Urbanicity
Relative risk of schizophrenia according to urbanicity and age at residence. Urbanicity from birth to the 15th birthday enters separately in these 16 models. Age 0 indicates the time at birth, etc. Vertical lines indicate 95% confidence intervals. To avoid the confidence intervals from overlapping graphically, the age scale for the capital suburb was moved slightly to the left and the age scale for the provincial city was moved slightly to the right. Estimates of relative risks were adjusted for age and its interaction with sex, calendar year of diagnosis, and mental illness in a parent or sibling. Further adjustment for change of the municipality would reduce the effect of urbanicity only slightly.

Emerging risk factorsAutoimmune disorders
Eaton et al. Am J Psychiatry. 2006;163(3):521-528.
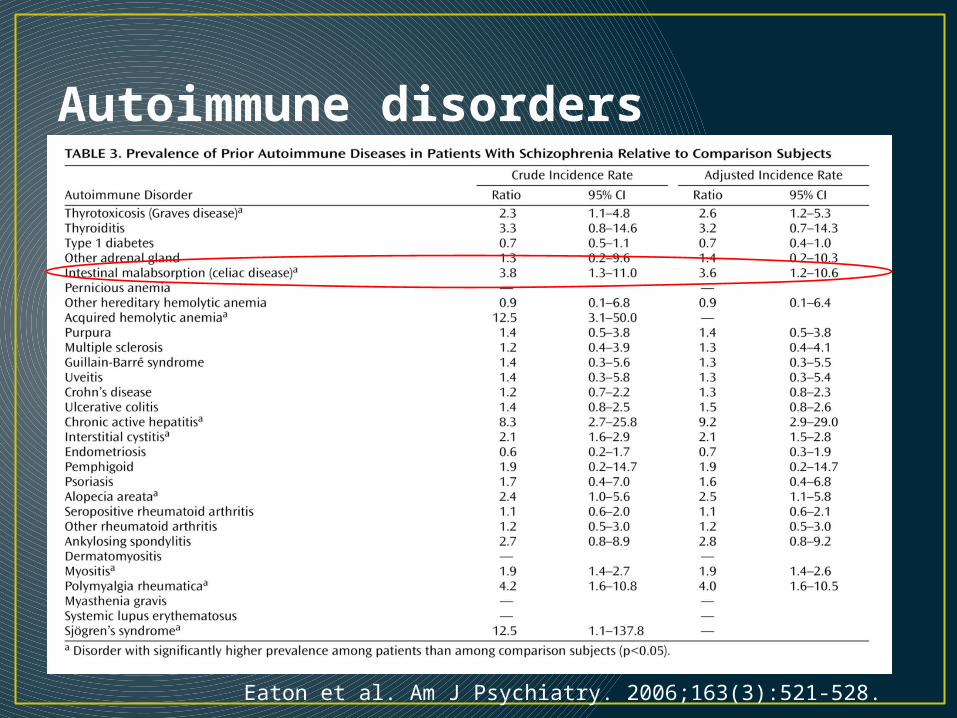
Autoimmune disorders
Eaton et al. Am J Psychiatry. 2006;163(3):521-528.
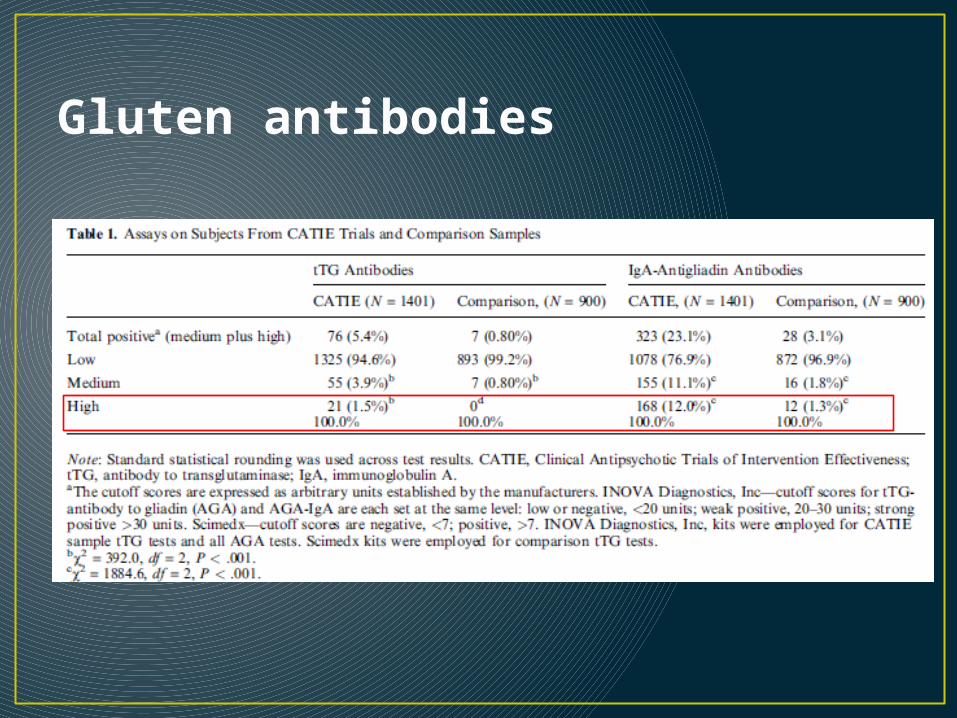
Gluten antibodies
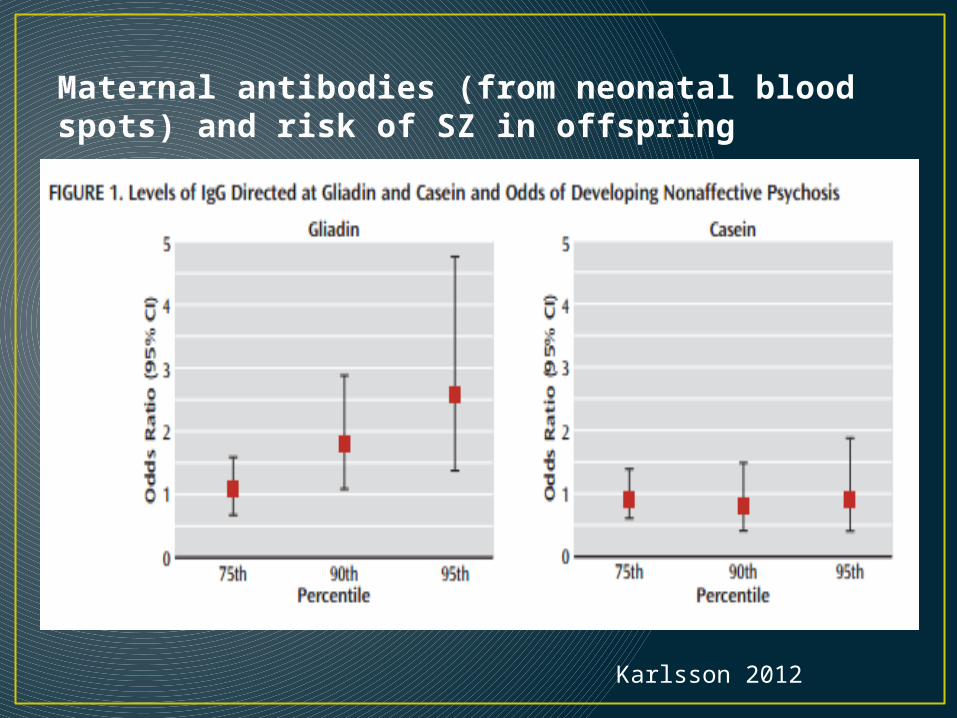
Maternal antibodies (from neonatal blood spots) and risk of SZ in offspring
Karlsson 2012


Later adulthood: Dementia

Schaie & Willis, 2011
Another brief survey• Q1. What is the strongest predictor of dementia?• Q2. Approximately what percent adults 65+ have
dementia?• Q3. Is dementia more common among women or
men?• Q4. What is the most common cause of dementia?
Another brief survey• Q1. What is the strongest predictor of dementia?
• AGE: Risk of dementia increases exponentially with age. Incidence doubles every 5 years after age 65.
• Q2. Approximately what percent adults 65+ have dementia?
• Q3. Is dementia more common among women or men?
• Q4. What is the most common cause of dementia?
Another brief survey• Q1. What is the strongest predictor of dementia?
• AGE: Risk of dementia increases exponentially with age. Incidence doubles every 5 years after age 65.
• Q2. Approximately what percent adults 65+ have dementia?• ~10%. Prevalence age 85+ is ~25-30%
• Q3. Is dementia more common among women or men?• In the US, the ratio of women to men with dementia is ~ 2
to 1.
• Q4. What is the most common cause of dementia?

Another brief survey• Q1. What is the strongest predictor of dementia?
• AGE: Risk of dementia increases exponentially with age. Incidence doubles every 5 years after age 65.
• Q2. Approximately what percent adults 65+ have dementia?• ~10%. Prevalence age 85+ is ~25-30%
• Q3. Is dementia more common among women or men?• In the US, the ratio of women to men with dementia is ~ 2
to 1.
• Q4. What is the most common cause of dementia?• Alzheimer’s disease. Estimated that 50-75% of cases are
caused by AD.
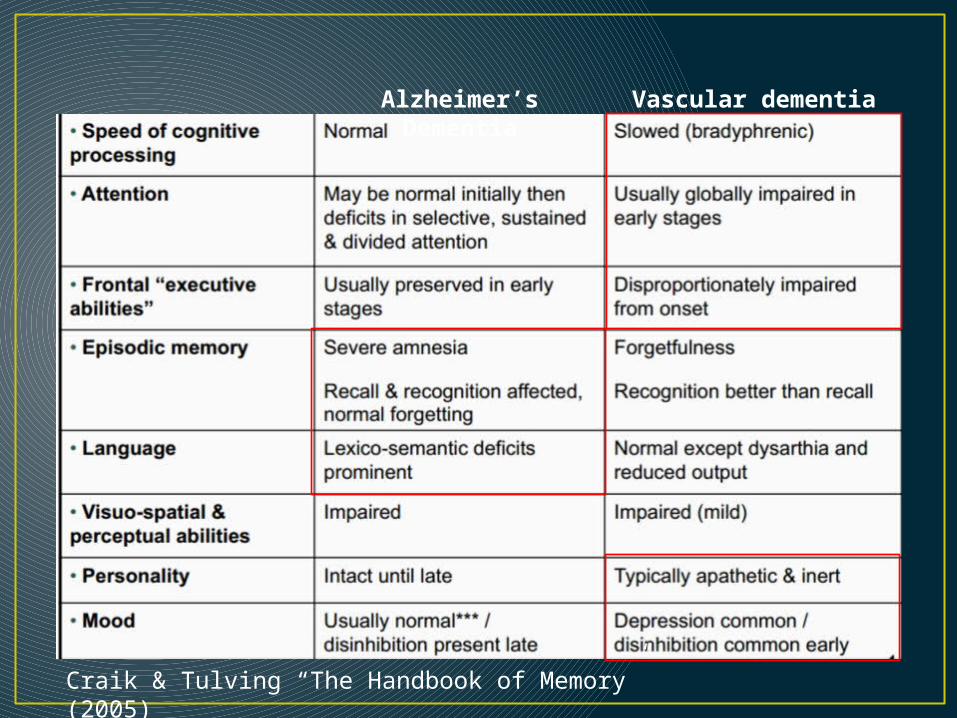
Craik & Tulving “The Handbook of Memory” (2005)
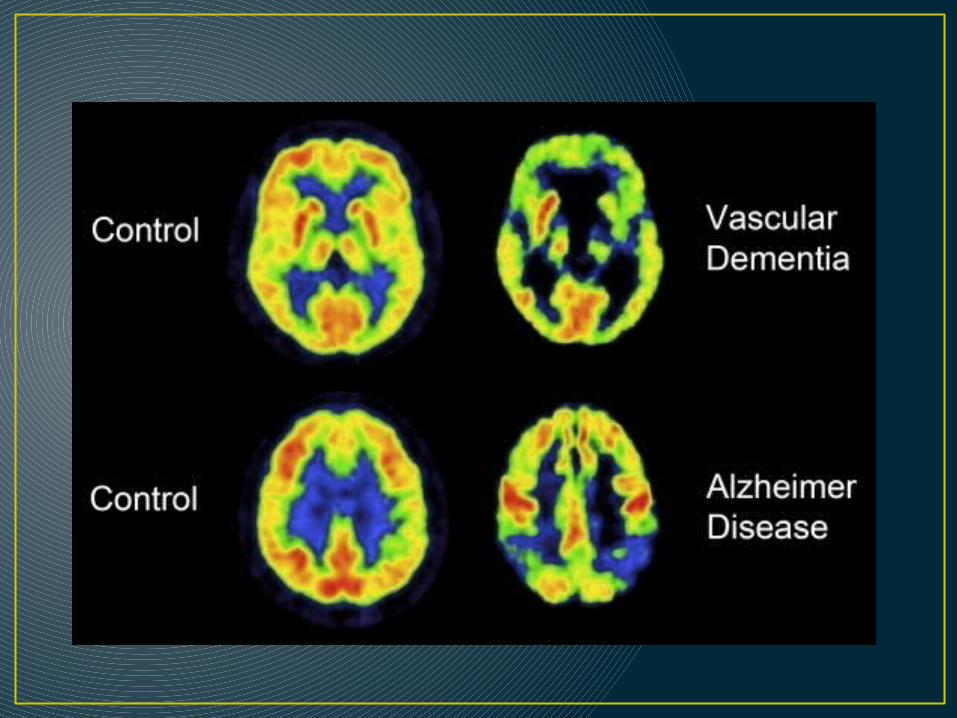
Alzheimer’s Dementia Vascular dementia
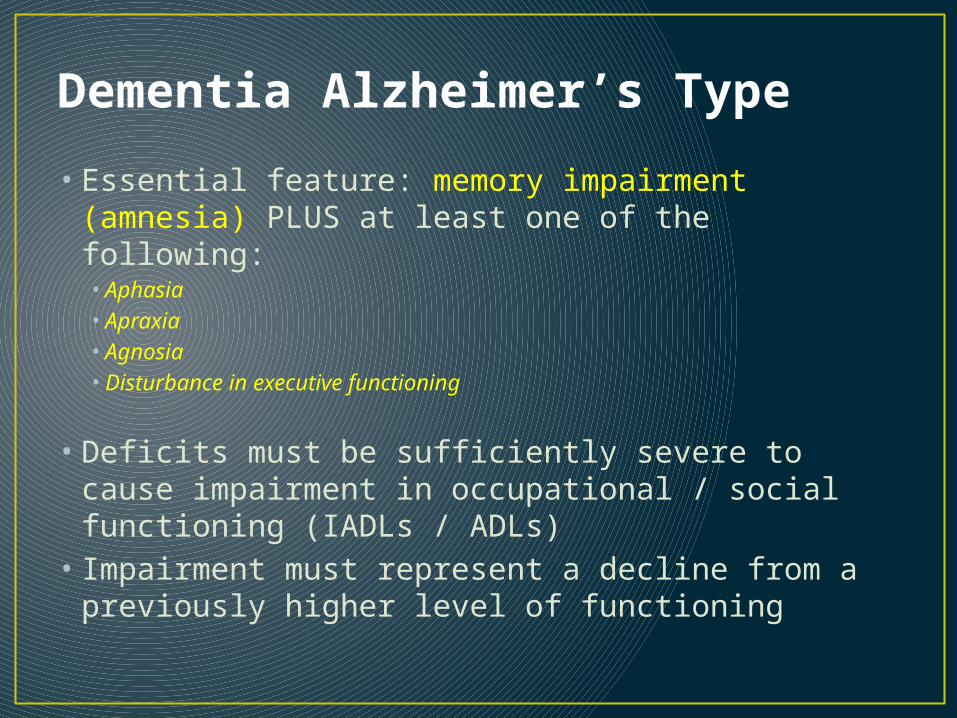
Dementia Alzheimer’s Type
• Essential feature: memory impairment (amnesia) PLUS at least one of the following:• Aphasia• Apraxia • Agnosia • Disturbance in executive functioning
• Deficits must be sufficiently severe to cause impairment in occupational / social functioning (IADLs / ADLs)
• Impairment must represent a decline from a previously higher level of functioning
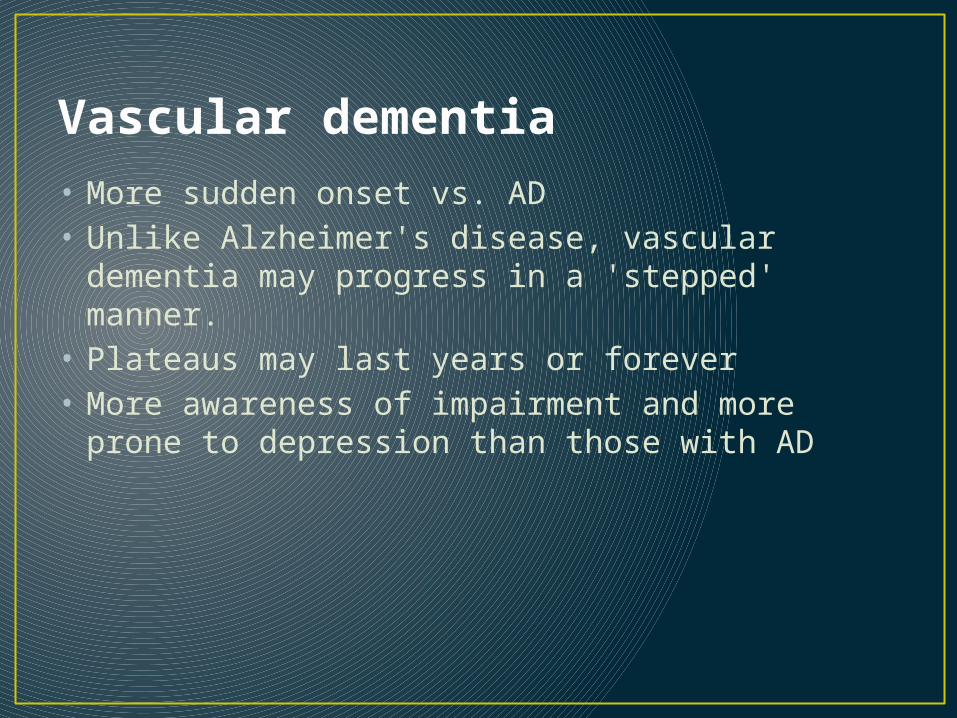
Vascular dementia• More sudden onset vs. AD• Unlike Alzheimer's disease, vascular dementia
may progress in a 'stepped' manner. • Plateaus may last years or forever• More awareness of impairment and more prone to
depression than those with AD
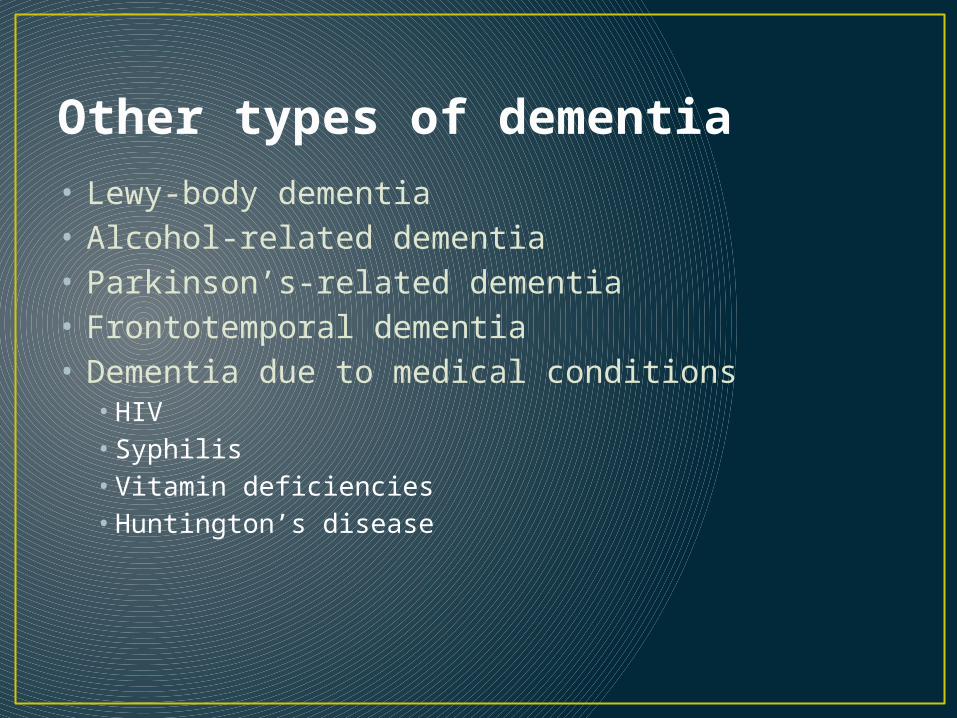
Other types of dementia• Lewy-body dementia• Alcohol-related dementia• Parkinson’s-related dementia• Frontotemporal dementia• Dementia due to medical conditions
• HIV• Syphilis• Vitamin deficiencies• Huntington’s disease

Mild Cognitive Impairment
• Mild impairment in a cognitive domain• Little or no functional difficulties• 2 types of MCI: Amnestic (aMCI) or non-amestic
(nMCI)
Petersen, 2011; Gauthier et al., 2006
Normal Cognition
Mild cognitive
impairmentDementia
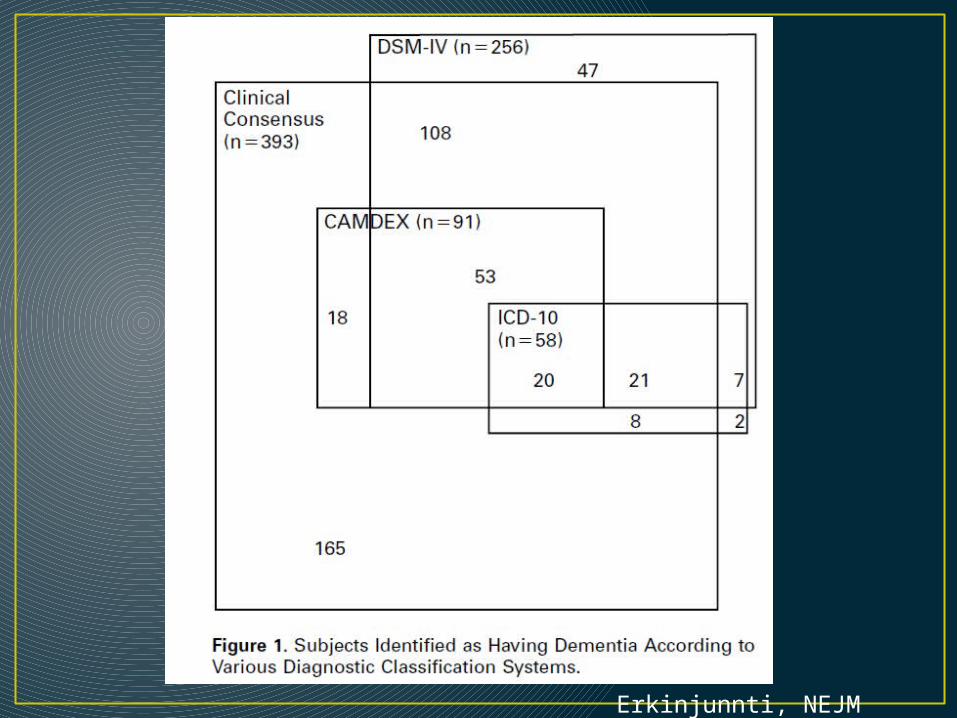
Erkinjunnti, NEJM (1997)
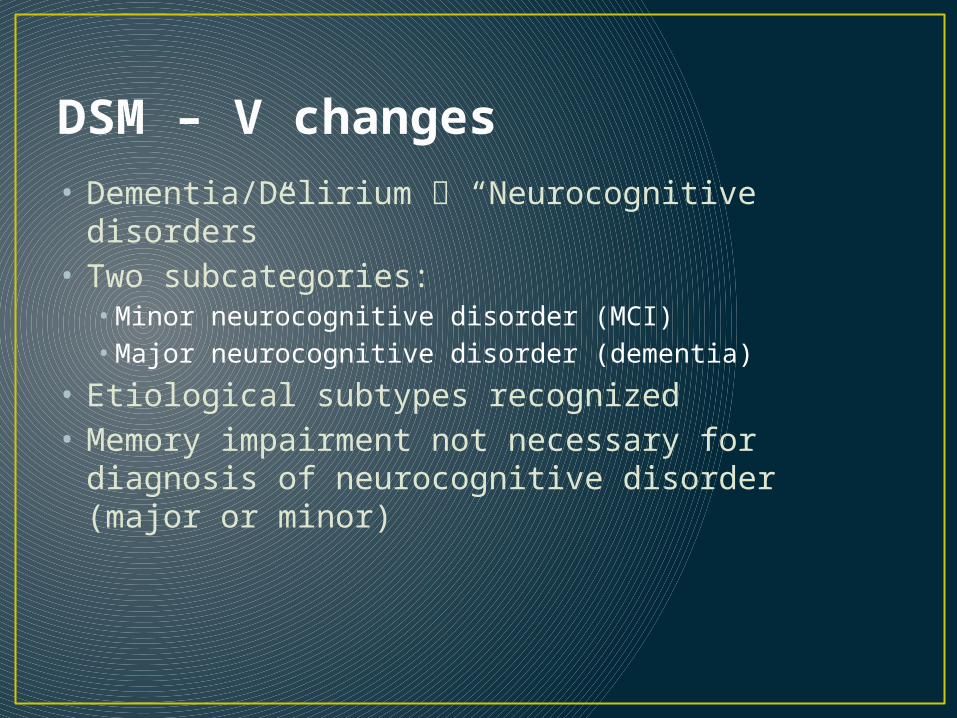
DSM – V changes• Dementia/Delirium “Neurocognitive disorders”• Two subcategories:
• Minor neurocognitive disorder (MCI)• Major neurocognitive disorder (dementia)
• Etiological subtypes recognized• Memory impairment not necessary for diagnosis
of neurocognitive disorder (major or minor)
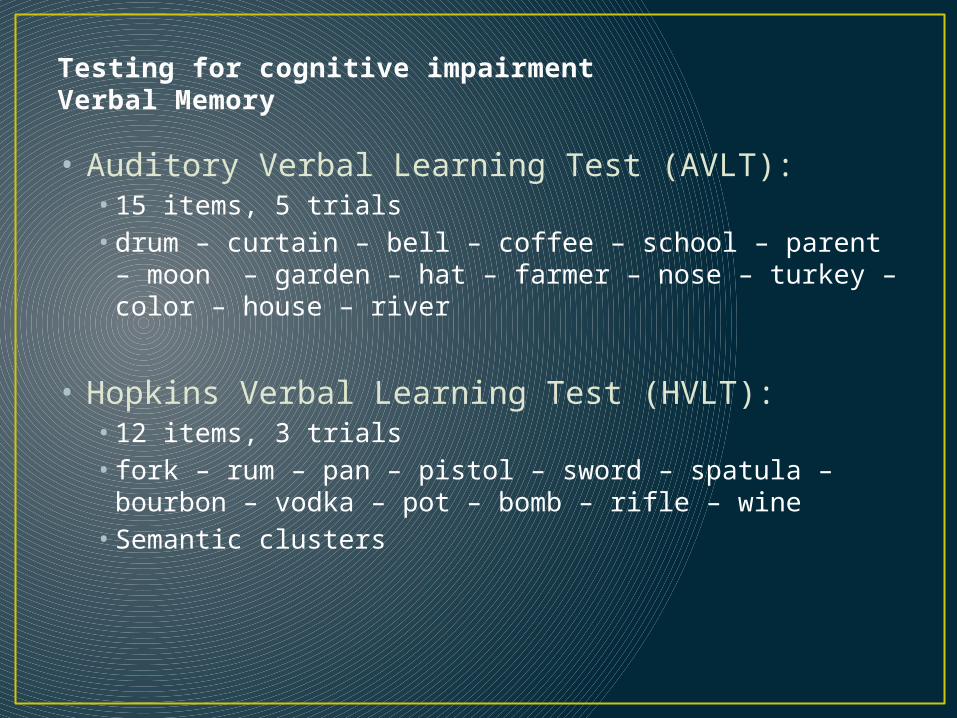
Testing for cognitive impairmentVerbal Memory
• Auditory Verbal Learning Test (AVLT): • 15 items, 5 trials• drum – curtain – bell – coffee – school – parent – moon –
garden – hat – farmer – nose – turkey – color – house – river
• Hopkins Verbal Learning Test (HVLT): • 12 items, 3 trials• fork – rum – pan – pistol – sword – spatula – bourbon –
vodka – pot – bomb – rifle – wine• Semantic clusters
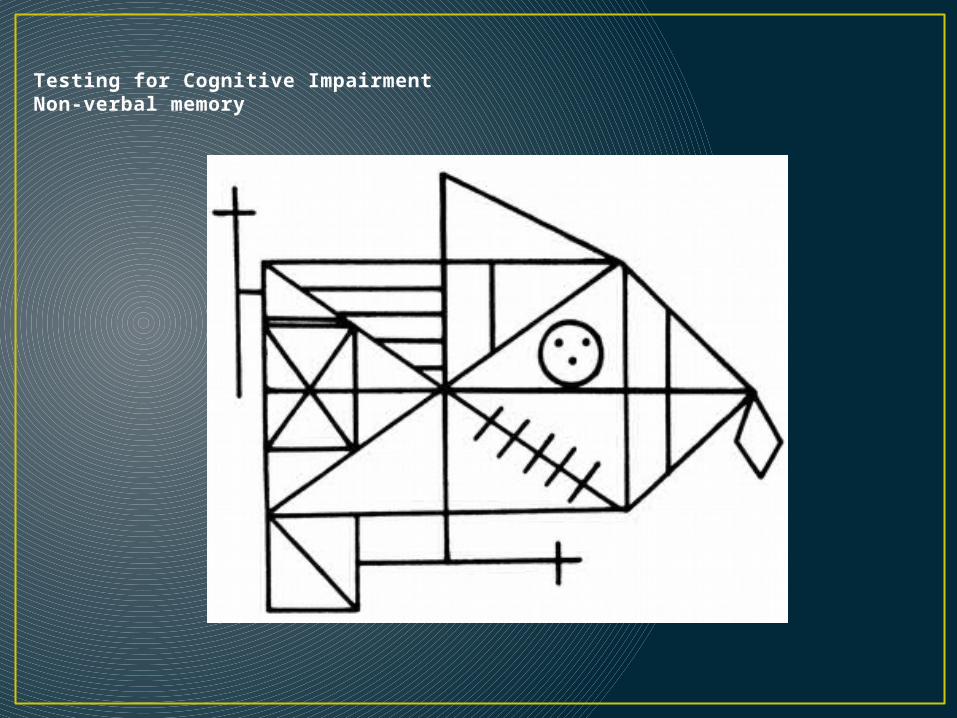
Testing for Cognitive ImpairmentNon-verbal memory

Copy task
Welsh et al., 1993
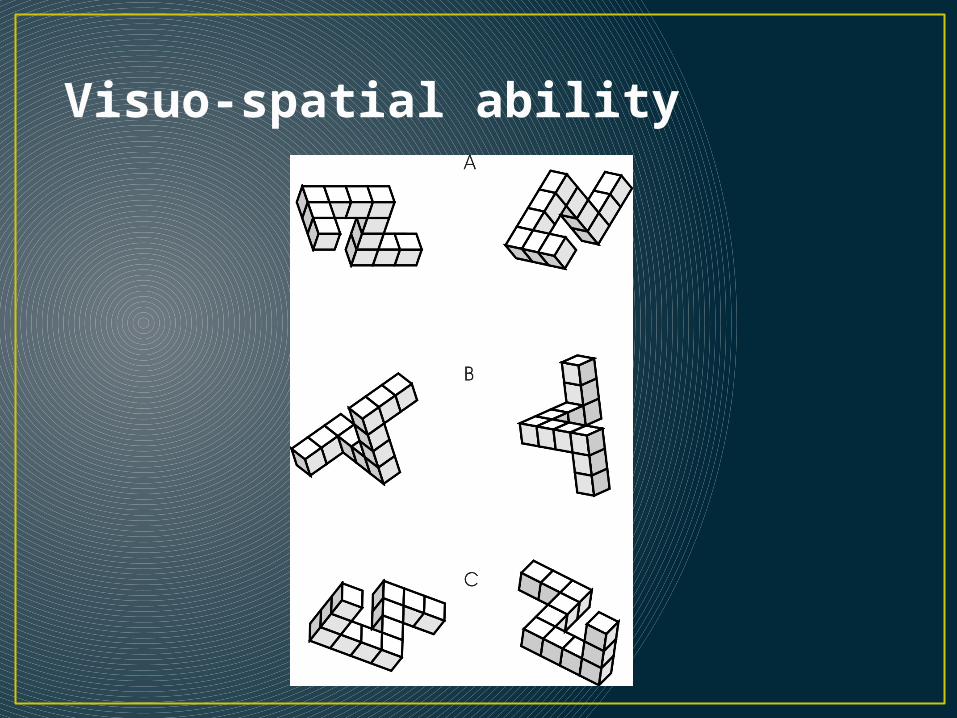
Visuo-spatial ability
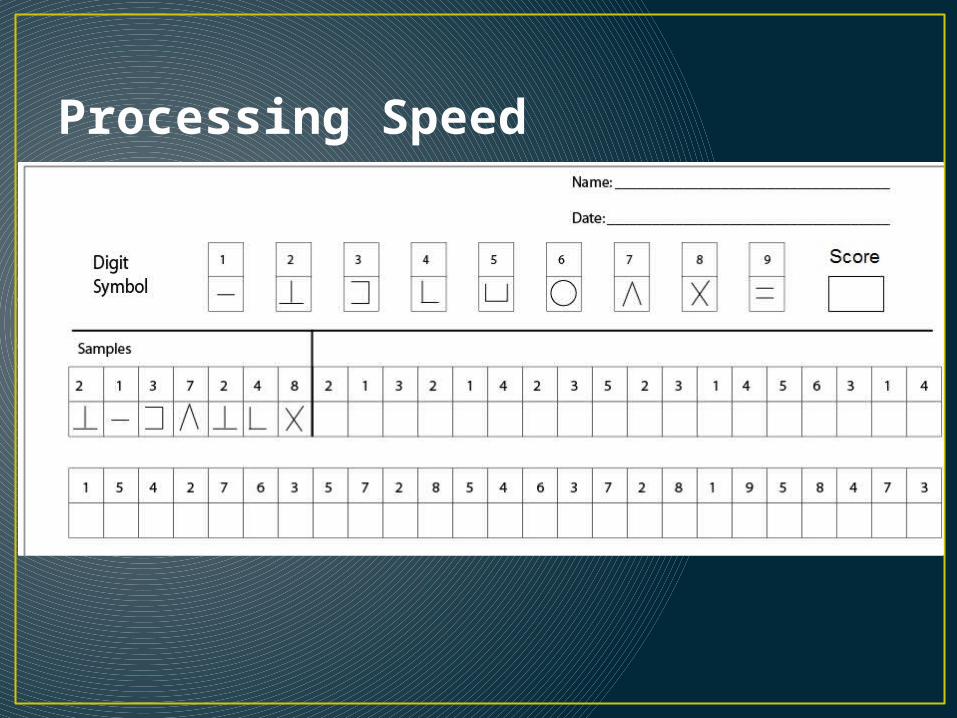
Processing Speed
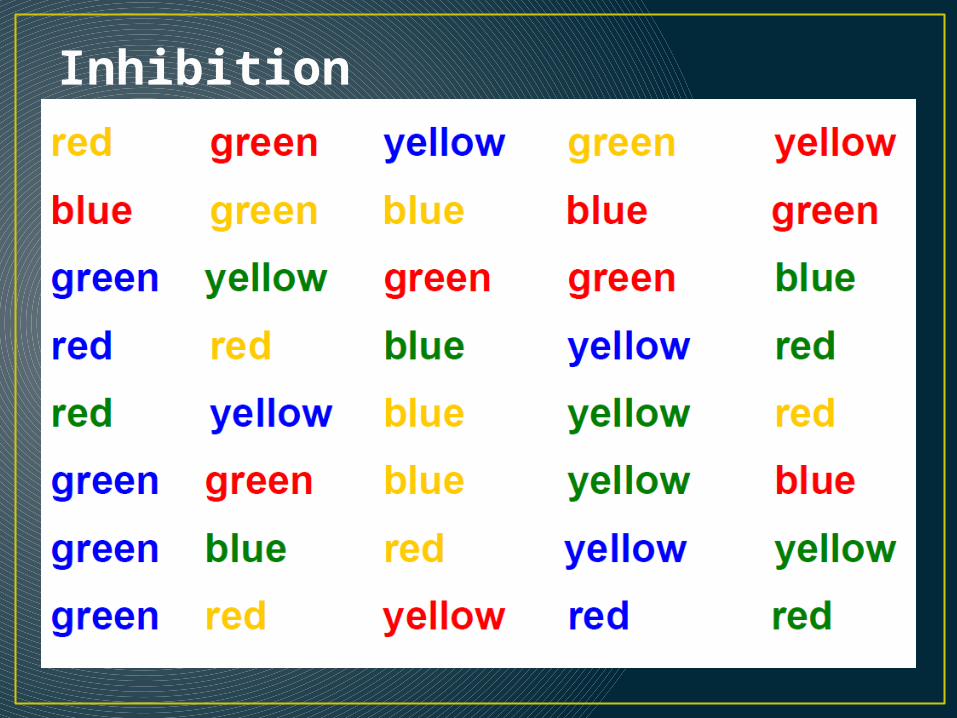
Inhibition
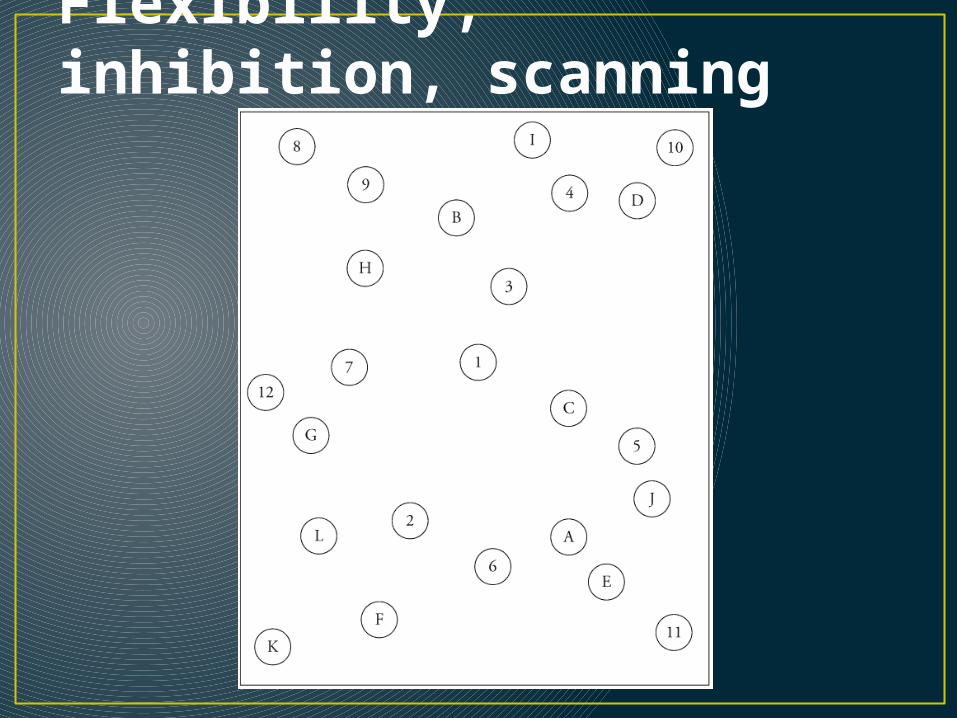
Flexibility, inhibition, scanning
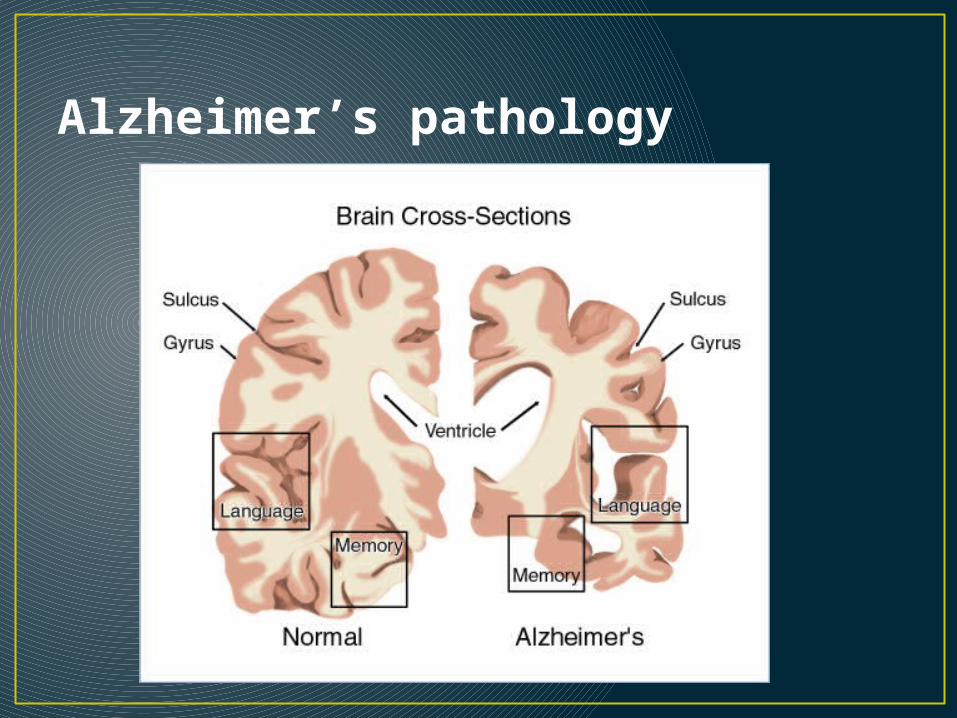
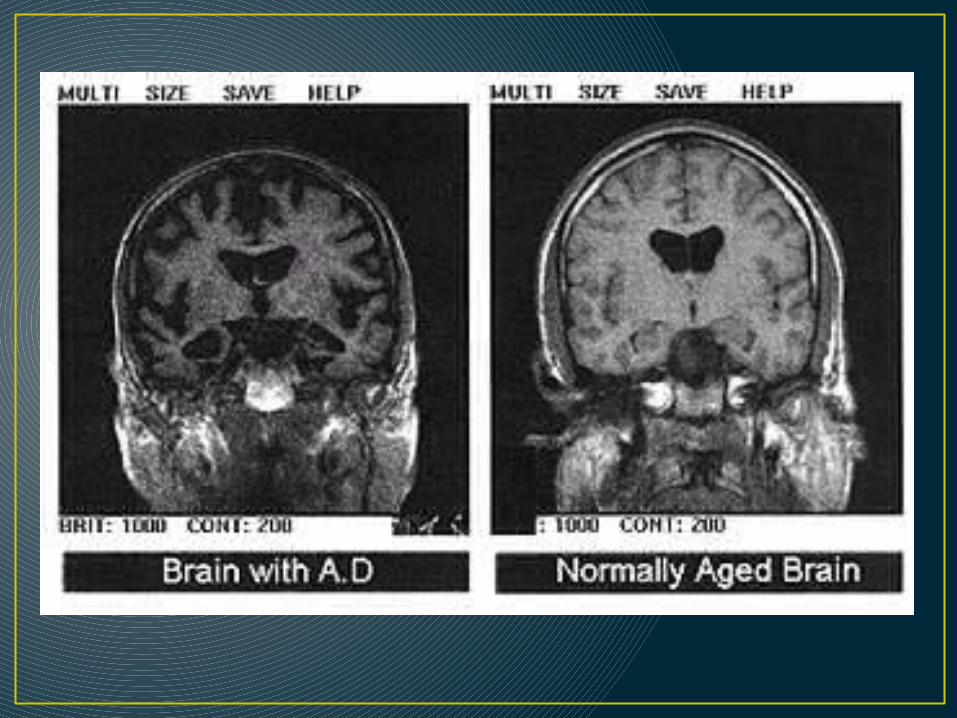
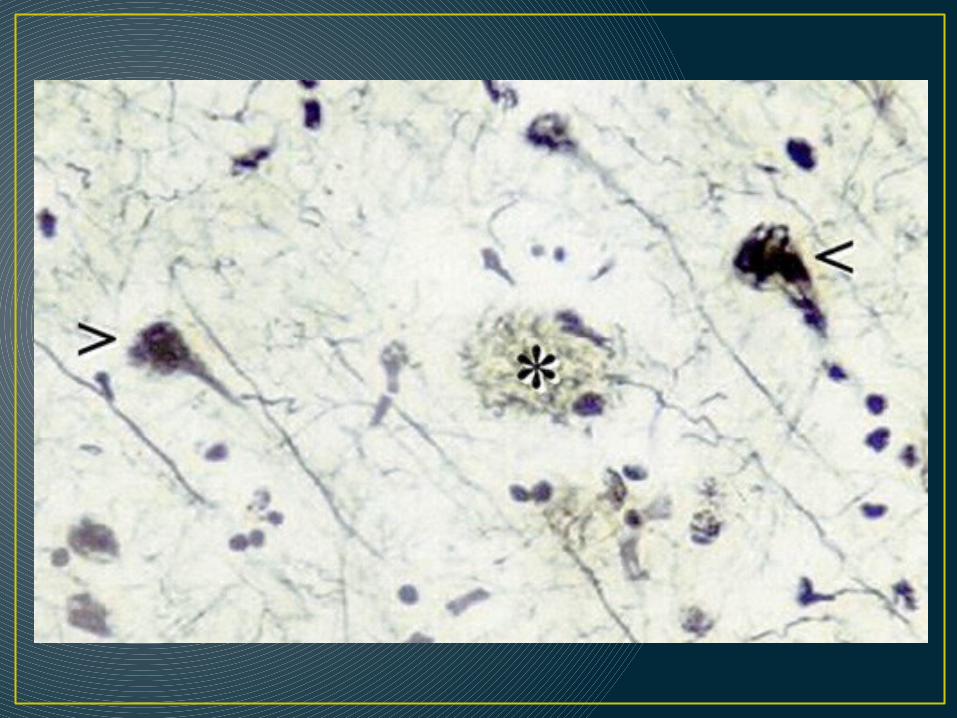
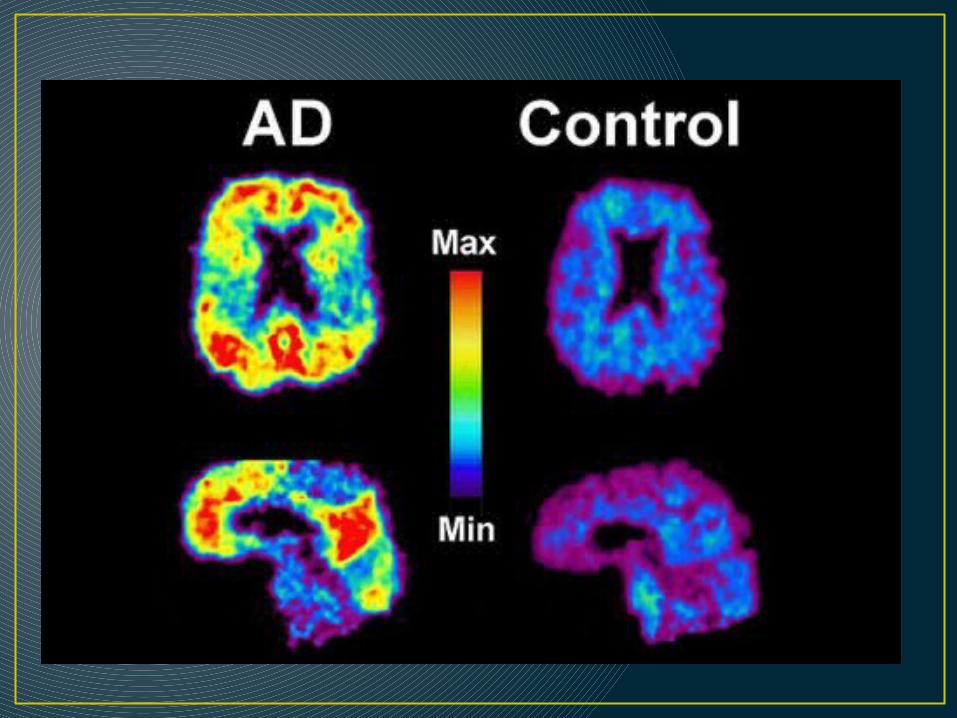
Alzheimer’s pathology
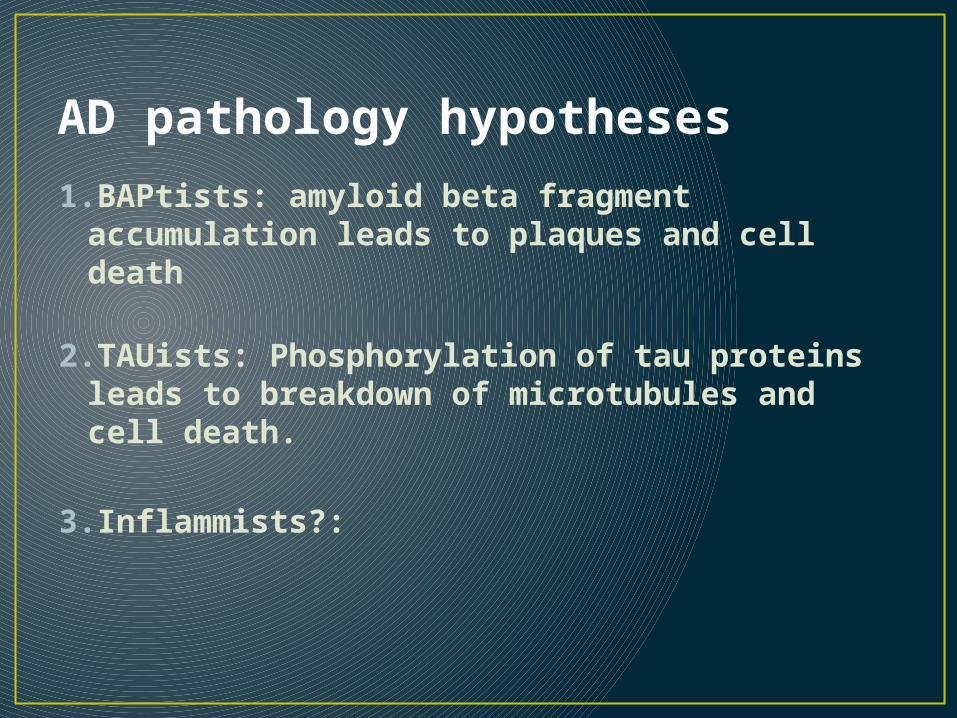
AD pathology hypotheses
1.BAPtists: amyloid beta fragment accumulation leads to plaques and cell death
2.TAUists: Phosphorylation of tau proteins leads to breakdown of microtubules and cell death.
3.Inflammists?:
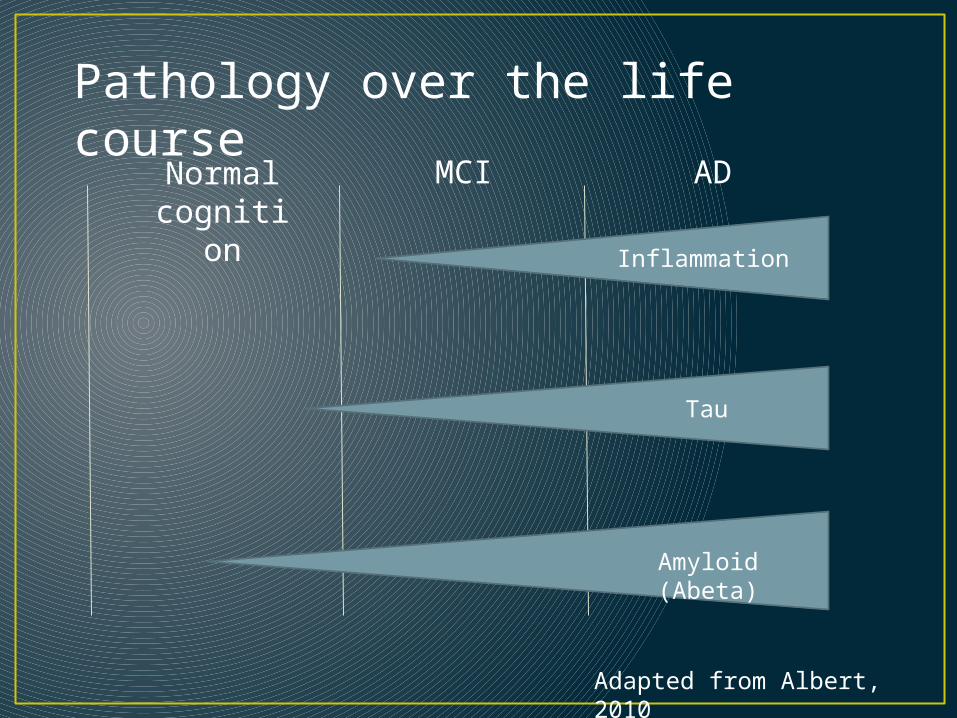
Normal cognition
MCI AD
Inflammation
Tau
Amyloid (Abeta)
Pathology over the life course
Adapted from Albert, 2010

Start of noticeable functional changes.
“Forgetful”
Average life span after onset of AD is ~ 7 years
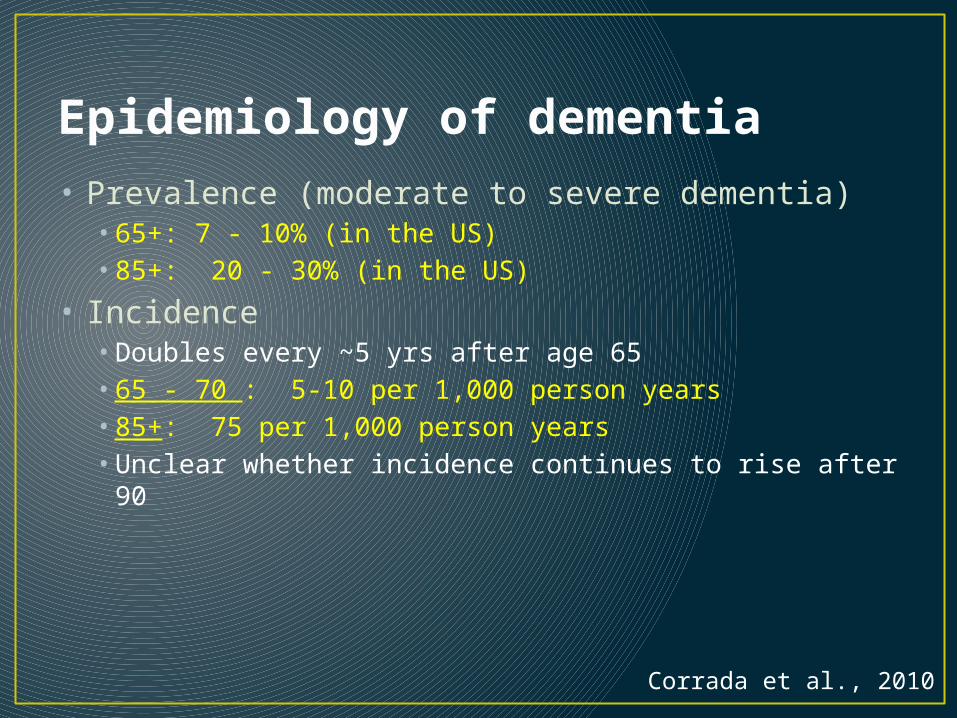
Epidemiology of dementia• Prevalence (moderate to severe dementia)
• 65+: 7 - 10% (in the US)• 85+: 20 - 30% (in the US)
• Incidence• Doubles every ~5 yrs after age 65• 65 - 70 : 5-10 per 1,000 person years • 85+: 75 per 1,000 person years• Unclear whether incidence continues to rise after 90
Corrada et al., 2010
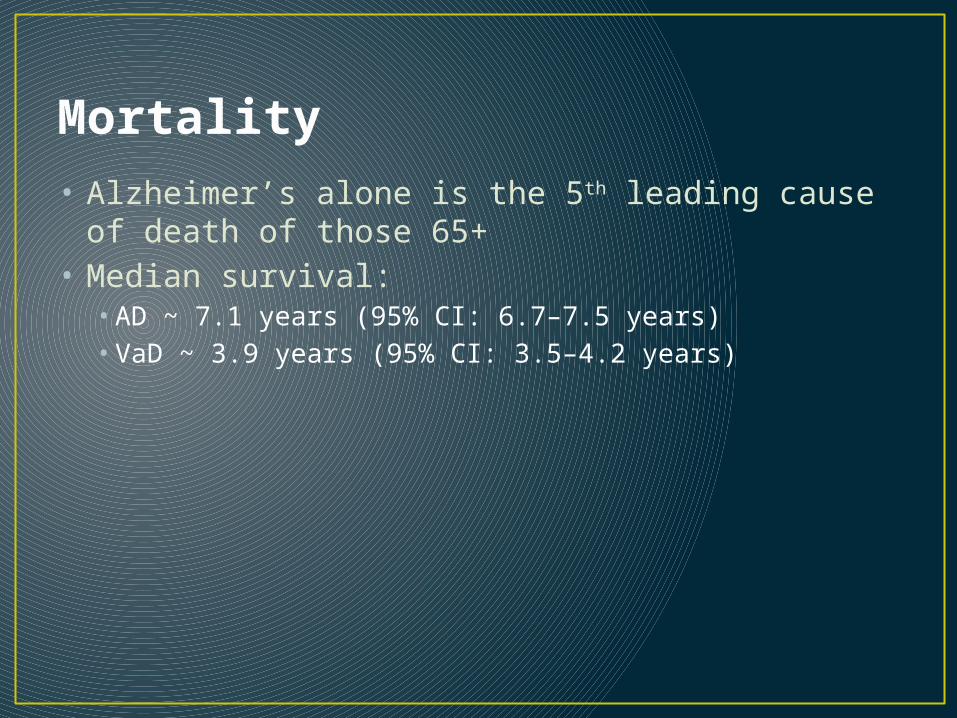
Mortality• Alzheimer’s alone is the 5th leading cause of death
of those 65+• Median survival:
• AD ~ 7.1 years (95% CI: 6.7–7.5 years) • VaD ~ 3.9 years (95% CI: 3.5–4.2 years)
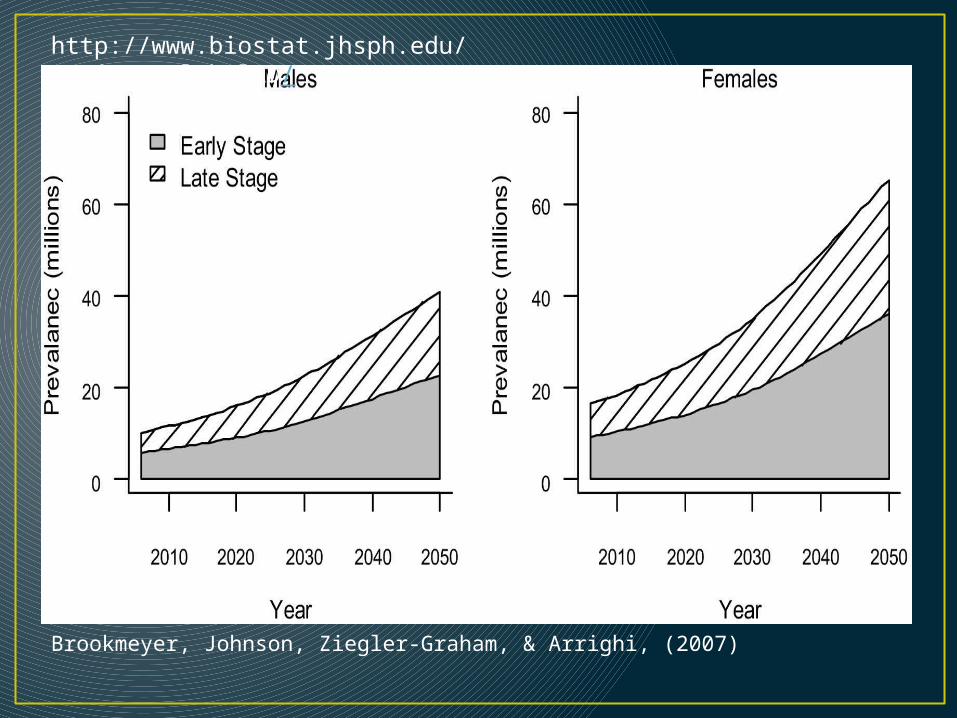
Brookmeyer, Johnson, Ziegler-Graham, & Arrighi, (2007)
http://www.biostat.jhsph.edu/project/globalAD/
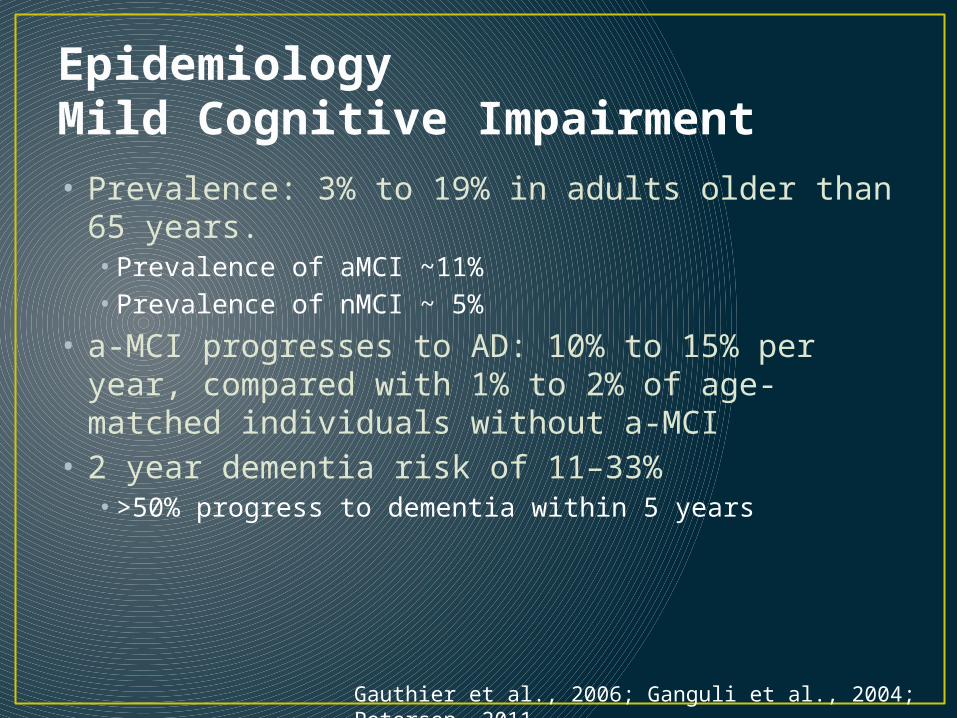
EpidemiologyMild Cognitive Impairment• Prevalence: 3% to 19% in adults older than 65
years.• Prevalence of aMCI ~11%• Prevalence of nMCI ~ 5%
• a-MCI progresses to AD: 10% to 15% per year, compared with 1% to 2% of age-matched individuals without a-MCI
• 2 year dementia risk of 11–33% • >50% progress to dementia within 5 years
Gauthier et al., 2006; Ganguli et al., 2004; Petersen, 2011
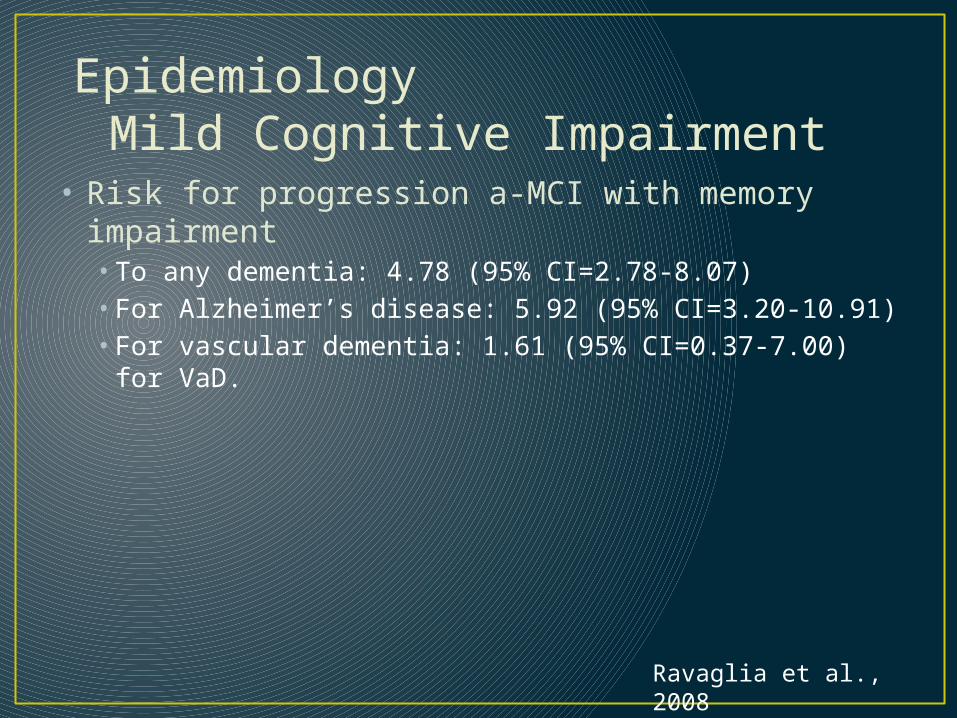
• Risk for progression a-MCI with memory impairment• To any dementia: 4.78 (95% CI=2.78-8.07) • For Alzheimer’s disease: 5.92 (95% CI=3.20-10.91) • For vascular dementia: 1.61 (95% CI=0.37-7.00) for VaD.
Ravaglia et al., 2008
EpidemiologyMild Cognitive Impairment
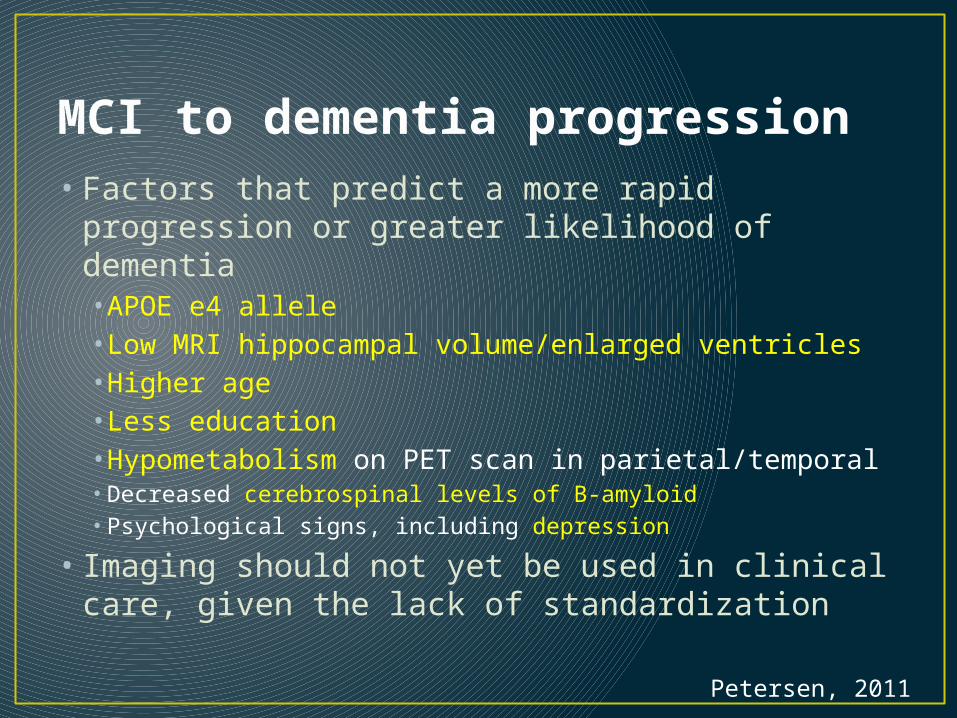
• Factors that predict a more rapid progression or greater likelihood of dementia• APOE e4 allele• Low MRI hippocampal volume/enlarged ventricles• Higher age• Less education• Hypometabolism on PET scan in parietal/temporal• Decreased cerebrospinal levels of B-amyloid• Psychological signs, including depression
• Imaging should not yet be used in clinical care, given the lack of standardization
Petersen, 2011
MCI to dementia progression

Zanetti et al., 2006
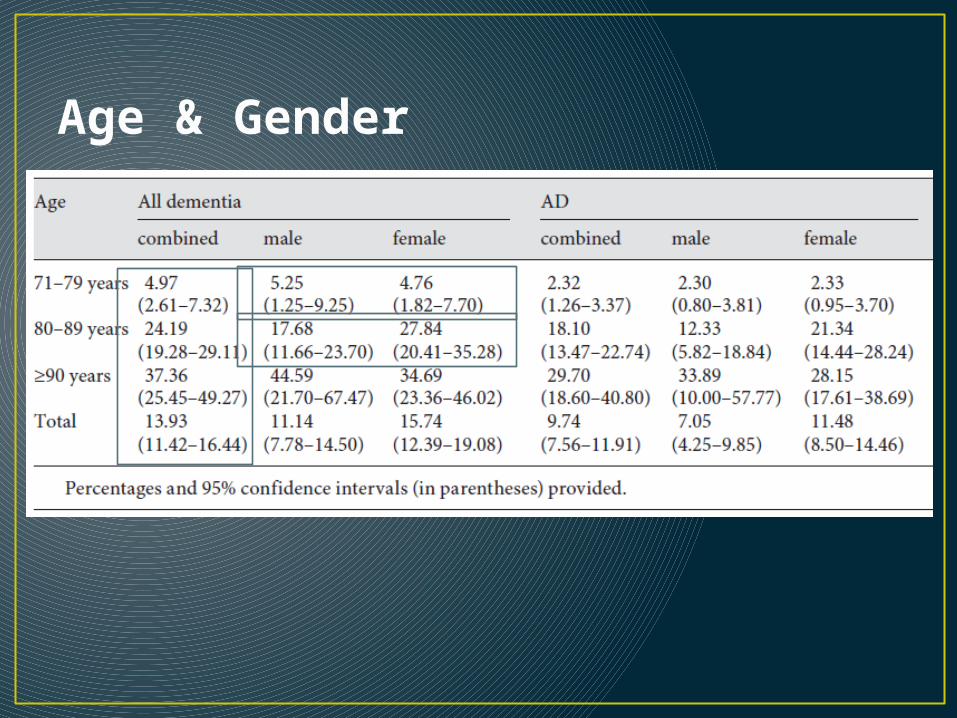
Age & Gender
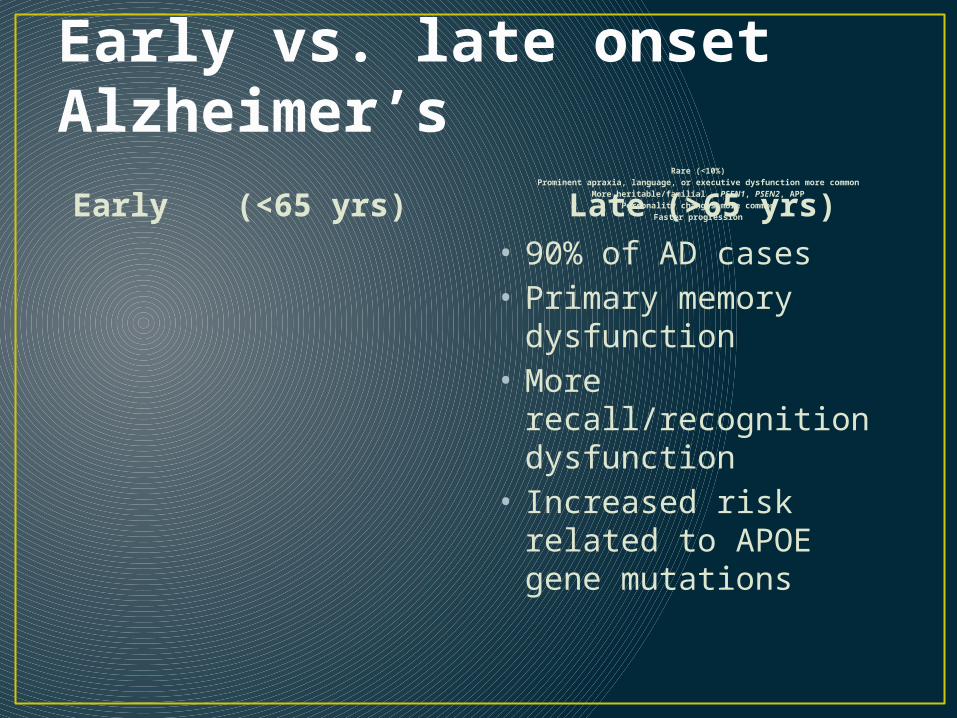
Early vs. late onset Alzheimer’s
Early (<65 yrs) Late (>65 yrs)Rare (<10%)
Prominent apraxia, language, or executive dysfunction more commonMore heritable/familial - PSEN1, PSEN2, APP
Personality changes more commonFaster progression
• 90% of AD cases• Primary memory
dysfunction• More recall/recognition
dysfunction• Increased risk related
to APOE gene mutations
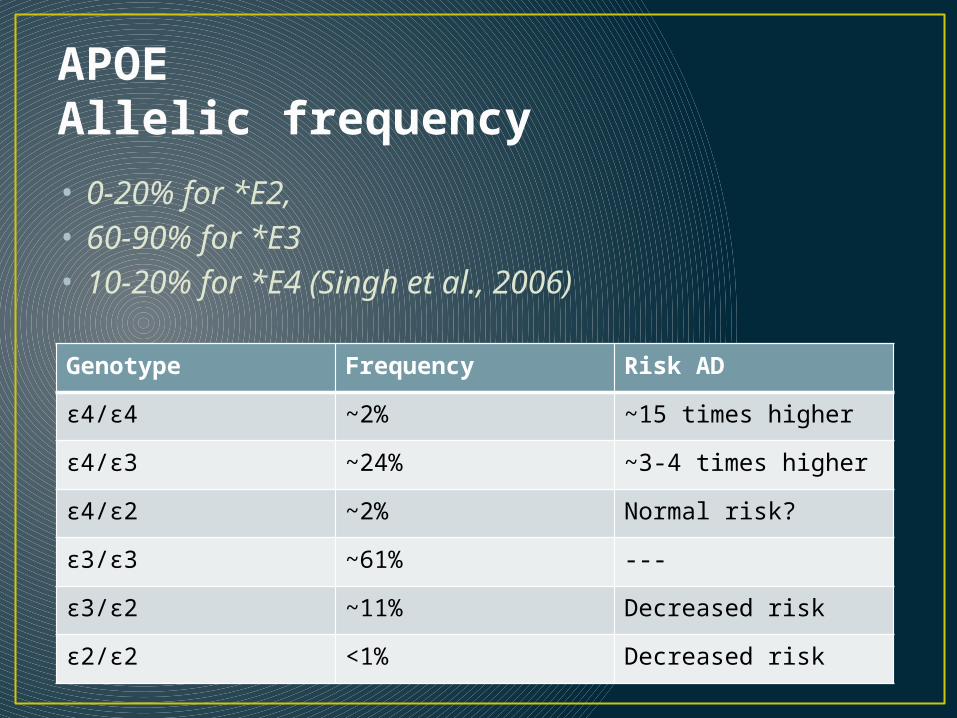
APOE Allelic frequency• 0-20% for *E2, • 60-90% for *E3• 10-20% for *E4 (Singh et al., 2006)
Genotype Frequency Risk AD
ε4/ε4 ~2% ~15 times higher
ε4/ε3 ~24% ~3-4 times higher
ε4/ε2 ~2% Normal risk?
ε3/ε3 ~61% ---
ε3/ε2 ~11% Decreased risk
ε2/ε2 <1% Decreased risk
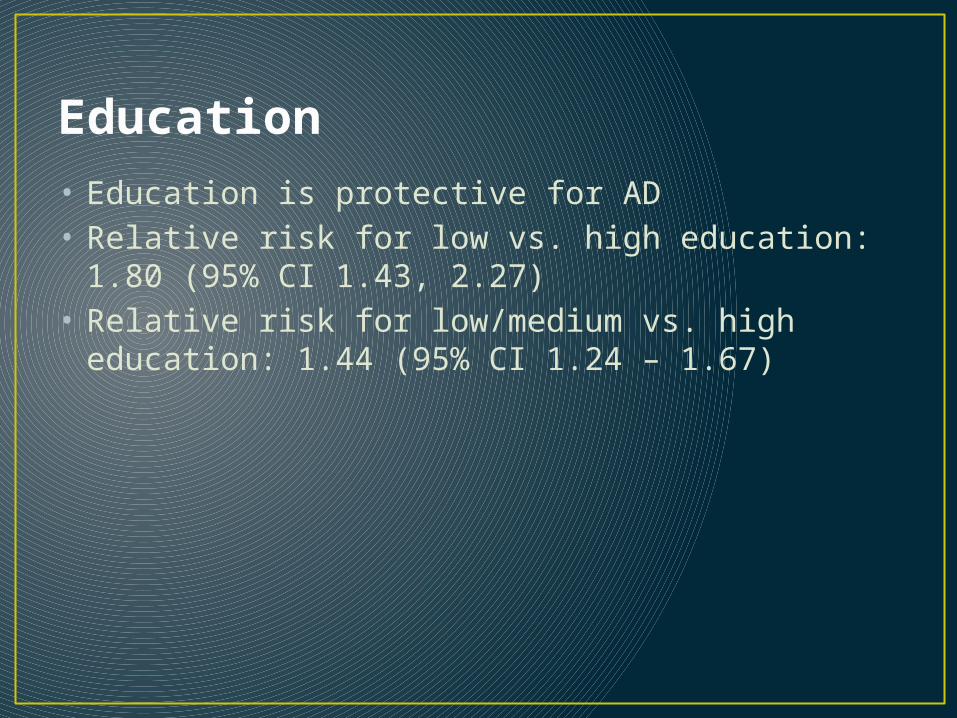
Education• Education is protective for AD• Relative risk for low vs. high education: 1.80 (95%
CI 1.43, 2.27)• Relative risk for low/medium vs. high education:
1.44 (95% CI 1.24 – 1.67)
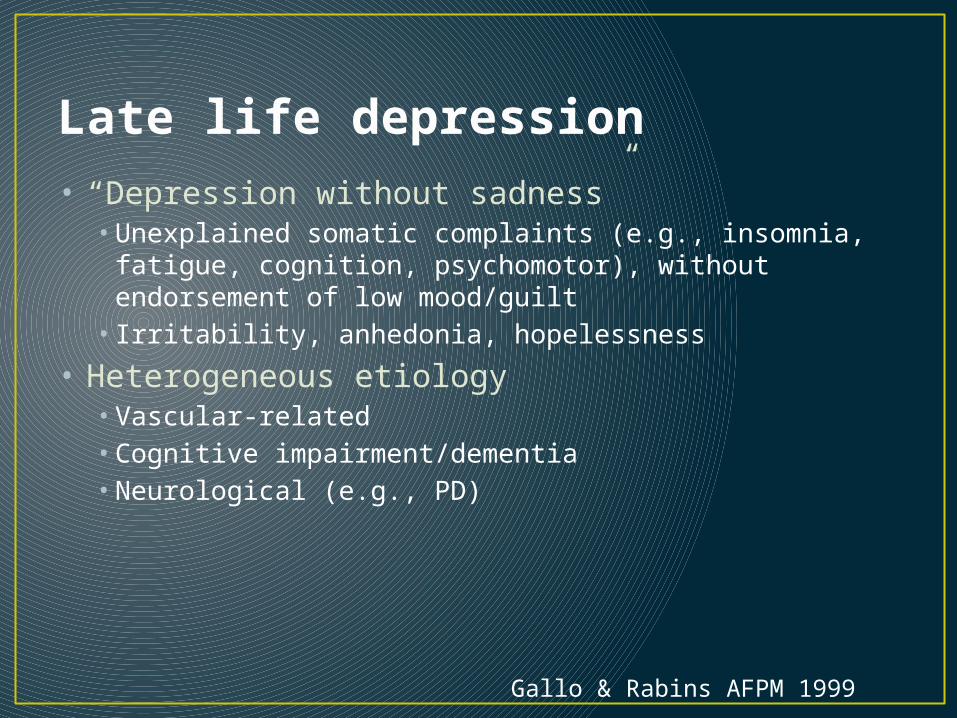
Late life depression• “Depression without sadness”
• Unexplained somatic complaints (e.g., insomnia, fatigue, cognition, psychomotor), without endorsement of low mood/guilt
• Irritability, anhedonia, hopelessness
• Heterogeneous etiology• Vascular-related• Cognitive impairment/dementia• Neurological (e.g., PD)
Gallo & Rabins AFPM 1999
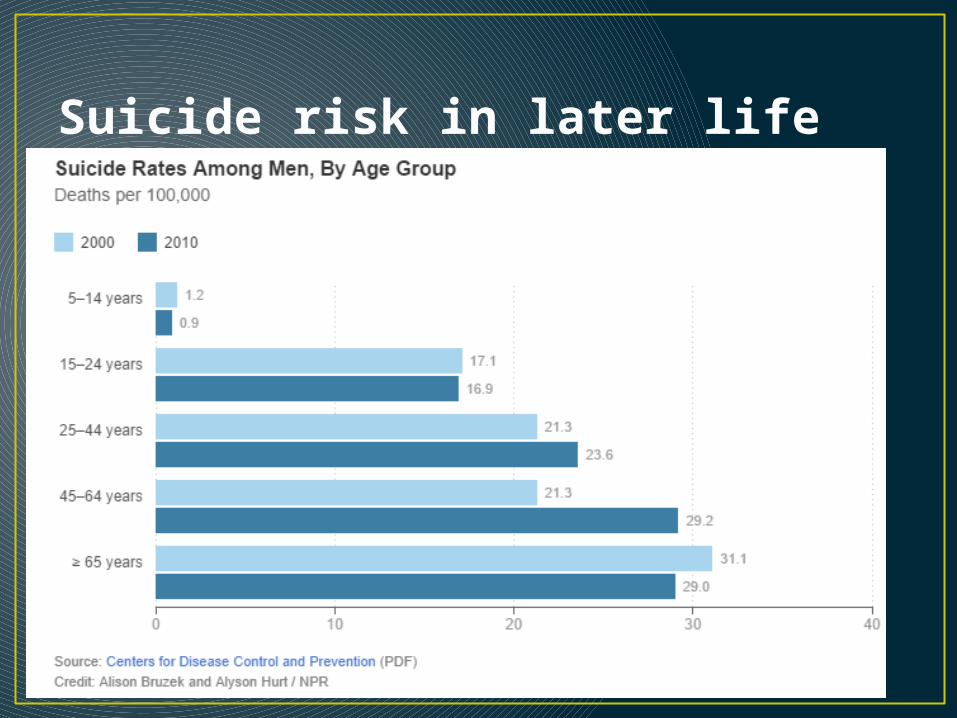
Suicide risk in later life
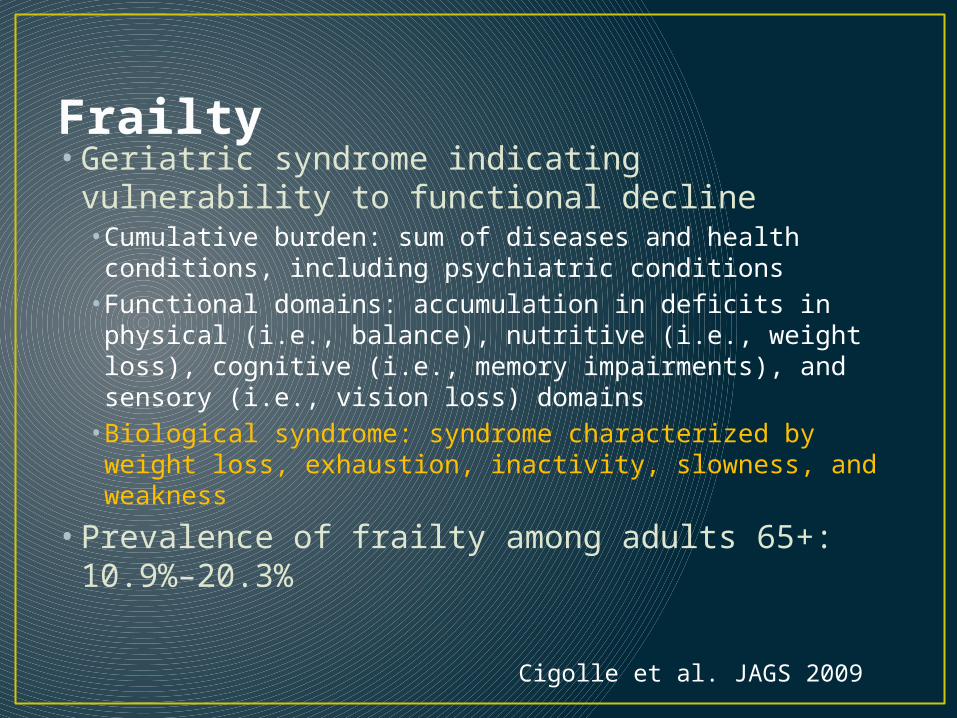
Frailty• Geriatric syndrome indicating vulnerability to
functional decline• Cumulative burden: sum of diseases and health conditions, including psychiatric conditions
• Functional domains: accumulation in deficits in physical (i.e., balance), nutritive (i.e., weight loss), cognitive (i.e., memory impairments), and sensory (i.e., vision loss) domains
• Biological syndrome: syndrome characterized by weight loss, exhaustion, inactivity, slowness, and weakness
• Prevalence of frailty among adults 65+: 10.9%–20.3%
Cigolle et al. JAGS 2009
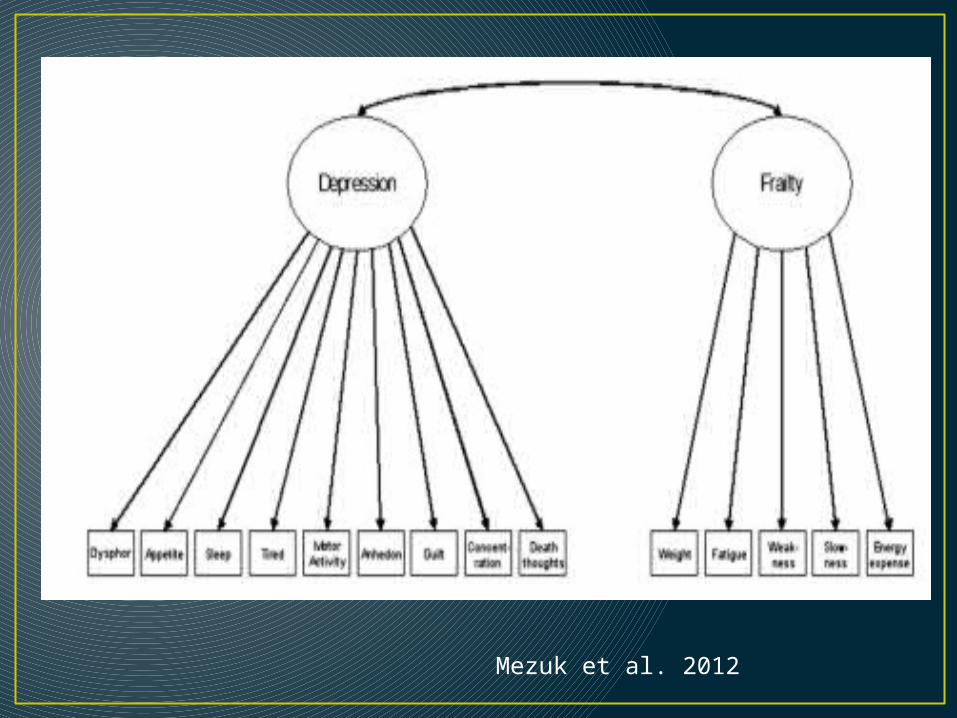
Mezuk et al. 2012
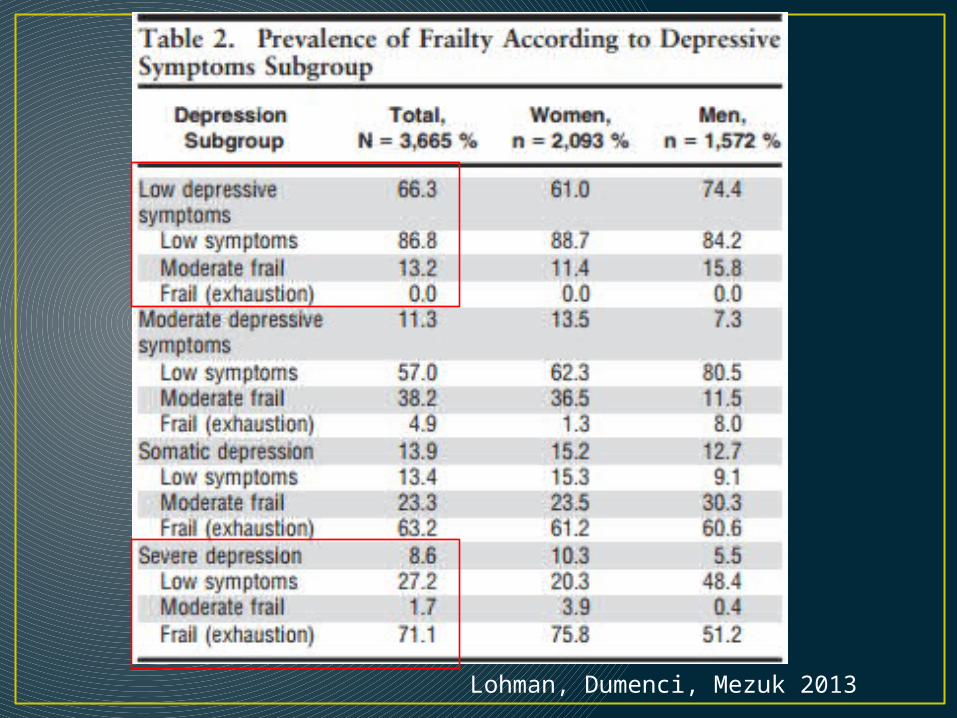
Lohman, Dumenci, Mezuk 2013

Vascular dementia
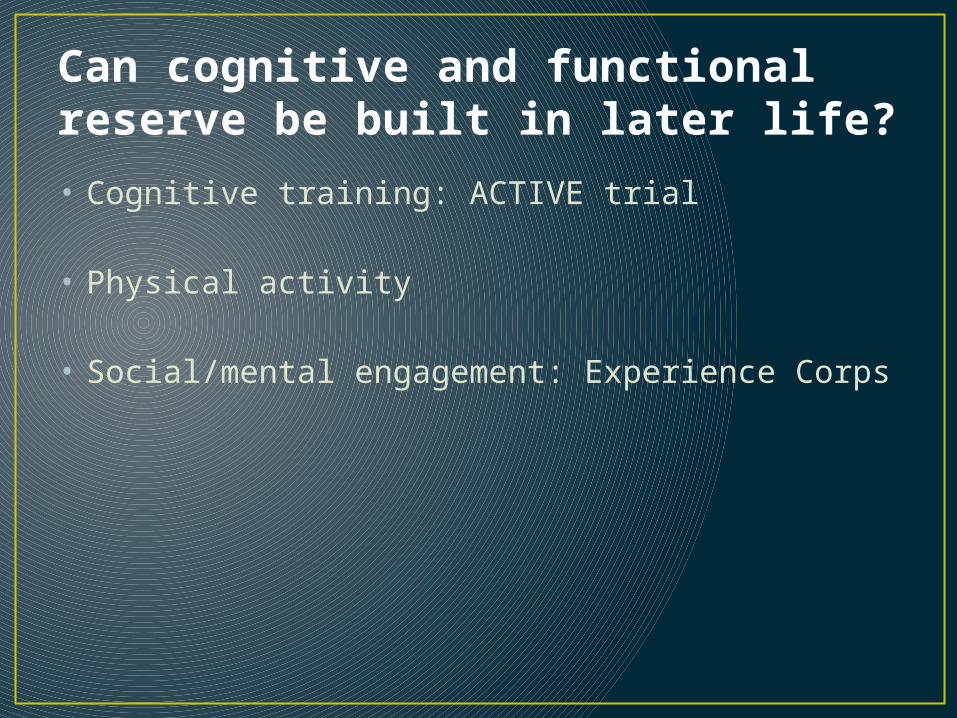
Can cognitive and functional reserve be built in later life?
• Cognitive training: ACTIVE trial
• Physical activity
• Social/mental engagement: Experience Corps
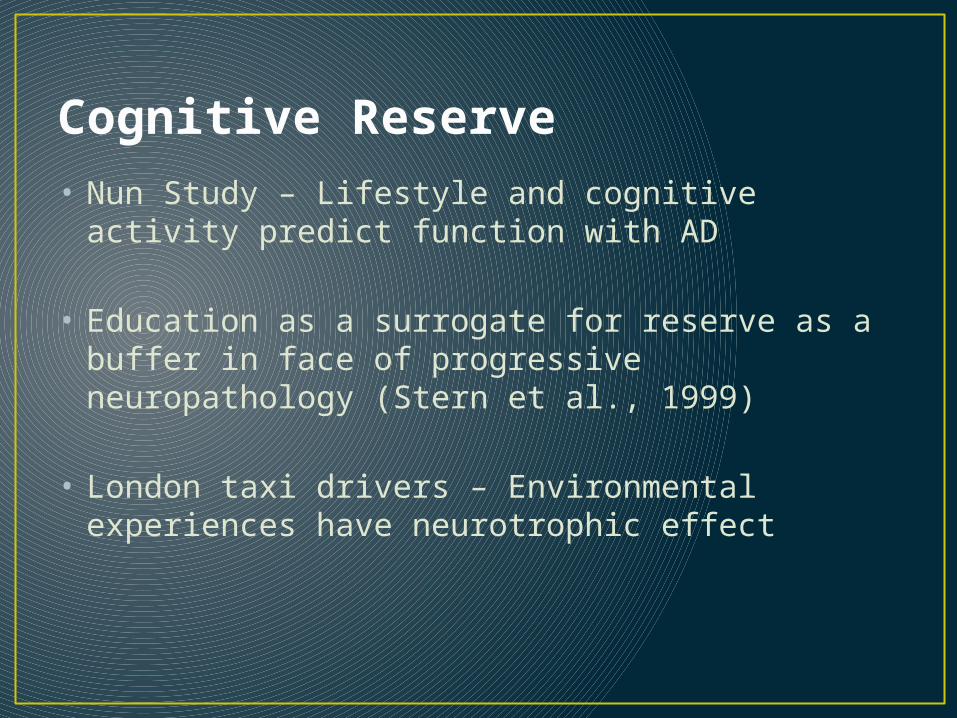
Cognitive Reserve• Nun Study – Lifestyle and cognitive activity predict
function with AD
• Education as a surrogate for reserve as a buffer in face of progressive neuropathology (Stern et al., 1999)
• London taxi drivers – Environmental experiences have neurotrophic effect
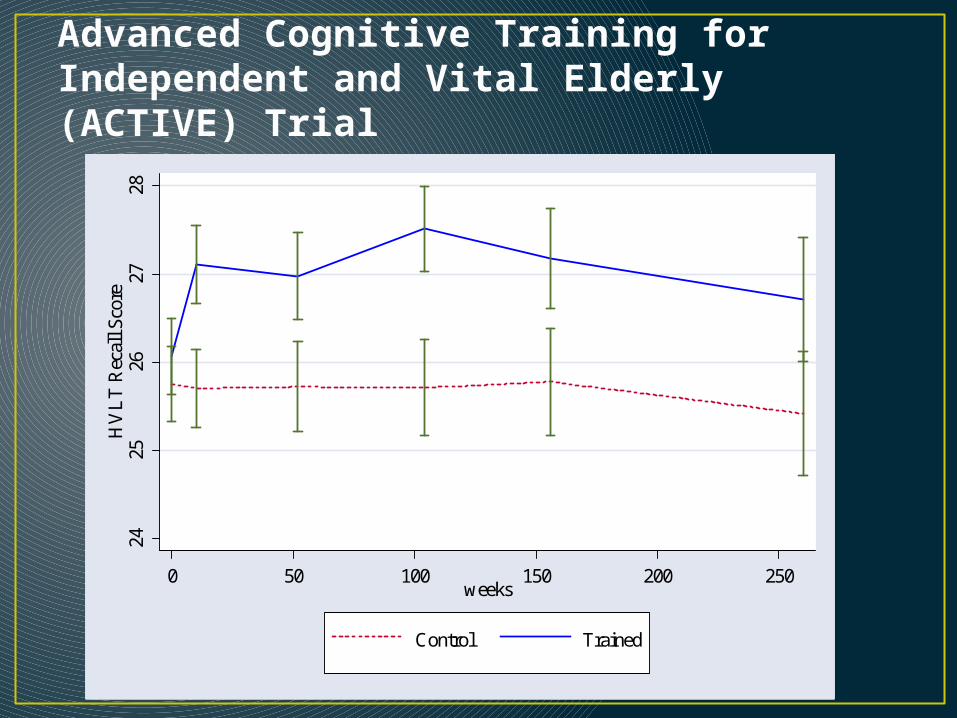
Advanced Cognitive Training for Independent and Vital Elderly (ACTIVE) Trial
2425
2627
28H
VL
T R
ecal
l Sco
re
0 50 100 150 200 250weeks
Control Trained

Summary• Understanding the epidemiology and pathology of
psychiatric disorders gets more, not less, complicated in later life• Medical comorbidity
• Burden of dementia, frailty and suicide risk (primarily among white men) increases substantially >65
• Life course framework still applies!


