80
Canada’s Emissions Trends Environment Canada October 2013

8/11/2019 1001-Canada's Emissions Trends 2013_e
http://slidepdf.com/reader/full/1001-canadas-emissions-trends-2013e 1/80
8/11/2019 1001-Canada's Emissions Trends 2013_e
http://slidepdf.com/reader/full/1001-canadas-emissions-trends-2013e 2/80
Cat. No.: En81-18/2013E-PDFISSN 2291-9392
Information contained in this publication or product may be reproduced, in part or in whole,and by any means, for personal or public non-commercial purposes, without charge or furtherpermission, unless otherwise specified.
You are asked to:
Exercise due diligence in ensuring the accuracy of the materials reproduced;Indicate both the complete title of the materials reproduced as well as the authororganization; andIndicate that the reproduction is a copy of an official work that is published by theGovernment of Canada and that the reproduction has not been produced in affiliationwith or with the endorsement of the Government of Canada.
Commercial reproduction and distribution is prohibited except with written permission fromthe Government of Canada's copyright administrator, Public Works and Government ServicesCanada (PWGSC). For more information, please contact PWGSC at 613-996-6886 [email protected].
© Her Majesty the Queen in Right of Canada, represented by the Minister of the Environment, 2013
Aussi disponible en français
8/11/2019 1001-Canada's Emissions Trends 2013_e
http://slidepdf.com/reader/full/1001-canadas-emissions-trends-2013e 3/80
1
Canada’s Emissions Trends
Executive Summary
Overview
Canada is home to a rich and diverse natural environment. From water and air quality,to the conservation of our species at risk and protecting the health of Canadians fromenvironmental hazards, preserving our environment is essential to our social andeconomic well-being.
Climate change is considered one of the most important environmental issues of ourtime since it will affect all of these aspects of our natural environment. Althoughclimate change can be caused by both natural processes and human activities,scientific studies have shown that recent warming can be largely attributed to humanactivity, primarily the release of carbon dioxide and other greenhouse gases to theatmosphere. The potential impacts of climate change and greenhouse gas emissionsare far-reaching, affecting all Canadians, our economy, infrastructure, and health, thelandscapes around us, and the wildlife that inhabit them. As an Arctic nation theeffects of climate change in the North will be important to Canadians. Reducinggreenhouse gas emissions is everyone’s responsibility and governments, businesses andconsumers all have a role to play.
Most greenhouse gases have both natural and human-caused sources. However,according to the Intergovernmental Panel on Climate Change (IPCC), human-causedemissions are tipping the balance towards climate change as they disrupt the naturalprocesses occurring in the atmosphere. Hence policy measures are focused on human-caused emissions. Likewise, all emissions in this report refer to anthropogenic (human-caused) emissions. Canada is a signatory to the United Nations Framework Conventionon Climate Change (UNFCCC). Canada signed onto the Copenhagen Accord inDecember 2009 and committed to reduce its greenhouse gas (GHG) emissions to 17%below 2005 levels by 2020. This represents a significant challenge in light of strongeconomic growth: Canada’s economy is projected to be approximately 3 1 % larger (inreal terms) in 2020 compared to 2005 levels.
The government’s approach is to encourage strong economic growth and job creationwhile achieving our environmental objectives. There are encouraging signs on thisfront: according to the latest National Inventory Report (NIR), between 2005 and2011, Canadian GHG emissions decreased by 4.8%, while the economy grew by 8. 4 %over the same period. There has been an average annual decline in Canadianemissions intensity (emissions per unit of GDP) since 1990, a trend that is projected tocontinue through 2020. Further actions by Canadian businesses, individuals, and
governments will allow us to address GHG emissions while keeping the Canadianeconomy strong. Canada’s share of total global emissions, like that of other developedcountries, will continue to decline in the face of rapid emissions growth fromdeveloping countries, particularly China and India. According to international data,Canada’s carbon dioxide (CO 2) emissions from fuel combustion in 2010 accounted for1.8% of global emissions down from 2.1% in 2005; this share is expected to decline to1.6% in 2020.

8/11/2019 1001-Canada's Emissions Trends 2013_e
http://slidepdf.com/reader/full/1001-canadas-emissions-trends-2013e 4/80
2
Canada’s Emissions Trends
Effective climate change mitigation requires that all countries act to reduceemissions, and, accordingly, Canada will continue to make progress towards itsCopenhagen target. The Government of Canada is implementing a sector-by-sectorapproach to regulate GHG emissions, with regulations already in place in two of thelargest sources of emissions – transportation and electricity. By undertaking thisregulatory agenda, Canada has strengthened its position as a world leader in cleanelectricity generation by becoming the first major coal user to ban construction oftraditional coal-fired electricity units. In addition, regulations in the transportationsector will ensure that 2025 passenger vehicles and light trucks will emit about 50%less GHGs than 2008 models once final regulations are issued. Furthermore, GHGemissions from 2018 model-year heavy duty vehicles will be reduced by up to 23percent. Provincial and territorial governments, many of whom have set specifictargets for emissions reductions, are also taking action. Likewise, businesses andindividual Canadians are also taking important steps to reduce emissions.
In support of global emissions reductions, the Government of Canada, together withgovernments in other industrialized countries, is fulfilling its commitments under theCopenhagen Accord to help developing countries take meaningful action of their ownto address climate change. Canada has fully delivered on its commitment to provideits fair share of fast-start financing: our investment of $1.2 billion in new andadditional climate change financing over the last three fiscal years (2010-11, 2011-12and 2012- 2013) is Canada’s largest -ever package of support for mitigation andadaptation. We also remain committed to the goal of jointly mobilizing $100 billionper year by 2020 from public and private sources to address the needs of developingcountries, in the context of meaningful mitigation actions and transparency onimplementation.
This year’s Canada’ s Emissions Trends report further demonstrates Canada’scommitment to transparency with respect to reporting on GHG emissions projections.The report goes beyond the Government of Canada’s international reportingrequirements by providing greenhouse gas emissions projections on an annual basis.This year’s report will be the foundation for Canada’s 6 th National Communication tothe UNFCCC later in 2013, which will be subject to international assessment andreview.
The projections in this year’s Canada’s Emissions Trends report point to significantprogress that has already been achieved through actions taken by consumers,businesses and governments since 2005. Under the “with current measures” scenario,Canada’s GHG emissions in 2020 are projected to be 734 megatonnes (Mt). This is 128Mt less than under a scenario where consumers, businesses and governments had takenno action to reduce emissions post 2005. The projections indicate that further effortswill be required in order to meet the Copenhagen target (see Figure ES-1).
Greenhouse gas emissions projections depend on a number of evolving economic andenergy variables and are subject to significant uncertainty. In addition, futuredevelopments in technologies, demographics and resource-extraction will alter thefuture emissions pathway. Under a scenario where oil prices are assumed to be 27%
8/11/2019 1001-Canada's Emissions Trends 2013_e
http://slidepdf.com/reader/full/1001-canadas-emissions-trends-2013e 5/80
3
Canada’s Emissions Trends
higher than in the reference case in 2020, and annual average growth in GrossDomestic Product (GDP) between 2010 and 2020 is expected to be 2.9% (comparedwith 2.1% in the reference scenario), emissions could reach 773 Mt 1. Alternatively,under a scenario with slower GDP growth (average growth of 1.9% between 2010 and2020) and lower world oil prices (29% lower than the reference case in 2020),emissions could be as low as 686 Mt.
Environment Canada uses the Energy, Environment and Economy model for Canada(E3MC), which is internationally recognized and incorporates external data fromconsistent sources (see Annex 4). Modeling estimates are subject to interdepartmentaland provincial/territorial consultations and undergo a peer-review process. However,modeling work is inherently filled with uncertainty and projections are subject tochange with updates to key energy data and drivers as well as when historical data isrevised.
Progress towards the Copenhagen Target
Progress in reducing GHG emissions is measured against a “without measures” scenario. This scenario, which is described in more detail in Annex 4 , acts as abaseline where consumers, businesses and governments take no action post-2005 toreduce emissions.
The scenario that includes current measures is then compared against this baselinescenario. In order to be included in the “with current measures” scenario, actionsmust be concrete or legislated, financially backed, and specific enough to add to themodeling platform as of May 2013.
This is consistent with UNFCCC guidelines for National Communications submissions,which recommend measuring the total effect of measures by taking the differencebetw een “ with m easures” and “ without m easures” projections . Moreover, thiscomparison shows the level of effort required to achieve the target in 2020. This couldnot be captured by measuring emissions against current levels, as this would not takeinto account factors such as population and economic growth that will affect emissionsbetween now and 2020. Representing progress using a deviation from a “withoutmeasures” scenario is also used in modeling policy applications by agencies such as theEnergy Information Administration.
The analysis indicates that if consumers, businesses and governments had taken noaction to reduce GHG emissions after 2005, emissions in 2020 would have risen to 862Mt. This is in comparison to the “ with current measures ” scenario where, as a result ofactions taken since 2005, emissions in 2020 are expected to be 734 Mt. This meansthat, taken together, actions by consumers, businesses, and federal, provincial andterritorial governments have decreased emissions substantially from the “ withoutmeasures” scenario (Figure ES -1).
1 No sensitivity analysis was performed on the Land-Use Land-Use-Change and Forestry Sector.As such, emissions from this sector are assumed to be constant in all scenarios.

8/11/2019 1001-Canada's Emissions Trends 2013_e
http://slidepdf.com/reader/full/1001-canadas-emissions-trends-2013e 6/80
4
Canada’s Emissions Trends
Figure ES 1 – Scenarios of Canadian Emissions to 2020 (Mt CO 2e) 2
The “ Land Use, Land-Use Change, and Forestry ” (LULUCF) sector is a particularlyimportant sector for Canada given our vast land areas. Ten percent of the world’sforests are in Canada. Our managed forest covers 229 million hectares, more than themanaged forest of the entire European Union. Canada also has 65 million hectares oftotal farm area as reported in the 2011 Census of Agriculture . Canada has opted foraccounting approaches to GHG emissions for each subsector that take into account theunique structure of these forests and lands. These accounting approaches are seen asa scientifically credible way to measure improvements over time in this complexsector, and to a large extent are based on approaches that were internationallyaccepted at the UNFCCC Conference of the Parties in Durban in 2011. Based on thisaccounting, the contribution of LULUCF in 2020 is estimated to be 28 Mt and is addedto the “with current measures” line in 2020 . More detail on the LULUCF contribution ispresented in Annex 1.
Government programs and measures send signals to consumers and firms which resultin emissions reductions. There is an extensive list of federal and provincial/territorialmeasures that have been modeled, including federal policies such as the electricityperformance standard for coal-fired generation, renewable fuel content regulations,light-duty vehicle GHG regulations (2011-2016 and 2017-2025), and provincialmeasures such as the BC carbon t ax, Ontario’s coal-fired electricity phase-out, NovaScotia’s cap on electricity sector e missions, Quebec’s cap and trade program andcarbon l evy, Alberta’s Specified Gas Emitters Regulation, etc.
2 The “With Current Measures” line includes the compliance contribution of the Land Use, Land-Use Change andForestry (LULUCF) sector towards the Copenhagen target in every year post 2005, and therefore actual emissionstrends (without LULUCF) will be 28 Mt higher in 2020.
8/11/2019 1001-Canada's Emissions Trends 2013_e
http://slidepdf.com/reader/full/1001-canadas-emissions-trends-2013e 7/80
5
Canada’s Emissions Trends
Taken together, these policies have and will continue to influence GHG emissionsreductions, from projected levels in 2020 and beyond. Most importantly, theyencourage further action by demonstrating that government policies are having aquantifiable impact on GHG emissions.
These policies (and government measures to reduce air pollutants) are also having aneffect on short-lived climate pollutants (SLCPs) such as: black carbon (or soot),methane, tropospheric ozone and some hydrofluorocarbons (HFCs). Although SLCPshave relatively shorter “life -spans” in the atmosphere, they are responsible for asubstantial fraction of current global warming and can have detrimental impacts onhuman health, agriculture and ecosystems. Action to reduce air pollutants from dieselvehicles is already reducing fine particulate matter and black carbon, and Canada’snew coal-fired electricity performance standard will further reduce these emissions.The Government of Canada is committed to reducing SLCP emissions and is an activemember of the Arctic Council and the Climate and Clean Air Coalition to Reduce Short-Lived Climate Pollutants, two multilateral fora that are addressing short-lived climatepollutants. Canada provided almost C$3 million as an initial donation to the Climateand Clean Air Coalition and an additional C$10 million in 2013. In May 2013, Canadaassumed the chairmanship of the Arctic Council, and will co-chair negotiations for pan-Arctic arrangements to begin addressing SLCP emissions for Arctic nations.
The Government of Canada supports clean technology through a variety of programs.One of the most important initiatives is Sustainable Development Technology Canada(SDTC), an arm’s -length foundation that finances and supports entrepreneurs in thedevelopment and demonstration of clean technologies. SDTC also plays a significantrole in fostering collaboration and partnering among a diversity of private, not-for-profit and academic organizations – domestic and international – to strengthenCanadian clean technology capacity. Since SDTC’s inception in 2001, the Governmentof Canada has allocated more than $1 billion in funding. Most recently, EconomicAction Plan 2013 announced the allocation of $325 million over eight years to SDTC tocontinue support for the development and demonstration of new, clean technologiesthat create efficiencies for businesses and contribute to sustainable economicdevelopment. Further actions to lower emissions by federal, provincial and territorialgovernments will contribute to the additional reductions required for Canada to meetits commitments under the Copenhagen Accord. The Government of Canada supportsthe efforts of provinces and territories - many of which have GHG emissions reductiontargets of their own - as well as businesses and individuals to lower their respectiveemissions.
Transparency and Continuous Enhancement of the Energy,Emissions and Economy Model for Canada
Canada’s Emissions Trends 2013 creates scenarios of emissions projections to the year2020 using a proven and reputable integrated energy, emissions and economy modelfor Canada. Having reliable projections of GHG emissions is essential for understandingCanada’s emission s profile in terms of how historical trends are expected to change aswe look to the future.

8/11/2019 1001-Canada's Emissions Trends 2013_e
http://slidepdf.com/reader/full/1001-canadas-emissions-trends-2013e 8/80
6
Canada’s Emissions Trends
Future emissions are driven by factors such as the pace of expected economic andpopulation growth, development of energy markets and their influence on prices,technological change, consumer behaviour, and policies aimed at emissionsreductions. Canada’s Emissions Trends 2013 includes updates to all of these keydrivers, to better reflect the most current views of their expected developments.Moreover, continued enhancement of the modeling platform is resulting in moredeveloped and refined projections. All of these changes will improve the emissionsprojections and specific estimates with each update.
The 2013 Canada’s Emissions Trends report is subject to rigorous review. The majorityof data underlying the assumptions that inform the projections were developed inconsultation with provinces, territories and industry and, as was done for the report in2011, the report has been subject to a peer review process. Moreover, the highlysophisticated modeling platform is viewed as one of the leading integrated energy,emissions and economy models in North America. Sensitivity analysis is described andillustrated in Annex 3.
Economic assumptions to 2018 are based on private sector projections from FinanceCanada's Private Sector Survey, June 2013 . The outer years are based on the Department of Finance’s longer- term fiscal projections included in their “Economicand F iscal Implications of an Aging Population” report . Forecasts of major energysupply projects and price s forecast are taken from the National Energy Board’spreliminary 2013 projections.
This analysis assumes that existing laws, regulations and policies remain unchangedover time. Programs and measures included in the modeling scenario reflect theirbudget profile, and are assumed to end when allocated funding sunsets. Similarly, it isassumed that there is no technological change over the projection period.
In an ongoing effort to improve the modeling platform, several changes have been
made to the model over the last year. These technical refinements are described inmore detail in Annex 5 and include: endogenous cogeneration building andrestructuring for the oil sands; revisions to electricity demand in the oil sands;methodology changes for future oil sands production mixes; a change in the economicdriver for natural gas distribution pipelines; and a new source of historical light-dutyvehicle efficiencies.

8/11/2019 1001-Canada's Emissions Trends 2013_e
http://slidepdf.com/reader/full/1001-canadas-emissions-trends-2013e 9/80
Canada’s Emissions Trends 7
Table of ContentsExecutive Summary ................................................................................ 1
Table of Contents .................................................................................. 7
Preface ............................................................................................... 8
Canada’s GHG Emissions in a Global Context ............................................... 10
Box 1 – Greenhouse Gases, Carbon Dioxide, and Fuel Combustion Definitions ... 10
Historical GHG Emissions by Sector ........................................................... 14
Emissions by Activity and Economic Sector .............................................. 14
Historical Emissions ........................................................................... 14
Projected Emissions Trends .................................................................... 18
Key Drivers Used in the Development of Emissions Projections ..................... 18
Reference Scenario: Projected Trends ................................................... 19
Emissions by Province ........................................................................ 3 5
Projected Alternate Emissions Scenarios .................................................... 3 8
Box 3: Short-Lived Climate Pollutants .................................................... 4 1
Annex 1: The Land Use, Land-Use Change and Forestry Sector ........................ 4 2
Annex 2: Baseline Data and Assumptions ................................................... 48
Annex 3: Alternate Emissions Scenarios ..................................................... 6 1
Annex 4: Methodology for Development of Emissions Scenarios ....................... 65
Annex 5: Technical Changes since Emissions Trends Report 2012 .................... 7 5
8/11/2019 1001-Canada's Emissions Trends 2013_e
http://slidepdf.com/reader/full/1001-canadas-emissions-trends-2013e 10/80
Canada’s Emissions Trends 8
PrefaceCanada’s Emissions Trends 2013 provides a basis for analyzing projected greenhousegas (GHG) emissions, and supports domestic and international reporting requirements.The projections can be used to analyze the effect of different emission abatement
strategies against a consistent backdrop, and enables quantitative assessment of theemission reductions associated with policy measures that will arise in the future.
Environment Canada published the first Canada’s Emissions Trends report in 2011. Thisis the third annual report.
The analysis presented in this report incorporates the most up-to-date statistics onGHG emissions and energy available at the time that the technical modeling wascompleted in the summer of 2013, and is based on scenarios of emissions projectionsusing a detailed Energy, Emissions and Economy Model for Canada.
Provincial/Territorial and Federal government departments were consulted during the
model’s development and were invited to provide their input and suggestions forimprovement.
The majority of data and advice received from sector experts and authorities for themodeled emissions scenarios have been subject to extensive consultations. Forexample, the National Energy Board has extensive consultation processes in place toensure their assumptions of energy demand and supply growth are robust; the inputthey provided to Environment Canada reflects those consultations.
In addition, these projections and reports have undergone an updated peer-reviewprocess with positive results. In the peer review, the external experts assessed themodeling methodology on its reasonableness and robustness, reviewed the sources for
the key macroeconomic and energy-related assumptions, and made suggestions on howto continue improving the methodology in future rounds.
As with all projections, the estimates in this paper should be seen as representative ofpossible outcomes that will, in the end, depend on economic, social and other factors,including future government policies.
Structure of this Report
This report presents projections of GHGs to the year 2020 aligned to the historicaldata on GHG emissions provided in Canada’s National Inventory Report (NIR). The firstsection, Canada’s GHG Emissions in a Global Context , sets the stage by explaining
Canada’s emissions relative to other countries and the work that is underwayinternationally as part of the global effort to lower emissions. The second section,Historical GHG Emissions by Sector, explains historical emissions trends by economicsector and provides details about the evolving trends in these sectors from 1990 to2011. The third section, Projected Emissions Trends, provides projections of GHGs bysector to the year 2020 and explains the underlying reason behind these sectoraltrends. The annexes of this report provide further details on LULUCF accounting,information on the key drivers of emissions used within the modeling exercise, andtechnical explanations of the modeling platform and changes made since last year’s

8/11/2019 1001-Canada's Emissions Trends 2013_e
http://slidepdf.com/reader/full/1001-canadas-emissions-trends-2013e 11/80
Canada’s Emissions Trends 9
projections. Sensitivity analysis is provided under the projections section as well as infurther detail in Annex 3. This analysis illustrates the plausible trajectories of GHGemissions under various assumptions about the future path of energy prices and theeconomy.
Note that throughout this report, table numbers may not add up due to rounding.

8/11/2019 1001-Canada's Emissions Trends 2013_e
http://slidepdf.com/reader/full/1001-canadas-emissions-trends-2013e 12/80
Canada’s Emissions Trends 10
Canada’s GHG Emissions in a Global Context There is currently no up-to-date international data that provides full greenhouse gasemissions projections by country. However, the International Energy Agency (IEA)reports that global carbon dioxide (CO 2) emissions from fossil fuel combustion in 2012
rose an estimated 1.4% from 2011 to 31.6 billion tonnes3
. Although global GHGemissions are expected to continue increasing with current policies and practices, thepace of this growth appears to be slowing. The emissions growth since last yearrepresents the second-smallest annual increase in emissions since 2003, behind only2009 when global fossil fuel CO 2 emissions fell due to the global recession.
Box 1 – Greenhouse Gases, Carbon Dioxide, and Fuel CombustionDefinitions
The most important greenhouse gases directly emitted by human activities include CO 2,CH4, N2O, and several other fluorine-containing halogenated substances (i.e. PFCs, HFCs,SFC). In Canada, carbon dioxide (CO 2) emissions in 2011 accounted for 79% of totalgreenhouse gas emissions in the National Inventory Report, with Methane (CH 4) and NitrousOxide (N2O) accounting for 12% and 7% of emissions respectively. Thus these three gasesaccounted for around 98% of total greenhouse gas emissions in Canada.
The primary source of carbon dioxide is from the combustion of fossil fuels for the purposesof energy production. This accounted for 89% of total CO 2 emissions in 2011. Carbon dioxidemay also be released during the extraction of fossil fuels, the conversion of fossil fuels toother products and the production of certain industrial products, such as cement. Carbondioxide is also emitted and absorbed in the Land Use Change and Land Use Change andForestry (LULUCF) sector.
These results are reflected in the historical emissions of the two largest emitters inthe world, China and the United States. CO 2 emissions from fuel combustion in theUnited States fell by 200 megatonnes (Mt) (3.8%) in 2012, to levels last seen in themid-1990s. This is primarily driven by a transition away from coal power generation tonatural gas in electricity generation, which is mostly driven by government policy anddecreasing prices for natural gas. Although Chinese emissions grew by 300 Mt in 2012,this was among the country's smallest annual emissions growth over the past decade.The IEA explains that this is a result of China diversifying its energy sources andinstalling more renewable energy. In addition, European emissions fell 50 Mt in 2012due to the economic contraction and renewable energy growth, despite an increase incoal energy use 4.
3 World Energy Outlook Special Report: Redrawing the Energy-Climate Map 4 http://www.eia.gov/forecasts/ieo/
8/11/2019 1001-Canada's Emissions Trends 2013_e
http://slidepdf.com/reader/full/1001-canadas-emissions-trends-2013e 13/80
Canada’s Emissions Trends 11
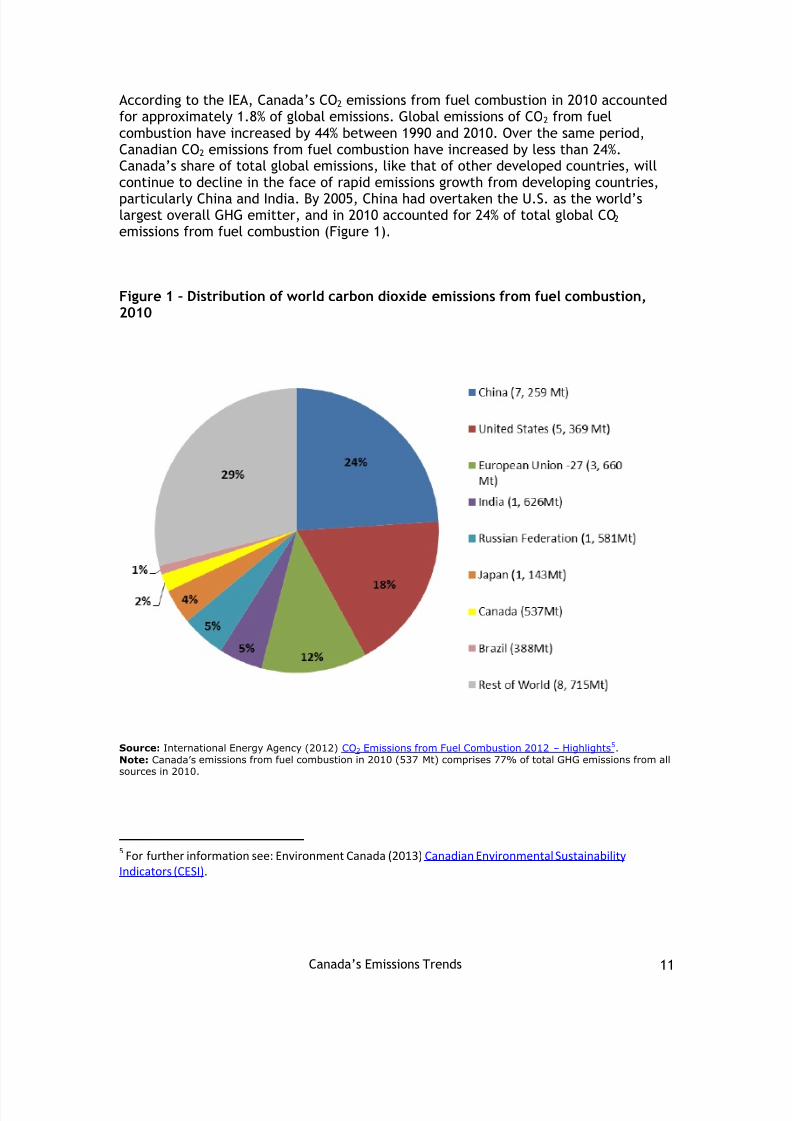
According to the IEA, Canada ’s CO2 emissions from fuel combustion in 2010 accountedfor approximately 1.8% of global emissions. Global emissions of CO 2 from fuelcombustion have increased by 44% between 1990 and 2010. Over the same period,Canadian CO 2 emissions from fuel combustion have increased by less than 24%.Canada’s share of total global emissions, like that of other developed countries, willcontinue to decline in the face of rapid emissions growth from developing countries,particularly China and India. By 2005, China had overtaken the U.S. as the world’slargest overall GHG emitter, and in 2010 accounted for 24% of total global CO 2 emissions from fuel combustion (Figure 1).
Figure 1 – Distribution of world carbon dioxide emissions from fuel combustion,2010
Source: International Energy Agency (2012) CO 2 Emissions from Fuel Combustion 2012 – Highlights 5 .Note: Canada’s emissions from fuel combustion in 2010 (537 Mt) comprises 77% of total GHG emissions from allsources in 2010.
5 For further information see: Environment Canada (2013) Canadian Environmental Sustainability Indicators (CESI).
8/11/2019 1001-Canada's Emissions Trends 2013_e
http://slidepdf.com/reader/full/1001-canadas-emissions-trends-2013e 14/80
Canada’s Emissions Trends 12
The United Nations Framework Convention on Climate Change (UNFCCC) is aninternational environmental treaty that includes over 190 countries, negotiated at theUnited Nations Conference on Environment and Development in 1992. The treaty’sobjective is to stabilize GHG concentrations in the atmosphere at a level that wouldprevent dangerous anthropogenic interference with the climate system.
Under the UNFCCC, the Copenhagen Accord (2009), and subsequent CancunAgreements (2010), called on all Parties to put forward 2020 mitigation pledges. As aresult of these two agreements, countries representing around 80% of global GHGemissions have now put forward 2020 mitigation pledges and have committed to reporton their progress in a transparent manner.
Canada signed onto the Copenhagen Accord in December 2009 and committed toreduce its GHG emissions to 17% below 2005 levels by 2020. This reduction targetmirrors that of the United States, although differing industrial composition createsdifferent challenges for the two countries. For example, 65% of utility generation inCanada is from non-emitting hydro and renewable sources, whereas the United States ’electricity portfolio is predominantly from coal, which is a high-emitting fuel.Canada’s ability to lower overall emissio ns with policies such as fuel switching forelectricity generation is therefore more limited and would incur greater proportionalcosts.
In response to this challenge, the Government of Canada is following a sector-by-sector approach to regulatory development, which will lower emissions throughout theentire economy where it makes sense to do so, and seeking out the lowest-costsolutions. This includes support for all provincial and territorial actions to reduceemissions.
As a member of the UNFCCC, Canada submits: National Inventory Reports annuallythat detail historical GHG emissions levels since 1990; National Communications every
four years that explain what Canada is doing to reduce emissions; and, starting inJanuary 2014, Biennial Reports that illustrate emissions projections to the year 2030by sector and gas. All of these reports are made publicly available on the UNFCCCwebsite. 6
Looking ahead, countries are now working towards the establishment of a new,effective international climate change agreement on the basis of the Durban Platform,adopted at the 2011 Climate Conference in South Africa. A key element of the DurbanPlatform is the recognition that, to be effective, all major emitters (includingdeveloped and developing countries) will need to contribute to the globaleffort. Negotiations on the details of the new agreement are scheduled to conclude in2015 for implementation starting in 2020. In this context, Canada’s emissions
projections will be used to estimate the level of effort required to reduce emissionsfrom the reference scenario.
6 UNFCCC submitted reports available at: http://unfccc.int/national_reports/items/1408.php
8/11/2019 1001-Canada's Emissions Trends 2013_e
http://slidepdf.com/reader/full/1001-canadas-emissions-trends-2013e 15/80
Canada’s Emissions Trends 13
Fast-Start Climate Financing
The Government of Canada has fully delivered on its commitment under theCopenhagen Accord to provide its share of fast-start financing, wherein developedcountries agreed to collectively provide $30 billion in new and additional financialresources for the period 2010-2012. The investment of C$1.2 billion for the fiscal years2010-11, 2011-12 and 2012-2013 (approximately $400 million in each of the threeyears) is Canada’s largest -ever package of support for GHG mitigation and adaptationin developing countries. Our contributions to and collaborations with bilateral,multilateral, private sector and non-governmental partners are generating significantenvironmental benefits and paving the way for continued progress under the UNFCCC.The funds have been committed at the project level to the benefit of over 50developing countries.
More broadly, the Government of Canada is encouraging the private sector ’sinvolvement to help developing countries achieve their climate goals. Half of theinvestment funds noted above will be directed towards multilateral banks for theexpress purpose of mobilizing private sector financing in climate-friendly projects. TheGovernment is also funding programs to promote sustainable agriculture and addressdeforestation in developing countries, and has supported major initiatives that willbuild resilience in the most vulnerable countries to the impacts of climate change.The Government remains committed to the Copenhagen goal of jointly mobilizing $100billion per year by 2020 from public and private sources to address the needs ofdeveloping countries, in the context of meaningful mitigation actions and transparencyon implementation.

8/11/2019 1001-Canada's Emissions Trends 2013_e
http://slidepdf.com/reader/full/1001-canadas-emissions-trends-2013e 16/80

8/11/2019 1001-Canada's Emissions Trends 2013_e
http://slidepdf.com/reader/full/1001-canadas-emissions-trends-2013e 17/80
Canada’s Emissions Trends 15
Table 1 – GHG emissions by economic sector (Mt CO 2e) (excluding LULUCF)
Mt CO 2 equivalent 1990 2000 2005 2011
Transportation 128 155 168 170
Oil and Gas 101 150 162 163
Electricity 94 129 121 90
Buildings 70 82 84 84
Emissions Intensive & Trade Exposed Industries 93 85 87 78
Agriculture 54 66 68 68
Waste and Others 50 51 49 49
NATIONAL GHG TOTAL 591 718 737 702
The specific gases included in the table above are: Carbon dioxide (CO 2), methane(CH4), Nitrous oxide emissions (N 2O), Hydrofluorocarbons (HFCs), Perfluorocarbons(PFCs) and sulphur-hexafluorides (SF 6) which have been converted into CO 2 eq withglobal warming potential values from the second Assessment Report of the IPCC. Note
that Black Carbon, a powerful short-lived climate pollutant, is not part of this analysisas it is not included under the current reporting framework of the UNFCCC.
Emissions and economic activity are intrinsically linked, although in a Canadiancontext their relationship has declined over the past two decades as technologicalimprovements and regulations have been adopted and implemented in variouseconomic sectors and relative energy prices have evolved. Emissions intensity, definedas GHG emissions per dollar of GDP, measures the relationship between economicproductivity and emissions generation of that economic activity. In Canada, therelationship between total GHG emissions and total real GDP has declined at anaverage annual rate of 1. 5 % since 1990. Overall, between 1990 and 2011, economy-wide emissions intensity declined 28%.
Transportation
In 2011, emissions from transportation (including passenger, freight, and off-roademissions) were the largest contributor to Canada’s GHG emissions, representing 24%of overall GHGs.
Between 1990 and 2005, emissions in the transportation sector increased 31%, from128 Mt in 1990 to 168 Mt in 2005. This was driven by a strong period of economicgrowth and low oil prices from 1990 to 1999 that influenced the fleet composition andits use (e.g. movement from cars to more light-duty trucks).
Since 2005, transportation emissions have been relatively stable, representing 170 Mtin 2011. The increasing fuel efficiency of light-duty vehicles has offset the effects ofmore vehicles on the road and more kilometres driven. For example, between 2005and 2011, the sales-weighted on-road fuel efficiency for new gasoline cars hasimproved from 9.2 litres per 100 Km to 8.5 litres per 100 Km, while the sales-weightedon-road fuel efficiency for new gasoline light trucks has improved from 13.2 litres per100 Km to 11.7 litres per 100 km.
8/11/2019 1001-Canada's Emissions Trends 2013_e
http://slidepdf.com/reader/full/1001-canadas-emissions-trends-2013e 18/80
8/11/2019 1001-Canada's Emissions Trends 2013_e
http://slidepdf.com/reader/full/1001-canadas-emissions-trends-2013e 19/80
Canada’s Emissions Trends 17
Buildings
Emissions in Canada’s commercial and residential buildings increased by 14 Mtbetween 1990 and 2005, and then remained relatively stable around the 2005 levelsthrough to 2011. Still, since 1990 buildings have accounted for about 12% of Canada’sGHG emissions in any given year. Despite a growing population and increased housingstock and commercial/institutional building stock, the stability in emissions since 2005is attributed mainly to energy retrofits, as 40% of the floor space has seen some levelof energy retrofit between 2005-2009.
Agriculture
GHG emissions from primary agriculture in Canada consist mainly of methane (CH4)and nitrous oxide (N2O) from livestock and crop production systems as well asemissions from on-farm fuel use. Emissions have remained stable over the 2005 to2011 period at approximately 68 Mt, following an increase of 14 Mt from 1990 to 2005.Since 1990, emissions from the sector grew from 8% of Canada’s total emi ssions to12%. Emissions and removals of carbon from land management and land use changeassociated with agricultural lands are accounted for separately in the Land Use, Land-Use-Change and Forestry (LULUCF) sector.
Waste and Others
Emissions from waste management and other non-emissions-intensive industrialsectors such as electric and transport equipment manufacturing, remained relativelystable between 1990 and 2005. From 1990 to 2011, GHG emissions from municipalsolid waste landfills decreased by some 3 Mt as provincial government measures aimedat capturing landfill gas and solid waste diversion helped to slow growth from thehistorical period.

8/11/2019 1001-Canada's Emissions Trends 2013_e
http://slidepdf.com/reader/full/1001-canadas-emissions-trends-2013e 20/80
Canada’s Emissions Trends 18
Projected Emissions Trends
Key Drivers Used in the Development of Emissions Projections
GHG emissions in Canada are driven by a number of factors, such as economic andpopulation growth as well as the mix of energy supply. Projections of future emissionsare greatly influenced by the underlying assumptions about the expected developmentof these economic drivers over time. Changing assumptions about any of these factorswill alter the future path of emissions (see Emissions Scenarios section and Annex 3).
The approach adopted for development of the emissions scenarios presented hererelies on a set of key assumptions. The economic projections to the year 2018 arebased on the private sector projections from Finance Canada's Private Sector Survey,June 2013 . The outer years (2018-2020) are based on Finance Canada’s longer-termfiscal projections included in their “Economic and Fiscal Implications of an AgingPopulation” repor t. Forecasts of major energy supply projects from the National
Energy Board ’s preliminary 2013 projections were incorporated for key variables andassumptions in the model (e.g., oil sands production, large hydro-capacityexpansions, nuclear refurbishment and additions). Under the National Energy Board’sreview process, s upply forecasts are based on consultation with industry experts andreflect the Government’s most recent views regarding the evolution of Canada’senergy supply sector. The projections also incorporate data from the NIR and the U.S.Energy Information Administration. For a more detailed summary of key economicdata and assumptions, see Annex 2.
Government policy also has a significant impact on emissions, as do changes inbehaviour by consumers and businesses. Although the modeling explicitly recognizesprice-driven technological progress (e.g., known, advanced, energy-efficienttechnologies will become more cost-effective over time), it is virtually impossible topredict which new technologies will be developed and commercialized in the future sono assumptions are made in this regard. Likewise, behavioural factors have been keptconstant throughout the entire projection period. In this respect, the expected trendin emissions projections will be shaped by existing government measures. In reality,technological progress, behavioural shifts and future government measures must allcontribute to reduce emissions to the target established in the Copenhagen Accord.
The Land Use, Land-Use-Change and Forestry (LULUCF) sector is modeled andaccounted for separately from the other sectors within this report. The expectedcontribution of the LULUCF sector towards the Copenhagen target is established bycomparing business-as-usual emissions/removals levels in 2020 to either 2005 levels or,
in the case of the managed forest, to a Reference Level based on an internationallyaccepted approach. Due to economic conditions and various management practicedecisions, the LULUCF sector is expected to improve relative to the base year orReference Levels. As such, the expected LULUCF contribution of 28 Mt is added toemissions projections in 2020 as a credit towards the target.
Taking into account the economic drivers described above, with no major technologychanges and factoring in current government measures, results in a baseline scenario
8/11/2019 1001-Canada's Emissions Trends 2013_e
http://slidepdf.com/reader/full/1001-canadas-emissions-trends-2013e 21/80
Canada’s Emissions Trends 19
0
0.1
0.2
0.3
0.4
0.5
0.6
0.7
0.8
0.9
M t C O 2 e
/ $ 9 7 b l n s G D P
whereby emissions reach 734 Mt by 2020 when the projected contribution fromLULUCF is included.
Reference Scenario: Projected Trends
National Emissions Projections
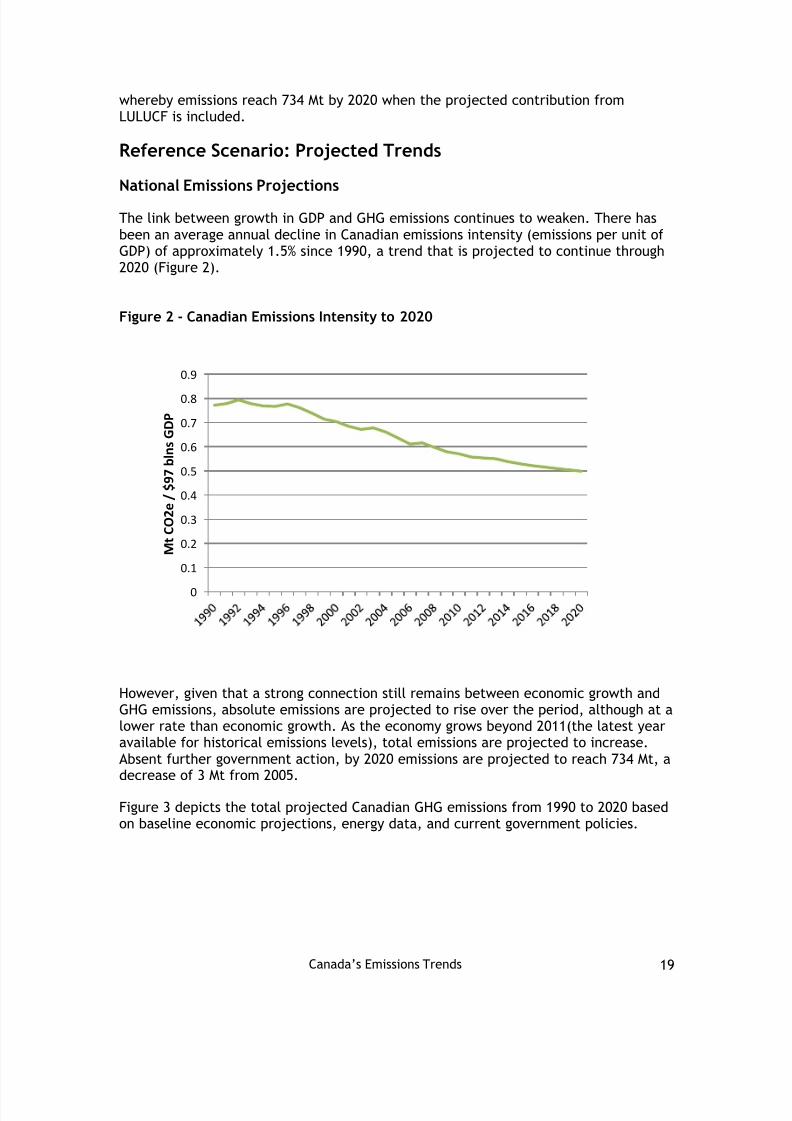
The link between growth in GDP and GHG emissions continues to weaken. There hasbeen an average annual decline in Canadian emissions intensity (emissions per unit ofGDP) of approximately 1.5% since 1990, a trend that is projected to continue through2020 (Figure 2).
Figure 2 - Canadian Emissions Intensity to 20 2 0
However, given that a strong connection still remains between economic growth andGHG emissions, absolute emissions are projected to rise over the period, although at alower rate than economic growth. As the economy grows beyond 2011(the latest yearavailable for historical emissions levels), total emissions are projected to increase.Absent further government action, by 2020 emissions are projected to reach 734 Mt, adecrease of 3 Mt from 2005.
Figure 3 depicts the total projected Canadian GHG emissions from 1990 to 2020 basedon baseline economic projections, energy data, and current government policies.

8/11/2019 1001-Canada's Emissions Trends 2013_e
http://slidepdf.com/reader/full/1001-canadas-emissions-trends-2013e 22/80
Canada’s Emissions Trends 20
Figure 3 – Total Canadian GHG emissions and projections (with no furthergovernment actions):2005 to 2020 (Mt CO 2e incl. LULUCF contribution applied to2020 target)
Per Capita Emissions:
Total greenhouse gas emissions divided by the population of Canada (per capitaemissions) have been decreasing significantly since 2005 when they were 22.9 tonnesof carbon dioxide equivalent (CO 2e) per person. In 2011, emissions per capita wereonly 20.4 tonnes of CO 2e per person, which is the lowest level recorded since recordsbegan in 1990 8.
Projections show this trend continuing through 2020. This analysis projects per capitaemissions to fall to 20.1 tonnes of CO 2e per person in 2015; and down to 20.0 tonnesper person in 2020 (Table 2).
Table 2: Canadian Greenhouse Gas Emissions Per Capita 9
Tonnes CO2e 2005 2011 2020
Per capita emissions 22.9 20.4 20.0
8 Emissions per capita in 2009 were also 20.4 tonnes of CO 2e per person, rising slightly to 20.5 in 20109 Excluding the contribution of LULUCF
8/11/2019 1001-Canada's Emissions Trends 2013_e
http://slidepdf.com/reader/full/1001-canadas-emissions-trends-2013e 23/80
Canada’s Emissions Trends 21
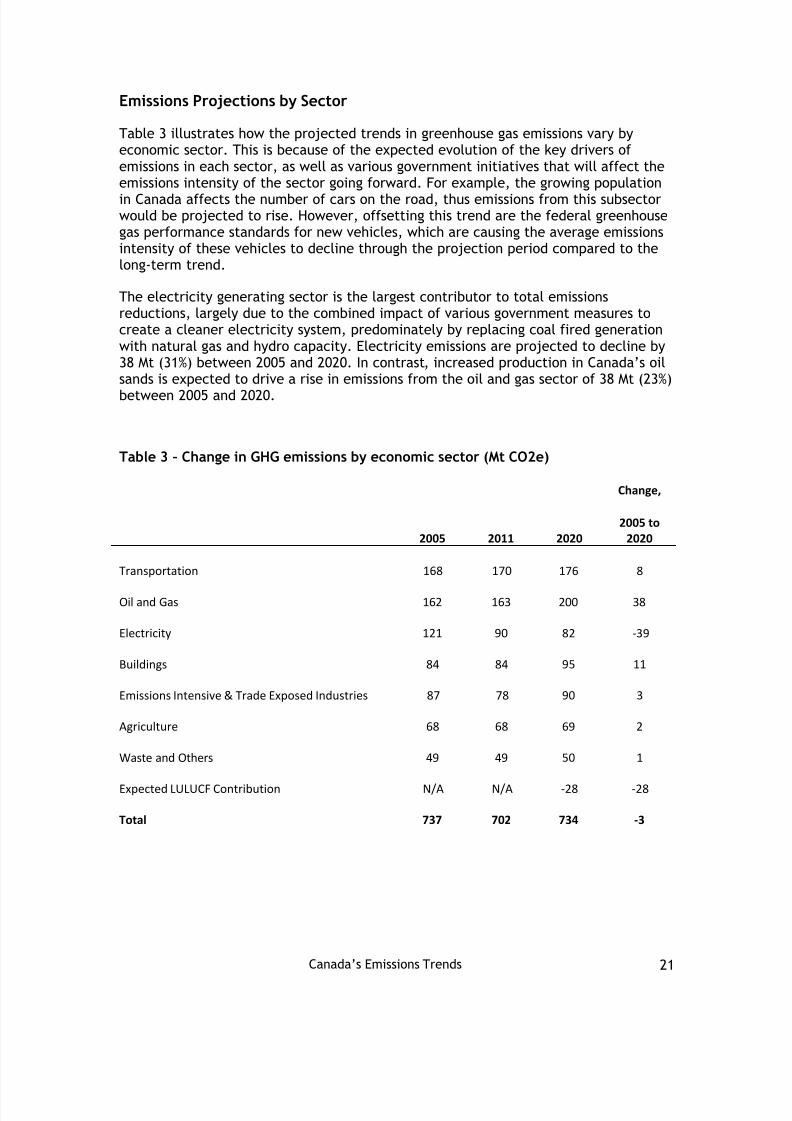
Emissions Projections by Sector
Table 3 illustrates how the projected trends in greenhouse gas emissions vary byeconomic sector. This is because of the expected evolution of the key drivers ofemissions in each sector, as well as various government initiatives that will affect theemissions intensity of the sector going forward. For example, the growing populationin Canada affects the number of cars on the road, thus emissions from this subsectorwould be projected to rise. However, offsetting this trend are the federal greenhousegas performance standards for new vehicles, which are causing the average emissionsintensity of these vehicles to decline through the projection period compared to thelong-term trend.
The electricity generating sector is the largest contributor to total emissionsreductions, largely due to the combined impact of various government measures tocreate a cleaner electricity system, predominately by replacing coal fired generationwith natural gas and hydro capacity. Electricity emissions are projected to decline by38 Mt (31%) between 2005 and 2020. In contrast , increased production in Canada’s oilsands is expected to drive a rise in emissions from the oil and gas sector of 38 Mt (23%)between 2005 and 2020.
Table 3 – Change in GHG emissions by economic sector (Mt CO2e)
2005 2011 2020
Change,
2005 to2020
Transportation 168 170 176 8
Oil and Gas 162 163 200 38
Electricity 121 90 82 -39
Buildings 84 84 95 11
Emissions Intensive & Trade Exposed Industries 87 78 90 3
Agriculture 68 68 69 2
Waste and Others 49 49 50 1
Expected LULUCF Contribution N/A N/A -28 -28
Total 737 702 734 -3
8/11/2019 1001-Canada's Emissions Trends 2013_e
http://slidepdf.com/reader/full/1001-canadas-emissions-trends-2013e 24/80

8/11/2019 1001-Canada's Emissions Trends 2013_e
http://slidepdf.com/reader/full/1001-canadas-emissions-trends-2013e 25/80
Canada’s Emissions Trends 23
Table 4 – Transportation: emissions (Mt CO2e)
2005 2011 2020
Passenger Transport 96 96 90
Cars, Trucks and Motorcycles 87 88 81
Bus, Rail and Domestic Aviation 9 8 9
Freight Transport 57 61 70
Heavy-Duty Trucks, Rail 49 54 61
Domestic Aviation and Marine 8 7 9
Other: Recreational, Commercial and Residential 14 13 15
Total Emissions (Mt) 168 170 176
Note: In this table and all subsequent tables, numbers may not add due to rounding
Oil and Gas
Upstream Oil and Gas Production
The overall emissions intensity of oil sands production (including upgrading) has
historically been decreasing over time. This trend reflects various offsettingcompositional trends in the different subsectors. For example, while the emissionsintensity of oil sands mining operations has been increasing since 1990 as miningoperations extract deeper/poorer-quality bitumen-sand, the emissions intensity of in-situ operations and bitumen upgrading facilities have been decreasing over the sameperiod (Figure 4).
Working against this historical trend, there are several forces that are working to driveemissions intensity up in the future for the sub-sector as a whole (e.g. decliningreservoir quality, aging of existing facilities, etc.). It is therefore unclear if thesehistorical improvements will continue. In addition, technological improvements havethe potential to reduce oil sands emissions intensities. This technological potential is
discussed in Box 2.Considering the uncertainties associated with emissions intensities in the oil sands,this analysis has assumed constant emissions intensity throughout the projectionperiod. Under a scenario where historical trends in intensities are brought forward intoprojections years, oil sands emissions could be some 0.5% smaller in 2020 than under

8/11/2019 1001-Canada's Emissions Trends 2013_e
http://slidepdf.com/reader/full/1001-canadas-emissions-trends-2013e 26/80
Canada’s Emissions Trends 24
the reference scenario 11. No scenarios assuming increasing intensities were modeledunder this analysis.
Under the reference case assumptions, emissions from upstream oil and gas productionare estimated to grow from 109 Mt in 2005 to 144 Mt in 2020. This increase is driven bythe growth in bitumen production, where emissions are expected to increase from 21Mt in 2005 to about 76 Mt by 2020. Specifically, emissions from oil sands mining areprojected to more than double over the 2005 to 2020 time period. Emissions from insitu production are expected to increase from 11 Mt in 2005 to 55 Mt in 2020. Oil sandsemissions from upgrading are not included under the “upstream” categorisation butare discussed below.
Emissions from conventional crude oil production are expected to fall from 32 Mt in2005 to 31 Mt in 2020. Emissions from natural gas production and processing are alsoexpected to fall from about 56 Mt in 2005 to 37 Mt by 2020, but are expected to thenrebound slightly in subsequent years as the price of natural gas is projected toincrease in later years.
Table 5 – Upstream oil and natural gas production: emissions and drivers
2005 2011 2020
Conventional Oil Production
Emissions (Mt CO 2e) 32 30 31
Production (1,000 barrels/day) 1361 1262 1304
Natural Gas Production and Processing
Emissions (Mt CO2e) 56 47 37
Production (billion cubic foot) 6984 5938 4861
Bitumen Production
Emissions (Mt CO 2e) 21 37 76
Production (1,000 barrels/day) 1064 1743 3316
Emissions from the pipeline transport of oil and natural gas are expected to fall fromabout 16 Mt in 2005 to 9 Mt by 2020. The emissions associated with the upgrading ofoil-sands bitumen are expected to rise from 14 Mt in 2005 to 25 Mt by 2020. Further
11 This is assuming a 5-year moving average. Under a 10-year moving average, emissions could be 10%lower than in the reference scenario.
8/11/2019 1001-Canada's Emissions Trends 2013_e
http://slidepdf.com/reader/full/1001-canadas-emissions-trends-2013e 27/80
Canada’s Emissions Trends 25
details on emissions from oil-sands upgrading are outlined in the following section onpetroleum refining and upgrading. Emissions from the production of synthetic crudeoil are linked to the petroleum refining industry.
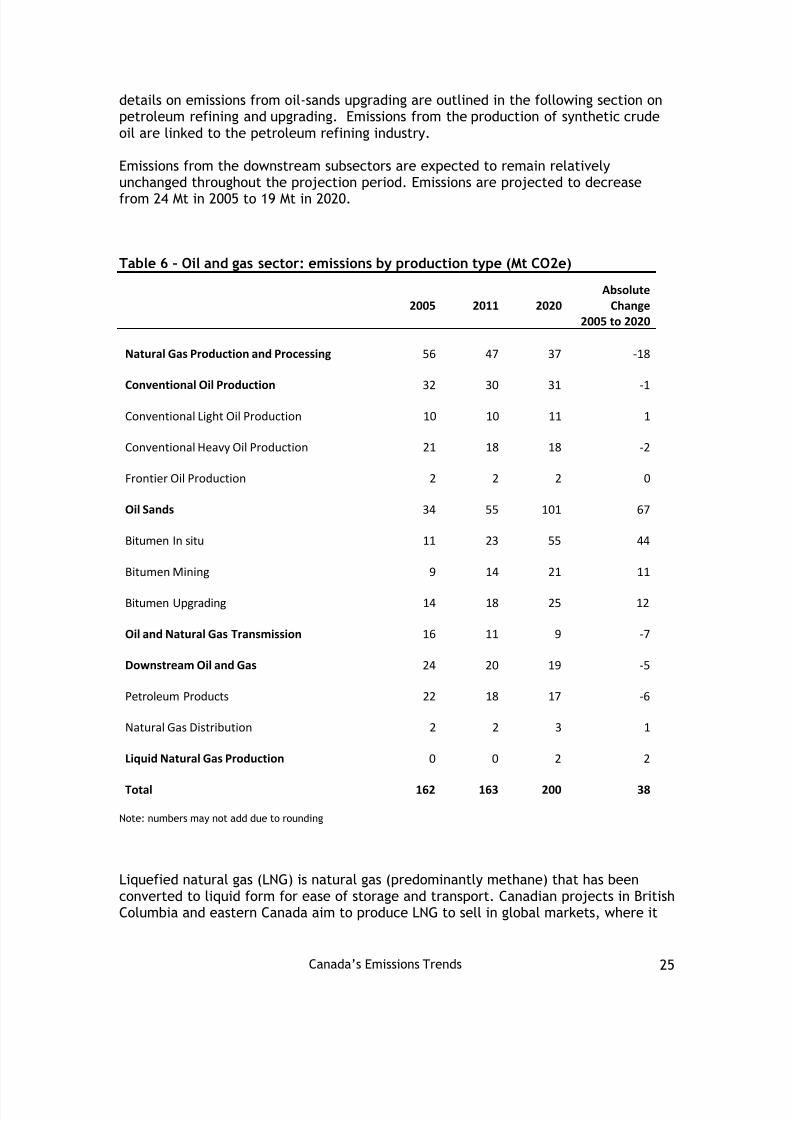
Emissions from the downstream subsectors are expected to remain relativelyunchanged throughout the projection period. Emissions are projected to decreasefrom 24 Mt in 2005 to 19 Mt in 2020.
Table 6 – Oil and gas sector: emissions by production type (Mt CO2e)
2005 2011 2020Absolute
Change2005 to 2020
Natural Gas Production and Processing 56 47 37 -18
Conventional Oil Production 32 30 31 -1
Conventional Light Oil Production 10 10 11 1
Conventional Heavy Oil Production 21 18 18 -2
Frontier Oil Production 2 2 2 0
Oil Sands 34 55 101 67
Bitumen In situ 11 23 55 44
Bitumen Mining 9 14 21 11
Bitumen Upgrading 14 18 25 12
Oil and Natural Gas Transmission 16 11 9 -7
Downstream Oil and Gas 24 20 19 -5
Petroleum Products 22 18 17 -6
Natural Gas Distribution 2 2 3 1
Liquid Natural Gas Production 0 0 2 2
Total 162 163 200 38
Note: numbers may not add due to rounding
Liquefied natural gas (LNG) is natural gas (predominantly methane) that has beenconverted to liquid form for ease of storage and transport. Canadian projects in BritishColumbia and eastern Canada aim to produce LNG to sell in global markets, where it

8/11/2019 1001-Canada's Emissions Trends 2013_e
http://slidepdf.com/reader/full/1001-canadas-emissions-trends-2013e 28/80
Canada’s Emissions Trends 26
would be regasified and distributed as pipeline natural gas. There is a high degree ofuncertainty regarding LNG production in Canada since its potential for exportationresides in factors such as the cost/acceptability of export terminals and pipelines onthe West Coast, as well as the long term price expectations of natural gas bothdomestically and internationally. For this report, modeling assumptions have used theNational Energy Boards preliminary 2013 view of expected LNG production through2020. Greenhouse gas emissions for LNG production represent emissions from theincremental energy consumption required for LNG processes.
Petroleum Refining and Upgrading
Table 7 displays emissions associated with petroleum refining and upgrading. In thetable above, the GHG emissions from upgrading bitumen into synthetic crude oil areincluded in the Traditional Refineries category.
There are currently 12 companies operating refineries in Canada. One refinery in NovaScotia is expected to convert into a terminal removing its capacity from the sector.
Overall, refinery production is expected to slightly increase between 2011 and 2020.GHG emissions decrease slightly over this timeframe due to improvements in energyefficiency expected at the facilities (e.g. refurbishments).
From 2005 to 2020, emissions from bitumen upgrading are projected to increase by 12Mt, while emissions from petroleum refining are projected to decline by 5 Mt.
Table 7 – Petroleum refining and upgrading sector: emissions and drivers
2005 2011 2020
Traditional Refineries
Emissions (Mt CO 2e) 22 18 17
Refined Petroleum Processed (1,000barrels/day) 2165 2035 2143
Upgraders
Emissions (Mt CO 2e) 14 18 26
Upgraded Products (1,000barrels/day) 611 932 1317
8/11/2019 1001-Canada's Emissions Trends 2013_e
http://slidepdf.com/reader/full/1001-canadas-emissions-trends-2013e 29/80
Canada’s Emissions Trends 27
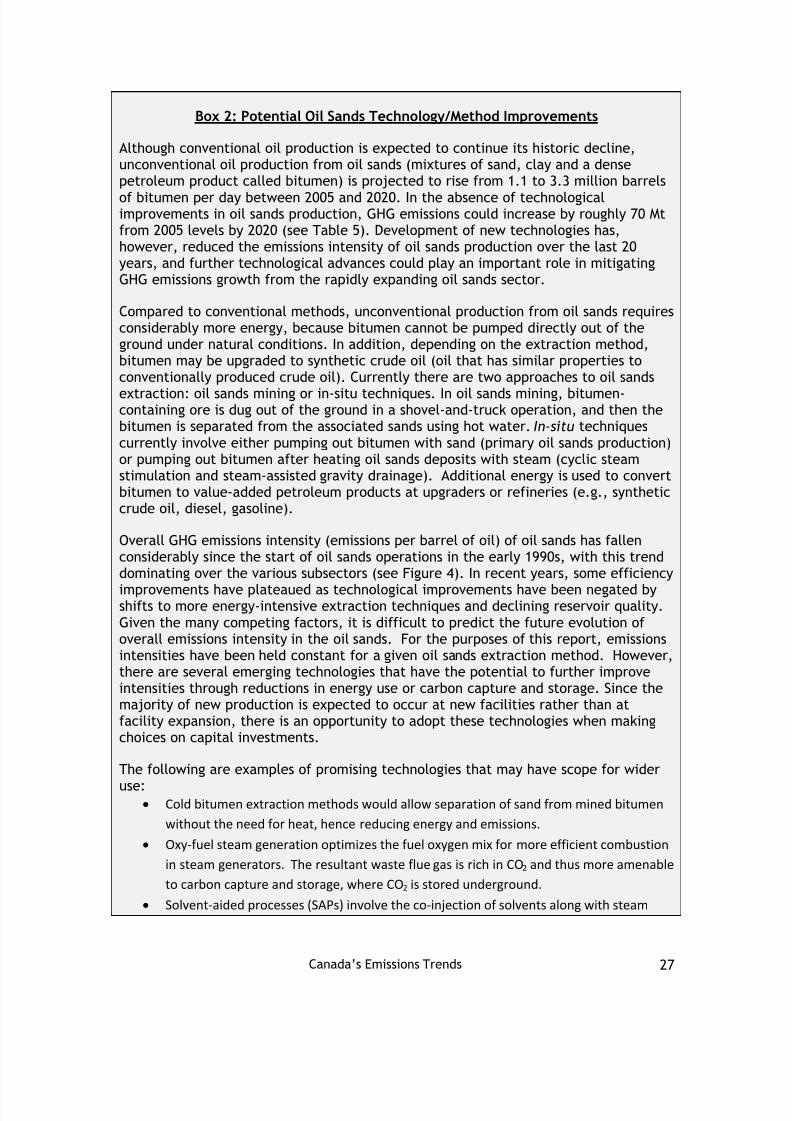
Box 2: Potential Oil Sands Technology/Method Improvements
Although conventional oil production is expected to continue its historic decline,unconventional oil production from oil sands (mixtures of sand, clay and a densepetroleum product called bitumen) is projected to rise from 1.1 to 3.3 million barrelsof bitumen per day between 2005 and 2020. In the absence of technologicalimprovements in oil sands production, GHG emissions could increase by roughly 70 Mtfrom 2005 levels by 2020 (see Table 5). Development of new technologies has,however, reduced the emissions intensity of oil sands production over the last 20years, and further technological advances could play an important role in mitigatingGHG emissions growth from the rapidly expanding oil sands sector.
Compared to conventional methods, unconventional production from oil sands requiresconsiderably more energy, because bitumen cannot be pumped directly out of theground under natural conditions. In addition, depending on the extraction method,bitumen may be upgraded to synthetic crude oil (oil that has similar properties toconventionally produced crude oil). Currently there are two approaches to oil sandsextraction: oil sands mining or in-situ techniques. In oil sands mining, bitumen-containing ore is dug out of the ground in a shovel-and-truck operation, and then thebitumen is separated from the associated sands using hot water. In-situ techniquescurrently involve either pumping out bitumen with sand (primary oil sands production)or pumping out bitumen after heating oil sands deposits with steam (cyclic steamstimulation and steam-assisted gravity drainage). Additional energy is used to convertbitumen to value-added petroleum products at upgraders or refineries (e.g., syntheticcrude oil, diesel, gasoline).
Overall GHG emissions intensity (emissions per barrel of oil) of oil sands has fallenconsiderably since the start of oil sands operations in the early 1990s, with this trenddominating over the various subsectors (see Figure 4). In recent years, some efficiencyimprovements have plateaued as technological improvements have been negated byshifts to more energy-intensive extraction techniques and declining reservoir quality.Given the many competing factors, it is difficult to predict the future evolution ofoverall emissions intensity in the oil sands. For the purposes of this report, emissionsintensities have been held constant for a given oil sands extraction method. However,there are several emerging technologies that have the potential to further improveintensities through reductions in energy use or carbon capture and storage. Since themajority of new production is expected to occur at new facilities rather than atfacility expansion, there is an opportunity to adopt these technologies when makingchoices on capital investments.
The following are examples of promising technologies that may have scope for wideruse:
Cold bitumen extraction methods would allow separation of sand from mined bitumenwithout the need for heat, hence reducing energy and emissions.Oxy-fuel steam generation optimizes the fuel oxygen mix for more efficient combustionin steam generators. The resultant waste flue gas is rich in CO 2 and thus more amenableto carbon capture and storage, where CO 2 is stored underground.Solvent-aided processes (SAPs) involve the co-injection of solvents along with steam

8/11/2019 1001-Canada's Emissions Trends 2013_e
http://slidepdf.com/reader/full/1001-canadas-emissions-trends-2013e 30/80
Canada’s Emissions Trends 28
into SAGD production wells to increase the fluidity of bitumen with less energy input.Infill wells are additional wells drilled between producing pairs of SAGD wells to increaseproduction with minimal additional steam inputs.Partial upgrading of in-situ bitumen can be carried out to eliminate the need for diluentfor transportation.
Although technological advances in oil sands extraction and processing will result inemissions intensity improvements, trends in absolute emissions will depend on thecombination of emissions intensity, production levels, and the resource quality. Forthe projections presented in this report, a conservative approach to the penetration ofthese new technologies in the oil sands sector has been applied.
Figure 4 - Historical Oil Sands Emissions Intensity (kg CO2-eq/barrel) (1990 – 2011)
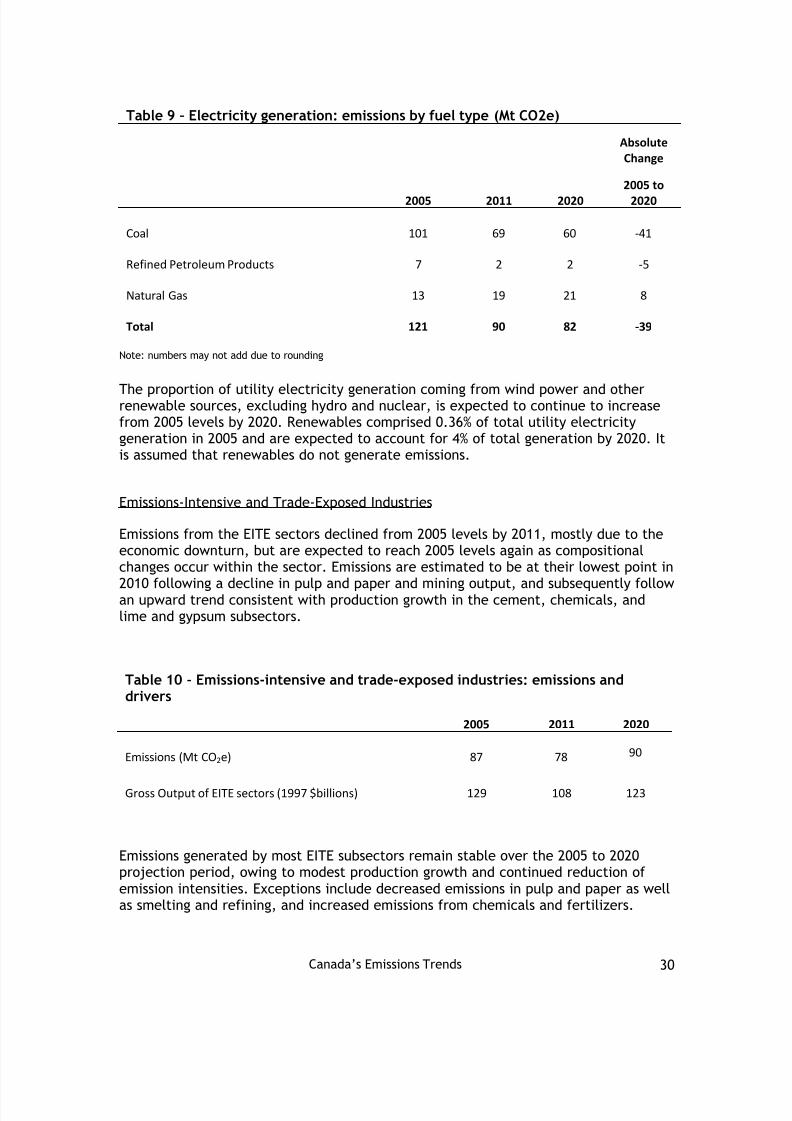
Electricity Generation
The recent downward trend in emissions from the electricity sector is expected tocontinue over the next decade as a result of various governmental initiatives. Onemeasure expected to contribute to the decline is the federal Emissions PerformanceStandard for coal-fired electricity generation. In September 2012 the Governmentreleased final regulations to reduce emissions from the coal-fired electricity sector.The regulations apply a stringent performance standard to new coal-fired electricitygeneration units and those coal-fired units that have reached the end of theireconomic life. The regulations come into effect on July 1, 2015. The government’s approach will foster a permanent transition towards lower or non-emitting types of

8/11/2019 1001-Canada's Emissions Trends 2013_e
http://slidepdf.com/reader/full/1001-canadas-emissions-trends-2013e 31/80
Canada’s Emissions Trends 29
generation such as high-efficiency natural gas and renewable energy. With thisregulation, Canada became the first major coal user to ban construction of traditionalcoal-fired electricity generation units. Canada already boasts one of the cleanestelectricity systems in the world, with three-quarters of our electricity supply emittingno greenhouse gases. These regulations further strengthen our position as a worldleader in clean electricity production.
Provincial measures that turn towards cleaner sources of power to meet electricitydemand are also expected to contribute to the decline in emissions in the electricitysector. Some initiatives being undertaken include the Ontario coal phase-out whichwill have all coal units in the province retired by the end of 2014. As well, Nova Scotiaaims to decrease greenhouse gas emissions in its electricity sector through a cap onemissions and through a renewable portfolio standard that will require 40% ofelectricity sales to come from renewable sources by 2020.
Table 8 outlines the decline in projected emissions alongside the expected increase inelectricity generation through 2020.
Table 8 – Electricity sector: emissions and drivers
2005 2011 2020
Emissions (Mt CO 2e) 121 90 82
Generation (Terawatt hours) 550 545 609
The increase in generation expected through 2020 will be powered from various fuelsources depending on the Canadian province and available resources. Although coalusage for electricity generation is declining, the proportion of power generation fromall fossil fuels is expected to vary following greater availability of electricity fromhydro, nuclear power, and renewable energy sources such as wind. 12 Hydro-powergeneration is expected to increase in most Canadian provinces.
On a national level, emissions from coal fired generation are projected to decline by41 Mt over the 2005 to 2020 time period. This represents 6% of total Canadianemissions in 2020. However, emissions from natural gas increase over this time-periodto fill in electricity generation requirements of an increasing demand as well as muchof the generation that had been fueled by coal. Emissions from natural gas increase by8 Mt over the 2005 to 2020 time period.
12 See Annex Table A.2.5 Electricity generation by fuel.
8/11/2019 1001-Canada's Emissions Trends 2013_e
http://slidepdf.com/reader/full/1001-canadas-emissions-trends-2013e 32/80
8/11/2019 1001-Canada's Emissions Trends 2013_e
http://slidepdf.com/reader/full/1001-canadas-emissions-trends-2013e 33/80
Canada’s Emissions Trends 31
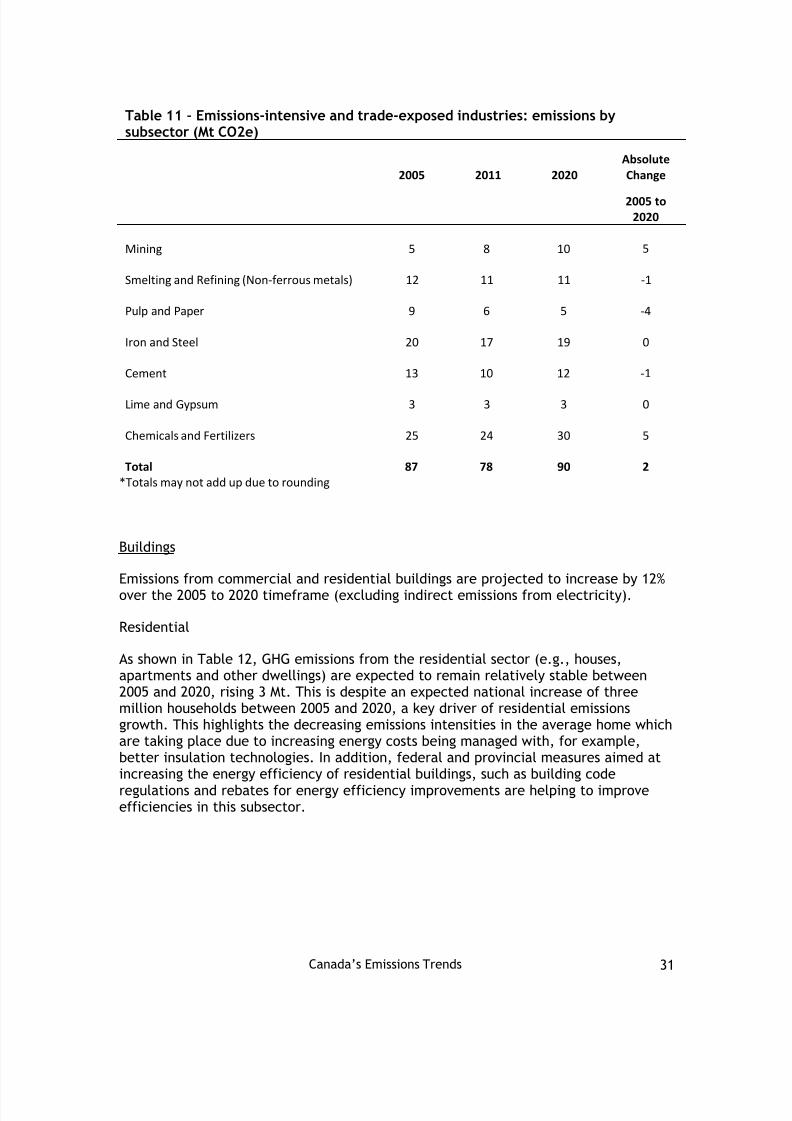
Table 11 – Emissions-intensive and trade-exposed industries: emissions bysubsector (Mt CO2e)
2005 2011 2020AbsoluteChange
2005 to2020
Mining 5 8 10 5
Smelting and Refining (Non-ferrous metals) 12 11 11 -1
Pulp and Paper 9 6 5 -4
Iron and Steel 20 17 19 0
Cement 13 10 12 -1
Lime and Gypsum 3 3 3 0
Chemicals and Fertilizers 25 24 30 5
Total 87 78 90 2*Totals may not add up due to rounding
Buildings
Emissions from commercial and residential buildings are projected to increase by 12%over the 2005 to 2020 timeframe (excluding indirect emissions from electricity).
Residential
As shown in Table 12, GHG emissions from the residential sector (e.g., houses,apartments and other dwellings) are expected to remain relatively stable between2005 and 2020, rising 3 Mt. This is despite an expected national increase of threemillion households between 2005 and 2020, a key driver of residential emissionsgrowth. This highlights the decreasing emissions intensities in the average home whichare taking place due to increasing energy costs being managed with, for example,better insulation technologies. In addition, federal and provincial measures aimed atincreasing the energy efficiency of residential buildings, such as building coderegulations and rebates for energy efficiency improvements are helping to improveefficiencies in this subsector.

8/11/2019 1001-Canada's Emissions Trends 2013_e
http://slidepdf.com/reader/full/1001-canadas-emissions-trends-2013e 34/80
Canada’s Emissions Trends 32
Table 12 – Residential sector: emissions and drivers
2005 2011 2020
Emissions (Mt CO 2e) 44 45 47
Households (millions) 12.7 13.9 15.6
Commercial Sector
GHG emissions from Canada’s commercial sector are expected to reach 48 Mt in 2020,an increase of 9 Mt from 2005 (Table 13). The economic downturn led to stableemissions in this subsector between 2005 and 2011, but these are expected to growduring the projection period due to an expansion of commercial floor space (theprincipal driver of emissions from this subsector) as the economy continues to grow.
Table 13 – Commercial sector: emissions and drivers
2005 2011 2020
Emissions (Mt CO 2e) 39 39 48
Floor space (millions m 2) 654 727 884
Agriculture
With respect to 2020 emissions projections, increased emissions from on-farm fuel useand crop production in the agriculture sector have been partially offset by decreasedemissions from livestock production since 2005. This decrease in livestock productionoccurred over the 2005 to 2011 timeframe as the number of animals decreased.However, since this initial decline, there is projected to be a gradual increase inemissions in line with an estimated increase in livestock production from 2011 to 2020.
Given these compositional trends, agriculture emissions are projected to remainrelatively stable reaching a total of 69 Mt in 2020.
8/11/2019 1001-Canada's Emissions Trends 2013_e
http://slidepdf.com/reader/full/1001-canadas-emissions-trends-2013e 35/80
Canada’s Emissions Trends 33
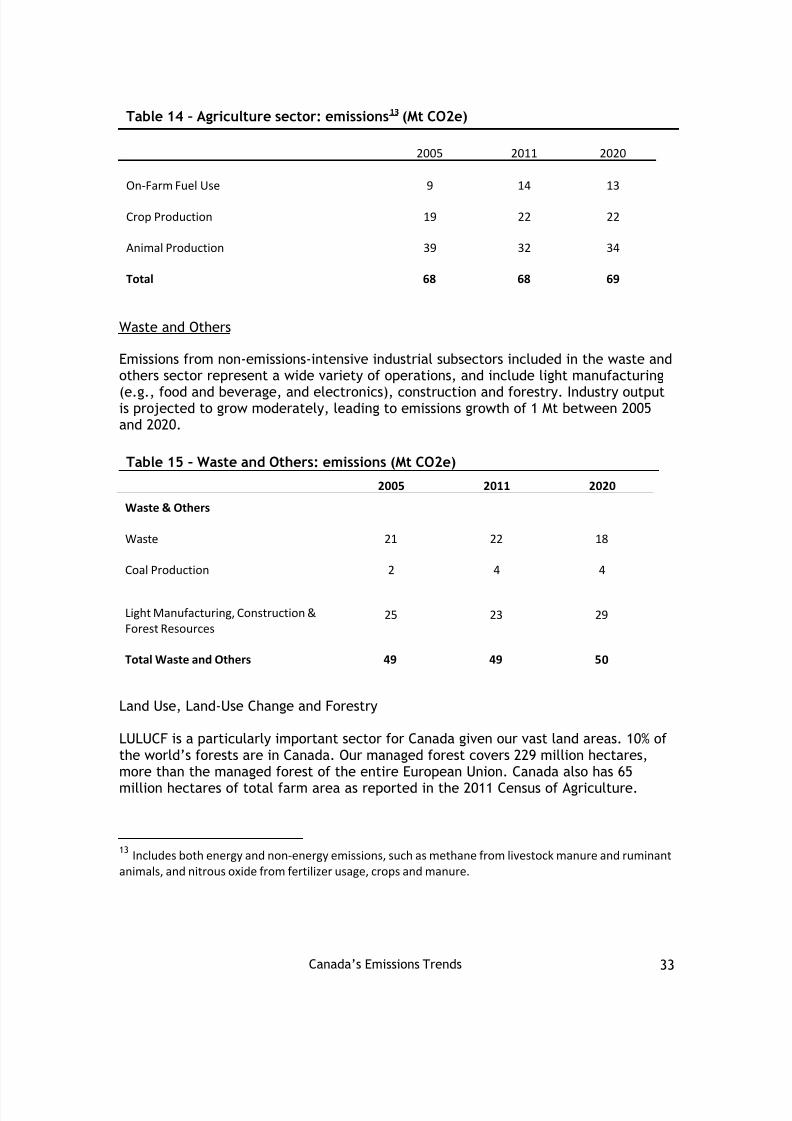
Table 14 – Agriculture sector: emissions 13 (Mt CO2e)
2005 2011 2020
On-Farm Fuel Use 9 14 13
Crop Production 19 22 22
Animal Production 39 32 34
Total 68 68 69
Waste and Others
Emissions from non-emissions-intensive industrial subsectors included in the waste andothers sector represent a wide variety of operations, and include light manufacturing
(e.g., food and beverage, and electronics), construction and forestry. Industry outputis projected to grow moderately, leading to emissions growth of 1 Mt between 2005and 2020.
Table 15 – Waste and Others: emissions (Mt CO2e)
2005 2011 2020
Waste & Others
Waste 21 22 18
Coal Production 2 4 4
Light Manufacturing, Construction &Forest Resources
25 23 29
Total Waste and Others 49 49 5 0
Land Use, Land-Use Change and Forestry
LULUCF is a particularly important sector for Canada given our vast land areas. 10% ofthe world’s forests are in Canada. Our managed forest covers 229 million hectares,more than the managed forest of the entire European Union. Canada also has 65million hectares of total farm area as reported in the 2011 Census of Agriculture.
13 Includes both energy and non-energy emissions, such as methane from livestock manure and ruminant animals, and nitrous oxide from fertilizer usage, crops and manure.

8/11/2019 1001-Canada's Emissions Trends 2013_e
http://slidepdf.com/reader/full/1001-canadas-emissions-trends-2013e 36/80
Canada’s Emissions Trends 34
A unique challenge in forecasting and accounting for LULUCF emissions and removalsresides in addressing the effects of natural disturbances (e.g., wildfires, insectinfestations such as the mountain pine beetle), which can result in significantvariations in the annual emission and removal estimates and generally cannot bepredicted for future years. The impact of natural disturbances also makes it difficultto discern the effects of improved management practices.
LULUCF emissions accounting represents only emissions/removals from managed lands.For example, the category of Forest Land Remaining Forest Land includes only thearea of forests that are managed for timber and non-timber resources (includingnational/provincial parks) or subject to fire projection. Managed lands can act eitheras a carbon sink (i.e., remove CO 2 from the atmosphere) or a GHG source (emit CO 2 and other GHGs to the atmosphere). For example, planting trees on non-forest land,removes carbon from the atmosphere as the trees grow, but conversion of forest landto other land uses (deforestation) will emit CO 2 and other greenhouse gases to theatmosphere due to decomposition or burning of the biomass.
The LULUCF projection estimates presented in the table below are modeled separatelyfrom the other sectors. Specifically, each sub-sector has been modeled by the relevantdepartment experts. In addition, the accounting approach used to measure progress inthe sector for the purpose of meeting the Copenhagen target of 17% below 2005 levelsis different from the other sectors described above. These methodologies aredescribed in more detail in Annex 1 of this report.
Table 16 - Projected emissions (+) or removals (-) from the LULUCF sector in2020( 1) (Mt CO2 eq)
(In Mt of GHGemissions/removals)
2005 Estimate/Reference Level
2020 ProjectedEmissions/Removals
Expected Contributionin 2020 Emissions
Forest Land RemainingForest Land
-107 (2) -133 -26
Cropland RemainingCropland (3)
-10 -9 1
Forest Land Converted toOther Land Categories (4)
18 15 (5) -4
Land Converted to ForestLand
-0.9 -0.4 0.6
Total -100 -128 -28(1) Numbers may not add due to rounding
(2) For Forest Land Remaining Forest Land, a 2020 reference level is used for determining the contribution.
(3) Cropland remaining Cropland includes residual emissions after 20 years from forest conversion to cropland
(4) Includes all emissions from the conversion of Forest Land to other categories, except residual emissions 20 yearsor more after the forests are converted to cropland
(5) Differences between these values and those reported in the NIR are due to the inclusion here of emissions fromthe conversion of forest to other land after 20 years or more, except in the case of conversion of forest to cropland

8/11/2019 1001-Canada's Emissions Trends 2013_e
http://slidepdf.com/reader/full/1001-canadas-emissions-trends-2013e 37/80
Canada’s Emissions Trends 35
Emissions by Province
Emissions vary significantly by province 14, driven by diversity in population size,economic activities, and resource base, among other factors. For example, provinceswhere the economy is oriented more toward resource extraction will tend to havehigher emission levels whereas more manufacturing or service-based economies tendto have lower emissions levels. Electricity generation sources also vary, with provincesthat rely on fossil fuels for their electricity generation having higher emissions thanprovinces that rely more on hydroelectricity. Table 17 shows the provincial/territorialdistribution of emissions in absolute terms as well as their per capita emissions.
Table 17 – Provincial and territorial GHG and per capita emissions: 2005 to 2011
GHG Emissions (Mt CO 2e) Per Capita Emissions (t/capita)2005 2011 2005 2011
British Columbia 64 59 15.3 12.8
Alberta 232 246 69.8 64.5
Saskatchewan 71 74 71.5 69.7
Manitoba 21 20 17.8 15.9
Ontario 206 171 16.4 12.8
Quebec 86 80 11.3 10.0
New Brunswick 20 19 26.9 24.6
Nova Scotia 23 20 24.9 21.6
Newfoundland 2 2 15.5 15.3
Prince Edward Island 10 9 19.2 18.3
Territories 2 2 21.9 17.7
Canada 737 702 22.9 20.4
14 While reported at the Provincial/Territorial level in Canada’s Emissions Trends report, emissions associated withammonia production as well as with the consumption of PFCs and SF6 (except for electric utilities) are only reportedat the national level in Canada’s National Inventory Report. As such differences in emissions totals may occur, if thesetotals are calculated by summing up provincial values

8/11/2019 1001-Canada's Emissions Trends 2013_e
http://slidepdf.com/reader/full/1001-canadas-emissions-trends-2013e 38/80
Canada’s Emissions Trends 36
Table 18 displays projected provincial and territorial GHG emissions from 2005 to2020. The projected emissions reflect a diversity of economic factors and governmentmeasures to reduce GHG emissions. These include public education campaigns, energyefficiency and renewable electricity programs, greening government operations,carbon taxes or levies, regulatory measures, and legislated renewable electricitytargets. 15
Table 18 – Provincial and territorial GHG emissions: 2005 to 2020 (Mt CO2e)
2005 2011 2020 Change
2005 to 2020
British Columbia 64 59 64 0
Alberta 232 246 295 63
Saskatchewan 71 74 74 2
Manitoba 21 20 22 1
Ontario 206 171 177 -29
Quebec 86 80 81 -5
New Brunswick 20 19 18 -2
Nova Scotia 23 20 16 -7
Prince Edward Island 2 2 2 0
Newfoundland 10 9 10 0
Territories 2 2 2 0
LULUCF NA NA -28 NA
Canada 737 702 734 -3
15 Although provincial and territorial governments have announced a diverse range of measures, onlymeasures that could be readily modeled or have an announced regulatory or budgetary dimension weremodeled. Aspirational goals and targets that were not supported by measurable, real and verifiableactions were not included.

8/11/2019 1001-Canada's Emissions Trends 2013_e
http://slidepdf.com/reader/full/1001-canadas-emissions-trends-2013e 39/80
Canada’s Emissions Trends 37
The provinces oriented toward resources extraction and/or that are highly reliant onfossil fuels for their electricity generation (i.e., Alberta, Saskatchewan, NewBrunswick and Nova Scotia) have per capita emissions above the national average. Theprovinces highly reliant on hydroelectricity or less emission-intensive sources for theirelectricity generation (i.e., Quebec, British Columbia, Ontario, Newfoundland andLabrador, and Manitoba) have per capita emissions below the national average.
Table 19 displays projected provincial and territorial per capita GHG emissions in2020, and compares them to actual emissions in 2005 and 2011. Per capita emissionsare projected to fall in all provinces in 2020 relative to 2005 levels.
Table 19 – Provincial and territorial per capita emissions: 2005 to 2020
2005 2011 2020
British Columbia 15.3 12.8 12.4
Alberta 69.8 64.5 64.9
Saskatchewan 71.5 69.7 61.2
Manitoba 17.8 15.9 15.8
Ontario 16.4 12.8 12.2
Quebec 11.3 10.0 9.4
New Brunswick 26.9 24.6 23.9
Nova Scotia 24.9 21.6 17.3
Prince Edward Island 15.5 15.3 13.0
Newfoundland 19.2 18.3 19.1
Territories 21.9 17.7 17.7
Canada 22.9 20.4 20.0

8/11/2019 1001-Canada's Emissions Trends 2013_e
http://slidepdf.com/reader/full/1001-canadas-emissions-trends-2013e 40/80

8/11/2019 1001-Canada's Emissions Trends 2013_e
http://slidepdf.com/reader/full/1001-canadas-emissions-trends-2013e 41/80
Canada’s Emissions Trends 39
Figure 5 – Projected GHG emissions under alternative economic assumptions
These sensitivities illustrate that Canada’s emissions projections should not beinterpreted as a precise prediction or forecast of our emissions, because, as outlinedabove, actual emissions will be determined by a range of as yet unknowndevelopments in key drivers. Rather, the projections should be viewed as oneplausible outcome for future emissions that provides a reference point for evaluatingthe impact of economic and technological developments, as well as assessing theimpact of future government measures.
It is important to note that the projection of emissions in this report is based onexisting government measures as of the spring of 2013 only, and does not reflect theimpact of further federal/provincial/territorial measures that are under developmentor that could be undertaken in the future. Likewise, specific federal, provincial andterritorial targets are not directly modeled in these scenarios.

8/11/2019 1001-Canada's Emissions Trends 2013_e
http://slidepdf.com/reader/full/1001-canadas-emissions-trends-2013e 42/80
Canada’s Emissions Trends 40
Table 20 – Sensitivity of emissions to changes in GDP and world oil price
(Mt CO2e)
Cases
2020 Change 2005 to 2020
Slow GDP – Low World Oil Prices 686 -51
Fast GDP – High World Oil Prices 773 36
Baseline Scenario 734 -3
Sensitivity Range (including all scenariosexamined – see Annex 3) 686 to 773 -51 to 36

8/11/2019 1001-Canada's Emissions Trends 2013_e
http://slidepdf.com/reader/full/1001-canadas-emissions-trends-2013e 43/80
Canada’s Emissions Trends 41
Box 3: Short-Lived Climate Pollutants
Short-lived climate pollutants (SLCPs) include black carbon (or soot), methane, tropospheric ozone andsome hydrofluorocarbons (HFCs). Reducing SLCPs has multiple benefits for human health, agriculture andecosystems, and also has the potential to reduce the rate of near-term warming expected under climatechange, because of SLCPs’ short lifetime in the atmosphere. Reducing SLCP emissions can help slow therate of near-term warming, both globally and in sensitive regions such as the Arctic.
Black carbon is a component of fine particulate matter (PM 2.5), which is produced during the burning ofbiomass and fossil fuels. Black carbon stays in the atmosphere for only several days to weeks, whereas CO
2
has an atmospheric lifetime of more than 100 years. Methane is another potent GHG and SLCP: the globalwarming potential used within this analysis of methane is 21, with an atmospheric lifetime of only 12years. Due to the potency of these short-lived pollutants, taking action to reduce these emissions can haverelatively rapid impacts on slowing the rate of climate change in the near term.
Although the climate impacts and mitigation actions for methane (CH4), HFCs and tropospheric ozone havebeen understood for some time, black carbon has only recently become a focus of attention for policymakers, and significant work has been done to identify its source. Black carbon is produced under variouscircumstances: open biomass burning, residential biofuel burned with traditional technologies (e.g.,woodstoves), stationary and mobile diesel engines, industrial processes, and fossil fuel combustion(including gas flaring).
Canada’s policies on GHGs under the sector -by-sector approach, and its new Air Quality ManagementSystem, are having an impact on SLCPs. For example, the performance standards for coal-fired electricitygeneration are expected to reduce particulate matter (PM 2.5) (and thus black carbon), as are the airpollution regulations for light- and heavy-duty diesel vehicles, in combination with low-sulphur-fuelstandards.
Canada is a founding partner of the Climate and Clean Air Coalition to Reduce Short-Lived ClimatePollutants, launched with the United Nations Environment Programme in February 2012. In 2013, Canadapledged a further $10 million in addition to its initial contribution of $3 million USD. Canada is engagedwith several initiatives under the Coalition that will lower SLCPs.
Canada is also engaged in other international fora and agreements to address SLCPs. These include theGothenburg Protocol, which was recently amended to include actions that will reduce black carbon; andthe Arctic Council, where negotiations for a new pan-Arctic arrangement to reduce emissions of blackcarbon and methane commence under Canada’s chairmanship. The Arcti c Council has also producedmitigation recommendations and is involved in scientific monitoring and modeling work in the Arctic, aswell as demonstration projects.
Table A.1.2 – Select Short Lived Climate Pollutants
killotonne 1990 1995 2000 2005 2010 2015 2020
CH4 3,425 4,089 4,474 4,670 4,310 4,280 4,042
HFCs 0.590 0.369 2.259 4.072 5.435 7.868 9.985
Black Carbon * 79 75 63 57 50 42 37
*Excluding open and natural sources.*Black Carbon emissions inventories and projections are still under development. These estimates are highly preliminary.*2011 is the last year of historical data for CH4 and HFCs; the last year of historical data for Black Carbon is 2007*Black carbon emissions from flaring in production processes from the oil and gas, industry and waste sectors, may not be fully reflected in theseemissions trends.*Further analysis is needed to determine the impact of government policies on black carbon emissions going forward (compared to how theyaffect particulate matter).

8/11/2019 1001-Canada's Emissions Trends 2013_e
http://slidepdf.com/reader/full/1001-canadas-emissions-trends-2013e 44/80
Canada’s Emissions Trends 42
Annex 1: The Land Use, Land-Use Change andForestry SectorImportance of the LULUCF Sector
The United Nations Framework Convention on Climate Change (UNFCCC) hasrecognized the important role of the land use, land-use change and forestry (LULUCF)sector in addressing climate change. The LULUCF sector involves greenhouse gas(GHG) fluxes between the atmosphere and Canada’s managed lands, as well as thoseassociated with land-use change. Globally, land use and land-use change wasresponsible for an estimated net carbon flux to the atmosphere of 1.14 GtC on averageper year over the 1990 to 2009 period, which comprised 12.5% of total anthropogeniccarbon emissions over the same period. 17
Globally, data suggest an overall decreasing trend in land-use change emissionsparticularly since 2000. Emissions from land-use change were 36% of the total human
emissions in 1960, 18% in 1990, and 9% in 2011. “ The implementation of new landpolicies, higher law enforcement to stop illegal deforestation, and new afforestationand regrowth of previously deforested areas could all have contributed to thisdecline ”18 .
Over the last two decades, important changes have occurred in land managementpractices in Canada that have reduced GHG emissions or enhanced their removals fromthe atmosphere. For example, farmers have increasingly adopted no-till practices andreduced field area under summerfallow, which contribute to a higher rate of soilcarbon sequestration.
Beneficial management practices have also been adopted by the forestry sector,
primarily as a result of provincial policies and/or regulations in their areas ofjurisdiction. Although these policies and regulations are aimed broadly at improvingsustainability in the sector, they can also reduce carbon emissions and increasesequestration. They include: relatively more reliance on tree planting as opposed tonatural regeneration; more use of improved seed stock for tree planting; more andfaster rehabilitation of harvest roads and landings; and adjustments in managementpractices to reduce soil compaction. Recently, economic factors have had a largeimpact on the forest sector: it experienced a 43% decline in harvest levels betweenthe peak year of 2004 and 2009, resulting in the lowest harvest since 1975 - althoughharvests recovered somewhat in 2010 and 2011 19 .
17 Houghton RA, House, JI, Pongratz J and others. 2012. Carbon emissions from land use and land-coverchange. Biogeosciences , 9, 5125–5142. 18 http://www.globalcarbonproject.org/carbonbudget/12/hl-full.htm 19 National Forestry Database Program, www.nfdp.ccfm.org .

8/11/2019 1001-Canada's Emissions Trends 2013_e
http://slidepdf.com/reader/full/1001-canadas-emissions-trends-2013e 45/80
Canada’s Emissions Trends 43
Accounting for the LULUCF Sector
At the 2011 UNFCCC Climate Conference in Durban, South Africa, countries agreed onrules for LULUCF accounting to be used by developed countries in the secondcommitment period of the Kyoto Protocol (i.e. 2013-2020). Challenges related tonatural disturbances had been the subject of considerable technical work andacknowledging that natural disturbances are out of human control, it was agreed inthe Durban rules that the impacts of natural disturbances can be removed inaccounting for forests. The rules also included improved accounting of emissions fromharvested wood products, and specified the use of Reference Levels for accounting forForest Management.
Changes from Canada’s Emissions Trends 2012
The 2012 Emissions Trends Report represented a key milestone for Canada as itincluded the LULUCF sector for the first time. This year, Canada continues to estimatea similar contribution arising from the LULUCF sector but sources of change in theestimates should be noted.
Changing the classification system away from activity based accounting (e.g.forest management) towards the accounting approach used in our NationalInventory Report (e.g. forest land remaining forest land). There are only slightdifferences between these two sets of classifications.
Updated data and methodological improvements. Projections have beenremodelled to take into account updated information and improved modelingconsistent with the 2013 NIR.
Change in the treatment of harvested wood products from Forest Conversionto Other Land Categories. The model used in the 2012 Emissions Trends Reportincluded delayed emissions from long-term carbon storage in wood productsresulting from forest conversion. However, the approach to calculatingemissions from wood products is currently being refurbished. Therefore, aninstant oxidation approach consistent with that used in the NIR was adopted forthis year’s report .
Technical corrections to the Reference Level. The Reference Level used for the
managed forest (Forest Land Remaining Forest Land) has been updated,
reflecting a process of technical correction outlined in the Durban LULUCF
agreement 20 .
Because of these changes, the UNFCCC category estimates reported this year willdiffer somewhat from the estimates for the Kyoto Protocol activities reported lastyear.
20 Decision 2/CMP.7, Annex paragraphs 14-15,http://unfccc.int/resource/docs/2011/cmp7/eng/10a01.pdf#page=11 .

8/11/2019 1001-Canada's Emissions Trends 2013_e
http://slidepdf.com/reader/full/1001-canadas-emissions-trends-2013e 46/80
8/11/2019 1001-Canada's Emissions Trends 2013_e
http://slidepdf.com/reader/full/1001-canadas-emissions-trends-2013e 47/80
Canada’s Emissions Trends 45
Each subsector’s contribution to Canada’s 2020 emissions reduction target is estimatedusing an accounting approach that compares projected business-as-usual 2020emissions/removals to 2005 emissions/removals, with the exception of Forest LandRemaining Forest Land, where 2020 projected emissions/removals are compared to a2020 Reference Level. As noted earlier, the Reference Level is an internationallyaccepted approach, one that is seen as a scientifically-credible approach to accountfor emissions and removals from managed forests.
The Durban agreement for LULUCF included Canada’s proposed R eference Level forthe 2013 to 2020 period 21 . As Canada’s target is focused on the single year of 2020, itis the 2020 value from the Reference Level time series that is used here (using thetechnically-corrected Reference Level discussed above). Use of the Reference Levelapproach allows factoring out of highly variable natural disturbance impacts, inaccordance with the process agreed at the UNFCCC 17 th Conference of the Parties inDurban, South Africa.
Canada’s work to analyze alternative accounting approaches is ongoing, and changesto the accounting approach may be made in future Emissions Trends reports. Inparticular, there remains uncertainty with respect to future approaches that may beincluded under a new climate change agreement that would be applied after 2020. Forexample, the United States uses a net-net approach to accounting for LULUCFemissions/removals where the sector is added into the national total in both the baseand target year just like the other economic sectors.
Subsector Emissions Trends and Methodologies
Further detail on Canadian emissions trends and methodologies used are provided foreach of the subsectors below:
Forest Land Remaining Forest Land. As per Table A.1.1, this subsectordominates the expected LULUCF contribution in 2020. Harvesting is the humanactivity with the most impact on emissions in this subsector. As already noted,harvest levels reached a 35-year low in 2009 before recovering somewhat in 2010and 2011. However, current projections suggest that harvests will remain belowthe recent average historical level used in estimating the Reference Level. Theprojected value for the Forest Land Remaining Forest Land contribution in 2020is derived by using these projected harvests to determine the expected sink in2020 and comparing that to the Reference Level. Both the projected sink in 2020and the Reference Level are derived using an assumption of no naturaldisturbances from 2012 onward except a low background level expected to occurevery year.
Land Converted to Forest Land. Given the low levels of new forest creation, itis not possible to identify any trends in the activity except that recent new forest
21 Canada’s submission on its reference level for 2013-2020 is described in a submission to the UNFCCC athttp://unfccc.int/bodies/awg-kp/items/5896.php .
8/11/2019 1001-Canada's Emissions Trends 2013_e
http://slidepdf.com/reader/full/1001-canadas-emissions-trends-2013e 48/80
Canada’s Emissions Trends 46
creation appears to be lower than in the 1990s. Data on creation of new forestsfor 2009 to 2011 are not available. Therefore it was assumed that the 2000 to2008 average rate in each ecozone in each province would be the business-as-usual rate in the future, totaling about 2,700 ha per year for Canada as a whole.Improvements in the data may be possible as there are indications that somecreation of new forest during the 2000s has not yet been reflected in the GHGinventory. Thus, the rate of new forest creation in the last decade may beunderestimated.
Cropland Remaining Cropland 22 . Soil carbon sequestration in Canada hasincreased from a rate of 2 Mt CO 2e per year in 1990 to 13 Mt CO 2e per year in2011 (NIR, 2013). This increase has been driven by several factors such as:increased uptake of no-till, reduced use of summerfallow and changing croppatterns. Estimates indicate that the rate of sequestration is expected todecline to 9 Mt CO 2e from 2011 to 2020 as a result of the soil sink approachingequilibrium and limited scope for additional practice adoption. For example, onmost of the land where using no-till makes economic sense, that practice isalready in use and it is assumed that there will be little additional uptake. Also,a significant portion of the land already in no-till will have been in that practicefor 20 years or more by 2020 and therefore approaching or at equilibrium. Therate of sequestration is expected to continue decreasing after 2020.
Forest Land Converted to other land categories. Current forest conversionrates in Canada are estimated at 46,000 hectares per year, down from 64,000hectares per year in 1990. Part of the emissions due to forest conversion occursimmediately upon the conversion event, while the remaining emissions takeplace over subsequent years and decades and are related to the rate of decay offorest material. Forest conversion emissions are projected to decline slightly to2020 relative to 2005. The circumstances surrounding forest conversion activitiesin Canada are extremely varied and involve a wide range of economic drivers(agriculture, urban expansion, resource extraction Figure A.1.1). As such, futurereports projections will be adjusted as a result of revised conditions for each ofthese sectors.
22 The land categories where changes were examined for estimating emissions beyond 2011 were: land inannual cropping, forage production and summerfallow.
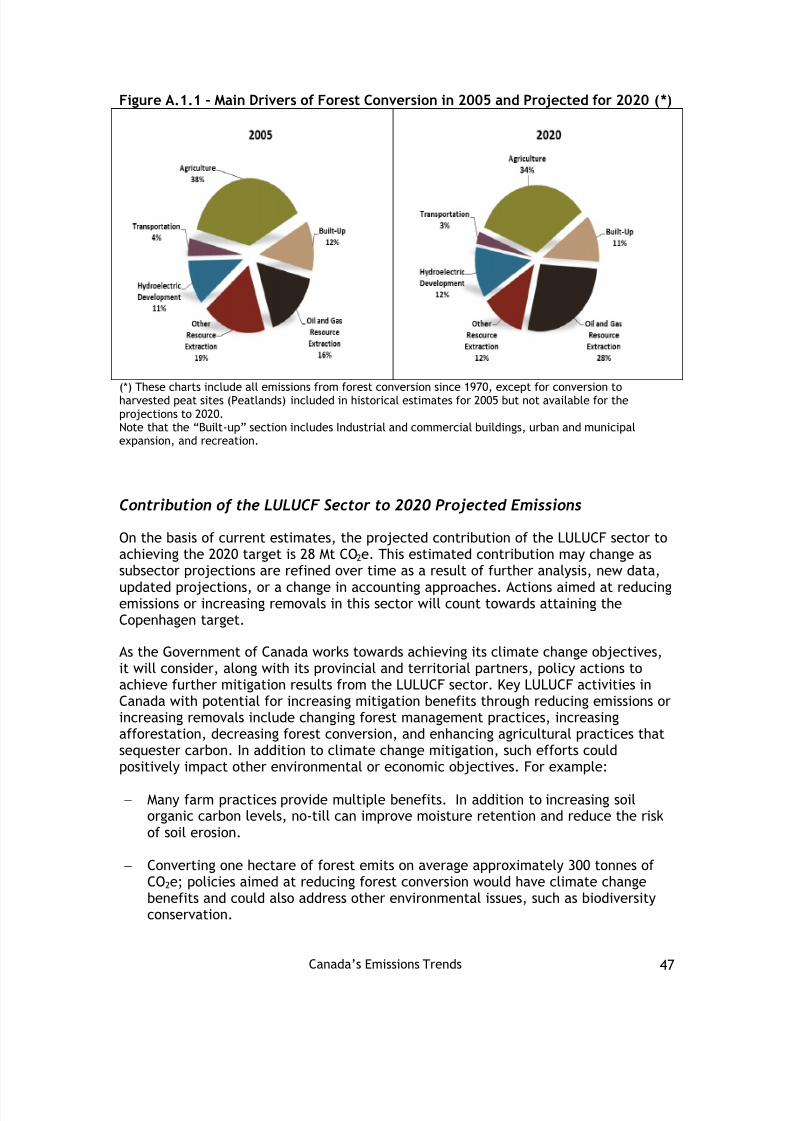
8/11/2019 1001-Canada's Emissions Trends 2013_e
http://slidepdf.com/reader/full/1001-canadas-emissions-trends-2013e 49/80
Canada’s Emissions Trends 47
Figure A.1.1 - Main Drivers of Forest Conversion in 2005 and Projected for 2020 ( *)
(*) These charts include all emissions from forest conversion since 1970, except for conversion toharvested peat sites (Peatlands) included in historical estimates for 2005 but not available for theprojections to 2020.Note that the “Built -up” section includes Industrial and commercial buildings, urban and municipalexpansion, and recreation.
Contribution of the LULUCF Sector to 2020 Projected Emissions
On the basis of current estimates, the projected contribution of the LULUCF sector toachieving the 2020 target is 28 Mt CO 2e. This estimated contribution may change assubsector projections are refined over time as a result of further analysis, new data,
updated projections, or a change in accounting approaches. Actions aimed at reducingemissions or increasing removals in this sector will count towards attaining theCopenhagen target.
As the Government of Canada works towards achieving its climate change objectives,it will consider, along with its provincial and territorial partners, policy actions toachieve further mitigation results from the LULUCF sector. Key LULUCF activities inCanada with potential for increasing mitigation benefits through reducing emissions orincreasing removals include changing forest management practices, increasingafforestation, decreasing forest conversion, and enhancing agricultural practices thatsequester carbon. In addition to climate change mitigation, such efforts couldpositively impact other environmental or economic objectives. For example:
Many farm practices provide multiple benefits. In addition to increasing soilorganic carbon levels, no-till can improve moisture retention and reduce the riskof soil erosion.
Converting one hectare of forest emits on average approximately 300 tonnes ofCO2e; policies aimed at reducing forest conversion would have climate changebenefits and could also address other environmental issues, such as biodiversityconservation.
8/11/2019 1001-Canada's Emissions Trends 2013_e
http://slidepdf.com/reader/full/1001-canadas-emissions-trends-2013e 50/80
Canada’s Emissions Trends 48
Annex 2: Baseline Data and AssumptionsKey Economic Drivers and Assumptions
Many factors influence the future trends of Canada’s GHG emissions. These key factors
include the pace of economic growth, as well as Canada’s population and householdformation, energy prices (e.g., world oil price and the price of refined petroleumproducts, regional natural gas prices, and electricity prices), technological change,and policy decisions. Varying any of these assumptions could have a material impacton the emissions outlook.
In constructing the emissions projections, Environment Canada developed alternativeviews of changes in certain key drivers (e.g., world oil price, the pace of economicgrowth) that result in a range of plausible emissions growth trajectories. The baselineemissions projections scenario represents the mid-range of these variations, butremains conditional on the future path of the economy, world energy markets andgovernment policy. The key assumptions and drivers are set out in this section. They
include:
Economic growth projections (Gross Domestic Product)Real disposable personal income projectionsConsumer price index projectionsHousehold formation projectionsLabour force projectionsWorld oil price projectionsNatural gas price projectionsOther energy price projectionsEnergy production and supply projectionsMajor energy investment outlooksMajor electricity supply projects (outlook)Emissions Factors
The emissions projections baseline scenario is designed to incorporate the bestavailable information about economic growth as well as energy demand and supplyinto the future. The projections capture the impacts of future production of goods andservices in Canada on GHG emissions. Alternative cases are explored in the sensitivityanalysis in Annex 3.
Historical data on gross domestic product and disposable personal income are providedfrom Statistics Canada. Consumer price index and population demographics are alsoproduced by Statistics Canada while historical emissions data are provided by the NIR. The economic projections to the year 2018 are calibrated to private sector projections
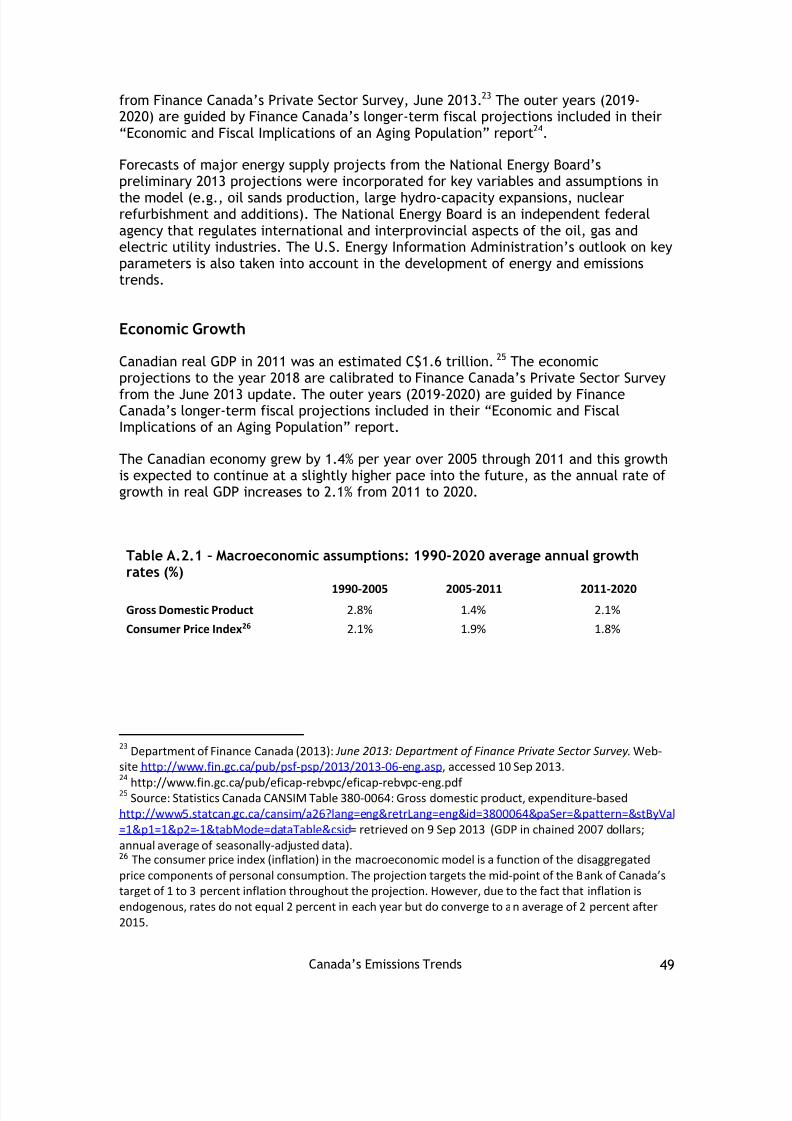
8/11/2019 1001-Canada's Emissions Trends 2013_e
http://slidepdf.com/reader/full/1001-canadas-emissions-trends-2013e 51/80
Canada’s Emissions Trends 49
from Finance Canada’s Private Sector Survey, June 2013. 23 The outer years (2019-
2020) are guided by Finance Canada’s longer -term fiscal projections included in their“Economic and Fiscal Implications of an Aging Population” report 24 .
Forecasts of major energy supply projects from the National Energy Board’spreliminary 2013 projections were incorporated for key variables and assumptions inthe model (e.g., oil sands production, large hydro-capacity expansions, nuclearrefurbishment and additions). The National Energy Board is an independent federalagency that regulates international and interprovincial aspects of the oil, gas andelectric utility industries. The U.S. Energy Information Administration’s outlook on keyparameters is also taken into account in the development of energy and emissionstrends.
Economic Growth
Canadian real GDP in 2011 was an estimated C$1.6 trillion. 25 The economicprojections to the year 2018 are calibrated to Finance Canada’s Private Sector Surveyfrom the June 2013 update. The outer years (2019-2020) are guided by FinanceCanada’s longer -term fiscal projections included in their “Economic and FiscalImplications of an Aging Population” report.
The Canadian economy grew by 1.4% per year over 2005 through 2011 and this growthis expected to continue at a slightly higher pace into the future, as the annual rate ofgrowth in real GDP increases to 2.1% from 2011 to 2020.
Table A.2.1 – Macroeconomic assumptions: 1990-2020 average annual growthrates (%)
1990-2005 2005-2011 2011-2020Gross Domestic Product 2.8% 1.4% 2.1%
Consumer Price Index 26 2.1% 1.9% 1.8%
23 Department of Finance Canada (2013): June 2013: Department of Finance Private Sector Survey . Web-site http://www.fin.gc.ca/pub/psf-psp/2013/2013-06-eng.asp , accessed 10 Sep 2013.24
http://www.fin.gc.ca/pub/eficap-rebvpc/eficap-rebvpc-eng.pdf 25 Source: Statistics Canada CANSIM Table 380-0064: Gross domestic product, expenditure-basedhttp://www5.statcan.gc.ca/cansim/a26?lang=eng&retrLang=eng&id=3800064&paSer=&pattern=&stByVal=1&p1=1&p2=-1&tabMode=dataTable&csid = retrieved on 9 Sep 2013 (GDP in chained 2007 dollars;annual average of seasonally-adjusted data). 26 The consumer price index (inflation) in the macroeconomic model is a function of the disaggregatedprice components of personal consumption. The projection targets the mid-point of the Bank of Canada’starget of 1 to 3 percent inflation throughout the projection. However, due to the fact that inflation isendogenous, rates do not equal 2 percent in each year but do converge to an average of 2 percent after2015.

8/11/2019 1001-Canada's Emissions Trends 2013_e
http://slidepdf.com/reader/full/1001-canadas-emissions-trends-2013e 52/80
Canada’s Emissions Trends 50
The growth in the labour force and changes in labour productivity influence thechanges in Canada’s real GDP. Labour productivity is expected to increase by anaverage of 1.2% annually between 2011 and 2020, an improvement over the 0.3%average annual growth during the period between 2005 and 2011.
Population Dynamics and DemographicsThe population size and its characteristics (e.g., age, sex, education, householdformation, among others), have important impacts on energy demand. Canada’soverall population is projected to grow on average at an annual rate of 1.1% between2011 and 2015, and by 1.1% per year between 2011 and 2020.
Major demographic factors that can have measurable impacts on energy consumptionare summarized below:
Household formation. This is the main determinant of energy use in theresidential sector. The number of households is expected to increase on
average by 1.3% per year between 2011 and 2020.
Labour force. This is expected to have a decelerating growth rate, reflectingthe aging population. Its annual average growth rate was on average 1.3% peryear between 2005 and 2011, and is projected to slow to 0.8% per yearbetween 2011 and 2020.
World Crude Oil Price
A major factor in projected GHG emissions is the assumption about future world oil
prices since this drives the level of production. Canada is a price taker in crude oilmarkets as its shares of world oil production and consumption are not large enough (4%and 2%, respectively) to significantly influence international oil prices. West TexasIntermediate (WTI) crude oil is used as an oil price benchmark. North American crudeoil prices are determined by international market forces and are most directly relatedto the WTI crude oil price at Cushing, Oklahoma, which is the underlying physicalcommodity market for light crude oil contracts for the New York Mercantile Exchange(NYMEX). The increase in North American supply and the resulting transportationbottleneck at Cushing have created a disconnect between the WTI and Brent crude oil,an often quoted international light oil benchmark. As such, the North American oilmarket is currently being priced differently from the rest of the world.
The emissions outlook’s reference case is anchored by the world oil price assumptionsdeveloped by the National Energy Board (preliminary expectations 2013). According tothe Board, the world crude oil price for WTI is projected to increase slightly fromabout US$80 per barrel of oil (bbl) in 2010 to about US$102/bbl in 2020. A higher pricescenario, in which 2020 prices are US$130/bbl, is used for the sensitivity analysis inAnnex 3. Under the higher price case, GHG emissions are expected to be lower.

8/11/2019 1001-Canada's Emissions Trends 2013_e
http://slidepdf.com/reader/full/1001-canadas-emissions-trends-2013e 53/80
Canada’s Emissions Trends 51
Figure A.2.1 – Crude oil price: WTI, and Alberta Heavy
Figure A.2.1 shows crude oil prices for light crude oil (WTI) and Heavy oil. Historicallythe price of heavy oil / bitumen (Alberta Heavy) has followed the light crude oil price
(WTI) at a discount of 50% to 60%. However, in 2008 and 2009 the differentialsbetween the prices of light and heavy crude oils (“bitumen/light -mediumdifferential”) narrowed significantly owing to a global shortage of heavier crude oilsupply. The bitumen/light-medium differential averaged 22% over the 2008 to 2009period, compared with 44% over the five-year average from 2003 to 2007.
Alberta’s Energy Resources Conservation Board expects the bitumen/light -mediumdifferential to average 26% over the forecast period, compared with the five-yearaverage of 36% and the 2009 average of 17%. 27
As shown in Figure A.2.2, the Henry Hub price for natural gas in Alberta (thebenchmark for Canadian prices) declined in 2010 to about four Canadian dollars per
gigajoule (GJ). In the projection, it begins to recover to reach about C$5.30 per GJ by2020, still well below its peak of over C$10 in 2005. This reflects the National EnergyBoard’s assumption that major pipeline expansions such as Mackenzie and Alaskapipelines may not occur before 2020 due to low natural gas prices.
27 http://www.ercb.ca/docs/products/STs/st98_current.pdf
0
20
40
60
80
100
120
1990 1995 2000 2005 2010 2015 2020
$ 2 0 1 0
( p e r
b a r r e
l i n C
$ )
Crude Oil Price:WTI and Alberta Heavy
WTI History WTI Emissions Trends 2013
Alberta Heavy (Hardisty) History Alberta Heavy (Hardisty) Emissions Trends 2013
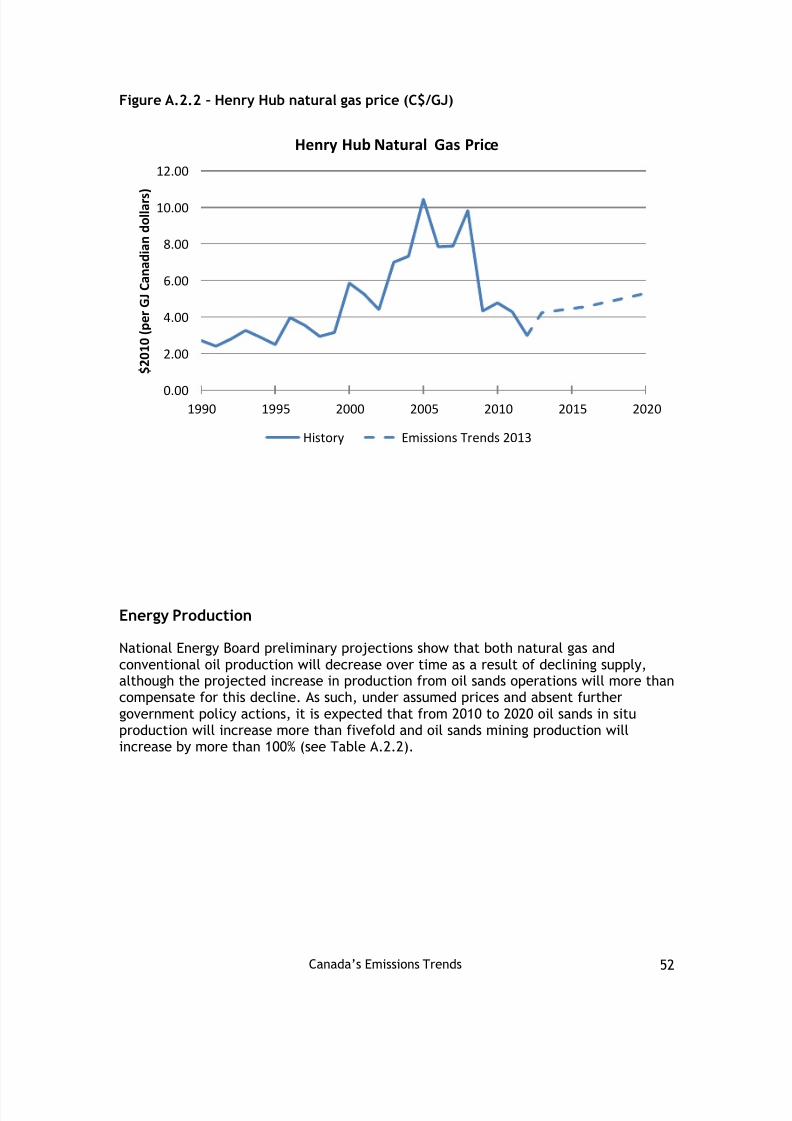
8/11/2019 1001-Canada's Emissions Trends 2013_e
http://slidepdf.com/reader/full/1001-canadas-emissions-trends-2013e 54/80
Canada’s Emissions Trends 52
Figure A.2.2 – Henry Hub natural gas price (C$/GJ)
Energy Production
National Energy Board preliminary projections show that both natural gas andconventional oil production will decrease over time as a result of declining supply,although the projected increase in production from oil sands operations will more thancompensate for this decline. As such, under assumed prices and absent furthergovernment policy actions, it is expected that from 2010 to 2020 oil sands in situproduction will increase more than fivefold and oil sands mining production willincrease by more than 100% (see Table A.2.2).
0.00
2.00
4.00
6.00
8.00
10.00
12.00
1990 1995 2000 2005 2010 2015 2020
$ 2 0 1 0
( p e r G J C a n a
d i a n
d o
l l a r s
)
Henry Hub Natural Gas Price
History Emissions Trends 2013
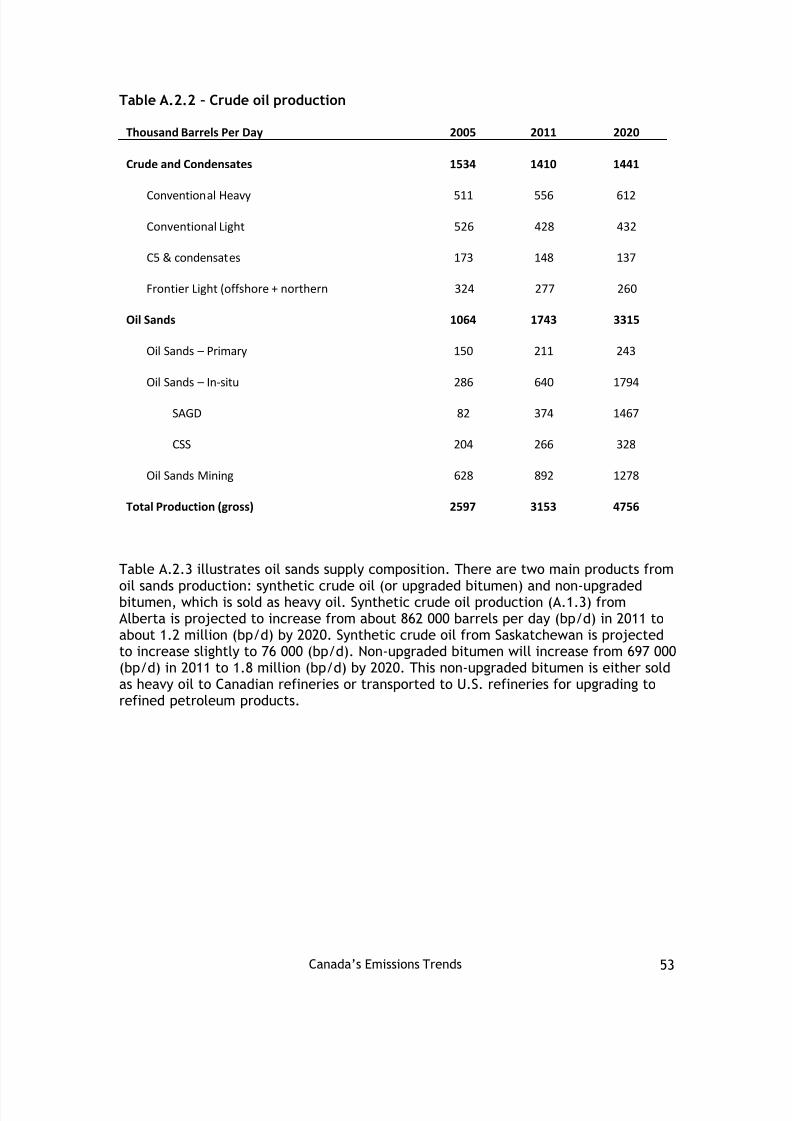
8/11/2019 1001-Canada's Emissions Trends 2013_e
http://slidepdf.com/reader/full/1001-canadas-emissions-trends-2013e 55/80

8/11/2019 1001-Canada's Emissions Trends 2013_e
http://slidepdf.com/reader/full/1001-canadas-emissions-trends-2013e 56/80
Canada’s Emissions Trends 54
Table A.2.3 - Oil Sands Disposition
Thousand Barrels Per Day 2005 2011 2020
Synthetic 610 932 1317
Non-upgraded Bitumen 368 697 1817
Oil Sands (net) 979 1,630 3,133
Own use 85 114 182
Oil Sands (gross) 1,064 1,743 3,316
Projections show gross natural gas production will decline to some 4.9 billion cubicfeet in 2020, as new production and non-conventional sources such as shale gas andcoal-bed methane come to market 28 but do not quite offset conventional declines. Theshale gas growth rate is projected to be 16% per year between 2011 and 2020 (NationalEnergy Board –preliminary estimates 2013).
Table A.2.4 - Natural Gas productionBillion Cubic Feet 2005 2011 2020
Supply
Gross Production 6984 5938 4861
Own-use Consumption 722 629 781
Marketable Gas 6262 5309 4081
Imports 346 1148 828
Total Supply 6608 6456 4908
Liquid Natural Gas Production 0 0 550
28 For the purposes of this document, shale gas development has been included under natural gasproduction (but not separately identified). As more data and information on likely shale gas productiontrends become available, consideration will be given to modeling shale gas separately.

8/11/2019 1001-Canada's Emissions Trends 2013_e
http://slidepdf.com/reader/full/1001-canadas-emissions-trends-2013e 57/80
Canada’s Emissions Trends 55
Taking into account these provincial/territorial utility expansion plans, plus additionalunits forecast to be built by the Energy, Emissions and Economy Model for Canada(E3MC) to meet growth in electricity demand, aggregate electricity generation is alsoexpected to increase substantially, by about 12% from 2011 to 2020, with fuel mixchanges as generation increases. As Table A.2.5 illustrates, the proportion ofgeneration coming from wind power and other renewable sources is expected toincrease from 2005 to 2020, starting at only about 0.3% in 2005 and reaching 4.5% oftotal generation by 2020. In addition, the proportion of natural-gas-fired generation isprojected to be 60% greater than 2005 levels.
Government actions, such as the introduction of the Electricity Performance Standard,will cause fuel switching in the overall electricity generating portfolio. As notedabove, it is expected that natural-gas-fired generation will increase 60% over its 2005levels by 2020 because of its appeal as a relatively cleaner source of power generationand a reliable means to cover peak loads. The lower natural gas price also makes it anattractive choice. Coal and petroleum coke generation are projected to fall from 18%of the generation in the Canadian portfolio in 2005 to 9.5% in 2020.
Table A.2.5 – Electricity generation by fuel , terawatts per hour (TWh)
2005 2011 2020
Coal and Petroleum Coke 97 66 58
Refined Petroleum Products 12 2 3
Natural Gas 25 37 40
Hydro 327 342 397
Nuclear 87 88 84
Other Renewables 2 10 28
Total Generation 550 545 609
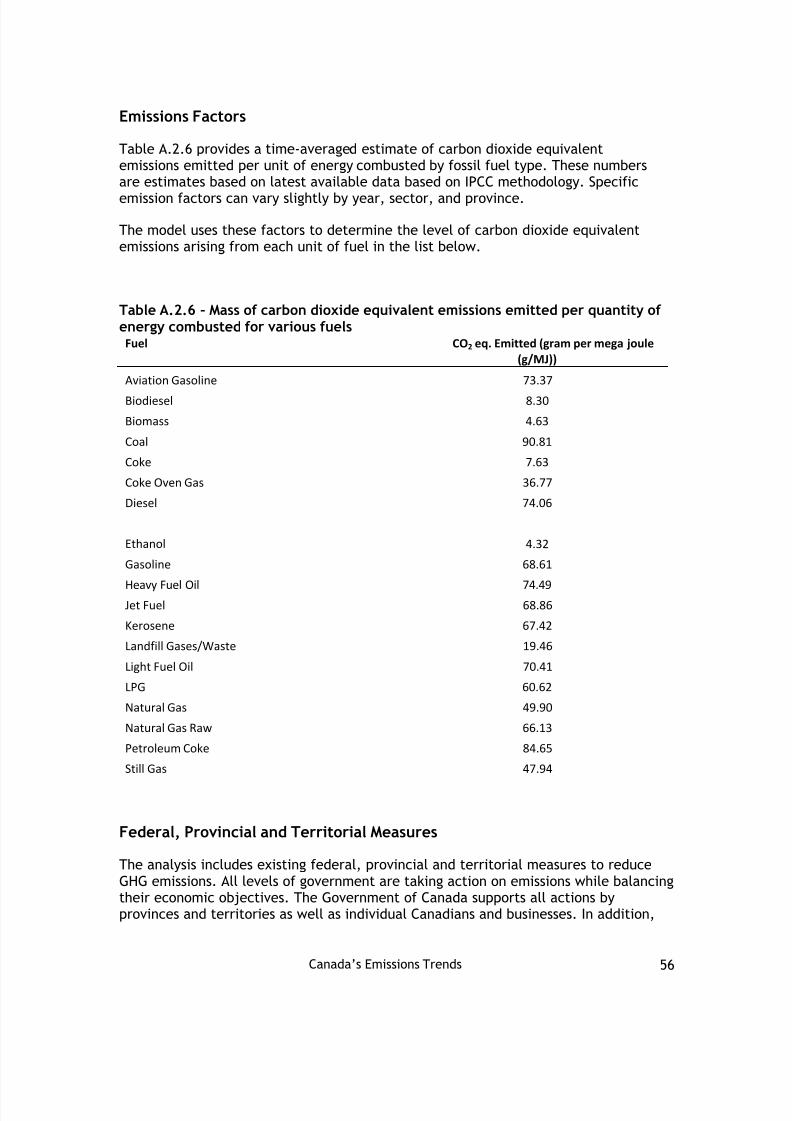
8/11/2019 1001-Canada's Emissions Trends 2013_e
http://slidepdf.com/reader/full/1001-canadas-emissions-trends-2013e 58/80
Canada’s Emissions Trends 56
Emissions Factors
Table A.2.6 provides a time-averaged estimate of carbon dioxide equivalentemissions emitted per unit of energy combusted by fossil fuel type. These numbersare estimates based on latest available data based on IPCC methodology. Specificemission factors can vary slightly by year, sector, and province.
The model uses these factors to determine the level of carbon dioxide equivalentemissions arising from each unit of fuel in the list below.
Table A.2.6 – Mass of carbon dioxide equivalent emissions emitted per quantity ofenergy combusted for various fuels
Fuel CO2 eq. Emitted (gram per mega joule(g/MJ))
Aviation Gasoline 73.37
Biodiesel 8.30
Biomass 4.63
Coal 90.81
Coke 7.63
Coke Oven Gas 36.77
Diesel 74.06
Ethanol 4.32
Gasoline 68.61
Heavy Fuel Oil 74.49Jet Fuel 68.86
Kerosene 67.42
Landfill Gases/Waste 19.46
Light Fuel Oil 70.41
LPG 60.62
Natural Gas 49.90
Natural Gas Raw 66.13
Petroleum Coke 84.65
Still Gas 47.94
Federal, Provincial and Territorial Measures
The analysis includes existing federal, provincial and territorial measures to reduceGHG emissions. All levels of government are taking action on emissions while balancingtheir economic objectives. The Government of Canada supports all actions byprovinces and territories as well as individual Canadians and businesses. In addition,

8/11/2019 1001-Canada's Emissions Trends 2013_e
http://slidepdf.com/reader/full/1001-canadas-emissions-trends-2013e 59/80
Canada’s Emissions Trends 57
the Government is taking action of its own and following its sector-by-sector approachto regulatory development.
Since 2006, the Government of Canada has invested more than $10 billion to reduceGHG emissions and support clean energy technologies through investments in greeninfrastructure, energy efficiency, clean energy technologies and the production ofcleaner energy and fuels. These include expenditures through the ecoENERGYinitiatives, Clean Energy Fund, Green Infrastructure Fund, Public Transit Tax Credit,Marine Shore Power Program, biofuels and bioproducts initiatives and programs,National Vehicle Scrappage Program, and the National Renewable DieselDemonstration Initiative, to name just a few.
In addition, regulations are being enacted to reduce emissions from key sources, andjoint initiatives and investments have been undertaken with the provinces andterritories to assist them in addressing their unique challenges and to facilitatecoordinated approaches.
Table A.2.7 below identifies the major federal, provincial and territorial measuresthat are included in the Canada’s Emissions Trends ’ reference case. It includes federalmeasures that have been implemented or announced in detail as of May 2013. Whereprogram funding is set to end, the projections assume that the impacts of theseprograms, other than those embodied in consumer behaviour and long-lived assets,cease when the approved funding terminates.
The analysis also includes existing provincial and territorial measures. EnvironmentCanada involves provinces and territories in extensive consulations to ensure theirinitiatives are accounted for in analysis and modeling of emissions trends. For thepurposes of this report, provincial/territorial measures announced and fullyimplemented as of May 2013 have been included wherever possible.
Although the emissions outlook’s baseline scenario includes existing measures thathave been implemented or announced in detail, it does not take into account theimpact of broader strategies or future measures within existing plans where significantdetails are still under development.
The following are select federal government measures that have been included in thebaseline scenario:
1. Performance standard for coal-fired electricity generation: In June 2010, theGovernment of Canada announced its intention to regulate coal-fired electricitygeneration. The regulations impose a performance standard on new coal-firedelectricity generation units, and on units that have reached the end of economic
life. The new regulations, which are scheduled to take effect in 2015, willencourage electric utilities to transition towards lower- or non-emitting types ofgeneration. The proposed regulations send a critical signal to industry in advanceof capital stock turnover, which is expected to be significant. By affecting currentcapital investment decisions, these regulations will prevent the building of higher-emitting facilities in the future. The gradual phase-out of old and dirty coal units isexpected to significantly reduce emissions from the electricity generation sectorand improve air quality for all Canadians.

8/11/2019 1001-Canada's Emissions Trends 2013_e
http://slidepdf.com/reader/full/1001-canadas-emissions-trends-2013e 60/80
Canada’s Emissions Trends 58
2. Passenger Automobile and Light Truck Greenhouse Gas Emission Regulations : InOctober 2010, the Government published its final Passenger Automobile and LightTruck Greenhouse Gas Emission Regulations , which establish progressivelystringent standards, harmonized with the United States, for GHG emissions fromnew cars and light trucks for the 2011 to 2016 model years. The Government alsopublished a Notice of Intent for Phase 2 of the regulations in order to developmore stringent GHG emissions standards for light-duty vehicles of model years 2017to 2025.
3. Renewable Fuels Regulations : In 2006, as part of the Renewable Fuels Strategy,the Government of Canada announced its intention to regulate an annual averagerenewable fuel content of 5% in gasoline by 2010, and, in a second phase, a 2%requirement for renewable content in diesel fuel by 2011.
4. Energy efficiency regulations, codes and standards for buildings and homes: TheGovernment continues to update and strengthen energy efficiency standards forproducts under the Energy Efficiency Act , and is working with provinces to updatethe National Energy Code of Canada for Buildings. These actions, combined withtargeted incentive programs, have proven to be effective at reducing energy useand GHG emissions in this sector.

8/11/2019 1001-Canada's Emissions Trends 2013_e
http://slidepdf.com/reader/full/1001-canadas-emissions-trends-2013e 61/80
Canada’s Emissions Trends 59
Table A.2.7. – GHG Measures reflected in projections (in place May 2013)
Provincial/Territorial Measures Federal Measures
Alberta- Specified Gas Emitters Program (SGER)
British Columbia- BC Carbon Tax- Renewable Fuels tax exemptions forminimum ethanol and biodiesel content- BC Emissions Offsets Regulations- Landfill Gas Management Regulation
Manitoba- Renewable Fuels provincial taxcredit/exemption for minimum ethanolcontent
Nova Scotia- Nova Scotia Renewable Portfolio Standard forelectric generation- Electric Demand-Side Management policiesfor Nova Scotia- Solid Waste Management ResourcesManagement Strategy
Ontario- Ontario Residential Electric Peak Savings(Time-of-Use pricing)- Ontario Feed-In Tariff Program- Provincial Commercial Building Code changes
for process efficiency improvements- Landfill Gas Regulation (O. Reg. 216/08 and217/08)- Ontario Coal Phase-Out Program
Quebec- Renewable Fuels tax reimbursement/incometax credit- Quebec and California WCI Cap and Tradesystem- Quebec’s Carbon Levy - Landfill Gas Regulation (Règlement surl'enfouissement et l'incinération de matières
résiduelles)Saskatchewan- Renewable fuels distributor tax credit forethanol produced and consumed in theprovince
- Performance standard for coal-firedelectricity generation
- Residential Building Code changes for energyefficiency (EnerGuide-80 or R-2000 level)applying to all provinces
- Renewable Fuel Content Regulation
- Adoption of the National Energy Code forBuilding of Canada 2011, or its equivalent, byall provinces and territories, except North-West-Territories, by 2016
- Commercial appliance efficiency
improvements (excludes lighting)- Residential appliance efficiencyimprovements. Includes refrigeration,freezers, range and dryers
- Industry Expansion of CIPEC (CanadianIndustry Program for Energy Conservation)including ISO and CSA certification programs
- Light Duty Vehicles 1 (LDV-1) GHG emissionsstandards for the light-duty vehicle modelyears 2011 to 2016
- Light Duty Vehicles 2 (LDV-2) GHG emissionsstandards increases stringency for modelyears 2017 to 2025
- Heavy Duty Vehicles (HDV) Regulation forgreater stringency on GHG emissions fromheavy-duty truck vehicle years 2014 to 2018
- The Pulp and Paper Green TransformationProgram (PPGTP), to improve environmentalperformance of mills including GHG emissionsreductions. The program ended in 2012 but
resulted in on-going emission reductions.- Public Transit Subsidy income tax credit fortransit passes and subsidy to all levels ofgovernment to improve public transit servicein communities. Includes standards forrenewable fuels
- Incandescent Lighting Phase-Out Program
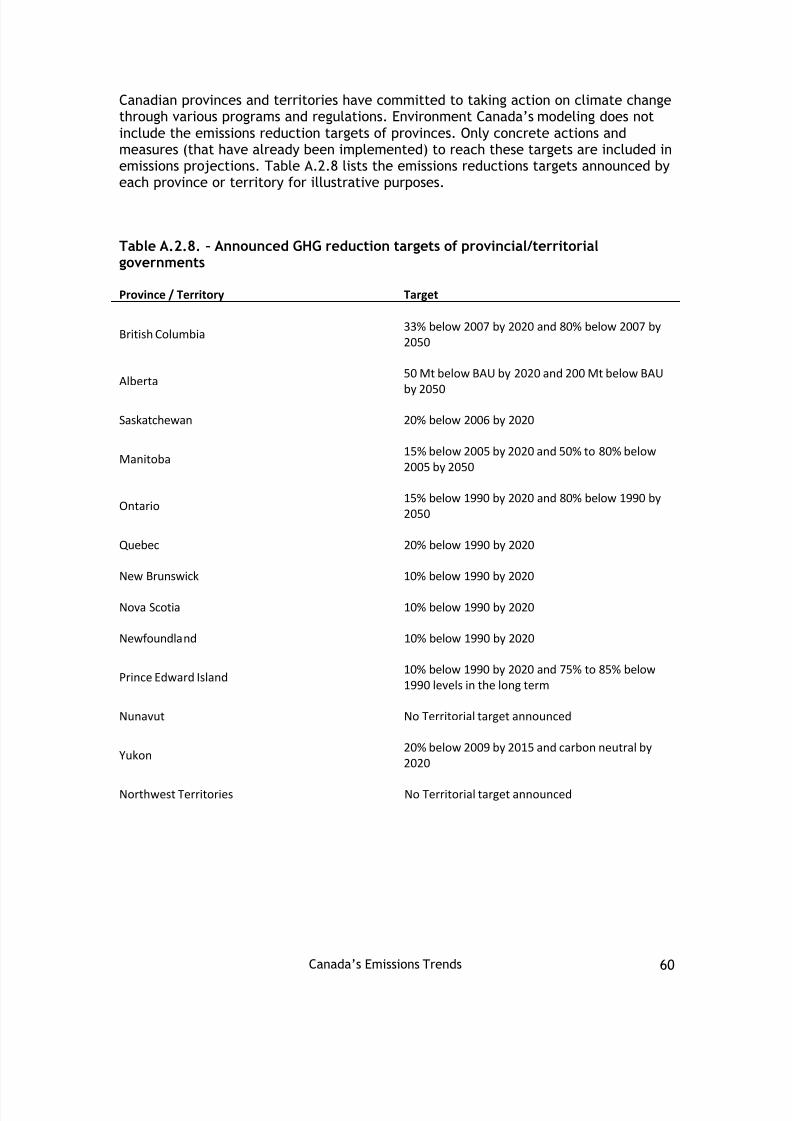
8/11/2019 1001-Canada's Emissions Trends 2013_e
http://slidepdf.com/reader/full/1001-canadas-emissions-trends-2013e 62/80
Canada’s Emissions Trends 60
Canadian provinces and territories have committed to taking action on climate changethrough various programs and regulations. Environment Canada’s modeling does notinclude the emissions reduction targets of provinces. Only concrete actions andmeasures (that have already been implemented) to reach these targets are included inemissions projections. Table A.2.8 lists the emissions reductions targets announced byeach province or territory for illustrative purposes.
Table A.2.8. – Announced GHG reduction targets of provincial/territorialgovernments
Province / Territory Target
British Columbia 33% below 2007 by 2020 and 80% below 2007 by2050
Alberta50 Mt below BAU by 2020 and 200 Mt below BAU
by 2050
Saskatchewan 20% below 2006 by 2020
Manitoba15% below 2005 by 2020 and 50% to 80% below2005 by 2050
Ontario15% below 1990 by 2020 and 80% below 1990 by2050
Quebec 20% below 1990 by 2020
New Brunswick 10% below 1990 by 2020
Nova Scotia 10% below 1990 by 2020
Newfoundland 10% below 1990 by 2020
Prince Edward Island10% below 1990 by 2020 and 75% to 85% below1990 levels in the long term
Nunavut No Territorial target announced
Yukon20% below 2009 by 2015 and carbon neutral by2020
Northwest Territories No Territorial target announced
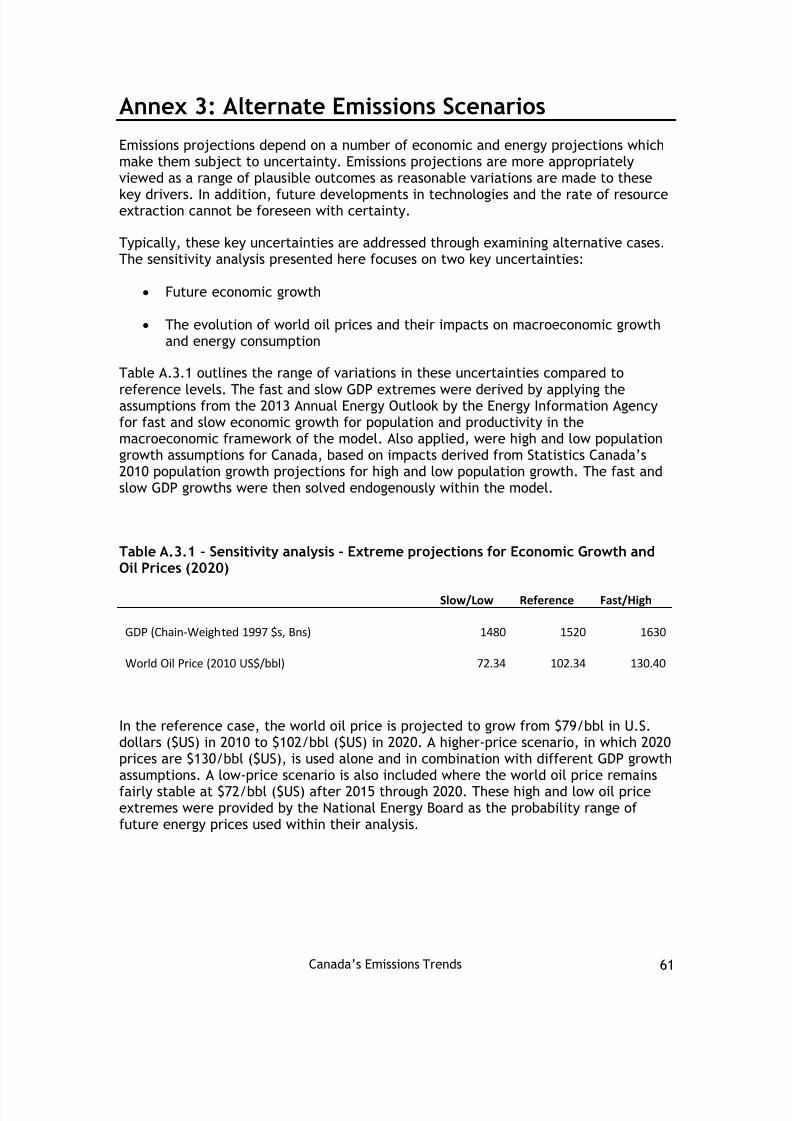
8/11/2019 1001-Canada's Emissions Trends 2013_e
http://slidepdf.com/reader/full/1001-canadas-emissions-trends-2013e 63/80
Canada’s Emissions Trends 61
Annex 3: Alternate Emissions ScenariosEmissions projections depend on a number of economic and energy projections whichmake them subject to uncertainty. Emissions projections are more appropriatelyviewed as a range of plausible outcomes as reasonable variations are made to these
key drivers. In addition, future developments in technologies and the rate of resourceextraction cannot be foreseen with certainty.
Typically, these key uncertainties are addressed through examining alternative cases.The sensitivity analysis presented here focuses on two key uncertainties:
Future economic growth
The evolution of world oil prices and their impacts on macroeconomic growthand energy consumption
Table A.3.1 outlines the range of variations in these uncertainties compared to
reference levels. The fast and slow GDP extremes were derived by applying theassumptions from the 2013 Annual Energy Outlook by the Energy Information Agencyfor fast and slow economic growth for population and productivity in themacroeconomic framework of the model. Also applied, were high and low populationgrowth assumptions for Canada, based on impacts derived from Statistics Canada’s2010 population growth projections for high and low population growth. The fast andslow GDP growths were then solved endogenously within the model.
Table A.3.1 – Sensitivity analysis – Extreme projections for Economic Growth andOil Prices (2020)
Slow/Low Reference Fast/High
GDP (Chain-Weighted 1997 $s, Bns) 1480 1520 1630
World Oil Price (2010 US$/bbl) 72.34 102.34 130.40
In the reference case, the world oil price is projected to grow from $79/bbl in U.S.dollars ($US) in 2010 to $102/bbl ($US) in 2020. A higher-price scenario, in which 2020prices are $130/bbl ($US), is used alone and in combination with different GDP growthassumptions. A low-price scenario is also included where the world oil price remainsfairly stable at $72/bbl ($US) after 2015 through 2020. These high and low oil priceextremes were provided by the National Energy Board as the probability range offuture energy prices used within their analysis.

8/11/2019 1001-Canada's Emissions Trends 2013_e
http://slidepdf.com/reader/full/1001-canadas-emissions-trends-2013e 64/80
Canada’s Emissions Trends 62
Figure A.3.1 illustrates how differing price and GDP growth assumptions might impactCanadian GHG emissions through 2020. Under the scenarios that affect only one driverindependently of the other, GHG emissions in 2020 range from 718 Mt to 749 Mt, underthe low world oil price and fast GDP growth cases respectively.
Figure A.3.1 – Projected GHG emissions under full range of alternative economicassumptions (independent changes to variables)
Figure A.3.2 illustrates how differing price and GDP growth assumptions incombination, might impact Canadian GHG emissions through 2020. Under the fast andhigh scenario which combines high world oil prices with fast growth in GDP emissionscould reach 773 Mt including the contribution from LULUCF 29 . Alternatively, under ascenario with slower GDP growth (average growth of 2.0% between 2010 and 2020) andlower world oil prices (29% lower than the reference case in 2020), emissions could beas low as 686 Mt.
29 No sensitivity analysis was performed on the Land-Use Land-Use-Change and Forestry Sector. As such,emissions from this sector are assumed to be constant in all scenarios.
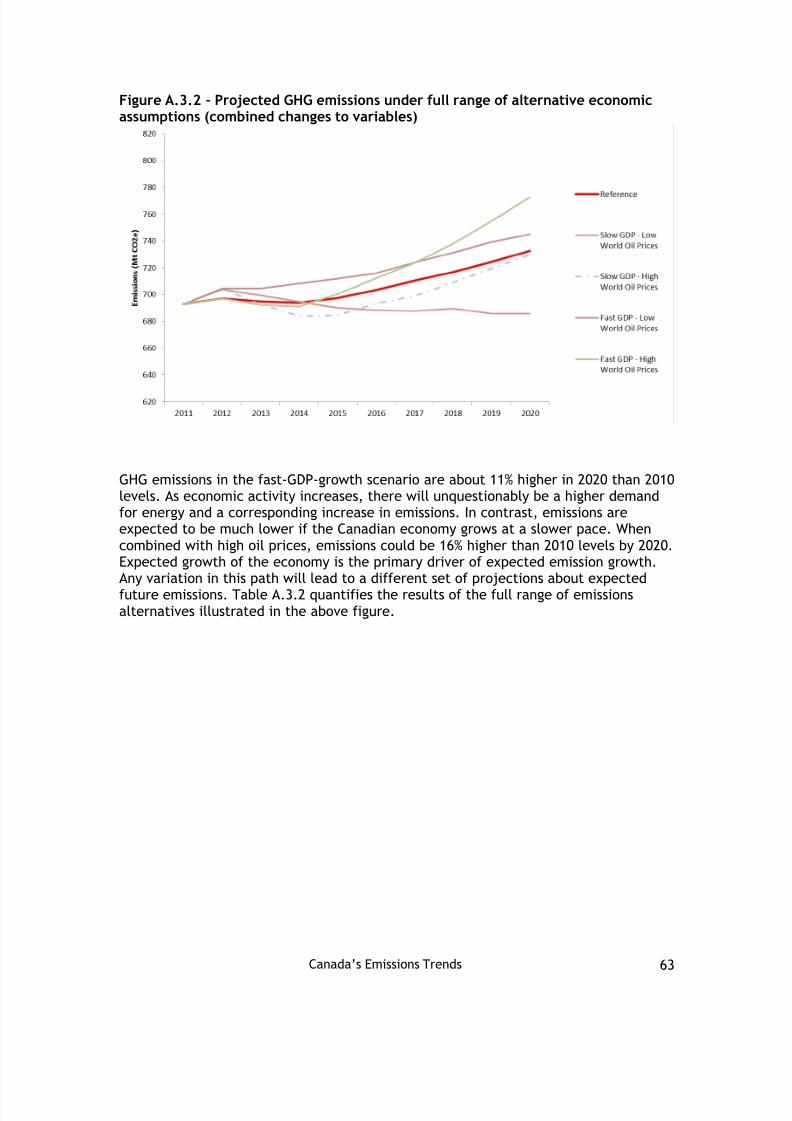
8/11/2019 1001-Canada's Emissions Trends 2013_e
http://slidepdf.com/reader/full/1001-canadas-emissions-trends-2013e 65/80
Canada’s Emissions Trends 63
Figure A.3.2 – Projected GHG emissions under full range of alternative economicassumptions (combined changes to variables)
GHG emissions in the fast-GDP-growth scenario are about 11% higher in 2020 than 2010levels. As economic activity increases, there will unquestionably be a higher demandfor energy and a corresponding increase in emissions. In contrast, emissions areexpected to be much lower if the Canadian economy grows at a slower pace. Whencombined with high oil prices, emissions could be 16% higher than 2010 levels by 2020.Expected growth of the economy is the primary driver of expected emission growth.Any variation in this path will lead to a different set of projections about expectedfuture emissions. Table A.3.2 quantifies the results of the full range of emissionsalternatives illustrated in the above figure.

8/11/2019 1001-Canada's Emissions Trends 2013_e
http://slidepdf.com/reader/full/1001-canadas-emissions-trends-2013e 66/80
8/11/2019 1001-Canada's Emissions Trends 2013_e
http://slidepdf.com/reader/full/1001-canadas-emissions-trends-2013e 67/80
8/11/2019 1001-Canada's Emissions Trends 2013_e
http://slidepdf.com/reader/full/1001-canadas-emissions-trends-2013e 68/80

8/11/2019 1001-Canada's Emissions Trends 2013_e
http://slidepdf.com/reader/full/1001-canadas-emissions-trends-2013e 69/80
Canada’s Emissions Trends 67
E3MC has two components: Energy 2020, which incorporate s Canada’s energy supplyand demand structure; and the in-house macroeconomic model of the Canadianeconomy.
Energy 2020 is an integrated, multi-region, multi-sector North American modelthat simulates the supply of, price of, and demand for all fuels. The model candetermine energy output and prices for each sector, both in regulated andunregulated markets. It simulates how such factors as energy prices andgovernment measures affect the choices that consumers and businesses makewhen they buy and use energy. The model’s outputs include changes in energy use,energy prices, GHG emissions, investment costs, and possible cost savings frommeasures, in order to identify the direct effects stemming from GHG reductionmeasures. The resulting savings and investments from Energy 2020 are then usedas inputs into the macroeconomic model.
The in-house macroeconomic model is used to examine consumption, investment,production, and trade decisions in the whole economy. It captures the interactionamong industries, as well as the implications for changes in producer prices,relative final prices, and income. It also factors in government fiscal balances,monetary flows, and interest and exchange rates. More specifically, themacroeconomic model incorporates 133 industries at a provincial and territoriallevel. It also has an international component to account for exports and imports,covering about 100 commodities. The macroeconomic model projects the directimpacts on the economy's final demand, output, employment, price formation, andsectoral income that result from various policy choices. These, in turn, permit anestimation of the effect of climate change policy and related impacts on thenational economy.
E3MC develops projections using a market-based approach to energy analysis. For eachfuel and consuming sector, the model balances energy supply and demand, accountingfor economic competition among the various energy sources. This ensures consistentresults among the sectors and regions. The model can be operated in a forecastingmode or an analytical mode. In forecasting mode, the model generates an annualenergy and emissions outlook to 2050. In analytical mode, it assesses broad policyoptions, specific programs or regulations, new technologies, or other assumptions.
The model’s primary outputs are tables showing energy consumption, production andprices by fuel type, year and region. The model also identifies many of the keymacroeconomic indicators (e.g., GDP or unemployment) and produces a coherent setof all GHG emissions (such as CO 2, methane and nitrous oxide) by sector and byprovince.
Figure A.4.1 shows the general structure of E3MC. The component modules of E3MCrepresent the individual supply, demand, and conversion sectors of domestic energymarkets, and also include the macroeconomic module. In general, the modulesinteract through values representing the prices of the energy delivered to theconsuming sectors and the quantities of end-use energy consumption.

8/11/2019 1001-Canada's Emissions Trends 2013_e
http://slidepdf.com/reader/full/1001-canadas-emissions-trends-2013e 70/80
Canada’s Emissions Trends 68
Figure A.4.1 – Energy, emissions and economy model for Canada
To develop this projection of energy use and related emissions, it was necessary toprovide a view of the Canadian economy to 2020. The level and composition of energysupply and demand, and the resulting GHG emissions, are determined based on manyassumptions that influence the overall size and growth rate of the economy.
Treatment of Interaction Effects
Estimates of the net impact of government measures incorporated into the modelingscenarios need to take into account major interaction and behavioural affects. Theanalytical approach permitted by E3MC addresses these key modeling challenges:
Additionality : This issue relates to the question of what would havehappened without the initiative in question. Problems of additionality arisewhen the stated emissions reductions do not reflect the difference inemissions between equivalent scenarios with and without the initiative in
question. This will be the case if stated emissions reductions from aninitiative have already been included in the reference case: emissionsreductions will effectively be double-counted in the absence of appropriateadjustments. The E3MC model controls for additionality by basing itsstructure on incremental or marginal decision-making. The E3MC modelassumes a specific energy efficiency or emission intensity profile at thesector and end-use point (e.g., space heating, lighting, or auxiliary power).Under the E3MC modeling philosophy, if the initiative in question were toincrease the efficiency of a furnace, for example, only the efficiency of a
8/11/2019 1001-Canada's Emissions Trends 2013_e
http://slidepdf.com/reader/full/1001-canadas-emissions-trends-2013e 71/80
Canada’s Emissions Trends 69
new furnace would be changed. The efficiency of older furnaces would notchange unless those furnaces are retired and replaced with higher-efficiency ones. As such, any change in the model is incremental to what isreflected in the business-as-usual assumptions.
Free ridership : A related problem, free ridership, arises when statedreductions include the results of behaviour that would occur regardless ofthe policy. This can occur when subsidies are paid to all purchasers of anitem (e.g., a high-efficiency furnace), regardless of whether they purchasedthe item because of the subsidy. Those who would have purchased theproduct regardless are termed free riders. In the E3MC model, thebehaviour of free riders has already been accounted for in the referencecase. Thus, their emissions are not counted toward the impact of thepolicy. Instead, the E3MC model counts only the incremental take-up of theemissions-reducing technology.
The rebound effect : This describes the increased use of a more efficient
product resulting from the implied decrease in the price of its use. For
example, a more efficient car is cheaper to drive and so people may drive more. Emissions reductions will generally be overestimated by between 5%and 20% unless estimates account for increased consumption because of the
rebound effect. Within the model, we have mechanisms for fuel choice,
process efficiency, device efficiency, short-term budget constraints, and
cogeneration, which all react to changes in energy and emissions costs in
different time frames. 30 All of these structures work to simulate the
rebound effect. In the example above, the impact of extra kilometres that
may be driven as a result of improved fuel efficiency is automatically nettedout of the associated emissions-reduction estimates.
Policy interaction effects : This describes impacts on the overalleffectiveness of Canada’s emissions -reduction measures when they interactwith each other. A policy package containing more than one measure orpolicy would ideally take into account these impacts in order to understandthe true contribution that the policy package is making (in this case, toemission reductions).
E3MC is a comprehensive and integrated model focusing on the interactions betweensectors and policies. In the demand sectors, the fuel choice, process efficiency, deviceefficiency, and level of self-generation are all integrally combined in a consistentmanner. The model includes detailed equations to ensure that all the interactionsbetween these structures are simulated with no loss of energy or efficiency. Forexample, the electric generation sector responds to the demand for electricity fromthe energy demand sectors, meaning that any policy to reduce electricity demand inthe consumer sectors will impact the electricity generation sector. The model
30 A shift in energy prices will cause: cogeneration to shift in the short to medium term, device efficiencyto adjust over the short to mid-term, process efficiency to adjust in the mid-term, and fuel choice to reactin the mid- to long-term. The actual adjustment times depend on the particular sector.

8/11/2019 1001-Canada's Emissions Trends 2013_e
http://slidepdf.com/reader/full/1001-canadas-emissions-trends-2013e 72/80
Canada’s Emissions Trends 70
accounts for emissions in the electricity generation sector as well as for emissions inthe consumer demand sectors. As the electricity sector reduces its emissions intensity,policies designed to reduce electricity demand in the consumer sectors will cause lessof an emissions reduction. The natural gas and oil supply sectors similarly respond tothe demands from the consumer sectors, including the demands for refined petroleumproducts for transportation. The model also simulates the export of products by supplysectors.
Taken as a whole, the E3MC model provides a detailed representation of technologiesthat produce goods and services throughout the economy, and can simulate, in arealistic way, capital stock turnover and choices among technologies. The model alsoincludes a representation of equilibrium feedbacks, such that supply and demand forgoods and services adjust to reflect policy. Given its comprehensiveness, E3MC coversall the GHG emissions sources, including those unrelated to energy use.
Simulation of capital stock turnover
As a technology vintage model, E3MC tracks the evolution of capital stocks over timethrough retirements, retrofits, and new purchases, in which consumers and businessesmake sequential acquisitions with limited foresight about the future. This isparticularly important for understanding the implications of alternative time paths foremissions reductions.
The model calculates energy costs (and emissions) for each energy service in theeconomy, such as heated commercial floor space or person-kilometres traveled. Ineach period, capital stocks are retired according to an age-dependent function(although the retrofitting of unretired stocks is possible, if warranted by changingeconomic conditions). Demand for new stocks grows or declines depending on theinitial exogenous forecast of economic output (i.e., a forecast that is external to themodel and not explained by it) and the subsequent interplay of energy supply –demandwith the macroeconomic module. A model simulation iterates between energy supply –demand and the macroeconomic module until there is a convergence. The globalconvergence criterion is set at 0.1% between iterations. This convergence procedure isrepeated for each year over the simulation period.
The E3MC model simulates the competition of technologies at each energy servicenode in the economy, based on a comparison of their cost and some technology-specific controls, such as a maximum market share limit in cases where a technology isconstrained by physical, technical or regulatory means from capturing all of a market.The technology choice simulation reflects the financial costs as well as the consumerand business preferences, revealed by real-world technology acquisition behaviour.
Model Limitations
While E3MC is a sophisticated analytical tool, no model can fully capture thecomplicated interactions associated with given policy measures between and withinmarkets or between firms and consumers. Unlike computable general equilibrium

8/11/2019 1001-Canada's Emissions Trends 2013_e
http://slidepdf.com/reader/full/1001-canadas-emissions-trends-2013e 73/80
Canada’s Emissions Trends 71
models, however, the E3MC model does not fully equilibrate government budgets andthe markets for employment and investment. That is, the modeling results reflectrigidities such as unemployment and government surpluses and deficits. Furthermore,the model, as used by Environment Canada, does not generate changes in nominalinterest rates and exchange rates, as would occur under a monetary policy response toa major economic event.
LULUCF MODELING METHODOLOGY
LULUCF projections have been modeled separately from the other sectors. EachLULUCF subsector has been projected using a different model/methodology asdetermined by the relevant Government department sub-sector experts.
Forest Land Converted to other Land Categories
Provided by Science and Risk Management Directorate, Environment Canada
Emissions associated with forest conversion to other land use are reported in Canada’sNational GHG Inventory (Environment Canada, 2013) under the LULUCF sector.Emissions for Forest conversion is not a LULUCF reporting category, since it overlapswith the subcategories of land converted to cropland, land converted to wetlands andland converted to settlements; it is nevertheless reported as a memo item in theannual inventory submission. Emissions from forest conversion to all land categoriesare estimated using a consistent approach, further described in this section.
Historical estimates for forest land conversion where developed based on an earthobservation sampling approach with resulting emissions impacts calculated using theCarbon Budget Model of the Canadian Forest Sector. These estimates take intoaccount activity extending back to the 1970’s and up to 2011 and were developed bydriver (agriculture, built-up, hydroelectric development, non-renewable andrenewable resource extraction-(mining and oil and gas), renewable resourceextraction, transportation and hydroelectric reservoirs) and end land use categories(cropland, wetlands, settlements).
The projected estimates for forest conversion where developed asare based on abusiness-as-usual (BAU) scenario of forest conversion activity for the 2011 - 2020period, using the best available knowledge of drivers, policies and practices. Thesampling and estimations for both historical and BAU are based on a sub- provincialecological stratification spatial framework taking into consideration regionalconditions and factors.
Emission estimates for projected forest conversion were developed using an empiricalmodel; model parameters were derived by driver and ecological region based on therelationship between areas converted and resulting emissions as reported in the mostrecent NIR submission. All emission estimates for forest conversion use aninstantaneous oxidation approach to represent the conversion of forest to harvestedwood products, which is in keeping with the approach used for the development ofestimates for Canada’s 2013 National Inventory Submission.
8/11/2019 1001-Canada's Emissions Trends 2013_e
http://slidepdf.com/reader/full/1001-canadas-emissions-trends-2013e 74/80
Canada’s Emissions Trends 72
Forest Land Remaining Forest Land and Land Converted to Forest Land projections
Canada’s National Forest Carbon Monitoring, Accounting an d Reporting System
Provided by Canadian Forest Service, Natural Resources Canada
Canada’s National Forest Carbon Monitoring Accounting and Reporting System buildson information in the National Forest Inventory and on additional provincial andterritorial forest inventory information. Natural Resources Canada developed andmaintains the Carbon Budget Model of the Canadian Forest Sector, a Tier 3 forestcarbon dynamics estimation tool fully consistent with the IPCC inventory guidelines.With the Carbon Budget Model of the Canadian Forest Sector as its core model, thesystem provides annual estimates of greenhouse gas emissions and removals asaffected by forest management, natural disturbances, and land-use change. NaturalResources Canada, in collaboration with the Canadian Space Agency uses remotesensing and other data to monitor the area annually disturbed by wildfires, andmaintains a deforestation monitoring program to estimate the area annually affectedby conversion of forest to non-forest land uses in both the managed and unmanagedforest area.
This system has been in place since 2006 and is described in detail in Canada’s 2013National Inventory Report. The system is used to produce the projections shown here,using assumptions about human activities in the future. This ensures that theprojections are fully consistent with historical emission estimates.
For Forest Land Remaining Forest Land (FLFL), projections are based on the samemethodologies used for the production of FLFL estimates for NIR2013. As notedabove, harvesting is the human activity with the greatest impact on this subsector.
Because future harvest levels are unknown, Canada has based its projection on thelatest available business-as-usual harvest projections from provincial and territorialgovernments. Additionally, as the effects of future disturbances are unknown, Canadahas assumed no natural disturbances would occur from 2012 onward, apart from a low,background level of wildfire expected to occur each year (based on more than 50years of historical data). Projected emissions from harvested wood products use thesame assumptions as used in FLFL estimates for the 2013 National Inventory Report,i.e. that the pool of harvested wood products starts in 1990, with emissions occurringover time.
8/11/2019 1001-Canada's Emissions Trends 2013_e
http://slidepdf.com/reader/full/1001-canadas-emissions-trends-2013e 75/80

8/11/2019 1001-Canada's Emissions Trends 2013_e
http://slidepdf.com/reader/full/1001-canadas-emissions-trends-2013e 76/80
Canada’s Emissions Trends 74
breakdown of activities and a detailed breakdown of cropping production practicesincluding choice of tillage regime, use of summerfallow and stubble
CRAM is directly calibrated to the 2011 Census of Agriculture and all resource usepatterns are the same as what is reported in the Census for that year. As CRAM is astatic model it does not provide any information on how the agriculture sector changesover time. In order to estimate future resource use patterns a 2020 baseline wascreated where CRAM was aligned to the crop and livestock production estimates fromAAFC’s 2013 Medium Term Outlook (MTO). The 2013 MTO provides a 10 year estimatefrom 2012 to 2022. Since estimates for crop and livestock production levels are notavailable for 2030 the 2020 production levels were held constant out to 2030.
The CanAG-MARS is model maintained by AAFC which reports on GHG sources and sinksresulting from changes in land use and land ma nagement practices in Canada’sagricultural sector. The estimation procedure follows a Tier 2 methodology under IPCCGood Practice Guidance (GPG) for LULUCF. The model quantifies the annual change insoil organic carbon (SOC) associated with land use or land management changes(LUMC). The amount of organic carbon retained in soil represents the balance betweenthe rate of primary production (C transfer from the atmosphere to the soil) and soilorganic carbon (SOC) decomposition (C transfer from the soil to the atmosphere).How the soil is managed can determine whether the amount of organic carbon storedin soil is increasing or decreasing. The estimation procedure is based on the premisethat changes in soil management influence the rate of soil carbon gains or losses for aperiod of time following a land management change (LMC). If there was no change inland management, then SOC is assumed to be at equilibrium and the change in carbonstock is deemed to be zero. Carbon emissions and removals on mineral soils areestimated by applying country-specific, spatially disaggregated carbon emission andremoval factors multiplied by the relevant area of land that undergoes a managementchange. The carbon factor represents the rate of change in soil C per unit area foreach LMC as a function of time since the land management change.
The 2011 and 2020 resource use patterns generated within CRAM were combined withactivity data from past census periods dating back to 1951. Within the CanAG-MARSmodel, activity data is annualized assuming a constant rate of change between censusperiods and projection years. The data is linked to soil landscapes and annual changesin land activities are estimated through a set of rule based mechanisms. Factors areapplied to the area of current and past LUMC activities to generate GHGemissions/removals for each inventory year. Since activity data for 2030 was heldconstant at 2020 levels, GHG data reported for 2030 reflect emissions/removalsassociated with changes in land management activities up to and including the 2020projection year.
Residual emissions from forest land converted to cropland were provided byEnvironment Canada as AAFC does not have the capacity to estimate some componentsof this, such as the decay of woody biomass. These estimates were combined with theestimates generated by CRAM and CanAG-MARS and provide the final estimated CLCLemissions.
8/11/2019 1001-Canada's Emissions Trends 2013_e
http://slidepdf.com/reader/full/1001-canadas-emissions-trends-2013e 77/80
Canada’s Emissions Trends 75
Annex 5: Technical Changes since EmissionsTrends Report 2012 The projections presented in this chapter were developed using the Energy, Emissionsand Economy Model for Canada (E3MC). While the methodology used to create theseprojections has not changed since publication of the 2011 and 2012 Emissions Trends reports, some technical improvements have been made. Specific changes are outlinedbelow.
Improvements in the oil and gas sectors include the ability to more accurately modelenergy demand and unit characteristics of cogeneration units, as well as updates tointensity and production expectations:
Addition of endogenous cogeneration build for oil sands:o Originally, only known cogeneration units were included in the forecast
exogenously; no additional cogeneration had been assumed. Now, inaddition to exogenously specified cogeneration units, the model buildsadditional endogenous units to satisfy the demands of the oil and gassector. In 2011, according to the Energy Resources Conservation Board,oil sands sectors generated about 1.25 times more electricity than theyconsumed and sold the surplus electricity to the grid. Under the currentassumption, the current ratio of generated to consumed electricity isbeing held constant in the forecast.
Restructuring of the oil sands cogeneration units:o Demands of industrial sectors consist of end-use demands and
cogeneration demands. Originally, cogeneration demands includeddemand for fuels used to generate steam and electricity in cogeneration
units, while end-use demands included all other demands. An updatepermitted end-use demands to include all fuel used to produce steam,and cogeneration demands to include only incremental fuel used togenerate electricity.
o Heat rates (i.e., fuel consumption per unit of electricity generation) ofthe cogeneration units were originally very high, because they wereaccounting for fuel used to generate both steam and heat. Now thatcogeneration demands only include incremental fuel used to generateelectricity, the heat rates of cogeneration units have been reducedconsiderably. For example, originally the heat rates were in the rangeof 12,000 to 18,000, whereas now they are in the range of 4000 to 6000.
Electricity demands of the oil sands:o Assumptions regarding electricity demands by oil sands sectors have
been changed upwards using report by the Canadian Energy ResearchInstitute to be more consistent with Alberta’s Energy ResourcesConservation Board (ERCB) data in history. In the forecast, we took theelectricity intensity in the last historical year and flattened the trend in

8/11/2019 1001-Canada's Emissions Trends 2013_e
http://slidepdf.com/reader/full/1001-canadas-emissions-trends-2013e 78/80

8/11/2019 1001-Canada's Emissions Trends 2013_e
http://slidepdf.com/reader/full/1001-canadas-emissions-trends-2013e 79/80
Canada’s Emissions Trends 77
Reallocation of all natural gas used in ammonia production from thepetrochemicals sector to the fertilizers sector.
Revision of allocation of undifferentiated emissions among EITE sectors.
Improvements in the electricity sector incorporated updated historical data and a
revised outlook on future projects: The adjustment to historical data included adding previously missing units andcorrecting fuel usage for existing units.
Online dates for projects were changed where applicable.o Deerland Peaking Station’s commissioning date has been moved from
2013 to 2015.Projects that have been placed on hold due to economic circumstances havebeen taken out of the reference case.
o The Swan Hills project in Alberta has been put on hold due to the lowprice of natural gas. The company has indicated that the project will berevisited once prices are higher.
o Ontario has less wind coming online in the future due to a renegotiationof a contract with Samsung.
New major projects added since last year include Saskatchewan’s Battlefordnatural gas station (260 megawatts).

8/11/2019 1001-Canada's Emissions Trends 2013_e
http://slidepdf.com/reader/full/1001-canadas-emissions-trends-2013e 80/80
www ec gc c
Additional information can be obtained at:
Environment CanadaInquiry Centre10 Wellington Street, 23rd FloorGatineau QC K1A 0H3Telephone: 1-800-668-6767 (in Canada only) or 819-997-2800Fax: 819-994-1412


