Date post: | 13-May-2017 |
Category: |
Documents |
Upload: | tuany-r-cassiano |
View: | 212 times |
Download: | 0 times |
arX
iv:1
001.
1739
v2 [
astr
o-ph
.CO
] 1
1 M
ay 2
010
The dark matter of gravitational lensing
Richard Massey, Thomas Kitching
Institute for Astronomy, Royal Observatory, Blackford Hill, Edinburgh EH9 3HJ, UK
E-mail: rm,[email protected]
Johan Richard
Durham University, Department of Physics, South Road, Durham DH1 3LE, UK
E-mail: [email protected]
Abstract.
We review progress in understanding dark matter by astrophysics, and particularly
via the effect of gravitational lensing. Evidence from many different directions now
all imply that five sixths of the material content of the universe is in this mysterious
form, separate from and beyond the ordinary “baryonic” particles in the standard
model of particle physics. Dark matter appears not to interact via the electromagnetic
force, and therefore neither emits nor reflects light. However, it definitely does interact
via gravity, and has played the most important role in shaping the Universe on large
scales. The most successful technique with which to investigate it has so far been the
effect of gravitational lensing. The curvature of space-time near any gravitating mass
(including dark matter) deflects passing rays of light – observably shifting, distorting
and magnifying the images of background galaxies. Measurements of such effects
currently provide constraints on the mean density of dark matter, and its density
relative to baryonic matter; the size and mass of individual dark matter particles; and
its cross section under various fundamental forces.
Submitted to: Rep. Prog. Phys.
The dark matter of gravitational lensing 2
1. Introduction
Astrophysics now operates under the astonishing hypothesis that the Universe we see
is but the tip of an iceberg. It has taken a wealth of evidence from many independent
observations to confirm that, while the “standard model” of particle physics may
successfully describe quarks, leptons and bosons, it misses the most common form of
matter. The first evidence for this provocative stance came from the unexpectedly high
velocities of galaxies in the Coma cluster [1, 2] and Virgo cluster [3]. The clusters appear
to be gravitationally bound, but all the luminous material inside them does not add up
to sufficient mass to retain the fast-moving galaxies. In individual galaxies too, stars
orbit too fast to be held by the luminous material of Andromeda [4, 5, 6], NGC3115
[7] and other spiral galaxies [8, 9]. Luminous material in these galaxies is concentrated
in the central regions, so the angular rotation of stars ought to slow at large radii, but
stars in the outskirts are seen to rotate at the same rate as those near the centre. Given
the high velocities of their constituents, both galaxies and clusters of galaxies ought to
pull themselves apart. Preserving these self-destructive systems requires gravitational
glue in the form of invisible “dark matter”.
The modern “concordance” cosmological model also relies upon the gravitational
influence of (cold) dark matter to glue together the entire Universe. Slowing the
expansion after the Big Bang required much more gravity than that provided by the
baryons, which alone would have allowed the contents of the Universe to be spread
unhabitably thin [10]. However, if additional dark matter were forged during the same
primordial fireball, it must have quickly stopped interacting with other particles through
the electroweak force, in order to preserve the uniformity of photons in the Cosmic
Microwave Background (CMB) radiation, whose temperature fluctuations reach only
one part in 105 of the mean [11]. Indeed, once dark matter decoupled from standard
model particles, it began collapsing under its own gravity into dense concentrations
of mass. These provided the initial scaffolding for structure formation. Once ordinary
matter had cooled further, and also decoupled from the hot photons, it could fall into the
scaffolding and be built into galaxies [12, 13, 14, 15]. Without dark matter’s headstart,
there would have been insufficient time to build the complex structures we see (and
live in) today. The latest measurements of the CMB and Large-Scale Structure [16, 17]
indicate that the Universe contains approximately one hydrogen atom per cubic metre,
but five times that in the form of dark matter.
On the back of this evidence, determining the nature of ubiquitous dark matter has
become an outstanding problem of modern physics. Yet its low rate of interaction with
the rest of the Universe makes it difficult to detect. Since dark matter does not generally
emit, reflect or absorb light of any wavelength, traditional astrophysics is rendered blind.
No particle colliders have yet achieved sufficient energy to create a single dark matter
particle and, even if they can identify a dark matter candidate, astronomical observations
will still be required to demonstrate that the candidate particle is present in sufficient
quantities throughout the Universe to be the dark matter. Direct detection experiments
The dark matter of gravitational lensing 3
in quiet, underground mines have yet to locate a convincing signal – and explaining this
absence also requires astrophysical explanations, such as the patchiness of dark matter
debris from consumed satellite galaxies [18, 19]. Astronomy will therefore remain vital
in resolving the outstanding problem that it initiated.
As with the first detections, the best way to study dark matter is via its
gravitational influence on more easily visible particles. The most direct method for this is
“gravitational lensing”, the deflection of photons as they pass through the warped space-
time of a gravitational field [20]. Light rays from distant sources are not “straight” (in
a Euclidean frame) if they pass near massive objects, such as stars, clusters of galaxies
or dark matter, along our line of sight. In practice, the effect is similar to optical
refraction, although it arises from very different physics. The effect was first observed
in 1919, during a solar eclipse in front of the Hyades star cluster, whose stars appeared
to move as they passed behind the mass of the sun [21]. This observation provided the
first experimental verification of general relativity. Although neither Einstein nor the
observers saw any further uses for the effect [22], Zwicky suggested that the ultimate
measurement of cluster masses would come from lensing [2], and it has indeed become
the most successful probe of the dark sector.
Many lines of research currently exploit the effect of gravitational lensing. It is
a rapidly growing field, but the first threads of consensus are beginning to emerge in
answer to the top-level questions. As we shall discuss in this review, the technique has
provided vital contributions to the following deductions:
• The Universe contains about five times more dark matter than baryonic matter
• Dark matter interacts approximately normally via gravity
• Dark matter has a very small electroweak and self-interaction cross section
• Dark matter is not in the form of dense, planet-sized bodies
• Dark matter is dynamically cold.
We introduce the various observational flavours of gravitational lensing in §2. We
then describe lensing measurements that have shed light upon the amount of dark
matter in §3, its organisation in §4, and its properties in §5. We try to touch upon
all of the areas of gravitational lensing that have contributed to current knowledge of
dark matter, but cannot comprehensively discuss observations from all fields in a single
review. We discuss future prospects and challenges for the field in §6, and conclude in
§7. Note that measurements of cosmological distances all depend upon the overall rate
of expansion of the Universe, parameterised as Hubble’s constant H . Throughout this
review, we assume a background cosmological model in which this value at the present
day is h = H0/0 = 70 km/s/Mpc. Since this is only known to ∼ 5% accuracy [23],
uncertainty in the geometry of gravitational lens systems propagates implicitly into the
same uncertainty in all inferred (absolute) lens masses.
The dark matter of gravitational lensing 4
2. Observational flavours of Gravitational Lensing
2.1. Strong lensing
Gravitational lensing is most easily observable around a dense concentration of mass
like the core of a galaxy or cluster of galaxies. In the “strong lensing” regime, nearby
space-time is so warped that light can travel along multiple paths around the lens, and
still be deflected back towards the observer [24]. If a distant source is directly behind
a circular lens, the light can travel around any side of it, and appears as an “Einstein
ring”. The Einstein radius or size of this ring is proportional to the square root of the
projected mass inside it. If the background source is slightly offset, or the lens has
a complex shape, the source can still appear in multiple locations, viewed from very
slightly different angles. Depending on the focussing of the light path, each of these
multiple images can be made brighter (magnified) or fainter (demagnified), and the
magnification is greatest close to the “critical curve” (the asymmetric equivalent of an
Einstein ring) [25]. Since light from opposite ends of an extended source (e.g. a galaxy) is
typically deflected by different amounts, the source appears distorted. Distant galaxies
intrinsically no different from any others appear as tangential arcs around the lens or, if
the lens mass is very concentrated, a line radiating away from it [26]. Such “radial arcs”
are generally difficult to see because they are usually less magnified and appear inside
the Einstein radius, behind any light emitted by the lens object itself. An example of
strong gravitational lensing around a massive galaxy cluster is shown in figure 1.
The first strong gravitational lens was discovered with the Jodrell Bank MkIA
radio telescope in 1979 [27]. Two quasars were found 6 arcseconds apart, with identical
redshifts z = 1.41 and detailed absorption spectra. A foreground z = 0.355 galaxy is
now known between them. Subsequent observational progress has then driven primarily
by technological advance. Photographic plates even on large telescopes and scanned by
computers gather light too inefficiently to capture optical images of the distant (therefore
faint) and thin lensed arcs. Digital CCD cameras have far higher efficiency, and the first
image of a strongly lensed arc was obtained with the Canada-France Hawaii telescope in
galaxy cluster Abell 370 [28, 29], and confirmed to be a single object at redshift z = 0.72
by optical spectroscopy [30]. Several more such giant arcs were quickly identified in other
galaxy clusters [31], soon the first sample of strong lensing clusters was built [32] and
allowed for statistical study of giant arcs [33].
The launch of the Hubble Space Telescope (HST) then revolutionised the field
once again. Its unrivalled imaging resolution helped distinguish a large number of
arcs, arclets and multiple images in many clusters. The first study using the Wide
Field Planetary Camera (WFPC2) identified seven strongly lensed objects behind the
cluster Abell 2218 [34], significantly more than bad been found by using ground-based
telescopes. The Advanced Camera for Surveys (ACS) provided a further step forward,
with 20-30 strongly lensed objects found in several of the most massive clusters [35] and
over 100 multiple images around Abell 1689 [36]. The positions and shapes of the images
can be used to reconstruct the distribution of mass in the lens. The magnification effect
The dark matter of gravitational lensing 5
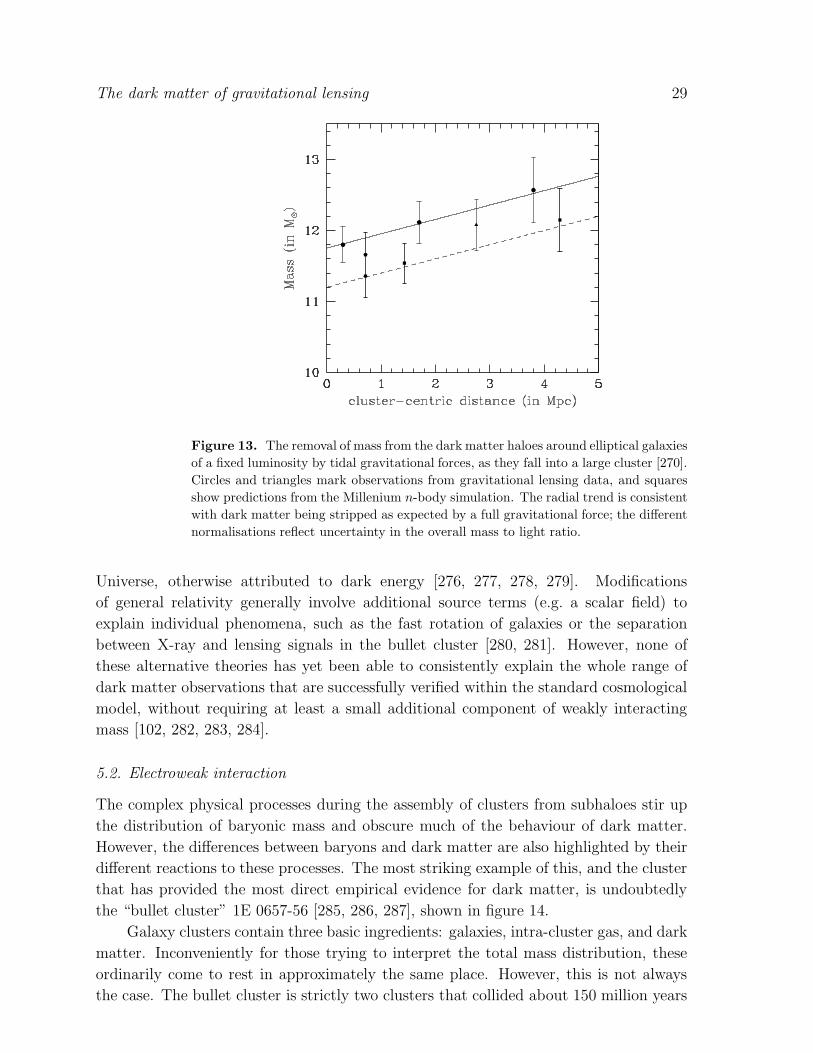
Figure 1. Strong gravitational lensing around galaxy cluster CL0024+17,
demonstrating at least three layers projected onto a single 2D image. The + shaped
objects are nearby stars in our own galaxy (the + created by optical effects in the
telescope). The yellow, elliptical galaxies are members of the cluster, all at a similar
redshift and gravitationally bound. Also amongst this group of galaxies is a halo of
invisible dark matter. The elongated blue objects are much more distant galaxies,
physically unassociated with, and lying behind, the cluster. Gravitational lensing
has distorted their apparent images into a series of tangential arcs. Figure credit:
NASA/ESA/M.J. Jee (John Hopkins University).
boosts the observed fluxes of background objects, so that a strong lensing cluster can
also be used as a gravitational telescope to see – and even resolve – fainter or more
distant objects than otherwise possible [37].
The detection of strong-lensing events on galaxy scales also enabled constraints
on cosmological parameters using large statistical samples. Throughout the 1990s,
the Cosmic Lens All-Sky Survey (CLASS, [38]) searched for gravitationally lensed
compact radio sources using imaging from the Very Large Array (VLA). Out of ∼16,500
radio sources, they found 22 lens systems. The statistical properties of these lensed
systems constrained cosmological parameters [39] and measurements of their time delays
constrained Hubble’s constant [40]. More recently, systematic homogeneous surveys
The dark matter of gravitational lensing 6
such as the Sloan Digital Sky Survey (SDSS) have provided even larger samples of
strong-lensing galaxies. The SDSS Quasar Lens Search (SQLS, [41]) spectroscopically
found 53 lensing galaxies and tightened constraints on cosmological parameters [42] by
ingeniously looking for the signature of two objects at different redshifts. Finally, the
Sloan Lens ACS (SLACS, [43]) Survey combined the massive data volume of SDSS
with the high-resolution imaging capability of ACS to identify and then follow up 131
galaxy-galaxy lensing systems [172], measuring the average dark matter fraction and
dark matter density profiles within galaxies [74].
2.2. Microlensing
Most distant astronomical observations are static on the scale of a human lifetime but, as
in the case of the 1919 eclipse, an exception is provided by any relative motion between
a source and a gravitational lens. The line of sight to a star along which a foreground
mass would induce gravitational lensing represents a tiny volume of space. Panoramic
imaging cameras now make it possible to monitor the lines of sight to many millions of
stars, and any object traversing any of those small volumes can temporarily brighten it
for days or weeks. Indeed, “pixel lensing” of even unresolved stars can still detect the
statistical passage of a foreground lens in front of one of the many stars contributing to
the light in any pixel [46, 47]. The main observational concern is to avoid false-positive
detections due to intrinsic variability in the luminosity of certain types of star. The two
most exciting results microlensing studies are that dark matter in the Milky Way is not
predominantly in the form of freefloating, planet-sized lumps of dull rock, which would
occasionally brighten stars in the Galactic centre, but that planet-sized lumps of rock
do exist around other stars, and give rise to secondary brighness peaks shortly before
or after their host star itself acts as a gravitational lens.
The term “gravitational microlensing” was coined by Refsdal [44, 45], from the
characteristic ∼ 1 microarcsecond size of a star’s Einstein radius. Only physically
small sources will be significantly affected by microlensing; extended background sources
like galaxies are effectively immune because only a tiny fraction of their light is
strongly magnified, with the rest propagating unaffected. More massive lenses, with
milliarcsecond Einstein radii, produce “gravitational millilensing” that affects slightly
larger background sources on a timescale of months (and the statistical long tail is
strong lensing around massive clusters, with arcsecond Einstein radii). This distinction
has been most useful when looking at the lensed images of Active Galactic Nuclei (a
galaxy’s central, supermassive black hole and surrounding accretion disc), because these
really do have different physical sizes when viewed at different wavelengths. As matter
gradually falls into the black hole, it emits a warm glow of infra-red light from the
large and outer narrow-line region, then optical light from the smaller broad-line region
and finally ultra-violet light from the accretion disc itself. The behaviour of the source
can be modelled from long wavelength observations, which are relatively unaffected
by gravitational lensing, then the lens object and even its substructure probed at
The dark matter of gravitational lensing 7
progressively shorter wavelengths.
2.3. Weak lensing
Most lines of sight through the Universe do not pass near a strong gravitational lens.
Far from the core of a galaxy or cluster of galaxies, the light deflection is very slight.
In this “weak lensing” regime, the distortion of resolved sources can be approximated
to first order as a locally linear transformation of the sky, represented as a 2× 2 matrix
that includes magnification, shear and (potentially, but not usually in practice) rotation
[48, 49, 50, 51, 52]. The theory was developed during the 1990s [53, 54], including
some practical methods to accurately measure galaxy positions and shapes in the new
pixellated CCD images [55]. Either the magnification [56] or the shear distortion can be
measured, but the shear tends to have higher signal to noise, because competing effects
of magnification (the brightening of faint galaxies, but the dilution of the surveyed
volume in a fixed angle on the sky) act against each other and partially cancel [57].
The shear distortion changes the shapes of distant galaxies, adjusting their major-
to-minor axis ratio by ∼ 2%. This cannot be seen in an individual object, since it is
far smaller than the range of intrinsic shape variation in galaxies, which are already
elliptical, have spiral arms and knots of star formation, etc. However, galaxies along
adjacent lines of sight are coherently sheared by a similar amount, while their intrinsic
shapes are (to first order) uncorrelated. In the absence of lensing, if there is no preferred
direction in the Universe, galaxy shapes must average out as circular. Once sheared,
the average shape of adjacent galaxies is an ellipse, from which the shear signal can be
measured statistically. The intrinsic shapes of galaxies are noise in this measurement
(averaging over ∼ 100 galaxies is required to obtain a signal to noise of unity in shear).
The spatial resolution of this measurement is determined by the density on the sky of
galaxies whose shapes are resolved: typically a few square arcminutes from the ground,
or one square arcminute from space.
The observable shear field is proportional to a second derivative of the gravitational
potential projected along a line of sight. Via a convolution, this can be converted into
a map of the projected mass distribution at the same resolution. The mass is just
a different second derivative of the gravitational potential and is responsible for the
circular “E-mode” patterns shown in figure 2 and reminiscent of the tangential strong
lensing arcs around clusters. Conveniently, a second scalar quantity can be extracted
from the shear field. The curl-like “B-mode” signal is not produced by the gravitational
field of a single mass, and only in very low amounts by a complex distribution of mass
[58]. However, many potential systematics produce E and B-modes equally, so checking
that the B-mode is consistent with zero in a final analysis provides a useful test that an
analysis has successully removed any residual instrumental systematics.
By the late 1990s, weak gravitational lensing had been detected around the most
massive clusters, and an optimistic outlook was presented in an influential review in
1997 [48]. The optimism was well founded, for weak lensing really burst onto the
The dark matter of gravitational lensing 8
Figure 2. The statistical signals sought by measurements of weak gravitational
lensing are slight but coherent distortions in the shapes of distant galaxies. (Left): A
tangential, circular pattern of background galaxies is produced around a foreground
mass overdensity, reminiscent of the tangential arcs of strong lensing seen in figure 1.
On much larger scales, an opposite, radial pattern is produced by foreground voids.
Physical gravitational lensing produces only these “E-mode” patterns. However, there
is another degree of freedom in a shear (vector-like) field, and spurious artefacts can
typically mimic both. Measurements of “B-mode” patterns therefore provide a free
test for residual systematic defects. (Right): The observed ellipticities of half a million
distant galaxies within the 2 square degree Hubble Space Telescope COSMOS survey
[148]. Each tick mark represents the mean ellipticity of several hundred galaxies. A
dot represents a circular mean galaxy; lines represent elliptical mean galaxies, with
the length of the line proportional to the ellipticity, and in the direction of the major
axis. The longest lines represent an ellipticity of about 0.06. Several coherent circular
E−mode patterns are evident in this figure, e.g. (149.9, 2.5). Radial E−mode patterns
are also present on larger scales, but the density in voids cannot be negative, so the
contrast is lower and the signal much less apparent to the eye. The B−mode signal is
consistent with zero.
cosmological scene during a single month in 2000 when the first large-format CCDs
allowed four groups to independently detect weak lensing in random patches of the sky
[59, 60, 61, 62], a probe of the true average distribution of dark matter. In particular, it
was the consistency between the four independent measurements that assuaged doubts
from an initially skeptical astronomical community and laid the foundations for larger,
dedicated surveys from telescopes both on the ground and in space. Weak lensing has
rapidly become a standard cosmological tool.
2.4. Flexion
Bridging the gap between strong and weak lensing is the second-order effect known as
flexion. If the projected mass distribution of a lens has a spatial gradient, steep enough
to change the induced shear from one side of a source galaxy to the other, that galaxy
begins to curve as shown in figure 3. This is the next term in a lensing expansion
The dark matter of gravitational lensing 9
Figure 3. The various regimes of gravitational lensing image distortion. Along typical
lines of sight through the Universe, an intrinsically circular source is distorted into an
ellipse by weak lensing shear. The resulting axis ratio is typically only ∼ 2% and has
been exaggerated in this figure for illustration. Nearer concentrations of mass, the
distortion begins to introduce flexion curvature. Along lines of sight passing near the
most massive galaxies of clusters of galaxies, and through the most curved space-time,
strong gravitational lensing produces multiple imaging and giant arcs.
that leads towards the formation of an arc, as in strong lensing. The amplitude of
the flexion signal is lower than the shear signal, but so is the intrinsic curvature of
typical galaxy shapes. Statistical techniques similar to those used in weak lensing can
therefore be applied. Flexion measurements have proven most useful to fill in a gap in
the reconstructed mass around galaxy clusters where the light deflection is too small for
strong lensing, but the area (and hence the number of lensed sources) is too low for a
significant weak lensing analysis.
The initial attempts to mathematically describe the flexion distortion were
forbidding [63, 64, 65]. More recent descriptions adapt the complex notation from
weak lensing shear into an elegant formalism requiring just one extra derivative of
the gravitational potential [66, 67]. Flexion has an equivalent of the E- and B-mode
decomposition [68], and one extra degree of freedom in the second-order equations
produces an additional distortion that is not produced by gravitational lensing [69].
Measurements of all these extra patterns may provide useful crosschecks for residual
image processing systematics.
3. Quantity of Dark Matter
3.1. Amount of dark matter in individual galaxies
Individual galaxies are built of baryonic material encased inside a much larger halo of
dark matter. Gravitational lensing can probe this halo at outer radii far beyond any
visible tracers of mass. Indeed, there is now better agreement about the profile of the
dark matter halo than the distribution of the central baryons!
The dark matter of gravitational lensing 10
The weak lensing signal in SDSS survey imaging is very noisy, but stacking the
signal around a third of a million galaxies reveals a typical halo of total (weak lensing)
mass 1.4×10¹²M⊙ around galaxies with a stellar mass of 6×10¹⁰M⊙ (as determined from
a comparison of the spectrum of emitted light against theoretical models), independently
of their visual morphology [70]. Across all galaxies, these stars would account for
∼ 16% of the expected baryons in the Universe. Within rather uncertain errors, this is
consistent with independent radio observations of atomic gas that indicate that while
only ∼ 10% of baryons end up in galaxies, almost all of these form stars [71].
To more directly measure the mass of the central baryons, the Hubble Space
Telescope SLACS survey of elliptical galaxies probes the distribution of total mass
throughout galaxies by combining weak lensing with strong lensing and parameterizing
the density of dark matter. Such observations necessarily require more massive galaxies,
and find haloes of 1.2±0.3×10¹³M⊙ around ellipticals with stellar mass 2.6±0.3×10¹¹M⊙
[74]. Crucially, baryons dominate the core by an order of magnitude excess over dark
matter, comprise 27± 4% of the mass in the central ∼ 5 kpc, and this fraction falls as
expected to recover the constant value consistent with cosmological measurements in
the outskirts.
On the contrary, the Red-Sequence Cluster survey finds that elliptical galaxies live
inside ∼ 2× more massive dark matter haloes than spiral galaxies with the same stellar
mass [72]. The ratio of total baryons to dark matter in bound systems is probably
constant so, if these variations are real, they are most likely due to variations in the
efficiencies of star formation between morphological types of galaxies. Other studies
do find this to vary by the required factor of ∼ 2 [73] – although this involves several
assumptions about the loss of baryons from galaxies and the relative production of bright
stars versus faint stars.
As shown in figure 4, the conversion of stars into baryons is most efficient today in
galaxies of a characteristic mass of 1011–1012 M⊙ [75, 76, 77]. This scale has generally
grown over cosmic history, although evidence is also emerging for “cosmic downsizing”,
by which activity may be shifting back to less massive structures [78, 79]. Either side of
this scale, star formation is quenched by astrophysical effects, and the amount of total
mass needed to support a given luminosity increases [80, 81, 82, 83]. Even slightly
smaller <∼
1010 M⊙ dark matter haloes form very few stars, because their shallow
gravitational potential can not gather a sufficient density of baryons that are being
continually re-heated by a background of photoionising radiation from distant stars
and quasars [84, 85], or kept from being stirred and expelled by winds and supernova
explosions in any first stars [75]. The situation is less clear in more massive haloes,
although outflows from central supermassive black holes certainly contribute to an
inability of baryons to cool and condense into sufficiently dense regions to then collapse
into stars [86].
The dark matter of gravitational lensing 11
3.2. Amount of dark matter in groups and clusters of galaxies
Larger structures have grown through the gradual merger of small structures – which
deepened the gravitational potential well, and accelerated the accretion of more mass
into runaway collapse. According to the Sheth-Tormen/elliptical collapse model of
structure formation [91], 10% of the total mass at the present day is contained
within galaxy clusters over 1014 M⊙ and another 15% within galaxy groups down to
1012 M⊙‡. This non-linear density enhancement exaggerated the dynamic range of
mass fluctuations from the early universe, which began with a Gaussian distribution to
a high level of accuracy. The most massive clusters today are very rare and, since only
slightly less dense initial fluctuations grew more slowly, the present number of haloes of
a given mass forms a steep “mass function” N(M), shown in figure 4. This steepness
means that the growth of clusters over time, N(M, z), is very sensitive to the collapse
process, including the nature of gravity [93, 94] as well as the amount and physics of dark
matter [103]. Conveniently, the dense concentrations of mass also create the strongest
gravitational lensing signal.
Galaxy groups and clusters can be found directly via gravitational lensing surveys
[104, 105]. Clusters sufficiently massive to produce strong lensing are generally already
known because of the corresponding overdensity of galaxies, although the detection
criteria for lensing is a cleaner function of mass. Weak lensing cluster surveys are
advancing even more rapidly. Several hundred cluster candidates have now been found in
weak lensing mass maps from the Canada-France-Hawaii telescope [106] and the Subaru
telescope [107]. Follow-up spectroscopy [108] has identified the baryonic component of
around 60% of these, yielding the redshifts required to place the clusters in N(M, z)
plane shown in figure 5, calibrate their mass through the geometrical distance to the
background galaxies, and also to rule out false detections due to the chance alignment
of multiple small structures along one line of sight [109]. The remaining ∼ 40% of
candidates are possibly chance alignments of unrelated small structures, or the random
orientation of aspherical haloes along the line of sight. Such effects must be carefully
considered in lensing surveys, which are sensitive to the total integrated mass along a
line of sight [110, 111]. Multicolour imaging is also needed to properly identify a clean
sample of source galaxies behind the cluster. Galaxies inside or in front of the cluster are
not lensed by it, and a study of the nearby Coma cluster [112] also shows that member
galaxies may even be radially aligned within it, so they will dilute the signal if they are
misidentified and accidentally included [113].
Gravitational lensing cluster surveys are clean but costly, since it is necessary to
find and resolve galaxies more distant than the structures of interest. The baryonic
components of clusters can be quickly identified from infra-red emission, which traces
old stellar populations and is unobscured by dust [115], the X-ray luminosity and
‡ To include half of the mass, it is necessary to consider haloes of 1010 M⊙, and 20% of mass has yet
to find its way into a bound halo at all. This is much less than in the older Press-Schechter/spherical
collapse model [92], in which 50% of mass was thought to be in groups and clusters.
The dark matter of gravitational lensing 12
Figure 4. The amount of total mass in astrophysical bodies. Left: The number
of galaxies with a given infra-red K-band luminosity in the 2dF [80, circles], SDSS
[89, squares] and local z < 0.1 surveys [90, stars]. In contrast to this, the dashed
line shows a theoretical model of the number of dark matter haloes as a function of
mass, assuming only cold dark matter physics in the growth of structure [82] (see also
[81]). This has been converted into luminosity assuming a fixed mass-to-light ratio. Its
normalisation is arbitrarily chosen to match at the knee of the luminosity function, but
can be adjusted by changing the model mass-to-light ratio. Importantly, the disparity
indicates that baryonic physics act to suppress star formation in low-mass or high-mass
haloes, and that these contain a very large proportion of mass that does not shine.
Right: Mass-to-light ratio as a function of the mass (all measured within the radius
at which the total density is 200 times higher than the mean density in the Universe),
from [72, 74, 76, 95, 96, 97, 98, 99, 100, 101, 102]. The majority of the luminosity
measurements are made in the B band, at redshift z ∼ 0.3 The dotted line shows the
prediction of semi-analytic models of galaxy formation [75].
temperature of intra-cluster gas [116], the Sunayev-Zeldovich (SZ) effect in which the
CMB is scattered to higher energy off warm electrons [117, 118], and Doppler-shifted
light that reveals the clusters’ internal kinematics [119]. In particular, since X-ray
emission is proportional to the square of the electron density in intra-cluster gas, X-ray
surveys are less sensitive than lensing to the chance alignment of many small haloes
along a line of sight. However, the fundamental quantity most easily predicted by
theories is mass, and a scaling relation must be constructed from all of these luminous
observables to mass. The scaling relations often rely on poorly justified assumptions
about the dynamical equilibrium or physical state of the baryonic component [120, 121].
Inherent systematic errors can be investigated by an inter-comparison of the various
observables, but the ultimate comparison is now generally obtained versus gravitational
lensing [95, 122, 123, 124, 125]. Strong lensing arcs directly measure the enclosed mass
within the Einstein radius, providing a robust normalisation of the mass distribution,
and weak lensing traces the outer profile of the halo, where most of the mass is found.
The comparison with X-ray cluster surveys has been most astrophysically
The dark matter of gravitational lensing 13
1 10 100 1000L 0.1-2.4 keV . E(z) -1 [ 1042 h72
-2 erg s-1 ]
1013
1014
1015
1016
M20
0 . E
(z)
[
h 72-1
MO • ]
Hoekstra et al. 2007, CFH12kBardeau et al. 2007, CFH12kRykoff et al. 2008, SDSS, z=0.25Rykoff et al. 2008 boosted valuesBerge et al. 2008, z=0.14 to z=0.5Leauthaud et al. 2009, z=0.2 to z=0.9
Figure 5. Counting the number of clusters in the universe N(M, z), as a function
of their redshift z and mass M . Left: Directly detecting clusters via their weak
gravitational lensing signal, which probably provides the cleanest selection criteria,
using the Subaru telescope [114]. The three panels show different cuts in detection S/N,
which is a proxy for mass M . The red histogram shows clusters with spectroscopically
confirmed redshifts, the green histogram shows less secure clusters detected in weak
lensing but not yet confirmed, and the solid line shows the expected distribution. The
matching of weak lensing peaks with a baryonic counterpart requires a large investment
of follow-up telescope time, and is the current limitation to the method. There are
currently fewer confirmed clusters than expected, and there is considerable shot noise.
However, this technique shows great promise for the future, with dedicated wide-field
surveys. Right: Using weak lensing measurements of a subset of galaxies, groups and
clusters to calibrate other observables – in this case the X-ray luminosity – which can
then be used to estimate N(M, z) more cheaply.
interesting. The combination of strong lensing and X-ray measurements of galaxy
clusters was first advocated as a way to probe the dynamics of the intra-cluster gas
[126]. Initial disagreements in the overall normalisation [127, 128] have indeed been
much addressed by accounting for the effects of cool cluster cores on emission from the
intra-cluster medium. Finally, a comparison was completed of strong lensing, X-ray
and infra-red emission from 10 X-ray luminous (LX > 8 × 1044 ergs/s at 0.2-2.4 keV
inside R < 350 kpc) clusters at redshift z ∼ 0.2 [129]. As shown in figure 5, mass
measurements now generally agree for dynamically mature clusters with a circular X-
ray morphology and high central concentration of the infra-red light. However, at a
certain level, there is no such thing as a relaxed cluster. Major mergers leave more than
half of systems dynamically immature, and estimates of their mass from the complex
X-ray morphologies are particularly problematic [130]. In these cases, only lensing mass
estimates appear viable.
The dark matter of gravitational lensing 14
3.3. Amount of dark matter in large-scale structure
Large weak lensing surveys of “cosmic shear” along random lines of sight can be
used to study the distribution of mass on the largest scales, and the mean density
of the Universe (Ωm, which is usually expressed in units of the fraction of the density
required to just close the Universe and prevent perpetual expansion). The amount of
mass clumped on different scales is usually parameterised in terms of the (two-point)
correlation ξE between the cumulative shear distortion along lines of sight to pairs of
galaxies separated by an angle θ on the sky, as illustrated in figure 6. In isolation,
current cosmic shear constraints on Ωm are degenerate with σ8 (see figure 7), another
parameter in cosmological models that normalises the amount of clumping of matter on
a fixed scale of 8h−1 Mpc – in this sense, it describes the physical size of the clumps.
At a redshift z = 0.3, where many recent cosmic shear surveys are most sensitive,
8h−1 Mpc corresponds to an angular size of ∼ 43 arcminutes on the sky (about one
and a half times the diameter of the full moon). The degeneracy between Ωm and σ8 is
gradually being removed, as larger cosmic shear surveys measure probe the distribution
of dark matter with statistical significance on both larger and smaller scales. Extensions
towards large scales are particularly welcomed, because very large-scale structure is still
collapsing linearly, so theoretical predictions are calculable from first-order perturbation
theory. The degeneracy is also being broken by the first measurements of the three-point
correlation function of galaxy triplets [95, 131, 132], which is sensitive to the skewness
of the mass distribution, and depends in an orthogonal way upon Ωm.
The “clumpiness” of matter naturally increases as the Universe transitions from an
almost uniform state at high redshift to the structures we see around us today. The
rate of growth of this structure also depends upon Ωm, since additional mass speeds
up gravitational collapse. The degeneracy between Ωm and σ8 present in a static, 2D
analysis can this be broken by comparing the density fluctuations at different epochs.
Figure 6 shows contraints of Ωm = 0.248 ± 0.019 from a comparison of the primordial
matter fluctuations captured in the Cosmic Microwave Background radiation [133] with
current structure seen in weak lensing measurements from the 50 square degree patch
Canada-France-Hawaii telescope Legacy Survey [134].
Even tighter constraints on Ωm, and unique insight into the nature of gravity as
it shapes dark matter, can be obtained by tracing the continual growth of structure
[135]. This can be obtained from gravitational lensing because, while nearby galaxies
are lensed by local structure between them and us, more distant galaxies are also lensed
by the additional mass in front of them, and the most distant galaxies are lensed by
mass throughout the Universe. The finite speed of light makes distance equivalent to
lookback time, so we can reconstruct the distribution of mass in distant structures
as it was when the light passed near and was lensed by them many billions of years
ago. Redshifts can be used as a proxy for the distance to each lensed galaxy, and are
measured from the spectrum of their emitted light or estimated from multicolour images.
The 2 square degree Hubble Space Telescope COSMOS survey is the largest optical
The dark matter of gravitational lensing 15
-2.0⋅10-5
0.0⋅100
2.0⋅10-5
4.0⋅10-5
6.0⋅10-5
8.0⋅10-5
1.0⋅10-4
1.2⋅10-4
1.4⋅10-4
1 10 100
ξΕ
θ [arcmin]
Figure 6. The large-scale weak lensing “cosmic shear” signal. Left: Measurement
of the 2D signal from the Canada-France-Hawaii telescope Legacy Survey [134]. This
traces the overall amount of mass in the Universe, projected along the line of sight, and
shows how it is more clumped on small scales than on large scales. Solid points show
the cosmological E-mode lensing signal, and open points show the B-mode, a tracer of
uncorrected systematic effects that should be consistent with zero. Right: The growth
of this signal over cosmic time, measured from the Hubble Space Telescope COSMOS
survey [136]. This uses the 3D locations of source galaxies to trace the distribution
of mass at different distance from the Earth. Dashed lines show the prediction of
the standard ΛCDM cosmological model. Error bars account for only statistical error
within the field and do not include the effect of using only a small field.
survey ever obtained from space, with extremely high quality imaging that resolves the
shapes of even small and faint galaxies at lookback times of more than 10 billion years.
Multiwavelength follow up of the field in about forty other wavelengths, from radio,
through IR, optical, UV and X-ray, provides the most accurate photometric redshift
estimates, for about 2 million galaxies [145]. The right hand panel of figure 6 shows
the essentially independent measurements of ξE(θ) as a function of time, witnessing the
growth of structure. Compared to a 2D analysis, this tightens statistical errors on Ωm
by a factor of 3 [136], yielding Ωm = 0.247 ± 0.016 from only a 2 square degree patch
of sky [17]. A continuous 3D cosmic shear analysis can potentially provide five-fold
improvements over a 2D survey [137, 138], making the investment of follow-up telescope
time very effective.
Galaxies can only be resolved to finite distances, and they did not even exist
in the very early Universe. As well as providing a snapshot of primordial density
fluctuations, the CMB may also provide the ultimate high redshift source that has
been gravitationally lensed by even more foreground matter [139, 140, 141]. Patterns in
the temperature of the CMB form shapes that become distorted by lensing in exactly
the same way as galaxies. More interestingly, lensing moves CMB photons without
The dark matter of gravitational lensing 16
CMB
Weak Lensing
CMB + Weak LensingCMB + Weak LensingCMB + Weak Lensing
1.0
1.1
1.2
0.9
0.8
0.7
0.6
0.50.1 0.30.2 0.4 0.5 0.6 0.7 0.8 0.9 1.0
Figure 7. Constraints on cosmological parameters from the distribution of mass in the
early universe, traced by the WMAP satellite in the Cosmic Microwave Background
radiation, compared to the distribution of mass in the local universe from weak
gravitational lensing [133]. The parameter Ωm is the density of all mass in the
Universe, and σ8 is the normalisation of the power spectrum, describing its clumpiness
on 8h−1 Mpc scales. In each case, the two contours depict 68% and 95% confidence
limits, and assume a flat universe. The orthogonality of the two constraints, originating
from the evolution of the mass distribution between very different epochs, is key to
their combined power.
rotating their polarisation. Primordial density fluctuations from a scalar inflationary
field produce a curl-free (E-mode) polarisation signal, but this is mixed by lensing into
a non-zero B-mode signal [142]. This requires high angular resolution measurements of
the CMB and only upper limits have yet been measured [143]. To complicate matters
further, non-zero curl modes in the polarisation can also be created by foreground effects
such as dust emission, and tensor (gravity-wave) perturbations in the early Universe.
Most ambitiously, independent measurements of Ωm at vastly different cosmic
epochs could also constrain the conservation of mass in the Universe, although the
statistical error on this are likely to remain large for the foreseeable future.
4. Organisation of dark matter
4.1. Distribution on large scales
On the largest scales, dark matter forms a crisscrossing network of filaments, spanning
vast, empty voids, and with the largest concentrations of mass at their intersections.
The dark matter of gravitational lensing 17
Figure 8 compares the expected and observed distribution of mass. The 2 square
degree Hubble Space Telescope COSMOS survey was specifically designed to enclose
a contiguous volume of the universe at redshift z = 1 containing at least one example of
even the largest expected structures [144]. The filamentary network of mass revealed by
weak lensing measurements is apparent, and the multiwavelength imaging also provides
several tracers of baryons [145]. Optical and infra-red emission, when interpreted via
theoretical models of stellar evolution, can be used to infer the mass, age and other
properties of the star populations. X-ray imaging is sensitive to the gas in dense clusters
of galaxies that is heated sufficiently for it to glow at these shorter wavelengths.
The multicolour data also provide redshift estimates for each source galaxy that
can be used to extrude the observed map in 3D along the line of sight [147, 148]. This
technique has also been applied to the distribution of dark matter near the Abell 901/902
galaxy supercluster [149], resulting in the discovery of a previously unknown cluster CB1
that lay behind the foreground [150].
The large-scale distribution of mass can be described statistically in terms of its
power spectrum P (k), which is shown in the left hand panel of figure 9. This is the
Fourier transform of the correlation functions shown in figure 6, and measures the
amount of clumping on different physical scales. If the density field is Gaussian, the
same information can also be expressed as the mass function N(M, z), i.e. the density
of haloes of a given mass as a function of that mass and cosmological redshift. There
has been a substantial amount of work on analysing the properties of the dark matter
power spectrum, including its growth over time from a power spectrum of primordial
density fluctuations. In order to compare theoretical models to data, the semi-analytic
approach of [151] is used, predominantly for its simple fitting functions to the linear
power spectrum, which can be extended (at 5-10% accuracy) into the mildly nonlinear
high-k regime [152, 153].
In the early universe, photons were subject to density waves in which regions could
gravitationally collapse then, with the increased density providing pressure support,
rebound and oscillate. Large regions oscillated slowly, but smaller regions could complete
multiple cycles. The oscillations were frozen when the temperature of the Universe
dropped sufficiently for protons to capture electrons, and fluctuations that happened
to be particularly overdense or underdense are now seen as anisotropies in the Cosmic
Microwave Background. Since standard model particles were coupled to photons at
high energies, they were subject to the same density fluctuations, and also froze out at
decoupling. To this day, baryonic structures like galaxies exist preferentially at certain
fixed physical separations, known in the power spectrum as Baryon Acoustic Oscillations
(BAOs). Dark matter was initially not subject to these fluctuations, having a featureless
power spectrum. Indeed, it decoupled from the primeval soup (of photons and particles)
at very early times, and formed the first network of structures that acted as scaffolding
into which baryonic material could be drawn and assembled, then only later picking
up the preferred scales through gravitational interaction with the baryons. However,
in several candidate particle models, including supersymmetric particles, dark matter
The dark matter of gravitational lensing 18
Figure 8. The large-scale distribution of dark matter. (Left): The expected
distribution of dark matter at the present day, from the “Millenium simulation” (of a
Universe containing only cold dark matter) [146]. Each layer is zoomed from the last
by a factor of four, and shows the projected distribution of dark matter in slices of
∼ 20 Mpc thickness, colour-coded by density and local dark matter velocity dispersion
(Image credit: Volker Springel/Max Planck Institute for Astrophysics). (Right): The
observed large-scale structure in the Hubble Space Telescope COSMOS survey [148].
Contours show the reconstructed mass from weak gravitational lensing, obtained by
running the filters in the left hand panel of figure 2 across the observed distribution of
background galaxies shown the right hand panel of figure 2 (to improve resolution, the
conversion process actually used smaller, noisier bins each containing ∼ 80 galaxies).
Like an ordinary optical lens, a gravitational lens is most effective half-way between
the source and the observer. At redshift z ∼ 0.7, where the lensing measurements
are most sensitive, the field of view is about the same as the second layer from the
top in the left panel. However, the observations also include overlaid contributions
(at a lower weight) from all mass between redshifts 0.3–1.0 along our line of sight,
projected onto the plane of the sky. The various background colours depict different
tracers of baryonic mass. Green shows the density of optically-selected galaxies and
blue shows those galaxies, weighted by their stellar mass from fits to their spectral
energy distributions. These have both been weighted by the same sensitivity function
in redshift as that inherent in the lensing analysis. Red shows X-ray emission from
hot gas in extended sources, with most point sources removed. This has not been
rewighted, so is stronger from nearby sources, and weaker from the more distant ones.
couples to photons at energies even higher than the standard model particles. The
smallest density fluctuations would have had chance to oscillate once or twice, and
imprint their scales on even the primordial distribution of dark matter, as shown in
the right hand panel of figure 9 [88]. In addition, a warm or hot component dark
matter, such as low-mass neutrinos, could continuously free-stream away from any mass
concentrations that build up (refusing to be captured in dense regions of the Universe)
and erase structure on small scales (see Section 5.5 for more details).
The dark matter of gravitational lensing 19
Figure 9. The statistical distribution of dark matter in Fourier space. Left: The
mass power spectrum, showing the clumping of dark matter as a function of large
scales (low k) to small scales (high k) [87], including some very early weak lensing
constraints [154]. Current constraints are tighter and extend over a wider range of
scales in both directions. Right: The effect on the power spectrum of 1 MeV mass
WIMP dark matter that remains coupled to other particles in the early universe [88].
The solid (dashed) line assumes a 10 keV (1 keV) kinetic decoupling temperature. The
dotted line illustrates the similar small-scale damping effect of a component of warm
dark matter.
4.2. Sizes of individual haloes
In numerical simulations, collisionless dark matter particles form structures with a
remarkable, “universal” density profile across a wide range of mass scales from dwarf
galaxies to clusters. There may be some cluster-to-cluster scatter [155, 156, 157], but
the mean density profile ρ(r) is expected to rise as ρ ∝ r−3 in the outskirts, transitioning
to ρ ∝ r−β inside a scale radius rs that is a function of halo mass and formation redshift.
Early simulations found a central cusp with β between 1 and 1.5 [158, 159], but this
appears to have been an effect of their limited resolution, with more recent simulations
predicting a smooth decrease in slope towards a flat core [160]. This appears to be
converging, but thorough testing of the numerical simulations is continuing. Finalising
and comparing these predictions to the observed distribution of dark matter in real
clusters is a strong test of the whole collisionless CDM paradigm – as well as the nature
of gravity.
Individual galaxies of 1012M⊙ at z ∼ 0.22 have weak lensing signals that show
extended dark matter haloes, with large scale radii in agreement with simulations
[70]. Note that the astrophysics literature normally parameterises this in terms of the
‘concentration’ or ratio of the radius containing most of the mass to the scale radius
(individual galaxies are expected to have concentrations of around 7–13, and massive
clusters of 5–6). A sample of 98 galaxies acting as strong lenses was ingeniously found
The dark matter of gravitational lensing 20
10-2 0.1 1 10R [ Mpc h70
-1 ]
0.1
1
10
102
103
∆Σ
[ h
70
MO •
pc -
2 ] Baryons
Dark matter
Dark mattersatellite term
Large-scale structure
Figure 10. The observed radial distribution of mass around elliptical galaxies in the
Hubble Space Telescope COSMOS survey, decomposed into its various components
[177]. The solid blue curve shows the total “galaxy-galaxy” weak gravitational lensing
signal. On small scales around ∼ 10 kpc, this is dominated by the baryonic content
of galaxies represented by the red dashed curve. This particular data set is for a set
of elliptical galaxies whose spectral energy distributions indicate a similar amount of
mass in stars, and the central lensing signal increases as expected for galaxies with
larger predicted stellar masses. At intermediate scales around ∼ 200 kpc, dark matter
haloes become dominant: the main NFW halo term (dotted green), plus an additional
contribution (triple-dot-dash magenta) from occasions when the analysis focuses on
satellite galaxies in the halo of a larger host, rather than main galaxies. On large
scales above 3 Mpc, the galaxy-galaxy lensing signal reverts to the cosmic shear signal
from large-scale structure in which the galaxy is located (dot-dash grey).
by looking for multiple sets of spectral lines at different redshifts within sources that
need not even be resolved in low resolution imaging [171, 172]. A successful observing
campaign with the Hubble Space Telescope has now followed up ∼ 150 such targets,
with a 2 in 3 success rate of resolving strong lens systems [74]. Interestingly, the stacked
gravitational lensing signal behind them, in agreement with dynamical analysis, shows
an apparent conspiracy between the dark matter and baryonic components to produce
an overall “isothermal” ρ ∝ r−2 density profile out to very large (∼ 140 kpc) radii
[173, 174] (or even further [175]). Figure 10 demonstrates the conspiracy of central
baryons, the galaxy’s own dark matter halo, and the haloes of neighbouring galaxies;
none of them is individually isothermal [161, 74, 176, 177]. In addition, the location
of the transition from the host halo to large-scale structure marks the typical size of
dark matter structures and its occurrence at the scale expected from simulations itself
provides strong support for the CDM paradigm [72].
The dark matter of gravitational lensing 21
Galaxy clusters of 1014 − 1015M⊙ in the Sloan Digital Sky Survey also exhibit dark
matter haloes with scale radii rs in line with expectations [161]. Other surveys find
particularly massive clusters to have smaller scale radii (but the expected outer slope),
as would have happened if they had collapsed earlier, when the Universe was more dense
[294, 162, 163, 164, 165]. The baryons that accumulate in the cluster cores (not least
in the typically massive central galaxy) add a complication that is not included in the
simulations and difficult to disentangle in observations. Baryons form stars and radiate
away energy, falling further into a deepening gravitational potential well that also drags
in and increases the central concentration of dark matter [166, 167]. However, additional
baryonic effects would act in the opposite way, and the discrepancy may simply arise
from selection biases that favour the observation of haloes that are centrally concentrated
or triaxially elongated in 3D and oriented along our line of sight [168, 169]. Nonetheless,
these observations suggest the intriguing possibility of non-Gaussian density fluctuations
in the early Universe (potentially cosmic strings) that would have seeded accelerated
structure formation [170].
4.3. Shapes of haloes
In the standard cosmological model, dark matter haloes are expected to be significantly
non-spherical [178, 179]. Measurements of weak gravitational lensing in the Sloan
Digital Sky Survey confirm that the axis ratio of haloes around isolated galaxy
clusters (projected onto the 2D plane of the sky) is 0.48+0.14−0.19 [180]. This rules out
sphericity at 99.6% confidence and is consistent with the ellipticity of the cluster
galaxy distribution. Albeit with large statistical errors, the dark matter haloes around
individual galaxies appear slightly rounder than the light emission. In the Canada-
France-Hawaii Telescope’s (CFHT) Red Cluster Sequence (RCS) survey, the mean
ellipticity of dark matter haloes around all galaxies is 77+18
−21% that of the host galaxy
ellipticity [102]. This has been subdivided in SDSS to haloes around red (elliptical)
galaxies with 60 ± 38% of the ellipticity of their host galaxies, versus haloes around
blue (spiral) galaxies being anti-aligned with their host galaxies and more oblate by
40+70
−100% [181]. This dichotomy is also seen in the CFHTLS [101]. Such results confirm
that the dark matter haloes guided the formation of the cores of massive galaxies [182].
Constraints on the ellipticity of dark matter haloes may be two orders of magnitude
tighter from gravitational flexion than those from shear [183]. As survey get larger and
observations improve, the next step will be to test whether the haloes align with the
large-scale structure in which they formed. For example, tidal gravitational forces along
filaments may preferentially align haloes, elliptical galaxies, and the angular momenta
of spiral galaxies [184]. It has also been suggested [185, 186] that the average ellipticity
of dark matter haloes can be used to probe cosmological parameter σ8 (and to a lesser
extent Ωm), and the nature of gravity.
Very oblate mass distributions can produce three images of a strongly-lensed source,
as opposed to the usual double or quadruple images. The paucity of observed triple
The dark matter of gravitational lensing 22
image systems therefore suggests that most are quite spherical [169] – although the
expected abundance also depends upon the inner profile of the mass distribution.
For strong lenses with a small separation (<∼
5′′), the radial profile and hence the
image multiplicities depend sensitively on the alignment of the dark matter and central
baryonic components [187]. Conveniently however, although the orientation of an
individual galaxy (particularly spiral galaxies) with respect to the line of sight affects
its strong lensing cross-section, when averaged over all possible orientations or relative
orientations of dark matter and luminous components, the shape of a spiral or elliptical
galaxy does not bias the strong lensing signal by more than ∼ 10% [187, 188, 169].
Numerical simulations suggest that the dark matter haloes around spiral disc
galaxies have an additional interesting feature. Merging subhaloes approaching from
within or near the plane of the disc are gravitationally dragged into a “dark disc” [189],
which maintains a similar velocity dispersion to the stars that form the thick disc. A dark
disc would have important implications for dark matter direct detection experiments,
because of the low velocity of those dark matter particles with respect to the Earth.
However, the stellar disc is a small fraction of stellar mass, and it will be challenging to
detect an equivalent dark component via lensing (or dynamical) measurements.
4.4. Cusp versus core central profiles
Debate has been raging for several years about the inner profile of dark matter haloes
within the scale radius. Examples of elliptical galaxies shown in figure 11 have been
found with a cuspy β ≈ 1 inner dark matter component, as expected from the original
NFW simulations. These include the “jackpot” double Einstein ring, which provides
the best lensing-only galaxy mass profile, and also shows that a dark halo is required.
However, most observations tend to prefer a flatter profile, with a low β <∼0.5 on all
mass scales. For example, the kinematics of dwarf and low surface brightness galaxies,
which are expected to be dark matter dominated throughout, suggest a dark matter
distribution closer to a “core” (β = 0) and incompatible with NFW haloes [190, 191].
Rotation curves of spiral galaxies also indicate lower central densities than expected in
NFW haloes [192, 193, 194, 195]. The discrepancy is fundamentally interesting because
it could be due to the properties of dark matter: either the free-streaming of a partial
‘warm’ component away from the gravitational potential well, or a low level of (self-
)interaction via the weak force to provide pressure support and thus prevent collapse
[196, 197]. However, neither provides a complete explanation. For example, it has
been pointed out that the self-annihilation of dark matter particles would only provide
significant heating in dense cores with cuspy slopes β & 1.5, even assuming a generous
interaction cross-section and efficient transfer of released energy into the baryons [83].
Slopes with β = 1 provide a factor of 1000 less heating.
Galaxies that can be further studied because they act as strong gravitataional
lenses appear to be a representative sample of all galaxies – chosen solely by the chance
of another source lying directly behind them. Two independent studies confirm that
The dark matter of gravitational lensing 23
Figure 11. Left: The “cosmic eye” elliptical galaxy lens [225]. If it is assumed that the
baryonic component of mass in the yellow lens galaxy traces the distribution of light,
the distribution of dark matter must be cuspy, in line with predictions from simulations
[226, 227]. Right: a rare alignment of two sources behind one elliptical galaxy
SDSSJ0946+1006 (after subtracting the foreground galaxy) [174]. This produced
concentric, near-perfect Einstein rings, and allows particularly precise measurement
of the radial slope of the mass distribution, since both rings constrain the total interior
mass. Both of these high resolution images were obtained with the Hubble Space
Telescope, but the second system was initially found in unresolved ground-based data,
from the spectroscopic signature of two sources at different redshifts [171].
the fraction of elliptical galaxies acting as a lens is independent of local environment
and stellar properties [209, 210]. More elliptical galaxies overall are found in clusters,
and simulations predicted that these would have a lower stellar to total mass ratio, and
more lensed images with larger arc radii [211]. However, the encouraging observational
result confirms that, at least within current statistical limits, the lens galaxy selection
have the same gross characteristics (e.g. inner profile slope, which increases the strong
lensing cross section) as those in the field, and there is negligible boost from additional
mass in large-scale structure.
The main challenge in extending the interpretation of the total mass near the
centres of haloes will be that most of that mass is baryonic, and therefore influenced
by additional astrophysical processes that require more work to be understood and
subtracted [198]. Observationally, galaxies appear sharply divided into (mainly faint,
discy and rapidly rotating) morphologies with a central cusp, and (mainly brighter,
boxy and slowly rotating) morphologies with a central core [212]. Cored galaxies also
tend to exhibit radio-loud active nuclei [213] and X-ray emission [214], confirming that
major merger events, especially the merging of binary black holes, profoundly impact
the central distribution of baryons. Simulations demonstrate that baryonic cusps can
be gradually softened by stellar winds or supernovae. Dynamical friction can build up a
central baryonic cusp, but preserve the overall mass distribution by softening the dark
matter core even if 0.01% the total mass exists in subclumps [199, 200]. The dark
matter profile can also be softened by scattering from or accretion onto central black
The dark matter of gravitational lensing 24
holes, especially when tidally stirred by infalling satellites [201, 202]. Any remaining
mass is rearranged into flat (β ≈ 0) cores particularly efficiently in low-mass dwarf
galaxies or if the mass loss events are intermittent [203].
Massive clusters of galaxies provide more multiple strong lensing systems, including
radial arcs, and are marginally better understood. Since cuspy cores act as more efficient
gravitational lenses, the inner slopes of haloes can also be statistically constrained by
the abundance on the sky of any strongly lensed arcs [204, 205], the relative abundance
of radial to tangential arcs [206], and the relative abundance of double- to quad-imaged
systems [207, 169]. The high resolution of space-based imaging is particularly needed to
identify radial arcs, which are typically embedded within the light from a bright central
galaxy. A systematic search of 128 clusters in the Hubble Space Telescope archive
[208] found a uniform ratio of 12:104 radial to tangential arcs with large radii behind
clusters of a wide range of mass. This ratio is consistent with β < 1.6, although the
interpretation again depends upon the assumed mass of the central galaxies.
Studies of individual galaxy clusters have been particularly effective when
combining strong lensing measurements with optical tracers of the velocities of stars
within the central galaxy. Analysis of the cores of nearly round, apparently “relaxed”
clusters initially found β = 0.52 ± 0.05 [215, 216]. At the time, this was thought to be
low, and concerns were raised about various simplifying assumptions [217, 218, 219]. A
more sophisticated analysis [220] of two clusters has since reached similar conclusions.
However, degeneracies were noticed that could only be broken by mass tracers at larger
radii, and weak lensing observations are currently being used [221] to extend the range
of measurement.
Another interesting observable is the light travel time to multiple images of a
strongly-lensed source, which may differ by months or years (in a cluster, or weeks
or months in an individual galaxy) because of variations in both the geometric distance
and the accumulated amount of gravitational time dilation. If the source is itself variable
(e.g. a quasar with varying output), the relative travel time can be measured between the
images. This is usually used to determine the value of Hubble’s constant, by assuming
a mass distribution for the lens, often through the shape of strong lensing arcs, which
then specifies the relative distance and time dilation along the two paths [44, 222, 223].
However, if cosmological parameters are externally known, the same technique can be
used to improve constraints on the inner profile [224].
4.5. Substructure
Structures in the Universe grow hierarchically via the ingestion of progressively larger
objects, each of which themselves grew from the merging of smaller units. Not all of the
material in subhaloes is stripped from merging subhaloes and smoothly redistributed
amongst the cluster. Speculation still continues [228, 229, 156, 157] on the expected
fraction of mass in substructure, with estimates typically ranging from ∼ 5–65% and
options for the relatives sizes of the substructure shown in the left panel of figure 12.
The dark matter of gravitational lensing 25
According to semi-analytic models, the substructure mass fraction varies with cluster age
and assembly history, so “archaeological” investigation can probe dark matter physics
during mergers, and also “age-date” smooth haloes that formed early and grew little,
versus clumpy haloes that formed in a recent flurry of activity [129, 230, 231, 232].
The largest dark matter simulations currently resolve up to four generations of
vestigial haloes within haloes [233]. A robust prediction of several hundred first
generation subhaloes around galaxies like the Milky Way led to the well-known “missing
satellites problem”, because too few were observed. This issue is beginning to be
resolved, as larger and deeper surveys have finally unearthed a wealth of faint dwarf
satellite galaxies [234], each of which contains very few stars (see §3.1) but a lot of dark
matter [235]. To fine-tune the number of these “dark haloes”, the focus of the debate
has now switched from the nature of dark matter to astrophysical issues such as the
efficiency of star formation and reionisation. Beneath the four hierarchical generations of
substructure, simulations also contain an additional smooth component of dark matter.
This may imply that the fourth level is the end of the self-similarity, or may just be a
limitation of the simulation resolution. Endless, fractal self-similarly in the substructure
mass function is appealing because it implies a patchy distribution of dark matter within
the Milky Way [236]. If the Earth is currently within a void, this could explain the lack
of robust evidence for local dark matter from subterranean direct detection experiments.
However, testing this theory is difficult because star formation is so strongly damped
in small dark matter haloes that they can only be indirectly observed. Once again,
gravitational lensing provides the only tool to do this in structures outside the Local
Group, studies of which will soon become statistically limited by the small sample size
available.
Strong gravitational lensing is most sensitive to small mass variations close to
a line of sight, and multiple images in which light followed paths through the lens
separated by more than the scale of substructure provide a unique opportunity to
observe a source both with and without its effect. The smooth potential of a galaxy lens
affects all the multiple images in a coherent way, but substructure affects each image
individually. Thus the amount and mass function of substructure can be probed in
the relative positions, fluxes and time delay of multiple images of (point-like) quasar
sources [237, 238, 239], and also “fine structure” variations in (extended) galaxy sources
[240]. Caution must be taken to rule out discrepancies caused by differential light
propagation effects along alternative paths through the lens, and (for optical imaging of
quasar sources) potential confusion from month–year long microlensing events by stars
in the lens galaxy [241]. In both cases, multiwavelength imaging provides the quickest
solution. Firstly, infra-red light is much less absorbed or scattered. Multiwavelength
imaging of lensed quasars is especially useful because the intrinsic source image ahanges
size at different wavelengths. A coarse model of the mass distribution in the lens can
be determined from multiple imaging of the large (∼ 1 kiloparsec), low energy narrow
line emission region. Smaller substructure in the lens introduces millilensing (small
Einstein radius lensing) that perturbs the relative intensity or “flux ratios” of the same
The dark matter of gravitational lensing 26
B
C
D
A
G1G2
Figure 12. Substructure in galaxies’ dark matter haloes. Left: Expected fraction of
mass in subhaloes more massive than 105 M⊙ from a semi-analytic model incorporating
merger histories, survival probabilities and destruction rates of infalling substructure
[264]. Lines show models of standard cold dark matter (black) and warm dark matter
with various particle masses (colours). Error bars reflect statistical scatter between
realisations of the model calculations. Right: Adaptive optics 2.2 µm imaging of lensed
quasar B2045+265 [265]. The lensed images (A, B, C, D) have one of the most extreme
anomalous flux ratios known: models of lens galaxy G1 require that B should be the
brightest image, but instead it is the faintest, suggesting the presence of an additional
perturbing mass. Indeed, this high resolution imaging revealed a small satellite galaxy
(G2) that explains the anomalous flux ratio.
multiple images, as seen in higher energy radiation originating from the ∼ 1 parsec
broad line region [242]. The fraction of mass in stars within the lens can be found from
“microlensing densitometry” variations of the continuum emission from the ∼ 10−3 pc
central accretion disc [243, 244, 245].
Substructure of 104 − 107 M⊙ in elliptical galaxies provides the only explanation
for observations of anomalous flux ratios in multiply imaged quasars [241, 245, 246].
Indeed, very deep near-infrared imaging in one of these cases, shown in the right panel
of figure 12, did eventually find emission from one of the large pieces of substructure.
Curiously, the amount of substructure implied by millilensing seems to be greater
than that predicted by simulations, turning the missing satellites problem on its head
[247, 248]. Time delays from substructure lensing have also been tentatively detected
as changes in the order of arrival time of multiple images [249].
Within galaxy clusters, group-scale substructure was revealed from early ground-
based studies of strong lensing arcs [250, 251, 252], and subsequent Hubble Space
Telescope imaging refined the precision [34]. An sample of 10 clusters observed with
Hubble (5 of them including strong-lenses) demonstrated that (70 ± 20)% of clusters
contain major substructure, including multiple main density peaks [129]. In a further
sample of 20 strong lensing clusters it has recently been confirmed that the amount of
substructure required in parametric mass reconstructions is indeed anticorrelated with
the dynamical age of the cluster, as measured by the contribution of the brightest cluster
The dark matter of gravitational lensing 27
galaxy and the magnitude difference between the two brightest central galaxies, as seen
in near-infrared light [253].
The fundamental limitation with strong lensing techniques is the finite number of
sight lines through the Universe that end in a strong lens. Weak gravitational lensing
analyses can overcome this in the most massive clusters. The weak lensing signal is
sensitive to all mass within an extended radius of the line of sight, so the reconstruction
of the mass distribution is inevitably non-local, but individual 1011−1012.5 M⊙ subhaloes
can be found amongst the larger net signal from the host halo with HST imaging
[254]. A weak lensing analysis of five massive clusters [255] shows a significant signal
of substructure, excluding the possibility of an entirely smooth mass distribution, and
with a mass function N(M) of substructure that is noisy but consistent with simulations.
The substructure contributes 10–20% of the clusters’ total mass. On even larger (and
entirely statistical) scales, the accumulated presence of small-scale substructure can
move power to small scales k >∼100h Mpc−1 in the matter power spectrum, from large
scales 1 <∼
k <∼
100h Mpc−1 that should be accessible with the next generation of
dedicated cosmic shear surveys [256].
Flexion mapping is the most exciting compromise between these two regimes. The
flexion signal is more local than weak lensing and sensitive to the gradient of the mass
distribution, which can be large near substructure even when the total amount of mass
is not [257, 258, 259]. A direct reconstruction of the mass distribution from flexion
has been achieved in cluster Abell 1689 [260, 261], and revealed a new subclump not
resolved by weak lensing. The amount of substructure in dark matter haloes down to
masses of ∼ 109 M⊙ should also be statistically detectable as an excess variance in the
flexion signal [262]. The flexion signal has a (small and spatially uniform) component of
variance due to the intrinsic shapes of distant galaxies. This is unaffected by a cluster
with a smooth distribution of mass [263, 183], but any substructure will increase this
variance, which can be measured in radial apertures about a cluster centre, and averaged
over many clusters to overcome noise.
5. Properties of dark matter
5.1. Gravitational interaction
It is assumed in the default cosmological scenario that dark matter interacts via
normal Einstein gravity. The ubiquitous coincidence of mass and light on all scales
[294, 266, 148, 97] certainly demonstrates that dark matter and baryons are mutually
attracted. But the best probe of dark matter’s precise interaction lies in the tidal
gravitational stripping of dark matter subhaloes as they are accreted on to a larger
structure. High resolution simulations of galaxy clusters [267, 268] show that tidal
stripping should rapidly reduce the mass of dark matter subhaloes as they are accreted
on to a larger structure, compared to both isolated haloes and also those already at
the centre, which are only weakly affected by tidal forces. The stripped dark matter is
The dark matter of gravitational lensing 28
dispersed into the smooth underlying distribution.
Observational evidence confirms this scenario, although current statistical
uncertainties are large, since only the most massive clusters have substructure that
can be studied in detail, and homogeneous samples have only been gathered for a
few of these. Nevertheless, weak lensing measurements from CFHT show that typical
elliptical galaxies of a given brightness live inside haloes that extend to 377 ± 60 kpc
[102]. Independent measurements of galaxies with a different camera on CFHT yield a
size of ∼ 430 kpc in the outskirts of supercluster MS 0302+17, but galaxies near the
cluster core are truncated at a radius <∼290 kpc [266]. Higher resolution weak lensing
measurements are not possible from the ground because of the smoothing required
to achieve statistical precision, but an even more thorough treatment has been made
of galaxy cluster Cl 0024+1654, which has been observed extensively from HST. The
morphologies of the infalling galaxies appear to change dramatically only once they
fall within ∼ 1 Mpc of the cluster core [269]. However, as shown in figure 13, the
weak lensing signal around elliptical galaxies within 3 Mpc indicates truncated haloes
with a mean total mass of 1.3 ± 0.8 × 10¹² M⊙, compared to 3.7 ± 1.4 × 10¹² M⊙ for
similarly bright galaxies in the outskirts [270]. Indeed, different physical effects seem to
dominate in three distinct zones around a cluster [269, 270]. Outside the cluster virial
radius, galaxies are entering the cluster for the first time, and evolution is driven by the
rare interactions and mergers of individual objects [271]. Inside a transition region of a
few megaparsecs, tidal stripping of dark matter haloes begins to decrease the mass-to-
light ratio of galaxies that may make several passes through the cluster core. Within
the central megaparsec, tidal stripping is strongest, but baryonic effects including ram-
pressure stripping also affect the observed morphology of galaxies’ baryonic component.
There is slight evidence that tidal stripping in Cl 0024+1654 is less efficient than in
dark-matter only simulations [270], but this is probably due to additional baryonic
effects.
Measurements of strong lensing can push the analysis down to even smaller
(kiloparsec) scales. Parametric reconstructions of the haloes of elliptical galaxies
[272, 273, 36, 274, 210] confirm that cluster members have less massive dark matter
haloes than galaxies in the field, and are truncated at radii around 17-66 kpc, depending
on the cluster. There is also preliminary evidence that the inner profiles of galaxy
dark matter haloes are steepened by gravitational tidal effects during infall [210]. This
is expected from simulations [275], and also needed to resolve discrepancies between
measurements of Hubble’s constant from time delays in strongly lensed multiple images
behind a foreground cluster, and those derived from independent techniques. With
larger surveys planned in the future, this technique promises to be very fruitful in
constraining the properties of dark matter.
It is particularly important to pin down the interaction of dark matter with gravity
because all the current evidence for dark matter is gravitational. Indeed, many attempts
have been made to circumvent the need for dark matter by modifying general relativity.
Some of these theories of gravity can also predict the accelerating expansion of the
The dark matter of gravitational lensing 29
Figure 13. The removal of mass from the dark matter haloes around elliptical galaxies
of a fixed luminosity by tidal gravitational forces, as they fall into a large cluster [270].
Circles and triangles mark observations from gravitational lensing data, and squares
show predictions from the Millenium n-body simulation. The radial trend is consistent
with dark matter being stripped as expected by a full gravitational force; the different
normalisations reflect uncertainty in the overall mass to light ratio.
Universe, otherwise attributed to dark energy [276, 277, 278, 279]. Modifications
of general relativity generally involve additional source terms (e.g. a scalar field) to
explain individual phenomena, such as the fast rotation of galaxies or the separation
between X-ray and lensing signals in the bullet cluster [280, 281]. However, none of
these alternative theories has yet been able to consistently explain the whole range of
dark matter observations that are successfully verified within the standard cosmological
model, without requiring at least a small additional component of weakly interacting
mass [102, 282, 283, 284].
5.2. Electroweak interaction
The complex physical processes during the assembly of clusters from subhaloes stir up
the distribution of baryonic mass and obscure much of the behaviour of dark matter.
However, the differences between baryons and dark matter are also highlighted by their
different reactions to these processes. The most striking example of this, and the cluster
that has provided the most direct empirical evidence for dark matter, is undoubtedly
the “bullet cluster” 1E 0657-56 [285, 286, 287], shown in figure 14.
Galaxy clusters contain three basic ingredients: galaxies, intra-cluster gas, and dark
matter. Inconveniently for those trying to interpret the total mass distribution, these
ordinarily come to rest in approximately the same place. However, this is not always
the case. The bullet cluster is strictly two clusters that collided about 150 million years
The dark matter of gravitational lensing 30
Figure 14. The “bullet cluster” 1E0657-56 and “baby bullet” MACSJ0025.4-1222.
The background images show the location of galaxies, with most of the larger yellow
galaxies associated with one of the clusters. The overlaid pink features show X-ray
emission from hot, intra-cluster gas. Galaxies and gas are baryonic material. The
overlaid blue features show a reconstruction of the total mass from measurements
of gravitational lensing. This appears coincident with the locations of the galaxies,
implying it has a similarly small interaction cross-section. However, there is far
more mass than that present in the stars within those galaxies, providing strong
evidence for the existence of an additional reserve of dark matter. (Figure credit:
Left: X-ray: NASA/CXC/CfA/ M.Markevitch et al.; Lensing Map: NASA/STScI;
ESO WFI; Magellan/U.Arizona/ D.Clowe et al. Optical image: NASA/STScI;
Magellan/U.Arizona/D.Clowe et al.; Right: NASA/ESA/M.Bradac et al.).
ago, within or close to the plane of the sky, and the ingredients have become separated.
Rather like the scattered ejections from a particle collider, the trajectories of the cluster
detritus are governed by the properties of its components. Since individual galaxies
within the clusters (and stars within those galaxies) are well-spaced, they have a very
low collisional cross-section: most continued moving during the collision, and today lie
far from the point of impact. On the other hand, intra-cluster gas was uniformly spread
throughout the incident clusters. This had a large interaction cross-section and was
slowed dramatically during the collision. The two concentrations of hot gas, seen in X-
ray emission, have now passed through each other, but have not travelled far from the
point of impact. The collision speed and gas density were sufficient for a shock front to
be observed in the gas from the smaller of the two clusters, allowing the determination
of the collision speed. Initial concern that the shock velocity of 4700 km/s is higher than
that expected for any merging haloes [288] has now been resolved by properly taking
into account the relative motion of the gas clouds in the rest frame of the smaller cluster.
Crucially, gravitational lensing observations require the third ingredient of the bullet
cluster. A great deal of extra mass (∼ 30− 40× than that seen in the galaxies’ stars) is
located near the galaxies, and 8σ away from the gas peaks. To have travelled so far, this
mass must have a self-interaction collisional cross section σ/m < 1.25 cm2g−1 at 68%
confidence (or σ/m < 0.7 cm2g−1 under the assumption that the mass to light ratio of
the initial clusters was the same) [289]. Note that this does not include a constraint on
the dark matter-baryon interaction cross section.
The dark matter of gravitational lensing 31
The visible separation between the three ingredients of each cluster is temporary.
Within another billion years, the mutual gravitational attraction of the galaxies, gas
and dark matter will have pulled them back together, spiralling back into the usual
configuration of baryonic material within a dark matter cocoon. Consequently, such
objects are rare. One very similar “baby bullet” object has been detected [290] (see right
panel of figure 14), as well as a “cosmic train wreck” counter-example [291], which shows
separated dark matter and gas components, but in a complex distribution that probably
implies a collision between three clusters. Collisions along the line of sight would provide
complementary information, but the one possible example [292] is probably an artefact
of spurious instrumental effects [293] and substructure within the cluster [294]. However,
the race is now on to find more bullet clusters, at a range of collision speeds, masses,
impact parameters and angles to the line of sight [295]. A statistical analysis of many
bullet clusters would overcome uncertainties in any individual system, and help dispel
any lingering doubts that a set of chance effects (or features of the nature of gravity)
conspire to produce the observed appearance.
5.3. Self-annihilation/decay
As discussed in §4.4, gravitational lensing observations of flat cores in the centres of dark
matter haloes could be explained by a finite self-interaction dark matter cross section.
Relying on this effect to produce cores in galaxy haloes requires a cross section σ ∼ 0.56-
5.6 cm2g−1 [296, 297]. However, smoothing the mass profile of clusters requires a much
larger σ ∼ 200 cm2g−1 [298]. If both are to be explained by self-interaction, either
the cross-section is velocity dependent and/or other astrophysical effects are dominant.
Self-interacting dark matter also generally produces haloes that are more spherical than
standard CDM, especially in the core [296], although current measurement uncertainty
is too large to discriminate. Measurements from the PAMELA satellite [299], ATIC
balloon [300] and of the WMAP haze [301, 302] tentatively suggest a high value of the
related dark matter-dark matter annihilation rate. These results are being greeted with
cautious skepticism, as similar effects have not been reproduced in other detectors that
ought to see decay products.
If axions exist as a component of dark matter, they would couple to standard-
model particles [303, 304] and should be detectable via photon-photon decay into a
single optical emission line with a flux proportional to the dark matter density. Integral
field spectroscopic searches for this signature emission from the dark matter haloes of
two galaxy clusters have benefitted from strong gravitational lensing [305]. The search
efficiency was improved by a factor of 3 over previous analyses by correlating the search
with strong lensing mass maps of the densest regions, where the emission from such
decays is expected to be strongest. The sensitivity for emission line detection in the
optical wavelength range allowed them to derive interesting upper limits on the two-
photon coupling in the mass range 4.5 eV< m < 7.7 eV. This work highlights the
potential of spectroscopy coupled with accurate maps of the dark matter distribution
The dark matter of gravitational lensing 32
to explore a larger axion mass window at higher sensitivity, and the same data can also
be used to constrain the decay rate of other ∼5 eV relics, such as sterile neutrinos.
5.4. Particles or planets?
In the broadest sense, “dark matter” refers to any matter that is undetectable through
either emission or absorption in the electromagnetic spectrum. Some astrophysical
objects are naturally dark, such as black holes — and we face technological limitations
in the detection of any faint sources. It is a particularly attractive proposition that a
large population of “dark”, ∼planet-sized Massive Compact Halo Objects (MACHOs)
contribute a major component of the missing mass but have so far evaded detection.
Such objects could be baryonic in nature and could even fit within our standard
understanding of stellar evolution, thus removing the need for any new particles.
There have been extensive and sustained efforts to characterise the number of
MACHOs in the halo of the Milky Way, its satellites the Large and Small Magellanic
Clouds, and our neighbouring galaxy Andromeda (M31). Even though MACHOs are not
visible themselves, whenever one passes in front of a star its gravitational microlensing
briefly brightens the star. Since the volume of space along lines of sight that would
cause microlensing is tiny, many millions of stars need to be continually monitored.
Looking towards 12 million stars in the Magellanic Clouds for 5.7 years, the
MACHO survey [306] found only 13–17 microlensing events (and some of these have
been challenged as supernovae or variable stars). At 95% confidence, this rules out
a model in which all of the Milky Way’s dark matter halo is (uniformly distributed)
MACHOs. However, if all events are real, the rate is still ∼ 3 times larger than that
expected from a purely stellar population, indicating either that they contribute up to
20% of the Milky Way halo’s mass [307], or a larger fraction of the Magellanic Cloud
halo, in less massive bodies [308]. Also looking towards the Magellanic Clouds, the
Experience pour la Recherche d’Objets Sombres (EROS) project [309] found only 1
event in 6.7 years of monitoring 7 million stars, compared to the 39 expected were local
dark matter composed entirely of 0.6 × 10⁻⁷–15 M⊙ MACHOs. Looking towards the
Magellanic Clouds and the densely populated central bulge of the Milky Way, the Optical
Gravitational Lensing Experiment (OGLE) [310, 311, 312] detected only 2 microlensing
events in 16 years, and even these events are consistent with self-lensing by stars, rather
than MACHOs [313, 310]. The OGLE results conclude that at most 19% of the mass
of the Milky Way halo is in objects of more than 0.4 M⊙, and that at most 10% is in
objects of 0.01–0.2 M⊙. The POINT-AGAPE experiment [314, 47] observed unresolved
(pixel) microlensing in the more distant Andromeda galaxy, and found that at most
20% of its dark matter halo is in 0.5–1.0 M⊙ mass objects (at 95% confidence).
The gravitational microlensing results provide convincing evidence that less than
20% of the mass of the Galactic halo is in the form of MACHOs. Coupled with
cosmological measurements of the baryonic and total mass density, this is strong
evidence that remaining dark matter must be non-baryonic. Weakly interacting massive
The dark matter of gravitational lensing 33
particles have become well-established as the favourite candidate. However we note that
while MACHOs down to planet mass scales have been convincingly ruled out, the jump
in scale from this to a sub-atomic description is not one that should necessarily be taken
for granted.
The rarity of MACHOs has meant that every individual event has become a great
source of information. An industry of follow up observations has developed to help
try to determine the nature of massive compact objects as either neutron stars, black
holes/dwarfs or something more exotic.
5.5. Warm and Hot Dark Matter
If dark matter is in thermal equilibrium, the mean velocity of the particles can be
characterised by a dark matter temperature. If the dark matter particles were produced
in the early Universe by standard “freeze-out” from a primordial soup, this temperature
is also related to the mass of the particles. Relativistic free-streaming of dark matter
particles lighter than ∼ 1 MeV would have suppressed subsequent gravitational collapse.
The large-scale structure visible today, and that in the Cosmic Microwave Background
[315], require the dominant component of dark matter to have been dynamically cold and
therefore massive. However, it seems most likely that dark matter consists of several
components, potentially including a small contribution of dynamically warm or hot
particle species such as gravitinos or massive neutrinos. Massive Majorana (να = να)§
neutrinos also provide an attractive theoretical explanation for the baryon asymmetry
[316]. Note that, although very light, sterile neutrinos (which do not couple with any
standard electroweak interaction) or axions would be dynamically cold, since they were
produced due to symmetry breaking and have never picked up large kinetic energy by
being in thermal equilibrium with the Universe.
Neutrino particle physics and astronomy first joined forces to explain the “solar
neutrino problem”, that fewer electron neutrinos than expected are detected from the
Sun. The Solar Neutrino Observatory (SNO) [317] explained this deficit as the oscillation
of electron neutrinos to other (µ or τ) flavours en route to Earth. SuperKamiokande
[318] studied cosmic ray collisions and found a similar result that only ∼ 1/3 the flux
of muon neutrinos νµ from cosmic ray collisions in the atmosphere were observed along
the line-of-sight through the Earth. This implies an oscillation of νµ to some other
flavour with a scale length comparable to the radius of the Earth. Further evidence
for neutrino oscillations comes from nuclear reactors (KamLAND, [319]) and neutrino
beam experiments (K2K, [320]). The LSND [321] results suggest the existence of sterile
neutrinos, and the MiniBOONE experiment [322] should confirm or refute this result.
There have also been cosmological constraints on the abundance of sterile neutrinos
[323].
§ For cosmological purposes the distinction between Majorana and Dirac neutrinos is not important.
However, astrophysics could feasibly detect the neutrinoless double beta decay possible with Majorana
neutrinos, thus constriaining neutrino mass (and distinguishing between normal or inverted hierarchies).
The dark matter of gravitational lensing 34
The rate of neutrino oscillations depends upon the (square of) the mass differences
between neutrino flavours. Current constraints on the mass differences from large
particle physics experiments are |δm23| ∼ 0.05 eV and |δm12| ∼ 0.007 eV. There are
currently no strong constraints on |δm13|, though upcoming experiments like T2K [324]
should measure this with an accuracy of ∼ 0.05 eV. Thus current constraints allow for
two possible orders of the massive neutrino hierarchy: m1 < m2 < m3 or the inverted
hierarchy m3 < m1 < m2. Particle physics experiments are planned that will measure
the absolute mass scale via the beta decay of Tritium [325, 326, 327, 328, 329, 330]. For
example, KATRIN [331] is expected to reach an accuracy of ∆mνe ∼ 0.35 eV. However,
providing useful information on the hierarchy configuration will require an accuracy of
∆mν < 0.1 eV [332].
If dark matter does include a component of massive neutrinos, they will have
left a key signature in the Cosmic Microwave Background [333] and in large-scale
structure [151, 334]. Neutrinos free-stream out of gravitational potentials, reducing
the amount of matter that can accumulate on small scales. This erases substructure in
dark matter haloes and softens their central cusps. This is observable via strong lensing
of galaxies [196, 197] and quasars [335, 336]. The altered flexion variance signal on due
to substructure could detect 2 keV neutrinos [262].
The suppression of small scale structure also shifts (free-streams) power onto
the larger scales accessible by weak lensing [337, 338, 339]. Current weak lensing
observations of the cluster mass function, in conjunction with the SDSS and 2dF galaxy
redshift surveys, constrain the total neutrino mass mν < 1.43 eV (at 95% confidence)
[340]. Two independent analyses of cosmic shear in the CFHTLS Wide survey [341, 342]
both tentatively find an upper limit ofmν < 0.54 eV (at 95% confidence) when combined
with data from the CMB (WMAP 3 year), supernovae and baryon acoustic oscillations.
Whilst these constraints are heavily dependent on priors, the statistical accuracy is well
matched to that expected from the size of the survey. The next generation of large,
three dimensional cosmic shear surveys expect to detect warm dark matter particles
with a mass of ∼ 5 keV [343] and constrain the effective number of neutrino species
Nν to ∼ 0.1 and ∆mν to within a few times 10−2 eV [344]. Weak lensing should even
be able to distinguish between inverted and normal neutrino hierarchies, because the
lighter species become relativistic at a higher redshift than more massive particles and
consequently have a different impact on the dark matter power spectrum P (k) [345] and
the weak lensing of the CMB [346].
6. Future directions
6.1. Hardware
Several facilities are being designed or converted for dedicated measurements of
gravitational lensing. The Japanese 8m Subaru telescope on Mauna Kea, Hawaii, shown
in the left panel of figure 15, was built with weak gravitational lensing measurements
The dark matter of gravitational lensing 35
Figure 15. The investigation of dark matter via gravitational lensing has a bright
near-term future. Left: The 8m Subaru telescope atop the 4200m inactive volcano
Mauna Kea, Hawaii. Subaru will soon receive an upgraded imaging camera, mounted
at prime focus – the top of the telescope and visible in the photo. Prime focus allows
a wide field of view, but requires sturdy support to avoid flexure of the optical path
as the telescope is pointed in different directions around the sky (credit: National
Astronomical Observatory of Japan). Right: Artist’s impression of the planned HALO
telescope, observing gravitational lensing from a long-duration balloon at an altitude
of 35km, above 99% of the Earth’s atmosphere (credit: NASA Columbia Scientific
Balloon Facility).
explicitly in mind. Its robust construction stabilizes the optical path and has produced
the highest quality imaging of all ground-based telescopes. A replacement is currently
being built for its 0.25 square degree field of view SuPrime-Cam imager. The next
generation, 1.5 gigapixel HyperSuPrime camera will have a 2.5 square degree field of
view [347], and will carry out a multiwavelength gravitational lensing survey covering
2000 square degrees. The KIlo Degree Survey (KIDS) should cover 1400 square degrees,
exploiting a new, 0.3 gigapixel, 1 square degree OmegaCAM optical imager on the
European 2.4m VST telescope at Paranal, Chile [348]. The Dark Energy Survey (DES)
will cover 5000 square degrees, using a 0.5 gigapixel, 2.2 square degree DECam imager
being designed for the 4m Blanco telescope at Cerro Tololo, Chile [350]. Most of
this survey will also be covered by the South Pole Telescope’s CMB survey to find
galaxy clusters via the Sunyaev-Zeldovich effect, allowing an important cross-correlation.
Looking further ahead the Large Synoptic Survey Telescope (LSST) is being planned,
with a 6m effective primary mirror and a 3.2 gigapixel optical camera [349]. All of these
surveys will include imaging at multiple optical and near-infrared bands in order to
obtain photometric estimates of galaxy redshifts and thus perform 3D lensing analyses.
Circumventing the drive toward ever-larger single-dish telescopes is the Panoramic
Survey Telescope and Rapid Response System (Pan-STARRS) on Haleakala, Hawaii
[351]. Survey imaging has just begun using a single 1.8m telescope (PS1) with a
1 gigapixel optical camera to cover a shallow but full-hemisphere Wide Survey plus a
70 square degree Medium Deep Survey (to the same depth as the Canada-France-Hawaii
telescope’s deep legacy survey, which covers only 1 square degree). The detectors include
The dark matter of gravitational lensing 36
the unique ability to transfer accumulated charge between pixels during an exposure,
following short-term variations in the atmosphere to improve image quality. Most
importantly, PS1 is a prototype for a much larger sequence of facilities. Construction
of PS2 has already begun: a duplicate unit that will be situated alongside and may
be used in conjunction with the original. Its goal will be to demonstrate that repeat
production of relatively small telescopes can be cost-efficient. If this is successful, two
more identical telescopes will be built to create PS4, all potentially housed in the same
dome but moved to a higher altitude site on Mauna Kea, and more still for PS16 situated
at various locations around the world, allowing 24 hour-a-day continual observation of
the sky [352].
There have been some attempts to use radio data to measure the weak lensing effect
[353, 354]. Such exploratory investigations suggest that surveys such as LOFAR and the
Square Kilometer Array (SKA) could use long baseline interferometry (approximately
300 to 500 km for the SKA frequencies) to image radio sources at a sufficient resolution
to measure weak lensing distortion [355, 356]. The expected sources are star-forming
galaxies, whose spatial density is uncertain, but whose intrinsic shapes are probably
more regular than usual radio sources. If possible, such radio observations would also
open up a whole new lensing regime: the large scale structure at very high redshift could
be inferred from lensing of the pre-galactic Hydrogen 21cm emission [357].
The most exquisite weak lensing measurements require telescopes above the Earth’s
atmosphere. The Hubble Space Telescope already offers imaging with more than ten
times higher resolution — and crucially stability – than even the Subaru telescope,
although over a narrow field of view [358]. The proposed High Altitude Lensing
Observatory (HALO), illustrated in the right panel of figure 15, will fly on a long-
duration balloon above 99% of the atmosphere. If its pointing accuracy can be
successfully stabilized, it will offer wide-field imaging of almost space-based resolution
for about the same cost as most cameras currently under construction for ground-based
telescopes. However, achieving the ultimate precision in lensing observations of dark
matter will eventually require deep imaging from a dedicated space-bourne telescope
in a dynamically and thermally stable environment at the Earth-Moon Lagrange point
L2. The SuperNova/Acceleration Probe (SNAP) and Dark Energy Space Telescope
(DESTINY) mission concepts proposed for the NASA/DoE Joint Dark Energy Mission
(JDEM) include major components of gravitational lensing surveys [360, 361]. At the
time of writing, the JDEM selection procedure is on hold, pending the outcome of the
US decadal review. The European Space Agency’s Euclid mission concept has been
designed explicitly with gravitational lensing as a primary science and instrumentation
driver. Euclid will image the entire extra-galactic sky (20, 000 square degrees) in optical
and infra-red with an image resolution and depth similar to the HST Deep Field, and
obtain spectra for a quarter of the lensed galaxies [362]. The Euclid dark matter science
objectives include providing a dark matter map of the Universe to a redshift of 2,
detecting hundreds of thousands of dark matter clusters and haloes from 108 M⊙ to
1015 M⊙ and constraining the neutrino mass, number and hierarchy to percent accuracy.
The dark matter of gravitational lensing 37
High resolution space-based imaging has also proven essential for measurements
of strong gravitational lensing, in which the most important factor is generally the
number of lensed sources resolved around each foreground mass (which can then be
cross-compared to remove degeneracies), rather than the total number of lenses on the
sky. About 1 in 200 elliptical galaxies are strong lenses, and about 1 in 90 strong lenses
provide something close to a double Einstein ring. An all-sky survey with Euclid should
therefore find several tens of thousands of strong lenses, several hundred double Einstein
rings, and maybe a “golden lens” with more. Following up all these detections with
spectroscopic observations to obtain their redshifts will require a significant investment
of time on ground-based telescopes such as some proposed 30m-class telescopes. The
proposed Observatory for Multi-Epoch Gravitational lens Astrophysics (OMEGA) space
telescope will continually monitor ∼ 100 strongly lensed Active Galactic Nuclei (AGN)
using near-UV to near-IR imaging and spectroscopy with a cadence of hours to days
[363]. AGN take on different physical sizes when observed at different wavelengths, so
each imaging band will be sensitive to millilensing by different masses of substructure in
the lens. The regular imaging will calibrate the physical size of the sources as a function
of wavelength, via the “reverberation mapping” technique, and also measure the time
delays between multiple images in order to better understand the lens geometry.
6.2. Software
Fully exploiting the wealth of new survey data will require simultaneous advances in
analysis techniques, computer hardware to implement those techniques on huge data
sets, and theoretical calculations against which the observations can be compared. As
appropriate for a mature scientific field, statistical weak lensing experiments will need
to simulate the entire experiment, from the growth of structure through observation
and data processing, in order to avoid systematics and correctly interpret the results.
This begins with computer simulations of structure formation – and while there is a
substantial existing industry of dark matter simulations, these tend to include neither
the complicating baryonic processes, nor the specific visualisation of dark matter as
seen by a lensing survey. For example, ∼ 10% biases can be introduced by simulations
too small to include even the largest coherent structures at any redshift [364], or by
simply integrating the mass distribution along radial lines away from the Earth [365].
Instead, it is necessary to raytrace backwards along the paths followed by light and
follow multiple deflections [366, 367]. Implementing this in petabyte-scale simulations
requires preplanned organisation of the output during runtime.
Simulations will then be required to realise images of the Universe through the
Earth’s atmosphere, the telescope’s point spread function (PSF) and distortions in the
optical path, and pixellisation and other effects at the detector. All of these change the
shape of a galaxy. But, while this forward process is easily mimicked, it is a challenging
inverse problem to start from the observed data and extract the underlying weak lensing
signal. Many image analysis techniques have been developed to measure galaxy shapes
The dark matter of gravitational lensing 38
and correct them for these effects. To make the challenge more difficult still, the most
distant galaxies, which contain the largest integrated lensing signal, are very faint and
noisy.
The archetypal weak lensing measurement method KSB measures galaxies’
quadrupole shape moments to infer the shear [55]. However, the physical simplicity
of KSB is known to be biased in some observational regimes and at low signal to noise.
A host of new methods have been developed and are now being used for the most recent
analyses. Two notable methods, lensfit [368, 369] and shapelets [370, 371, 372] both
work by forward-fitting a model galaxy shape that has been pre-convolved with the
PSF, in order to obtain a deconvolved image. Shapelets uses a model that generalises
KSB’s quadrupole moments to higher order. Lensfit uses a parametric model based
on the typical shapes of galaxies and in particular deals with the noisy regime via
a fully Bayesian framework. The Shear TEsting Programme (STEP) [373, 374], an
international collaboration of lensing groups, then the GRaviational lEnsing Accuracy
Testing (GREAT) [375, 376] scheme, which also included input from computer scientists
and experts in machine learning, have provided lensing simulations upon which methods
can be tested. Both schemes took the format of a blind competition, in which simulated
astronomical images containing a known weak lensing signal were distributed to entrants
(who were not told the input signal) for independent analysis. Flexion measurement
methods are still in relative infancy, but shapelets contain all the higher order shape
information necessary to construct flexion estimators [66, 377, 378]. The similar HOLICS
estimator [379] is identical to shapelets (and KSB) at low order, but uses non-orthogonal
moments at higher order. This improves the signal to noise, but at the expense of
correlated errors. All these flexion methods have been implemented on small amounts
of real data, and the FLexion Improvement Programme (FLIP) is underway to calibrate
them via simulated images.
The final step of a data analysis pipeline is to reconstruct the distribution of
mass from a gravitational lensing observable. Weak lensing shear and flexion are both
related simply to the projected mass in Fourier space [54, 68], but the conversion is
non-local and also noisy. Several methods have been developed to optimally filter the
reconstruction, the most successful being maximum entropy wavelet-based techniques
[380, 381]. Incorporating additional constraints from strong gravitational lensing is
not so simple, and usually requires iteration of a model until it matches the observed
positions, fluxes, redshifts and complex shapes of observed sources [382, 383]. Strong
lensing observations yield very high information density along lines of sight that lead to
an image, but zero elsewhere, and two styles have been developed to realise a continuous
mass model from this. Parametric models assume the mass distribution to have some
symmetry or to follow the distribution of light within a lens but, by construction, the
parameters are physical quantities of direct interest [34, 36]. Non-parametric models
avoid such assumptions, but require a large number of multiple images to provide
accurate mass reconstructions on different scales [35, 384]. One new method uses a
multi-scale adaptive grid to combine advantages of both styles [385]. This technique
The dark matter of gravitational lensing 39
should be able to simultaneously reconstruct the mass distribution on cluster, group
and galaxy scales, and therefore provides more accurate measurements of substructure.
7. Conclusions
During the past decade, there has been tremendous progress in the measurement of
gravitational lensing, and this has contributed to key observations of dark matter. We
now know that there is a lot of dark matter, and its distribution has been mapped
on a wide range of physical scales. Dark matter is certainly not baryonic, and
measurements are beginning to ascertain properties including its dynamical temperature
and interaction cross-section through fundamental forces with both itself and baryonic
matter.
In this revolution, the techniques of gravitational lensing have moved rapidly into
mainstream astronomy. Progress is most apparent in the field of weak gravitational
lensing, which is now a standard tool for many astrophysicists. The excited aniticipation
of a 1997 review [48] was quickly realised in the almost immediate detection of cosmic
shear, and has been brought by continual observational and technical advances into a
mature scientific field.
The future prospects are bright. The first telescopes purpose-built for gravitational
lensing measurements have just begun dedicated surveys. More facilities are being
planned and built – including pioneering space-based telescopes that will provide the
most discriminating data to investigate the dark sector. To keep pace with these surveys
and interpret the observations, image analysis techniques and theoretical calculations
are entering a new regime in precision. Over the next decade, particle physics may
find particles that are a candidate for dark matter; astrophysics will study the missing
matter directly. Together, we tiny specs of baryonic matter may be able to join up the
two sides of the dark Universe.
Acknowledgements
The authors would especially like to thank Alexie Leauthaud, James Taylor and Andy
Green for allowing them to include figures before their publication elsewhere. We are also
grateful for invaluable discussions with Phil Marshall, Andy Taylor, Fergus Simpson,
Alina Kiessling and the organisers and participants of the 2009 W. M. Keck Institute
for Space Studies workshop “Shedding light on the nature of dark matter”. We would
finally like to thank the two referees, whose helpful suggestions were much appreciated
and have greatly improved the whole article. RM is supported by STFC Advanced
Fellowship PP/E006450/1 and FP7 grant MIRG-CT-208994. TK is supported by the
STFC Rolling Grant number RA0888. JR is supported by a EU Marie-Curie Fellowship.
References
[1] Zwicky F., 1933, Helvetica Physica Acta 6 110
The dark matter of gravitational lensing 40
[2] Zwicky F., 1937, ApJ 86 217
[3] Smith S., 1936 ApJ 83 23
[4] Babcock H., 1939, Lick Obs. Bull. 19(498) 41
[5] Rubin V. & Ford W., 1970 ApJ 159 379
[6] Roberts M. & Whitehurst R., 1975, ApJ 201 327
[7] Oort J., 1940, ApJ 91 273
[8] Rubin V. C., Burstein, D., Ford, W. & Thonnard N. 1985, ApJ 289 81
[9] Persic m. & Salucci P., 1988, MNRAS 234 131
[10] Coc A., Vangioni-Flam, E., Descouvemont, P., Adahchour A. & Angulo C., 2004, ApJ 600 544
[11] Peebles J., 1982 ApJL 263 1
[12] Davis M., Efstathiou G., Frenk C. & White S., 1985, ApJ 292 371
[13] Efstathiou G., Davis M., White S. & Frenk C., 1985, ApJS 57 241
[14] Efstathiou G., 1990, Nature 348 705
[15] Springel V., Frenk C. & White S., Nature 440 1137
[16] Dunkley, J. et al. 2009, ApJS 180 306
[17] Lesgourgues J., Viel M., Haehnelt M. & Massey R. 2007, JCAP 11 8
[18] Chapman S., et al., 2008, MNRAS 390 1437
[19] Cole N., et al., 2008, ApJ 683 750
[20] Einstein, A., 1916, Annalen der Physik 49 769
[21] Dyson F., Eddington A. & Davidson C., 1919, Phil. Trans. Roy. Soc. 220 291
[22] Einstein A., 1936, Science 84 506
[23] Riess A. et al., 2009, ApJS 183, 109
[24] Treu T., 2009, ARA&A in press
[25] McBreen B. & Metcalfe L., 1987, Nature 330 348
[26] Hammer F., Gioia I., Shaya E., Teyssandier P., Le Fevre O. & Luppino G., 1997, ApJ 491 477
[27] Walsh D., Carswell R. & Weynmass R., 1979, Nature 279 381
[28] Soucail G., Fort,B., Mellier Y. & Picat J., 1987, A&A 172 14
[29] Kovner I., 1987, Nature 327 193
[30] Soucail G., Mellier Y., Fort B., Mathez G., Cailloux M., 1988, A&A 191 L19
[31] Lynds R. & Petrosian V., ApJ 336 1
[32] Le Fevre O., Hammer F., Angonin M., Gioia I., Luppino G., 1994, ApJ 422 5
[33] Wu X.-P. & Hammer F., 1993, MNRAS 262 187
[34] Kneib J.-P., Ellis R., Smail I., Couch W. & Sharples R., 1996, ApJ 471 634
[35] Broadhurst T. et al., 2005, ApJ 621 53
[36] Limousin M. et al., ApJ 668 643
[37] Stark D., Ellis R., Richard J., Kneib J.-P., Smith G. & Santos M., 2007, ApJ 663 10
[38] Myers, S. et al., 2003, MNRAS 341 1
[39] Chae, K.-H., 2003, MNRAS 346 746
[40] Koopmans, L. and the CLASS collaboration, 2001, PASA 18 179
[41] Oguri et al. 2006, AJ 132 999
[42] Oguri et al. 2008, AJ 135 512
[43] Bolton et al. 2006, ApJ 638 703
[44] Refsdal S. 1964, MNRAS 128 295
[45] Paczynski B. 1986, ApJ 304 1
[46] Gould A., 1996, ApJ 470 201
[47] Calchi Novati S., 2009
[48] Mellier Y., 1999, ARA&A 37 127
[49] Bartelmann M. & Schneider P., 2001, Phys. Rep. 340 291
[50] Refregier A. et al., 2004, AJ 127 3102
[51] Munshi D. & Kilbinger M. 2006, A&A 452 63
[52] Hoekstra H. & Jain B., 2008, ARNPS 58 99
The dark matter of gravitational lensing 41
[53] Blandford R., 1992, ARA&A 30 311
[54] Kaiser N. & Squires G., 1993, ApJ 404 441
[55] Kaiser N., Squires G. & Broadhurst T., 1995, ApJ 449 460
[56] Menard B., Scranton R., Fukugita M. & Richards G., MNRAS submitted (arXiv:0902.4240)
[57] Gray M., Ellis R., Refregier A., Bezecourt J., McMahon R., Beckett M., Mackay C. & Hoenig
M., 2000, MNRAS 318 573
[58] Schneider P., van Waerbeke L., Mellier Y., Jain B., Seitz S. & Fort B., 1998, A&A 333 767
[59] Bacon D., Refregier A., Ellis R.S. 2000, MNRAS 318 625
[60] Kaiser, N. et al., 2000, arXiv:astro-ph/0003338
[61] Van Waerbeke L. et al., 2000, A&A 358 30
[62] Wittman D. et al., 2000, Nature 405 143
[63] Goldberg & Natarajan 2002, ApJ 564 65
[64] Irwin & Shmakova, 2003 arXiv:astro-ph/0308007
[65] Irwin & Shmakova, 2006 ApJ 645 17I
[66] Goldberg D. & Bacon D., 2005, ApJ 619 741
[67] Bacon D., Goldberg D., Rowe B. & Taylor A., 2006, MNRAS 365 414
[68] Bernstein G. & Nakajima R. 2009, ApJ 693 1508
[69] Bacon D. & Schaefer B., 2009, MNRAS 396 2167
[70] Mandelbaum R., Seljak U., Kauffmann G., Hirata C., Brinkmann J., 2006, MNRAS 368 715
[71] Read J. & Trentham N., 2005, RSPTA 363 2693
[72] Hoekstra H., Hsieh B., Yee H., Lin H., Gladders M., 2005, ApJ 635 73
[73] Guzik J. & Seljak U., 2002, MNRAS 335 311
[74] Gavazzi R. et al. 2007, ApJ 667 176
[75] van den Bosch F., Yang X. & Mo H., 2003 MNRAS 340 771
[76] Parker L., Hudson M., Carlberg R. & Hoekstra H., 2005, ApJ 634 806
[77] Shankar F., Lapi A., Salucci P., De Zotti G. & Danese L., 2006, ApJ 643 14
[78] Juneau S. et al., 2005, ApJ 619 L135
[79] Bundy K., Fukugita M., Ellis R., Targett T., Belli S. & Kodama T., 2009, ApJ 697 1369
[80] Cole S. et al. 2001, MNRAS 326 25
[81] Marinoni C. & Hudson M. J. 2002, ApJ 569 91
[82] Benson A., Bower R., Frenk C., Lacey C., Baugh C. & Cole S., 2003 ApJ 599 38
[83] Natarajan P., Croton D. & Bertone G., 2008, MNRAS 388 1652
[84] Efstathiou G., 1992, MNRAS 256 43
[85] Bullock J., Kravtsov A. & Weinberg D., 2000, ApJ 548 33
[86] Sanders J. & Fabian A., 2008, MNRAS 390 L93
[87] Tegmark M. et al., 2004, ApJ 606 702
[88] Hooper D., Kaplinghat M., Strigari L. & Zurek K., 2007, PRD 76 3515
[89] Kochanek C. et al., 2001, ApJ 560 566
[90] Huang J., Glazebrook K., Cowie L., & Tinney C., 2003, ApJ 584 203
[91] Sheth R., Mo H. & Tormen G, 2001, MNRAS 323 1
[92] Press W. & Schechter P., 1974, ApJ 187 425
[93] Thomas S., Abdalla F. & Weller J., 2008, (arXiv:0810.4863)
[94] Guzik J., Jain B. & Takada M., 2009, (arXiv:0906:2221)
[95] Bardeau S., Soucail G., Kneib J.-P., Czoske O., Ebeling H., Hudelot P., Smail I., & Smith G.,
2007, A&A 470 449
[96] Sheldon E. et al., 2007, (arXiv:0709.1162)
[97] Limousin M., Jullo E., Richard J., Cabanac R., Kneib J.-P., Gavazzi R. & Soucail G., 2009
(0906.4118)
[98] Limousin M. et al., 2009, A&A 502 445
[99] Dahle H., Outskirts of Galaxy Clusters: Intense Life in the Suburbs. Edited by Antonaldo
Diaferio, IAU Colloquium 195, p.200-204
The dark matter of gravitational lensing 42
[100] Heymans C. et al., 2008, MNRAS 385 1431
[101] Parker L., Hoekstra H., Hudson M., van Waerbeke L. & Mellier Y., 2007, ApJ 669 21
[102] Hoekstra H., Yee, H. & Gladders, M. 2004, ApJ 606 67
[103] Schuecker P., Caldwell R., Bohringer H., Collins C., Guzzo L., & Weinberg N., 2003, A&A 402
53
[104] Faure C. et al., 2008, ApJS 176 19
[105] Marshall P, Hogg D., Moustakas L., Fassnacht C., Bradac M, Schrabback T, Blandford R., 2009
ApJ 694 924
[106] Gavazzi, R. & Soucail, G., 2007, A&A 462 459
[107] Miyazaki S., Hamana T., Ellis R., Kashikawa N., Massey R., Taylor J. & Refregier A., 2007, ApJ
669 714
[108] Hamana T., Miyazaki S., Kashikawa N., Ellis R., Massey R., Refregier A. & Taylor J., 2009,
PASJ 61 833
[109] Hamana T. et al., 2003, ApJ 597 98
[110] Corless V., King L., & Clowe D. 2009, MNRAS 393 1235
[111] Corless V., & King L., 2008, MNRAS 390 997
[112] Gavazzi R., Adami C., Durret F., Cuillandre J.-C., Ilbert O., Mazure A., Pello R. & Ulmer M.,
2009, A&A 498 L33
[113] Medezinski E., Broadhurst T., Umetsu K., Oguri M., Rephaeli Y. & Benitez N., MNRAS
submitted (arXiv:0906.4791)
[114] Taylor J. et al., in prep.
[115] Lin Y.-T. & Mohr J. 2007, ApJS 170 71
[116] Vikhlinin A., Kravtsov A. & Nagai D. 2006, arXiv:astro-ph/0608330
[117] Bonamente M., Joy M., LaRoque S., Carlstrom J., Nagai D., & Marrone, D. 2008, ApJ 675 106
[118] Mroczkowski T. et al. 2009, ApJ 694 1034
[119] Blindert K., Yee H., Gladders M., & Ellingson E. 2004, IAU Colloq. 195 215
[120] Fort B. & Mellier Y., 1994, A&ARv 5 239
[121] Allen S. & Fabia A., 1998, MNRAS 297 57
[122] Hoekstra H., 2007, MNRAS 379 317
[123] Berge J. et al., 2008, MNRAS 385 695
[124] Marrone D. et al., 2009, ApJ 701 114
[125] McInnes R., Menanteau F., Heavens A., Hughes J., Jimenez R., Massey R., Simon P. & Taylor
A. 2009, MNRAS L301
[126] Miralda-Escude J., & Babul A. 1995, ApJ 449 18
[127] Smail I., Edge A., Ellis R., & Blandford R., 1998, MNRAS 293 124
[128] Allen S., Schmidt, R.. & Fabian, A., 2001, MNRAS 328 L37
[129] Smith G., Kneib J.-P., Smail I., Mazzotta P., Ebeling H., & Czoske O. 2005, MNRAS 359 417
[130] Bower R., Benson A., Lacey C., Baugh C., Cole S. & Frenk C., 2001, MNRAS 325 497
[131] Semboloni E. et al., in prep.
[132] Berge J. et al., in prep.
[133] Spergel D. et al., 2007, ApJS 170 377
[134] Fu L. et al., 2008, A&A 479 9
[135] Bacon D. et al., 2004, (astro-ph/0403384)
[136] Massey R. et al., 2007, ApJS 172 239
[137] Heavens A., 2003, MNRAS 343 1327
[138] Kitching T., Heavens A., Taylor A., Brown M., Meisenheimer K., Wolf C., Gray M. & Bacon D.,
2007, MNRAS 376 771
[139] Hu W., 2001, Phys. Rev. D 65, 023003
[140] Lesgourgues J., Perotto L., Pastor S. & Piat M., 2006, Phys. Rev. D 73, 045021
[141] Lewis A. & Challinor A., 2006, Phys. Rep. L. 429 1
[142] Efstathiou G. & Gratton S., 2009, JCAP 6 11
The dark matter of gravitational lensing 43
[143] Brown M. et al. [QUaD collaboration] 2009, arXiv:0906.1003
[144] Scoville N. et al., 2007, ApJS 172 38
[145] Capak P. et al., 2007, ApJS 172 99
[146] Springel V. et al., 2005, Nature 435 629
[147] Bacon D. & Taylor A., 2003, MNRAS 344 1307
[148] Massey R. et al., 2007, Nature 445 286
[149] Simon P., Taylor A., & Hartlap J., 2009, MNRAS 1298
[150] Taylor A. et al., 2004, MNRAS 353 1176
[151] Eisenstein D. & Hu W., 1998, ApJ 496 605
[152] Peacock J. & Dodds S., 1996, MNRAS 280 19
[153] Smith R., Peacock J., Jenkins A., White S., Frenk C., Pearce F., Thomas P., Efstathiou G. &
Couchmann H., 2003, MNRAS 341 1311
[154] Hoekstra H., Yee, H. & Gladders, M. 2002, ApJ 577 595
[155] Jing Y., 2000, ApJ 535 30
[156] Madau P., Diemand J. & Kuhlen M., 2008, ApJ 679 1260
[157] Diemand J. et al., 2008, Nature 454 735
[158] Navarro J., Frenk C. & White S., 1997 ApJ 490 493
[159] Moore B., Quinn T., Governato F., Stadel J. & Lake G., 1999, MNRAS 310, 1147
[160] Navarro J. et al., 2009, MNRAS in press (arXiv:0810.1522)
[161] Mandelbaum R., Seljak U., Cool R., Blanton M., Hirara C., Brinkmann J., 2006, MNRAS 372
758
[162] Gavazzi, R., Fort B., Mellier Y., Pello R., & Dantel-Fort M., 2003, A&A 403 11
[163] Comerford J. & Natarajan P., 2007, MNRAS 379 190
[164] Broadhurst T., Umetsu K., Medezinski E., Oguri M. & Rephaeli Y., 2008, ApJ 685 9
[165] Oguri M. et al., 2009, ApJ 699 1038
[166] Blumenthal, G. et al., 1986, ApJ 301 27
[167] Gnedin, O., Kravtsov, A., Klypin, A., & Nagai, D. 2004, ApJ 616 16
[168] Sheldon E. et al, 2009, ApJ 703 2217
[169] Mandelbaum R., van de Ven G. & Keeton C., 2009, MNRAS 398 635
[170] Mathis H., Diego J & Silk J., 2004, MNRAS 353 681
[171] Bolton A.., Burles S., Schlegel D., Eisenstein D. & Brinkmann J., 2004, AJ 127 1860
[172] Bolton A. et al., 2008, ApJ 682 964
[173] Nipoti C., Treu T. & Bolton A., 2008, MNRAS 390 349
[174] Gavazzi R., Treu T., Koopmans L., Bolton A., Moustakas L., Burles S. & Marshall P., 2008, ApJ
677 1046
[175] Sheldon E. et al., 2004, AJ 127 2544
[176] Johnston D. et al. 2007, ApJ 656 27
[177] Leauthaud A. et al., 2009, in prep.
[178] Allgood B., Flores R., Primack J., Kravtsov A., Wechsler R., Faltenbacher A. & Bullock J., 2006,
MNRAS 367 1781
[179] Jing Y. & Suto Y., 2002, ApJ 574 538
[180] Kathinka Dalland Evans A., & Bridle S., 2008, ApJ in press (arXiv:0806.2723)
[181] Mandelbaum R., Seljak U., Kauffmann G., Hirata C. & Brinkmann J., 2006, MNRAS 368 715
[182] Koopmans L. et al., 2006, ApJ 649 599
[183] Hawken A. & Bridle, S. 2009, MNRAS 400 1132
[184] Schneider M. & Bridle S., 2009 PRD submitted (arXiv:0903.3870)
[185] Ho S., Bahcall N., & Bode P. 2006, ApJ 647 8
[186] Johnston D., 2006, MNRAS 367 1222
[187] Minor Q. & Kaplinghat M., 2008, MNRAS 391 653
[188] Keeton C. & Kochanek C., 1998 , ApJ 495, 157
[189] Read J., Lake G., Agertz O. & Debattista V., 2008, MNRAS 389 1041
The dark matter of gravitational lensing 44
[190] Simon J., Bolatto A., Leroy A. & Blitz L., 2003, ApJ 596 957
[191] Kuzio de Naray R., McGaugh S. & de Blok W., 2008, ApJ 676 920
[192] Persic M., Salucci P. & Stel F., 1996, MNRAS 281 27
[193] Navarro J. & Steinmetz M., 2000, ApJ 528 607
[194] Binney J. & Evans N., 2001, MNRAS 327 27
[195] Gentile G., Salucci P., Klein U., Vergani D. & Kalberla P., 2004, MNRAS 351 903
[196] Spergel D. & Steinhardt P., 2000, PRL 84 3760
[197] Moore B., 2002, ASP conf ser. 254 245
[198] Nipoti C., 2009, (arXiv:0905.4565)
[199] El-Zant A, Shlosman I. & Hoffman Y., 2001, ApJ 560 636
[200] El-Zant A., Hoffman Y., Primack J., Combes F. & Shlosman I., 2004, ApJ 607 75
[201] Zhao H., Haenhelt M. & Rees M., 2002, New Astron. 7 385
[202] Read J. & Gilmore G., 2003, MNRAS 339 494
[203] Read J. & Gilmore G., 2005, MNRAS 356 107
[204] Wyithe J., Turner E. & Spergel D., 2001, ApJ 555 504
[205] Ma C.-P., 2003, ApJ 584 1
[206] Molikawa K. & Hattori M., 2001, ApJ 559 544
[207] Oguri M. & Keeton C., 2004 ApJ 610 663
[208] Sand D., Treu T., Ellis R. & Smith G., 2005, ApJ 627 32
[209] Faure C. et al., 2009, ApJ 695 1233
[210] Treu T., Gavazzi R., Gorecki A., Marshall P., Koopmans L., Bolton A., Moustakas L. & Burles
S., 2009, ApJ 690 670
[211] Hilbert S., White S., Hartlap J., & Schneider P., 2007, MNRAS 382
[212] Lauer T. et al., 2007, ApJ 664 226
[213] Balmaverde B. & Capetti A., 2006, A&A 447 97
[214] Pellegrini S., 2005, MNRAS 364 169
[215] Sand D., Treu T & Ellis R., 2002, ApJL 574 129
[216] Sand D., Treu T., Smith G. & Ellis R., 2003, ApJ in press (astro-ph/0309465)
[217] Dalal N. & Keeton C., 2003, (astro-ph/0312072)
[218] Bartelmann M. & Meneghetti M, 2004, A&A 418 413
[219] Meneghetti M., Bartelmann M., Jenkins A. & Frenk C., 2007, MNRAS 381 171
[220] Sand D., Treu T., Ellis R. Smith G. & Kneib J.-P., 2008, ApJ 674 711
[221] Newman D. et al., 2009, ApJ 706 45
[222] Coe D. & Moustakas L., ApJ submitted (arXiv:0906.4108)
[223] Suyu S., Marshall P., Auger M., Hilbert S., Blandford R., Koopmans L., Fassnacht C. & Treu
T., ApJ submitted (arXiv:0910.2773)
[224] Dobke B. & King L., 2006, A&A 460 647
[225] Stark D., Swinbank M., Elis R., Dye S., Smail I. & Richard J., 2008, Nature 455 775
[226] Smail I. et al., 2007, ApJL 654 33
[227] Dye S. et al., 2007, MNRAS 379 308
[228] Calcaneo-Roldan C. & Moore B., 2000, PRD 62 12 123005
[229] Moore B. et al., 2001, PRD 64 083516
[230] De Lucia G. et al., 2004, MNRAS 348 333
[231] Taylor J. & Babul A., 2005, MNRAS 364 535
[232] Smith G. & Taylor J., 2008, ApJL 682 73
[233] Springel V. et al., 2008, MNRAS 391 1685
[234] Strigari L., Bullock J., Kaplinghat M., Simon J., Geha M., Willman B. & Walker M., 2008,
Nature 454 28
[235] Kazantzidis S., Mayer L., Mastropietro C., Diemand J., Stadel J. & Moore B., 2004 (0312194)
[236] Kamionkowski M. & Koushiappas S., 2008, PRD 77 103509
[237] Chen J., Rozo E., Dalal N. & Taylor J., 2007, ApJ 659 52
The dark matter of gravitational lensing 45
[238] Williams L., Foley P., Farnsworth D., Belter J., 2008, ApJ 685 725
[239] Keeton C., 2009 MNRAS submitted (arXiv:0908.3001)
[240] Inoue K. & Chiba M., 2005, ApJ 634 77
[241] Kochanek C. & Dalal N., 2004, ApJ 610 69
[242] Moustakas L. & Metcalf B., 2003, MNRAS 339 607
[243] Morgan C., Kochanek C., Dai X., Morgan N. & Falco E., 2008, ApJ 689 755
[244] Pooley D., Rappaport S., Blackburne J., Schechter P., Schwab J. & Wambsganss J., 2009, ApJ
697 1892
[245] Minezaki T., Chiba M., Kashikawa N., Inoue K. & Kataza H., 2009, ApJ 697 610
[246] Dobler G. & Keeton C., 2006, ApJ 653 1391
[247] More A., McKean J., More S., Porcas R., Koopmans L., Garrett M., 2009, MNRAS 394 174
[248] Xu D. et al., 2009, MNRAS 398 1235
[249] Keeton C. & Moustakas L., 2009, ApJ 699 1720
[250] Pello R. et al., 1991, ApJ 366 405
[251] Kneib J.-P., Mellier Y., Fort B. & Mathez G., 1993, A&A 273 367
[252] Kneib J.-P., Mellier Y., Pello R., Miralda-Escude J., Le Borgne J.-F., Boehringer H. & Picat
J.-P., 1995, A&A 303 27
[253] Richard J. et al., MNRAS in press (arXiv:0911.3302)
[254] Natarajan P. et al., MNRAS submitted (astro-ph/0411426)
[255] Natarajan P. et al., 2007, MNRAS 376 180
[256] Hagan B., Ma C.-P. & Kravtsov A., 2005, ApJ 633 537
[257] Bacon D., Goldberg D., Rowe B. & Taylor A., 2006, MNRAS 365 414
[258] Leonard A., King L. & Wilkins S., 2009, MNRAS 395 1438
[259] Shapiro C., Bacon D., Hendry M. & Hoyle B., 2009, MNRAS submitted (0907.3635)
[260] Leonard A., Goldberg D., Haaga J. & Massey R., 2007, ApJ 666 51
[261] Okura Y., Umetsu K. & Futamase T., 2008, ApJ 680 1
[262] Bacon D., Amara A. & Read, J., 2009, arXiv:0909.5133
[263] Lasky P. & Fluke C., 2009, MNRAS 396 2257
[264] Zentner A. & Bullock J., 2003, ApJ 598 49
[265] McKean J. et al., 2007, MNRAS 378 109
[266] Gavazzi G., Mellier Y., Fort B., Cuillandre J.-C., Dantel-Fort M., 2004, A&A 422 407
[267] Ghigna S. et al, 2000, ApJ 544, 616
[268] Gao L., White S., Jenkins A., Stoehr F.& Springel V., 2004, MNRAS 355 819
[269] Treu T., Ellis R., Kneib, J.-P., Dressler A., Smail I., Czoske O., Oemler A. & Natarajan P., 2003,
ApJ 591 53
[270] Natarajan P., Kneib J.-P., Smail I., Treu T., Ellis R., Moran S., Limousin M. & Czoske O., 2009,
ApJ 693 970
[271] Ghigna S. et al, 1998, MNRAS 300, 146
[272] Natarajan P., Kneib J.-P., Smail I. & Ellis R., 1998, ApJ 449 600
[273] Natarajan P., Kneib J.-P. & Smail I., 2002, ApJ 580 11
[274] Halkola A., Seitz S. & Pannella M., 2007, ApJ 656 739
[275] Dobke B., King L., Fellhauer M., 2007, MNRAS 377 1503
[276] Song Y., Hu W. & Sawicki I., 2007, PRD 75 044004
[277] Hu W. & Sawicki I., 2007, PRD 76 064004
[278] Hu W. & Sawicki I., 2007, PRD 76 104043
[279] Camera S., Bertacca D., Diaferio A., Bartolo N. & Matarrese S., MNRAS in press (0902.4204)
[280] Bekenstein J., 2004, Phys. Rev. D, 70, 083509
[281] Zhao H. & Famey B., 2006, ApJ 638 L9
[282] Natarajan P. & Zhao H., 2008, MNRAS 389 250
[283] Knebe A., Llinares C., Wu X. & Zhao H., 2009, ApJ 703 2285
[284] Tian L., Hoekstra H. & Zhao H., 2009, MNRAS 393 885
The dark matter of gravitational lensing 46
[285] Markevitch M., Gonzales A., David L., Vikhlinin A., Murray S., Forman W., Jones C. & Tucker
W. 2002, ApJ 567 L27
[286] Clowe D., Gonzalez A. & Markevitch M. 2004, ApJ 604 596
[287] Clowe D., Bradac M., Gonzalez A., Markevitch M., Randall S., Jones C. & Zaritsky D. 2006,
ApJ 648 L109
[288] Koda J., Milosavlijevic M., Shapiro P., Nagai D. & Nakar E., 2007, (arXiv:0803.1803)
[289] Randall S., Markevitch M., Clowe D., Gonzalez A. & Bradac M., 2008, ApJ 679 1173
[290] Bradac, M. et al., 2008, ApJ 687, 959
[291] Mahdavi A., Hoekstra H., Babul A., Balam D. & Capak P., 2007, ApJ 668 806
[292] Jee M. et al., 2007, ApJ 661 728
[293] Boffi F. et al. 2007,“ACS Instrument Handbook”, Version 8.0, figure 4.2 (Baltimore: STScI).
[294] Kneib J.-.P, Hudelot P., Ellis R., Treu T., Smith G., Marshall P., Czoske O., Smail I. & Natarajan
P., 2003, ApJ 598 804
[295] Shan H. et al., in prep.
[296] Dave R., Spergel D., Steinhardt P. & Wandelt B., 2001, ApJ 547 574
[297] Ahn K. & Shapiro P., 2003, JKAS 36 89
[298] Ahn K. & Shapiro P., 2005, MNRAS 363 1092
[299] Adriani O. et al., 2009, Nature 458 607
[300] Chang J. et al., 2008, Nature 456 362
[301] Hooper D., Finkbeiner D. & Dobler G., 2007, PRD 76 083012
[302] Cumberbatch D., Zuntz J., Kamfjord Eriksen H. & Silk J., 2009, (arXiv:0902.0039)
[303] Baluni V., 1979, PRD 19 2227
[304] Crewther R., Di Vecchia P., Veneziano G. & Witten E., 1979, Phys. Lett. B 88 123
[305] Grin D., Covone G., Kneib J.-P., Kamionkowski M., Blain A. & Jullo E., 2007, PRD 75 105018
[306] Alcock 2000, ApJ 542 281
[307] Popowski P. et al. 2003, arXiv:astro-ph/0304464
[308] Calchi Novati S., De Luca F., Jetzer Ph. & Scarpetta G., 2006, A&A 459 407
[309] Tisserand P. et al., 2007, A&A 469 387
[310] Calchi Novati S., Mancini L., Scarpetta G. & Wyrzykowski L., 2009, MNRAS 400 1625
[311] Wyrzykowski L. et al. 2009, MNRAS 397 1228
[312] Udalski A., 2009, ASP Conference Series 403 110
[313] Zhao H.-S., 1999, COSMO-98 478 305
[314] Calchi Novati S. et al., 2005, A&A 443 911
[315] Spergel D. et al., 2007, ApJS 170 377
[316] Fukugita M., Yanagida T., 1986, Phys. Lett. B 174 45
[317] Ahmed S. et al. [SNO Collaboration], 2003, arXiv:nucl-ex/0309004.
[318] Fukuda Y. et al. [Super-Kamiokande Collaboration], 1998, Phys. Rev. Lett. 81 1562
[319] Eguchi K. et al. [KamLAND Collaboration], 2003, Phys. Rev. Lett. 90 021802
[320] Ahn M. et al. [K2K Collaboration], 2006, PRD 74,072003
[321] Aguilar A. et al. [The LSND Collaboration], 2001, PRD 64 112007
[322] Church E. et al. [The MiniBooNE Collaboration], 1997, FERMILAB-P-0898,available at
http://library.fnal.gov/archive/test-proposal/0000/fermilab-proposal-0898.shtml
[323] Seljak U., Makarov A., McDonald P. & Trac H., 2006, Phys. Rev. Lett. 97 191303
[324] Itow Y. et al. [The T2K Collaboration], 2001, arXiv:hep-ex/0106019
[325] McKellar B., 1980, Phys. Lett. B 97 93
[326] Vissani F., 2001, Nucl. Phys. B (Proc. Suppl.) 100 273
[327] Studnik J. & Zralek M., hep-ph/0110232
[328] Farzan Y. & Smirnov A., 2003, Phys. Lett. B 557 224
[329] Weinheimer C., 2003 Nucl. Phys. Proc. Suppl. 118 279
[330] Lobashev V., 2003, in the Proceedings of NPDC 17, ed. by N. Auerbach, Zs. Fulop, Gy. Gyurky,
and E. Somorjai, Nucl. Phys. A 719 153
The dark matter of gravitational lensing 47
[331] Osipowicz A. et al. [KATRIN Collaboration], 2001, arXiv:hep-ex/0109033
[332] Lesgourgues J. & Pastor S., Phys.Rept. 429 307
[333] Ma C.-P. & Bertschinger E., 1995, ApJ 455 7
[334] Viel M., Lesgourgues M., Haehnelt M., Matarrese S. & Riotto A., 2005, PRD 71 063534
[335] Xue Y.-J., & Wu X.-P., 2001, ApJL 549 L21
[336] Miranda M., & Maccio A., 2007, MNRAS 382 1225
[337] Hannestad S., Tu H. & Wong Y., 2006, JCAP 0606 025
[338] Abazajian K. & Dodelson S., 2003, Phys.Rev.Lett. 91 041301
[339] Cooray A., 1999, A&A 348 31
[340] Kristiansen J., Elgarøy Ø. & Dahle H., 2007, PRD 75 083510
[341] Tereno I., Schimd C., Uzan J.-P., Kilbinger M., Vincent F. & Fu, L., 2009, A&A 500 657
[342] Ichiki K., Takada M. & Takahashi T., 2009, PRD 79 023520
[343] Markevitch et al., in prep.
[344] Kitching T., Heavens A., Verde L., Serra P. & Melchiorri A., 2008, PRD, 77, 103008
[345] De Bernardis F., Kitching T., Heavens A., & Melchiorri A., 2009, arXiv:0907.1917
[346] Slosar A., 2006, PRD 73 123501
[347] Miyazaki, S. et al. 2006, SPIE 6269 9
[348] Arnaboldi M., Neeser M., Parker L., Rosati P., Lombardi M., Dietrich J. & Hummel W., 2007,
The Messenger 127 28
[349] Tyson A., 2002, Proc. SPIE 4836 10
[350] Lin, H., 2006, AIPC conf. 842 989
[351] Kaiser N. et al. 2002, SPIE 4386 154
[352] Kaiser N. et al. 2004, SPIE 5489 11
[353] Patel P., Bacon D., Beswick R., Muxlow T., & Hoyle B., 2009, arXiv:0907.5156
[354] Chang T.-C., Refregier A., & Helfand D., 2004, ApJ 617 794
[355] Schilizzi R. et al., 2007, SKA Memorandum 100
[356] Butcher H., 2004, Proc. SPIE 5489 537
[357] Pilipenko S., Demianski M., Doroshkevich A., & Gottlober S., 2007, Nuovo Cimento B Serie 122
1459
[358] Kasliwal M., Massey R., Ellis R., Miyazaki S. & Rhodes J., 2008, ApJ 684 34
[359] Richard J. et al., 2009, A&A 498 37
[360] Aldering G. et al., 2004, arXiv:astro-ph/0405232
[361] Morse J., Lauer T. & Woodruff A., 2004, Proc. SPIE 5487 1484
[362] Refregier A. et al., 2010, arXiv:1001.0061
[363] Moustakas L. et al., 2008, Proc. SPIE 7010 70101
[364] Fosalba P., Gaztanaga E., Castander F., & Manera M. 2008, MNRAS 391 435
[365] Van Waerbeke, L., Hamana T., Scoccimarro R., Colombi S. & Bernardeau F., 2001, MNRAS 322
918
[366] Teyssier R. et al., 2009, A&A 497 335
[367] Hilbert S., Hartlap J., White S. & Schneider P., 2009, A&A 499 31
[368] Miller L., Kitching T., Heymans C., Heavens A., & van Waerbeke L., 2007, MNRAS 382 315
[369] Kitching, T., Miller L., Heymans C., van Waerbeke L., & Heavens, A., 2008, MNRAS 390 149
[370] Refregier A. & Bacon D., 2003, MNRAS 338 48
[371] Massey R. & Refregier A., 2005, MNRAS 363 197
[372] Bernstein G. & Jarvis M., 2002, AJ 123 2
[373] Heymans C. et al., 2006, MNRAS 368 1323
[374] Massey R. et al., 2007, MNRAS 376 13
[375] Bridle S. et al. 2009, MNRAS in press (arXiv:0908.0945)
[376] Kitching T. et al., in prep.
[377] Massey R., Rowe B., Refregier A., Bacon D. & Berge J., 2007, MNRAS 380 229
[378] Goldberg D. & Leonard A., 2007, ApJ 660 1003
The dark matter of gravitational lensing 48
[379] Okura Y., Umetsu K. & Futamase T., 2007, ApJ 660 995
[380] Starck J.-L., Pires S. & Refregier A., 2006, A&A 451 1139
[381] Pires S., Starck J.-L. & Refregier A., 2009, IEEE signal Processing Magazine (arXiv:0908.4157)
[382] Bradac M., Schneider P., Lombardi M. & Erben T., 2004, arXiv:astro-ph/0410643
[383] Bradac M. et al. 2006, ApJ 652 937
[384] Coe D. et al. 2008, ApJ 681 814
[385] Jullo E. & Kneib J.P., 2009 MNRAS 395 1319