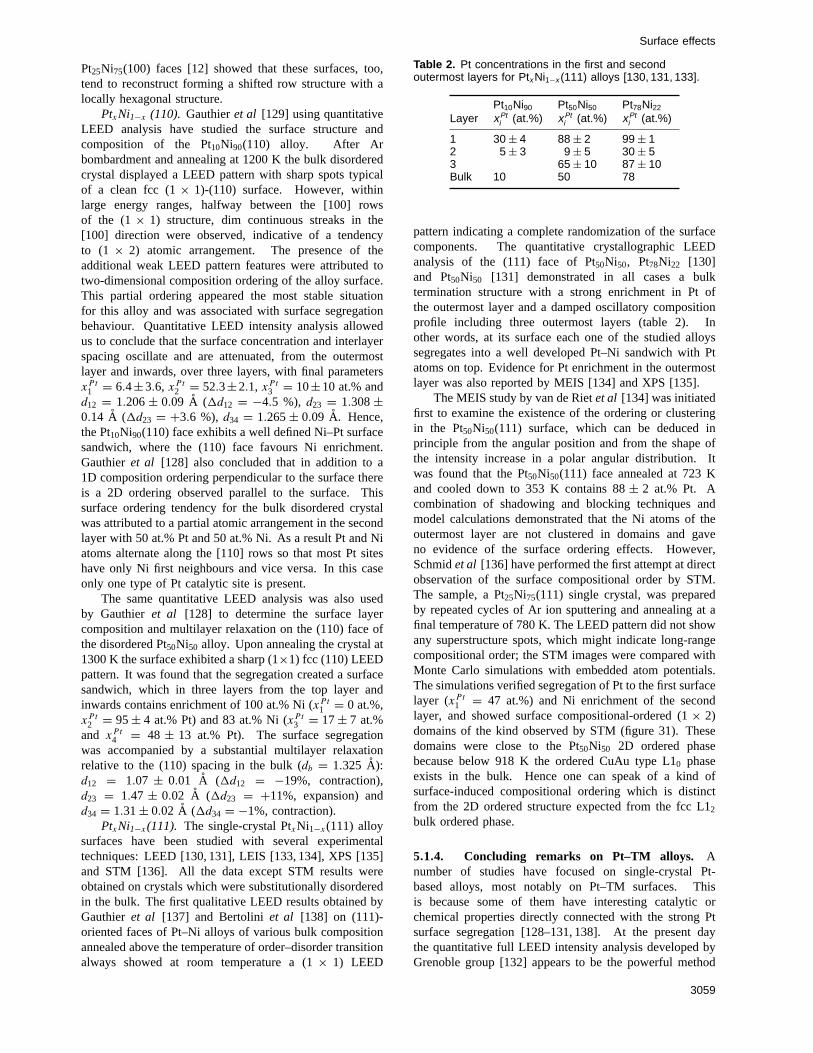
J. Phys. D: Appl. Phys. 30 (1997) 3037–3070. Printed in the UK PII: S0022-3727(97)69438-3 TOPICAL REVIEW Surface effects of ordering in binary alloys M A Vasiliev Institute of Metal Physics, National Ukrainian Academy of Sciences, Vernadsky Street 36, 252680 Kiev, Ukraine Received 7 February 1997, in final form 6 August 1997 Abstract. This article reviews the most important achievements in the studies of the compositional (chemical) and magnetic ordering effects in the surface region of single-crystal binary alloys with different bulk structures. These alloys include the non-magnetic and magnetic concentrated substitutional binary systems which have a tendency to ordering (Au–Cu, Cu–Pt, Fe–Pt, Co–Fe, Fe–Ni, Al–Fe, Al–Ni, Pt–Ti, Cu–Pd, Co–Pt, Ni–Pt, Al–Cu, Cu–Al). A number of analytical methods very sensitive to the surface region have been recently developed to obtain a more detailed knowledge of the crystallographic symmetry and lattice parameters, and these as well as compositional and spin order parameters of the outermost few atom layers of alloys are briefly described. Of primary interest are the following phenomena observed from the experimental studies of the various ordering alloys: the face-dependent bulk termination; surface composition and surface segregation oscillatory profile; face-related ‘sandwich’ segregation; strong surface multilayer and rippled relaxation as well as buckling in the first few layers; surface reconstruction and formation of the surface superstructure; the temperature-dependent surface compositional and magnetic order parameters; kinetics of the order–disorder phase transition; surface electron structure; surface ferromagnetic anomalies. After a review of the experimental data the interplay between theory and experiment is also discussed. This comparison has proved particularly useful for understanding the nature of the surface ordering effects in alloys. Contents Contents 3037 1. Introduction 3038 2. Non-magnetic ordered solid solution 3039 2.1. Cu 3 Au 3039 2.2. Cu 3 Pt(111) 3046 2.3. Pt 80 Fe 20 3047 3. Ferromagnetic ordered solid solution 3048 3.1. Co 0.5 Fe 0.5 : surface structure and composition 3048 3.2. Ni 3 Fe 3049 4. Intermetallic ordered compounds: surface layer structure and composition 3051 4.1. Fe 3 Al(110) 3051 4.2. Ni 3 Al 3053 4.3. Ni 0.5 Al 0.5 3053 4.4. Pt 3 Ti(100) and (111) 3055 4.5. Pt 3 Sn 3055 5. Random solid solution 3056 5.1. Ordering solid solution 3056 5.2. Compound-forming alloys 3060 6. Comparison of theoretical and experimental studies 3061 6.1. The surface order–disorder phe- nomena 3061 6.2. Ordering and surface segregation 3062 6.3. Surface magnetism 3064 6.4. Surface effects in magnetic ordered alloys 3065 7. Conclusions 3066 Acknowledgments 3067 References 3067 1. Introduction First it should be stressed that in the present review we consider only the two types of ordering which take place in the metallic alloys, namely, ‘compositional (or chemical)’ and ‘magnetic’. In the following, let us term these notions for simplicity also ‘order (ordering)’ and ‘magnetization’, respectively. The phenomenon of ordering in solid state physics is well known [1, 2]. At the beginning we will note only some general points in this connection. So, in the case of a completely ordered substitutional alloy with specific stoichiometric composition atoms of different sorts occupy only a certain type of site in the crystal lattice. When the 0022-3727/97/223037+34$19.50 c 1997 IOP Publishing Ltd 3037
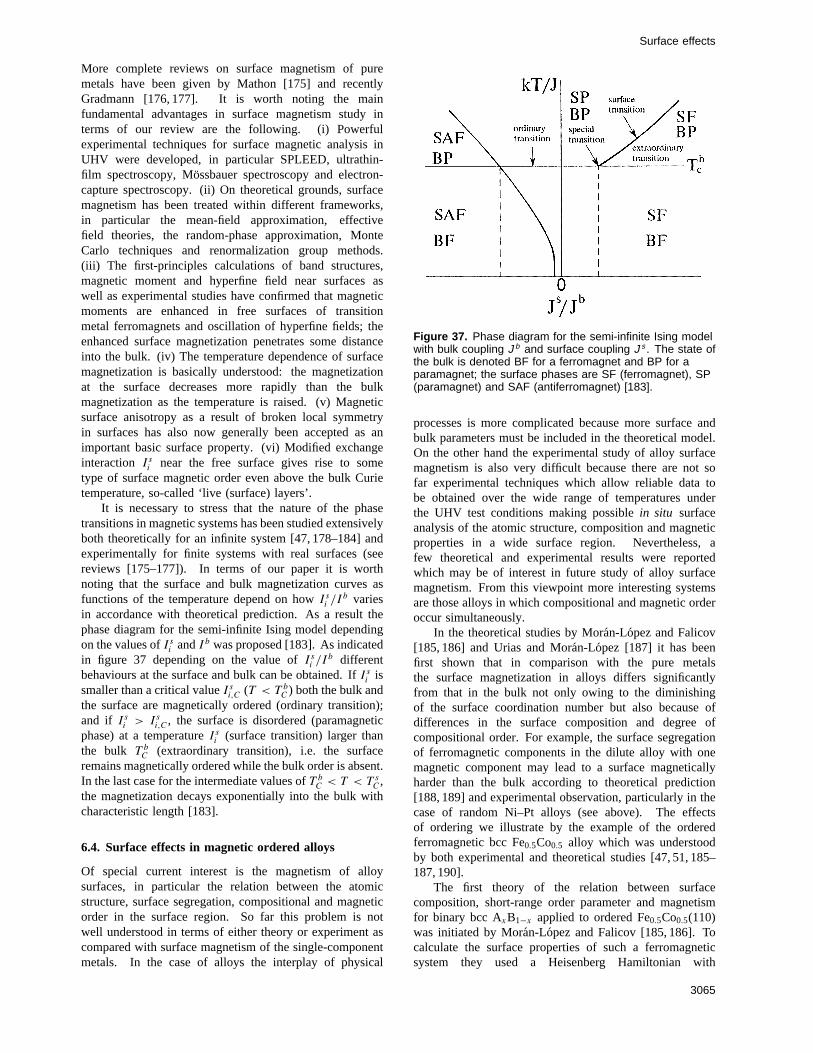
Transcript
J. Phys. D: Appl. Phys. 30 (1997) 3037–3070. Printed in the UK PII: S0022-3727(97)69438-3
TOPICAL REVIEW
Surface effects of ordering in binaryalloys
M A Vasiliev
Institute of Metal Physics, National Ukrainian Academy of Sciences,Vernadsky Street 36, 252680 Kiev, Ukraine
Received 7 February 1997, in final form 6 August 1997
Abstract. This article reviews the most important achievements in the studies ofthe compositional (chemical) and magnetic ordering effects in the surface region ofsingle-crystal binary alloys with different bulk structures. These alloys include thenon-magnetic and magnetic concentrated substitutional binary systems which havea tendency to ordering (Au–Cu, Cu–Pt, Fe–Pt, Co–Fe, Fe–Ni, Al–Fe, Al–Ni, Pt–Ti,Cu–Pd, Co–Pt, Ni–Pt, Al–Cu, Cu–Al). A number of analytical methods verysensitive to the surface region have been recently developed to obtain a moredetailed knowledge of the crystallographic symmetry and lattice parameters, andthese as well as compositional and spin order parameters of the outermost fewatom layers of alloys are briefly described. Of primary interest are the followingphenomena observed from the experimental studies of the various ordering alloys:the face-dependent bulk termination; surface composition and surface segregationoscillatory profile; face-related ‘sandwich’ segregation; strong surface multilayer andrippled relaxation as well as buckling in the first few layers; surface reconstructionand formation of the surface superstructure; the temperature-dependent surfacecompositional and magnetic order parameters; kinetics of the order–disorder phasetransition; surface electron structure; surface ferromagnetic anomalies. After areview of the experimental data the interplay between theory and experiment isalso discussed. This comparison has proved particularly useful for understandingthe nature of the surface ordering effects in alloys.
6. Comparison of theoretical and experimentalstudies 3061
6.1. The surface order–disorder phe-nomena 3061
6.2. Ordering and surface segregation 30626.3. Surface magnetism 30646.4. Surface effects in magnetic ordered
alloys 30657. Conclusions 3066
Acknowledgments 3067References 3067
1. Introduction
First it should be stressed that in the present review weconsider only the two types of ordering which take place inthe metallic alloys, namely, ‘compositional (or chemical)’and ‘magnetic’. In the following, let us term these notionsfor simplicity also ‘order (ordering)’ and ‘magnetization’,respectively.
The phenomenon of ordering in solid state physics iswell known [1, 2]. At the beginning we will note onlysome general points in this connection. So, in the caseof a completely ordered substitutional alloy with specificstoichiometric composition atoms of different sorts occupyonly a certain type of site in the crystal lattice. When the
temperature increases the atoms begin to fill foreign sitesand the concentration of the given sort of atoms on foreignsites increases with temperature, but the concentration ontheir own sites decreases.
At a certain critical temperatureT0 in a completelyordered alloy its symmetry changes during an order–disorder transition. As this takes place, the probabilityof site substitution atT0 may change discontinuously (thecase of a first-order phase transition) or continuously (thecase of a second-order phase transition) depending on thetype of alloy. The ordering of atoms in the crystal latticemay be characterized by the extent to which the differentsites forming a sublattice are occupied by the different sortsof atom. Consequently, the ordering may be consideredin relation to the lattice sites, and the degree of orderη,called the degree of long-range order (LRO), is determinedby the arrangement of atoms over the entire crystal. Thedegree of LRO fromη = 1 at room temperature decreaseswith increase in temperature and disappears (η = 0) at thecritical temperatureT0.
It is well established that the ordering in alloys hasa great influence on their properties. So, the electric,mechanical and other bulk properties of the alloys changestrongly upon ordering. Recent interest in orderedsystems for high-temperature, high-ductility applicationshas presented the challenge of understanding the geometricand electronic structure of ordered binary alloys andcompounds. In the case of ferromagnetic ordered alloystheir properties are dependent on not only the ordering butthe magnetization which is characterized by mean atomicmagnetic momentξ [3]. The nature of the interplaybetween ordering and magnetization in the bulk crystal iswell recognized [1, 4, 5].
However, the surface structure and properties of theboth non-magnetic and magnetic ordered alloys do notnecessarily reflect that of the bulk material. This maybe particularly important when considering, for example,an alloy’s strength at a grain boundary or in detailedunderstanding of its catalytic and corrosion behaviour, aswell as other chemical properties. In addition, adsorptionand desorption rates and chemical reactions on the surfacecan be influenced by order–disorder and magnetic phasetransitions. It is interesting that some ordering bimetalliccatalysts are known to have superior catalytic propertiesfor a number of catalytic reactions and are more activethan their pure components. However, ordered alloysurfaces have received increasing attention in the lastfew years not only in connection with their practicalimportance, but also because of fundamental interest inthe field of the phase transition mechanism in solids: inparticular, the interrelation between the bulk and surfacephase transition behaviour. It is known that terminationof a solid creates a surface, which universally can changeits atomic arrangement in both the 2D surface latticeand underlying atomic layers. Since the coordination ofatoms at the surface apparently differs from that of thebulk, the conduction-electron distribution at the surfaceis distinct from that in the bulk. As a result, theelectronic forces produced by this distribution cause thenew equilibrium crystallography structure of the surface to
be different from that of an ideal truncated bulk surface[6, 7]. As an example, a class of surface structurechanges, which have been studied extensively over thepast few years, are relaxation and reconstruction at theclean surface of some pure metals, i.e. rigid movementof one, or more, of the outermost surface layers with orwithout any atomic rearrangement (reconstruction) withinthe layers. The latter surface phenomenon is associatedwith a specific surface phase transition in the pure metals(W, Mo, Pt, Ir, Au). The studies of the layer relaxationand reconstruction for monoatomic clean surfaces haveled to insights which motivated us to investigate surfacebehaviour of the ordered single-crystal alloys. Thus,obtaining detailed crystallographic informations for suchobjects is a logical extension of past works on polyatomicsurfaces, since it can be inferred that various types ofrelaxation and reconstruction could be present in binaryalloy surfaces. However, alloys have an extra degree offreedom in the surface layers and can exhibit a numberof new phenomena which are absent in the bulk of thecrystal: in particular, different types of bulk terminationdepending on face orientation; buckling of the surfacelayers, i.e. a different relaxation of the sublattices; surfacesegregation, i.e. enrichment of the free surface by one of thecomponents; surface reconstruction induced by the surfacesegregation or adsorption of foreign species; surface orderin the absence of a LRO in the bulk and vice versa; changesof the surface phase transition order, kinetics, and thetemperature-dependent LRO and magnetization parametersin comparison with the bulk behaviour; last, a surface caninduce critical phenomena (‘wetting’) in the alloys with abulk first-order transition.
All the noted specific surface phenomena in the caseof ordered (ordering) alloy systems have been predictedfrom several theories since the first work by Valentaand Sukiennicki in 1966 [8] and confirmed by suitableexperimental techniques since the first experimental studiesby Nielsen in 1973 [9] and Sundaramet al [10] in 1973.Such experimental results and theoretical data are discussedin the present review by the examples of a number ofconcentrated substitutional alloy systems (non-magneticor magnetic) which have a tendency to compositionalordering. It should be stressed that we have focused ourattention only on the surface properties of well definedsingle crystals. Polycrystalline and amorphous alloysare out of the scope of the review, because the dataobtained on the single crystal give, firstly, the fundamentalface-dependent characteristics for the clean free surfaces,and, secondly, appropriate analysis in terms of basis-developed theoretical models. From the point of viewof an experimentalist who enjoyed surface research formany years we consider here only those theoretical studieswhich were compared with appropriate experimental data.Also we consider only the experiments which have beenperformed in conditions of ultra-high vacuum (UHV),with in situ surface cleaning by cycles of noble gas ionbombardment and thermal treatment in order to bringthe surface region to the equilibrium state. Let us listthe basic surface sensitivity techniques which have beenused to study the surface crystallographic, compositional,
3038
Surface effects
electronic states and magnetization of the ordered systems(in alphabetical order): Auger electron spectroscopy(AES), ionization spectroscopy (IS), low-energy electrondiffraction (LEED), low-energy ion scattering (LEIS) withtime-of-flight (TOF) analysis, photo-electron spectroscopy(PES), reflexion high-energy electron diffraction (RHEED),scanning tunnelling microscopy (STM), spin-polarizedLEED (SPLEED) and x-ray diffraction (XRD). The morecomprehensive data one can find in the recent reviews[11, 12] or in the appropriate references in the present paper.
The ordered (ordering) binary systems described in thereview are separated into two types: the concentrated solidsolution and compound-forming alloys, both non-magneticand ferromagnetic.
2. Non-magnetic ordered solid solution
2.1. Cu3Au
The Au–Cu alloy system became the favourite objectfor experimental as well as theoretical studies of therelationship between bulk and surface ordering behaviourmainly because its bulk properties and structure have beenwell established [1, 2].
2.1.1. Fcc L12 bulk structure. According to thebulk phase diagram the Au–Cu alloys reveal two typicalcompositional ordered phases: L12 (Cu3Au or Au3Cu) typeand L10 (AuCu) type [13]. In the disordered state suchalloys show the existence of a continuous series of solidsolutions of the substitutional type below the solidificationrange. In this case the alloys have an fcc structure, andatoms Cu (or Au) are encountered with equal probabilityat all lattice sites. The alloys which are close to theCu3Au composition are the most completely investigated.The Cu3Au phase is a classical ordering alloy, whose bulkproperties have been extensively studied. Such an alloywith stoichiometric composition Cu3Au becomes orderedupon the attainment of an equilibrium state below a criticaltemperatureT b0 of 663 K. In the ordered phase the Cu andAu atoms rearrange in such a way that the Au atoms occupythe corners of the cubic unit cell and the Cu atoms occupythe face-centred sites (figure 1). Obviously, the numberof sites of the second type is three times greater than thenumber of the first type. Thus the Cu3Au fcc ordered latticecan be subdivided into four simple cubic superlattices. Thissuperlattice structure can be determined, for example, byx-ray diffraction methods which show superlattice Braggpeaks. In this type of ordered alloy, as the temperatureincreases the bulk order parameterη = pAu − pCu, thedifference of the probability of Cu sitting on corners(pAu) and on face-centred sites (pCu), at first decreasescontinuously to some non-zero value, and then jumps tozero at the critical temperature. Thus a discontinuous firstorder–disorder transition occurs atT b0 . It is importantto point out that the critical temperature decreases withdeparture from the stochiometric composition in eitherdirection. The ordered phase exists over approximaterange 17 to 37 at.% of Au. This L12 ordered typeof superstructure is also exhibited by Au3Cu, Cu3Pd,
Figure 1. Unit cell for the Cu3Au ordered bulk structure(L12 superlattice).
The Au–Cu alloys with fcc structure whose compositionis close to 50 at.% possess the CuAu L10 type ofcrystal structure in the ordered state. In a completelycompositionally ordered alloy of stoichiometric CuAucomposition: both Au and Cu atoms are located inalternating atomic planes. In this case, as in Cu3Au thedegree of long-range order (LRO) at the order–disordertransition undergoes a step change. The disordered phaseexists at temperatures higher than approximately 685 K.Such a type of superlattice is observed in CoPt, FePd, FePtand also in some other alloys and compounds.
2.1.2. Surface structure and composition. Let usconsider the surface of only Cu3Au among Au–Cu alloysbecause it is the most completely investigated by severalsurface sensitivity techniques. On the other hand the Cu3Aualloy showed the most definitive evidence for surfaceordering. Owing to the interest of the surface order–disorder transition, the fcc Cu3Au alloy is the first one thathas been extensively studied above and belowT b0 .
(100) face.The first study of the Cu3Au(100) face wasreported by Nielsen [9]. He has used RHEED technique andobserved the superlattice pattern that appeared to coincidewith the (100) plane of the bulk ordered Cu3Au structure.Sundaramet al [10] have performed the first qualitativeLEED study and a bulk termination periodicity was alsoproposed for the Cu3Au(100) face atT < T b0 .
Other studies on the same alloy surface were performedlater in more detail also by quantitative LEED [14]. Potterand Blakely [14] observed LEED patterns produced byAr ion bombardment at 773 K followed by annealing at573 K and cooling to room temperature. This LEEDpattern was interpreted as c(2× 2) superstructure expectedfor the ideal termination of the ordered bulk crystal. Itmeans that the crystallographic structure of the outermostlayer is the same as that of a bulk crystallographic planeof the same indices. However, in the case of orderedCu3Au alloy, if a LEED pattern corresponding to bulktermination was observed, that does not necessarily meanthat the surface superlattice is exactly established. This isbecause in the ‘bulk termination’ model the atomic planesalong a specific bulk crystallographic direction do notnecessarily have all the same composition. For example,the atomic planes perpendicular to the〈100〉 direction havea stacking with a plane of composition CuAu alternating
3039
M A Vasiliev
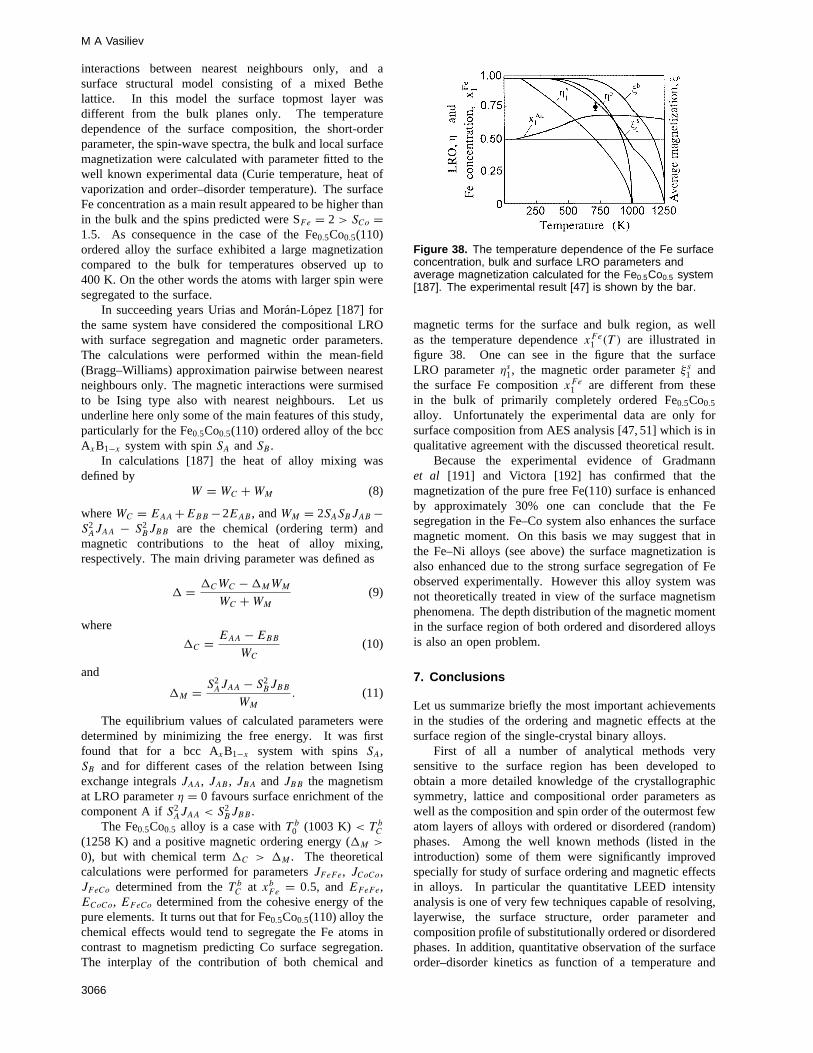
with a plane of pure Cu. A priori mixed and pure Cusurfaces correspond to ‘bulk termination’ and in both casesthe compositions of the outermost planes are different fromthe average one of the bulk (Cu0.75Au0.25). The questionof the type of termination in the ordered Cu3Au(100)alloy was first answered by Bucket al [15] using LEIS(TOF) supplemented by LEED and AES. It was found,in agreement with Potter and Blakely [14], that LEEDsuperlattice spots indicated LRO as the sample was cooledto room temperature after ion bombardment at 720 K.The quantitative LEIS (TOF) results for room temperaturewere consistent with an ordered (100) surface structurelike that of an ideally terminated fcc Cu3Au(100) crystalwith Au atom fractions in the first and second surfacelayers of 0.5± 0.2 (mixed layer) and 0.00 (pure Cu layer),respectively.
(110) face.This surface has been the subject of severalexperimental studies [14, 16–19]. It is interesting that the(110) face, in contrast with the (100) one, did not exhibitLRO according to the first qualitative LEED study by Potterand Blakely [14]. They concluded that the Cu3Au surfaceexhibited a (1× 1) diffraction pattern at room temperatureafter annealing at 773 K. But after 20 h annealing at 573 Ka weak (2×1) type LEED pattern was obtained which wasthe one expected of the ordered state. In the followingLEED study by Krummacheret al [16] it was shown thatthe Cu3Au(100) face yields a reconstruction with (4× 1)symmetry which was observed at room temperature aftersurface cleaning by repeated cycles of Ar ion sputteringand annealing up to 873 K. However at intermediatetemperatures around 473 K this symmetry transformed intothe (2× 1) expected for an ordered, unreconstructed (110)face. At a later time a more detailed analysis of bothstructure and composition of the same face was performedby McRaeet al [17–19] using LEED (PSD), AES and LEIS(TOF) techniques. After a standard ion bombardment andannealing at 625 K, the room-temperature LEED patternin this study indicated the (4× 1) periodicity rather thanthe (2× 1) periodicity of the ordered alloy with idealtermination. However the LEED patterns observed ata different temperatures yielded a(4 × 1) → (2 × 1)transition at about 425 K. McRaeet al [19] have performeddetailed LEIS composition observations on the (4× 1) and(2 × 1) surface symmetry. Since the ordered-bulk (110)atom planes are alternately AuCu and pure Cu with regardto composition there are two possible ideal terminations.On the other hand for the completely disordered state thefirst x1 and secondx2 surface layer compositions are thesame,∼Cu0.75Au0.25. LEIS results indicated that at roomtemperature the measured composition values more nearlyresemble those of the Au-rich ideal termination (xAu1 = 0.5,xAu2 = 0) than of the Au-poor one. But there was asubstantial enrichment of Au in the outermost two atomlayers: the Au atom fraction in the first (second) atom layerwas found to change from 0.45 (0.20) at room temperatureto 0.35 (0.35) nearT b0 . These LEIS results corresponded toa net segregation of Au atoms to the outermost two layers.
(111) face.The (111) face has not yet been thoroughlyinvestigated. Potter and Blakely [14] first performedquantitative LEED analysis this face. They have noted that
after annealing at 723 K and cooling to room temperaturethe LEED pattern conformed with the disordered alloy, butafter annealing at 573 K for 20 h corresponded to the idealtermination of the ordered alloy. In contrast to the (100)and (110) surfaces in the ordered Cu3Au each (111) planein the bulk is of stochiometric composition (Cu0.75Au0.25).However, Shaw and Fain [20] have found the surface ofCu3Au(111) to be enriched in Au (xAu1 = 0.39).
2.1.3. LRO parameters and order–disorder kinetics.In recent years there has been quickened interest in thestudy of the order–disorder transition at Cu3Au surfaces.This classic ordering alloy which undergoes a first-order transition provides an experimentally convenientmeans of testing several theoretical speculations about therelationship between bulk and surface ordering. Sincethe average coordination in the surface region and theinteratomic electron distribution is changed in the outermostlayers one would expect surface ordering or disorderingbehaviour somewhat different from those of the bulk.Now the ordering or disordering behaviour has been wellinvestigated using a number techniques, including RHEED,LEED, LEIS and x-ray diffraction methods. Those studiesyield important information on which ordered superlatticesoccur, the kinetics of ordering and the variation of LROparameters and composition with temperature, particularlynear the critical temperature.
(100) face. The first evidence for the existence of theorder–disorder transition at the (100) face of Cu3Au wasreported by Nielsen [9] who used RHEED techniques. Attemperatures above 773 K the surface structure lattice unitwas found to be a square with a parameter of 2.65A, whichwas in accordance with unit cell of the disordered structure.At 643 K this structure transformed to the ordered state,which corresponded to a structure with a square latticerotated 45◦ (with respect to the disordered one) with alattice parameter 3.75A. It was also confirmed that thesurface order–disorder transition is reversible. Other studiesof the order–disorder characteristics on the same face werelater performed by LEED, SPLEED and x-ray diffraction[10, 17, 21–24]. Sundaramet al [10] and Sundaram andRobertson [25] have confirmed observation of ordering atthe (100) face of Cu3Au, and in addition they have madethe first detailed study of the variation with temperature ofthe LRO parameterηs . To evaluateηs as a function oftemperature the LEED beam intensityIhk for a superlatticewas measured at different temperatures in the range 300to 648 K, and in a single-scattering approximation thefollowing relation was used:
Ihk ∝ (ηs)2 e−2M (1)
where 2M is the well known Debye–Waller factor. Valuesof the obtainedηs are shown in figure 2, as a functionof temperature. The bulk LROηb parameters determinedby x-ray measurement are also presented in figure 2.One can see first from the figure that the surface orderparameter, in contrast to the bulk behaviour, appearsto be a continuous function of temperature. It is alsoan important observation that the disordering process at
3040
Surface effects
Figure 2. Temperature dependences of the measured bulk(•) and surface (◦) [10] LRO parameters from LEED ofCu3Au(100).
the surface begins at about 60 K below a commoncritical temperature both for surface and bulk (T b0 =T s0 ). Sundaram and Robertson [25] in addition to thisstudy investigated the temperature dependence of LEEDintensities in the range from 300 to 673 K and extractedthe effective surface Debye temperatures2s
D from thedata. For example, figure 3 shows the Debye plot oflogI/I0 versus temperature for the spicular (00) beam atvarious electron energiesE0. It is interesting to note thatthe anharmonic effects associated with the order–disordertransition are reflected in the non-linear behaviour of Debyeplots at temperatures above approximately 600 K. Thisresult supports the earlier conclusions [10] that the surfacedisordering starts below the bulk valueT b0 . Indications ofa possible continuous order–disorder transition on the sameface of Cu3Au have been also recently reported [17, 21–24, 26]. McRae and Malic [21] characterized the surfacetransition using LEED (PSD) with high angular resolutionand have found, in contrast to the abrupt change atT b0 of thex-ray superlattice, beam intensity decreases smoothly withincreasing temperatureT in proportion to [(T s0 −T )/T s0 ]2β
with β = 0.3. The same temperature dependence ofLEED intensity and beam profile shape was also observedwith temperature increasing or decreasing. The absence ofhysteresis in this temperature-dependent behaviour possiblyimplied that the ordering time was small compared withthe experimental time constants. For example, the apparentreversibility of LEED observations [21] which were madewith a time constant of the order of 10 s, implied that thesurface ordering was faster than the bulk ordering by afactor of 105.
SPLEED measurements performed by Jamisonet al[22] and Alvaradoet al [23] also provide no evidenceof a sudden change in LRO atT b0 = T s0 . In addition tothis Alvaradoet al [23] noted that a continuous surface-induced order–disorder transition is equivalent to a criticalwetting phase transition [27–29] on the Cu3Au(100) face,and indicated that nearT s0 the observed singularity wasrelated to theηs which can be described by a functionaldependence of the formηs ∼ tβ1, where t = 1− T0/T
s0
with β1 = 0.77 ± 0.06. From all measurements theyobtainedT s0 = 662±15 K. The data also gave no evidenceof hysteresis. Thus the results obtained by LEED andSPLEED have confirmed that the surface order–disordertransition on the Cu3Au(100) face is of second order.
Figure 3. The logarithm of LEED intensity as a function oftemperature [25] for Cu3Au(100).
Dosch et al [24], using x-ray diffraction undertotal external reflection, have made the first attempt todetermine the order parameter profile as a function ofthe depth (>16 A), considering the Cu3Au(100) surface.The temperature dependence of the (100) evanescentsuperlattice scattering intensity was measured in thetemperature range between 523 and 677 K (for a wellordered surface at room temperature). Correspondingtemperature-dependent values ofηs are presented infigure 4, and one can see that for small scattering depths3 these data also exhibit the behaviour of a continuousphase transition confirming results obtained by LEED andSPLEED. On the other hand, if the values of3 increases,the features of a first-order (bulk type) transition can beobserved. Doschet al [24] also found that the phasetransition temperature was independent of the distance fromthe surface, while the surface layer started to disorder in thepresence of a still ordered bulk crystal. This situation wascharacterized by an order parameter profile
ηt (z) = 1− [1− ηs1] exp(−z/ξb) t > t∗ (2)
and
ηt (z) =
1/2 exp(z− Lt)/ξb 0≤ z ≤ Lt
t ≤ t∗1− 1/2 exp(Lt − z)/ξb z ≥ Lt
(3)
whereηs1 is the continuous order parameter of the outermostlayer; ξb is the bulk correlation length;t = 1 − T/T b0the reduced temperature;t∗ ≈ 4 × 10⁻² is the point ofthe strong change in the temperature dependence ofηt (3);Lt is the mean position of the interface from the surface(see figure 5). Finally Doschet al [24] considered theproportional relation between intensitiesIt (3) and|ηt (3)|2and concluded that the effective thickness of a disorderedsurface layer which exists between the ordered bulk and thevacuum at temperatures belowT b0 grows logarithmically asthe crystal temperature increases up toT b0 .
(110) face. In observation of (110) face orderingkinetics we refer to a surface that belowT b0 has the LEED
3041
M A Vasiliev
Figure 4. The temperature dependence of the surfaceLRO parameter (x-ray) [24] of Cu3Au(100).
pattern (2× 1) symmetry, which is that expected for idealtermination of the ordered bulk crystal. Krummacheret al[16] using qualitative LEED showed that surface transitionfrom the ordered (2× 1) symmetry to the disordered andunreconstructed (1× 1) structure occurred at the sametemperatureT s0 as in the bulkT b0 = 663 K. A more detailedanalysis of the ordering kinetics was performed by McRaeand Buck [17], McRaeet al [19] and McRae and Malic [18]using LEED (PSD) and LEIS. It was found first [18, 19]that the superlattice beam intensity decreases linearly withincreasing temperature and dies out at a temperatureT s06 K below T b0 . As shown in the LEED (PSD) intensityversusT plots in figure 6 the transition exhibits markedhysteresis associated with the (2× 1)→ (1× 1) transitiondue to a relatively low rate of ordering. On the basisof the asymmetry between ordering and disordering, thesurface transition was identified as first order, that is tosay a discontinuous surface order–disorder transition. Forexample, disordering at 651 K was an order of magnitude
Figure 6. Temperature dependences of the LEED intensityfor the beams indicated [19] for Cu3Au(110).
faster than ordering at the same temperature. The slowvariation of intensity nearT s0 , or the broadening of thesurface transition was expanded by analogy with the off-stoichiometric bulk transition. This analogy is possible inview of the observed surface segregation of Au (see below).McRae et al [19] have also concluded that the observedhysteresis and a symmetry of ordering and disordering ratesare expected since, on cooling, small ordered domains mustnucleate and grow in a disordered surface phase whereas onheating disordered regions must form in an ordered phase.Detailed observations of ordering kinetics were reported byMcRae and Buck [17], corresponding to two different initialconditions of disorder: (i) disordered surface on an orderedsubstrate; (ii) disordered surface on a disordered substrate.It was noted that the times required to restore the surfaceto a substantially ordered condition after annealing were(i) 105 and (ii) 106 s. The latter value is comparable withthe bulk ordering time. On the basis of study of the orderingkinetics at the Cu3Au(100) face McRae and Malic [18] havemade a very important conclusion about an unpresentedcase of two-dimensional compositional ordering, i.e. theexistence of ordering in two dimensions in the absence ofan ordered substrate to act as a template at some regime ofannealing. It is known [30] that according to the theoreticalinterpretation in the case of discontinuous bulk transitionsdisorder can be induced by a surface and propagates intothe bulk. Consequently it may be expected that ordering ofthe crystal starts in the bulk and propagates to the surfaceregion. Put another way, the surface orders on top of analready ordered substrate as on a template. The results onthe late stage of ordering obtained by McRae and Malic[18] are in line with this assumption. However for theearlier stage of ordering they found that the surface ordersfirst. Thus the kinetics for the Cu3Au(110) face exhibit avery complex picture.
(111) face. There is little information on orderingkinetics at the Cu3Au(111) face. Potter and Blakely [14]first briefly pointed out the noticeable difference in theordering kinetics of the (111) face from that of (100), beingmuch faster on the (100) face. But the reason for this fact
3042
Surface effects
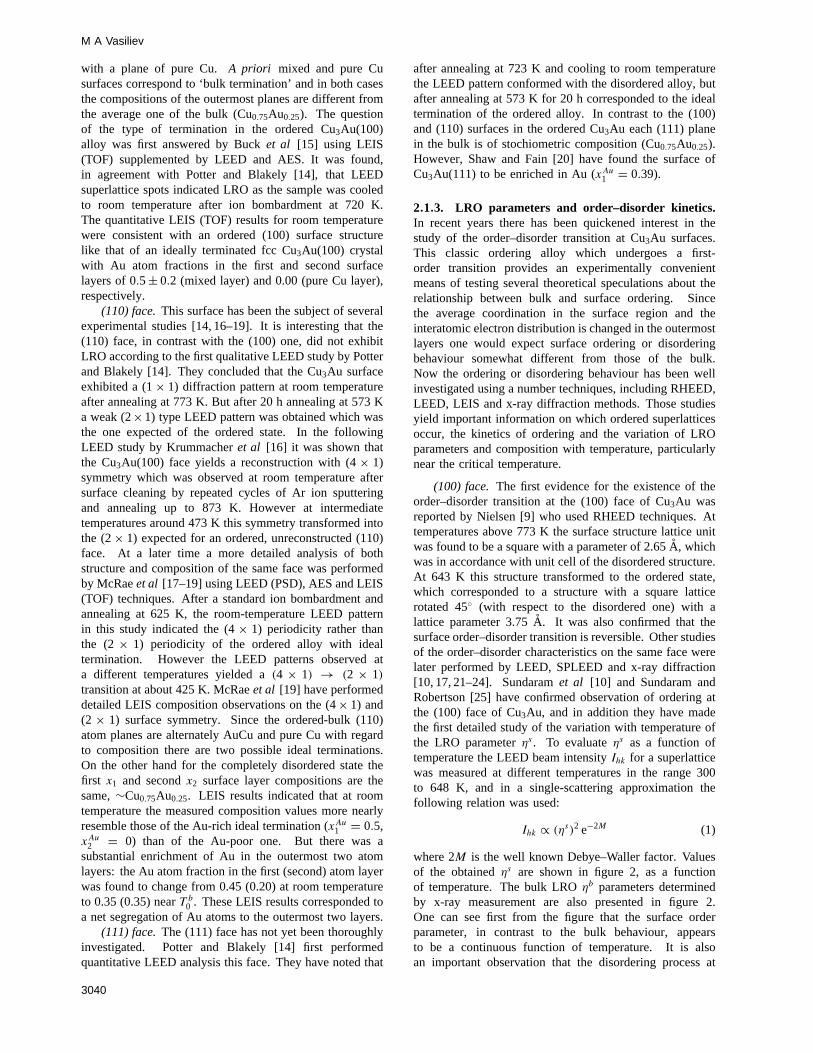
Figure 7. Au concentration of the first and second layers ofCu3Au(100) as a function of annealing temperatures [15].
is not understood. McRae and Buck [17] have made theconclusion that the surface transition at the (111) face hasproperties similar to those for the (110) surface: a first-order transition.
2.1.4. Temperature-dependent surface composition.(100) face. As was mentioned above the orderedCu3Au(100) face at room temperature preserves practicallyideal bulk termination with outermost layers alternatingbetween mixed Cu0.5Au0.5 and pure Cu. There is only alittle tendency of Au segregation (xAu1 = 0.53,xAu1 = 0.06).The first data on the equilibrium surface composition asa function of temperature were reported by Krummacheret al [16]. They have made the conclusion that afterthe surface cleaning procedure the intensity ratio of theAu peak at 60 eV and the Cu peak at 70 eV in theAES spectra showed no change in surface stoichiometryin the temperature range from room temperature to 873 K.However AES gives only the average layer composition.The first temperature dependence of the outermost layercomposition was observed by Bucket al [15] using LEIS(TOF) method with monolayer resolution. The variations ofthe first- and second-surface-layer equilibrium compositionwith the temperature are shown in figure 7. One cansee in this figure that the first-layer composition behaviouryields clear evidence of the strong competition betweenordering/disordering and surface Au segregation. So,for the first layer the Au concentration increases withtemperature, reaching the valuexAu1 = 0.62 at 673 K (closeto T b0 ), and then monotonically decreases to approximatelyits initial value 0.50 at 873 K. The latter value is ratherfar from the average value of 0.25 for disordered alloy athigh temperature. This was the first observation of thecomposition maximum in the temperature-dependent curvex1(T ) at nearT b0 . This effect will be discussed in thetheoretical part of the present review.
Now let us note that although the first layer does notachieve the random bulk composition (xAub = 0.25) in thetemperature range investigated, the second layer does (seefigure 7), but at a temperature above theT b0 . This is becauseof the Au–Cu bonding preference and the lattice straininvolved in placing more gold atoms in the second layerwhile the first-layer concentration is so high [31]. Thus
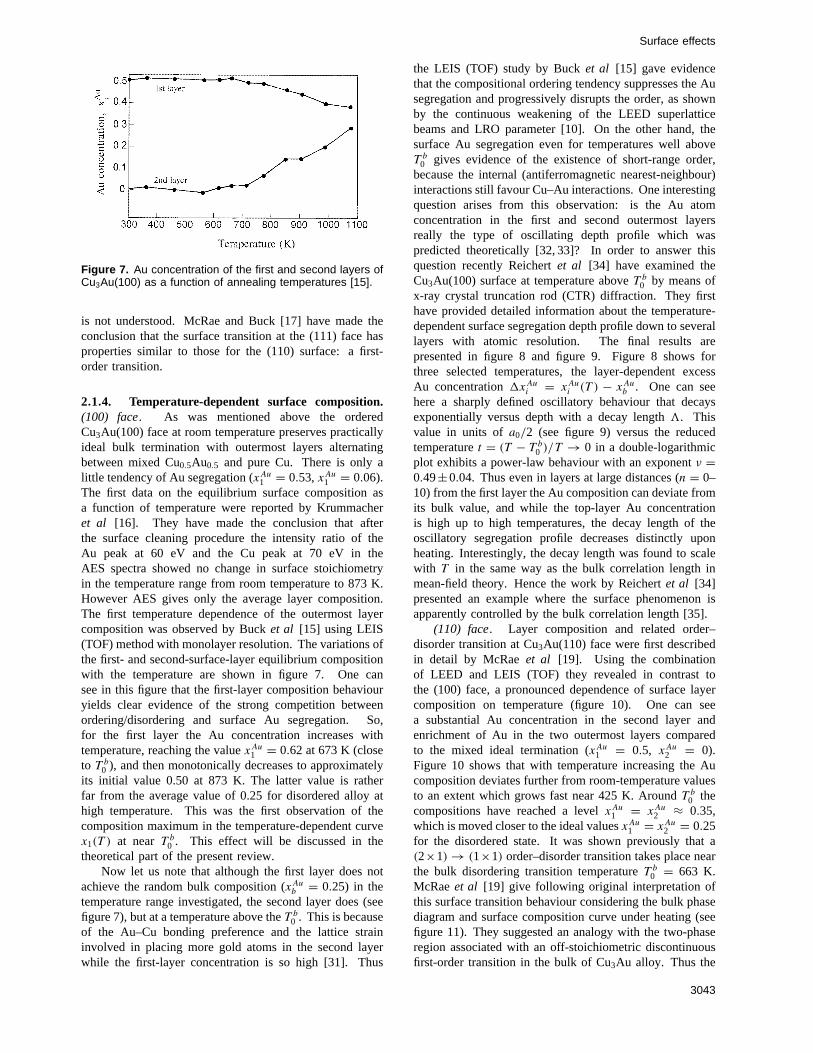
the LEIS (TOF) study by Bucket al [15] gave evidencethat the compositional ordering tendency suppresses the Ausegregation and progressively disrupts the order, as shownby the continuous weakening of the LEED superlatticebeams and LRO parameter [10]. On the other hand, thesurface Au segregation even for temperatures well aboveT b0 gives evidence of the existence of short-range order,because the internal (antiferromagnetic nearest-neighbour)interactions still favour Cu–Au interactions. One interestingquestion arises from this observation: is the Au atomconcentration in the first and second outermost layersreally the type of oscillating depth profile which waspredicted theoretically [32, 33]? In order to answer thisquestion recently Reichertet al [34] have examined theCu3Au(100) surface at temperature aboveT b0 by means ofx-ray crystal truncation rod (CTR) diffraction. They firsthave provided detailed information about the temperature-dependent surface segregation depth profile down to severallayers with atomic resolution. The final results arepresented in figure 8 and figure 9. Figure 8 shows forthree selected temperatures, the layer-dependent excessAu concentration1xAui = xAui (T ) − xAub . One can seehere a sharply defined oscillatory behaviour that decaysexponentially versus depth with a decay length3. Thisvalue in units ofa0/2 (see figure 9) versus the reducedtemperaturet = (T − T b0 )/T → 0 in a double-logarithmicplot exhibits a power-law behaviour with an exponentν =0.49±0.04. Thus even in layers at large distances (n = 0–10) from the first layer the Au composition can deviate fromits bulk value, and while the top-layer Au concentrationis high up to high temperatures, the decay length of theoscillatory segregation profile decreases distinctly uponheating. Interestingly, the decay length was found to scalewith T in the same way as the bulk correlation length inmean-field theory. Hence the work by Reichertet al [34]presented an example where the surface phenomenon isapparently controlled by the bulk correlation length [35].
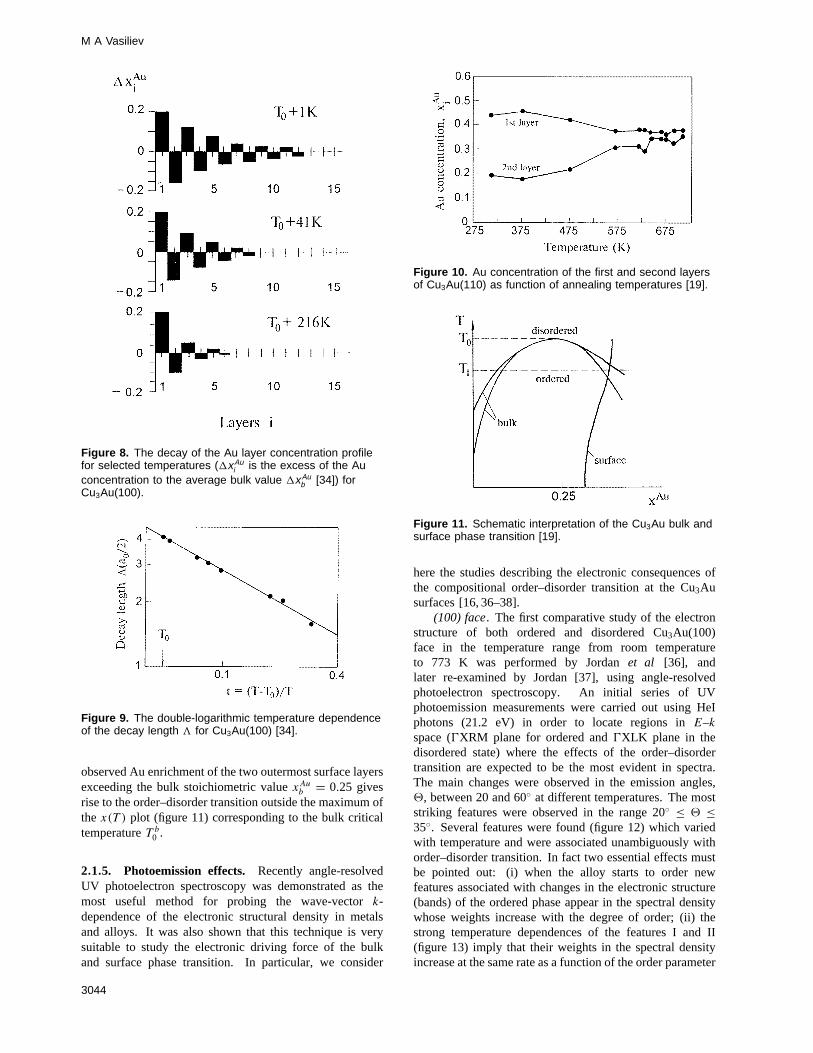
(110) face. Layer composition and related order–disorder transition at Cu3Au(110) face were first describedin detail by McRaeet al [19]. Using the combinationof LEED and LEIS (TOF) they revealed in contrast tothe (100) face, a pronounced dependence of surface layercomposition on temperature (figure 10). One can seea substantial Au concentration in the second layer andenrichment of Au in the two outermost layers comparedto the mixed ideal termination (xAu1 = 0.5, xAu2 = 0).Figure 10 shows that with temperature increasing the Aucomposition deviates further from room-temperature valuesto an extent which grows fast near 425 K. AroundT b0 thecompositions have reached a levelxAu1 = xAu2 ≈ 0.35,which is moved closer to the ideal valuesxAu1 = xAu2 = 0.25for the disordered state. It was shown previously that a(2×1)→ (1×1) order–disorder transition takes place nearthe bulk disordering transition temperatureT b0 = 663 K.McRaeet al [19] give following original interpretation ofthis surface transition behaviour considering the bulk phasediagram and surface composition curve under heating (seefigure 11). They suggested an analogy with the two-phaseregion associated with an off-stoichiometric discontinuousfirst-order transition in the bulk of Cu3Au alloy. Thus the
3043
M A Vasiliev
Figure 8. The decay of the Au layer concentration profilefor selected temperatures (1x Au
i is the excess of the Auconcentration to the average bulk value 1x Au
b [34]) forCu3Au(100).
Figure 9. The double-logarithmic temperature dependenceof the decay length 3 for Cu3Au(100) [34].
observed Au enrichment of the two outermost surface layersexceeding the bulk stoichiometric valuexAub = 0.25 givesrise to the order–disorder transition outside the maximum ofthe x(T ) plot (figure 11) corresponding to the bulk criticaltemperatureT b0 .
2.1.5. Photoemission effects. Recently angle-resolvedUV photoelectron spectroscopy was demonstrated as themost useful method for probing the wave-vectork-dependence of the electronic structural density in metalsand alloys. It was also shown that this technique is verysuitable to study the electronic driving force of the bulkand surface phase transition. In particular, we consider
Figure 10. Au concentration of the first and second layersof Cu3Au(110) as function of annealing temperatures [19].
Figure 11. Schematic interpretation of the Cu3Au bulk andsurface phase transition [19].
here the studies describing the electronic consequences ofthe compositional order–disorder transition at the Cu3Ausurfaces [16, 36–38].
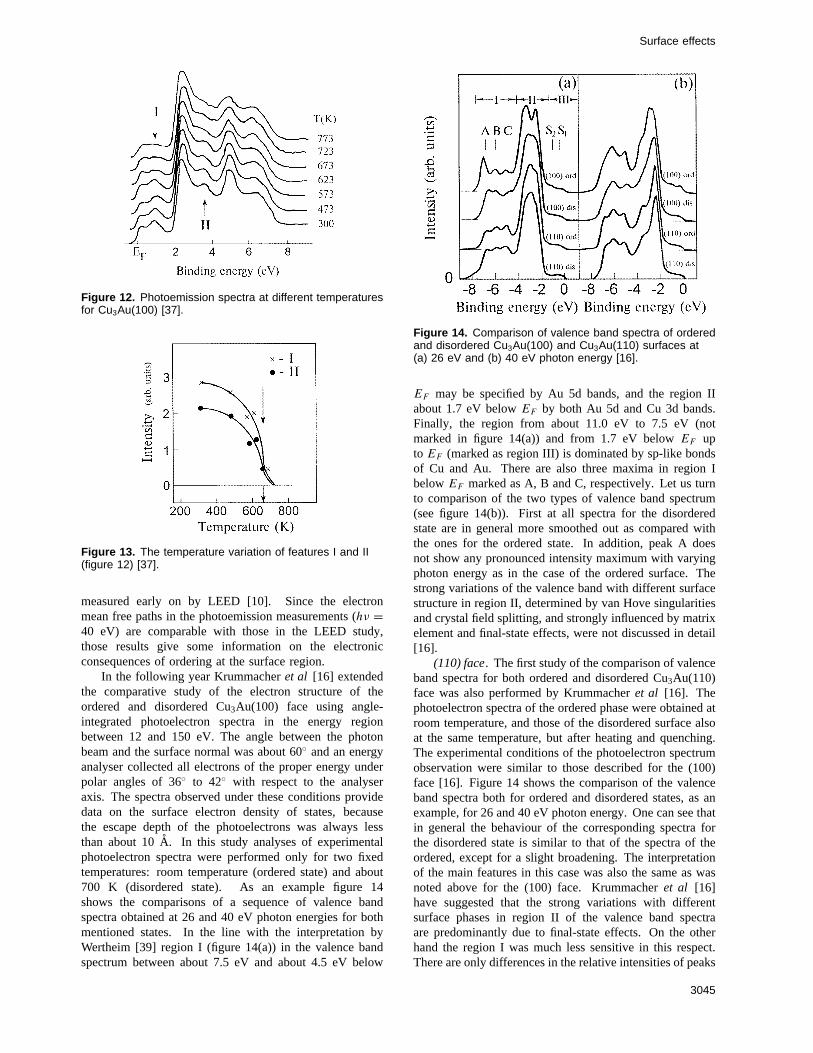
(100) face. The first comparative study of the electronstructure of both ordered and disordered Cu3Au(100)face in the temperature range from room temperatureto 773 K was performed by Jordanet al [36], andlater re-examined by Jordan [37], using angle-resolvedphotoelectron spectroscopy. An initial series of UVphotoemission measurements were carried out using HeIphotons (21.2 eV) in order to locate regions inE–kspace (0XRM plane for ordered and0XLK plane in thedisordered state) where the effects of the order–disordertransition are expected to be the most evident in spectra.The main changes were observed in the emission angles,2, between 20 and 60◦ at different temperatures. The moststriking features were observed in the range 20◦ ≤ 2 ≤35◦. Several features were found (figure 12) which variedwith temperature and were associated unambiguously withorder–disorder transition. In fact two essential effects mustbe pointed out: (i) when the alloy starts to order newfeatures associated with changes in the electronic structure(bands) of the ordered phase appear in the spectral densitywhose weights increase with the degree of order; (ii) thestrong temperature dependences of the features I and II(figure 13) imply that their weights in the spectral densityincrease at the same rate as a function of the order parameter
3044
Surface effects
Figure 12. Photoemission spectra at different temperaturesfor Cu3Au(100) [37].
Figure 13. The temperature variation of features I and II(figure 12) [37].
measured early on by LEED [10]. Since the electronmean free paths in the photoemission measurements (hν =40 eV) are comparable with those in the LEED study,those results give some information on the electronicconsequences of ordering at the surface region.
In the following year Krummacheret al [16] extendedthe comparative study of the electron structure of theordered and disordered Cu3Au(100) face using angle-integrated photoelectron spectra in the energy regionbetween 12 and 150 eV. The angle between the photonbeam and the surface normal was about 60◦ and an energyanalyser collected all electrons of the proper energy underpolar angles of 36◦ to 42◦ with respect to the analyseraxis. The spectra observed under these conditions providedata on the surface electron density of states, becausethe escape depth of the photoelectrons was always lessthan about 10A. In this study analyses of experimentalphotoelectron spectra were performed only for two fixedtemperatures: room temperature (ordered state) and about700 K (disordered state). As an example figure 14shows the comparisons of a sequence of valence bandspectra obtained at 26 and 40 eV photon energies for bothmentioned states. In the line with the interpretation byWertheim [39] region I (figure 14(a)) in the valence bandspectrum between about 7.5 eV and about 4.5 eV below
Figure 14. Comparison of valence band spectra of orderedand disordered Cu3Au(100) and Cu3Au(110) surfaces at(a) 26 eV and (b) 40 eV photon energy [16].
EF may be specified by Au 5d bands, and the region IIabout 1.7 eV belowEF by both Au 5d and Cu 3d bands.Finally, the region from about 11.0 eV to 7.5 eV (notmarked in figure 14(a)) and from 1.7 eV belowEF upto EF (marked as region III) is dominated by sp-like bondsof Cu and Au. There are also three maxima in region IbelowEF marked as A, B and C, respectively. Let us turnto comparison of the two types of valence band spectrum(see figure 14(b)). First at all spectra for the disorderedstate are in general more smoothed out as compared withthe ones for the ordered state. In addition, peak A doesnot show any pronounced intensity maximum with varyingphoton energy as in the case of the ordered surface. Thestrong variations of the valence band with different surfacestructure in region II, determined by van Hove singularitiesand crystal field splitting, and strongly influenced by matrixelement and final-state effects, were not discussed in detail[16].
(110) face. The first study of the comparison of valenceband spectra for both ordered and disordered Cu3Au(110)face was also performed by Krummacheret al [16]. Thephotoelectron spectra of the ordered phase were obtained atroom temperature, and those of the disordered surface alsoat the same temperature, but after heating and quenching.The experimental conditions of the photoelectron spectrumobservation were similar to those described for the (100)face [16]. Figure 14 shows the comparison of the valenceband spectra both for ordered and disordered states, as anexample, for 26 and 40 eV photon energy. One can see thatin general the behaviour of the corresponding spectra forthe disordered state is similar to that of the spectra of theordered, except for a slight broadening. The interpretationof the main features in this case was also the same as wasnoted above for the (100) face. Krummacheret al [16]have suggested that the strong variations with differentsurface phases in region II of the valence band spectraare predominantly due to final-state effects. On the otherhand the region I was much less sensitive in this respect.There are only differences in the relative intensities of peaks
3045
M A Vasiliev
A, B and C for the four surface structures and a slightbroadening for the disordered surfaces. This was surprisingsince the (110) face exhibits a reconstruction whereas the(100) face does not. At the other extreme observed byKrummacheret al [16] was the absence of the orderingand face orientation effects in the surface core level shiftof the Au 4f level. There was only a difference in relativeintensity probably because the (110) surface is more openas compared with the (100) surface.
2.2. Cu3Pt(111)
Cu and Pt atoms form a continuous series of fcc exothermicdisordered solid solutions at high temperatures and orderedphases at low temperatures (Cu3Pt, CuPt, Pt3Cu and Pt7Cu)[13]. The Cu–Pt alloys are interesting in the field ofcatalysis because this system is catalytically more activethan pure Pt. This is a surprising result since Cu itself is lessactive than Pt for oxidation and reforming reactions [40]and has been explained controversially in terms of structuraland electronic effects. The Cu3Pt(111) ordered surfacehas been extensively studied for its adsorptive properties[40–42] since it allows the properties of isolated Pt atoms,surrounded only by Cu atoms to be examined. On theother hand, the Cu–Pt system is suitable to test a theory ofsurface segregation, which would account for lattice straincaused by the difference in the atomic radii (about 8%,rCu = 1.27 A and rP t = 1.39 A) [43].
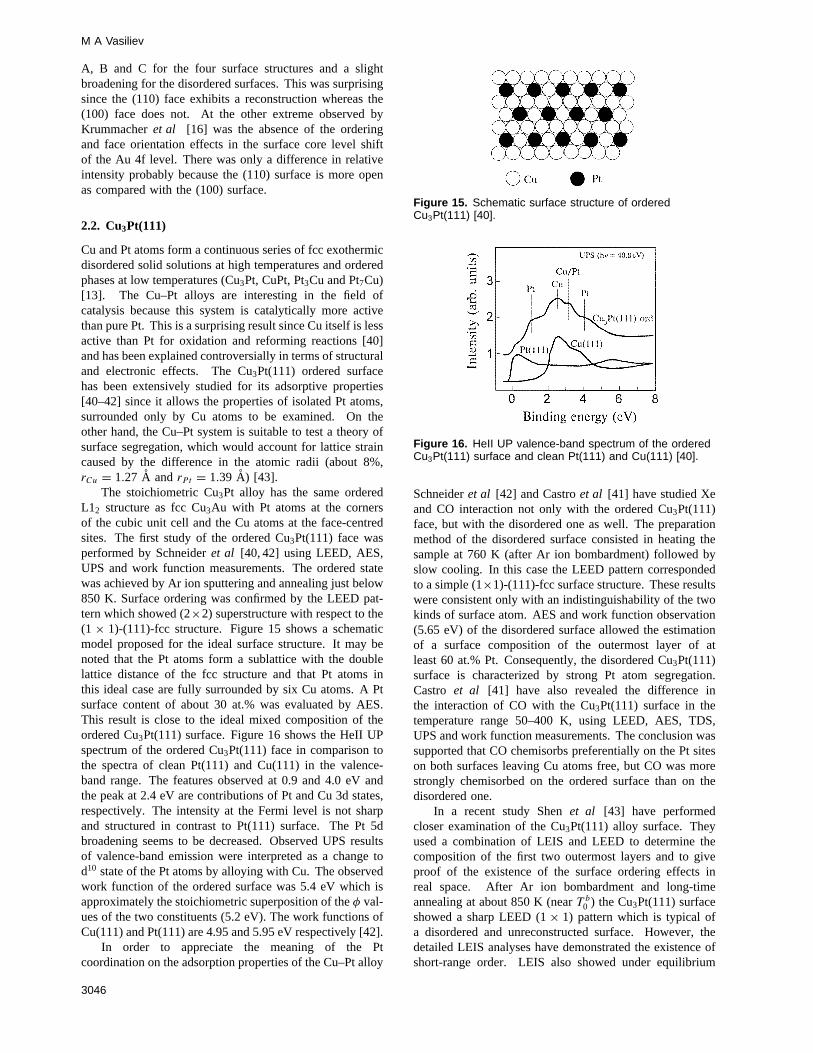
The stoichiometric Cu3Pt alloy has the same orderedL12 structure as fcc Cu3Au with Pt atoms at the cornersof the cubic unit cell and the Cu atoms at the face-centredsites. The first study of the ordered Cu3Pt(111) face wasperformed by Schneideret al [40, 42] using LEED, AES,UPS and work function measurements. The ordered statewas achieved by Ar ion sputtering and annealing just below850 K. Surface ordering was confirmed by the LEED pat-tern which showed (2×2) superstructure with respect to the(1× 1)-(111)-fcc structure. Figure 15 shows a schematicmodel proposed for the ideal surface structure. It may benoted that the Pt atoms form a sublattice with the doublelattice distance of the fcc structure and that Pt atoms inthis ideal case are fully surrounded by six Cu atoms. A Ptsurface content of about 30 at.% was evaluated by AES.This result is close to the ideal mixed composition of theordered Cu3Pt(111) surface. Figure 16 shows the HeII UPspectrum of the ordered Cu3Pt(111) face in comparison tothe spectra of clean Pt(111) and Cu(111) in the valence-band range. The features observed at 0.9 and 4.0 eV andthe peak at 2.4 eV are contributions of Pt and Cu 3d states,respectively. The intensity at the Fermi level is not sharpand structured in contrast to Pt(111) surface. The Pt 5dbroadening seems to be decreased. Observed UPS resultsof valence-band emission were interpreted as a change tod10 state of the Pt atoms by alloying with Cu. The observedwork function of the ordered surface was 5.4 eV which isapproximately the stoichiometric superposition of theφ val-ues of the two constituents (5.2 eV). The work functions ofCu(111) and Pt(111) are 4.95 and 5.95 eV respectively [42].
In order to appreciate the meaning of the Ptcoordination on the adsorption properties of the Cu–Pt alloy
Figure 15. Schematic surface structure of orderedCu3Pt(111) [40].
Figure 16. HeII UP valence-band spectrum of the orderedCu3Pt(111) surface and clean Pt(111) and Cu(111) [40].
Schneideret al [42] and Castroet al [41] have studied Xeand CO interaction not only with the ordered Cu3Pt(111)face, but with the disordered one as well. The preparationmethod of the disordered surface consisted in heating thesample at 760 K (after Ar ion bombardment) followed byslow cooling. In this case the LEED pattern correspondedto a simple (1×1)-(111)-fcc surface structure. These resultswere consistent only with an indistinguishability of the twokinds of surface atom. AES and work function observation(5.65 eV) of the disordered surface allowed the estimationof a surface composition of the outermost layer of atleast 60 at.% Pt. Consequently, the disordered Cu3Pt(111)surface is characterized by strong Pt atom segregation.Castro et al [41] have also revealed the difference inthe interaction of CO with the Cu3Pt(111) surface in thetemperature range 50–400 K, using LEED, AES, TDS,UPS and work function measurements. The conclusion wassupported that CO chemisorbs preferentially on the Pt siteson both surfaces leaving Cu atoms free, but CO was morestrongly chemisorbed on the ordered surface than on thedisordered one.
In a recent study Shenet al [43] have performedcloser examination of the Cu3Pt(111) alloy surface. Theyused a combination of LEIS and LEED to determine thecomposition of the first two outermost layers and to giveproof of the existence of the surface ordering effects inreal space. After Ar ion bombardment and long-timeannealing at about 850 K (nearT b0 ) the Cu3Pt(111) surfaceshowed a sharp LEED (1× 1) pattern which is typical ofa disordered and unreconstructed surface. However, thedetailed LEIS analyses have demonstrated the existence ofshort-range order. LEIS also showed under equilibrium
3046
Surface effects
conditions a tendency to surface segregation, namely, thetop layer had 80 at.% Cu–20 at.% Pt, while the second layerwas 69 at.% Cu–31 at.% Pt. This observed oscillation insurface layer composition is typical as generally predicatedfor alloys with a negative enthalpy of mixing (1Hmix =−10 kcal mol−1 for Cu3Pt). It was also indicated that thePt atoms in the first layer are not clustered in domains andare coplanar with the Cu atoms.
2.3. Pt80Fe20
The enhanced catalytic properties, as compared to pure Pt,of alloys between Pt and Fe have indicated the studies oftheir surface region concerning both surface structure andsegregation [44–46]. Fe–Pt alloys show a strong tendencyto bulk compositional order. In the range 25–83 at.% Ptthree ordered phases are formed based on the compositionFe3Pt (γ1, T b0 = 1108 K), FePt (γ2, T b0 = 1588 K) andPt3Fe (γ3, T b0 = 1623 K) [13]. The ordered superlatticephases Fe3Pt and Pt3Fe are both of the Cu3Au (L12) typeof structure. The first phase is ferromagnetic and the secondis paramagnetic.
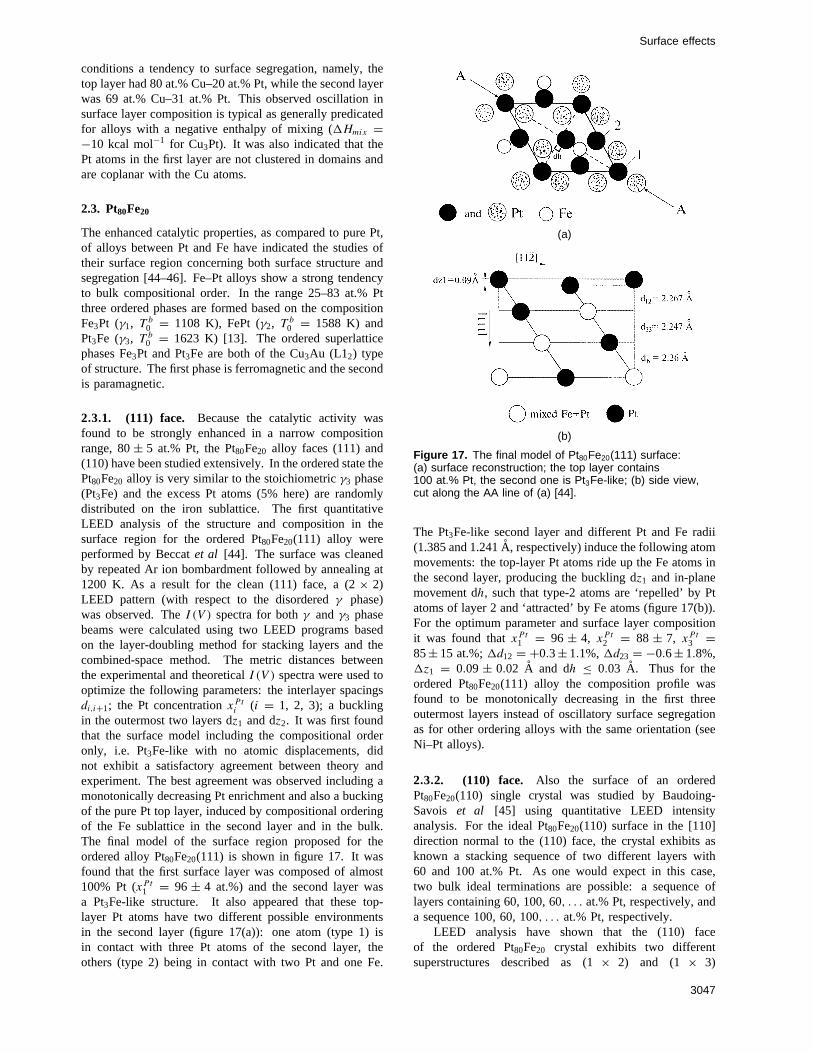
2.3.1. (111) face. Because the catalytic activity wasfound to be strongly enhanced in a narrow compositionrange, 80± 5 at.% Pt, the Pt80Fe20 alloy faces (111) and(110) have been studied extensively. In the ordered state thePt80Fe20 alloy is very similar to the stoichiometricγ3 phase(Pt3Fe) and the excess Pt atoms (5% here) are randomlydistributed on the iron sublattice. The first quantitativeLEED analysis of the structure and composition in thesurface region for the ordered Pt80Fe20(111) alloy wereperformed by Beccatet al [44]. The surface was cleanedby repeated Ar ion bombardment followed by annealing at1200 K. As a result for the clean (111) face, a (2× 2)LEED pattern (with respect to the disorderedγ phase)was observed. TheI (V ) spectra for bothγ andγ3 phasebeams were calculated using two LEED programs basedon the layer-doubling method for stacking layers and thecombined-space method. The metric distances betweenthe experimental and theoreticalI (V ) spectra were used tooptimize the following parameters: the interlayer spacingsdi,i+1; the Pt concentrationxP ti (i = 1, 2, 3); a bucklingin the outermost two layers dz1 and dz2. It was first foundthat the surface model including the compositional orderonly, i.e. Pt3Fe-like with no atomic displacements, didnot exhibit a satisfactory agreement between theory andexperiment. The best agreement was observed including amonotonically decreasing Pt enrichment and also a buckingof the pure Pt top layer, induced by compositional orderingof the Fe sublattice in the second layer and in the bulk.The final model of the surface region proposed for theordered alloy Pt80Fe20(111) is shown in figure 17. It wasfound that the first surface layer was composed of almost100% Pt (xP t1 = 96± 4 at.%) and the second layer wasa Pt3Fe-like structure. It also appeared that these top-layer Pt atoms have two different possible environmentsin the second layer (figure 17(a)): one atom (type 1) isin contact with three Pt atoms of the second layer, theothers (type 2) being in contact with two Pt and one Fe.
(a)
(b)
Figure 17. The final model of Pt80Fe20(111) surface:(a) surface reconstruction; the top layer contains100 at.% Pt, the second one is Pt3Fe-like; (b) side view,cut along the AA line of (a) [44].
The Pt3Fe-like second layer and different Pt and Fe radii(1.385 and 1.241A, respectively) induce the following atommovements: the top-layer Pt atoms ride up the Fe atoms inthe second layer, producing the buckling dz1 and in-planemovement dh, such that type-2 atoms are ‘repelled’ by Ptatoms of layer 2 and ‘attracted’ by Fe atoms (figure 17(b)).For the optimum parameter and surface layer compositionit was found thatxP t1 = 96± 4, xP t2 = 88± 7, xP t3 =85± 15 at.%;1d12 = +0.3± 1.1%,1d23 = −0.6± 1.8%,1z1 = 0.09± 0.02 A and dh ≤ 0.03 A. Thus for theordered Pt80Fe20(111) alloy the composition profile wasfound to be monotonically decreasing in the first threeoutermost layers instead of oscillatory surface segregationas for other ordering alloys with the same orientation (seeNi–Pt alloys).
2.3.2. (110) face. Also the surface of an orderedPt80Fe20(110) single crystal was studied by Baudoing-Savois et al [45] using quantitative LEED intensityanalysis. For the ideal Pt80Fe20(110) surface in the [110]direction normal to the (110) face, the crystal exhibits asknown a stacking sequence of two different layers with60 and 100 at.% Pt. As one would expect in this case,two bulk ideal terminations are possible: a sequence oflayers containing 60, 100, 60, . . . at.% Pt, respectively, anda sequence 100, 60, 100, . . . at.% Pt, respectively.
LEED analysis have shown that the (110) faceof the ordered Pt80Fe20 crystal exhibits two differentsuperstructures described as (1× 2) and (1 × 3)
3047
M A Vasiliev
reconstruction. Both superstructures were produced byannealing the Ar-ion-bombarded surface: the (1×3) in therange 750 to 900 K; and (1× 2) above 1000 K. Baudoing-Savoiset al [45] have performed a detailed LEED analysisof the (1× 2) stable superstructure only. Because of thestriking similarity in theI (V ) curves of the pure Pt(110)and Pt80Fe20(110)-(1×2) surface they chose the well knownmissing row model with geometrical parameters of the purePt(110)-(1×2) reconstructed structure as a start model. Thecalculation procedure of theI (V ) intensity was the sameas in the early study [44]. Neglecting compositional order16 parameters were optimized in the structure analysis,including nine geometrical parameters describing the latticerelaxations within the five outermost layers (figure 18(a)),and seven additional parameters allowing a different Ptconcentration in each non-equivalent row. In orderto consider an ordering effect ten additional parametersdescribing the Pt site concentrations within the rows inlayers 1, 3, and 5 were analysed (in layers 2 and 4, thefour atoms/unit cell were symmetrically equivalent). Non-equivalent occupations of lattice sites also allowed differentgeometrical parameters. Figure 18 shows the optimumstructure of the Pt80Fe20(110) surface region based on themissing row (1× 2) reconstruction. Optimum geometricalparameters were determined to bed12 = 1.2 A (1d12 =−13%), d23 = 1.40 A, d34 = 1.40 A, d45 = 1.41 A,d56 = 1.40 A, 1z3 = 0.15 A, 1y2 = 0.03 A, 1y4 =0.01 A (db = 1.379 A). In figure 18(b) a limited greyscale represents different levels of Pt concentration (black,grey, and white circles denote 100, 80 and 60 at.% Pt,respectively). In connection with surface layer compositionand ordering several interesting facts were pointed out:(i) the outermost ‘visible’ row with only 13 at.% Feappears totally distorted; (ii) the ordering gradually recoversthe bulk situation over five to six layers; (iii) generalPt enrichment is found in the surface ‘visible’ rows (inlayers 1–3), but segregation and composition order yielda subtle redistribution of Pt and Fe atoms in deeper rows,for example, in layer 2, the visible row is Pt rich, whereasthe other row (buried under layer 1) is enriched with Fe.Finally with missing row (1× 2) structure the average Ptconcentrations are in the first layer 87, the second∼60 andthe bulk layer 80 at.% Pt. This would correspond to a Ptcomposition oscillation starting with Pt enrichment in thesurface. Finally we comment that the surface of the orderedPt80Fe20(110) crystal is example of very complex structure,including reconstruction, segregation, atom displacementsand partial order. The missing row model for this surfacewas also confirmed in a recent STM study by Hammaret al[46], although different (1×1) phases were found to coexistwith the (2× 1) structure.
3. Ferromagnetic ordered solid solution
3.1. Co0.5Fe0.5: surface structure and composition
The ferromagnetic Co–Fe alloys, from the viewpoint oftechnical importance, possesses several useful characteris-tics, particularly such as the largest known magnetizationper atom and an extremely high Curie temperature. There
(a)
(b)
Figure 18. Pt80Fe20(110) (1× 2) missing row model:(a) the parameters optimized in the structure analysis(d1–d5 interlayer spacing; 1z3, 1z5 buckling in odd layers,1y2, 1y4 lateral shift); (b) perspective view of the optimumstructure [45].
is also considerable current interest in studying the catalyticproperties of Co–Fe alloys, for example in the hydrogena-tion reactions.
The Co–Fe phase diagram [13] shows a wide rangeof solid solution with bccα–Fe and a region from 30 to70 at.% Co where the ordered bcc Co0.5Fe0.5 (B2, CsCltype) superstructure exists in the vicinity of the equiatomiccomposition. In this system the magnetic Curie temperature(T bC = 1258 K at xCob = 0.465) is higher than thecompositional order–disorder transition temperatures (T b0 =1003 K atxCob = 0.49) [13].
The Co0.5Fe0.5 B2 lattice is one of the simpleststructures encountered among the ordered alloys [1]. Inthe disordered state, atoms of one type (Fe or Co) aredistributed with equal probability over all sites of the bcclattice. In a completely ordered state for stoichiometriccomposition all the sites at the corners of the cubic unitcells are occupied by Fe atoms and the sites at thecentres of the cells are occupied by Co atoms. The LROparameter in such an alloy decreases continuously withincreasing temperature and becomes zero at the criticaltemperature, i.e. a second-order phase transition occurs atthis temperature. One can understand that in the〈100〉direction each ideal bulk (100) plane contains only onetype of atom leaving either all Fe atoms at the surface or allCo atoms. Hence, there are two equivalent types of bulk
3048
Surface effects
termination: Fe termination (. . .ABAB . . . stacking) or Cotermination (. . .BABA . . . stacking), while the (110) and(111) planes contain both Fe and Co atoms arranged in atwo-atom unit cell (mixed FeCo termination).
So far the surface structure and composition of theordering Co–Fe alloys have not been studied in so muchdetail as observed above binary alloys, although severalsurface studies of this system were performed under UHVconditions in order to determine the surface composition[47–50]. Unfortunately in all experimental works onlythe polycrystalline samples were used. Nevertheless weconsider those data which were measured after annealingat relatively high temperature below and aboveT b0 inorder to approach the equilibrium state. The first resultin this connection was reported by Moran-Lopez and Wise[47] using AES. After annealing at 723 K (belowT b0 )the polycrystalline Co0.5Fe0.5 sample exhibited a surfacecomposition equivalent to 75±5 at.% Fe and 25±5 at.% Co,i.e. considerable enrichment with Fe (estimated escapedepth was about 10A, or about 3 to 4 atomic layers).Later, Mrozek et al [51] using quantitative formalismconverted AES spectra into Fe surface concentration of thepolycrystalline Co70Fe30, Co50Fe50, Co40Fe60, and Co30Fe70
alloy. No change was found in Fe surface compositionat the surface of the Co50Fe50 alloy in the temperaturerange of 683 to 1123 K. On the other hand, moderate Fesurface enrichment after annealing at 973 and 1123 K wasestablished for other alloys. Hence these results excludedthe possibility of a considerable Fe or Co segregation effectat the surface region of the Co–Fe alloys.
3.2. Ni3Fe
The Fe–Ni alloy system is of metallurgical interest becauseit is the basis of an important class of engineering materials.Particularly, the investigation of this alloy primarily hasaroused considerable interest due to its special magneticproperties. For example, the Fe–35 at.% Ni alloy (Invaralloy) has an almost zero thermal expansion coefficient overseveral hundred degrees above room temperature; the alloywith 78 at.% Ni (Permalloy) is a soft magnetic material withhigh magnetic permeability. Depending on the compositionand heat treatment conditions, these alloys can have variousstructures and, therefore, possess different properties.
In the phase equilibrium state Fe and Ni form acontinuous series of solid solutions [13] and the alloysimportant for ferromagnetism lie in the composition rangefrom 30 to 90 at.% Ni including anα (bcc) + γ (fcc) orpure fcc γ region. The order–disorder transition coversa wide range of composition, about 50–80 at.% Ni. In acompletely ordered alloy the stoichiometric composition isconsistent with Ni3Fe phase which has fcc Cu3Au (L12)type structure. For this composition the first-order phasetransition occurs at the critical temperatureT b0 = 776 K.The phase diagram also shows the composition-dependentmagnetic transition with the maximum Curie temperatureT bC = 885 K at∼70 at.% Ni, i.e.T bC > T b0 in the Fe–Nisystem.
Several studies on the surface of Fe–Ni alloys have beenpreformed [52–54]. However, we consider only results
Figure 19. The energy dependence of the differentiated(00) reflex LEED intensity (dI00/dE0) for Ni3Fe(111);1—350 K, 2—550 K, 3—800 K [55].
obtained from single crystals in UHV, in particular theordered alloy with Ni3Fe composition.
3.2.1. Surface structure and layer order parameter.The first study of the structure and composition at the (100),(110) and (111) faces of ordered Ni3Fe alloy was performedby Vasiliev and Gorodetsky [53] using qualitative LEEDand AES. The surfaces of the single-crystal specimenswere cleaned by the conventional procedure of Ar ionbombardment and annealing. After a long-time annealingat 700 K the cleaned surfaces oriented in the [100], [110]and [111] directions yielded only a (1× 1) LEED pattern,typical for an unreconstructed surface, in the temperaturerange from room temperature up to 1025 K (>T b0 ). Itmust be emphasized that in the case of the Ni3Fe alloyit is principle difficult to observe ordered superstructure byconventional LEED, because the Ni and Fe atoms haveclosely related scattering atomic factors in contrast to theAu–Cu system. In order to resolve this problem Vasilievand Gorodetsky [55] have pioneered applying the procedureof differentiation of the LEEDI (V ) spectra (figure 19).One can see in figure 19 the clear Bragg and multiple-reflection peaks in the differentiatedI (V ) spectra. Itwas supposed that the interrelation between temperaturedependence of the multiple-reflection intensitiesImhk and thechange of the LRO parameter was
Imhk ∝ (ηs)2 e−2M. (4)
For example, figure 20 showsη–temperature behaviourfor several electron energiesE0 under the assumption thatηs = ηb = 1. Let us discuss these results later withconsideration for the temperature dependence of the surfacecomposition data.
3.2.2. Temperature-dependent layer composition. It isknown that the ordered Ni3Fe alloy has an fcc lattice with
3049
M A Vasiliev
Figure 20. The temperature dependence of the LROparameter for Ni3Fe(111), 1–4 surface layers.
the Fe atoms preferentially at the cube unit cell corners andNi atoms at the face centres. Consequently, the ideal Featom fraction in (100) or (110) planes of the ordered bulkcrystal is alternately 0.5 and 0, while each (111) plane isof stoichiometric composition (0.75 Ni+ 0.25 Fe).
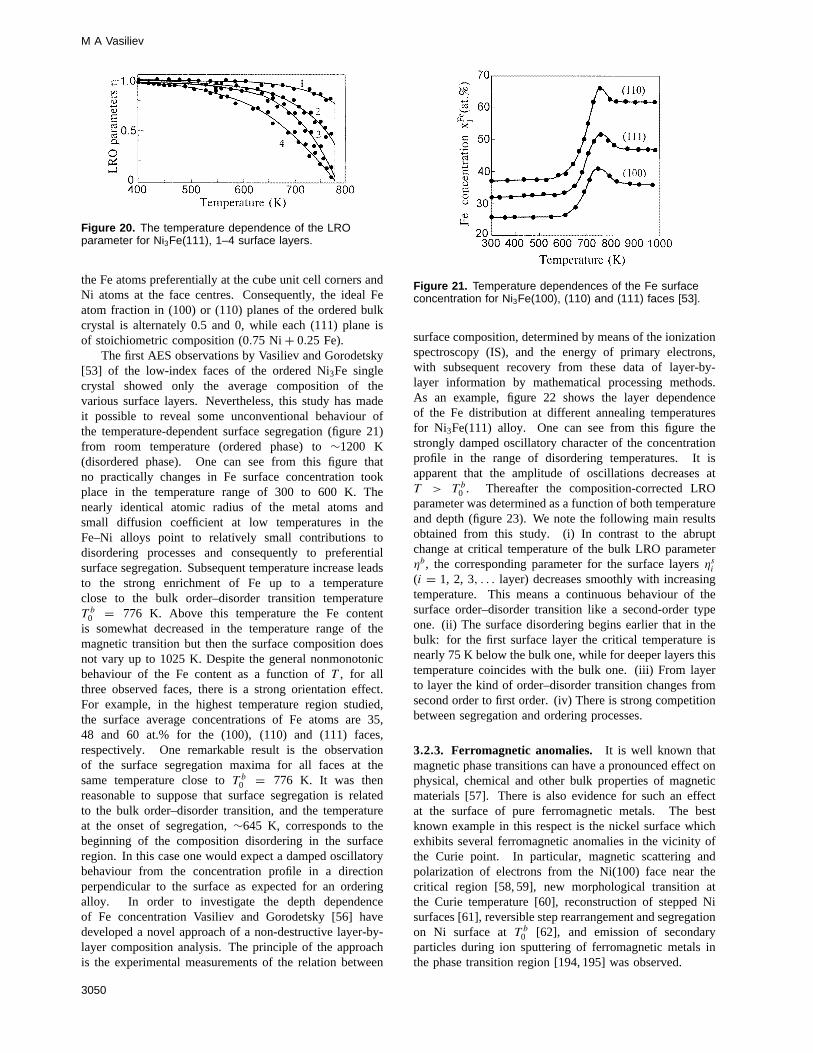
The first AES observations by Vasiliev and Gorodetsky[53] of the low-index faces of the ordered Ni3Fe singlecrystal showed only the average composition of thevarious surface layers. Nevertheless, this study has madeit possible to reveal some unconventional behaviour ofthe temperature-dependent surface segregation (figure 21)from room temperature (ordered phase) to∼1200 K(disordered phase). One can see from this figure thatno practically changes in Fe surface concentration tookplace in the temperature range of 300 to 600 K. Thenearly identical atomic radius of the metal atoms andsmall diffusion coefficient at low temperatures in theFe–Ni alloys point to relatively small contributions todisordering processes and consequently to preferentialsurface segregation. Subsequent temperature increase leadsto the strong enrichment of Fe up to a temperatureclose to the bulk order–disorder transition temperatureT b0 = 776 K. Above this temperature the Fe contentis somewhat decreased in the temperature range of themagnetic transition but then the surface composition doesnot vary up to 1025 K. Despite the general nonmonotonicbehaviour of the Fe content as a function ofT , for allthree observed faces, there is a strong orientation effect.For example, in the highest temperature region studied,the surface average concentrations of Fe atoms are 35,48 and 60 at.% for the (100), (110) and (111) faces,respectively. One remarkable result is the observationof the surface segregation maxima for all faces at thesame temperature close toT b0 = 776 K. It was thenreasonable to suppose that surface segregation is relatedto the bulk order–disorder transition, and the temperatureat the onset of segregation,∼645 K, corresponds to thebeginning of the composition disordering in the surfaceregion. In this case one would expect a damped oscillatorybehaviour from the concentration profile in a directionperpendicular to the surface as expected for an orderingalloy. In order to investigate the depth dependenceof Fe concentration Vasiliev and Gorodetsky [56] havedeveloped a novel approach of a non-destructive layer-by-layer composition analysis. The principle of the approachis the experimental measurements of the relation between
Figure 21. Temperature dependences of the Fe surfaceconcentration for Ni3Fe(100), (110) and (111) faces [53].
surface composition, determined by means of the ionizationspectroscopy (IS), and the energy of primary electrons,with subsequent recovery from these data of layer-by-layer information by mathematical processing methods.As an example, figure 22 shows the layer dependenceof the Fe distribution at different annealing temperaturesfor Ni3Fe(111) alloy. One can see from this figure thestrongly damped oscillatory character of the concentrationprofile in the range of disordering temperatures. It isapparent that the amplitude of oscillations decreases atT > T b0 . Thereafter the composition-corrected LROparameter was determined as a function of both temperatureand depth (figure 23). We note the following main resultsobtained from this study. (i) In contrast to the abruptchange at critical temperature of the bulk LRO parameterηb, the corresponding parameter for the surface layersηsi(i = 1, 2, 3, . . . layer) decreases smoothly with increasingtemperature. This means a continuous behaviour of thesurface order–disorder transition like a second-order typeone. (ii) The surface disordering begins earlier that in thebulk: for the first surface layer the critical temperature isnearly 75 K below the bulk one, while for deeper layers thistemperature coincides with the bulk one. (iii) From layerto layer the kind of order–disorder transition changes fromsecond order to first order. (iv) There is strong competitionbetween segregation and ordering processes.
3.2.3. Ferromagnetic anomalies. It is well known thatmagnetic phase transitions can have a pronounced effect onphysical, chemical and other bulk properties of magneticmaterials [57]. There is also evidence for such an effectat the surface of pure ferromagnetic metals. The bestknown example in this respect is the nickel surface whichexhibits several ferromagnetic anomalies in the vicinity ofthe Curie point. In particular, magnetic scattering andpolarization of electrons from the Ni(100) face near thecritical region [58, 59], new morphological transition atthe Curie temperature [60], reconstruction of stepped Nisurfaces [61], reversible step rearrangement and segregationon Ni surface atT b0 [62], and emission of secondaryparticles during ion sputtering of ferromagnetic metals inthe phase transition region [194, 195] was observed.
3050
Surface effects
Figure 22. The layer dependence of the Fe concentrationat different temperatures for Ni3Fe(111) [56].
Figure 23. The layer dependence of the LRO parametersat different temperatures for Ni3Fe(111): •—theory [145],×—LEED experiment [146].
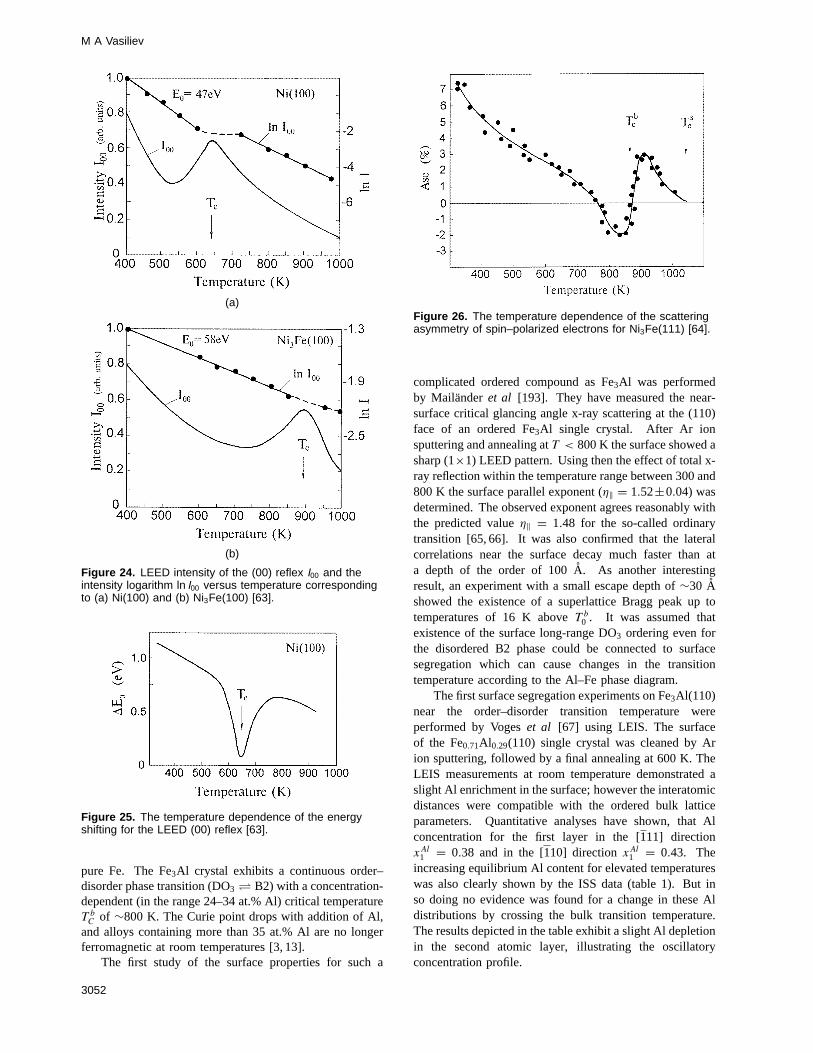
In our opinion the first surface ferromagnetic anomaliesin alloys were reported by Vasiliev and Gorodetsky [63] andMamaevet al [64] for the clean surface of an Ni3Fe singlecrystal. The first effect was observed [63] in the course ofthe continuous registration of the temperature dependenceof Bragg maximum intensityIhk(T ). This experimentwas made possible by an improved method of LEEDreflex modulation and automatic adjustment of electronbeam energy on the maximum of the reflex intensity [55].Thus it was revealed that for both pure Ni and Ni3Fethe temperature dependence of the Bragg reflexI00(T )
exhibited nonmonotonic behaviour in the region of theCurie temperatureT bC . Figure 24(a), (b) gives an exampleof such dependence for Ni(100) and Ni3Fe(100) surfacesrespectively. The same behaviour ofI00(T ) was alsoobserved for (100) and (111) faces. It is interesting thatthe position of the observed intensity peak nearT bC didnot depend onE0, while its magnitude diminished with
increasingE0, so that forE0 > 200 eV it could notbe recorded. Consequently, only the outermost surfacelayers contributed to this effect, which may be attributed tocompetition between the critical scattering of electrons onmagnetic moment fluctuations nearT bC and the scattering ofelectrons on thermal lattice vibrations according to the wellknown Debye–Waller function. In addition it was foundthat the energy of the LEED reflex maximum was alterednear theT bC temperature region. An example of such atemperature-dependent energy shifting1E0(T ) is given infigure 25 for the Ni(100) crystal. The value of1E0 both forNi(100) and also for Ni3Fe(100) is dependent substantiallyon theE0 value. AtE0 ≈ 25 eV the shifting1E0 amountsto ≈3 eV and decreases withE0 rise. It is interesting thatthe sign of shifting is different for Ni and Ni3Fe. So withtemperature increasing the maximum energy for Ni becamelower while for Ni3Fe it increased during the run acrossT bC .There was also an orientation dependence of the1E0. Thusfor Ni and Ni3Fe at the sameE0 the shifting1E0 was twotimes larger for the (100) face than for (111). It is apparentthat from the quantity1E0 in the case of beam spicularreflection (00), it is possible to determine the change of theinterplane spacing at normal to the surface:1d/d = (1/2)1E0/E0. For example, the relative change of this spacingat E0 = 30 eV (surface region) was 5× 10⁻², while atE0 = 200 eV1d/d ∼ 2 × 10⁻⁵ which is close to thevalues typical for magnetostriction processes in the bulk.Finally it was suggested that the shifting effect1E0 in theT bC region is a result of competition between ordinary latticethermal expansion and magnetostriction (thermostriction)effects which as well known are different in Ni and Ni3Fecrystals [3].
Mamaevet al [64] first studied the magnetic propertiesof the clean ordered Ni3Fe(111) alloy surface usingSPLEED. Figure 26 shows the temperature dependence ofthe scattering asymmetry of the spin-polarized electronsASE(T ). The change of the asymmetry sign in the vicinityof T bC , i.e. the change of the magnetic coupling type, isclearly seen. The Curie temperature of the (111) surfacefor the Ni3Fe alloyT sC alloy appears to be 1050 K, which ismuch higher than theT bC = 850 K. Thus the present workfirst revealed the antiferromagnetic coupling between theFe-rich surface layers and the underlying bulk of Ni3Fe.Recall that the strong Fe segregation at high temperaturesfor this ordered alloy was mentioned above.
4. Intermetallic ordered compounds: surfacelayer structure and composition
4.1. Fe3Al(110)
Al–Fe alloys are potentially useful for high-temperatureindustrial applications. The phase diagram of the Al–Fesystem shows the existence of two ordered phases based onthe ideal composition Fe3Al (β2) and Fe0.5Al 0.5 (β2) [13].The Fe3Al superlattice is of the bcc BiF3 (DO3) type, witha lattice constant (a0 = 5.84 A) twice that of theα randomphase. In this structure the atoms of Al avoid adjacentsites and so occupy the centres of the alternate small cubes(each 1/8 of the true unit cell) that show the structure of
3051
M A Vasiliev
(a)
(b)
Figure 24. LEED intensity of the (00) reflex I00 and theintensity logarithm ln I00 versus temperature correspondingto (a) Ni(100) and (b) Ni3Fe(100) [63].
Figure 25. The temperature dependence of the energyshifting for the LEED (00) reflex [63].
pure Fe. The Fe3Al crystal exhibits a continuous order–disorder phase transition (DO3 B2) with a concentration-dependent (in the range 24–34 at.% Al) critical temperatureT bC of ∼800 K. The Curie point drops with addition of Al,and alloys containing more than 35 at.% Al are no longerferromagnetic at room temperatures [3, 13].
The first study of the surface properties for such a
Figure 26. The temperature dependence of the scatteringasymmetry of spin–polarized electrons for Ni3Fe(111) [64].
complicated ordered compound as Fe3Al was performedby Mailanderet al [193]. They have measured the near-surface critical glancing angle x-ray scattering at the (110)face of an ordered Fe3Al single crystal. After Ar ionsputtering and annealing atT < 800 K the surface showed asharp (1×1) LEED pattern. Using then the effect of total x-ray reflection within the temperature range between 300 and800 K the surface parallel exponent (η‖ = 1.52±0.04) wasdetermined. The observed exponent agrees reasonably withthe predicted valueη‖ = 1.48 for the so-called ordinarytransition [65, 66]. It was also confirmed that the lateralcorrelations near the surface decay much faster than ata depth of the order of 100A. As another interestingresult, an experiment with a small escape depth of∼30 Ashowed the existence of a superlattice Bragg peak up totemperatures of 16 K aboveT b0 . It was assumed thatexistence of the surface long-range DO3 ordering even forthe disordered B2 phase could be connected to surfacesegregation which can cause changes in the transitiontemperature according to the Al–Fe phase diagram.
The first surface segregation experiments on Fe3Al(110)near the order–disorder transition temperature wereperformed by Vogeset al [67] using LEIS. The surfaceof the Fe0.71Al 0.29(110) single crystal was cleaned by Arion sputtering, followed by a final annealing at 600 K. TheLEIS measurements at room temperature demonstrated aslight Al enrichment in the surface; however the interatomicdistances were compatible with the ordered bulk latticeparameters. Quantitative analyses have shown, that Alconcentration for the first layer in the [111] directionxAl1 = 0.38 and in the [110] directionxAl1 = 0.43. Theincreasing equilibrium Al content for elevated temperatureswas also clearly shown by the ISS data (table 1). But inso doing no evidence was found for a change in these Aldistributions by crossing the bulk transition temperature.The results depicted in the table exhibit a slight Al depletionin the second atomic layer, illustrating the oscillatoryconcentration profile.
3052
Surface effects
Table 1. Al concentrations in the first and secondoutermost layers, estimated from ISS [67].
Temperature (K) x Al1 x Al
2
700 0.96± 0.01 0.0± 0.1900 0.97± 0.01 0.1± 0.1
1000 0.97± 0.01 0.3± 0.11050 0.98± 0.01 0.2± 0.1
4.2. Ni3Al
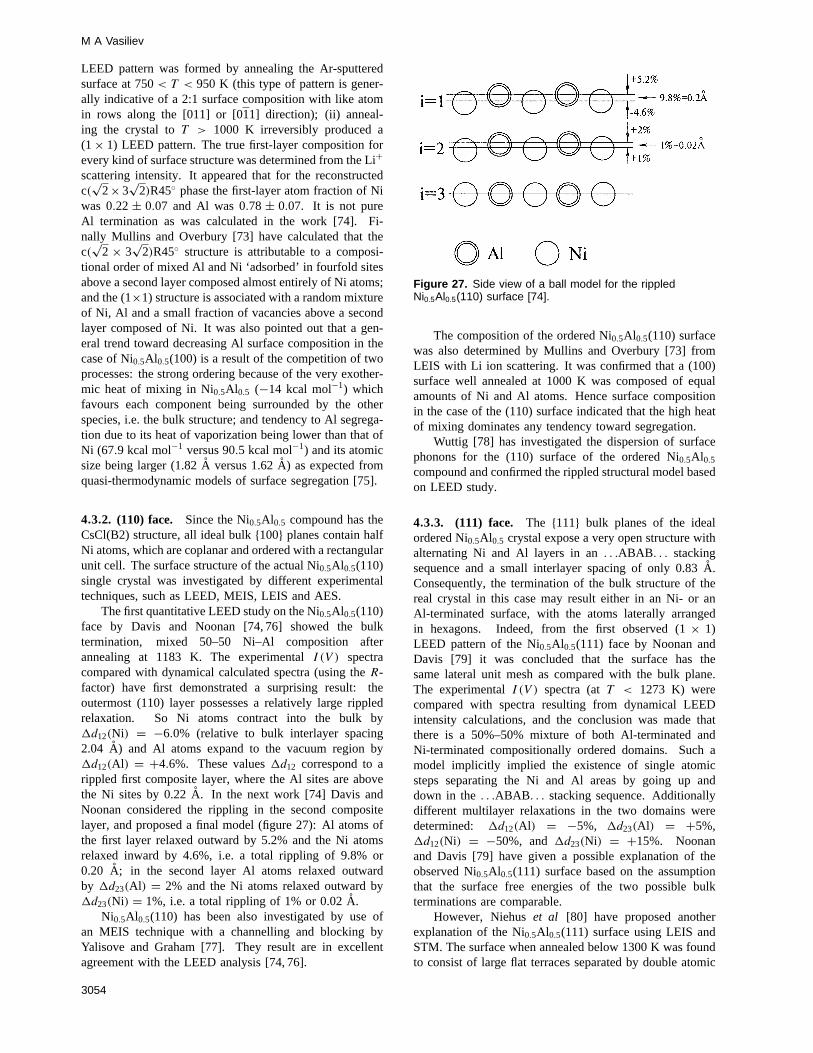
The Al–Ni system has received recently considerableattention because of its technological importance. Someordered intermetallic compounds, especially Ni3Al andNiAl, yield strength increases with increasing temperatureand have excellent corrosion resistance at high temperature[68]. However the intrinsic brittleness of this compoundin its polycrystalline form is a major drawback to itsuse as a construction material. It was suggested that thelocal compositionally disordered regions close to the grainboundaries are liable to increase the tendency for crackingto occur, since the number of possible dislocation reactionsat the interface is larger for the disordered state. It may bethat this local disorder is due to surface segregation effects.It is one of the main reasons for the current experimentalinterest in the surface structure of such ordered compoundsin single-crystal form. Since Al–Ni alloys contain bothsimple and transition metals, they also provide a challengeof two intermetallic compounds of the Al–Ni system havebeen examined in detail: Ni3Al (fcc, Cu3Al L1 2 type) andNiAl (bcc, CsCl B2 type), with different low-index faces[13]. Let us note that both compounds are paramagnetic [3].
4.2.1. (100) face. There are two possible bulk termi-nations: in the{100} termination (denoted by A) the topatomic layer has 50 at.% Ni–50 at.% Al (mixed layer);in the other termination the{200} planes (denoted by B)contain only 100 at.% Ni atoms. In order to determine thetype of termination Sonderickeret al [69, 70] performed thefirst quantitative LEED intensity analysis of the Ni3Al(100)face. In the first place, it was indicated by AES that acleaned and annealed surface was stoichometrically stablebetween room temperature and 1073 K, i.e. a surface seg-regation does not take place here. In the second place, theLEED-intensity-calculated data on the basis of the dynam-ical multiple-scattering program andR-factor analysis con-firmed the mixed-layer termination of a clean Ni3Al(100)surface with a small contraction of1d12 = −2.8% (db =1.78 A) and a slight buckling of the top layer (the Al atomsbeing 0.02± 0.03 A outwards from the Ni atoms). Thesecond interlayer spacing appeared to be bulklike. First-principles calculations of the cohesive energies of slabs ter-minating in the two types of layer also indicated that themixed-layer termination is more stable (2.108 Ryd com-pared to 2.036 Ryd for the B termination) [70].
4.2.2. (110) face. As in the case of Ni3Al(100) thereare also two possible{110} terminations: (i) unit meshwith one Al and one Ni atoms in the first layer and two
Ni atoms in the second layer (mixed-layer termination);(ii) unit mesh with two Ni atom in the first, and one Aland one Ni atom in the second layer (Ni-layer terminationindicated). This question of true termination was resolvedby Sonderickeret al [71] in their quantitative LEEDanalysis. The clean and annealed (110) face up to 973 Krevealed that the topmost layer contains 50% Ni–50% Aland the second layer has 100% Ni. On the basis of theLEED intensity calculations the geometrical parameterswere also determined. Particularly in the first surfacelayer, the Ni and Al subplanes were slightly separatedfrom one another by 0.02± 0.03 A (1.2% of the bulkdb = 1.259 A), the Al atoms moved outwards from thebulk. The contraction of the distance between the Nisubplane and the second layer was 0.15± 0.03 A (or 12%of the bulk value, while the corresponding value for theAl subplane was 10.7%). The second interlayer distancewas expanded by1d23 = +0.04± 0.03 A (3% of the bulkvalue). Buckling of the second plane and deeper relaxationshave not been tested.
4.2.3. (111) face. In this case there is only{111}termination because all{111} planes are equal to oneanother, with the stoichiometric composition of three Ni andone Al atom per unit cell. The structure of the Ni3Al(111)face was determined by Sonderickeret al [72] by means ofa quantitative LEED intensity analysis assisted by AES. Itwas confirmed that bulklike surface composition was stablebetween room temperature and 1023 K after the surfacecleaning procedure. The following structure parameterswere determined: a small but detectable buckling of thefirst atomic layer with the Al atoms 0.06± 0.03 A abovethe plane of the Ni atoms, which is in turn very slightlyshifted inward (0.01± 0.03 A) toward the second atomiclayer; second and deeper interlayer spacings were expectedto be equal to the bulk value (db = 2.055 A). Hence thetermination of the Ni3Al(111) single crystal is essentiallybulklike but with a small buckling of the topmost layer.
4.3. Ni0.5Al 0.5
4.3.1. (100) face. Since the Ni0.5Al 0.5 compound hasthe CsCl type ordered structure all bulk{100} planes havean . . .ABAB . . . stacking sequence with layers of all Niatoms and layers of all Al atoms alternately interspaced,and both layers have a square unit cell. Hence there isa question concerning bulk termination for a real crystalof Ni0.5Al 0.5(100): an Al layer or Ni layer. This surfacewas first examined by Davis and Noonan [74] using thequantitative LEED analysis. The calculatedI (V ) spectrawere compared with the experimental spectra by use of thereliability R-factor. The lowestR-factor was found for theAl-terminated model. It was also determined that surfacerelaxation values are1d12 = −8.5% and1d23 = +4.0%(db = 1.44 A).
LEIS and LEED studies on the same surface by Mullinsand Overbury [73] have confirmed the Al-terminationmodel, although also a surface reconstruction was observed.Depending upon the annealing regimes two types of LEEDpattern were observed in this study: (i) a c(
√2×3√
2)R45◦
3053
M A Vasiliev
LEED pattern was formed by annealing the Ar-sputteredsurface at 750< T < 950 K (this type of pattern is gener-ally indicative of a 2:1 surface composition with like atomin rows along the [011] or [011] direction); (ii) anneal-ing the crystal toT > 1000 K irreversibly produced a(1× 1) LEED pattern. The true first-layer composition forevery kind of surface structure was determined from the Li+
scattering intensity. It appeared that for the reconstructedc(√
2×3√
2)R45◦ phase the first-layer atom fraction of Niwas 0.22± 0.07 and Al was 0.78± 0.07. It is not pureAl termination as was calculated in the work [74]. Fi-nally Mullins and Overbury [73] have calculated that thec(√
2× 3√
2)R45◦ structure is attributable to a composi-tional order of mixed Al and Ni ‘adsorbed’ in fourfold sitesabove a second layer composed almost entirely of Ni atoms;and the (1×1) structure is associated with a random mixtureof Ni, Al and a small fraction of vacancies above a secondlayer composed of Ni. It was also pointed out that a gen-eral trend toward decreasing Al surface composition in thecase of Ni0.5Al 0.5(100) is a result of the competition of twoprocesses: the strong ordering because of the very exother-mic heat of mixing in Ni0.5Al 0.5 (−14 kcal mol−1) whichfavours each component being surrounded by the otherspecies, i.e. the bulk structure; and tendency to Al segrega-tion due to its heat of vaporization being lower than that ofNi (67.9 kcal mol−1 versus 90.5 kcal mol−1) and its atomicsize being larger (1.82A versus 1.62A) as expected fromquasi-thermodynamic models of surface segregation [75].
4.3.2. (110) face. Since the Ni0.5Al 0.5 compound has theCsCl(B2) structure, all ideal bulk{100} planes contain halfNi atoms, which are coplanar and ordered with a rectangularunit cell. The surface structure of the actual Ni0.5Al 0.5(110)single crystal was investigated by different experimentaltechniques, such as LEED, MEIS, LEIS and AES.
The first quantitative LEED study on the Ni0.5Al 0.5(110)face by Davis and Noonan [74, 76] showed the bulktermination, mixed 50–50 Ni–Al composition afterannealing at 1183 K. The experimentalI (V ) spectracompared with dynamical calculated spectra (using theR-factor) have first demonstrated a surprising result: theoutermost (110) layer possesses a relatively large rippledrelaxation. So Ni atoms contract into the bulk by1d12(Ni) = −6.0% (relative to bulk interlayer spacing2.04 A) and Al atoms expand to the vacuum region by1d12(Al) = +4.6%. These values1d12 correspond to arippled first composite layer, where the Al sites are abovethe Ni sites by 0.22A. In the next work [74] Davis andNoonan considered the rippling in the second compositelayer, and proposed a final model (figure 27): Al atoms ofthe first layer relaxed outward by 5.2% and the Ni atomsrelaxed inward by 4.6%, i.e. a total rippling of 9.8% or0.20 A; in the second layer Al atoms relaxed outwardby 1d23(Al) = 2% and the Ni atoms relaxed outward by1d23(Ni) = 1%, i.e. a total rippling of 1% or 0.02A.
Ni0.5Al 0.5(110) has been also investigated by use ofan MEIS technique with a channelling and blocking byYalisove and Graham [77]. They result are in excellentagreement with the LEED analysis [74, 76].
Figure 27. Side view of a ball model for the rippledNi0.5Al0.5(110) surface [74].
The composition of the ordered Ni0.5Al 0.5(110) surfacewas also determined by Mullins and Overbury [73] fromLEIS with Li ion scattering. It was confirmed that a (100)surface well annealed at 1000 K was composed of equalamounts of Ni and Al atoms. Hence surface compositionin the case of the (110) surface indicated that the high heatof mixing dominates any tendency toward segregation.
Wuttig [78] has investigated the dispersion of surfacephonons for the (110) surface of the ordered Ni0.5Al 0.5
compound and confirmed the rippled structural model basedon LEED study.
4.3.3. (111) face. The {111} bulk planes of the idealordered Ni0.5Al 0.5 crystal expose a very open structure withalternating Ni and Al layers in an. . .ABAB . . . stackingsequence and a small interlayer spacing of only 0.83A.Consequently, the termination of the bulk structure of thereal crystal in this case may result either in an Ni- or anAl-terminated surface, with the atoms laterally arrangedin hexagons. Indeed, from the first observed (1× 1)LEED pattern of the Ni0.5Al 0.5(111) face by Noonan andDavis [79] it was concluded that the surface has thesame lateral unit mesh as compared with the bulk plane.The experimentalI (V ) spectra (atT < 1273 K) werecompared with spectra resulting from dynamical LEEDintensity calculations, and the conclusion was made thatthere is a 50%–50% mixture of both Al-terminated andNi-terminated compositionally ordered domains. Such amodel implicitly implied the existence of single atomicsteps separating the Ni and Al areas by going up anddown in the. . .ABAB . . . stacking sequence. Additionallydifferent multilayer relaxations in the two domains weredetermined: 1d12(Al) = −5%, 1d23(Al) = +5%,1d12(Ni) = −50%, and1d23(Ni) = +15%. Noonanand Davis [79] have given a possible explanation of theobserved Ni0.5Al 0.5(111) surface based on the assumptionthat the surface free energies of the two possible bulkterminations are comparable.
However, Niehuset al [80] have proposed anotherexplanation of the Ni0.5Al 0.5(111) surface using LEIS andSTM. The surface when annealed below 1300 K was foundto consist of large flat terraces separated by double atomic
3054
Surface effects
steps and having only one atom species (Ni). Theseterraces were covered with small domains (an averagesize of 25 A) of the other alloy component (Al) whichmight be segregated over the top layer under the influenceof observed oxygen (about 10% of a monolayer). Onthis surface Al-terminated terraces were not found. High-temperature annealing at 1400 K resulted in an oxygen-freesurface and there was only Ni termination of the first layerfollowed by a second layer consisting of Al atoms.
4.4. Pt3Ti(100) and (111)
Alloys of Pt and Ti atoms are characterized by ahighly negative enthalpy of formation and strong bondinginteraction in the d orbitals of each metal. Pt–Ti alloysare known as a compound-forming system, particularly,Pt8Ti, Pt3Ti, Pt3Ti2, PtTi and Ti3Pt ordered compoundsexist according to the bulk phase diagram [13]. Thestrong intermetallic bonding interaction is expected to causedramatic changes in the catalytic properties of Pt and Ti.The ordered surface Pt3Ti compound is one of the stablesystems that forms among transition metals. The orderedsurface structure for this compound was the object ofseveral works [81–84].
The bulk single-crystal structure Pt3Ti has the Cu3AuL12 type structure with Ti atom substructure for Pt atthe corners of the fcc cubic unit cell, producing an. . .ABAB . . . sequence of planes normal to [100]. These{100} planes alternately have 50 at.% Ti and 100 at.% Ptcomposition. Thus there are as usually two inequivalentregular terminations possible. On the other hand, an ideal(111) surface of this crystal should have a layer stackingdesignated as. . .ABCABC. . . and all layers should be ofidentical stoichiometric composition, i.e. three Pt atoms andone Ti atom per unit cell.
Early work on the low (100) and (111) faces ofPt3Ti was performed by Bardi and Ross [81] usingqualitative LEED and AES. LEED patterns for theclean annealed (111) and (100) faces were designated asp(2× 2) and c(2× 2) superlattices, respectively. The half-order (superlattice) spots were observable to the highesttemperature up to 1200 K. After examining the superlatticespots over a wide range of beam energies and Ti/PtAuger peak ratios Bardi and Ross [81] concluded that thePt3Ti(100) face is a mixed bulklike (100) layer, and the(111) face is again the bulk termination. However, laterPaul et al [82], using angle-resolved x-ray photoemissionand LEIS, indicated that the clean surface of Pt3Ti(111)has a reconstructed structure where the first atomic layeris a quasi-pure Pt, and the stable termination of the(100) surface is the Pt-rich one. These results have beenconfirmed by a complete LEED analysis for the (100)face by Atrei et al [83] and for the (111) face by Chenet al [84]. In the latter more detailed study the fullquantitative analysis of LEEDI (V ) spectra was performedover several structure models. It was established as resultthat one pure Pt layer atop the bulk lattice gave the bestagreement with experiment on the base measuredR-factors,i.e. the outermost layer was pure Pt and the other layershad the bulk Pt/Ti ratio 3:1. The small contraction of
0.02 A ± 0.03 A for the first interlayer spacing (d12 =2.23±0.03 A) and 0.04 A±0.03 A for the second interlayerspacing (d23 = 2.21±0.03 A), corresponding to contractionof 0.9% and 1.8% of the bulk value, respectively, weredetermined. It was also found that there is a small bucklingin the top layer 0.04 A±0.05 A and larger buckling in thesecond layer 0.15 A ± 0.04 A.
4.5. Pt3Sn
Surface properties of the highly exothermic bulk Pt–Snalloys have been extensively studied in view of the interestas both heterogeneous catalysis for hydrocarbon conversionand as electrocatalysts for the direct electro-oxidation ofmethanol in fuel cells. Moreover, this system is interestingfor the study of surface segregation because it is composedof metals of considerably different heat of sublimationand surface energy [85]. The phase diagram of the Pt–Sn alloys shows that the solid solubility of Pt in Sn isnegligibly small, and assumes the existence a number ofstable compounds, particularly Pt3Sn, PtSn, Pt2Sn3 andSn2Pt [13].
Several recent studies of the surface structure of aPt3Sn single crystal were performed by surface sensitivetechniques [83, 86, 87]. The highly ordered exothermiccompound Pt3Sn has the Cu3Au (L12) structure with Snatoms on the corners of the face-centred cubic unit cell andPt atoms on the centre of the faces. The ideal faces of thiscrystal must have bulk termination surfaces like the othermembers of the L12 family, for example, such as Cu3Au,Ni3Al and Pt3Ti. Because of the surface Sn enrichmentobserved in polycrystalline Pt3Sn [88] and the relativelylarge difference in the thermodynamic parameters betweenSn and Pt, the proposal that Pt3Sn will behave like Cu3Auhas come into question.
4.5.1. (100) face. In the ideal (100) face of the Pt3Snsingle crystal there are equal numbers of the two typesof atom (50% Sn–50% Pt) and each has eight nearestneighbours. In the (200) plane there are only Pt atoms,each with eight nearest neighbours. Consequently, inthe [100] direction surface planes alternate between amixed layer and pure Pt one, resulting in two inequivalentregular terminations of the bulk crystal. The preferentialtermination in the ordered Pt3Sn(100) compound wasfirst determined by Haner and Ross [86]. After Arion bombardment and annealing at 1032 K the wellordered c(2 × 2) LEED pattern was observed and LEISspectra clearly indicated a surface composition of atleast 50 at.% Sn. Those results are consistent with thetermination of the compositionally mixed (100)-c(2 × 2)structure. In subsequent experiments Atreiet al [83] usinga quantitative LEED intensity analysis provided support forthis conclusion. In addition to LEED pattern observationsthey have performed full dynamical calculations of theintensity of the diffracted LEED beams, considering thevariations in the first two interplanar distances (d12 andd23)and the buckling of Sn atoms in the first mixed surface layerwith c(2× 2) structure. Assuming the outlined terminationwith 50% of Sn, the best agreement between experiments
3055
M A Vasiliev
Figure 28. Top view of the surface structure of Pt3Sn(111):(a) bulk termination; (b) surface reconstruction [87].
and calculations was found for buckling of Sn atoms of0.22± 0.08 A a value ofd12 = 1.89± 0.05 A and a valueof d23 = 2.00± 0.05 A (bulk value).
4.5.2. (111) face. The ideal (111) face contains threePt atoms for every Sn atom, and has a compositionidentical with the average of the bulk. Each atom herehas nine nearest neighbours. Hence the{111} planes inthe Pt3Sn crystal are all equivalent and contain the bulkcomposition. A structural model for the (111) surface ofthe ordered Pt3Sn compound corresponding to the idealbulk truncation (figure 28(a)) was confirmed by Haner andRoss [86] and Atreiet al [83] using quantitative LEEDand LEIS analysis. In these works the LEED patterns havebeen indexed as p(2 × 2). Full dynamical calculationsof the LEED beam intensity have shown stoichiometriccomposition (25 at.% Sn) of the outermost layer, Sn atombuckling of 0.21 ± 0.08 A, d12 = 2.20 ± 0.05 A andd23 = 2.38± 0.08 A (db = 2.31 A).
Recently Atreiet al [87] have demonstrated that the(111) surface of the Pt3Sn ordered compound may showa reconstruction in some conditions of preparation, i.e.a non-bulk termination. So after the clean surface with(2 × 2) structure was sputtered by 3 keV Ar ions at600 K the new LEED pattern was observed correspondingto (√
3 × √3)R30◦. Based on the quantitative LEEDcrystallographic analysis, Atreiet al [87] proposed thestructural model of the reconstructed Pt3Sn(111) surface(figure 28(b)). This model consists of a topmost planewhere Sn atoms substitute Pt atoms in an orderly wayaccording to the (
√3 × √3)R30◦ hexagonal symmetry,
while the underlying layers are assumed to contain no Sn.The optimization of the structure parameters led to a slightupward buckling (∼0.2 A) of the Sn atoms in the overlayer.The Sn fraction in the topmost layer for both (2× 2) bulktermination and reconstructed model is, respectively, 1/3and 1/4 of a monolayer. It was also concluded that themain factor of the(
√3×√3)R30◦ phase stabilization was
the highly negative enthalpy of Pt3Sn formation [85], thatmay be attributed to the enhanced Pt–Sn nearest-neighbourbonding. It takes place when the subsurface layers aredepleted in Sn. In this case Sn atoms are surrounded by Ptatoms only, and in contrast to the (2× 2) bulk terminationfor the reconstructed Pt3Sn(111) face the Sn–Sn nearest-neighbour pairs between atoms of the first and the secondsurface layers do not exist.
5. Random solid solution
5.1. Ordering solid solution
5.1.1. Cu85Pd15(110). Alloys of Cu and Pd areinteresting first of all in the field of catalysis and have beenthe object of a number of surface studies [86, 89–95]. Cuand Pd atoms form a continuous series of solid solutions[13], while the enthalpy of mixing in the formation of thealloys is only a moderately negative. Since the atomicradii of Cu and Pd differ by about 7%, the Cu–Pd systemis an appropriate alloy for investigating the influence ofatomic strain on the surface segregation effects. What ismore, those alloys make up the compositional ordered bulkphases in certain bulk composition ranges [13]. The orderedsuperstructure based on Cu3Pd (T b0 ∼ 773 K) is that ofthe fcc Cu3Au (L12) type within the composition range ofabout 10–25 at.% Pd and the order–disorder transition inthe region 30–50 at.% Pd is associated with formation ofthe CuPd ordered superstructure (T b0 ∼ 873 K) of the bccCsCl type. Evidence for surface ordered phases in thissystem was first found by qualitative LEED measurementsfor Cu–Pd(100) and Cu–Pd(110) alloys which were formedby depositing Pd atoms on the clean surface of the Cucrystal followed by annealing [89]. In this case Fujinagafound the c(2×2) ordered structure on the (100) surface andthe (2×1) structure on the (110) surface in agreement with abulk termination structure of the Cu3Pd (α′) ordered phase.Andersonet al [90] and Popeet al [91] first describedthe kinetics of the domain growth during formation of theCu(100)–c(2×2)Pd surface alloy. Holmeset al [95] usingLEED and AES have extensively analysed the equilibratedclean surface of a single-crystal Cu85Pd15(110) alloy, andfirst reported the geometric structure and composition ofthis face. It is well understood that a cut along the(110) plane will give alternate layers of 50:50 CuPd and100 at.% Cu for the ideal Cu3Pd phase. However, heretwo possible surface terminations may exist: (i) a top pureCu layer, and (ii) a topmost mixed CuPd layer. Holmeset al [95] have found that after repeat cycles of Ar ionbombardment and annealing at 650 K the LEED patterncorresponded to a well ordered p(2 × 1) superstructure.Based on the observation of CO adsorption it was suggestedthat pure Cu-terminated the first surface layer with amixed second ordered CuPd layer was the most likelysurface structure (figure 29). Subsequent results presentedby Lindroos et al [96] using quantitative LEED, and byNewton et al [93] using LEED, XPS and LEIS haveconfirmed the conclusion of Holmeset al [95]. However, itshould be stressed that according to the bulk phase diagramthe Cu85Pd15 alloy does not achieve the ideal ordered Cu3Pdstructure in contrast to the behaviour in the surface region.It was the first case of the ordering of an underlayer at thesurface of a random substitutional alloy, associated with thesurface segregation phenomenon.
Raoet al [97] have performed the first extensive studyof UV photoemission (UPS) for the (1× 1) disorderedsurface of the Cu85Pd15 alloy. The spectra obtained werequite different to both Cu(110) and Pd(110) spectra. This isevidence that the Cu–Pd alloy has been formed with a highdegree of mixing of the Pd and Cu electron states. Both
3056
Surface effects
Figure 29. Schematic diagram of theCu85Pd15(110)–(2× 1) surface [93].
ordered and disordered phases of the Cu85Pd15(100) facehave been then studied by Newtonet al [93] using alsoUPS. Figure 30 shows the angle-resolved normal emissionspectra from both the disordered (1× 1) and ordered(2× 1) surfaces with HeI radiation (in addition the spectrafrom Cu and Pd single crystals are also presented [97]).Two main changes after annealing to (2× 1) structurewere observed: (i) all the features of the photoemissionspectra appear to be better resolved; (ii) the major peak at2.2 eV binding energy (Cu-derived feature) has increasedin intensity relative to the rest of the spectra. It wassuggested that the first comment is dictated by the observedordering of the surface. Raoet al [97] have proposedto describe the width of both Pd and Cu features in the(1×1) HeI spectra in the context of ‘disorder smearing’ anddamping of the Cu-derived features. The second commentis consistent with the segregation effect of the Cu atomsinto the topmost layer at the (2× 1) selvedge structureformation. Most recently Coleet al [121] have discussedthe electronic structure of the ordered Cu85Pd15(110)surface in terms of the conclusion drawn from the extensiveexperimental and theoretical studies of bulk Cu–Pd alloys[100, 101, 105, 108, 110, 111, 120]. It was speculated thata knowledge of the ordering processes in the bulk ofCu–Pd alloys may yield useful insight into the nature ofsurfaces. First-principles electronic structure calculation(within the framework of the multiple-scattering KKR–CPAapproach) for ordered, as well as substitutionally disorderedsystems are discussed in a series of papers [98, 99, 102–104, 106, 107, 109, 112, 116, 117]. The above-mentionedtheoretical treatments and experiments have indicated thatthe physical and electronic structure (bulk and surface) ofthe Cu–Pd alloys can be understood in terms of matrixelement and self-energy effects, local lattice expansionsand charge transfer [114, 121]. The influence of the bulkchemical order on the surface morphology was recentlydemonstrated by Barbieret al [113]. They have showna double-step–single-step phase transition on the vicinalsurface of Cu83Pd17(110). Most recently Galliset al [122]have discussed the question of the competition or synergybetween surface segregation and bulk chemical ordering inthe Cu–Pd system. Properties of Cu0.5Pd0.5(110) single-crystal alloy surfaces were recently depicted by Loboda-Cackovic [118, 119, 123].
5.1.2. Pt–Co alloys. The Pt–Co system is one of theplatinum bimetallic alloys studied in terms of both catalyticand magnetic properties, particularly, in developing high-density magnetic recording. Pt and Co form a substitutional
Figure 30. Emission HeI valence band spectracorresponding to Cu85Pd15(110)—(A) the (1× 1) phase and(B) the (2× 1) phase [91]—and (C) Pd(110) and(D) Cu(110) [95].
continuous solid solution in the whole range of compositionand two ordered phases [13]. The PtCo ordered structureis stable from about 42 to 72 at.% Pt and the maximumof the order–disorder transformation temperature is 825◦Cat 50 at.% Pt. This phase has the tetragonal structure ofthe CuAu (L10) type. In the region of 75 at.% Pt thereis a fcc superlattice Pt3Co of the Cu3Au (L12) type withT b0 ∼ 750◦C. Both ordered phases are ferromagnetic atroom temperature.
Pt80Co20(100). The first qualitative LEED results andLEIS data by Bardiet al [124, 125] showed that the stabletermination of the (100) surface of the fcc disorderedPt80Co20 has a layer of pure platinum, forming a quasi-hexagonal layer on the (100) alloy surface with parameterssimilar to those of the reconstructed Pt(100) surface.According to LEIS results the second outermost layerwas approximately 40 at.% Co. The observed oscillatoryvariation in Pt composition (100–60–80 at.% Pt) of the firsttwo layers of the (100) surface is strikingly similar to thesurface-sandwich segregation model proposed earlier for anordering system (Ni–Pt, Pt–Ti).
Pt25Co75 (110). The structure of the Pt25Co75(100)alloy in the substitutionally disordered state was studiedin detail by Bugnard et al [126] using quantitativeLEED analysis. In the Co-rich region of the Pt–Co phase diagram the hexagonal cobalt phase (ε) isstable at room temperature until more than 6 at.% Pt isdissolved, whereupon the structure becomes disordered (upto 42 at.% Pt) fccγ -phase. In this region there is no order–disorder transformation; however the Pt25Co75 compositionis strongly ferromagnetic with rather high Curie temperatureTC ∼ 1120 K. After simple standard Ar ion cleaning andannealing at 1070 K the Pt25Co75(110) crystal exhibitsa sharp (1× 1) LEED pattern with no evidence ofcompositional ordering on a long-range scale. LEEDI (V ) intensities were calculated using the averageT -matrixapproximation for substitutionally disordered alloys. Thegoodness of the fit was assessed by five metric distances.
3057
M A Vasiliev
Finally, it was found the stronger Pt concentration oscillatesaround the bulk value and damps out over five layers:the top layer is a pure Co layer (xP t1 = 0), the secondlayer is strongly Co depleted (xP t2 = 90 at.%), the thirdlayer is strongly Pt depleted (xP t3 = 0), the fourth layer isenriched in Pt and the fifth layer is slightly Pt depleted.Additionally, larger interlayer spacing oscillations werefound: 1d12 = −16.3% (contracted) and1d23 = +11.2%(expanded) compared withdb = 1.298 A.
From these data one can notice that the damping ofthe interlayer spacing is faster than that of the composition.Interestingly, the present results demonstrated that on thethree surface region layers of Pt25Co75(110) there is quasi-perfect stacking of pure metal layers. This is a veryimportant observation with respect to the surface magneticproperties of this ferromagnetic system.
Pt80Co20(111). In the case of the (111)-orientedPt80Co20 [124], no reconstruction was observed inqualitative LEED, but only the fcc (111)-(1× 1) patternexpected for a bulk truncation surface structure with asurface lattice parameter nearly the same as that of the purePt(111) surface; no reflexes attributable to ordering of theCo atoms in the surface lattice were detected.
Gauthieret al [11] performed the first study of the alloyPt80Co20(111) surface using quantitative LEED analysisin the T -matrix approximation. According to the phasediagram for Pt contents larger than 80 at.% the alloy existsin the disordered fccγ -phase at all temperatures. Oncleaning by standard Ar ion cleaning and annealing in therange 960–1060 K the crystal produced at room temperaturea (1× 1) LEED pattern with sharp spots. The levelof agreement between experimental and calculatedI (V )
spectra was confirmed by five metric distances. The bestmodel showed that the Pt composition oscillates aroundthe bulk value and damps out over three layers. Asthis takes place, the first surface layer is a pure Pt layer(xP t1 = 100 at.%), the second layer is strongly Pt depleted(xP t2 = 48 at.%) and the third layer is only slightlyenriched in Pt (xP t3 = 89 at.%). The structural surfaceparameters were found to be typical of a (111) face ofan fcc metal, i.e. weak relaxations of interlayer spacings(1d12 = −0.3, 1d23 = −0.9 %, db = 2.226 A) and. . .ABC. . . stacking.
5.1.3. Pt–Ni alloys. Ni and Pt are both transition metalsexhibiting important and specific catalysis properties, andmodification thereof by alloying appeared very attractive.These two metals after alloying form fcc solid solutions,which are the subject of high interest in a wide offields, particular as catalysts in oxidation, respectivelyhydrogenation reactions. On the other hand, these alloysexhibit some quite remarkable surface features comparedto other alloys with similar electron structure and phasediagrams, and are probably the most studied among thesurfaces of random substitutional alloys. In the light of ourreview this alloy system has aroused considerable interestbecause of the tendency to compositional ordering in thebulk. The equilibrium phase diagram [13] shows that Niand Pt atoms form a continuous series of random solidsolution at higher temperature. However there are also
two ordered superstructures: around the composition Ni3Pt(Cu3Au L12 type of structure) withT b0 = 853 K, andNiPt in the equiatomic region (tetragonal CuAu L10 type ofstructure) below∼918 K; the homogeneity range extendsfrom about 40 to 55 at.% Pt at 673 K. There is also avariation of the Curie temperature with the composition ofthe alloy [3].
PtxNi1−x alloy surfaces have been extensively studiedin the disordered state only. Let us observe in briefterms the most thoroughly studied single-crystal alloyswith following composition: Pt10Ni90, Pt25Ni75, Pt50Ni50,Pt78Ni22, having different face orientations.
P txNi1−x(100). Gauthieret al [127] reported the firstquantitative LEED study to determine both the geometricstructure and the composition of the surface region of thePt10Ni90(100) alloy. The final surface cleaning procedureincluded annealing at 1050 K and then the alloy was cooleddown to room temperature. The electron scattering in thesubstitutionally disordered alloy was described by a layer-by-layer version of the averagedT -matrix approximation[127–131]. LEED-calculatedI (V ) spectra (by the layer-doubling method) and the experimentally observed oneswere compared in those works by means of metricdistances. In the case of the Pt10Ni90(100) alloy from suchdynamical LEED analysis a damped oscillatory surfacesegregation has been found with a Pt concentrationxP t1 =24.3± 2.7 at.% in the first layer andxP t2 = 6.4± 5.9 at.%in the second surface layer. The deeper layers have beenassumed to be bulklike, i.e.xP tb = 10 at.% Pt. Examineof the (1× 1) LEED pattern showed that a Pt-enrichedoutermost layer is not reconstructed. The absence of aclear (2× 2) superstructure which is expected in the caseof compositional order atxP t1 = 24.3 at.% Pt and thepresence, on the other hand, of narrow stripes indicatingthat [011] rows were partially ordered allowed us to drawconclusions about the occurrence of small ordered areas. Itwas proposed that the tendency of the alloy to order andthus prefer Ni–Pt bonds against Ni–Ni and Pt–Pt bonds maybe the main reason for the observed oscillation segregationprofile, because it leads to an increase of the number ofNi–Pt bonds between the outermost layers.
The dynamical LEED analysis also showed anoscillatory behaviour for the first three interlayer spacings:the distance between the first and the second layersd12
was expanded by+2.0 ± 0.3% as compared to the bulkvalue db; the distance between the second and the thirdlayers d23 was contracted by−1.2 ± 0.4%; and thed34
distance was expanded by+1.6± 0.9%. It is interestingthat in contrast to Ni(100) and some other fcc (100) metalsurfaces [6] however, the Pt10Ni90(100) surface starts withan expansion of the first interlayer spacing, probably due tosurface segregation of the larger Pt atoms to the outermostlayer.
A strong Pt enrichment in the first layer (up to 80 at.%)followed by a depletion in the second was also foundin the case of the Pt50Ni50(100) alloy by Gauthier andBaudoing [132] using also quantitative LEED analysis.It was concluded that this Pt segregation led to theformation of a (1×19) surface-reconstructed superstructure.Recent results by STM relative to the Pt10Ni90(100) and
3058
Surface effects
Pt25Ni75(100) faces [12] showed that these surfaces, too,tend to reconstruct forming a shifted row structure with alocally hexagonal structure.
PtxNi1−x (110). Gauthieret al [129] using quantitativeLEED analysis have studied the surface structure andcomposition of the Pt10Ni90(110) alloy. After Arbombardment and annealing at 1200 K the bulk disorderedcrystal displayed a LEED pattern with sharp spots typicalof a clean fcc (1× 1)-(110) surface. However, withinlarge energy ranges, halfway between the [100] rowsof the (1× 1) structure, dim continuous streaks in the[100] direction were observed, indicative of a tendencyto (1 × 2) atomic arrangement. The presence of theadditional weak LEED pattern features were attributed totwo-dimensional composition ordering of the alloy surface.This partial ordering appeared the most stable situationfor this alloy and was associated with surface segregationbehaviour. Quantitative LEED intensity analysis allowedus to conclude that the surface concentration and interlayerspacing oscillate and are attenuated, from the outermostlayer and inwards, over three layers, with final parametersxP t1 = 6.4±3.6, xP t2 = 52.3±2.1, xP t3 = 10±10 at.% andd12 = 1.206± 0.09 A (1d12 = −4.5 %), d23 = 1.308±0.14 A (1d23 = +3.6 %), d34 = 1.265± 0.09 A. Hence,the Pt10Ni90(110) face exhibits a well defined Ni–Pt surfacesandwich, where the (110) face favours Ni enrichment.Gauthieret al [128] also concluded that in addition to a1D composition ordering perpendicular to the surface thereis a 2D ordering observed parallel to the surface. Thissurface ordering tendency for the bulk disordered crystalwas attributed to a partial atomic arrangement in the secondlayer with 50 at.% Pt and 50 at.% Ni. As a result Pt and Niatoms alternate along the [110] rows so that most Pt siteshave only Ni first neighbours and vice versa. In this caseonly one type of Pt catalytic site is present.
The same quantitative LEED analysis was also usedby Gauthier et al [128] to determine the surface layercomposition and multilayer relaxation on the (110) face ofthe disordered Pt50Ni50 alloy. Upon annealing the crystal at1300 K the surface exhibited a sharp (1×1) fcc (110) LEEDpattern. It was found that the segregation created a surfacesandwich, which in three layers from the top layer andinwards contains enrichment of 100 at.% Ni (xP t1 = 0 at.%,xP t2 = 95± 4 at.% Pt) and 83 at.% Ni (xP t3 = 17± 7 at.%and xP t4 = 48± 13 at.% Pt). The surface segregationwas accompanied by a substantial multilayer relaxationrelative to the (110) spacing in the bulk (db = 1.325 A):d12 = 1.07 ± 0.01 A (1d12 = −19%, contraction),d23 = 1.47± 0.02 A (1d23 = +11%, expansion) andd34 = 1.31± 0.02 A (1d34 = −1%, contraction).
PtxNi1−x(111). The single-crystal PtxNi1−x(111) alloysurfaces have been studied with several experimentaltechniques: LEED [130, 131], LEIS [133, 134], XPS [135]and STM [136]. All the data except STM results wereobtained on crystals which were substitutionally disorderedin the bulk. The first qualitative LEED results obtained byGauthieret al [137] and Bertoliniet al [138] on (111)-oriented faces of Pt–Ni alloys of various bulk compositionannealed above the temperature of order–disorder transitionalways showed at room temperature a (1× 1) LEED
Table 2. Pt concentrations in the first and secondoutermost layers for Ptx Ni1−x (111) alloys [130, 131, 133].
pattern indicating a complete randomization of the surfacecomponents. The quantitative crystallographic LEEDanalysis of the (111) face of Pt50Ni50, Pt78Ni22 [130]and Pt50Ni50 [131] demonstrated in all cases a bulktermination structure with a strong enrichment in Pt ofthe outermost layer and a damped oscillatory compositionprofile including three outermost layers (table 2). Inother words, at its surface each one of the studied alloyssegregates into a well developed Pt–Ni sandwich with Ptatoms on top. Evidence for Pt enrichment in the outermostlayer was also reported by MEIS [134] and XPS [135].
The MEIS study by van de Rietet al [134] was initiatedfirst to examine the existence of the ordering or clusteringin the Pt50Ni50(111) surface, which can be deduced inprinciple from the angular position and from the shape ofthe intensity increase in a polar angular distribution. Itwas found that the Pt50Ni50(111) face annealed at 723 Kand cooled down to 353 K contains 88± 2 at.% Pt. Acombination of shadowing and blocking techniques andmodel calculations demonstrated that the Ni atoms of theoutermost layer are not clustered in domains and gaveno evidence of the surface ordering effects. However,Schmidet al [136] have performed the first attempt at directobservation of the surface compositional order by STM.The sample, a Pt25Ni75(111) single crystal, was preparedby repeated cycles of Ar ion sputtering and annealing at afinal temperature of 780 K. The LEED pattern did not showany superstructure spots, which might indicate long-rangecompositional order; the STM images were compared withMonte Carlo simulations with embedded atom potentials.The simulations verified segregation of Pt to the first surfacelayer (xP t1 = 47 at.%) and Ni enrichment of the secondlayer, and showed surface compositional-ordered (1× 2)domains of the kind observed by STM (figure 31). Thesedomains were close to the Pt50Ni50 2D ordered phasebecause below 918 K the ordered CuAu type L10 phaseexists in the bulk. Hence one can speak of a kind ofsurface-induced compositional ordering which is distinctfrom the 2D ordered structure expected from the fcc L12
bulk ordered phase.
5.1.4. Concluding remarks on Pt–TM alloys. Anumber of studies have focused on single-crystal Pt-based alloys, most notably on Pt–TM surfaces. Thisis because some of them have interesting catalytic orchemical properties directly connected with the strong Ptsurface segregation [128–131, 138]. At the present daythe quantitative full LEED intensity analysis developed byGrenoble group [132] appears to be the powerful method
3059
M A Vasiliev
Figure 31. Atomic arrangement on the Pt37Ni63(111)surface at 420 K calculated by Monte Carlo simulations[136].
to give important information on the Pt–TM (TM–Ni, Co,Fe) surface region with layer-by-layer resolution. It ispossible to compare results obtained on examples of Pt–TM alloys having the same face orientation and the samebulk composition, namely, Pt78Ni22(111), Pt80Co20(111)and Pt80Fe20(111) alloys [11]. All these three alloys arefcc with the usual unperturbed ABC stacking sequence of(111) planes. However there are also some differences: firstthe pure transition metals alloyed with Pt have differentbulk lattices, i.e. Ni is fcc, Co is hcp and Fe is bcc;second, the order–disorder critical temperature for orderedNi0.5Pt0.5 (915 K) and ordered Pt3Co (1098 K) phases aresubstantially below than that for ordered Pt3Fe (1623 K)phase. Because of this it was impossible to achieve cleansurfaces for the ordered state in Pt–Ni and Pt–Co alloysin contrast to Pt–Fe alloys. In the case of the (111)face the Grenoble group has established that the outermostlayer is essentially of quasi-pure Pt for all three above-mentioned alloys, and the composition profile damps outto the bulk value within four outermost layers. Howeverthe deeper layers showed different behaviour depending onalloy: marked Pt damped concentration oscillation for Pt–Ni and Pt–Co alloys (but less pronounced) and a monotonicdecrease for the Pt–Fe ordered system (figure 32). In thelast case, additionally the compositional order was observedin the underlying layers. It was concluded that the change inthe compositional profile (pronounced oscillation for Pt–Ni,monotonic profile for Pt–Fe and intermediate situation forPt–Co) is the result of balance between the strain energyterm, caused by differences in the atom size and latticeparameters, and the ordering energy term, i.e. strong Pt–TM pair interaction in the ordering systems which is veryeffective to stop the oscillation behaviour.
5.2. Compound-forming alloys
5.2.1. Cu–Al α-phase. Al–Cu alloys are a well knownconstructional material in varied engineering applicationsowing to a good combination of strength and toughnessat lower densities. Al and Cu atoms form fcc randomsubstitutional alloys in a range of composition from 0to 19.6 at.% Al (α-phase). Above this range severalordered compounds exist [13]. The surface of this alloy
Figure 32. The layer dependence of the Pt surfaceconcentration for Pt–M(111) alloy (M = Fe, Co, Ni).
has attracted particular interest because the (111)-orientedface in the case ofα-phase was found to be reconstructed[57, 139–142], giving an example of an alloy surface whichexhibits LRO at the surface in the absence of LRO in thebulk. Ferrante [139, 140] first demonstrated a sharp welldefined LEED pattern for the Cu–10 at.% Al(111) face,which was interpreted as(
√3× √3)R30◦ superstructure.
Using AES he also indicated increased Al concentrationwas limited to two layers up to 43 at.%. Later, thissurface superstructure was shown to undergo a reversible(√
3×√3)R30◦ (1× 1) phase transformation at 570 Kon the (111) face of Cu–12.5 at.% Al alloy [57]. Thistransformation was also observed at approximately the sametemperature in the Cu–16 at.% Al crystal by Bairdet al[142]. At first, it was suggested [57, 140, 141] that the(√
3 × √3)R30◦ superlattice was due to an ordering ofAl atoms above the alloy surface. But this Al overlayermodel was not supported by Bairdet al [142], using thequantitative LEED intensity analysis. Since this work hasgiven evidence of a radically new structure model wewill look at it more closely. The Cu–16 at.% Al (111)face was cleaned by Ar ion bombardment at 500 eVand after annealing below 570 K the(
√3 × √3)R30◦
superstructure was observed. In this case the surfaceconcentration of Al, as determined by AES, had increasedto one-third of a monolayer. Once the superstructure hadformed, the AES peaks did not change as the specimenwas heated. At 570 K the reconstructed surface exhibited areversible order–disorder phase transformation to (1× 1)symmetry. I (V ) spectra were recorded for the(
√3 ×√
3)R30◦ superlattice with the crystal cooled to∼150 K.For the LEED intensity calculations well established multi-scattering schemes were used [57]. Comparison betweentheory and experiment was made by the five type ofR-factor. The four structural models were calculated for the(√
3×√3)R30◦ superstructure, including (i) one-third of amonolayer of Al located in both fcc and hcp hollow siteson pure Cu(111), and (ii) one-third of a monolayer of Allocated substitutionally within the top layer of fcc Cu(111).In addition the mixed top layer in the second model wasgiven bucklings of 0.0± 0.1, and±0.2 A; this means thatAl atoms were depressed below or raised above the top Culayer by the amounts indicated. Also, the interlayer spacing
3060
Surface effects
Figure 33. Top view of the α-Cu–Al(111) surface [142].
between the mixed top layer and the next pure Cu layer wasvaried from 1.887 to 2.287A. The best agreement betweentheoretical and experimentalI (V ) spectra was consistentwith the above-mentioned second model, but with a slighttendency toward a small expansion of the top layer spacingby +0.05 A and a small inward buckling of the Al atomsby−0.025A (figure 33). Bairdet al [142] have drawn alsothe conclusion that such a substitutionally ordered surfacewas consistent with the short-range order observed in bulkα-Al–Cu compound-forming alloys.
5.2.2. Al–6.5 at.% Li. Considerably recent attentionhas been focused in particular on Al–Li alloys due toadvantages of these materials in different engineeringapplications, for example, as contemplated aerospacematerials, as an anode material in high-performancesecondary cells and lastly as a potential first-wall materialfor Tokamak reactors. However Al–Li alloys sufferfrom their relatively low resistance to corrosion by theatmosphere and by water. The later has given rise tostudy surface properties of this alloys. According to thephase diagram in this system a eutectic exists between anAl-rich random solid solution and a compound, Li2Al 3 ormore likely LiAl, with a bcc structure of the CsCl (B2)type [13]. It is not surprising, then, that the predictionof the surface structure model and surface compositionof the Al–Li alloys is rather difficult if not impossibleto realize. The first experimental study devoted to thisproblem has been performed recently by Espostoet al [143]using LEED, AES, SIMS and work function measurements.They investigated Al–6.5 at.% Li sheet with facets on thesurface of (111) orientation. The surface was cleaned by Arion sputtering at temperatures between 300 and 600 K. TheLEED pattern observed after the cleaning procedure alwaysindicated that the surface consisted of (111) facets only.LEED measurements were carried out during observed Lisegregation (figure 34). It was noted that rapid segregationof Li atoms to the surface layers (measured by AES) tookplace at annealing above 500 K, reaching a maximum Licomposition of 0.17. At higher temperature the Li surfaceconcentration decreased because of evaporation. It wasfound that at annealing temperature≥500 K the LEEDdata indicated the formation of an ordered(
√3×√3)R30◦
superstructure on the substrate with hexagonal symmetry.Upon cooling the sample, the value of Li segregationremained on the surface resulting in a final average surfaceconcentration of 0.16. The work function showed that arapid enhancement of surface Li concentration associatedwith a fast decrease in1φ in the same temperature range.
Figure 34. The temperature dependence of the Li surfaceconcentration for Al–6.5 at.% Li [143].
6. Comparison of theoretical and experimentalstudies
The present review is mainly concerned with experimentalstudies of the various surface effects in ordering alloys. Onthe other hand, many interesting theoretical results withsurface order–disorder phenomena were obtained over aperiod of years. A review of these is not the aim ofthe present paper. Nevertheless we will focus attention onsome related theories in the discussion of experiments andconfine ourselves for the present to recalling some basicaspects giving surface characteristics of the real orderedalloy systems.
6.1. The surface order–disorder phenomena
It was first shown theoretically by Valenta and Sukiennicki[8] for a thin film of Ni3Fe with (111) orientation as anexample, that changes in the LRO are to be expected atthe surface of ordered alloys. They and then Sukiennicki[144] have surmised these changes must be a result of anatural surface defect, i.e. lack of a fraction of nearestneighbours for the surface atoms, and also different latticeconstant and interlayer spacing in the surface region. Ingeneral, all kinds of surface defect, connected with differentconditions of surface layers in comparison with those inthe bulk make their contribution to the surface order–disorder behaviour. Sukiennicki and Puszkarski [145] haveproposed a phenomenological surface parameterα as ameasure of the change in the ratio of the ordering energiesdue to surface defects for surface atoms and that for insidethe bulk. The ordering energy as it usually in the case of theinteraction between nearest neighbours only was defined
V = EAB − 12(EAA + EBB) (5)
where EAB , EAA and EBB are the pairwise energiesof interaction between the A–B, A–A and B–B atomsrespectively for AxB1−x alloy. From the condition forthermodynamic equilibrium at a given temperature,
∂F
∂ηi= 0 i = 1, 2, . . . , n (6)
whereF is the free energy of a system, andηi is an LROparameter for theith monolayer. The authors of [145] used
3061
M A Vasiliev
Figure 35. Comparison between calculated (——[10]) andmeasured (•—[10], ◦—[17]) LRO parameters and Ausurface concentration, calculated (——[32]) and measured(×—[15]), for Cu3Au.
the well known Bragg–Williams approximation and madenumerical calculations ofηi for several values ofα. Indoing so they considered the first two boundary surfacelayers only. The results of calculation for Ni3Fe(111) areshown in figure 23 in comparison with experimental databy Vasiliev et al [146] considering the surface segregationeffects. In view of this theoretical work one can considerthat change of the surface composition is also a surfacedefect which influences bothα andηi parameters. As wecan see from figure 23 the surface values ofηi accordingto the experimental and theoretical results are lower in acomparison withηb at all temperatures. The theoreticaldata also show different behaviour of the surface parameterηi depending on parameterα (α = 1 is the case of thenatural defect only). In particular ifα is large than 3/2(critical value) the parameterηi may be even higher thanthe bulk one, that is not the case for Ni3Fe.
The behaviour of the LRO parameter as a functionof temperature for ordered Cu3Al(100) alloy was firstcalculated by Sundaramet al [10] also on the assumptionthat at each temperature the composition of the layerscorresponded to a bulk layer. Nonetheless, they haveobtained some fundamentally new theoretical as well asexperimental results for ordered system. In the statisticalcomputations of theηi parameter in layers near the surfacethe Monte Carlo method was used, and interactions betweenthe atoms in Cu3Au were represented by an Ising-likemodel Hamiltonian. The result of calculations for the realmixed CuAu termination of the surface model is shownin figure 35 together with LEED data. It can see thattheoretical data are in reasonably good agreement with theexperimentally deduced order parameter which, unlike thebulk, appears to be a continuous function of temperaturefor the surface. This was new evidence of the differencebetween observed behaviour of the LRO parameter at thealloy surface and that in the bulk. However the influenceof the surface composition as a function of the temperature,which was later experimentally observed, was not predictedin the calculations.
6.2. Ordering and surface segregation
The theory of surface segregation in an ordered alloywas first developed by van Santen and Sachtler [85] forthe Pt3Sn compound. They used the Bragg–Williamsapproximation in order to evaluate the surface free energyin both the ordered and disordered state assuming the sameorder parameter at the surface and the bulk crystal. This, ofcourse, is not correct as was shown above. Nevertheless, itwas demonstrated that the preferential termination of the(100) Pt3Sn crystal in the compositionally mixed (100)plane is the result of the surface composition constrainedby strong ordering energies in qualitative agreement withexperimental observation [86].
In succeeding years the A3B ordered system (fcc,Cu3Au type) has been the subject of several theoreticalinvestigations of the surface segregation effects on theorder–disorder behaviour at the surface. This problem wasraised by Moran-Lopez and Bennemann in their pioneeringwork [148]. The order–disorder phase transition andsurface composition for A3B type alloys have been studiedusing the Bragg–Williams approximation. If surfacesegregation was neglected, the calculated temperaturedependence of the surface LRO parameter accorded wellwith theoretical result reported earlier for Cu3Au [10].When the effect of surface composition changing onordering was taken into account the applied theory predictedthat the order parameter in the vicinity of the surfacecan be strongly reduced and might even disappear at thesurface at some temperature below the bulk transitiontemperatureT b0 (see the above example of Ni3Fe). Itwas the first theoretical prediction indicating that surfacesegregation and composition ordering in alloys affect eachother. Experimental support for this important conclusionwas obtained more recently when the experimental LEISdata were reported [15].
Using the cluster-variation method in the tetrahedronapproximation Kumar and Bennemann [147] have studiedthe order–disorder transition at the (100) surface of theCu3Au alloy considering the experimental results of thetemperature-dependent surface segregation [15]. Theircalculations are evidence in favour of a general conclusionmade previously [148] that there is a competition betweensegregation and ordering. For example, depending onsurface segregation behaviours as function of temperaturethe surface order–disorder transition may be first or secondorder (the case of Cu3Au), and disordered phase at thesurface may occur at temperature above or below the bulktransition temperature (the case of Ni3Fe). The calculatedsurface LRO agreed with the LEED data [10] but the Ausurface concentration in Cu3Au(100) was far below theLEIS result for both ordered and disordered structures.
The above-mentioned theoretical studies had the gravepractical disadvantage that the simple model involved onlyatom interactions which were the same for both surfaceregion and bulk crystal. In the subsequent study Sanchezand Moran-Lopez [32, 54] demonstrated that the surfaceorder–disorder effects obtained for the (100) surface ofCu3Au can be in fact accurately treated by a simpleIsing model with nearest-neighbour pair interactions inwhich such interactions at the surface were assumed to
3062
Surface effects
Figure 36. The layer dependence of the Au concentrationcalculated for Cu3Au(100) at 670 K [32].
be different from those in the bulk. The free energyof the system at finite temperatures was calculated byuse of the self-consistent cluster-variation method in thetetrahedron approximation. As seen in figure 35 theagreement between the model presented by the authors of[32, 54] and the available experimental LEED and LEISresults is satisfactory both in considering to the surfaceAu segregation (xAu1 , xAu2 ) and to the continuous surfacedisordering occurring at the same critical temperaturesas the bulk first-order transition, i.e.T s0 = T b0 . TheAu concentration and the LRO parameter have been alsocalculated for the 20 planes adjacent to the surface and sothe Au layer-by-layer profile was obtained at a temperatureof 670 K, 7 K above theT b0 (see figure 36). One cansee from this figure that such an oscillatory concentrationprofile in a direction perpendicular to the surface is aninherent feature of ordering alloys. As we can see infigure 35 the theoretical surface layer concentration showsa discontinuous jump at theT b0 in contrast to the LRObehaviour. The authors of [32] concluded that this effectis dictated by the first-order discontinuities in the bulkLRO parameter. We leave here the discussion of theinterplay between surface segregation and ordering for theCu3Au alloy and propose to the reader who has a takenan interest in this question the papers [35, 149–155] whichalso gave the theoretical treatment of the Cu3Au orderedalloy surface.
Let us consider the Ni–Pt alloy system next mostaccepted for theoretical treatment, but only from theviewpoint of ordering effects compared with experimentaldata. The strong Pt (or Ni) surface segregation andits extreme sensitivity to the face orientation in Ni–Ptordering alloy have elicited a number of theoretical models[29, 66, 128, 153, 156–163] in order to predict the relativestability of different possible configurations, such as theobserved ‘sandwich’ and the segregation inversion in (110)surface. It must be emphasized that the Ni–Pt alloysurfaces, notably the (110) surface, are found to presentsome problem for the calculations. The first problem isconnected with some factor which makes it preferable forPt atoms to be situated at (100), (111) surfaces and Niatoms at (110) surfaces; the second problem has motivatedthe nature of the strong depth–compositional oscillation.
The first theoretical estimations have shown that thecommonly used simple bond-breaking models [75, 164] fail
to predict Pt segregation in the case of Ni–Pt alloys. Itis well known when the two kinds of atom in an alloyhave different radii (rNi = 1.24 A, rP t = 1.39 A, forexample), there is a strain in the lattice (size effects). Thiseffect can be calculated by means of elastic continuumtheory [165]. However Lundberg [159] has demonstratedthat surface Pt segregation was poorly described by thebond-breaking model with the elastic strain term [165].The conclusion is that these simple theories including theheats of vaporization of pure metals, surface tension (quitenegligible), size effect and the bulk activity coefficientsare inapplicable to Ni–Pt alloy surfaces. The best resultswere obtained indicating a non-regular behaviour of theNi–Pt system, which as was pointed above has a strongordering tendency towards the formation of ordered L10
and L12 phases. For this reason the most theoreticalstudies have taken into account some ordering effects[29, 153, 156, 157, 160–163]. Unfortunately, it is almostimpossible to test these effects for well ordered phasesbecause all experimental studies of Pt and Ni surfacesegregation for all concentrations and faces were performedwith random alloys. In spite of this fact the incorporationof the ordering term in some theoretical models has allowedus to obtain a number of fundamental data. From thispoint of view let us briefly consider some of the workswhich used the most developed theoretical model, the tight-binding Ising model (TBIM) [29, 159, 166].
Treglia and Legrand [166], Lundberg [159] andLegrand and Treglia [29] have shown that the mainfeatures of the surface segregation phenomena for Ni–Pt alloys can be interpreted using an improved TBIMapproximation in which the size effect was treated within amicroscopic model and the pair interactionV s was variedat the surface region according to the electron structurecalculations. In particular it has been shown that thesign of V (V > 0 in equation (5) is a tendency toordering) is due to the spin–orbit coupling interactions. TheV -value was also derived from the experimental criticaltemperatures of the L10 ordered phase in the mean-fieldapproximation (V b = 1
2kTb
0 = 0.038 eV). However fordifferent crystallographic orientations the enhancements atthe surface of the effective pair interactions are increasedwhen the face is an open one, mainlyV b < V s(111) <V s(100) < V s(110). For example, in the last case1.5 < V s(110)/V b < 2. The differentV s values wereinvolved in the segregation energy calculations in order todetermine the physical origin of this phenomenon. Finallythe segregation energy was reduced to the combination ofthe two main factors: of the size mismatch term (1Hse
i )and the ordering term1Hord . It was demonstrated byTBIM calculations that the competition between1Hse
i
and1Hord terms may be thought of as the genesis of avariety of segregation behaviours in relation to the surfaceorientation, the bulk concentration and the temperatureregion. This competition led to a strongly dampedoscillating segregation profile atT > T b0 for the (100)and (110) surfaces compared to the (111) surface, whichwas explained as a tendency towards the formation ofthe ordered phases in the bulk. The size effect appearedmore pronounced on the closer-packed (100) face than on
3063
M A Vasiliev
the more open (110) surface. To summarize, the TBIMmodel for the (100) and (111) surfaces predicted a Ptsurface enrichment for the whole bulk concentration rangein good agreement with experimental results obtained byLEED. Nevertheless the discrepancy remains still in a largedifference between the LEED and TBIM for the (110)surfaces. Finally, experiments in the ordered bulk phase ofthe Ni–Pt alloys should be of great interest because theymay give a clear insight into the nature of the relationbetween surface segregation and ordering effects in bothordered and disordered Ni–Pt alloys.
In conclusion it may be pointed that the magnetic andvibrational contributions are small in Ni–Pt alloys and theentropy of alloy formation1Sform in the Pt-rich regionsuggests a tendency towards ordering [167]. On the otherhand, Pt50Ni50(110) alloy is non-magnetic in the bulk butthe question now arises of whether sufficient spin couplingwould occur among the Ni atoms at the (110) surface for theobserved Ni–Pt–Ni sandwich to exhibit surface magnetism[128].
Now we note two examples when the improvedquasichemical broken-bond model was usefully employedfor the theoretical prediction of the surface segregation inthe strongly ordered intermetallic compound Pt3Ti [168]and ordering Cu85Pd15 alloy [94]. This qualitative modelof segregation [164] gives two simple criteria for predictingthe general segregation behaviour in very dilute ideal alloys:(i) the bond strength ratio, (ii) the atomic size ratio. Spencer[168] has shown that when these criteria are applied todilute solid solutions of Ti in Pt the structure segregation ofTi should occur in contrast to the experimental results [84].However he extended this model to a more concentratedalloy, in particular the ordered Pt3Ti compound, and usedthermodynamic data for Pt–Ti alloys as well as those for thepure metals. Considering the Pt–Ti alloys as the irregularsystem (ordering) Spencer [168] proposed, on the basis ofthe broken-bond model, that two main factors control thethermodynamics of segregation: the strain energy and thesurface free energy. The first factor as known originatesfrom the mismatch of the sizes of the atoms, and the secondone comes from bonding between atoms. In the pure metalsTi has the larger metallic radius (rT i = 1.47 A, rP t =1.39 A); however for the Pt3Ti the effective size of the Tiatom appeared to be smaller than that of the Pt atom [164]so that factor does not favour the segregation of Ti atoms.Moreover for Pt3Ti any Ti–Ti bonding can be neglectedbecause all Ti atoms are coordinated to 12 Pt atoms asnearest neighbours while the Pt atoms are coordinated toeight Pt atoms and four Ti atoms as nearest neighbours. Inthis case the free energy of segregation
1Gseg = 1Z(EPt−T i − EPt−P t ) (7)
consists only of the nearest-neighbour bond strengthsEPt−T i and EPt−P t ; 1Z is the difference in effectivecoordination number of a bulk site and a surface site.Since the free energy of the Pt–Ni bond (EPt−Ni =22.17 kcal/g-atom) is larger than the Pt–Pt bond (EPt−P t =17.7 kcal/g-atom) at 800 K, the surface free energy willalso not allow Ti atoms to occupy the surface, in line withexperiment [84].
Newton et al [94] have also used the simple broken-bond model to predict surface segregation in the Cu–Pdordering alloys despite the fact that this model is notformally designed for systems having a tendency to order[75, 164, 169]. The results of these calculations have shownin agreement with experimental observation a Cu outermostlayer, and a second layer significantly enriched in Pd forthe Cu85Pd15(110) equilibrium structure. It was againdemonstrated that the overall driving force for segregationin ordering alloys (having a negative heat of solution) isthe result of a competition between the size mismatch andsurface free energy terms.
The condition for order–disorder transition to the(√
3 × √3)R30◦ structure ordered phase in the absenceof the bulk LRO was discussed by Teraoka [170] usingof the Bragg–Williams approximation. In fact such a casewas experimentally observed on an fcc (111) surface ofα-Al–Cu alloy with bulk Al concentration of more than9 at.% [140, 142]. Using the nearest-neighbour pairwiseinteraction energies Teraoka defined the ordering energyV = EAA+EBB−2AB and the surface segregation energyW = EAA−EBB for the AxB1−x(111) surface and ordered(√
3×√3)R30◦ phase. The role of the surface segregationin the surface order–disorder transition in order to form theoutermost layer with(
√3×√3)R30◦ symmetry was shown
first. This structure was predicted for the absence of thebulk LRO only if W/V > 1 andx < 0.21 by calculationsof the difference between the free energies of the orderedand disordered phases [170].
6.3. Surface magnetism
It is well known that the compositional order of atomsmay significantly influence the bulk magnetic propertiesof alloys [3]. So in a number of ferromagnetic alloys thesaturation magnetization, Curie temperature, coercive force,magnetic permeability and some other properties are foundto be strongly dependent on the degree of compositionalorder.
There are a number of theoretical analyses of theinterdependence of magnetism and order in the bulkbinary alloys with one or two ferromagnetic components[4, 5, 171–173]. In particular the influence of magnetismon order–disorder critical temperature and, conversely,the influence of ordering on the Curie temperature weretreated in detail for the bcc CoxFe1−x alloy [4, 5]. Itwas also shown that the interplay of compositionaland magnetic order leads to complicated bulk phasediagrams which can only be obtained if both effectsare considered on an equal footing [4, 5, 174]. Basedon a study of the bulk properties one may speculatethat the situation at the surface of the ferromagnetic andcompositionally ordered alloys must be more complicated.Firstly this is due to the well established fact that atleast for ferromagnetic pure metals (Fe, Co, Ni, Gd)the magnetization at the surface may differ considerablyfrom that in bulk crystal because of the reduction inthe coordination of the surface atoms as well as thedependence of magnetic surface properties on the chemicalstate of the pure metal surfaces (magnetochemistry effect).
3064
Surface effects
More complete reviews on surface magnetism of puremetals have been given by Mathon [175] and recentlyGradmann [176, 177]. It is worth noting the mainfundamental advantages in surface magnetism study interms of our review are the following. (i) Powerfulexperimental techniques for surface magnetic analysis inUHV were developed, in particular SPLEED, ultrathin-film spectroscopy, Mossbauer spectroscopy and electron-capture spectroscopy. (ii) On theoretical grounds, surfacemagnetism has been treated within different frameworks,in particular the mean-field approximation, effectivefield theories, the random-phase approximation, MonteCarlo techniques and renormalization group methods.(iii) The first-principles calculations of band structures,magnetic moment and hyperfine field near surfaces aswell as experimental studies have confirmed that magneticmoments are enhanced in free surfaces of transitionmetal ferromagnets and oscillation of hyperfine fields; theenhanced surface magnetization penetrates some distanceinto the bulk. (iv) The temperature dependence of surfacemagnetization is basically understood: the magnetizationat the surface decreases more rapidly than the bulkmagnetization as the temperature is raised. (v) Magneticsurface anisotropy as a result of broken local symmetryin surfaces has also now generally been accepted as animportant basic surface property. (vi) Modified exchangeinteraction I si near the free surface gives rise to sometype of surface magnetic order even above the bulk Curietemperature, so-called ‘live (surface) layers’.
It is necessary to stress that the nature of the phasetransitions in magnetic systems has been studied extensivelyboth theoretically for an infinite system [47, 178–184] andexperimentally for finite systems with real surfaces (seereviews [175–177]). In terms of our paper it is worthnoting that the surface and bulk magnetization curves asfunctions of the temperature depend on howI si /I
b variesin accordance with theoretical prediction. As a result thephase diagram for the semi-infinite Ising model dependingon the values ofI si andI b was proposed [183]. As indicatedin figure 37 depending on the value ofI si /I
b differentbehaviours at the surface and bulk can be obtained. IfI si issmaller than a critical valueI si,C (T < T bC ) both the bulk andthe surface are magnetically ordered (ordinary transition);and if I si > I si,C , the surface is disordered (paramagneticphase) at a temperatureI si (surface transition) larger thanthe bulk T bC (extraordinary transition), i.e. the surfaceremains magnetically ordered while the bulk order is absent.In the last case for the intermediate values ofT bC < T < T sC ,the magnetization decays exponentially into the bulk withcharacteristic length [183].
6.4. Surface effects in magnetic ordered alloys
Of special current interest is the magnetism of alloysurfaces, in particular the relation between the atomicstructure, surface segregation, compositional and magneticorder in the surface region. So far this problem is notwell understood in terms of either theory or experiment ascompared with surface magnetism of the single-componentmetals. In the case of alloys the interplay of physical
Figure 37. Phase diagram for the semi-infinite Ising modelwith bulk coupling J b and surface coupling J s . The state ofthe bulk is denoted BF for a ferromagnet and BP for aparamagnet; the surface phases are SF (ferromagnet), SP(paramagnet) and SAF (antiferromagnet) [183].
processes is more complicated because more surface andbulk parameters must be included in the theoretical model.On the other hand the experimental study of alloy surfacemagnetism is also very difficult because there are not sofar experimental techniques which allow reliable data tobe obtained over the wide range of temperatures underthe UHV test conditions making possiblein situ surfaceanalysis of the atomic structure, composition and magneticproperties in a wide surface region. Nevertheless, afew theoretical and experimental results were reportedwhich may be of interest in future study of alloy surfacemagnetism. From this viewpoint more interesting systemsare those alloys in which compositional and magnetic orderoccur simultaneously.
In the theoretical studies by Moran-Lopez and Falicov[185, 186] and Urias and Moran-Lopez [187] it has beenfirst shown that in comparison with the pure metalsthe surface magnetization in alloys differs significantlyfrom that in the bulk not only owing to the diminishingof the surface coordination number but also because ofdifferences in the surface composition and degree ofcompositional order. For example, the surface segregationof ferromagnetic components in the dilute alloy with onemagnetic component may lead to a surface magneticallyharder than the bulk according to theoretical prediction[188, 189] and experimental observation, particularly in thecase of random Ni–Pt alloys (see above). The effectsof ordering we illustrate by the example of the orderedferromagnetic bcc Fe0.5Co0.5 alloy which was understoodby both experimental and theoretical studies [47, 51, 185–187, 190].
The first theory of the relation between surfacecomposition, short-range order parameter and magnetismfor binary bcc AxB1−x applied to ordered Fe0.5Co0.5(110)was initiated by Moran-Lopez and Falicov [185, 186]. Tocalculate the surface properties of such a ferromagneticsystem they used a Heisenberg Hamiltonian with
3065
M A Vasiliev
interactions between nearest neighbours only, and asurface structural model consisting of a mixed Bethelattice. In this model the surface topmost layer wasdifferent from the bulk planes only. The temperaturedependence of the surface composition, the short-orderparameter, the spin-wave spectra, the bulk and local surfacemagnetization were calculated with parameter fitted to thewell known experimental data (Curie temperature, heat ofvaporization and order–disorder temperature). The surfaceFe concentration as a main result appeared to be higher thanin the bulk and the spins predicted were SFe = 2> SCo =1.5. As consequence in the case of the Fe0.5Co0.5(110)ordered alloy the surface exhibited a large magnetizationcompared to the bulk for temperatures observed up to400 K. On the other words the atoms with larger spin weresegregated to the surface.
In succeeding years Urias and Moran-Lopez [187] forthe same system have considered the compositional LROwith surface segregation and magnetic order parameters.The calculations were performed within the mean-field(Bragg–Williams) approximation pairwise between nearestneighbours only. The magnetic interactions were surmisedto be Ising type also with nearest neighbours. Let usunderline here only some of the main features of this study,particularly for the Fe0.5Co0.5(110) ordered alloy of the bccAxB1−x system with spinSA andSB .
In calculations [187] the heat of alloy mixing wasdefined by
BJBB are the chemical (ordering term) andmagnetic contributions to the heat of alloy mixing,respectively. The main driving parameter was defined as
1 = 1CWC −1MWM
WC +WM
(9)
where
1C = EAA − EBBWC
(10)
and
1M = S2AJAA − S2
BJBB
WM
. (11)
The equilibrium values of calculated parameters weredetermined by minimizing the free energy. It was firstfound that for a bcc AxB1−x system with spinsSA,SB and for different cases of the relation between Isingexchange integralsJAA, JAB , JBA andJBB the magnetismat LRO parameterη = 0 favours surface enrichment of thecomponent A ifS2
AJAA < S2BJBB .
The Fe0.5Co0.5 alloy is a case withT b0 (1003 K)< T bC(1258 K) and a positive magnetic ordering energy (1M >
0), but with chemical term1C > 1M . The theoreticalcalculations were performed for parametersJFeFe, JCoCo,JFeCo determined from theT bC at xbFe = 0.5, andEFeFe,ECoCo, EFeCo determined from the cohesive energy of thepure elements. It turns out that for Fe0.5Co0.5(110) alloy thechemical effects would tend to segregate the Fe atoms incontrast to magnetism predicting Co surface segregation.The interplay of the contribution of both chemical and
Figure 38. The temperature dependence of the Fe surfaceconcentration, bulk and surface LRO parameters andaverage magnetization calculated for the Fe0.5Co0.5 system[187]. The experimental result [47] is shown by the bar.
magnetic terms for the surface and bulk region, as wellas the temperature dependencexFe1 (T ) are illustrated infigure 38. One can see in the figure that the surfaceLRO parameterηs1, the magnetic order parameterξ s1 andthe surface Fe compositionxFe1 are different from thesein the bulk of primarily completely ordered Fe0.5Co0.5
alloy. Unfortunately the experimental data are only forsurface composition from AES analysis [47, 51] which is inqualitative agreement with the discussed theoretical result.
Because the experimental evidence of Gradmannet al [191] and Victora [192] has confirmed that themagnetization of the pure free Fe(110) surface is enhancedby approximately 30% one can conclude that the Fesegregation in the Fe–Co system also enhances the surfacemagnetic moment. On this basis we may suggest that inthe Fe–Ni alloys (see above) the surface magnetization isalso enhanced due to the strong surface segregation of Feobserved experimentally. However this alloy system wasnot theoretically treated in view of the surface magnetismphenomena. The depth distribution of the magnetic momentin the surface region of both ordered and disordered alloysis also an open problem.
7. Conclusions
Let us summarize briefly the most important achievementsin the studies of the ordering and magnetic effects at thesurface region of the single-crystal binary alloys.
First of all a number of analytical methods verysensitive to the surface region has been developed toobtain a more detailed knowledge of the crystallographicsymmetry, lattice and compositional order parameters aswell as the composition and spin order of the outermost fewatom layers of alloys with ordered or disordered (random)phases. Among the well known methods (listed in theintroduction) some of them were significantly improvedspecially for study of surface ordering and magnetic effectsin alloys. In particular the quantitative LEED intensityanalysis is one of very few techniques capable of resolving,layerwise, the surface structure, order parameter andcomposition profile of substitutionally ordered or disorderedphases. In addition, quantitative observation of the surfaceorder–disorder kinetics as function of a temperature and
3066
Surface effects
depth was also made possible by the LEED system witha position-sensitive detector. The combination of LEEDand LEIS (with the time-of-flight version) has a significantplace in the structure and composition analysis of the firsttwo atom layers. The first STM study was presented whichhas demonstrated the clear discrimination of two chemicalspecies in an alloy surface and short-range ordering effects.The important result obtained by SPLEED in the studyof the surface magnetization in the ferromagnetic surfacewas also shown. SPLEED will remain in the future themost accurate method for absolute measurements of thesurface magnetization. Using LEED with modulated beamintensity allowed us to observe some new ferromagneticanomalies in alloys. However the lack of extensive andaccurate studies of the alloys’ surface magnetic propertiesin comparison with pure metals is certainly dictated by thespecific experimental difficulties which may be resolved inthe immediate future. Along this line the use of dynamicalSPLEED theory and the layer-by-layer approach are moreappropriate to obtain insight into the atomic magneticmoment distribution as a function of the temperature anddepth in combination with depth profiling of the lattice andorder parameters as well as layer composition.
Of main interest is the following phenomenon observedfrom the studies of the various ordering alloys.
—An ideal bulklike termination with (1× 1) structureand compositional mixed (100) layer for the〈100〉orientation of the fcc-ordered Cu3Au, Cu3Pt, Ni3Fe alloysand ordered compounds Ni3Al, Pt3Ti, Pt3Sn as wellas bcc-ordered Co0.5Fe0.5(100) alloy and Al0.5Ni0.5(110),Fe3Al(110) compounds.
—Surface segregation damped oscillatory profile inordering alloys as systematically found for PtxNi1−xrandom systems and in the disordered Cu3Au and Ni3Fe.
—Face-related ‘sandwich’ segregation, observed onPtxNi1−x(110) versus (111).
—Strong surface multilayer and rippled relaxation aswell as buckling in the first few layers of an orderedcompound (Ni3Al).
—The surface reconstruction with layer relaxationand buckling, based on the formation of the surfacesuperstructures of different types, in particular missing row(1× 2) reconstruction in Pt80Fe20(110); hexagonal(
√3×√
3)R30◦ in ordered Pt3Sn(111) and random compound-forming Al–Li and Al–Cu alloys; a quasipure Pt top layerin ordered Pt3Ti(111).
—The surface order parameters, in contrast to thebulk behaviour, appeared to be a continuous function oftemperature (second-order transition) in the Cu3Au andNi3Fe alloys with the bulk first-order transition. It is alsoan important observation that the ordering process at thesurface of the Cu3Au, Ni3Fe begins at a temperature belowthat in the bulk, however in the first caseT s0 = T b0 , andin the second caseT s0 < T b0 . From layer to layer the kindof order–disorder transition in these systems changes fromsecond order to first order.
—In the Ni3Fe(100), (110), (111) alloys surfacedisordering is accompanied by a strong temperature-dependent Fe surface segregation.
—The effects of ordering on the surface electronicstructure were observed in detail on an example of orderedand disordered Cu3Au(100) and (110) surfaces.
—Systematic studies of the surface behaviour offerromagnetic single-crystal alloys have only recentlybeen performed on the example of ordered (disordered)Ni3Fe(111). Since its surface magnetic and electronicstructure and composition appeared to be different fromthose of the bulk, a number of new surface magneticeffects have been discovered, in particular, the shift nearthe Curie temperature of the LEED reflex energy maximumand nonmonotonic temperature-dependent behaviour of thismaximum. In addition the antiferromagnetic couplingbetween the surface layer and underlying bulk inthe Ni3Fe(111) alloy was revealed; the surface Curietemperature appeared to be higher than the bulk one,because of strong Fe surface enrichment with temperatureincreasing.
—A number of theoretical models have been developedspecifically to describe the surface behaviour in non-magnetic and ferromagnetic ordered (ordering) alloys.The modern realistic models are based on two importantconcepts: (i) the pairwise interaction energies in thesurface region are different from those in the otherregion, and (ii) the multilayer (layer-by-layer) approachis far more appropriate to predict the distribution of thedifferent structural, compositional as well as other physicalparameters as a function of the depth, including orderparameters and kinetics of the surface phase transition.The interrelation between the compositional ordering,magnetization and surface segregation was confirmed witha good agreement with experimental data.
Finally it may be said that the ordering and magnetismat the surface of the alloys with transition metals will clearlyremain an area of intense activity.
Acknowledgments
The research described in this publication was madepossible in part by grant NU8200 of the UkrainianGovernment and International Science Foundation. Theauthor is very grateful to Klaus Wandelt for stimulatingdiscussion and for reviewing the paper.
References
[1] Krivoglaz M A and Smirnov A 1964The Theory ofOrder–Disorder in Alloys(London: McDonald)
[2] Ducastelle F 1991Order and Phase Stability in Alloys(Cohesion and Structure)vol 3, ed F R deBoer andD G Pettifor (Amsterdam: North-Holland–Elsevier)
[3] Bozorth R M 1953Ferromagnetism(New York: VanNostrand)
[4] Moran-Lopez J L and Falicov L M 1979 Solid StateCommun.31 325
[5] Moran-Lopez J L and Falicov L M 1980 J. Phys. C: SolidState Phys.13 1715
[6] Van Hove M A, Koestner R J, Stair P C, Biberian J P,Kesmodel L I, Bartos and Somorjai G A 1981 Surf.Sci. 103 189
[7] Vasiliev M A 1988 Structura i Dinamika PoverkhnostiPerekhodnykh Metallov(Kiev: Naukova Dumka) (inRussian)
3067
M A Vasiliev
[8] Valenta L and Sukiennicki A 1966Phys. Status Solidi17903
[9] Nielsen P E H1973Phys. Lett.42A 468[10] Sundaram V S, Farrell B, Alben R S and Robertson W D
1973Phys. Rev. Lett.31 1136[11] Gauthier Y, Baudoing-Savois R and Bugnard J M 1992
Surf. Sci.276 1[12] Bardi U 1994Rep. Prog. Phys.57 939[13] Hansen M and Anderko K 1958Constitution of Binary
Alloys (New York: McGraw-Hill)[14] Potter H C and Blakely J M 1975J. Vac. Sci. Technol.12
635[15] Buck T M, Wheatley G H and Marchut L 1983Phys. Rev.
Lett. 51 43[16] Krummacher S, Sen N, Gudat W, Johnson R, Grey F and
Ghijsen J 1989Z. Phys.B 75 235[17] McRae E G and Buck T M 1990Surf. Sci.227 67[18] McRae E G and Malic R A 1990Phys. Rev.B 42 1509[19] McRae E G, Buck T M, Malic R A and Wallace W E
1990Surf. Sci238 L481[20] Shaw C G and Fain S C Jr1977Proc. 7th Int. Vacuum
Congress 3rd Int. Conf. on Solid Surfaces (Vienna)ed R Dobrozemsky, F G Rudenauer, F P Viekbock andA Breth, p 535
[21] McRae E G and Malic R A 1984Surf. Sci.148 551[22] Jamison K D, Lind D M, Dunning F B and Walters G K
1985Surf. Sci.159 L451[23] Alvarado S F, Campagna M, Fattah A and Velhoff W
1987Z. Phys.B 66 103[24] Dosch H, Mailander L, Lied A and Peisl J 1988Phys.
Rev. Lett.60 2382[25] Sundaram V S and Robertson W D 1976Surf. Sci.55 324[26] McRae E G, Buck T M and Malic R A 1987Phys. Rev.B
4 2341[27] Lipowsky R 1982Phys. Rev. Lett.49 1575[28] Lipowsky R and Speth WPhys. Rev.B 28 3983[29] Legrand B and Treglia G 1990Phys. Rev.B 41 4422[30] Lipowsky R 1983Z. Phys.B 51 165[31] Buck T M 1987 The Structure of Surfaces II (Springer
Ser. Surf. Sci. 11)(Berlin: Springer) p 435[32] Sanchez J M and Morian-Lopez J L 1985Surf. Sci.157
L297[33] Teraoka Y 1991Surf. Sci.256 L579[34] Reichert H, Eng P J, Dosch H and Robinson I K 1995
Phys. Rev. Lett.74 2006[35] Mecke K R and Dietrich S 1995Phys. Rev.B 52 2107[36] Jordan R G, Sohal G S, Gyorffy B L, Durham P J,
Temmerman W M and Weinberger P 1985J. Phys. F:Met. Phys.15 L135
[37] Jordan R G 1988Vacuum38 267[38] Jordan R G and Sohal G S 1982J. Phys. C: Solid State
Phys.15 L663[39] Wertheim G K 1987Phys. Rev.B 36 4432[40] Schneider U, Castro G R and Wandelt K 1993Surf. Sci.
287/288146[41] Castro G R, Schneider U, Busse H, Janssens T and
Wandelt K 1992Surf. Sci.269/270321[42] Schneider U, Castro G R, Busse H, Janssens T,
Wesemann J and Wandelt K 1992Surf. Sci.269/270316
[43] Shen Y G, O’Connor D J, McDonald R J and Wandelt K1995Solid State Commun.96 557
[44] Beccat P, Gauthier Y, Baudoing-Savois R andBertolini J C 1990Surf. Sci.238 105
[45] Baudoing-Savois R, Gauthier Y and Moritz W 1991Phys.Rev.B 44 12 977
[46] Hammar M, Gauthier V, Gothelid M, Karlsson U O,Flodstrom S A and Rosengren A 1993J. Phys.:Condens. Matter5 2837
[47] Moran-Lopez J L and Wise H 1980Appl. Surf. Sci.4 93[48] Allie G and Lauroz C 1982Surf. Sci.116 L179[49] Bevolo A I 1983 J. Vac. Sci. Technol.A 1 1004
[50] Asami K and Hashimoto K 1984Corros. Sci.24 83[51] Mrozek P, Menyhard M, Jablonski A and Tyuliev G 1988
Phys. Status Solidia 110 495[52] Wandelt K and Ertl G 1976J. Phys. F: Met. Phys.6 1607[53] Vasiliev M A and Gorodetsky S D 1986Surf. Sci.171 543[54] Sanchez J M and Moran-Lopez J L 1985Phys. Rev.B 32
3534[55] Vasiliev M A and Gorodetsky S D 1987Vacuum37 723[56] Vasiliev M A and Gorodetsky S D 1996Surf. Rev. Lett.3
1779[57] Baird R J 1984Bull. Am. Phys. Soc.29 268[58] Feder R 1981J. Phys. C: Solid State Phys.14 2049[59] Alvarado S F, Campagna M and Hopster H 1982Phys.
Rev. Lett.48 51[60] Dresselhaus M S 1981Nature292 196[61] Thapliyal H V and Blakely J 1978J. Vac. Sci. Technol.15
600[62] Jach T and Hamilton J C 1982Phys. Rev.B 26 3766[63] Vasiliev M A and Gorodetsky S D 1987Phys. Status
Solidi a 102 K121[64] Mamaev Yu A, Petrov V N and Starovoitov S A 1987
Pis. Zh. Tekh. Fiz.13 1530 (in Russian)[65] Binder K, Stauffer D and Wildpaner V 1975Acta Metall.
23 1191[66] Schmid M, Hofer W, Varga P, Stoltze P, Jacobsen K W
and Norskov 1995Phys. Rev.B 51 10 937[67] Voges D, Taglauer E, Dosch H and Peisl J 1992Surf. Sci.
269/2701142[68] Lui C T, Cahn R W and Sauthoff G (eds) 1992Ordered
Intermetallic–Physical Metallurgy and MechanicalBehaviour (NATO ASI Series E: Applied Sciences 213)(Deventer: Kluwer)
[69] Sondericker D, Jona F, Moruzzi V L and Marcus P M1985Solid State Commun.53 175
[70] Sondericker D, Jona F and Marcus P M 1986Phys. Rev.B 33 900
[71] Sondericker D, Jona F and Marcus P M 1986Phys. Rev.B 34 6775
[72] Sondericker D, Jona F and Marcus P M 1986Phys. Rev.B 34 6770
[73] Mullins D R and Overbury S H 1988Surf. Sci.199 141[74] Davis H L and Noonan J R 1987The Structure of Surfaces
II (Springer Ser. Surf. Sci. 11)(Berlin: Springer) p 152[75] Miedema A R 1978Z. Metallk.69 455[76] Davis H L and Noonan J R 1985Phys. Rev. Lett.54 566[77] Yalisove S M and Graham W R 1987Surf. Sci.183 556[78] Wuttig M 1990J. Electron Spectrosc. and Relat. Phenom.
54/55383[79] Noonan J R and Davis H L 1987Phys. Rev. Lett.59 1714[80] Niehus H, Raunau W, Besocke K, Spitzl R and Comsa G
1990Surf. Sci.225 L8[81] Bardi U and Ross P N 1984Surf. Sci.146 L555[82] Paul J, Cameron S D, Dwyer D J and Hoffmann F M
1986Surf. Sci.177 121[83] Atrei A, Bardi U, Rovida G, Torrini M and Zanazzi E
1992Phys. Rev.B 46 1649[84] Chen W, Paul J, Barbieri A, Van Hove M A, Camerson S
and Dwyer D J 1993J. Phys.: Condens. Matter5 4585[85] van Santen R A and Sachtler W M H 1974J. Catal.33
202[86] Haner A N and Ross P N 1991Surf. Sci.249 15[87] Atrei A, Bardi U, Torrini M, Zanazzi E, Rovida G,
Kasamura H and Kudo M 1993J. Phys.: Condens.Matter 5 L207
[88] Bouwman R, Toneman L H and Holscher A A 1973 Surf.Sci. 35 8
[89] Fujinaga Y 1979Surf. Sci.86 581[90] Anderson G W, Pope T D, Jensen K O, Griffiths K,
Norton P R and Schultz P J 1993Phys. Rev.B 4815 283
[91] Pope T D, Griffiths K, Zhdanov V P and Norton P R1994Phys. Rev.B 50 18 553
3068
Surface effects
[92] van Langeveld A D, Hendrickx H A C M andNieuwenhuys B E 1983Thin Solid Films109 179
[93] Newton M A, Francis S M, Li Y, Law D and Bowker M1991Surf. Sci.259 45
[94] Newton M A, Francis S M and Bowker M 1991Surf. Sci.259 56
[95] Holmes D J, King D A and Barnes C J 1990Surf. Sci.227 179
[96] Lindroos M, Barnes C J, Bowker M and King D A 1991The Structure of Surfaces III (Springer Ser. Surf. Sci.24) ed S Y Tonget al (Berlin: Springer) p 287
[97] Rao R S, Bansil A, Asonen H and Pessa M 1984Phys.Rev.B 29 1713
[98] Gonis A 1986Phys. Rev.B 34 8313[99] Zhang X, Hwang M, Gonis A and Freeman A J 1986
[111] Lu Z W, Wei S-H and Zunger A 1992Phys. Rev.B 4510 314
[112] Johnson D D and Pinski F J 1993Phys. Rev.B 48 11 553[113] Barbier L, Salanon B and Loiseau A 1994Phys. Rev.B
50 4929[114] Bowker M, Newton M, Francis S M, Gleeson M and
Barnes C 1994Surf. Rev. Lett.1 569[115] Weightman P, Cole R J, Verdozzi C and Durham P J 1994
Phys. Rev. Lett.72 793[116] Clark J F, Pinski F J, Johnson D D, Sterne P A,
Staunton J B and Ginatempo B 1995Phys. Rev. Lett.74 3225
[117] Gonis A, Singh P P, Turchi P E A andZhang X-G 1995Phys. Rev.B 51 2122
[118] Loboda-Cackovic J 1995Vacuum46 89[119] Loboda-Cackovic J 1995Vacuum46 1449[120] Weightman P, Cole R J, Brooks N J and Thorntor J M C
1995Nucl. Instrum. Methods Phys. Res.B 97 472[121] Cole R J, Brooks N J, Weightman P, Francis S M and
Bowker M 1996Surf. Rev. Lett.3 1763[122] Gallis C, Legrand B, Treglia G, Salanon B, Hecquet P
and Saul A 1996Surf. Sci.352 588[123] Loboda-Cackovic J 1996Vacuum47 1405[124] Bardi U, Atrei A, Ross P N, Zanazzi E and Rovida G
1989Surf. Sci.211/212441[125] Bardi U, Beard B C and Ross P N 1988J. Vac. Sci.
Technol.A 6 665[126] Bugnard J M, Baudoing-Savois R, Gauthier Y and
Hill E K 1993 Surf. Sci.281 62[127] Gauthier Y, Hoffmann W and Wuttig M 1990Surf. Sci.
233 239[128] Gauthier Y, Baudoing R, Lundberg M and Rundgren J
1987Phys. Rev.B 35 7867[129] Gauthier Y, Baudoing R and Jupille J 1989Phys. Rev.B
40 1500[130] Gauthier Y, Joly Y, Baudoing R and Rundgren J 1985
Phys. Rev.B 31 6216[131] Baudoing R, Gauthier Y, Lundberg M and Rundgren J
1986J. Phys. C: Solid State Phys.19 2825[132] Gauthier Y and Baudoing R 1990Segregation and
Related Phenomenaed P Dowben and A Miller (BocaRaton, FL: Chemical Rubber Company) p 169
[133] De Temmerman L, Creemers C, Van Hove H, Neyens A,Bertolini J C and Massardier J 1986Surf. Sci.178 888
[134] van de Riet E, Deckers S, Habraken F H P M andNiehaus A 1991Surf. Sci.243 49
[135] Jugnet Y, Prakash N S, Grenet G and Duc T M 1987Surf. Sci.189/190649
[136] Schmid M, Stadler H and Varga P 1993Phys. Rev. Lett.70 1441
[137] Gauthier Y, Baudoing R, Joly Y, Rundgren R,Bertolini J C and Massardier J 1985Surf. Sci.162 342
[138] Bertolini J Cet al 1982Surf. Sci.119 95[139] Ferrante J 1971Scr. Metall.5 1129[140] Ferrante J 1971Acta Metall.19 743[141] Pessa M, Asonen H, Rao R S, Prasad R and Bansil A
1982Surf. Sci.117 371[142] Baird R J, Ogletree D F, Van Hove M A and
Somorjai G A 1986 Surf. Sci.165 345[143] Esposto F J, Zhang C-S and Norton P R 1993Surf. Sci.
290 93[144] Sukiennicki A 1973Phys. Lett.44A 169[145] Sukiennicki A and Puszkarski H 1969Acta Phys. Pol.36
581[146] Vasiliev M A, Gorodetsky S D and Blaschuk A G 1993
Kristallografiya 38 205 (in Russian)[147] Kumar V and Bennemann K H 1984Phys. Rev. Lett.53
278[148] Moran-Lopez J L and Bennemann K H 1977Phys. Rev.B
15 4769[149] Balseiro C A and Moran-Lopez J L 1980Phys. Rev.B 21
349[150] Mezey L Z, Nishikawa O and Giber J 1983Phys. Status
Solidi a 78 323[151] Kroll D M and Gompper G 1987Phys. Rev.B 36 7078[152] Teraoka Y 1987Solid State Commun.64 1333[153] Teraoka Y 1990Surf. Sci.233 97[154] Teraoka Y 1990Surf. Sci.232 193[155] Rivers S B, Unertl W N, Hung H H and Liang K S 1995
Phys. Rev.B 52 12 601[156] Hillert M and Rundgren J 1985Phys. Rev.B 32 640[157] Legrand B and Treglia G 1987The Structure of Surfaces
II (Springer Ser. Surf. Sci. 11)(Berlin: Springer) p 434[158] De Temmerman L, Creemers C, Van Hove H and
Neyens A 1987Surf. Sci.183 565[159] Lundberg M 1987Phys. Rev.B 36 4692[160] Eymery J and Joud J C 1990Surf. Sci.231 419[161] Mezey L Z and Hofer W 1992Surf. Sci.269/2701135[162] Stadler H, Hofer W, Schmid M and Varga P 1993Surf.
Sci. 287/288366[163] Stadler H, Hofer W, Schmid M and Varga P 1993Phys.
Rev.B 48 11 352[164] Abraham F F, Tsai N-H and Pound G M 1979Surf. Sci.
83 406[165] Wynblatt P and Ku R C 1977Surf. Sci.65 511[166] Treglia G and Legrand B 1987Phys. Rev.B 35 4338[167] Walker R A and Darby J B 1970Acta Metall.18 1261[168] Spencer M S 1984Surf. Sci.145 145[169] Williams F L and Nason D 1974Surf. Sci.45 377[170] Teraoka Y 1990Surf. Sci.235 249[171] Huberman B A and Streifer W 1975Phys. Rev.B 12 2741[172] Tahir-Kheli R A and Kawasaki T 1977J. Phys. C: Solid
State Phys.10 2207[173] Binder K, Bowker M, Inglesfield J F and Rous P J 1995
3069
M A Vasiliev
Cohesion and Structurevol 4, ed F R deBoer andD G Pettifor (Amsterdam: North-Holland–Elsevier)
[174] Urias J and Moran-Lopez J L 1982Phys. Rev.B 26 2669[175] Mathon J 1988Rep. Prog. Phys.51 1[176] Gradmann U 1991J. Magn. Magn. Mater.100 481[177] Gradmann U 1993Handbook of Magnetic Materialsvol 7,
ed K H Buschow (Amsterdam: Elsevier) pp 1–96[178] Sukiennicki and Wojtczak L 1973Phys. Rev.B 7 2205[179] Binder K and Hohenberg P C 1974Phys. Rev.B 9 2194[180] Binder K, Landau D P and Kroll D M 1986 Phys. Rev.
Lett. 56 2272[181] Binder K and Hohenberg P C 1972Phys. Rev.B 6 3461[182] Chame A and Tsallis C 1989J. Phys.: Condens. Matter1
10 129[183] Auilera-Ganja F and Moran-Lopez J L 1985Phys. Rev.B
31 7146[184] Landau D P and Binder K 1990Phys. Rev.B 41 4633[185] Moran-Lopez J L and Falicov L M 1979 Phys. Rev.B 20
3900
[186] Moran-Lopez J L and Falicov L M 1980 J. Magn. Magn.Mater. 15–181077
[187] Urias J and Moran-Lopez J L 1991Phys. Rev.B 23 2759[188] Moran-Lopez J L and Falicov L M 1979 Phys. Rev.B 19
1470[189] Kaneyoshi T, Tamura I and Sarmento E F 1983Phys.
Rev.B 28 6491[190] Moran-Lopez J L and Falicov L M 1978 Phys. Rev.B 18
2542[191] Gradmann U, Waller G, Feder R and Tamura E 1983
J. Magn. Magn. Mater.31–34883[192] Victora R H 1986Magnetic Properties of
Low-Dimensional Systemsed L M Falicov andJ L Moran-Lopez (Berlin: Springer) p 25
[193] Mailander L, Dosch H and Peisl J 1990Phys. Rev. Lett.64 2527
[194] Yurasova V 1983Vacuum33 565[195] Kuvakin M, Yurasova V and Motaweh H 1994Vacuum