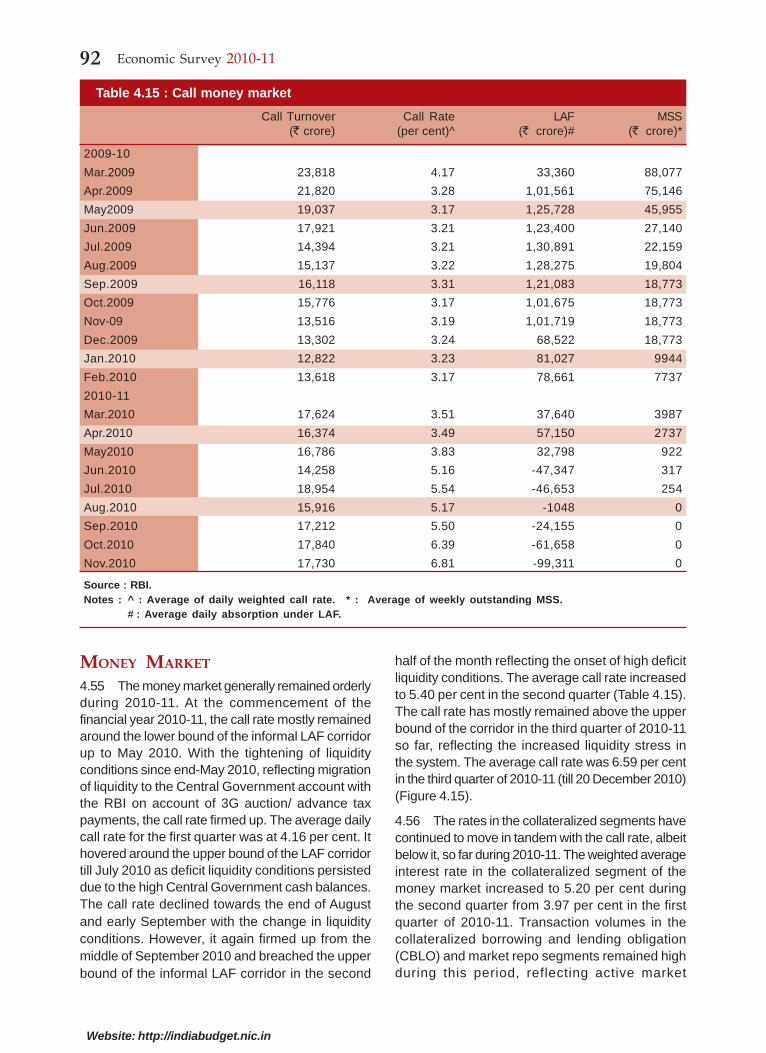
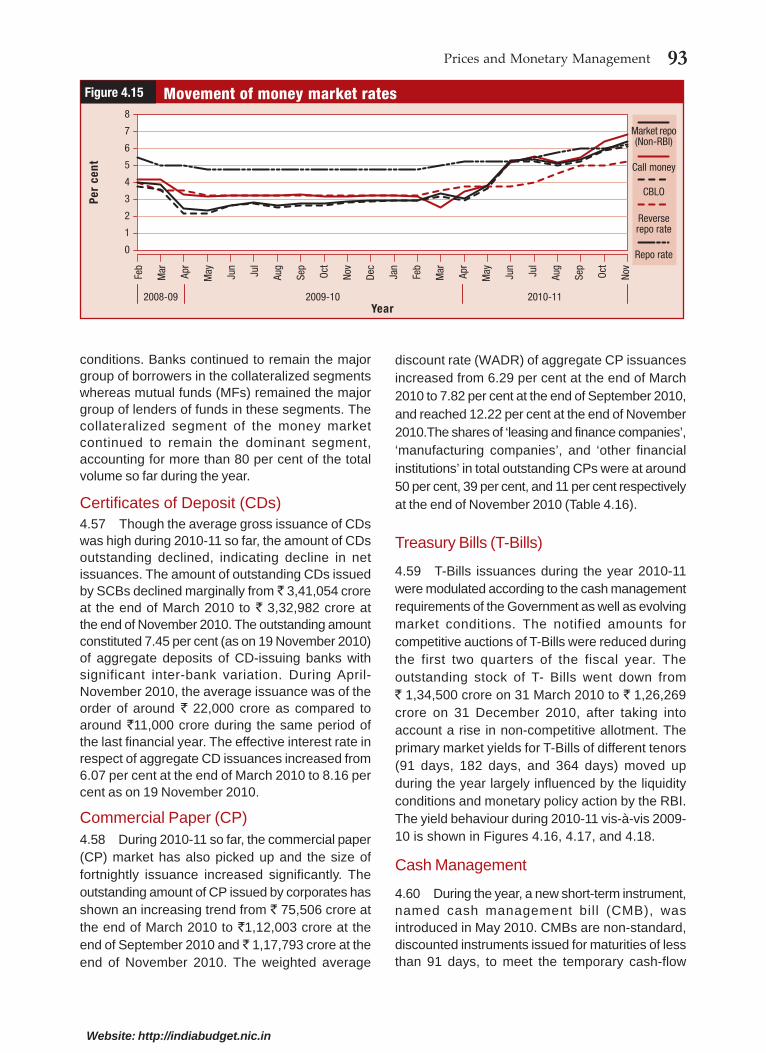
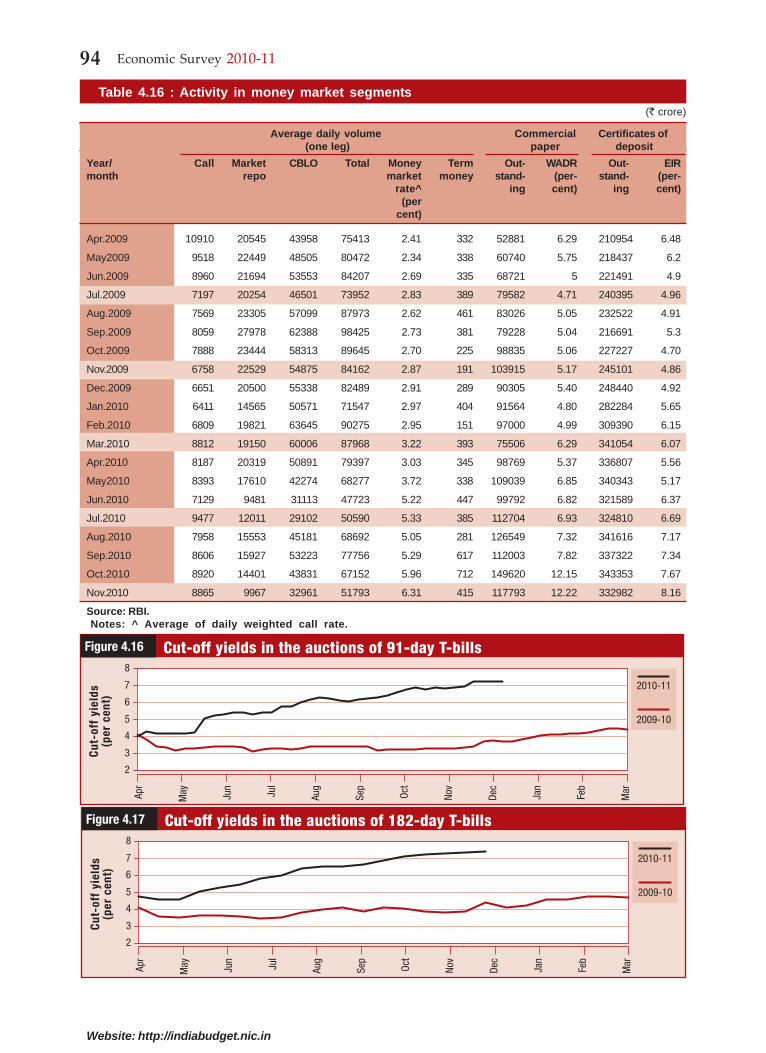
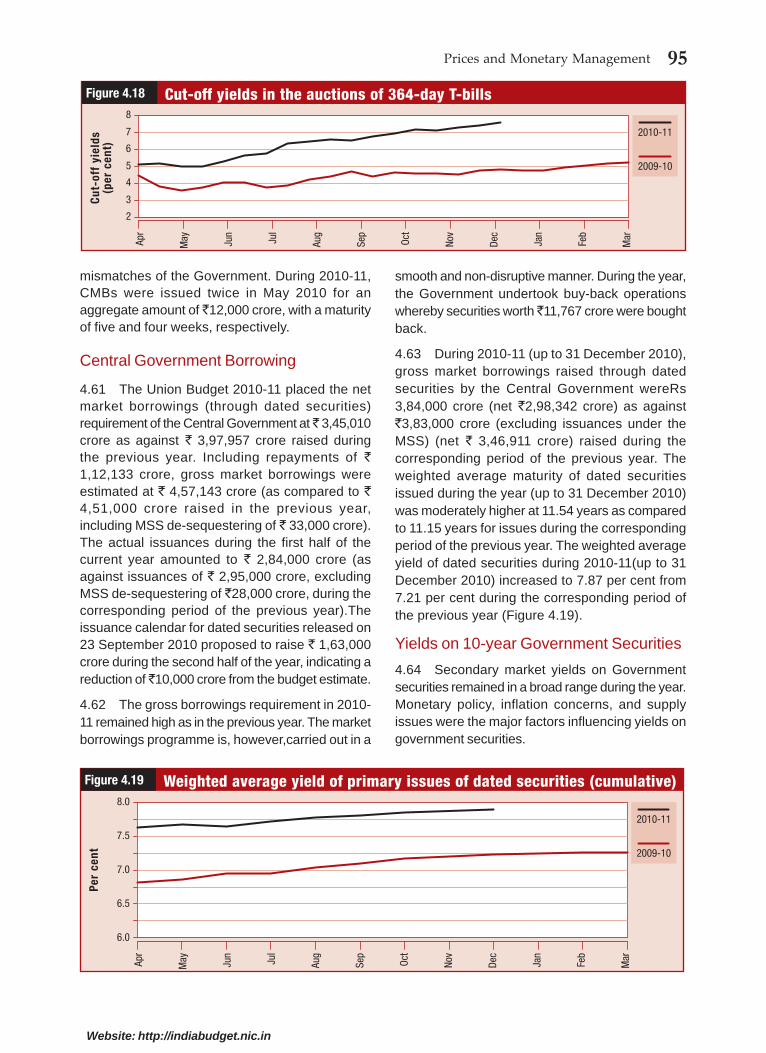
CHAPTER 1 1.2 It is important to note here that during the immediate past three years, the Indian economy has been severely buffeted by, but has successfully withstood, two shocks in rapid succession: (a) a collapse in world growth, finances, and trade with the onset of the global financial crisis in 2007-09 whose ripple effects continued into 2009-10 and persisted into 2010-11 (with fiscal stresses in Europe); and (b) domestically, following a year of negative growth in agriculture and allied sectors in 2008-09, erratic monsoons resulted in a severe drought in 2009-10 and unseasonal late rains affecting the winter season crops in 2010-11. 1.3 This period of economic stress has severely tested citizens and policymakers alike. Yet the Indian economy is coming through with resilience and strength. While some clouds linger—such as The Indian economy has emerged with remarkable rapidity from the slowdown caused by the global financial crisis of 2007-09. With growth in 2009-10 now estimated at 8.0 per cent by the Quick Estimates released on 31 January 2011 and 8.6 per cent in 2010-11 as per the Advance Estimates of the Central Statistics Office (CSO) released on 7 February 2011, the turnaround has been fast and strong. Growth is strong in 2010-11(as per the Advance Estimates) with a rebound in agriculture and continued momentum in manufacturing, though there was a deceleration in services caused mainly by the deceleration in community, social, and personal services, reflecting the base effect of fiscal stimulus in the previous two years. That there has been a deceleration in industry and manufacturing, in particular, as indicated by index of industrial production (IIP) data pertaining to November 2010 is a matter of some concern. However, buoyancy in other indicators of industrial performance and the short-run nature of the IIP slowdown suggest that the deceleration is more in the nature of road bumps than indication of any long-run problem. The medium- to long-run prospect of the economy, including the industrial sector, continues to be positive. On the demand side, a rise in savings and investment and pickup in private consumption have resulted in strong growth of the gross domestic product (GDP) at constant market prices at 9.7 per cent in 2010-11. A sequenced and gradual withdrawal of the monetary accommodation is helping contain inflationary pressures. Inflation which remained at elevated levels for a large part of the current fiscal was largely driven by food items, though the goods that were inflating at the start of the fiscal year were different from the goods for which prices are rising now. Notwithstanding the tightening money markets and moderate growth in deposits, the financial situation remained orderly with a pickup in credit growth, vibrant equity market and stable foreign exchange market. A moderation in the current account of balance-of-payments position is likely with deceleration in imports and acceleration in exports as per latest monthly merchandise trade data. Though downside risks of global events, particularly movement in prices of commodities like crude oil (exacerbated by political turmoil in the Middle East), remain, the Indian economy is poised to further improve and consolidate in terms of key macroeconomic indicators. State of the Economy and Prospects Website: http://indiabudget.nic.in
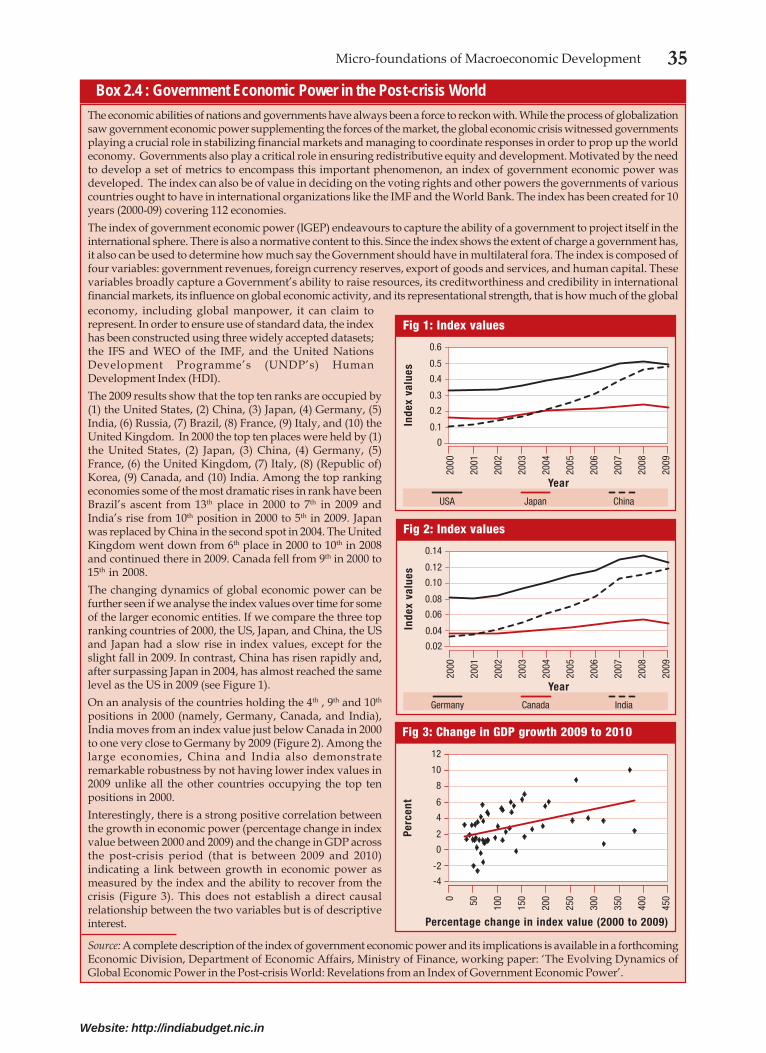
Transcript
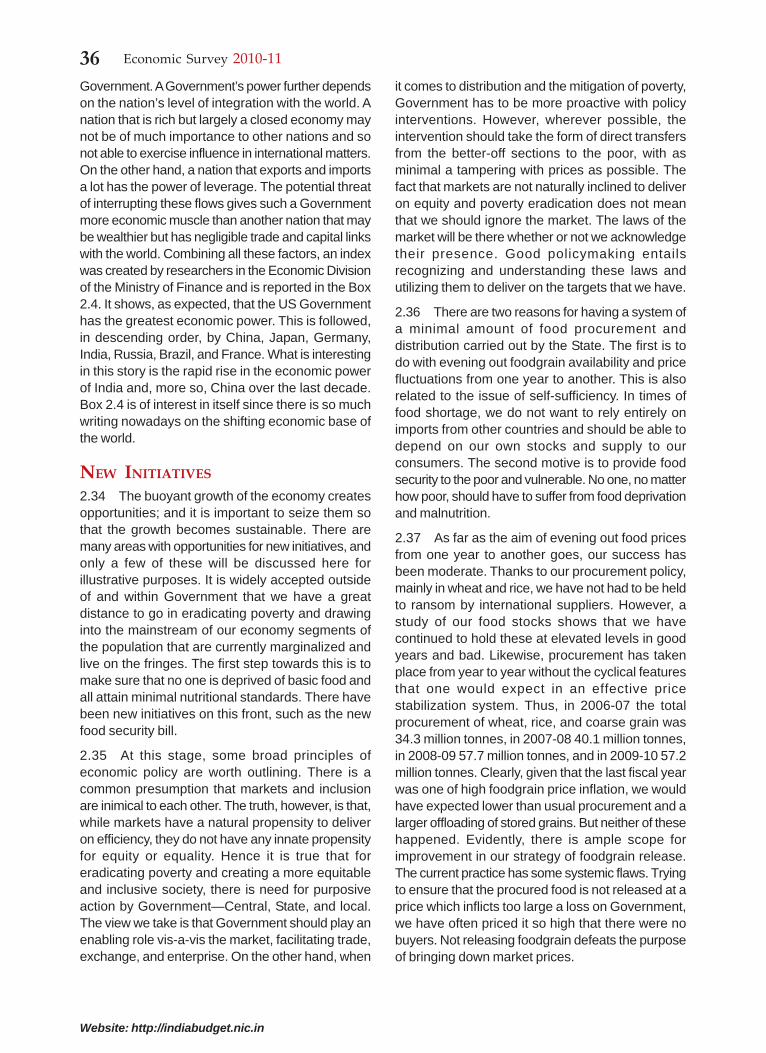
CHAPTER
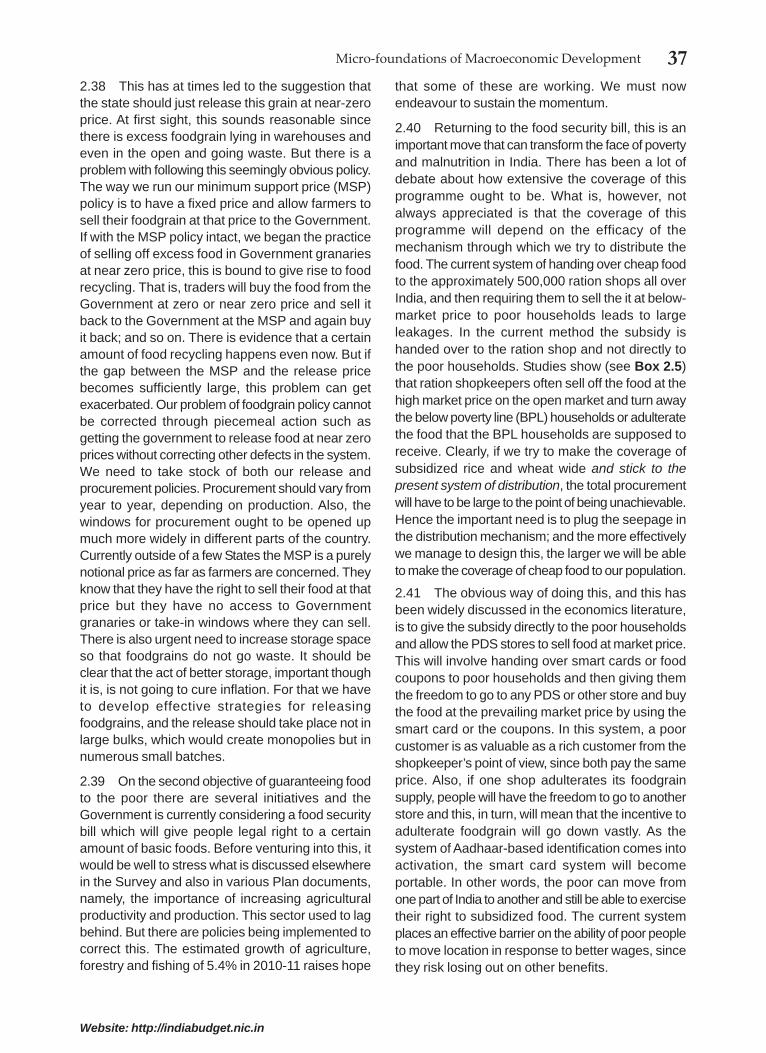
1
1.2 It is important to note here that during theimmediate past three years, the Indian economyhas been severely buffeted by, but has successfullywithstood, two shocks in rapid succession: (a) acollapse in world growth, finances, and trade withthe onset of the global financial crisis in 2007-09whose ripple effects continued into 2009-10 andpersisted into 2010-11 (with fiscal stresses inEurope); and (b) domestically, following a year of
negative growth in agriculture and allied sectors in2008-09, erratic monsoons resulted in a severedrought in 2009-10 and unseasonal late rainsaffecting the winter season crops in 2010-11.
1.3 This period of economic stress has severelytested citizens and policymakers alike. Yet theIndian economy is coming through with resilienceand strength. While some clouds linger—such as
The Indian economy has emerged with remarkable rapidity from the slowdowncaused by the global financial crisis of 2007-09. With growth in 2009-10 nowestimated at 8.0 per cent by the Quick Estimates released on 31 January 2011 and8.6 per cent in 2010-11 as per the Advance Estimates of the Central Statistics Office(CSO) released on 7 February 2011, the turnaround has been fast and strong. Growthis strong in 2010-11(as per the Advance Estimates) with a rebound in agricultureand continued momentum in manufacturing, though there was a deceleration inservices caused mainly by the deceleration in community, social, and personal services,reflecting the base effect of fiscal stimulus in the previous two years. That there hasbeen a deceleration in industry and manufacturing, in particular, as indicated byindex of industrial production (IIP) data pertaining to November 2010 is a matterof some concern. However, buoyancy in other indicators of industrial performanceand the short-run nature of the IIP slowdown suggest that the deceleration is morein the nature of road bumps than indication of any long-run problem. The medium-to long-run prospect of the economy, including the industrial sector, continues to bepositive. On the demand side, a rise in savings and investment and pickup in privateconsumption have resulted in strong growth of the gross domestic product (GDP) atconstant market prices at 9.7 per cent in 2010-11. A sequenced and gradualwithdrawal of the monetary accommodation is helping contain inflationary pressures.Inflation which remained at elevated levels for a large part of the current fiscal waslargely driven by food items, though the goods that were inflating at the start of thefiscal year were different from the goods for which prices are rising now.Notwithstanding the tightening money markets and moderate growth in deposits,the financial situation remained orderly with a pickup in credit growth, vibrantequity market and stable foreign exchange market. A moderation in the currentaccount of balance-of-payments position is likely with deceleration in imports andacceleration in exports as per latest monthly merchandise trade data. Thoughdownside risks of global events, particularly movement in prices of commodities likecrude oil (exacerbated by political turmoil in the Middle East), remain, the Indianeconomy is poised to further improve and consolidate in terms of key macroeconomicindicators.
State of the Economyand Prospects
Website: http://indiabudget.nic.in
2 Economic Survey 2010-11
Website: http://indiabudget.nic.in
0.1 KEY INDICATORS
Data categories and components Units 2005-06 2006-07 2007-08 2008-09 2009-10 2010-11
AE GDP figures for 2010-11 are advance estimates; PE Provisional Estimates. QE quick estimates.
na not yet available / released for 2009-10.
a Final estimates.
b Second advance estimates.
c The annual growth rates have been recompiled from 2005-06 onwards since the indices have been recompiled from April 04 onwards using newseried of WPI for the IIP items reported in value terms.
d Average Apr.-Dec. 2010.
e Apr.-Dec. 2010.
f as of December 31, 2010.
g Average exchange rate for 2010-11 (Apr.-Dec. 2010).
h Provisional.
i fiscal indicators for 2009-10 are based on the provisional actuals for 2009-10.
3State of the Economy and Prospects
Website: http://indiabudget.nic.in
continued high food inflation and a temporaryslowdown in industrial growth the dynamism in overallgrowth is evident, even as a series of social protectionmeasures have considerably strengthened the abilityto withstand shocks. These results owe to thecounter-cyclical macroeconomic policies, structuralmeasures to promote growth, social spending toprovide a stronger foundation to protect the poor and,as always with economic progress, some luck inthe form of good weather and slow but steady recoveryof the global economy. In each of these areas,enormous progress was made during this crisis, andvaluable lessons learnt for the future.
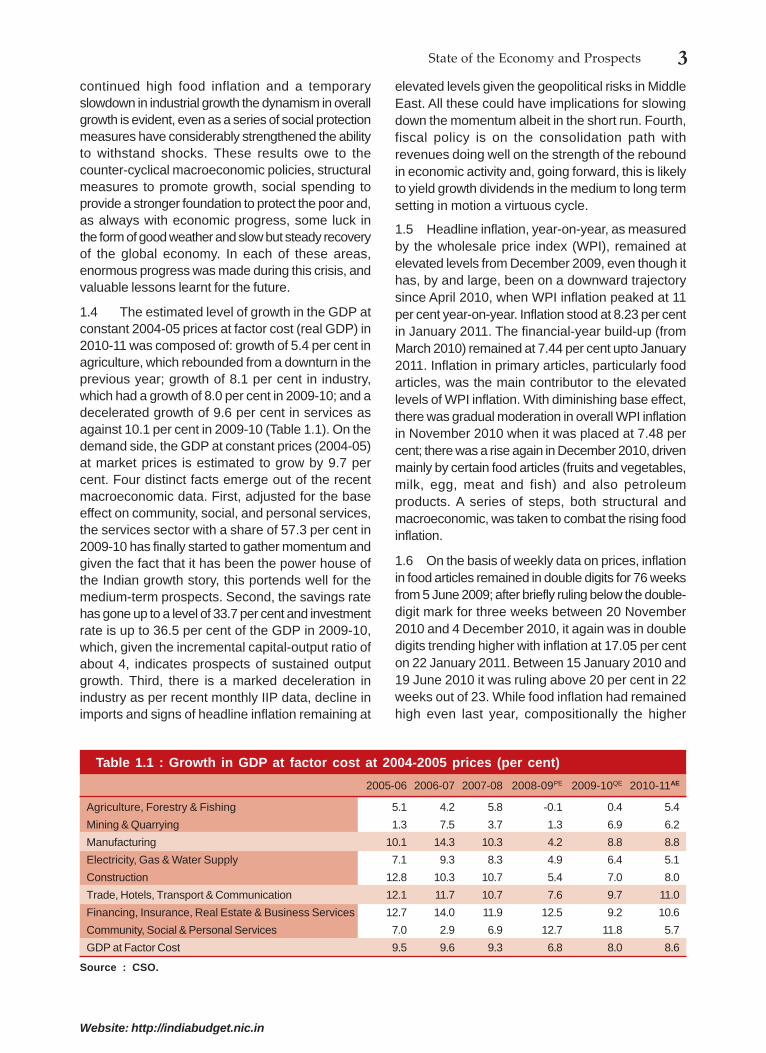
1.4 The estimated level of growth in the GDP atconstant 2004-05 prices at factor cost (real GDP) in2010-11 was composed of: growth of 5.4 per cent inagriculture, which rebounded from a downturn in theprevious year; growth of 8.1 per cent in industry,which had a growth of 8.0 per cent in 2009-10; and adecelerated growth of 9.6 per cent in services asagainst 10.1 per cent in 2009-10 (Table 1.1). On thedemand side, the GDP at constant prices (2004-05)at market prices is estimated to grow by 9.7 percent. Four distinct facts emerge out of the recentmacroeconomic data. First, adjusted for the baseeffect on community, social, and personal services,the services sector with a share of 57.3 per cent in2009-10 has finally started to gather momentum andgiven the fact that it has been the power house ofthe Indian growth story, this portends well for themedium-term prospects. Second, the savings ratehas gone up to a level of 33.7 per cent and investmentrate is up to 36.5 per cent of the GDP in 2009-10,which, given the incremental capital-output ratio ofabout 4, indicates prospects of sustained outputgrowth. Third, there is a marked deceleration inindustry as per recent monthly IIP data, decline inimports and signs of headline inflation remaining at
elevated levels given the geopolitical risks in MiddleEast. All these could have implications for slowingdown the momentum albeit in the short run. Fourth,fiscal policy is on the consolidation path withrevenues doing well on the strength of the reboundin economic activity and, going forward, this is likelyto yield growth dividends in the medium to long termsetting in motion a virtuous cycle.
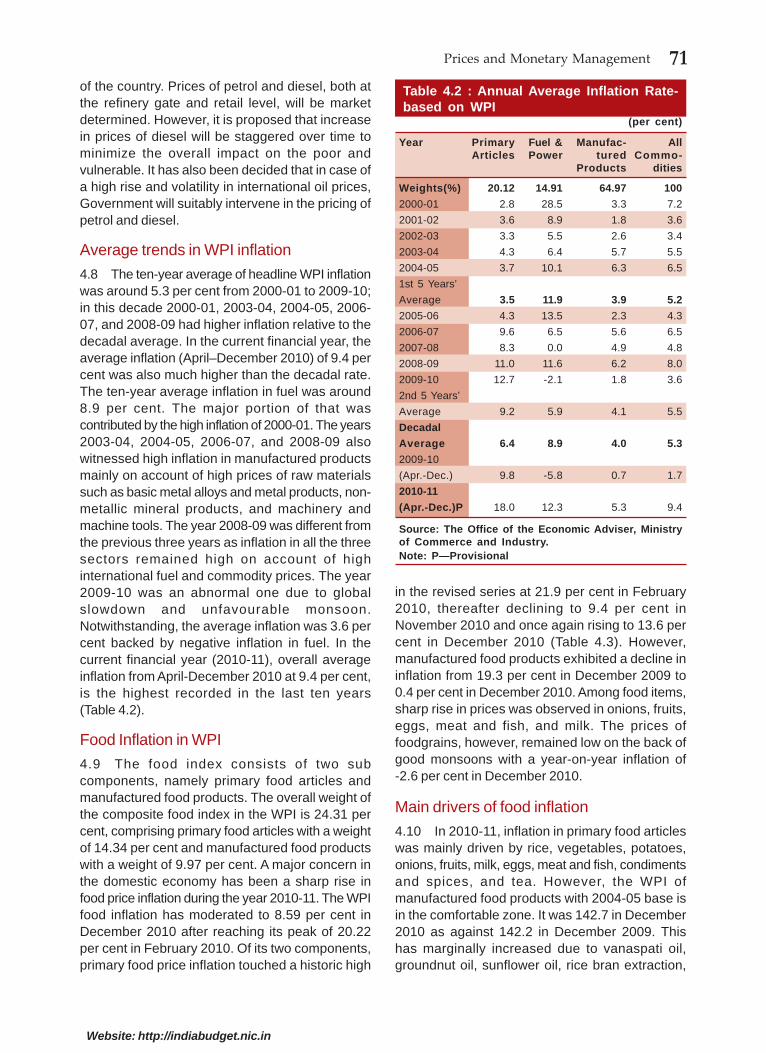
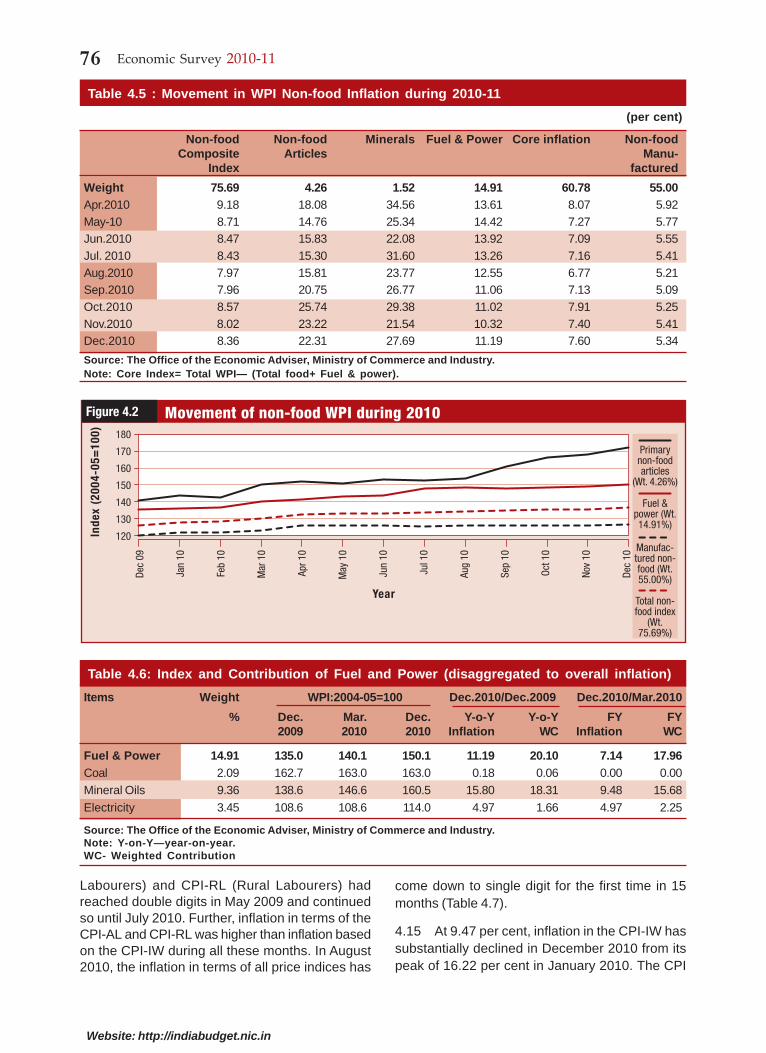
1.5 Headline inflation, year-on-year, as measuredby the wholesale price index (WPI), remained atelevated levels from December 2009, even though ithas, by and large, been on a downward trajectorysince April 2010, when WPI inflation peaked at 11per cent year-on-year. Inflation stood at 8.23 per centin January 2011. The financial-year build-up (fromMarch 2010) remained at 7.44 per cent upto January2011. Inflation in primary articles, particularly foodarticles, was the main contributor to the elevatedlevels of WPI inflation. With diminishing base effect,there was gradual moderation in overall WPI inflationin November 2010 when it was placed at 7.48 percent; there was a rise again in December 2010, drivenmainly by certain food articles (fruits and vegetables,milk, egg, meat and fish) and also petroleumproducts. A series of steps, both structural andmacroeconomic, was taken to combat the rising foodinflation.
1.6 On the basis of weekly data on prices, inflationin food articles remained in double digits for 76 weeksfrom 5 June 2009; after briefly ruling below the double-digit mark for three weeks between 20 November2010 and 4 December 2010, it again was in doubledigits trending higher with inflation at 17.05 per centon 22 January 2011. Between 15 January 2010 and19 June 2010 it was ruling above 20 per cent in 22weeks out of 23. While food inflation had remainedhigh even last year, compositionally the higher
Table 1.1 : Growth in GDP at factor cost at 2004-2005 prices (per cent)
Electricity, Gas & Water Supply 7.1 9.3 8.3 4.9 6.4 5.1
Construction 12.8 10.3 10.7 5.4 7.0 8.0
Trade, Hotels, Transport & Communication 12.1 11.7 10.7 7.6 9.7 11.0
Financing, Insurance, Real Estate & Business Services 12.7 14.0 11.9 12.5 9.2 10.6
Community, Social & Personal Services 7.0 2.9 6.9 12.7 11.8 5.7
GDP at Factor Cost 9.5 9.6 9.3 6.8 8.0 8.6
Source : CSO.
4 Economic Survey 2010-11
Website: http://indiabudget.nic.in
inflation this year is different; last year the maindrivers were pulses, cereals, and sugar which couldbe attributed to monsoon deficiency, whereas thisyear inflation seems to be driven by demand factorsdespite higher supply levels. Inflation as measuredby consumer price indices, wherein greater weightsare assigned to food items, rose sharply to reachpeak levels in January 2010; thereafter it hasmoderated broadly in tandem with movements inWPI inflation.
1.7 The inflationary pressures on the domestic frontare likely to be exacerbated by the higher levels ofglobal commodity prices and also the easy moneypolicy being followed in several industrial nationstrying to jump-start their own economies. TheInternational Monetary Fund (IMF) forecast (as perthe January 2011 World Economic Outlook [WEO]update) indicates the likely continuance of highconsumer price inflation for emerging and developingeconomies in 2011 due to continued robust demandand a sluggish supply response to tightening marketconditions. The IMF has also upped its baselineprojection for petroleum prices from US $ 79/bbl inWEO October 2010 to US $ 90/bbl in the Januaryupdate of the WEO. Non-oil commodity prices areforecast to increase by 11 per cent in 2011. Theupdate also indicated that near-term risks were nowon the upside for most commodity classes and forsome emerging economies that had grown rapidlythere was danger of overheating on account of closingof output gaps.
1.8 The IMF has revised upwards the global growthprojections, which are placed now at 4.4 per cent in2011. The Indian economy is estimated to grow by8.4 per cent in 2011 following a growth of 9.7 percent in 2010 (in terms of GDP at constant marketprices). Under the baseline scenario in whichcontagion from the financial turmoil in the euro areais contained, emerging market capital inflows areexpected to remain strong and financial conditionsrobust. Key risks to emerging markets as per theupdate relate to overheating, a rapid rise of inflationarypressures, and the possibility of a hard landing.
REVIEW OF ECONOMICDEVELOPMENTS
Growth broad based, recovery on firmerfooting
1.9 In its Quick Estimates released on 31 January2011, the CSO revised growth in real GDP for 2009-10 from a level of 7.4 per cent to 8.0 per cent {these
revisions take into account the new series of WPIwith base 2004-05 and also subsequent revision inIndex of industrial production (IIP)}. Growth in realGDP for 2008-09 also stands revised to 6.8 per cent(up by 0.1 percentage point). Compositionally, thereare significant changes in the GDP as per the QuickEstimates with growth in agriculture at 0.4 per cent(0.2 per cent as per the Revised Estimates); growthin industry of 8.0 per cent as against 9.3 per cent inthe Revised Estimates and a sharper rise in growthin services at 10.1 per cent as against the 8.5 percent indicated in the Revised Estimates. Growth inGDP at factor cost current prices was placed at 16.1per cent in the Quick Estimates as against a level of12.2 per cent suggested by the Revised Estimates.
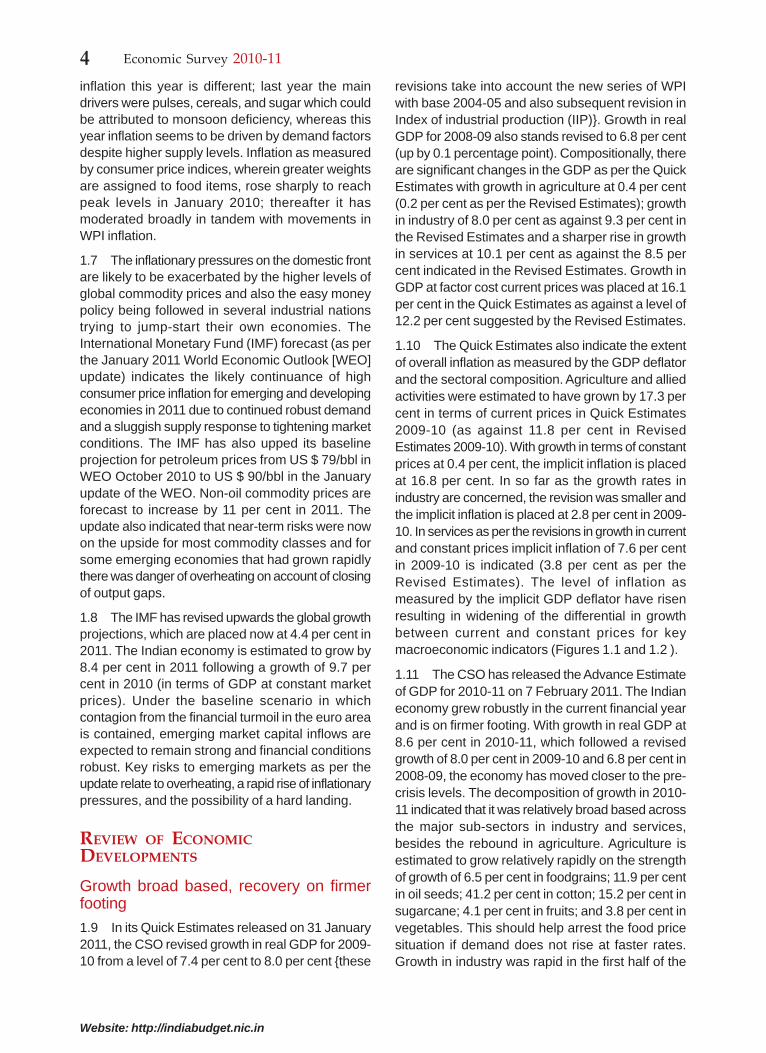
1.10 The Quick Estimates also indicate the extentof overall inflation as measured by the GDP deflatorand the sectoral composition. Agriculture and alliedactivities were estimated to have grown by 17.3 percent in terms of current prices in Quick Estimates2009-10 (as against 11.8 per cent in RevisedEstimates 2009-10). With growth in terms of constantprices at 0.4 per cent, the implicit inflation is placedat 16.8 per cent. In so far as the growth rates inindustry are concerned, the revision was smaller andthe implicit inflation is placed at 2.8 per cent in 2009-10. In services as per the revisions in growth in currentand constant prices implicit inflation of 7.6 per centin 2009-10 is indicated (3.8 per cent as per theRevised Estimates). The level of inflation asmeasured by the implicit GDP deflator have risenresulting in widening of the differential in growthbetween current and constant prices for keymacroeconomic indicators (Figures 1.1 and 1.2 ).
1.11 The CSO has released the Advance Estimateof GDP for 2010-11 on 7 February 2011. The Indianeconomy grew robustly in the current financial yearand is on firmer footing. With growth in real GDP at8.6 per cent in 2010-11, which followed a revisedgrowth of 8.0 per cent in 2009-10 and 6.8 per cent in2008-09, the economy has moved closer to the pre-crisis levels. The decomposition of growth in 2010-11 indicated that it was relatively broad based acrossthe major sub-sectors in industry and services,besides the rebound in agriculture. Agriculture isestimated to grow relatively rapidly on the strengthof growth of 6.5 per cent in foodgrains; 11.9 per centin oil seeds; 41.2 per cent in cotton; 15.2 per cent insugarcane; 4.1 per cent in fruits; and 3.8 per cent invegetables. This should help arrest the food pricesituation if demand does not rise at faster rates.Growth in industry was rapid in the first half of the
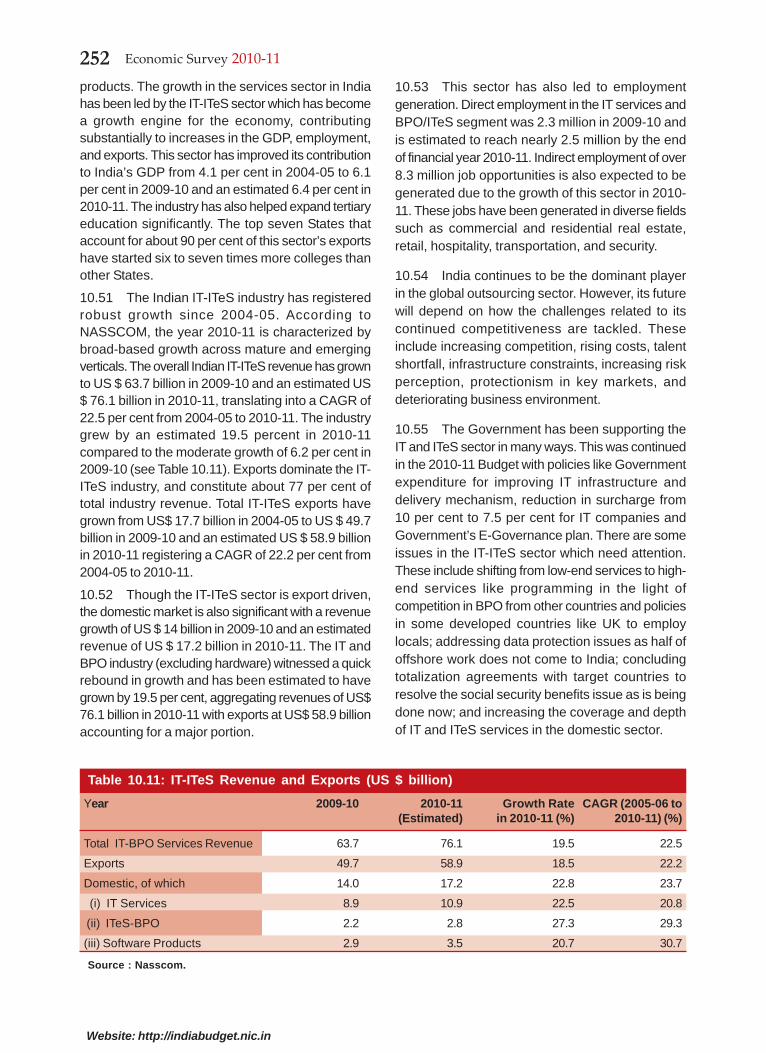
5State of the Economy and Prospects
Website: http://indiabudget.nic.in
current fiscal in terms of national accounts as wellas the IIP. Robust performance in terms of keyindicators in telecom services, civil aviation, andfinancial services and the level of growth in servicesexcluding community, social, and personal servicesin the current fiscal indicates brighter prospects fornext year. With manufacturing estimated to remainat about the same levels as last year and a pickupin the construction sector estimated to offset thedeceleration in the other sub-sectors, growth inindustry is estimated to remain at more or less thesame levels of 8 per cent that obtained last year. Apart of the deceleration in year-on-year growth asper the monthly IIP data owes to the large baseeffect; but the quarter-on-quarter sequentialdeseasonalized index movements also reflect apositive but weak momentum, which needs closemonitoring.
Quarterly trend
1.12 The revisions to the annual GDP estimatesbetween the Quick Estimates released on 31January 2011 and the Revised Estimates for 2009-10 released in May 2010 indicate some likelyrevisions in the quarterly GDP estimates for thecurrent and previous years. These revisions toquarterly GDP are likely to be made available at alater date. The available data (reported also in theMid-year Analysis 2010) indicated a robust growthmomentum with growth in real GDP at 8.9 per centin each of the first two quarters as well as the firsthalf of the current fiscal. The growth in real GDP andits broad based nature indicated that economicrecovery that began in 2009-10 has gatheredmomentum and is at the robust level that obtainedprior to the global crisis. Growth in the GDP at
2
6
10
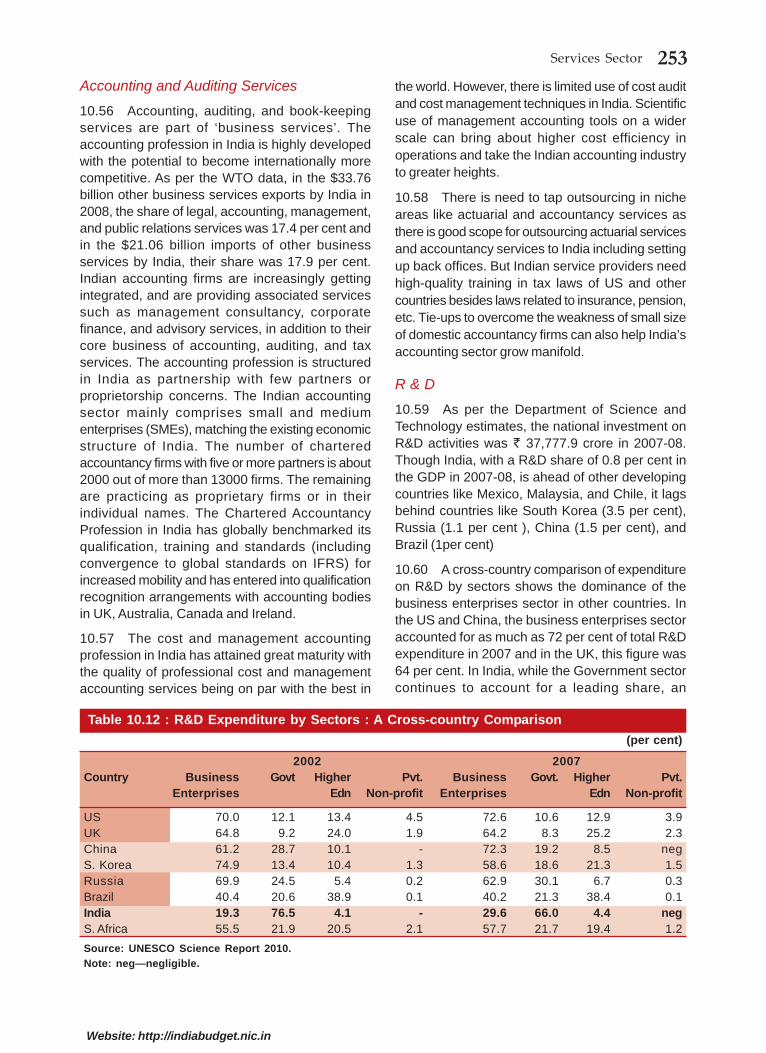
14
18
Growth inGDP at FCat constant
prices
Growth in GDP at FC at current and constant pricesand inflation based on deflator
Figure 1.1
4
8
12
16
Year
2005-06
20
Growth inGDP at FCat current
prices
Inflationbased on
GDPdeflator
2006-07 2007-08 2008-09 2009-10 20010-11
22
2
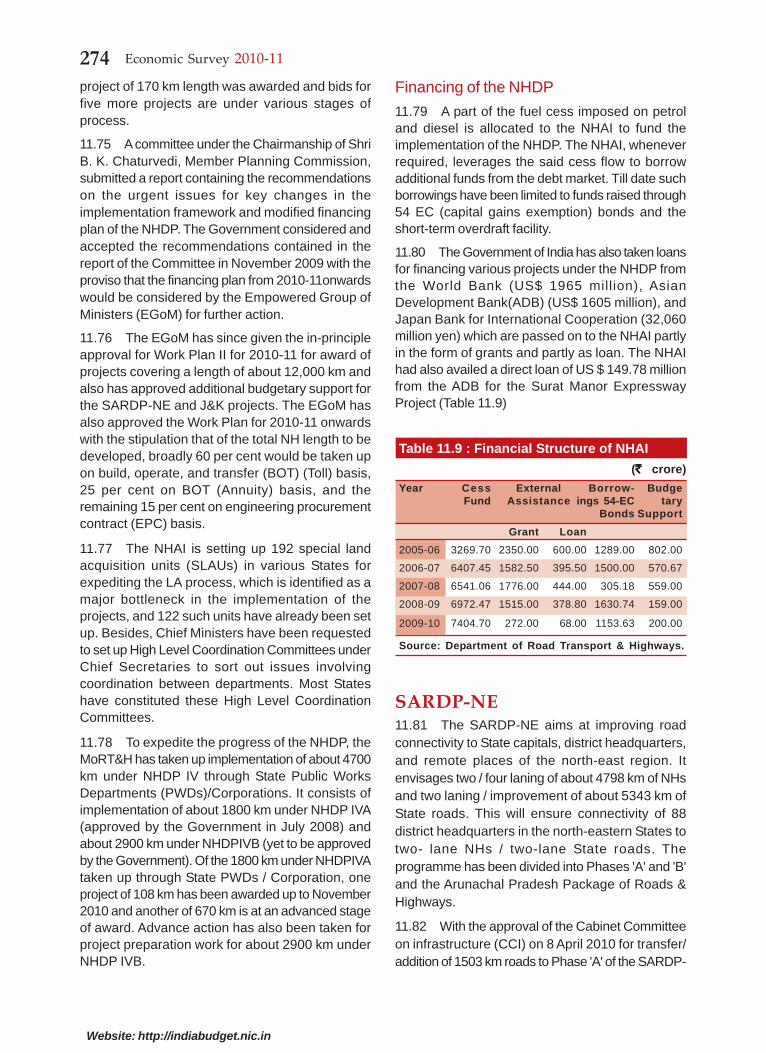
6
10
14
18
Growth inGDP at MPat constant
prices
Growth in GDP at MP at current and constant pricesand inflation based on deflator
Figure 1.2
4
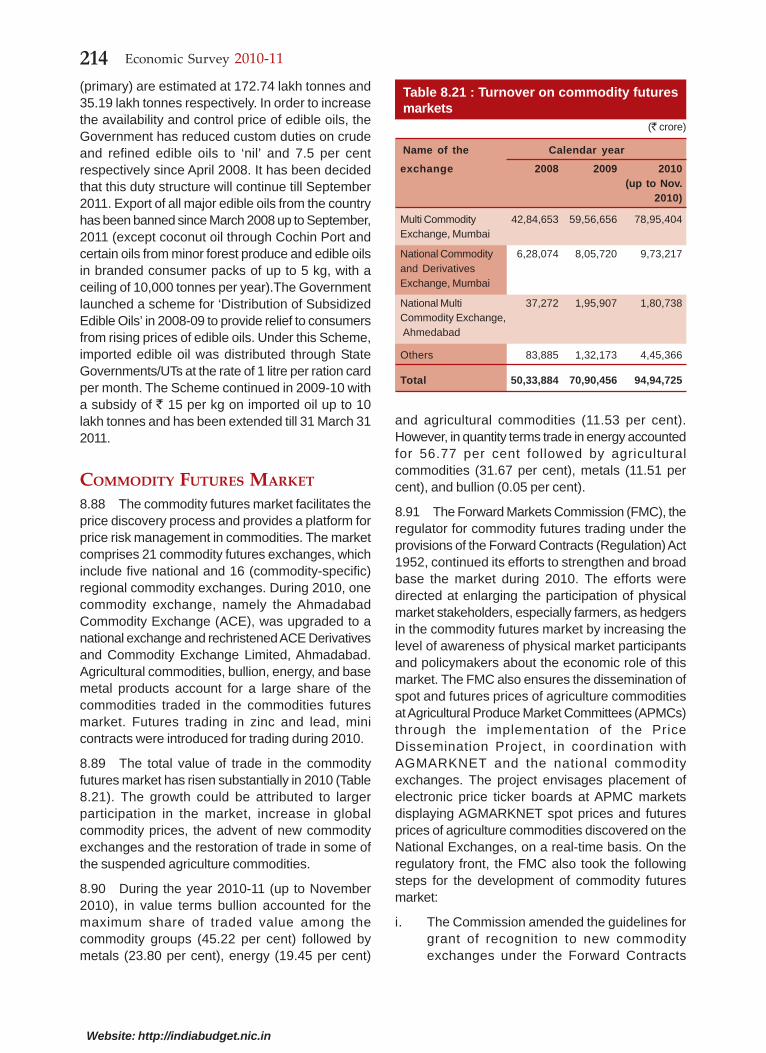
8
12
16
Year
2005-06
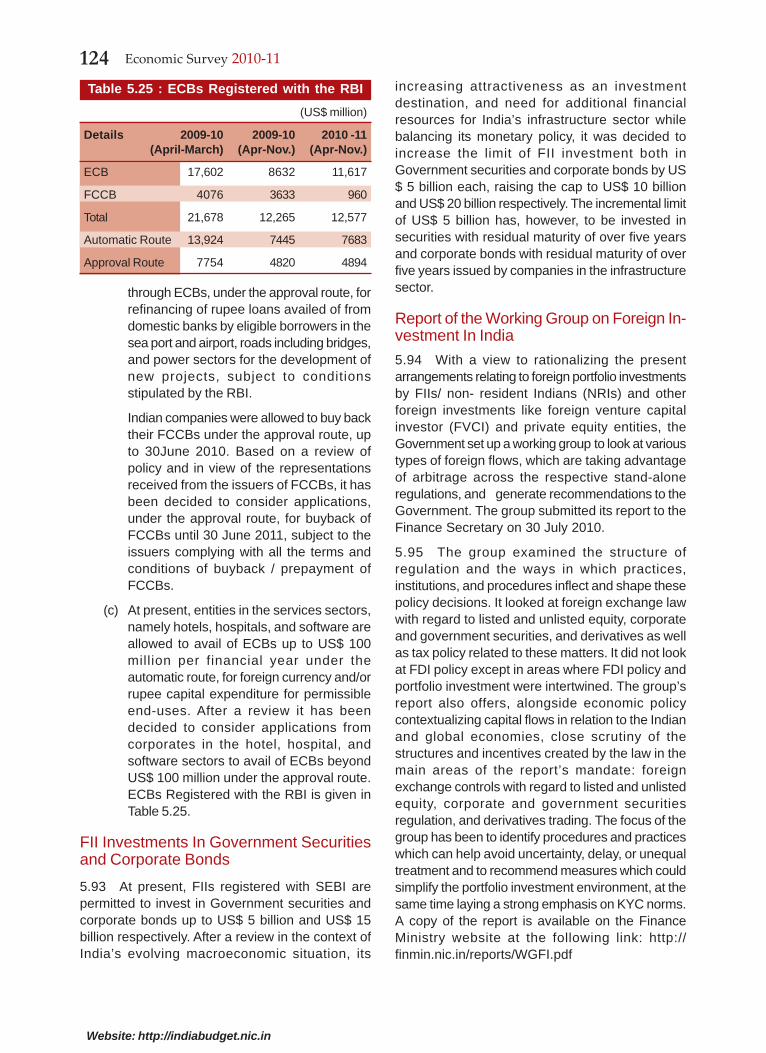
20
Growth inGDP at MPat current
prices
Inflationbased on
GDPdeflator
2006-07 2007-08 2008-09 2009-10 20010-11
22
6 Economic Survey 2010-11
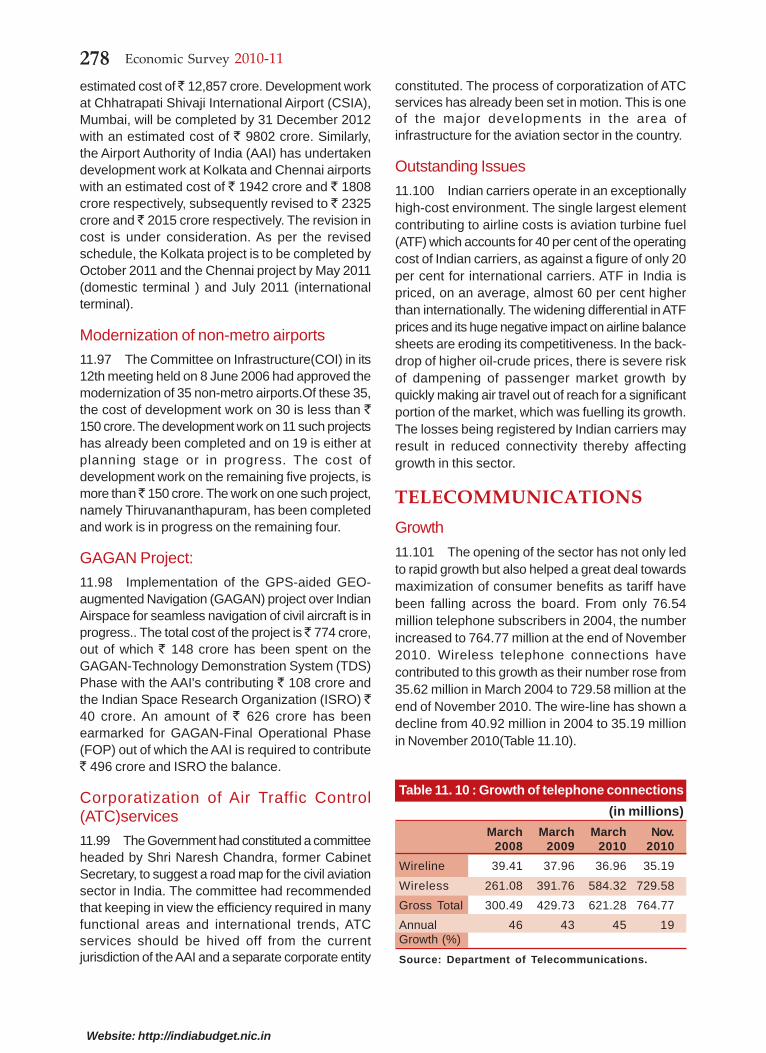
Website: http://indiabudget.nic.in
constant market prices is placed at 10.4 per cent inthe first half of the current fiscal. That fiscal stimuluspackages were central to the recovery as attestedby the demand-side aggregates, was reported indetail in the Mid-year Analysis 2010.
Aggregate demand and its composition
Pickup in private consumption and investmentdriving rebound in demand
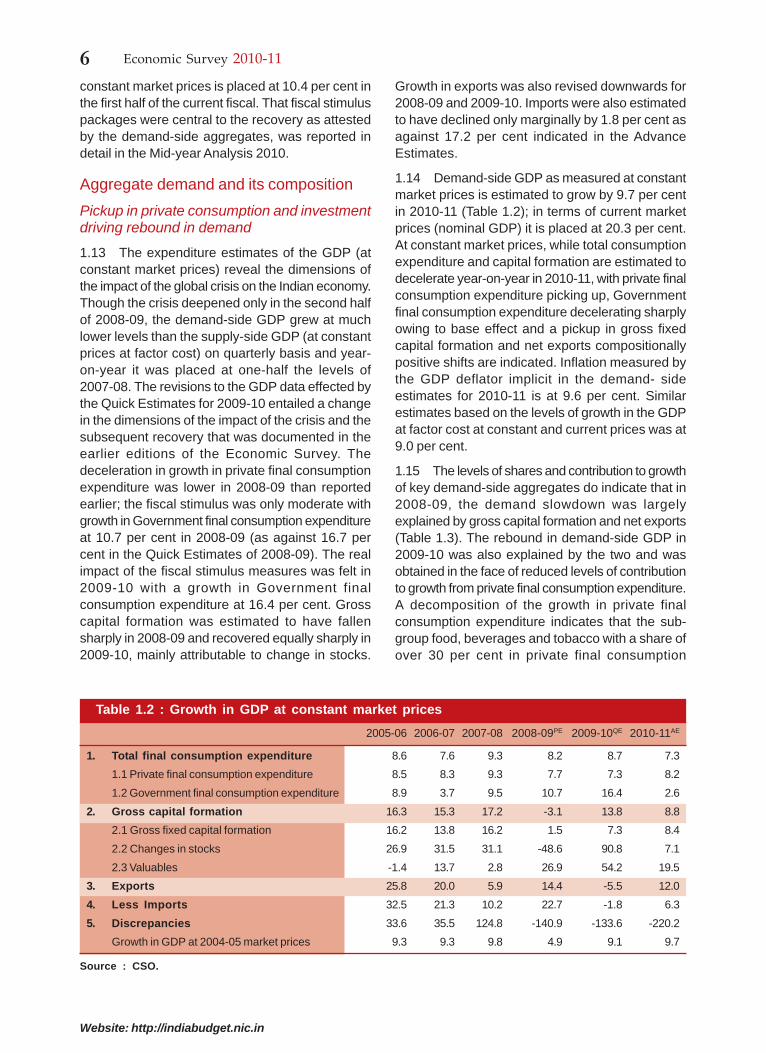
1.13 The expenditure estimates of the GDP (atconstant market prices) reveal the dimensions ofthe impact of the global crisis on the Indian economy.Though the crisis deepened only in the second halfof 2008-09, the demand-side GDP grew at muchlower levels than the supply-side GDP (at constantprices at factor cost) on quarterly basis and year-on-year it was placed at one-half the levels of2007-08. The revisions to the GDP data effected bythe Quick Estimates for 2009-10 entailed a changein the dimensions of the impact of the crisis and thesubsequent recovery that was documented in theearlier editions of the Economic Survey. Thedeceleration in growth in private final consumptionexpenditure was lower in 2008-09 than reportedearlier; the fiscal stimulus was only moderate withgrowth in Government final consumption expenditureat 10.7 per cent in 2008-09 (as against 16.7 percent in the Quick Estimates of 2008-09). The realimpact of the fiscal stimulus measures was felt in2009-10 with a growth in Government finalconsumption expenditure at 16.4 per cent. Grosscapital formation was estimated to have fallensharply in 2008-09 and recovered equally sharply in2009-10, mainly attributable to change in stocks.
Growth in exports was also revised downwards for2008-09 and 2009-10. Imports were also estimatedto have declined only marginally by 1.8 per cent asagainst 17.2 per cent indicated in the AdvanceEstimates.
1.14 Demand-side GDP as measured at constantmarket prices is estimated to grow by 9.7 per centin 2010-11 (Table 1.2); in terms of current marketprices (nominal GDP) it is placed at 20.3 per cent.At constant market prices, while total consumptionexpenditure and capital formation are estimated todecelerate year-on-year in 2010-11, with private finalconsumption expenditure picking up, Governmentfinal consumption expenditure decelerating sharplyowing to base effect and a pickup in gross fixedcapital formation and net exports compositionallypositive shifts are indicated. Inflation measured bythe GDP deflator implicit in the demand- sideestimates for 2010-11 is at 9.6 per cent. Similarestimates based on the levels of growth in the GDPat factor cost at constant and current prices was at9.0 per cent.
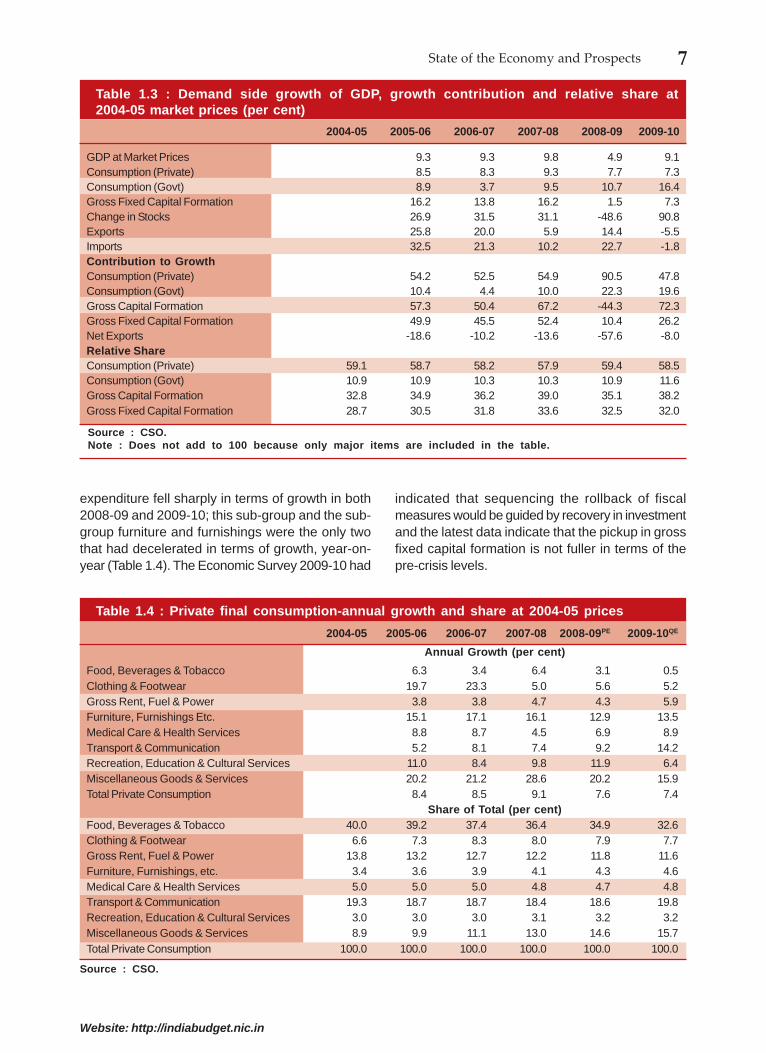
1.15 The levels of shares and contribution to growthof key demand-side aggregates do indicate that in2008-09, the demand slowdown was largelyexplained by gross capital formation and net exports(Table 1.3). The rebound in demand-side GDP in2009-10 was also explained by the two and wasobtained in the face of reduced levels of contributionto growth from private final consumption expenditure.A decomposition of the growth in private finalconsumption expenditure indicates that the sub-group food, beverages and tobacco with a share ofover 30 per cent in private final consumption
Table 1.2 : Growth in GDP at constant market prices
Growth in GDP at 2004-05 market prices 9.3 9.3 9.8 4.9 9.1 9.7
Source : CSO.
7State of the Economy and Prospects
Website: http://indiabudget.nic.in
expenditure fell sharply in terms of growth in both2008-09 and 2009-10; this sub-group and the sub-group furniture and furnishings were the only twothat had decelerated in terms of growth, year-on-year (Table 1.4). The Economic Survey 2009-10 had
indicated that sequencing the rollback of fiscalmeasures would be guided by recovery in investmentand the latest data indicate that the pickup in grossfixed capital formation is not fuller in terms of thepre-crisis levels.
Table 1.4 : Private final consumption-annual growth and share at 2004-05 prices
Source : CSO.Note : Does not add to 100 because only major items are included in the table.
8 Economic Survey 2010-11
Website: http://indiabudget.nic.in
Savings and investment
Movements in public-sector savings andcorporate investment explain the slowdown andsubsequent recovery
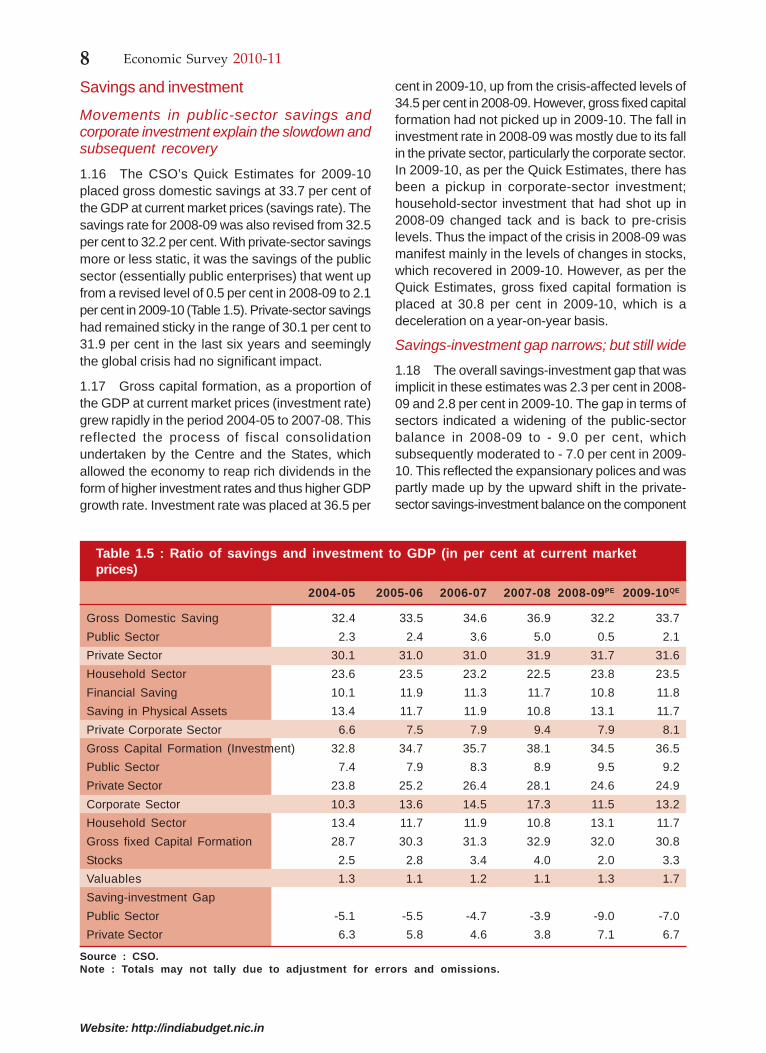
1.16 The CSO’s Quick Estimates for 2009-10placed gross domestic savings at 33.7 per cent ofthe GDP at current market prices (savings rate). Thesavings rate for 2008-09 was also revised from 32.5per cent to 32.2 per cent. With private-sector savingsmore or less static, it was the savings of the publicsector (essentially public enterprises) that went upfrom a revised level of 0.5 per cent in 2008-09 to 2.1per cent in 2009-10 (Table 1.5). Private-sector savingshad remained sticky in the range of 30.1 per cent to31.9 per cent in the last six years and seeminglythe global crisis had no significant impact.
1.17 Gross capital formation, as a proportion ofthe GDP at current market prices (investment rate)grew rapidly in the period 2004-05 to 2007-08. Thisreflected the process of fiscal consolidationundertaken by the Centre and the States, whichallowed the economy to reap rich dividends in theform of higher investment rates and thus higher GDPgrowth rate. Investment rate was placed at 36.5 per
cent in 2009-10, up from the crisis-affected levels of34.5 per cent in 2008-09. However, gross fixed capitalformation had not picked up in 2009-10. The fall ininvestment rate in 2008-09 was mostly due to its fallin the private sector, particularly the corporate sector.In 2009-10, as per the Quick Estimates, there hasbeen a pickup in corporate-sector investment;household-sector investment that had shot up in2008-09 changed tack and is back to pre-crisislevels. Thus the impact of the crisis in 2008-09 wasmanifest mainly in the levels of changes in stocks,which recovered in 2009-10. However, as per theQuick Estimates, gross fixed capital formation isplaced at 30.8 per cent in 2009-10, which is adeceleration on a year-on-year basis.
Savings-investment gap narrows; but still wide
1.18 The overall savings-investment gap that wasimplicit in these estimates was 2.3 per cent in 2008-09 and 2.8 per cent in 2009-10. The gap in terms ofsectors indicated a widening of the public-sectorbalance in 2008-09 to - 9.0 per cent, whichsubsequently moderated to - 7.0 per cent in 2009-10. This reflected the expansionary polices and waspartly made up by the upward shift in the private-sector savings-investment balance on the component
Table 1.5 : Ratio of savings and investment to GDP (in per cent at current marketprices)
Saving in Physical Assets 13.4 11.7 11.9 10.8 13.1 11.7
Private Corporate Sector 6.6 7.5 7.9 9.4 7.9 8.1
Gross Capital Formation (Investment) 32.8 34.7 35.7 38.1 34.5 36.5
Public Sector 7.4 7.9 8.3 8.9 9.5 9.2
Private Sector 23.8 25.2 26.4 28.1 24.6 24.9
Corporate Sector 10.3 13.6 14.5 17.3 11.5 13.2
Household Sector 13.4 11.7 11.9 10.8 13.1 11.7
Gross fixed Capital Formation 28.7 30.3 31.3 32.9 32.0 30.8
Stocks 2.5 2.8 3.4 4.0 2.0 3.3
Valuables 1.3 1.1 1.2 1.1 1.3 1.7
Saving-investment Gap
Public Sector -5.1 -5.5 -4.7 -3.9 -9.0 -7.0
Private Sector 6.3 5.8 4.6 3.8 7.1 6.7
Source : CSO.Note : Totals may not tally due to adjustment for errors and omissions.
9State of the Economy and Prospects
Website: http://indiabudget.nic.in
side and on the macroeconomic side reflectedrelatively stronger domestic demand vis-à-vis externaldemand. While the expansionary fiscal stance wasconsidered apposite given the level of demandslowdown arising from fall in investment, goingforward, the need to deepen the process of fiscalconsolidation that has resumed in the Budget for2010-11 cannot be overemphasized.
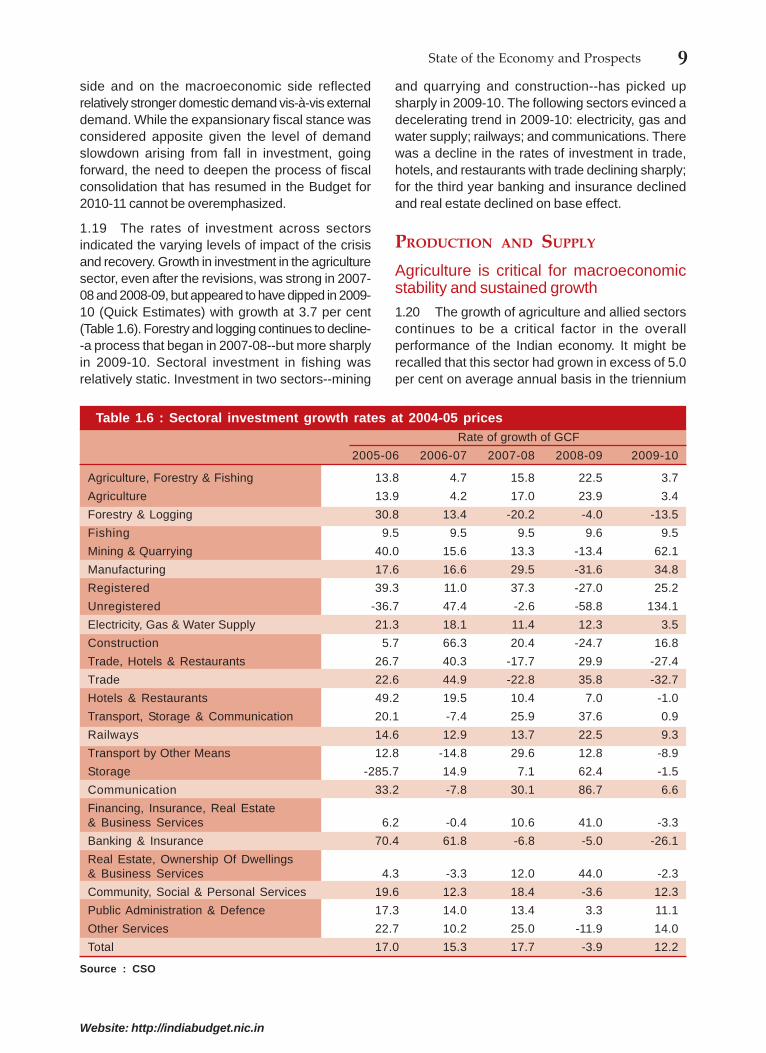
1.19 The rates of investment across sectorsindicated the varying levels of impact of the crisisand recovery. Growth in investment in the agriculturesector, even after the revisions, was strong in 2007-08 and 2008-09, but appeared to have dipped in 2009-10 (Quick Estimates) with growth at 3.7 per cent(Table 1.6). Forestry and logging continues to decline--a process that began in 2007-08--but more sharplyin 2009-10. Sectoral investment in fishing wasrelatively static. Investment in two sectors--mining
and quarrying and construction--has picked upsharply in 2009-10. The following sectors evinced adecelerating trend in 2009-10: electricity, gas andwater supply; railways; and communications. Therewas a decline in the rates of investment in trade,hotels, and restaurants with trade declining sharply;for the third year banking and insurance declinedand real estate declined on base effect.
PRODUCTION AND SUPPLY
Agriculture is critical for macroeconomicstability and sustained growth
1.20 The growth of agriculture and allied sectorscontinues to be a critical factor in the overallperformance of the Indian economy. It might berecalled that this sector had grown in excess of 5.0per cent on average annual basis in the triennium
Table 1.6 : Sectoral investment growth rates at 2004-05 prices
Transport, Storage & Communication 20.1 -7.4 25.9 37.6 0.9
Railways 14.6 12.9 13.7 22.5 9.3
Transport by Other Means 12.8 -14.8 29.6 12.8 -8.9
Storage -285.7 14.9 7.1 62.4 -1.5
Communication 33.2 -7.8 30.1 86.7 6.6
Financing, Insurance, Real Estate& Business Services 6.2 -0.4 10.6 41.0 -3.3
Banking & Insurance 70.4 61.8 -6.8 -5.0 -26.1
Real Estate, Ownership Of Dwellings& Business Services 4.3 -3.3 12.0 44.0 -2.3
Community, Social & Personal Services 19.6 12.3 18.4 -3.6 12.3
Public Administration & Defence 17.3 14.0 13.4 3.3 11.1
Other Services 22.7 10.2 25.0 -11.9 14.0
Total 17.0 15.3 17.7 -3.9 12.2
Source : CSO
10 Economic Survey 2010-11
Website: http://indiabudget.nic.in
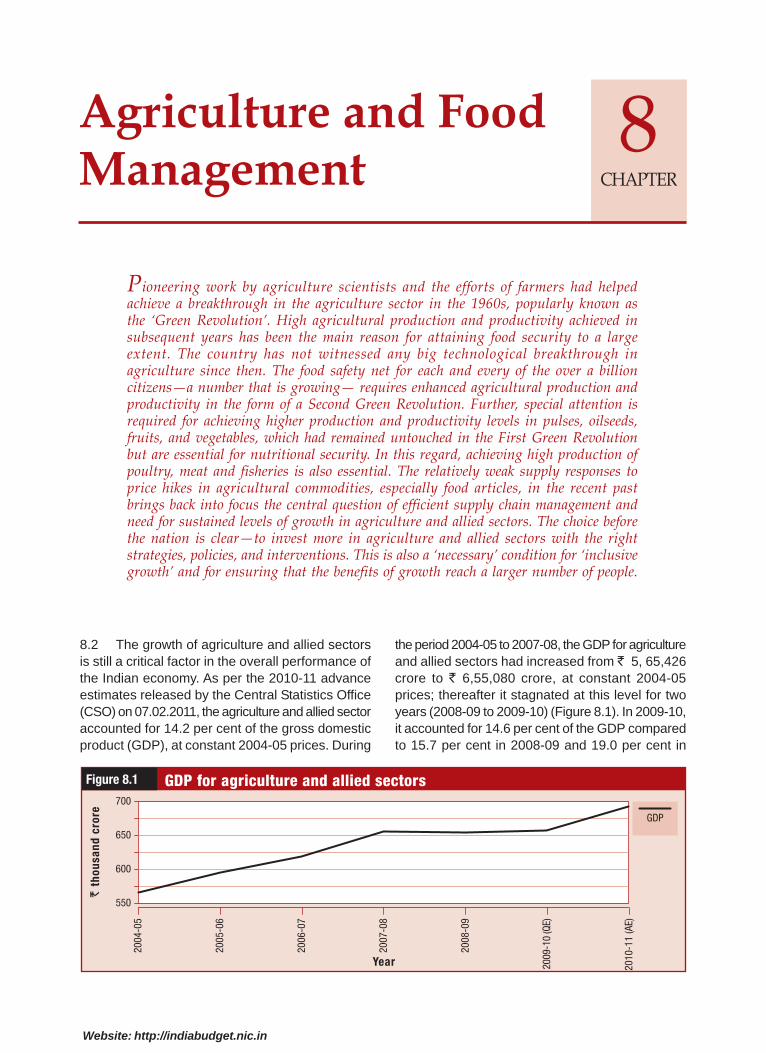
ending 2007-08 when real GDP grew in excess of 9per cent. This sector accounted for 12.7 per cent ofthe real GDP in the first half of 2010-11. Despiteexperiencing the most deficient south-west monsoonsince 1972 and a significant fall in the levels of khariffoodgrain production in 2009-10, the growth inagriculture marginally recovered to 0.4 per centprimarily due to a good rabi crop. Several measurestaken in advance by the Government for raising therabi crop output had the desired effect. The farmingsector was also broadly supported by moreremunerative prices and, earlier, by the waiver ofloans and other measures taken. With above normalrainfall, the prospects for growth of the sector werebright in the current year with a growth of 3.8 percent during the first half of 2010-11 as against 1.0per cent during the first half of 2009-10. The AdvanceEstimates of the CSO placed the growth inagriculture and allied sectors at 5.4 per cent whichimplied an overall share of 14.2 per cent in real GDPin 2010-11. Even with the level of growth in the currentfiscal, the full Eleventh Plan period target of 4 percent per annum may not be realized.
1.21 For four consecutive years from 2005-06 to2008-09, foodgrains production registered a risingtrend and touched a record level of 234.47 milliontonnes in 2008-09. The production of foodgrainsdeclined to 218.20 million tonnes during 2009-10 (4th
Advance Estimates) due to the long spells of droughtin various parts of the country in 2009. Theproductivity of almost all the crops sufferedconsiderably which led to decline in their productionin 2009. As per the 1st Advance Estimates (coveringonly kharif crops), production of kharif foodgrainsduring 2010-11 is estimated at 114.63 million tonneswhich is lower than the target of 125.31 million tonnesbut higher than kharif foodgrain production of 103.84million tonnes recorded during 2009-10 (4th AdvanceEstimates). The shortfall in the estimated khariffoodgrain production compared to the target in 2010-11 is mainly due to drought conditions reported inmajor rice-producing areas in the country.
1.22 The country has made great strides inincreasing foodgrains production since the mid-1960s. Today India ranks high in the production ofvarious commodities such as milk, wheat, rice, fruits,and vegetables. However, the agriculture sector inIndia is at a crossroads with rising demand for fooditems and relatively slower supply response in manycommodities resulting in frequent spikes in foodinflation. The technological breakthrough achievedin the 1960s is gradually waning. The need for a
second green revolution is being recognized morethan ever before. There is need to significantly stepup both private and public investment in theagriculture sector to ensure sustained growth so asto achieve the target growth of around 4 per cent perannum. The rise in prices of agricultural producewould in part help incentivize production; the mootquestion remains what proportion of the rise accruesto the producer and what proportion gets appropriatedby middlemen. The creation of more direct farm-to-fork supply chains in food items across the countrywould be critical in incentivizing the farmer with higherproducer prices and at the same time would lowerthe prices for end-consumers.
Behaviour of prices and inflation
Inflation continues to be a cause for concern
1.23 Inflation continues to be a cause for concern.The year-on-year WPI inflation that started trendingup in December 2009 continued through the currentfiscal. The financial year 2010-11 started with adouble-digit headline inflation of 11.0 per cent in April2010. After remaining in double digits from April toJuly 2010, headline inflation came down to singledigits and stood at 8.8 per cent in August 2010.Headline inflation in November 2010 was 7.5 per cent;but the trend reversed and in December 2010 it was8.4 per cent. In spite of having a good monsoon thisyear, headline inflation at elevated levels owed tohigh levels of food inflation. The inflation in foodarticles which had moderated to single digit inNovember 2010 again jumped to double digits andstood at 13.6 per cent in December 2010.
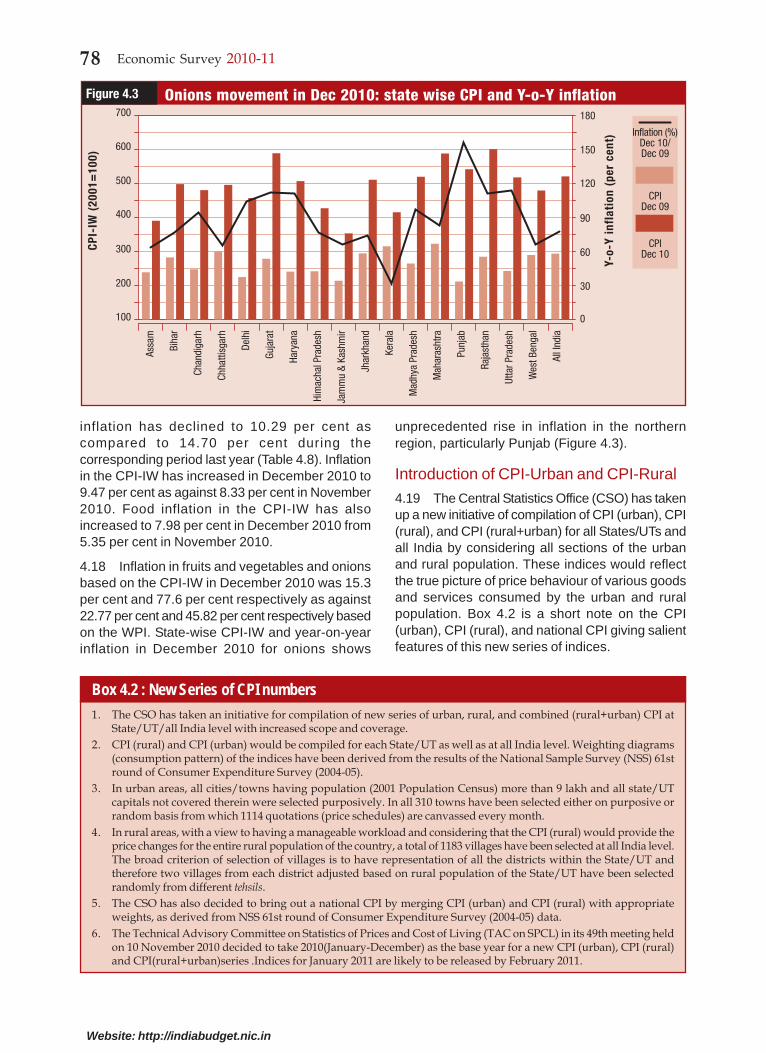
1.24 The spurt in inflation in December 2010 couldbe attributed to supply bottlenecks especially invegetables, onions, tomatoes, fruits, milk, eggs, andfish. A sudden spike in prices of onions duringDecember 2010 was witnessed on account ofdamage to the onion crop. It may be mentioned thatfood price inflation during the last financial year wasmainly driven by high inflation in pulses, cereals,and sugar due to bad monsoon. The rise in thepurchasing power owing to the rapid growth of theeconomy and inclusive programmes like theMahatma Gandhi National Rural EmploymentGuarantee Act (MNREGA) partly might havecontributed to the upward trend in inflation. Theaverage inflation in primary articles was reported at18 per cent on an average during the period April2010 to December 2010 as compared to 10 per centlast year for the same period. Recovery in thedomestic economy led to demand-side pressure on
11State of the Economy and Prospects
Website: http://indiabudget.nic.in
inflation. The inflationary pressure persists both fromdomestic demand and higher global commodityprices on account of the global recovery.
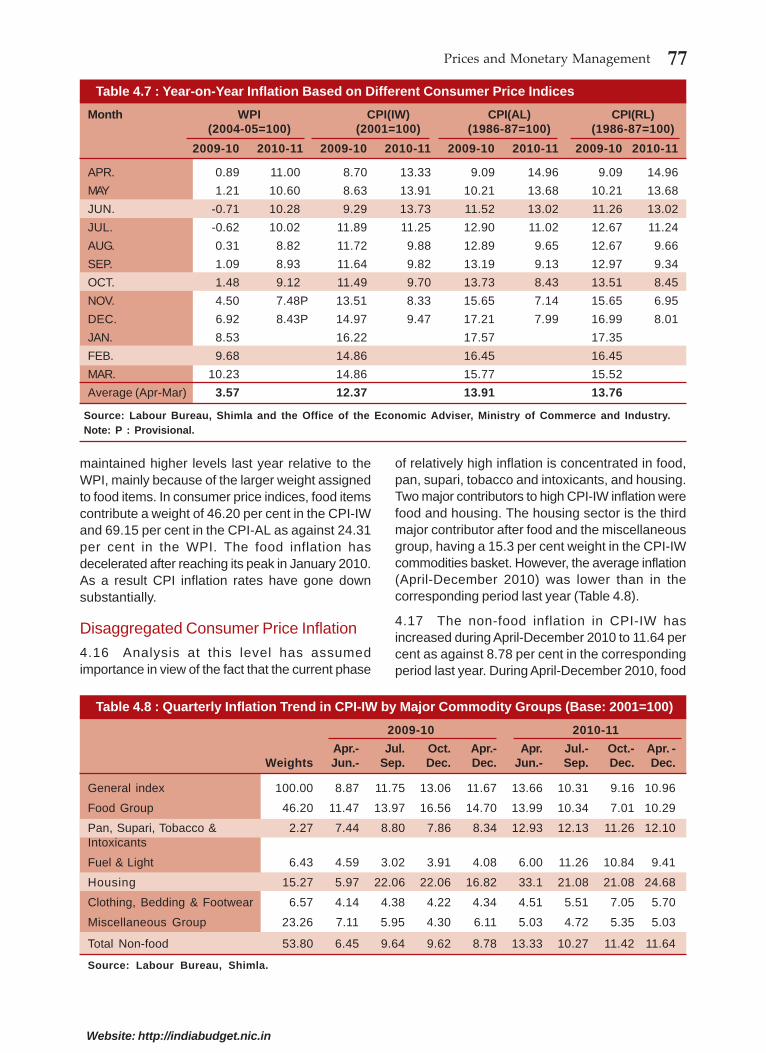
1.25 Food has higher weight in consumer priceindices than in the WPI. Overall consumer priceindex (CPI) for industrial workers (IW) inflation,year-on-year, ruled higher than WPI from November2008; this continues through the current fiscal. InAugust 2010, inflation in terms of all price indiceshad come down to single digit after 15 consecutivemonths of double-digit inflation. Year-on-year inflationin the CPI-IW was 9.47 per cent in December 2010as compared to 14.97 per cent in December 2009.On year-on-year basis, inflation in the consumerprice indices for agriculture workers (CPI-AL) andrural workers (CPI-RL) was 7.99 per cent and8.01 per cent respectively in December 2010 ascompared to 17.21 and 16.99 per cent respectivelyin December 2009.
1.26 In terms of financial year build-up of inflation,that is per cent change in the WPI index in December2010 over the levels in March 2010, a level of 6.11per cent obtained as against 7.9 per cent last yearin the same period. A decomposition of the year-on-year inflation in terms of base effect and price effectrevealed the large base effect in the rise in the levelsof inflation in 2010-11, albeit evincing a moderatingtrend in recent months. This was true also of adecomposition of the year-on-year inflation in primaryarticles.
1.27 Therefore, it is instructive to monitor theemerging trend in inflation on a sequential month-on-month basis. As there are seasonalitiesassociated with such a measure, a deseasonaliza-tion of the data would provide indications of thechange if any in the direction and the momentumembedded in it. The seasonally adjusted sequentialmeasure of headline inflation points to a spurt inSeptember 2010 followed by a moderation in the
next two months; in December 2010 there is againa massive build-up; indicating a much highermomentum (Figure 1.3). Core inflation also movedup in the current fiscal indicating that the inflation infood items might have spilled over into a moregeneralized phenomenon. Inflation in manufactureditems with a weight of 65 per cent in the WPI hasbeen above the 4 per cent mark since January 2010and after reaching 6.4 per cent in April 2010 hasevinced a moderating trend. The rise in wage goodsand levels of inflation in intermediates has implicationsfor the industrial output.
Industry and Infrastructure
Recent data indicate volatility and waningmomentum
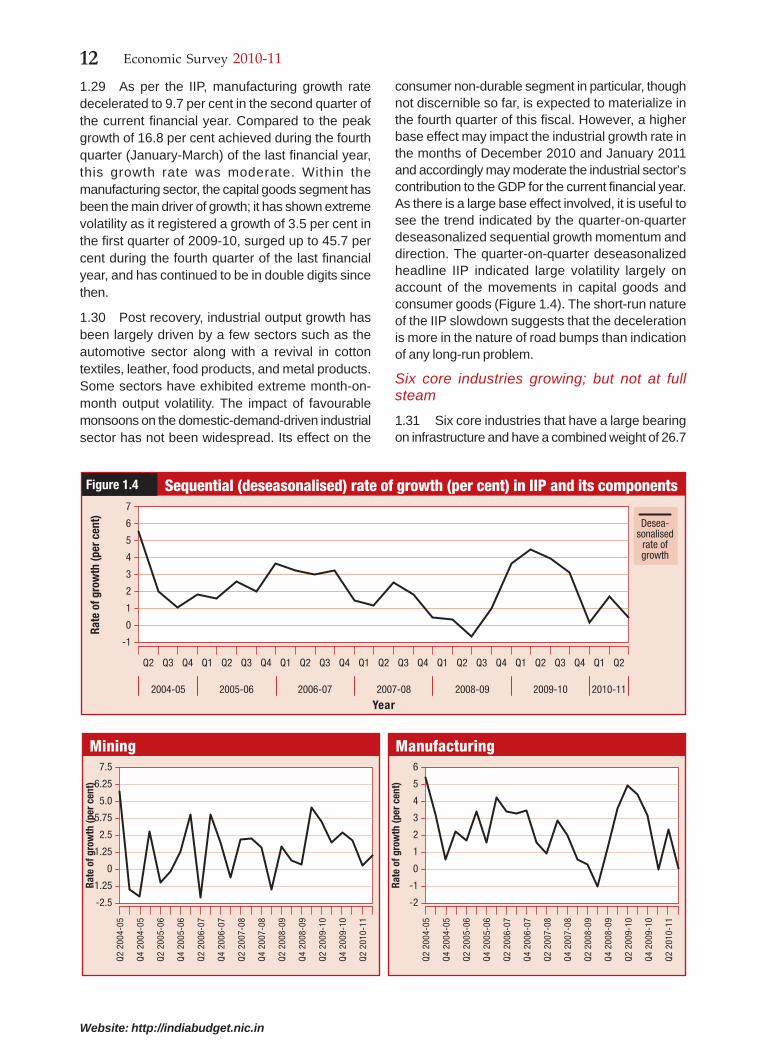
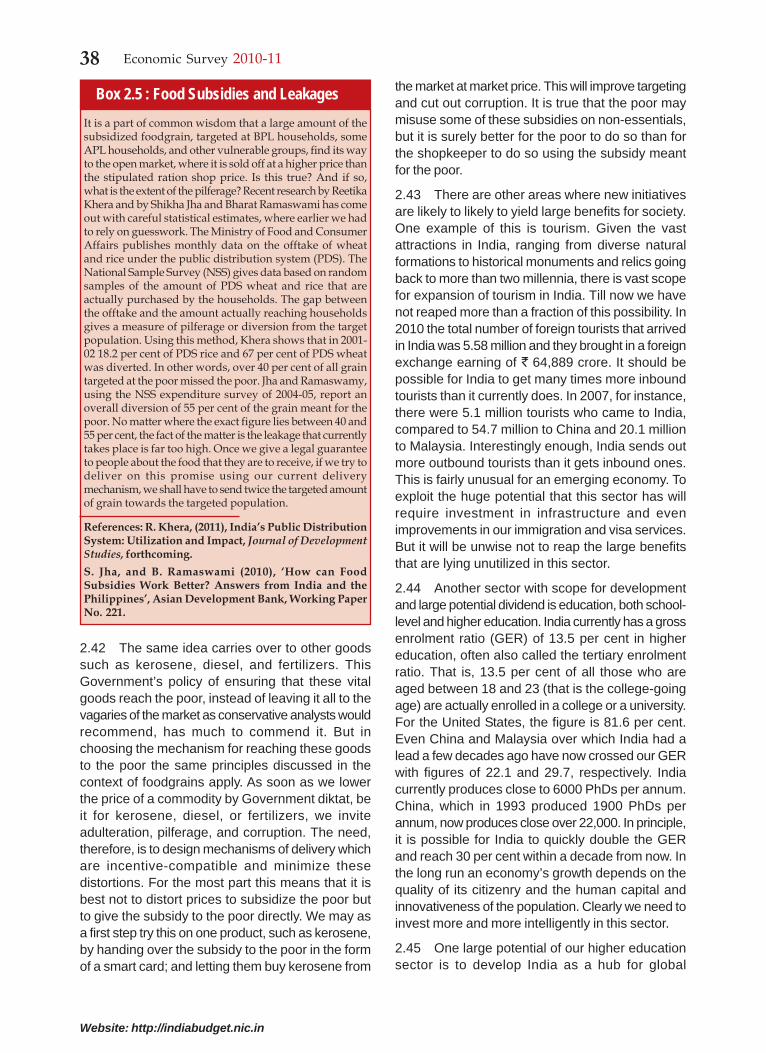
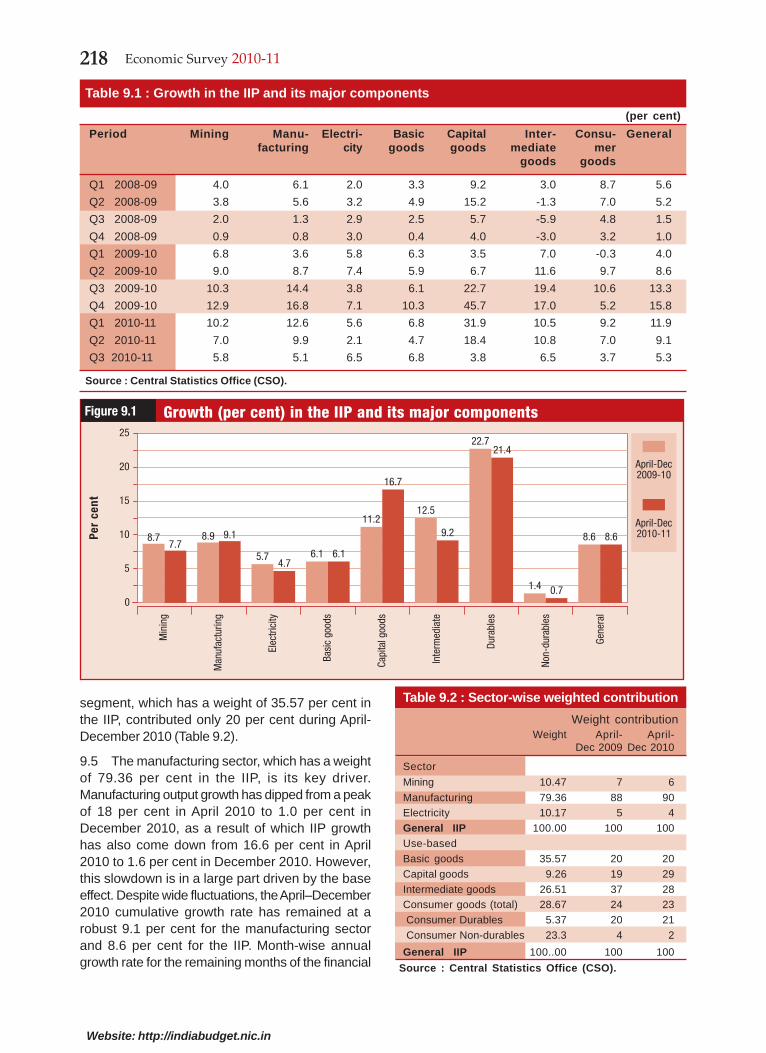
1.28 Growth in the industrial sector as per the IIPwas buoyant during the first two quarters of the currentfinancial year. The manufacturing sector, in particular,showed a remarkable robustness, growing at ratesof 12.6 per cent and 9.7 per cent respectively duringthese two quarters. IIP data on monthly basisindicated that growth in IIP has decelerated sharplyto a level of 2.7 per cent in November from 11.3 percent in November 2009. For the current financial year(April-November), growth in the IIP was placed at9.5 per cent as against the 7.4 per cent that obtainedin the corresponding period last year. Data on theIIP has exhibited volatility in the current fiscal withgrowth varying widely in the range of 2.7 per cent to16.6 per cent. While earlier the volatility wasassociated with capital goods in the use-basedclassification, components like consumer non-durables and basic goods were the main depressantsin the deceleration in November 2010. The CSO hasreleased the IIP data for the month of December2010 on 11 February 2011. Year-on-year, the IIP hasgrown by 1.6 per cent in December 2010 and 8.6per cent during April-December 2010.
1.29 As per the IIP, manufacturing growth ratedecelerated to 9.7 per cent in the second quarter ofthe current financial year. Compared to the peakgrowth of 16.8 per cent achieved during the fourthquarter (January-March) of the last financial year,this growth rate was moderate. Within themanufacturing sector, the capital goods segment hasbeen the main driver of growth; it has shown extremevolatility as it registered a growth of 3.5 per cent inthe first quarter of 2009-10, surged up to 45.7 percent during the fourth quarter of the last financialyear, and has continued to be in double digits sincethen.
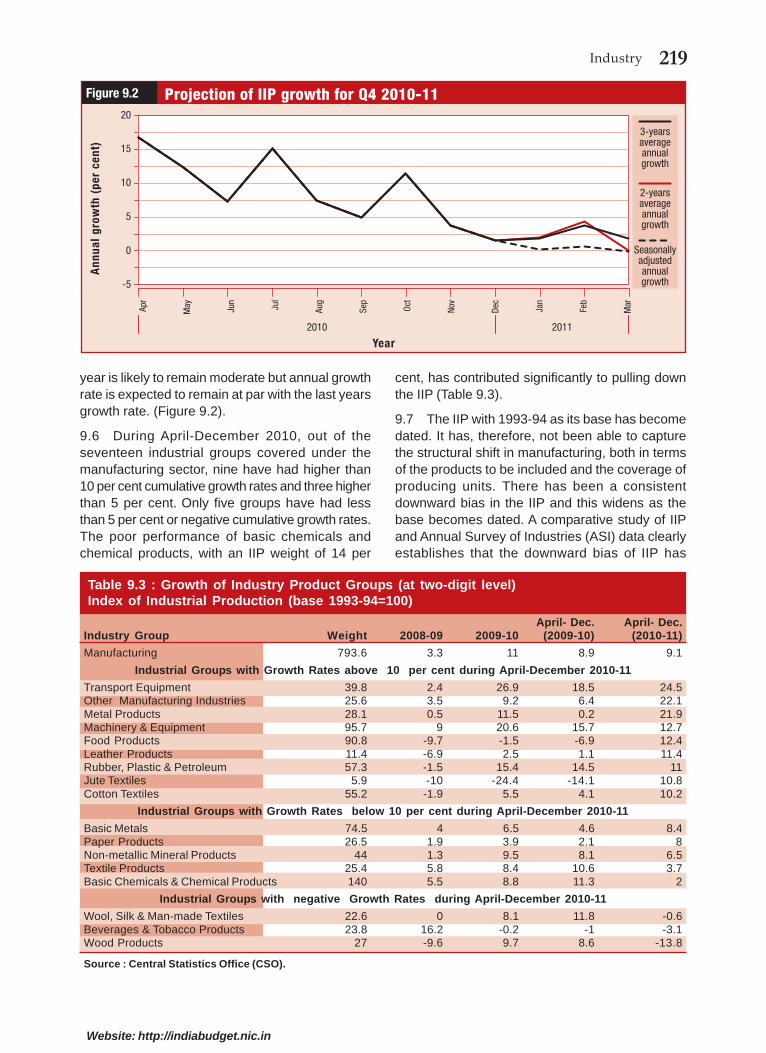
1.30 Post recovery, industrial output growth hasbeen largely driven by a few sectors such as theautomotive sector along with a revival in cottontextiles, leather, food products, and metal products.Some sectors have exhibited extreme month-on-month output volatility. The impact of favourablemonsoons on the domestic-demand-driven industrialsector has not been widespread. Its effect on the
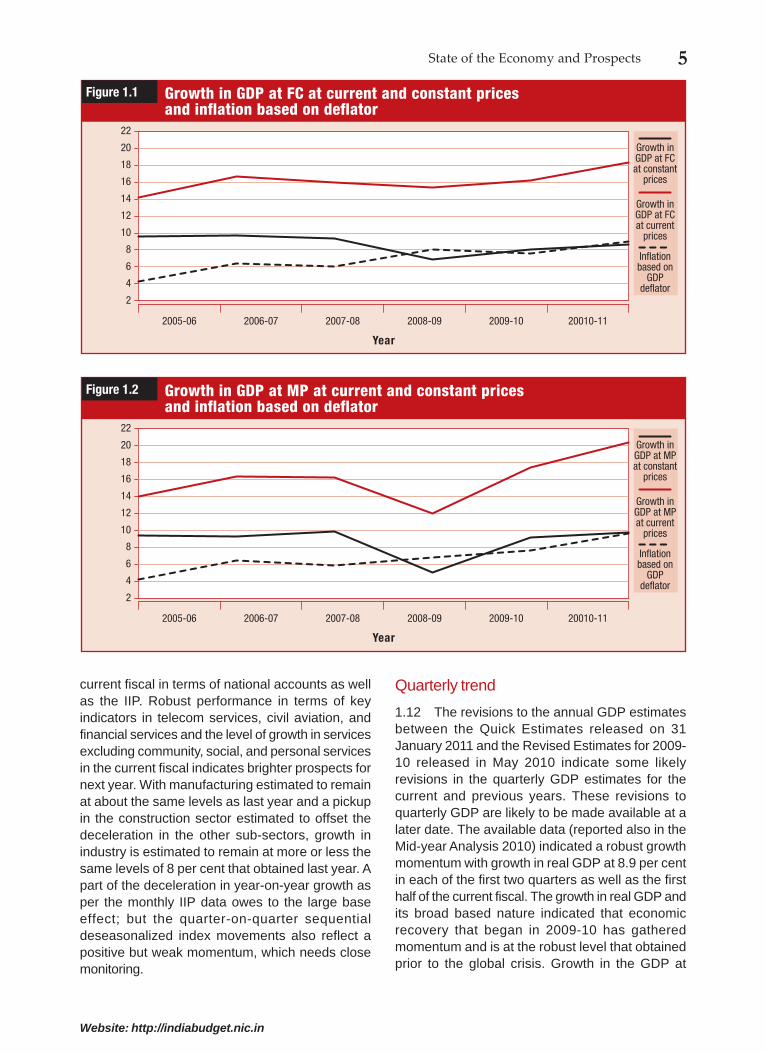
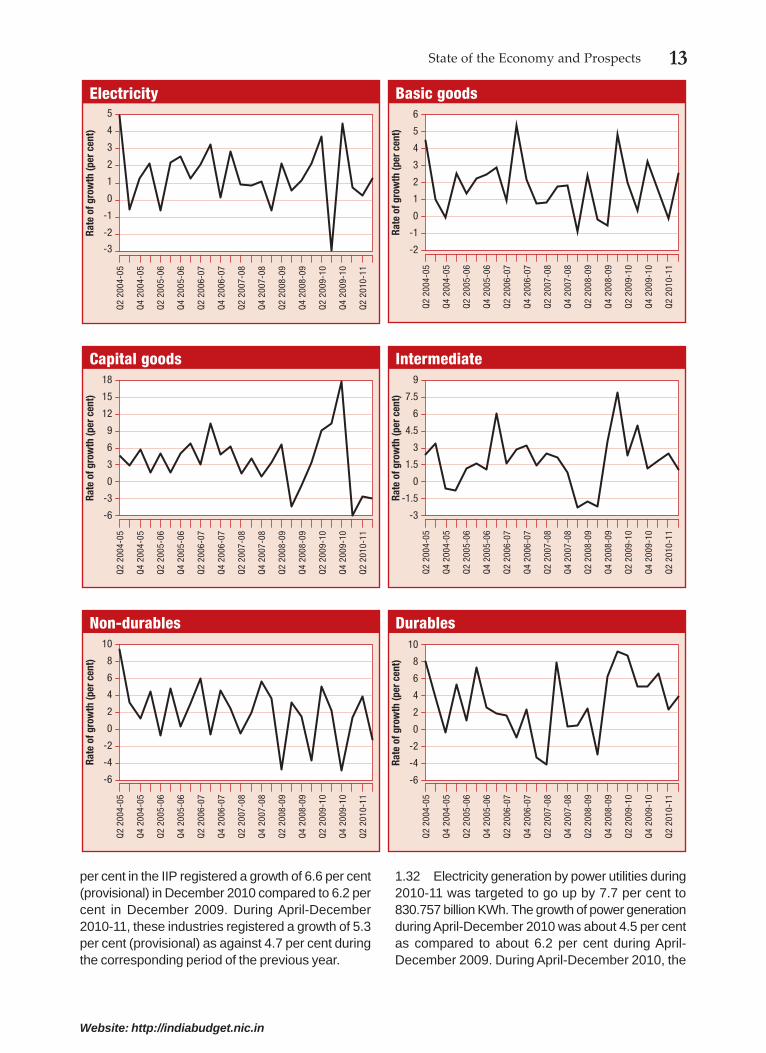
consumer non-durable segment in particular, thoughnot discernible so far, is expected to materialize inthe fourth quarter of this fiscal. However, a higherbase effect may impact the industrial growth rate inthe months of December 2010 and January 2011and accordingly may moderate the industrial sector’scontribution to the GDP for the current financial year.As there is a large base effect involved, it is useful tosee the trend indicated by the quarter-on-quarterdeseasonalized sequential growth momentum anddirection. The quarter-on-quarter deseasonalizedheadline IIP indicated large volatility largely onaccount of the movements in capital goods andconsumer goods (Figure 1.4). The short-run natureof the IIP slowdown suggests that the decelerationis more in the nature of road bumps than indicationof any long-run problem.
Six core industries growing; but not at fullsteam
1.31 Six core industries that have a large bearingon infrastructure and have a combined weight of 26.7
-1
1
3
5
Rate
of g
row
th (p
er c
ent) Desea-
sonalisedrate ofgrowth
Sequential (deseasonalised) rate of growth (per cent) in IIP and its componentsFigure 1.4
per cent in the IIP registered a growth of 6.6 per cent(provisional) in December 2010 compared to 6.2 percent in December 2009. During April-December2010-11, these industries registered a growth of 5.3per cent (provisional) as against 4.7 per cent duringthe corresponding period of the previous year.
1.32 Electricity generation by power utilities during2010-11 was targeted to go up by 7.7 per cent to830.757 billion KWh. The growth of power generationduring April-December 2010 was about 4.5 per centas compared to about 6.2 per cent during April-December 2009. During April-December 2010, the
Rate
of g
row
th (p
er c
ent)
Intermediate
-3
0
3
6
-1.5
1.5
4.5
7.5
9
Q2
2004
-05
Q4
2004
-05
Q2
2005
-06
Q4
2005
-06
Q2
2006
-07
Q4
2006
-07
Q2
2007
-08
Q4
2007
-08
Q2
2008
-09
Q4
2008
-09
Q2
2009
-10
Q4
2009
-10
Q2
2010
-11
Rate
of g
row
th (p
er c
ent)
Non-durables
-6
-2
2
6
-4
0
4
8
10
Q2
2004
-05
Q4
2004
-05
Q2
2005
-06
Q4
2005
-06
Q2
2006
-07
Q4
2006
-07
Q2
2007
-08
Q4
2007
-08
Q2
2008
-09
Q4
2008
-09
Q2
2009
-10
Q4
2009
-10
Q2
2010
-11
Durables
Q2
2004
-05
Q4
2004
-05
Q2
2005
-06
Q4
2005
-06
Q2
2006
-07
Q4
2006
-07
Q2
2007
-08
Q4
2007
-08
Q2
2008
-09
Q4
2008
-09
Q2
2009
-10
Q4
2009
-10
Q2
2010
-11
Rate
of g
row
th (p
er c
ent)
-6
-2
2
6
-4
0
4
8
10
Rate
of g
row
th (p
er c
ent)
Electricity
-2
0
2
4
-1
1
3
5Q
2 20
04-0
5
Q4
2004
-05
Q2
2005
-06
Q4
2005
-06
Q2
2006
-07
Q4
2006
-07
Q2
2007
-08
Q4
2007
-08
Q2
2008
-09
Q4
2008
-09
Q2
2009
-10
Q4
2009
-10
Q2
2010
-11
-3
Rate
of g
row
th (p
er c
ent)
Basic goods
-2
0
2
4
-1
1
3
5
6
Q2
2004
-05
Q4
2004
-05
Q2
2005
-06
Q4
2005
-06
Q2
2006
-07
Q4
2006
-07
Q2
2007
-08
Q4
2007
-08
Q2
2008
-09
Q4
2008
-09
Q2
2009
-10
Q4
2009
-10
Q2
2010
-11
Rate
of g
row
th (p
er c
ent)
Capital goods
-6
0
6
12
-3
3
9
15
18
Q2
2004
-05
Q4
2004
-05
Q2
2005
-06
Q4
2005
-06
Q2
2006
-07
Q4
2006
-07
Q2
2007
-08
Q4
2007
-08
Q2
2008
-09
Q4
2008
-09
Q2
2009
-10
Q4
2009
-10
Q2
2010
-11
14 Economic Survey 2010-11
Website: http://indiabudget.nic.in
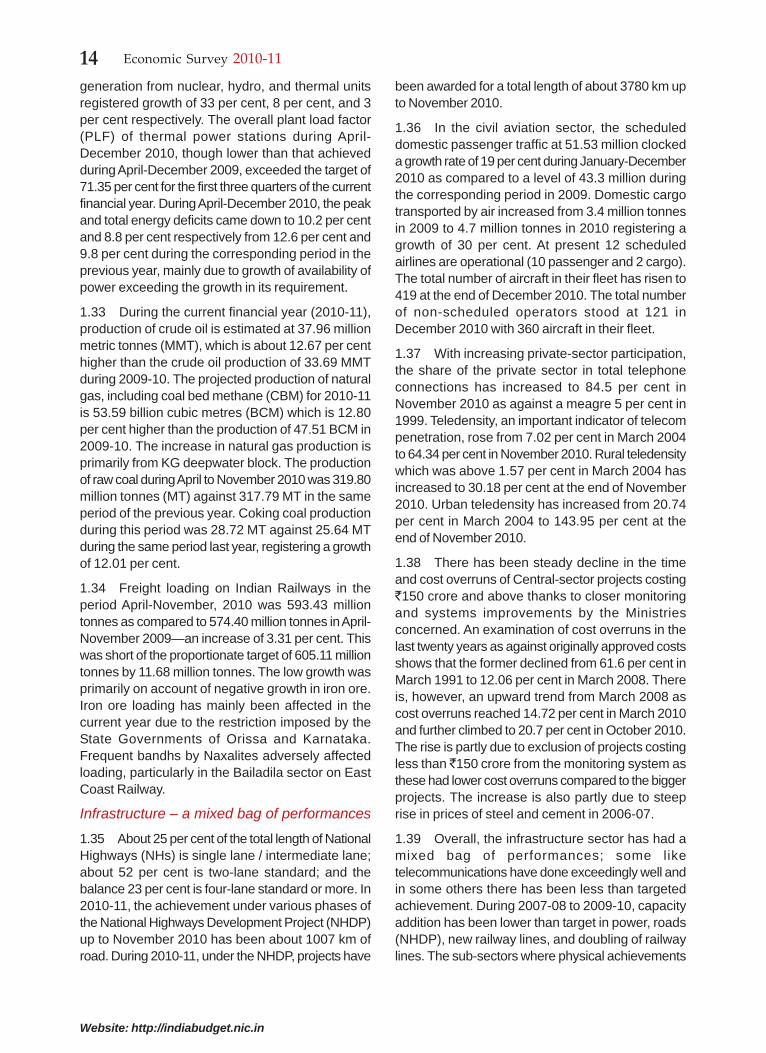
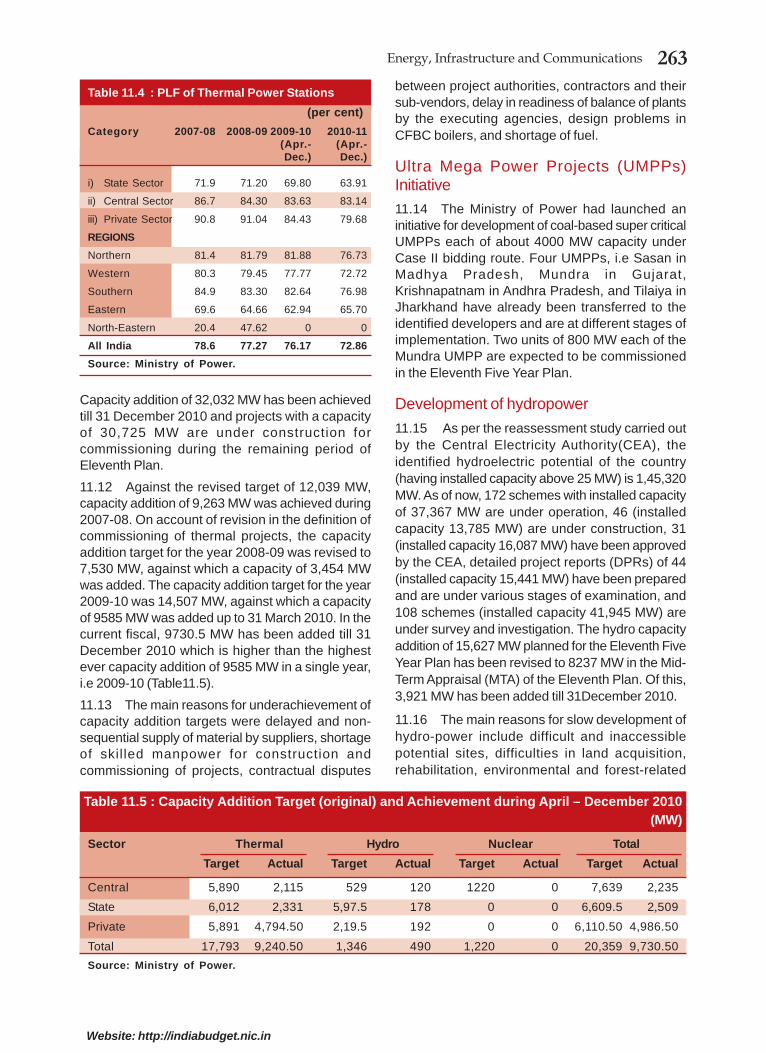
generation from nuclear, hydro, and thermal unitsregistered growth of 33 per cent, 8 per cent, and 3per cent respectively. The overall plant load factor(PLF) of thermal power stations during April-December 2010, though lower than that achievedduring April-December 2009, exceeded the target of71.35 per cent for the first three quarters of the currentfinancial year. During April-December 2010, the peakand total energy deficits came down to 10.2 per centand 8.8 per cent respectively from 12.6 per cent and9.8 per cent during the corresponding period in theprevious year, mainly due to growth of availability ofpower exceeding the growth in its requirement.
1.33 During the current financial year (2010-11),production of crude oil is estimated at 37.96 millionmetric tonnes (MMT), which is about 12.67 per centhigher than the crude oil production of 33.69 MMTduring 2009-10. The projected production of naturalgas, including coal bed methane (CBM) for 2010-11is 53.59 billion cubic metres (BCM) which is 12.80per cent higher than the production of 47.51 BCM in2009-10. The increase in natural gas production isprimarily from KG deepwater block. The productionof raw coal during April to November 2010 was 319.80million tonnes (MT) against 317.79 MT in the sameperiod of the previous year. Coking coal productionduring this period was 28.72 MT against 25.64 MTduring the same period last year, registering a growthof 12.01 per cent.
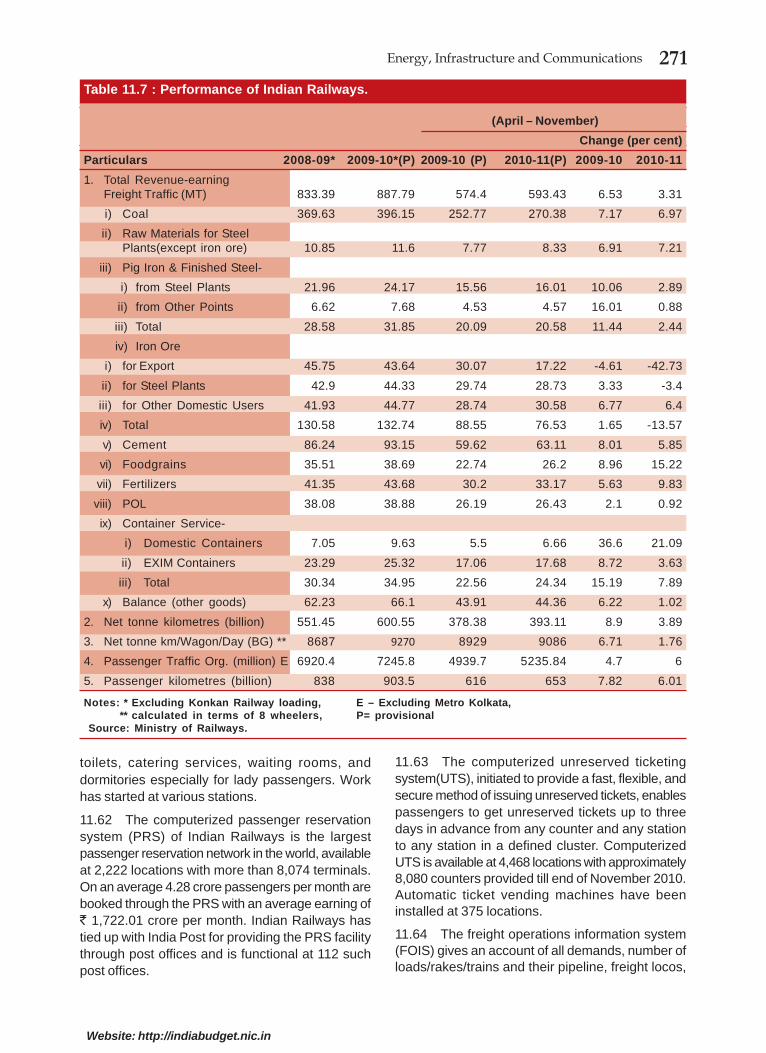
1.34 Freight loading on Indian Railways in theperiod April-November, 2010 was 593.43 milliontonnes as compared to 574.40 million tonnes in April-November 2009—an increase of 3.31 per cent. Thiswas short of the proportionate target of 605.11 milliontonnes by 11.68 million tonnes. The low growth wasprimarily on account of negative growth in iron ore.Iron ore loading has mainly been affected in thecurrent year due to the restriction imposed by theState Governments of Orissa and Karnataka.Frequent bandhs by Naxalites adversely affectedloading, particularly in the Bailadila sector on EastCoast Railway.
Infrastructure – a mixed bag of performances
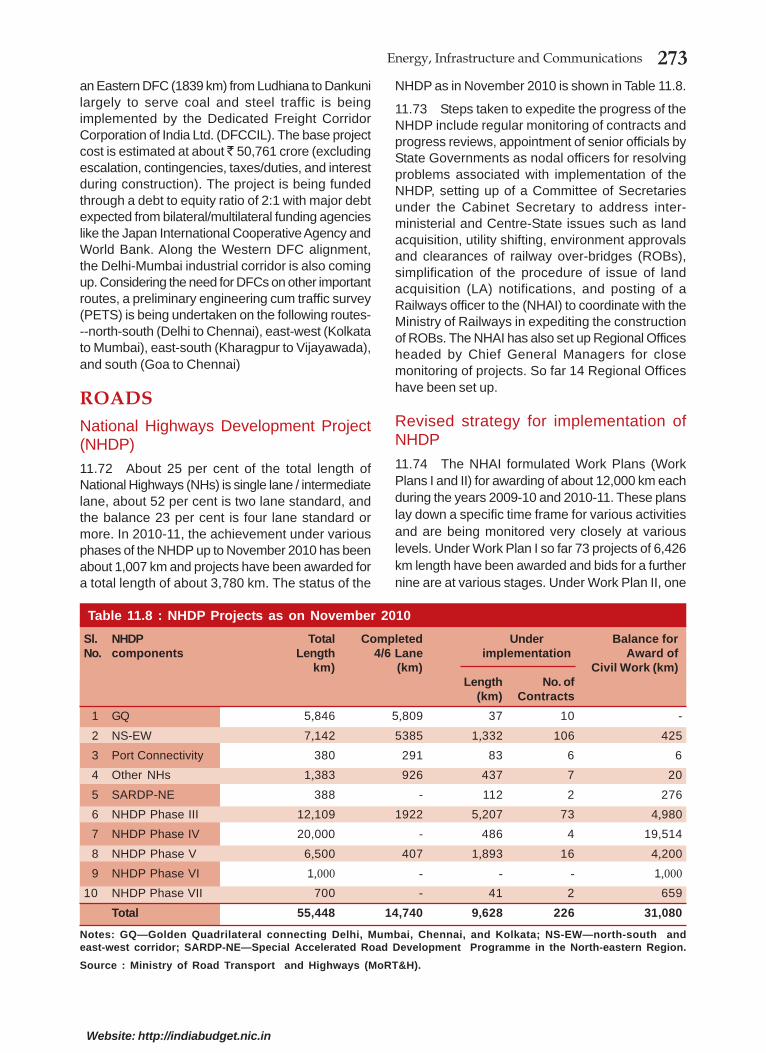
1.35 About 25 per cent of the total length of NationalHighways (NHs) is single lane / intermediate lane;about 52 per cent is two-lane standard; and thebalance 23 per cent is four-lane standard or more. In2010-11, the achievement under various phases ofthe National Highways Development Project (NHDP)up to November 2010 has been about 1007 km ofroad. During 2010-11, under the NHDP, projects have
been awarded for a total length of about 3780 km upto November 2010.
1.36 In the civil aviation sector, the scheduleddomestic passenger traffic at 51.53 million clockeda growth rate of 19 per cent during January-December2010 as compared to a level of 43.3 million duringthe corresponding period in 2009. Domestic cargotransported by air increased from 3.4 million tonnesin 2009 to 4.7 million tonnes in 2010 registering agrowth of 30 per cent. At present 12 scheduledairlines are operational (10 passenger and 2 cargo).The total number of aircraft in their fleet has risen to419 at the end of December 2010. The total numberof non-scheduled operators stood at 121 inDecember 2010 with 360 aircraft in their fleet.
1.37 With increasing private-sector participation,the share of the private sector in total telephoneconnections has increased to 84.5 per cent inNovember 2010 as against a meagre 5 per cent in1999. Teledensity, an important indicator of telecompenetration, rose from 7.02 per cent in March 2004to 64.34 per cent in November 2010. Rural teledensitywhich was above 1.57 per cent in March 2004 hasincreased to 30.18 per cent at the end of November2010. Urban teledensity has increased from 20.74per cent in March 2004 to 143.95 per cent at theend of November 2010.
1.38 There has been steady decline in the timeand cost overruns of Central-sector projects costing`150 crore and above thanks to closer monitoringand systems improvements by the Ministriesconcerned. An examination of cost overruns in thelast twenty years as against originally approved costsshows that the former declined from 61.6 per cent inMarch 1991 to 12.06 per cent in March 2008. Thereis, however, an upward trend from March 2008 ascost overruns reached 14.72 per cent in March 2010and further climbed to 20.7 per cent in October 2010.The rise is partly due to exclusion of projects costingless than ̀ 150 crore from the monitoring system asthese had lower cost overruns compared to the biggerprojects. The increase is also partly due to steeprise in prices of steel and cement in 2006-07.
1.39 Overall, the infrastructure sector has had amixed bag of performances; some liketelecommunications have done exceedingly well andin some others there has been less than targetedachievement. During 2007-08 to 2009-10, capacityaddition has been lower than target in power, roads(NHDP), new railway lines, and doubling of railwaylines. The sub-sectors where physical achievements
15State of the Economy and Prospects
Website: http://indiabudget.nic.in
have been above or close to targets aretelecommunications, villages electrified under theRajiv Gandhi Grameen Vidyutikaran Yojana(RGGVY), railway lines electrification, railway gaugeconversion, and new and renewal of roadsconstruction under the Pradhan Mantri Gram SadakYojana (PMGSY). The investment in infrastructurehas reached 7.18 per cent of the GDP in 2008-09and is expected to increase to 8.37 per cent in theterminal year of the Eleventh Plan. Rapid reductionof the infrastructure deficit holds the key tocompetitiveness in an increasingly globalizedeconomic environment.
Services Sector – the potential growth engine
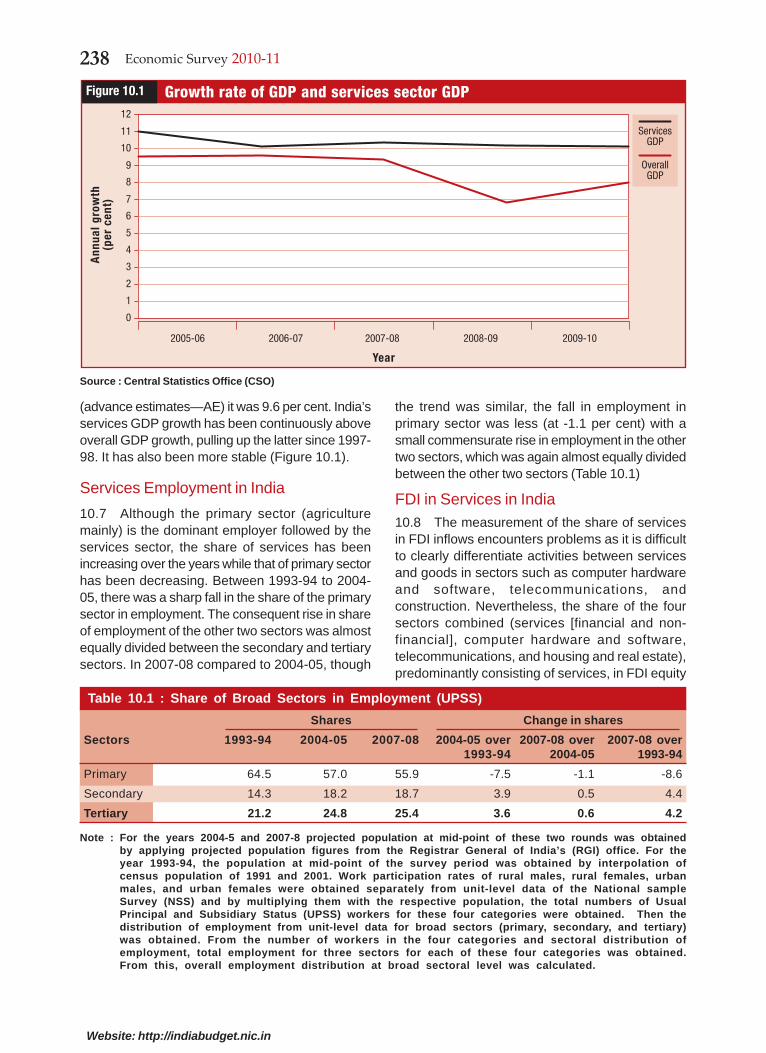
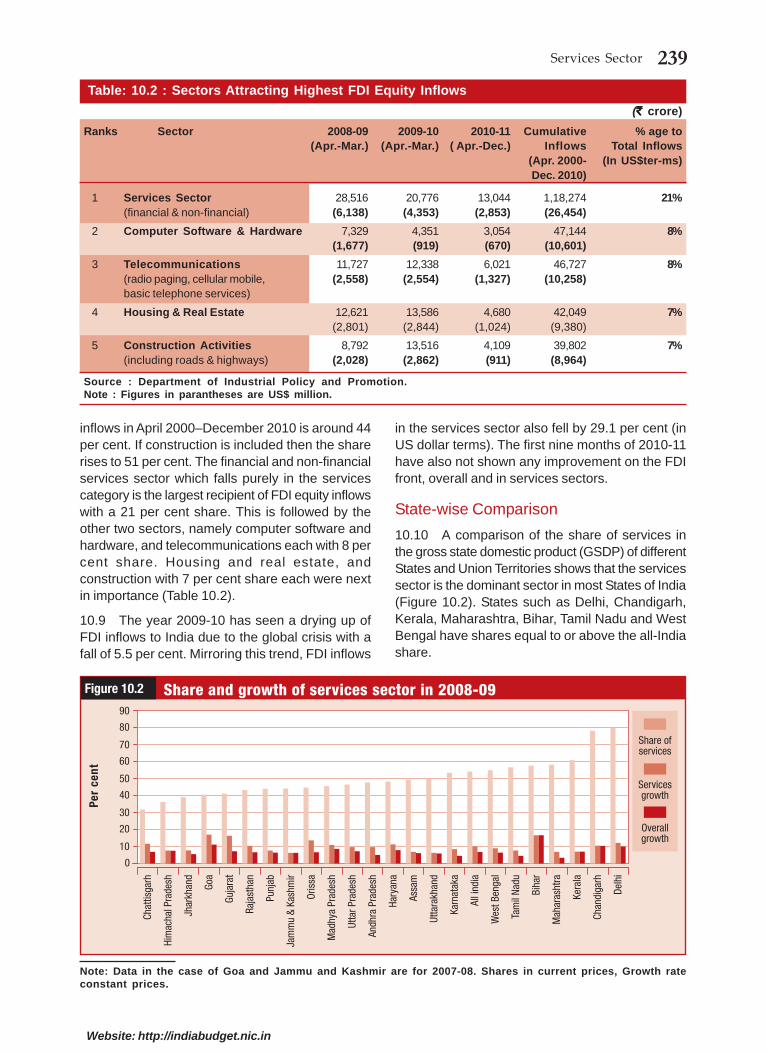
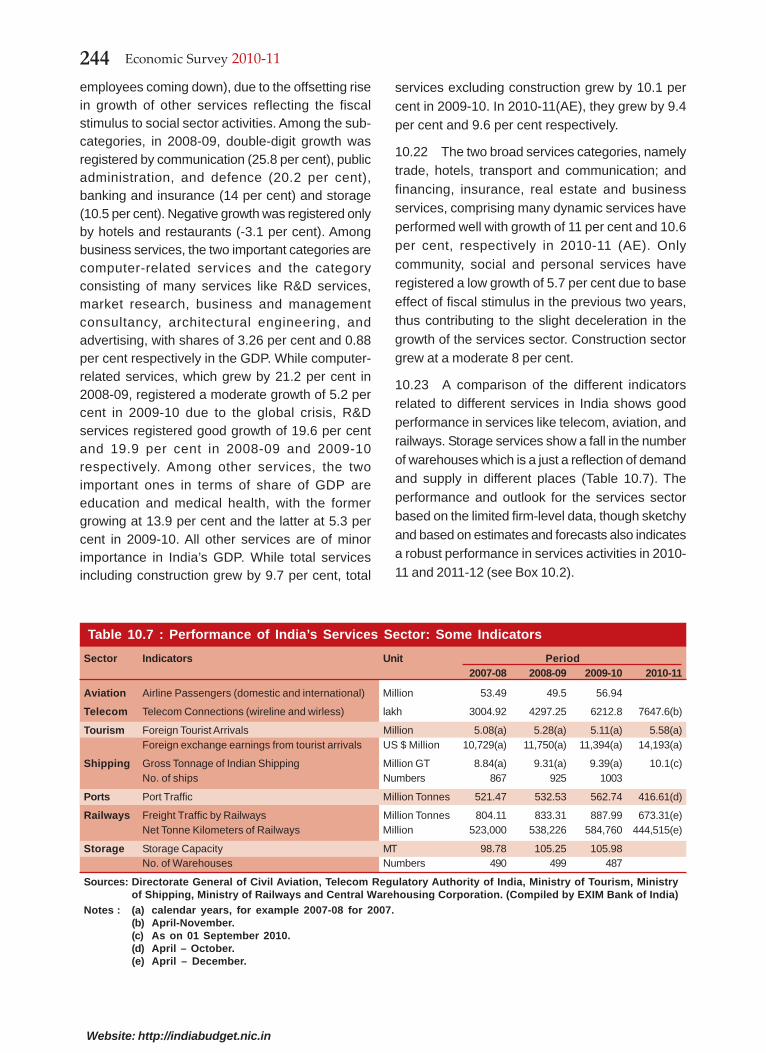
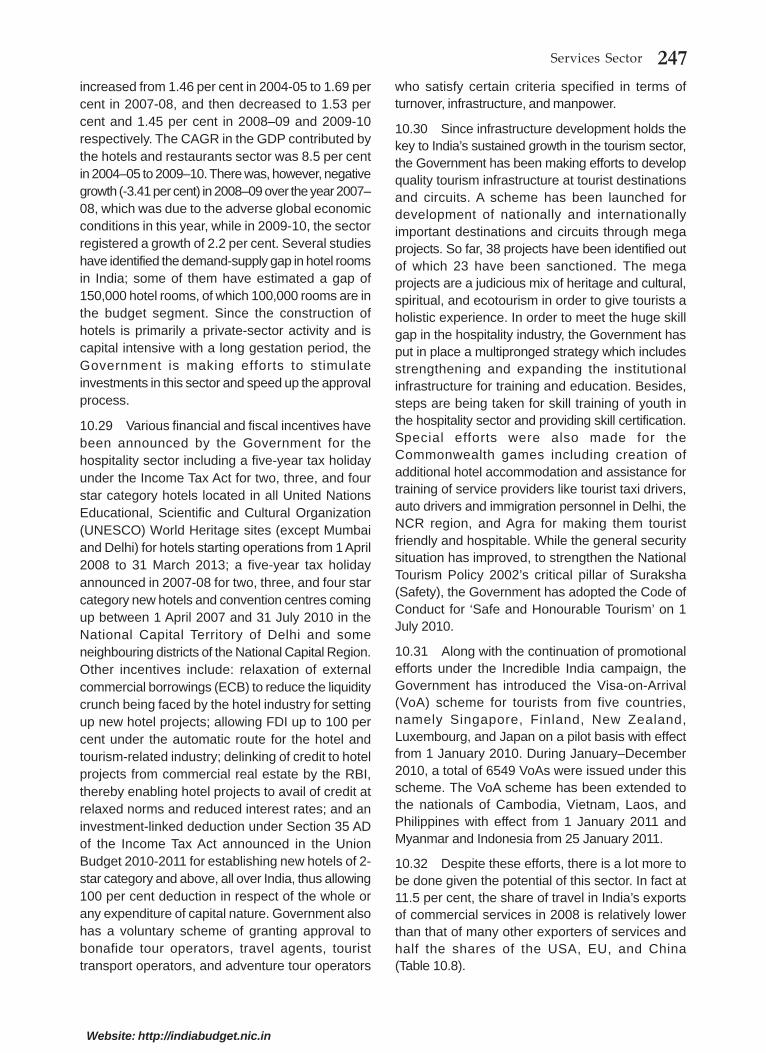
1.40 The services sector has played a dominantrole in the Indian economy with a 57.3 per cent sharein the GDP; a growth of 10.1 per cent in 2009-10; ahigh share in FDI equity inflows with the financialand non-financial services category alone contributing21 per cent during April 2000 to November 2010;and a 35 per cent share in total exports with 27.4per cent export growth in the first half of 2010-11. Acomparison of shares of the services sector in theGDP of different States and Union Territories showsthat the services sector is also the dominant sectorin most of the States of India.
1.41 High-growth services categories are financing,insurance, real estate, and business services andtransport, storage, and communication with the latterovertaking the former in 2009-10 with a high growthof 15 per cent. Growth of trade, hotels, andrestaurants which slowed down in 2008-09 hasrecovered moderately in 2009-10. Among the sub-categories, in 2008-09, double- digit growth wasregistered by communications (25.7 per cent), publicadministration and defence (22.1 per cent), bankingand insurance (13.9 per cent), and storage (11.6 percent). Negative growth was registered only by hotelsand restaurants (-3.5 per cent). Among businessservices, the most important categories are computer-related service; and the category consisting of manyservices like research and development (R&D)services, market research, business andmanagement consultancy, architectural engineering,and advertising., with shares in the GDP of 3.26 percent and 0.88 per cent respectively. While computer-related services which grew by 21.2 per cent in 2008-09 registered a moderate growth of 5.2 per cent in2009-10 due to the global crisis, R&D servicesregistered good growth of 19.6 per cent and 19.9 percent in both 2008-09 and 2009-10 respectively.
Among other services, the two important servicesare education and medical health in terms of relativeshare of the GDP; they had growth rates of 13.9 percent and 5.3 per cent in 2009-10 respectively. Whiletotal services including construction grew by 9.7 percent, total services excluding construction grew by10.1 per cent in 2009-10. In 2010-11(AdvanceEstimates), they grew by 9.4 per cent and 9.6 percent respectively. The outlook for the services sectorwhich had slightly dimmed due to the fallouts of thesub-prime crisis in US and the global financial crisishas once again brightened. Recent businessperformance indicators of different service firms inthe different services also support this healthyprognosis. Even during the crisis years, annualservices growth has been around the 10 per centmark which it has maintained since 2005-06. This isin contrast to the overall GDP growth which fell to6.8 per cent in 2008-09 from 9.3 per cent in 2007-08.
External-sector developments
Global economy on the upturn; to supportgrowth momentum
1.42 The global economy was estimated to havegrown rapidly in 2010 by 5.0 per cent according tothe update of the WEO (25 January 2011); whichwas one of the highest rates of growth in recent yearsand compares favourably with the robust levels inthe pre-crisis period. Growth in emerging economiesremains strong, while advanced countries aregrowing slowly and facing uncertainty with large fiscaldeficit and high public debt and unemployment levels.This indicated the two-paced nature of the globalgrowth process in the current conjuncture. Whilegrowth in 2010 was partly a rebound from weak levelsin 2009, the estimate for 2011 and 2012 at about 4.5per cent indicated the prospects. The Market Updateof the Global Financial Stability Report of the IMF(January 2011) observed that global financial stabilityis still to be assured and significant policy challengesremain to be addressed: slow progress in the as yetincomplete balance sheet restructuring process;interaction between the banking and sovereign creditrisks in the euro area; and need for more regulatoryreforms to the financial sector to anchor stability. Inseveral emerging market economies (EMEs),however, there has been surge in capital inflows withthe associated risk of bubbles in asset and creditmarkets. There have also been signs of rising inflation,in response to strong global demand, combined withsupply constraints.
16 Economic Survey 2010-11
Website: http://indiabudget.nic.in
Trade developments
Imports slowing; exports gathering pace andtrade deficit set to narrow
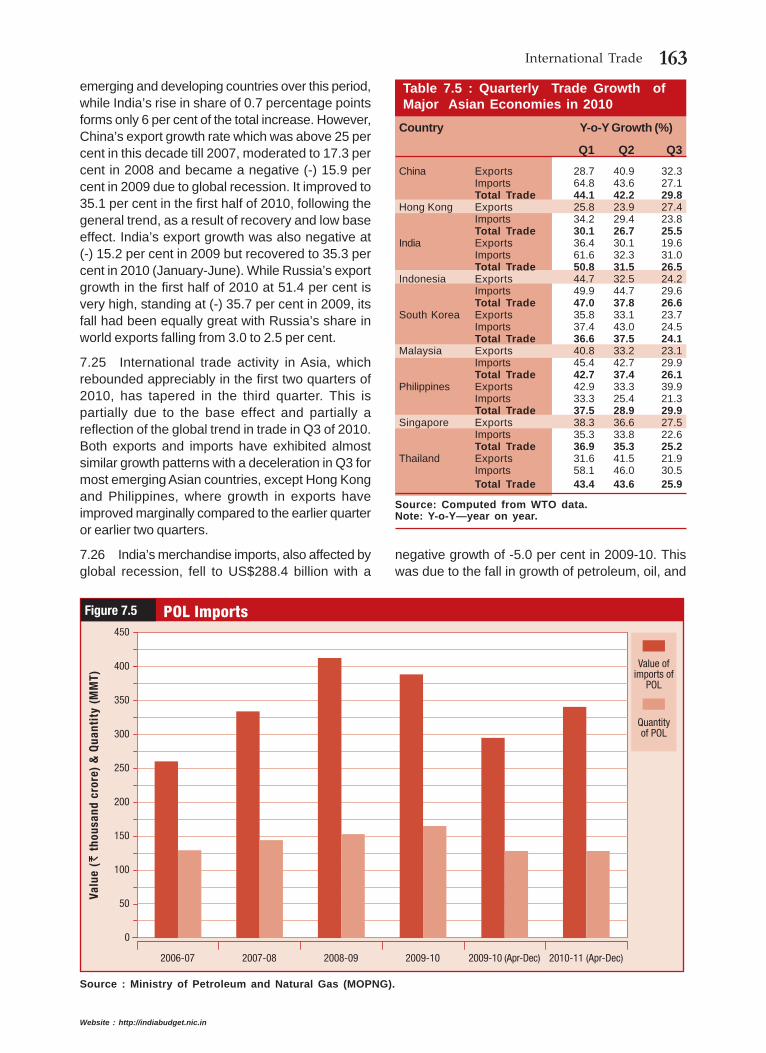
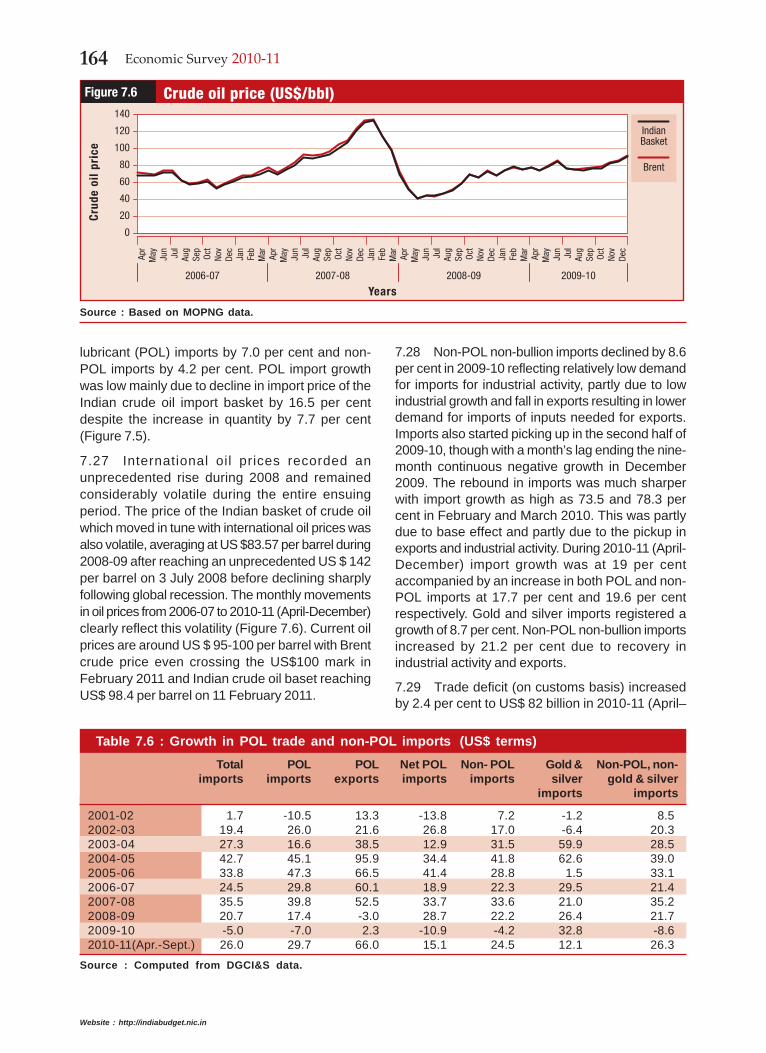
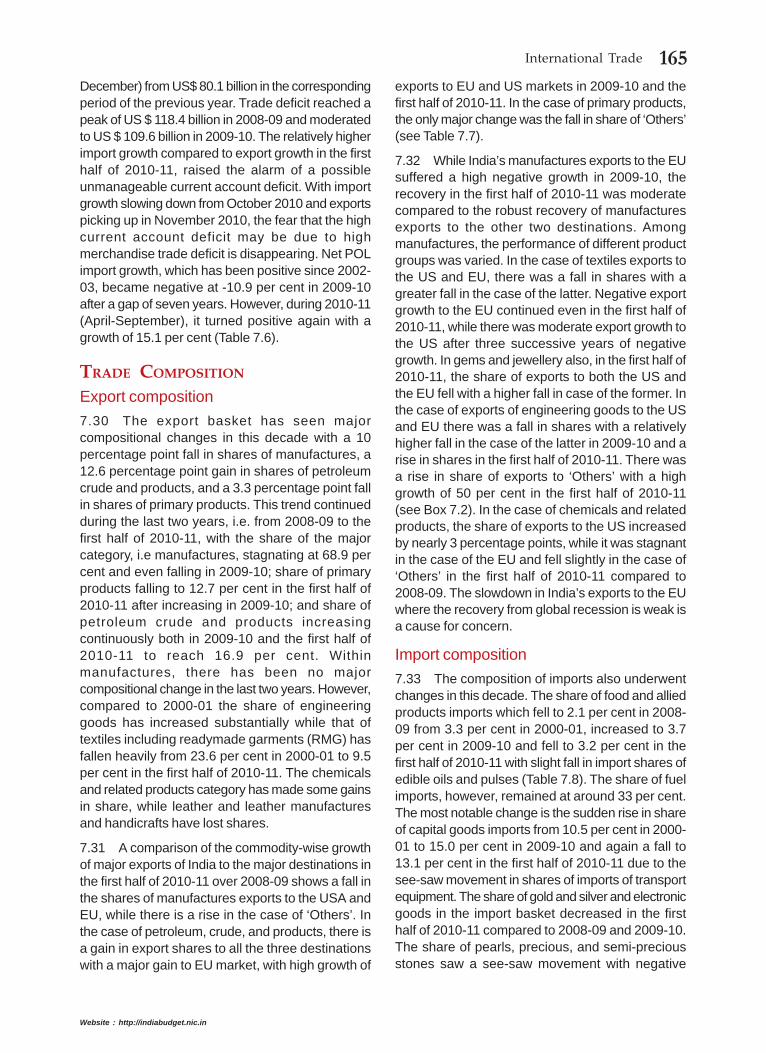
1.43 In tandem with world trade volumes, India’sexports fell rapidly following the deepening of theglobal financial crisis midway through 2008-09; theyrose in the second half of 2009-10, which continuedthrough 2010-11 until June 2010. Thereafter growthdecelerated till October 2010 and picked upsubsequently to reach 36.4 per cent in December2010, which is the highest growth in the last twoyears. Nevertheless cumulative export growth inApril-December 2010-11 was at 29.5 per cent withcumulative exports reaching US $ 164.7 billion duringthis period. Current indications are that India wouldnot only achieve the target of US$ 200 billion butsurpass it in 2010-11. India’s merchandise importsalso affected by the global recession fell to US$288.4billion with a negative growth of - 5.0 per cent in2009-10. This was due to the fall in growth ofpetroleum, oil, and lubricants (POL) imports by 7.0per cent and non-POL imports by 4.2 per cent. POLimport growth was low mainly due to decline in importprice of the Indian crude oil import basket by 16.5per cent despite the increase in quantity by 7.7 percent.
1.44 Trade deficit (on customs basis) increasedby 2.4 per cent to US$ 82 billion in 2010-11 (April-December) from US$ 80.1 billion in the correspondingperiod of the previous year. Trade deficit reached apeak of US $ 118.4 billion in 2008-09 and moderatedto US $ 109.6 billion in 2009-10. With lower levels ofsurpluses on the invisibles balance, the relativelyhigher import growth compared to export growth inthe first half of 2010-11 raised concerns ofunsustainable current account deficit levels. Withimport growth slowing down from October 2010 andexports picking up in November 2010, the concernson the trade deficit have been allayed; the concernson the moderation in levels of invisibles surplusremain as per the latest data on balance of payments(BoP), which are for April-September 2010 and needto be closely monitored.
BoP developments
Invisibles key to reduced deficit on the currentaccount; capital flows easily absorbed withoutforex market intervention
1.45 The net invisibles surplus (invisibles receiptsminus payments) was lower at US$ 39.1 billionduring the first half of 2010-11 vis-a-vis US$ 42.5
billion during the first half of 2009-10. The lowerinvisible surplus combined with higher trade deficitresulted in widening of the current account deficit toUS$ 27.9 billion during the first half of 2010-11compared to US$ 13.3 billion in the first half of 2009-10. With merchandise trade indicators showingmoderation in trade deficit, performance in transfersand information technology (IT) and IT-enabledservices (ITeS) holds the key to anchoring theelevated levels of current account deficit tosustainable levels.
1.46 Net capital flows at US$ 36.7 billion in thefirst half of 2010-11 were higher as compared to US$23.0 billion in the first half of 2009-10. The increasewas primarily composed of inflow of portfolioinvestment, mainly FIIs, short-term trade credits, andexternal commercial borrowings (ECBs). The largeincrease, however, was considerably offset by themoderation in net FDI inflows to India.Notwithstanding significant increase in net capitalinflows, accretion to reserves during the first half of2010-11 was lower, mainly due to more than doublingof current account deficit over the levels in the firsthalf of 2009-10.
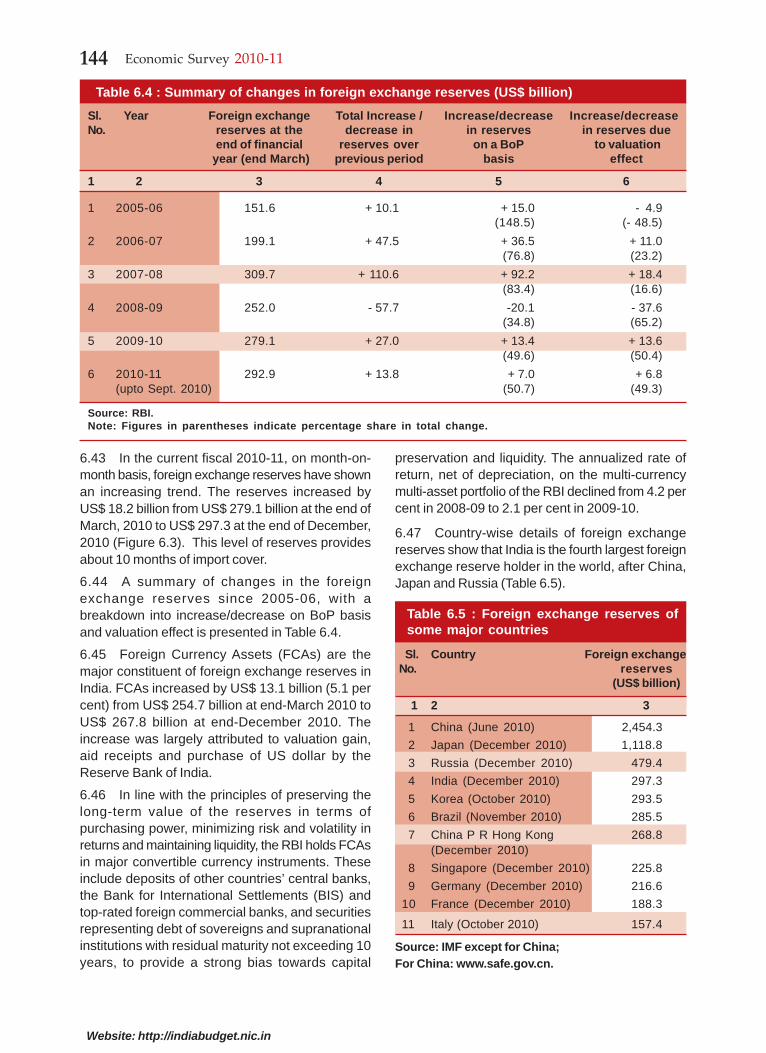
Foreign Exchange Reserves
1.47 Foreign exchange reserves increased fromUS$ 252 billion at the end of March 2009 to US$279.1 billion at the end of March 2010, showing arise of US$ 27.1 billion. Of the total increase, US$13.6 billion was on account of valuation gain (due todecline of the US dollar in the international market)and the remaining US$ 13.5 billion on account ofthe BoP. During the current fiscal, reserves increasedfrom US$ 279.6 billion at the end of April 2010 toUS$ 292.4 billion at the end of November 2010. Thereserves stood at US$ 297.3 billion at the end ofDecember 2010, showing an increase of US$ 18.2billion over the end-March 2010 level mainly onaccount of valuation changes.
Exchange Rate
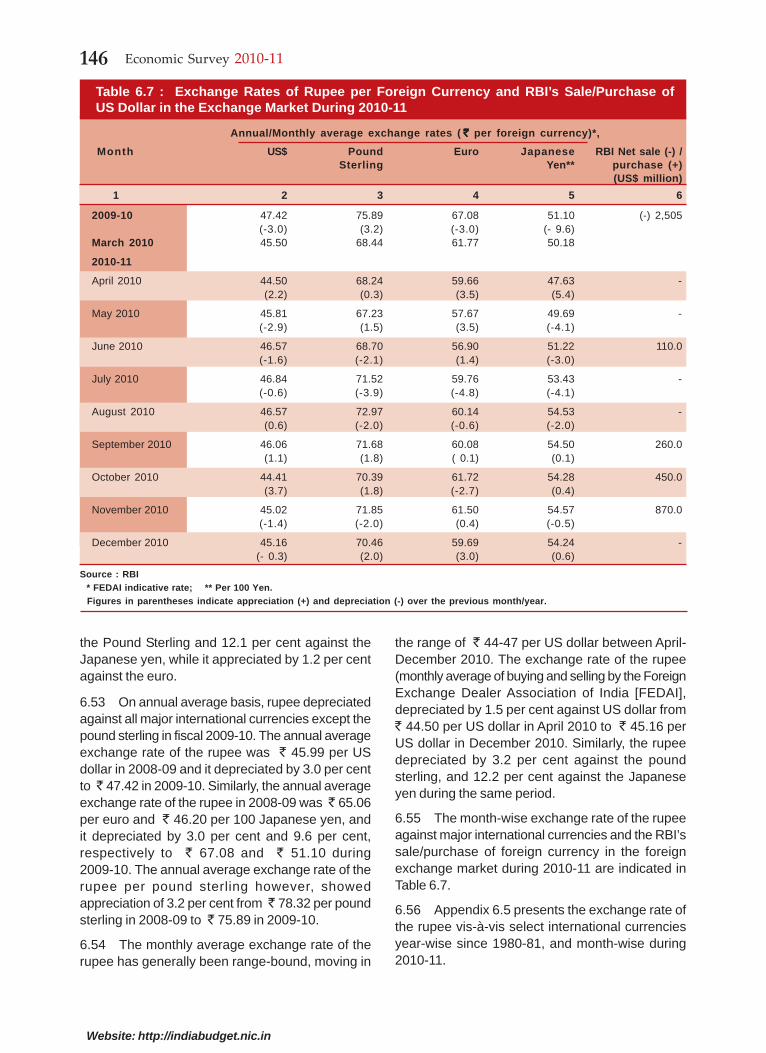
1.48 During the current fiscal, the monthly averageexchange rate of the rupee has generally been rangebound, moving in the range of ̀ 44-47 per US dollarbetween April and December 2010. The exchangerate of the rupee depreciated by 1.5 per cent againstthe US dollar, from ̀ 44.50 per US dollar in April 2010to ̀ 45.16 per US dollar in December 2010. The rupeealso depreciated against other major internationalcurrencies such as the pound sterling (3.2 per cent)and Japanese yen (12.2 per cent) during theperiod.
17State of the Economy and Prospects
Website: http://indiabudget.nic.in
External Debt
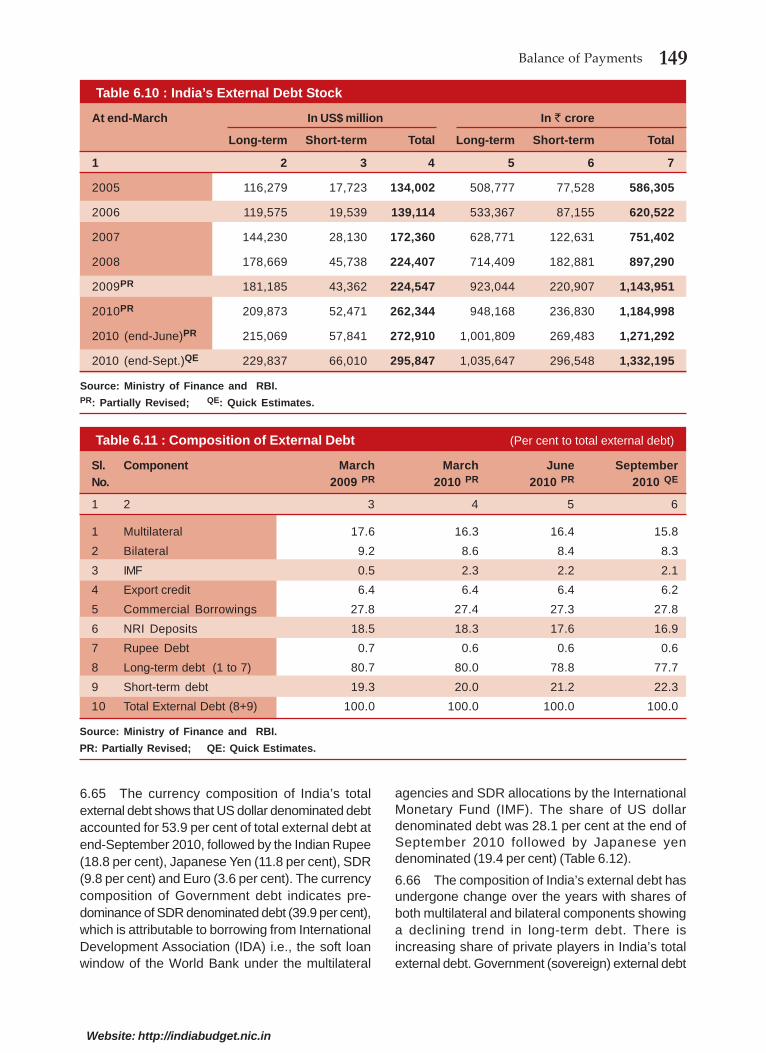
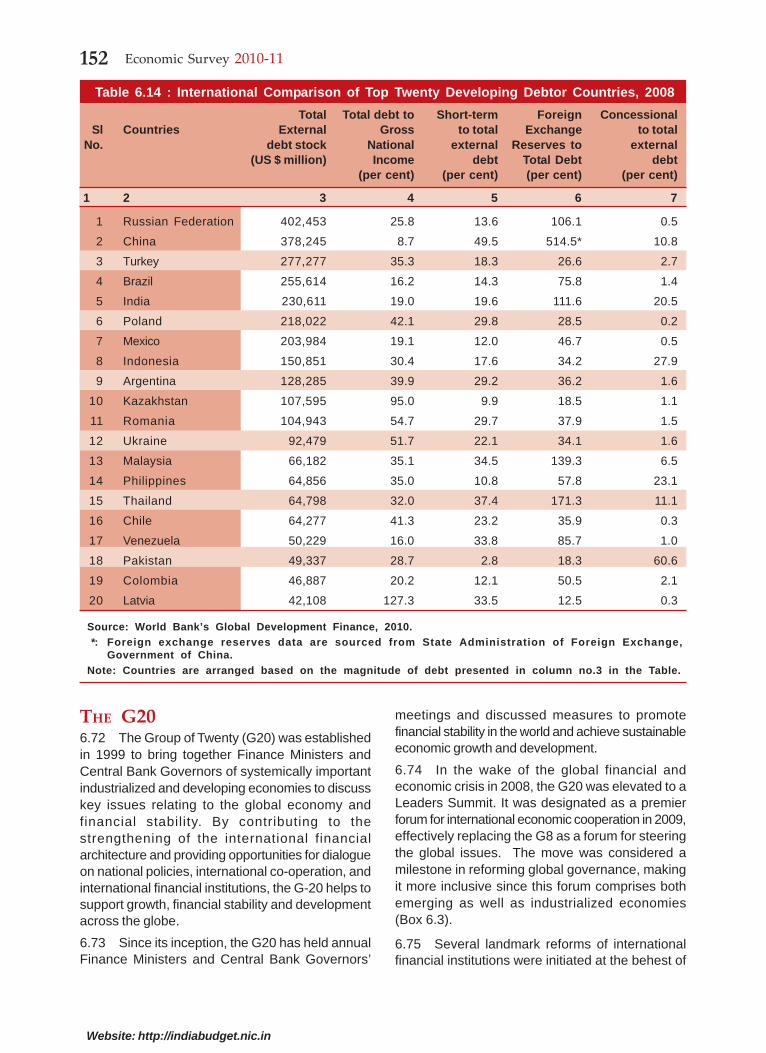
1.49 India’s external debt stood at US$ 295.8 billionat the end of September 2010, recording an increaseof US$ 33.5 billion (12.8 per cent) over the level ofend-March 2010. The rise in debt was largely due tohigher commercial borrowings, short-term tradecredits, and multilateral Government borrowings. Thevaluation effect contributed to an increase of US$6.3 billion in the total increase. The maturity profileof India’s external debt indicates the dominance oflong-term borrowings with long-term debt accountingfor 77.7 per cent of the total external debt at the endof September 2010.
1.50 In 2007-08, a surge in capital flows far inexcess of the absorptive capacity and withimplications for competitiveness had complicatedmonetary management on account of trade-offsinvolving the impossible trinity objectives—of opencapital account, exchange rate stability, andmonetary policy independence. However, withrecovery in 2009-10 and in the current fiscal, theexternal sector broadly remained supportive as theelevated levels of current account deficits were easilyfinanced by rising capital flows; though concerns ofsustainability had emerged. Thus, with orderlyconditions in the forex markets, the external sectorremained supportive of the monetary policy setting.
Monetary and financial sector developments
Monetary policy in tightening mode—fightinginflationary pressure and supportive of growth;some volatility in securities markets with broadstability in financial markets
1.51 The Reserve Bank of India (RBI) had begunthe process of withdrawing from the accommodativepolicy stance in October 2009 itself. In its AnnualMonetary Policy Statement in April 2010, it hadestimated that the economy would grow by 8.0 percent with an upward bias and that inflation as perthe WPI would decline to a level of 5.5 per cent byend-March 2011. The Policy Statement sought tobalance the credit demands of the private sector andthe need of Government borrowing as indicated inthe Budget Estimates of 2010-11 with a broad money(M
3) growth of 17.0 per cent. Aggregate deposits of
the scheduled commercial banks (SCBs) wereestimated to grow by 18.0 per cent and credit growthwas placed at 20.0 per cent. Economic events asthey unfolded in the current fiscal in the form of risingfood inflation and the risk of it impinging on inflationaryexpectations, necessitated revisions and, in a series
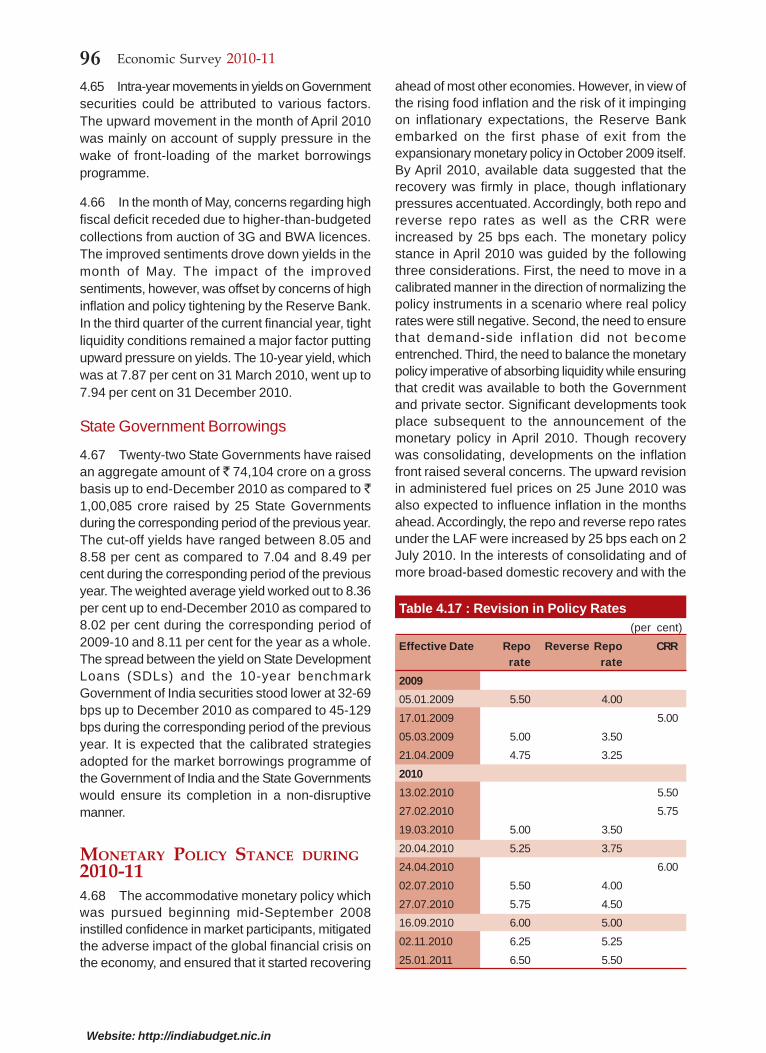
of steps, key policy rates were raised. The RBI raisedthe policy rates six times during the current fiscalwherein the repo rates under its liquidity adjustmentfacility (LAF) was increased cumulatively by 175 basispoints (bps) raising it to 6.5 per cent and the reverserepo rate was increased by 225 bps raising it to 5.5per cent. The cash reserve ratio (CRR) was at 6 percent of net demand and time liabilities (NDTL) ofbanks.
1.52 In its subsequent reviews of the monetarypolicy statement, the RBI has revised growth to 8.5per cent and inflation to 7.0 per cent for end-March2011. During the year 2010-11, the growth in reservemoney (M
0) at 21.6 per cent as on 28 January 2011
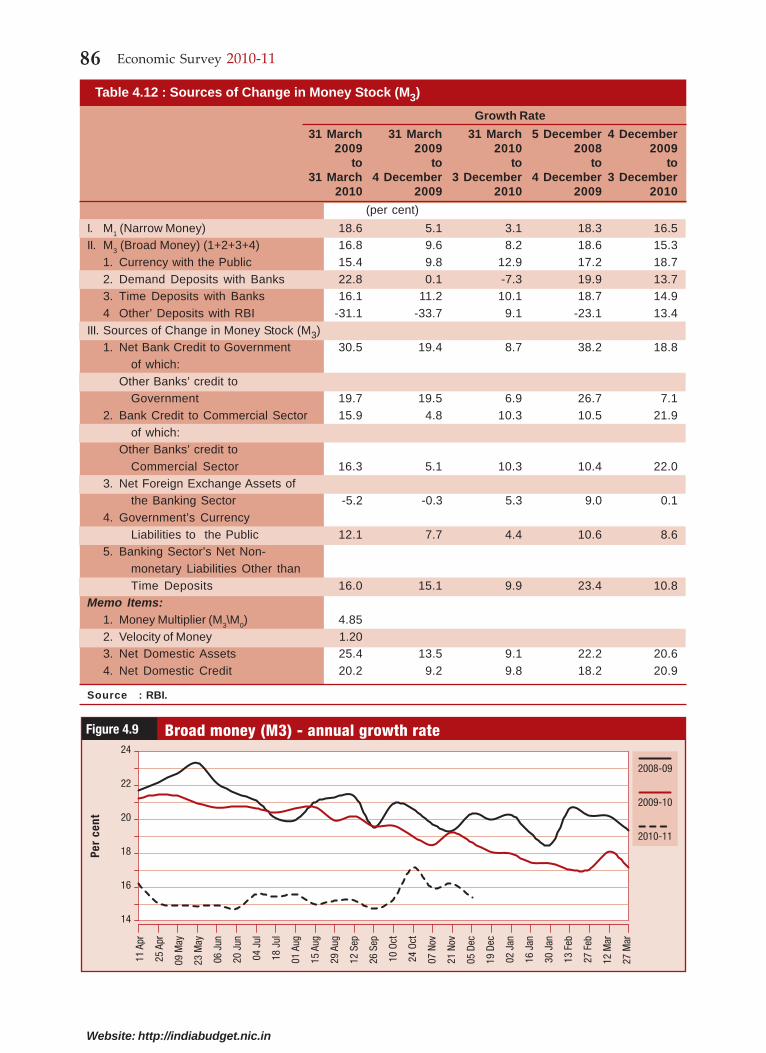
was higher than in the preceding year while broadmoney (M
3) growth was lower at 16.6 per cent as on
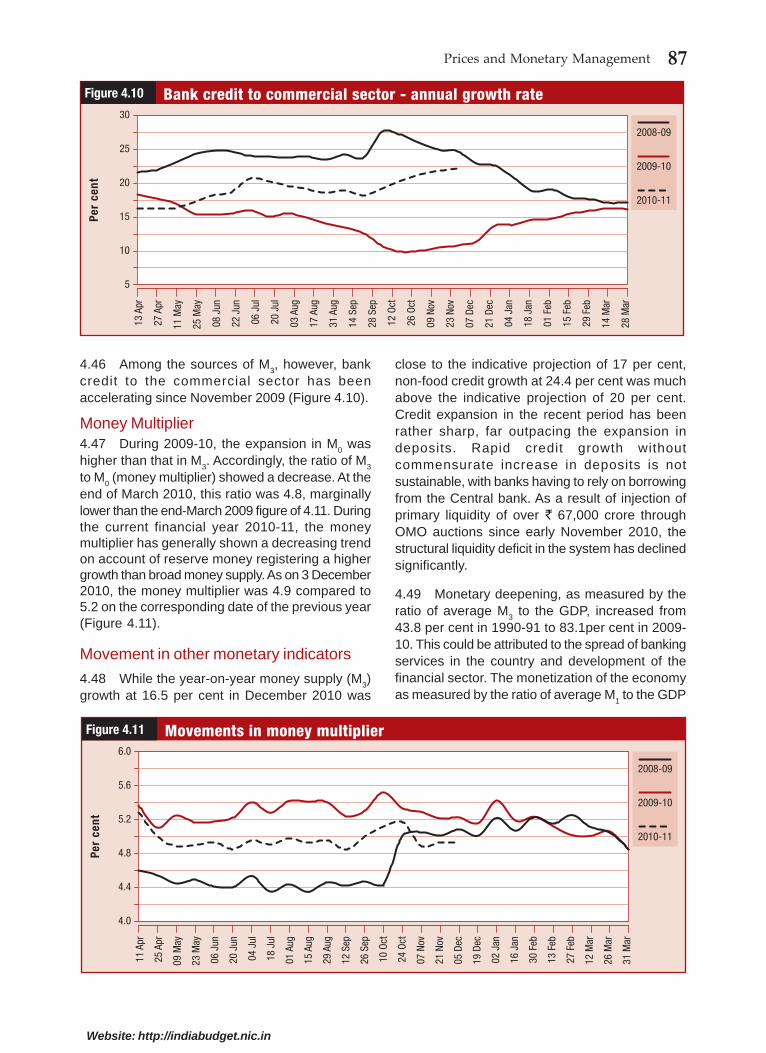
14 January 2011.Year-on-year, non-food credit growthwas up 24 per cent at the end of December 2010and financed many sectors more broadly (from theagriculture rebound to the 3G [third generation]spectrum sales and private infrastructure projects),while the overall credit to GDP ratio rose to about 55per cent, continuing its progress (but still structurallywell below potential).
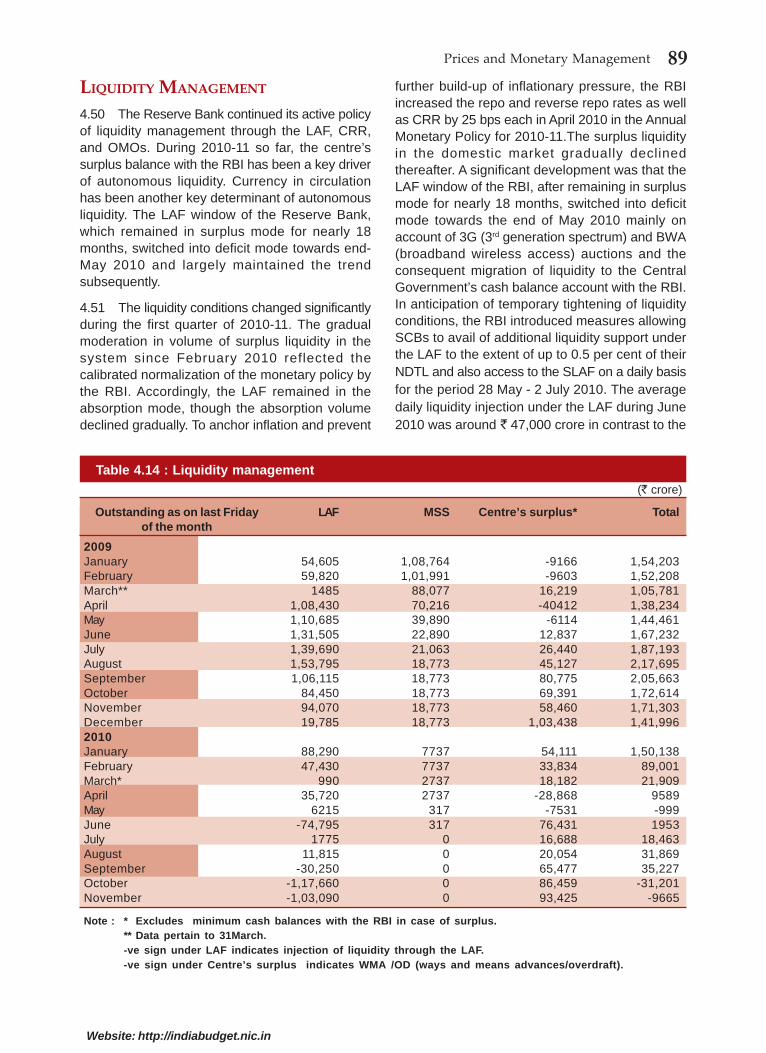
1.53 Reflecting the tightening of the policy ratesand a pickup in credit demand, liquidity conditionstightened. The fiscal began with a gradual decline inthe absorption mode in liquidity conditions ; and aswitch to injection mode in May 2010 mainly onaccount of 3G spectrum and broadband wirelessaccess (BWA) auctions and the resultant rise inCentral Government’s cash balance account withthe RBI . The levels of injection grew in October andNovember 2010. The RBI moved in to address theproblem of such frictional liquidity with a slew ofmeasures like conduct of a special second LAF on29 October and 1 November 2010, conduct of aspecial two-day repo auction under the LAF on 30October 2010, and waiver of penal interest on shortfallin maintenance of the statutory liquidity ratio (SLR)(on 30-31October) to the extent of 1 per cent of NDTLfor availing of additional liquidity support under theLAF.
1.54 Money markets remained orderly in the currentfiscal with the call money rate remaining within theLAF corridor with some overshooting episodes. Therates in the collateralized segments have continuedto move in tandem with the call rate, albeit below it,so far during 2010-11. India’s financial marketscontinued to gain strength in recent years, followingsteady reforms since 1991. Prudent regulations and
18 Economic Survey 2010-11
Website: http://indiabudget.nic.in
institutions protected the economy from the recentglobal financial shocks and its dynamism is nowleading the current recovery. Domestic capitalmarkets performed well in 2010, primary marketsfinancing record levels, including the largest-everinitial public offer (IPO) (for Coal India), whilesecondary markets reached new highs. Recordforeign inflows helped support the market. Pensionsand insurance gained, with life insurance premiumgrowing nearly 26 per cent and penetration doublingto 5.4 per cent of the GDP in 2009, from 2.3 per centin 2000 (when insurance reforms started). Lookingto the future, the twin challenges are to continuethis ongoing progress on gradual financial reform andmodernize regulations and institutions to ensure itscontinued safety and stability.
1.55 The past year saw banking deposit growthslow, as real interest rates were depressed, especiallycompared to returns in other fast-recovering assetmarkets (real estate, gold, and stock markets). Thepriority is to considerably extend the reach of bankingto help mobilize more savings, add more depth, andmore efficiently intermediate opportunities, includingthose in the traditional ‘priority’ sectors. To moveahead,(1) financial inclusion needs to be acceleratedas a next crucial step; innovative solutions areneeded in this regard; (2) similar efforts are neededto deepen domestic capital markets and the role ofnon-bank institutions, especially in corporate bondand debt markets; (3) the rapid lowering of fiscaldeficits is needed to help crowd-in suchdevelopments; and (4) the Government and the RBIhave already begun a series of essential regulatoryoverhaul aimed at updating the modern legislationunderlying financial markets and improving macro-prudential safeguards and institutions. We need tocontinue along this path.
Fiscal developments
Fiscal consolidation on track in the currentfiscal; reforms to drive the process in themedium term
1.56 With clear evidence of economic recovery in2009-10 as indicated by the Advance Estimates ofthe GDP, the Budget for 2010-11 resumed the pathof fiscal consolidation with a partial exit from thestimulus measures. As a proportion of the GDP, fiscaldeficit was estimated at 5.5 per cent of the GDP bythe Budget 2010-11 and the Medium Term FiscalPolicy Statement indicated a further reduction to 4.8per cent and 4.1 per cent in 2011-12 and 2012-13.
The fiscal outcome in the first nine months of thecurrent financial year remained broadly on theconsolidation track chalked out by the Budget. Withgrowth reverting to pre-crisis levels in the currentfiscal, revenues remaining buoyant, and a muchhigher than budgeted realization in non-tax revenuesarising from telecom 3G/ BWA auctions, there washeadroom for higher levels of expenditure at the givenfiscal deficit targets.
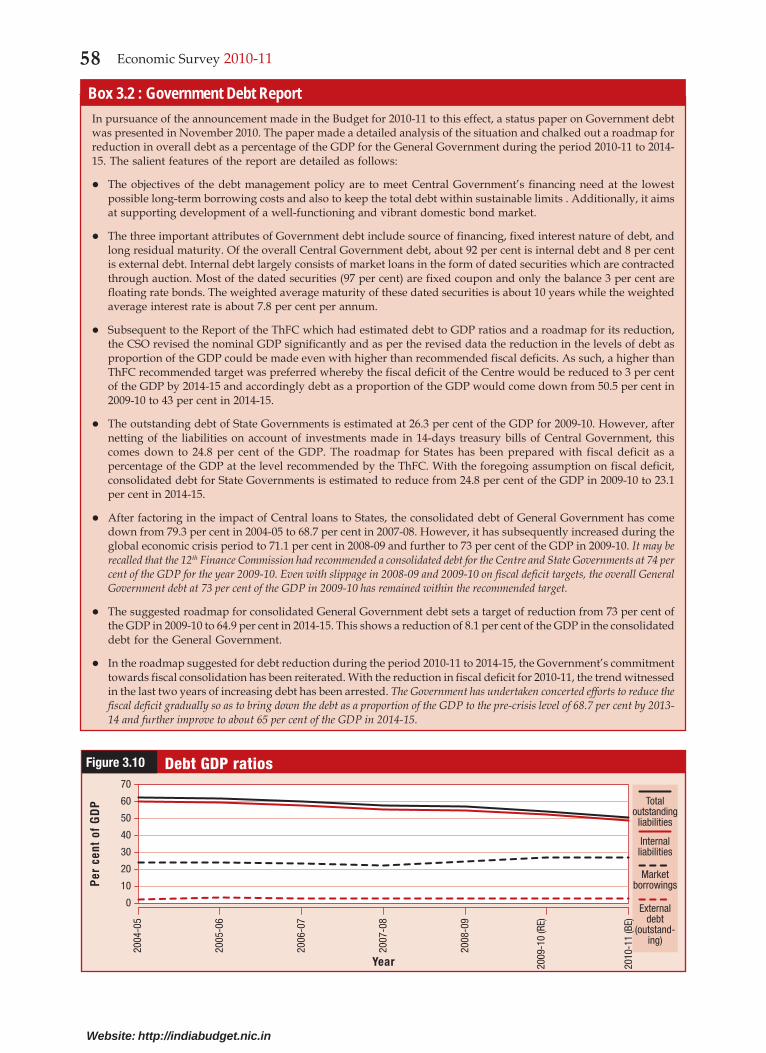
1.57 The Budget for 2010-11 followed up on theThirteenth Finance Commission (ThFC)recommendations on limiting the combined publicdebt to GDP ratio to 68 per cent by 2014-15 with apromise to analyse the issues in a Status Paper,which would also unveil the roadmap for the reduction.In pursuance of the announcement made in theBudget for 2010-11 to this effect, a status paper ongovernment debt was presented in November 2010.The paper made a detailed analysis of the situationand chalked out a roadmap for reduction in overalldebt as a percentage of the GDP for the GeneralGovernment during the period 2010-11 to 2014-15.The Centre’s debt was projected to come down to43 per cent of the GDP in 2014-15 when the fiscaldeficit would be limited to 3.0 per cent of the GDP.With combined debt of the State Governmentsestimated to decline from 24.8 per cent of the GDPin 2009-10 to 23.1 per cent in 2014-15, consolidatedGeneral Government debt was estimated to comedown from 73 per cent of the GDP in 2009-10 to64.9 per cent in 2014-15. The recent Budgets hadindicated the reform measures that would drive theprocess, which included subsidy reforms in fertilizersand petroleum and public expenditure management,besides the tax reforms that are on the anvil.
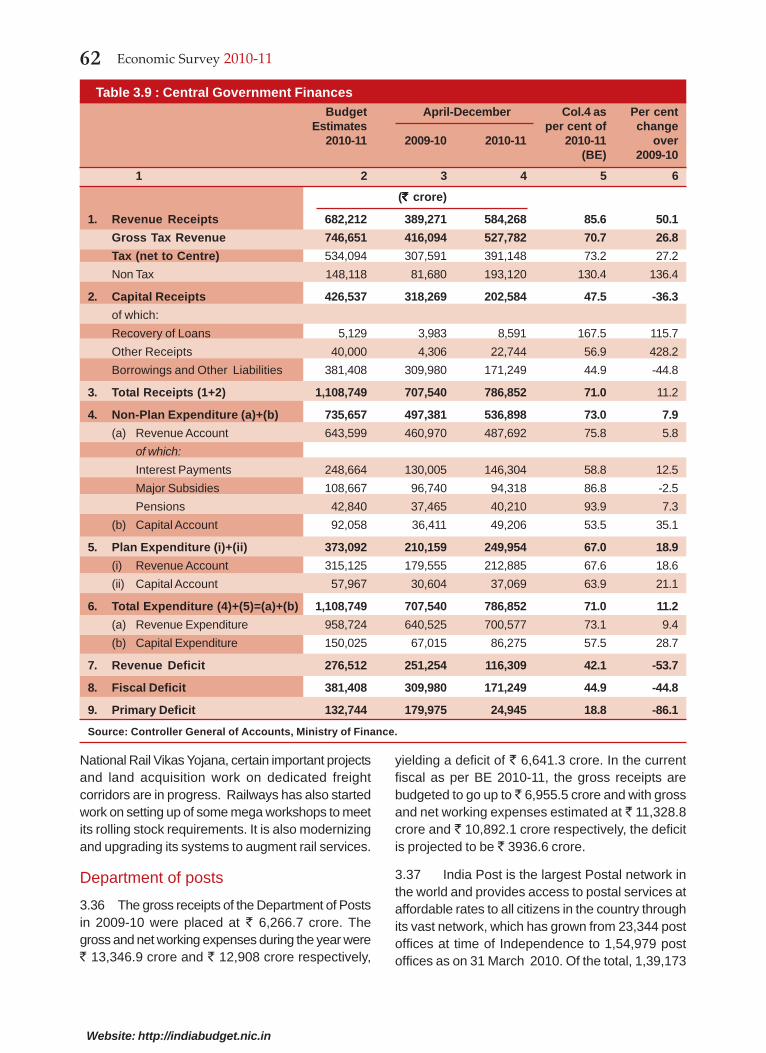
1.58 The fiscal outcome in the first nine months ofthe current financial year being robust, there washeadroom for higher levels of expenditure at the givenfiscal deficit targets. In the first nine months of thecurrent fiscal,with year-on-year growth in totalexpenditure at 11.2 per cent as against a level of 8.5per cent envisaged for the full year by the BudgetEstimates for 2010-11, fiscal and revenue deficitsare placed at ` 171,249 crore and `116,309 crorerespectively, which constituted 44.9 per cent and42.1 per cent of the Budget Estimates. With nominalGDP placed at ̀ 78,77,947 crore for the year by theAdvance Estimates of the CSO, the target for thecurrent fiscal in terms of the fiscal deficit to GDPratio is placed at 4.8 per cent and in terms of revenuedeficit at 3.5 per cent.
19State of the Economy and Prospects
Website: http://indiabudget.nic.in
Social-sector developments
Focus on aam aadmi and higher funds forflagship programmes; implementation key torealizing the desired outcomes
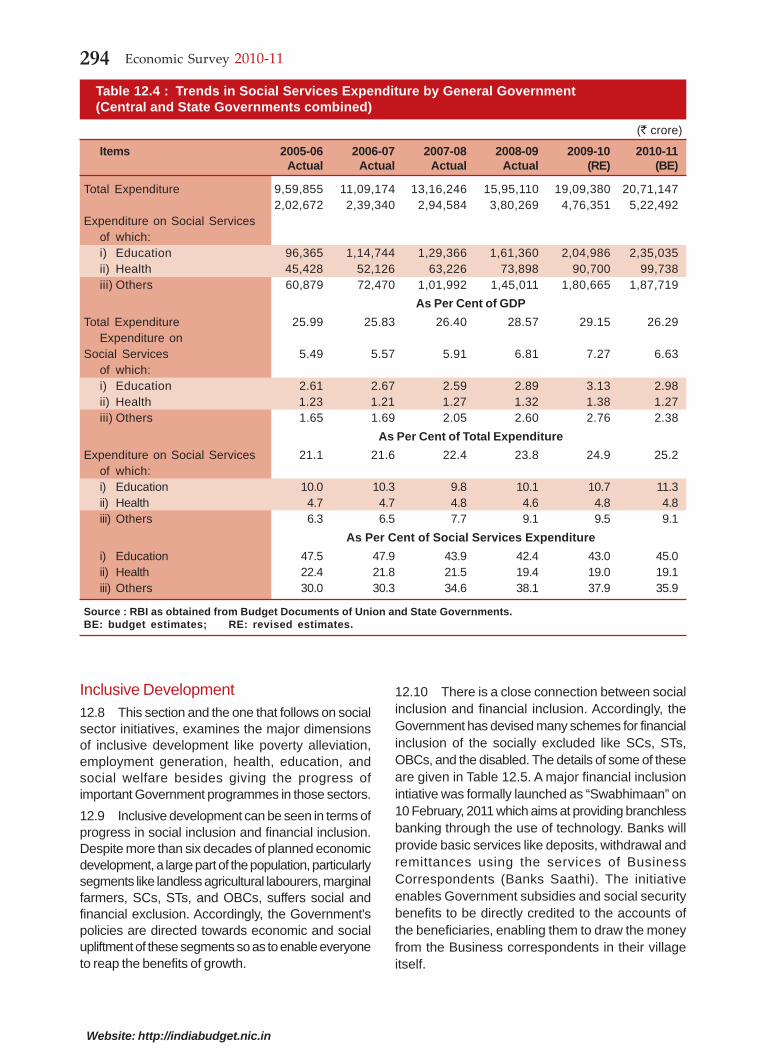
1.59 The Budget for 2010-11 had indicated thatinclusive development is an act of faith for thegovernment. The entitlements for individuals backedby legal guarantees provide ample testimony to thiseffect. Social-sector spending has progressively beenstepped up and it stood at 37 per cent of the totalplan outlay in 2010-11. Sector-specific priorities ofthe Government are reflected in the continued higherbudgetary allocations in areas like rural development,education, medical and public health, family welfare,water supply and sanitation, housing, urbandevelopment, and welfare of Scheduled Castes(SCs), Scheduled Tribes (STs), and other BackwardClasses (OBCs). The share of Central Governmentexpenditure on social services including ruraldevelopment in total expenditure (Plan and non-Plan)has increased from 13.75 per cent in 2005-06 to19.27 per cent in 2010-11 (Budget Estimates).Similarly, the expenditure on social services by theGeneral Government (Centre and States combined)has also shown increase in recent years reflectinghigher priority to social services. The expenditureon social services as a proportion of total expenditurehas increased from 21.1 per cent in 2005-06 to 23.8per cent in 2008-09 and further to 25.2 per cent in2010-11 (Budget Estimates).
1.60 On the employment front, the country hasbeen able to withstand the adverse impact of theglobal crisis and generate employment since July2009 as reported in the quarterly quick employmentsurveys conducted by the Labour Bureau. Theupward trend in employment has been continuouslyobserved since July 2009. During the quarter July toSeptember 2010, the overall employment has beenestimated to have increased by 4.35 lakh. Acomparison of the results of the last four quarterlysurveys, i.e. September 2010 over September 2009,indicates that overall employment has increased by12.96 lakh, with the highest increase of 9.36 lakh inIT/business process outsourcing (BPO), followed by0.79 lakh in textiles, 0.99 lakh in metals, 1.15 lakhin automobiles, and 0.39 lakh in gems andjewellery.
1.61 The progress under the MGNREGA thatguarantees wage employment on an unprecedentedscale has been satisfactory. During 2009-10, 5.26
crore households were provided employment underthis scheme as against more than 4.51 crore during2008-09. During 2010-11, about 4.10 crorehouseholds have been provided employment tillDecember 2010. Out of the 145 crore person dayscreated under the scheme during this period, 23 percent and 17 per cent were accounted for by SC andST population respectively and 50 per cent bywomen.
1.62 The Sarva Shiksha Abhiyan (SSA) beingimplemented in partnership with the States foraddressing the needs of children in the age group of6-14 years seeks, inter alia: enrolment of all childrenin school; setting up of Education Guarantee Centres(EGC), Alternate Schools, ‘Back-to-School’ camps;retention of all children till the upper primary stageby 2010; bridging of gender and social category gapsin enrolment with retention and learning; andensuring that there is significant enhancement inthe learning achievement levels of children at theprimary and upper primary stage. The achievementsunder the SSA till September 2010 include 3,09,727new schools, construction of 2,54,935 schoolbuildings, 11,66,868 additional classrooms, 1,90,961drinking water facilities, and 3,47,857 toilets, supplyof free textbooks to 8.70 crore children, andappointment of 11.13 lakh teachers. Around 14.02lakh teachers received in-service training under thisprogramme. There has been a significant reductionin the number of out-of-school children on accountof SSA interventions.
1.63 The National Rural Health Mission (NRHM)was launched in 2005 to provide accessible,affordable, and accountable quality health servicesto the rural areas with emphasis on poor personsand remote areas. It is being operationalizedthroughout the country, with special focus on 18States which include 8 Empowered Action GroupStates (Bihar, Jharkhand, Madhya Pradesh,Chhattisgarh, Uttar Pradesh, Uttarakhand, Orissa,and Rajasthan), 8 north-eastern States, HimachalPradesh, and Jammu and Kashmir. Theachievements under the NRHM as on September2010, include selection of 8.33 lakh accredited socialhealth activists (ASHAs), employment of 1572specialists, 8284 MBBS doctors, 26,734 StaffNurses, 53,552 auxiliary nurse midwives (ANMs),18,272 paramedics on contract basis and settingup of a total of 16,338 additional primary healthcentres (APHCs), primary health centres (PHCs),community health centres (CHCs) and other sub-district facilities made functional on 24 x 7 basis.
20 Economic Survey 2010-11
Website: http://indiabudget.nic.in
1.64 While the Government has consciouslyundertaken a large increase in budgetary allocationsfor anti-poverty programmes and employmentgeneration schemes, the delivery mechanism needsto be bolstered and streamlined to facilitate theeffective implementation of these programmes. Toensure that allocations result in outputs and outputsin outcomes, initiatives like the outcome budget andthe setting up of the Unique Identification Authorityof India by the Government are steps in the rightdirection.
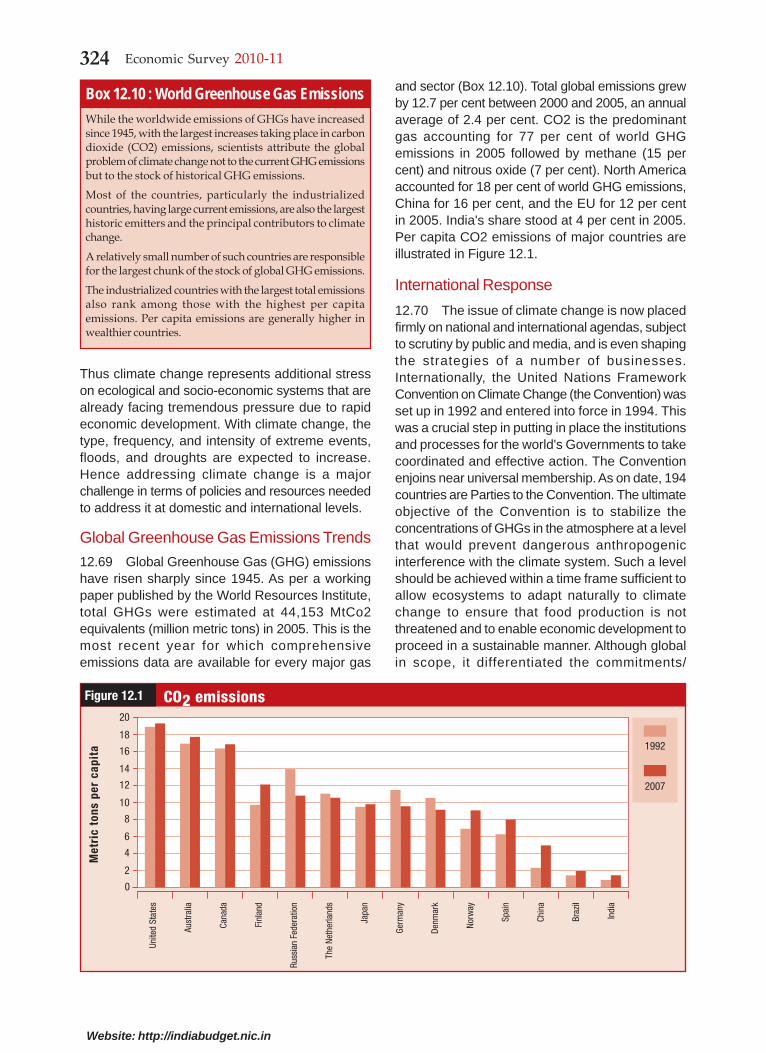
Climate change1.65 Climate Change as a result of greenhousegas (GHG) emissions has been receiving intensepolitical attention at domestic and internationallevels. The industrialized countries have the largesttotal emissions, and India’s share of global GHGemissions is relatively small. Climate change hasenormous implications for India. Various studiesindicate that key sectors impacted by climatechange are agriculture, water, natural ecosystem,biodiversity, and health. This is happening preciselyat a time when India is confronted with hugedevelopment imperatives. A recent India-specificreport warns of impacts such as sea-level rise,increase in cyclonic intensity, reduced crop yield inrainfed crops, stress on livestock, reduction in milkproductivity, increased flooding, and spread ofmalaria.
1.66 Internationally, the United Nations FrameworkConvention on Climate Change (the Convention,entered into force in 1994) aimed to reduce emissionsto sustainable levels and provide support todeveloping countries in terms of finance andtechnology. The Convention led to the adoption ofthe Kyoto Protocol in 1997.The Conference of Parties(CoP), which is the supreme body of the Convention,meets annually; during the 13th CoP held at Bali,Indonesia, in December 2007, a comprehensiveprogramme called the Bali Action Plan waslaunched, followed by the ‘Copenhagen Accord’ inDecember 2009. The most recent negotiations heldat Cancun during 29 November – 11 December 2010have resulted in further decisions including mitigationadaptation, technology, and finance. The CancunAgreements are widely perceived as a modest, smallstep forward and a reaffirmation of faith in themultilateral process. Decisions were taken atCancun to set up a Green Climate Fund, aTechnology Mechanism, and an AdaptationCommittee at global level to support developingcountry actions for adaptation and mitigation.
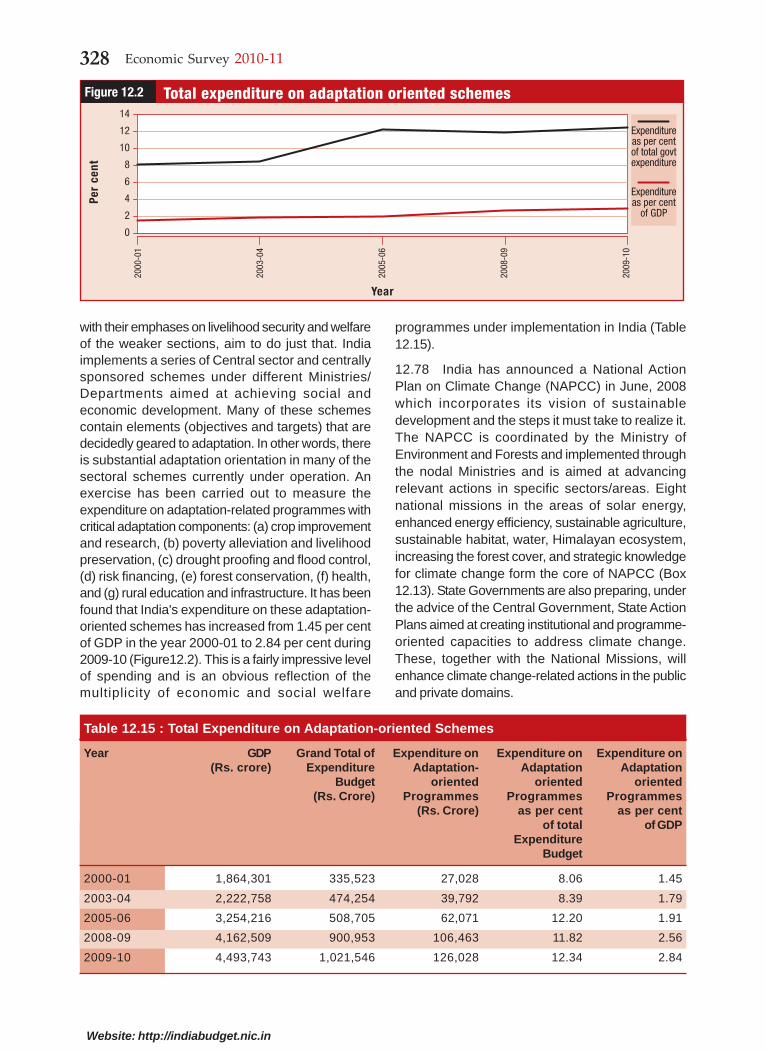
1.67 India’s determination in addressing climatechange is evident from an indicative target ofincreasing energy efficiency by 20 per cent by 2016,now supplemented with the domestic mitigation goalof reducing emissions intensity of the GDP by 20-25 per cent of the 2005 level by 2020 throughproactive policies. The resources required to achievethis objective will need to be mobilized from varioussources. Studies in respect of a low carbon strategyare under way as one of the key pillars of the TwelfthFive Year Plan. Second, India is taking conscioussteps for diversifying the energy fuel mix such assetting up of 20,000 MW of solar power-generatingcapacity by 2022, doubling the present 3 per centshare of nuclear power in the energy mix over thenext decade, putting in place a major market-basedprogramme to stimulate energy efficiency, imposingclean energy cess on coal for funding R&D of cleanenergy technologies even though coal will continueto play a key role in our future energy strategy, andaggressively expanding the use of natural gas inpower production. Third, India has been pursuingaggressive strategies for forestry and has launcheda major new programme on coastal zonemanagement to address the adaptation challengesfacing over 300 million people in our country who livein vulnerable areas near our coast. In addition, Indiaimplements a number of Central sector and Centrallysponsored schemes with many elements decidedlygeared to adaptation. An exercise carried out for thisSurvey suggests India’s expenditure on theseadaptation-oriented schemes has increasedimpressively from 1.45 per cent of the GDP in theyear 2000-01 to 2.82 per cent during 2009-10. Indiahas also announced a National Action Plan onClimate Change (NAPCC) in June 2008—includingeight national missions in the areas of solar energy,enhanced energy efficiency, sustainable agriculture,sustainable habitat, water, Himalayan ecosystem,increasing the forest cover, and strategic knowledgefor climate change. State Action Plans are also underway
1.68 All actions to address climate changeultimately involve costs. Funding is vital in order forcountries like India to design and implementadaptation and mitigation plans and projects. Oneof the important outcomes of the Cancun Agreementsis the decision on ‘fast start finance, long-termfinance, and Green Climate Fund’. It was decided toset up a ‘Green Climate Fund’, approaching US$30billion, for the period 2010-12, to be supported by anindependent Secretariat and designed by a
21State of the Economy and Prospects
Website: http://indiabudget.nic.in
Transitional Committee with 40 members—15 fromdeveloped countries and 25 from developing. It alsorecognized the goal of jointly mobilizing US$ 100billion per year by 2020 as ‘long-term finance’ toaddress the needs of developing countries. The goalof US$100 billion falls short of developing countries’call for assessed contributions of 1.5 per cent ofdeveloped countries’ GDP. Further, developingcountries had been insisting on public funds as themajor source, whereas the Cancun Agreements donot specify how the finances would be mobilized bythe developed countries. In this context, India’sinitiatives will succeed if the global framework ofactions is effective and supportive, includingtechnology development and transfer efforts, builton sound principles of equity and common, butdifferentiated responsibilities.
Prospects, short term and medium term
1.69 Based on the performance of the economyover the last five years and analysis of the underlyingtrends of critical variables, India’s real GDP isexpected to grow by 9 per cent (+/- 0.25) in 2011-12. The Indian economy had grown at above 9 percent for three consecutive years starting in 2005-06.So the economy is expected to revert to pre-crisisgrowth levels next year. The country’s savings andinvestment rates had gone down a little during 2008-09 because of the deliberate decision by theGovernment to encourage consumption as anantidote to the economic downturn. The latest dataon savings and investments, which pertain to 2009-10, show that these rates have turned around. In2009-10 the savings rate was 33.7 per cent, up fromthe previous year’s 32.3 per cent, and the investmentrate had also risen and stood at 36.5 per cent. India’sincremental capital-output ratio (ICOR) is estimatedto be 4.1 for the Eleventh Plan. Given that theeconomy still has excess capacity, these twoindicators lead to a projection of GDP growth justshort of 9 per cent. Since savings and investmentsnow show a positive momentum and the Governmentis implementing a gradual exit from the stimuluspackage, the savings and investment rates are likelyto rise further. Hence it is expected that theeconomy’s growth will breach the 9 per cent mark in2011-12.
1.70 Growth forecasts and, for that matter, allforecasts in life, however carefully made, are subjectto error. A sharp deterioration in weather conditionsor a disproportionate spike in the price of crude
petroleum can lead to slower growth. Equally, asudden movement of these variables in a favourabledirection can give a boost to the growth rate. Apartfrom the factors just mentioned, it should be pointedout that a certain amount of uncertainty continuesto prevail over the economic conditions in Europeand the USA. Japan also has not yet shown definitesigns of recovery from its long slowdown. The fiscalsituation and level of sovereign debt in a large numberof these industrialized nations are also in a somewhattenuous situation. While India’s growing trade andfinance links with emerging economies provide someinsurance against a downturn in industrializednations, our economy has vital links with theindustrialized nations. Hence India will be adverselyhit in the event of a serious crisis in any of themajor industrialized nations. However, theexpectation is that there will not be a seriousdownturn in industrialized nations; or, moreaccurately, a second dip recession is a very lowprobability event. Hence the point expectation forIndia’s growth is 9 per cent.
1.71 Looking further, into the medium to long term,the expectation is that India’s pace of economicdevelopment will pick up even more. There are tworeasons for this expectation. Given the momentumin the savings and investment rates and also thefact that India’s demographic dividend is yet to peakand there is evidence that the savings rate for theworking- age population of India, especially for thosein the 30s and 40s, is disproportionately high, theratio of investment to ICOR is expected to rise in thenext half to one decade. Further, the fraction ofinvestment that is going towards building upinfrastructure has been rising. The importance ofinfrastructure for sustainable and inclusivedevelopment is now well recognized and the PlanningCommission is scheduling to give this a large boostin the Twelfth Five Year Plan.
1.72 It is known that once an economy begins tooperate close to its capacity, the savings andinvestment rates are no longer such effective driversof GDP growth. Growth then depends much moreon skill development and innovative activity in thecountry. Fortunately, there is awareness of this inIndia and efforts are afoot in terms of budgetaryallocation and actual initiatives to boost thedevelopment of skill and human capital. Innovativeactivity in a nation is difficult to measure but, judgingby patenting activity, there seems to be a pickup inresearch and innovation in India. Patent applications
22 Economic Survey 2010-11
Website: http://indiabudget.nic.in
used, traditionally, to be few and far between. Thereis, however, a sharp rise in this over the last fewyears. In 2004-05, 17,466 patents were filed and 1911granted. In contrast, in 2008-09, 36,812 patents werefiled and 16,061 granted. There are also initiatives tobolster India’s higher education system, includinguniversities, institutes of technology, and centres of
research. It is expected that these initiatives willgather steam and more than make up for eventuallywaning power of the savings rate as a driver ofeconomic growth. As a consequence, the next twodecades should see the Indian economy growingfaster than it has done any time in the past and alsofaster than the growth in the next two years.
Micro-foundations ofMacroeconomic Development CHAPTER
2
INCLUSIVE GROWTH AND INFLATION
2.2 This has been a difficult year in terms ofinflation, even though the overall trend of inflationhas been downwards. Inflation peaked around Marchand April 2010 and has since been on a downwardtrend despite a disturbing turnaround in December2010. Inflation in India is measured by a wholesaleprice index (WPI) and four different consumer priceindices (CPIs) for various categories of consumers.Interestingly, measured by all five price indices, itwas in single digits from October 2010. This hadnot happened since April 2009. Till September 2010,for 17 months, one or the other inflation index hasbeen in double digits. In fact, from March 2010 toJuly 2010 all five indices showed double-digit inflation.
So clearly there has been an easing of the overallinflationary situation even though the recent spikein food prices is a cause for concern and will beaddressed in this and other chapters. On the otherhand, the high growth that India has achieved thisyear, when much of the industrialized world is stillteetering on the brink of a possible second dip, isremarkable. As always with high growth, this is alsoa moment of opportunities. This is the time whenwe have to make sure that the economy builds upstrengths—fiscal, infrastructural and more—so thatnot only do we improve our current standard of living,we also accumulate resources and create fiscalspace for bad times that may come our way in thefuture. In short, a part of the current recovery mustbe stored away to build future resilience.
This has been a classic year of economic recovery for India. The economy remainedon the path of rapid resurgence which began in 2009-10 and has virtually returnedto the high growth path that it had achieved during 2005-08, before the globalfinancial crisis and economic meltdown. India’s growth story this year has beenremarkable by any standards. What makes it even more significant is that this ishappening on the heels of a year in which growth was a robust 8 per cent; so there isno base effect to lay claims on this year’s achievement. Further, as discussed in Chapter1, the growth prospect over the medium to long term looks excellent. However, asoften happens with strong recovery, the economy has come under strain from highinflation. Since the growth is in real terms, the average person has the cushion ofmore goods and services. Nevertheless, inflation, especially when it is centred onfood, as has been the case in recent times in India, can be a cause of considerabledistress for the common man and woman. Not surprisingly, a substantial part ofthis chapter addresses the subject of inflation. Price rise is discussed both as a matterof overall demand management and from the point of view of productivity andmarketing. The chapter also comments at some length on the efficiency of financialintermediation. Economic analysts often treat growth and development as rooted ineconomic policy alone. In reality, much depends on the social, political, andinstitutional milieu. Crafting good policy entails taking proper account of this. Thechapter closes with a discussion of these extra-economic catalysts of economicdevelopment.
24 Economic Survey 2010-11
Website: http://indiabudget.nic.in
2.3 When growth is as high as it has been for Indiathis year, if it were the case that all segments of thepopulation were partaking in the growth in exactlythe same way, then inflation would not be a matterof great concern. This is because the growth beingreal, everybody is better off and the inflation doesnot take away anything from this. It is when theaverage growth is unevenly distributed that we haveto worry about the worse-off and vulnerable segmentsof society. Hypothetically it is possible that whilethe average Indian is better off by the per capitaincome growth of approximately 7 per cent per annumthat the country has had, some poor people areactually worse off because their nominal incomeshave hardly grown and inflation has negated thatgrowth. Given India’s objective of inclusive growth,this is a matter of concern.
2.4 According to the unit level data of the NSSO2004-05 round of monthly consumption expenditure,based on uniform recall period, the bottom quintileof India’s rural population devotes approximately 67%of their aggregate household expenditure on food.Since food price inflation during much of the yearhas been over 10 per cent, it is possible that someof these people are worse off, despite the high realgross domestic product growth (GDP) growth. Theway this has to be handled is by developing strongersystems of food security for the poor, more effectivesystems of providing cheap fertilizer to small farmers,dependable micro credit to poor households in ruraland urban areas, and basic health support and othersuch services. There are several initiatives afoot inIndia right now to make sure that not only do we tryto control inflation, we also try to put these supportivepolicy structures in place so that the vulnerablesegments of India’s population are protected fromthe ravages of inflation. These policies are importantbecause, though the Government aims to bring downinflation further, there may be reason to expect thatin the medium term we will have to live with a littlehigher inflation than the 3 per cent or so that weused to have in earlier years.
2.5 In designing inflation control measures it isimportant to be aware that sudden, sharp policy-induced contractions in demand can causeunemployment to rise. Given that India’s inflationdata are remarkably comprehensive and arepublished on a weekly and monthly basis, whereasour employment statistics come out with longintervals and time-lag, the trade-off between inflationand employment escapes public awareness andslants discourse. There is however, enough evidencefrom around the world that, at least in the short run,there is a negative relation between inflation andunemployment. This is what makes it critical forgovernment to carefully calibrate the demandmanagement measures when bringing down inflation.There is no known formula for doing this. This has to
be based on the comprehensive study of availablestatistics, the lessons of economic theory and, notleast, judgement.
2.6 Recognizing the complex nature of inflation,with roots in domestic and international factors, theGovernment has set up an inter-ministerial group(IMG), under the chairmanship of the Chief EconomicAdviser, Ministry of Finance, to “review trends inoverall inflation, with particular reference to primaryfood articles,” and “make recommendations for actionon fiscal, monetary, administrative and other fronts.”In the mean time, in understanding and analysinginflation, it is important to distinguish between twodifferent kinds of phenomena. The first is a short-term relative price rise in a couple of commoditiesand the second is a sustained overall price increase.In fact, in much of standard economics, the formeris not even called inflation. The latter, on the otherhand, is classic inflation and calls for standardremedies involving monetary and fiscal policies. Thisis not to deny that relative price adjustments can bea contributory factor in a country’s overall inflation.However, these two kinds of phenomena call for verydifferent kinds of policy interventions. To begin withthe phenomenon of sustained overall price increaseor inflation, it is important to note an interestingconnection between inclusion and inflation. Whilethe Reserve Bank of India (RBI) controls the totalamount of currency in the economy and the Ministryof Finance, Government of India (GOI), controls thefiscal and revenue deficits, what is not oftenunderstood is that inflation depends on overall liquidityin the economy, and that can be affected by thedecisions and behaviour of firms, farms, corporations,and ordinary citizens.
2.7 As Figure 2.1 shows, Indians continue to holda lot of their savings as cash. In rural India, around42 per cent of savings are held as cash. In thisenvironment, once we initiate policies for financialinclusion and help people open bank accounts andput their money in the accounts, we will be bringingmoney that was earlier lying dormant into circulation.In the old set-up where lots of Indians, especially inrural areas, kept their savings as cash in their homes,the Government and the RBI had the freedom toindulge in an additional amount of spending withoutthis giving rise to inflationary pressures. This is acase of one person’s decision not to put his moneyinto circulation enabling another agent to put hermoney into circulation without causing inflationarypressures. Once people are financially included, thatis, they put away their money in banks and mutualfunds, this money goes into circulation. Hence, thetotal effective money supply in the economy goesup. In this situation, even if there is no change in thebehaviour of the RBI and GOI, there will be inflationarypressure. There is evidence from around the worldthat monetization of the economy and the desirable
25Micro-foundations of Macroeconomic Development
Website: http://indiabudget.nic.in
objective of bringing more and more people intosystems of modern money management contributeto the overall pressure on prices. This is a case ofone good development, namely, greater financialinclusion, having an undesired consequence, to wit,a greater inflationary propensity. This must not deterus from pursuing financial inclusion since the overallbenefit of this can be enormous. What is beingpointed out is the need to be aware of all its fall-outs, and take appropriate action against possiblenegative side effects.
2.8 An analysis of India’s recent monetary andliquidity conditions lends credence to the foregoinganalysis. Overall money supply seems to be wellunder control. In 2010-11 (year on year, up to 31
tolerated well by the real economy. The inflation thatoccurred despite these features point to the possiblerole of other non-central bank factors.
2.9 The other route through which a desirablechange can have the adverse effect of creatinginflationary pressures in an emerging economy isintegration with the global economy and, moregenerally, globalization. It is well-known that in poorcountries, the purchasing power parity (PPP) is low.In other words, the kind of living standard one canachieve in a poor country with 100 dollars isconsiderably higher than what one can achieve withthe same money in the United States, Europe, orany other industrialized nation. Currently, India’s PPPcorrection factor is 2.9. In other words, what a person
December) broad money (M3) growth was 16.5 per
cent. This is not only reasonable but it is less thanthe growth in the previous year, which was 17.9 percent. Narrow money (M
1) also grew less in 2010-11
compared to 2009-10. This year (year on year, up to31 December) the growth was 15.5 per cent andlast year the growth was 17.9 per cent). During thisyear currency growth has been greater than depositgrowth, resulting in a higher currency to deposit ratio.Also, during the year the growth in bank credit toGovernment has also gone down. The demand forliquidity is evident from the fact that the repo rateemerged as the operative policy rate, at least formost of the latter part of the calendar year 2010.This shows that the raising of the repo rate was being
in India can buy with 100 dollars will typically require290 dollars in the US. We also know that by thetime a country becomes industrialized, the PPPcorrection has to be smaller. This happens partlybecause of exchange rate changes but moresubstantially because the prices of basic non-tradedgoods and unskilled labour in the formerly poorcountry rise and partly catch up with prices inindustrialized nations.
2.10 The most major break for the Indian economyoccurred with the far-reaching economic reforms ofthe early 1990s. From 1994 India was clearly on ahigher growth path than ever before. The next bigstep up in growth happened in 2005. If India keepsup the high growth rate it has had from 2005, it will
0
10
20
30
40
50
60
70
80
90
100
Rural
Per
cent
of
cash
sav
ing
Prefered form of cash savingsby location
Figure 2.1
Urban
Others
Post office
Banks
Keeping athome
41.7
23.4
45.3
62.6
5.4 4.2
7.6 9.7
Source: National Council for Applied Economic Research–Center for Macro ConsumerResearch (NCAER-CMCR), NSHIE, analysis from Rajesh Shukla (2010), How IndiaEarns, Spends and Saves: Unmasking the Real India, Sage Publications, New Delhi.
26 Economic Survey 2010-11
Website: http://indiabudget.nic.in
mean that the real per capita income of Indians willrise from the current level of approximately 1300dollars per annum to 10,000 dollars in 2039. Usingthe data on PPP corrections needed for countriesjust above the 10,000 dollar benchmark, we wouldexpect India’s average dollar prices to rise (see Box2.1). If this happened entirely through the adjustmentof prices with no change in real exchange rate, wewould have an additional 2 per cent per annuminflation rate. In reality, there could be someexchange rate adjustment as well, though cross-country data suggest this is dominated by the priceadjustment. If simply as a rule of thumb, we takethree-fourths of this to be determined by priceadjustment, this will mean that we will, over the next30 years, have an inflation rate that is 1.5 percentagepoints greater than would have been the case in theabsence of this growth spurt. In the yearsimmediately preceding 2003-04, from when GDPgrowth picked up (and went even higher after 2005),the average annual WPI inflation was just below 3.5per cent (it was 3.61 per cent in 2001-02 and 3.38per cent in 2002-03). This implies that, other policiesremaining unchanged, we will have an average annualinflation of nearly 5 per cent during the next decadeor so of the rapid growth that is widely expected tooccur in India. This suggests the need to revisit someof our standard policies for managing inflation, andalso underlines the need to ensure that India’s growthis inclusive and that we have better designedsystems for providing basic security to the vulnerable.
2.11 Around this average inflation, there willcertainly be periods of price spikes and even pricedeclines for different commodities and differentclasses of commodities. The year 2010-11 has beena year of more than one such skewflationary episode.At the beginning of the calendar year 2010 and evenin the first months of the fiscal year 2010-11 inflationwas high for foodgrains, sugar, and pulses. Duringthe course of the year, inflation in these commoditiesstabilized, but by November there was another spikein prices of another set of commodities, led byonions, cabbage, milk, and a couple of otherproducts. While we are often forced to use the bluntinstrument of controlling aggregate demand in theeconomy through monetary and fiscal instruments,these price spikes should be treated as occasion toinvestigate the micro structure of markets, inparticular the production and distribution of goodsfrom farm and factory to retail store and consumer.While political compulsions sometimes obligeGovernment to take short-term measures like banningexports and changing tax rates to correct the price
spikes, it is important to take a longer-run view andbe restrained in the use of such interventions. Weshould use each such inflationary episode to try andlocate and rectify the flaws in the system ofproduction and marketing.
2.12 Before going into this, it is important to stressthat not all price increase should be met withGovernment interventions. Prices rise and fall inresponse to changing demand and supply scenariosin the country. Prices are signals to consumers andproducers to alter their behaviour in response toexogenous changes in the economy. It is notadvisable for Government to step in and flatten outall these price fluctuations. Trying to control theseprice increases by legislating price controls runs therisk of prices being lower but goods vanishing fromstore shelves, as happened in countries which triedthis strategy in the 1970s and 1980s. In other words,we risk having low prices for no goods. Such a policycould also give rise to black markets. When anunwarranted price spike occurs, the need is to seeif there are defects in our marketing system, takeaway lessons, and put corrective measures in placeto prevent a recurrence. Some such food distributionflaws were isolated during the high inflation infoodgrains that occurred from November 2009 to May2010 and corrective measures put in place.
2.13 It can be argued that the sharp hike in theprice of vegetables seen during December 2010 andJanuary 2011, especially of onions, reveals defectsin our food production and marketing systems. Whatcame to light during this period was the greatdifference in prices for the same product at the farmgate and in city retail outlets, and also across differentcities and towns. On 7 January 2011, for instance,onions were selling for ̀ 30 in Agra and 57.5 in Delhi;for ` 35 in Nagpur and 62 in Mumbai; for ` 23 inThiruvananthapuram and 60 in Dindigul. Surely withan efficiently functioning and competitive marketsuch price differentials could not have survived. Whatthese price differentials suggest more than anythingelse is not so much hoarding as the cartelization oftrade resulting in the prevention of entry of newtraders. The problem needs to be tackled using ourCompetition Act 2002.
2.14 When we give free rein to enforcers to checkthese practices in the market and among traders,the tendency often is to lump together a motleycategory of behaviour—hoarding, entry deterrence,and collusive price hikes—and treat them all asmalpractices to be avoided. Yet such indiscriminatelumping together and punishing traders can do more
27Micro-foundations of Macroeconomic Development
Website: http://indiabudget.nic.in
Box 2.1 : The Mechanics of PPP Catch-up and Increases in Price Levels
The concept of PPP catch-up inflation arises from the empirical observation that as countries grow in terms of per capitaGDP the required PPP adjustment appears to become lower (see Figure). Countries with per capita GDPs of around US$850 to 1200 in 2009, like India, Pakistan, Nicaragua, and Vietnam, appear to have an average PPP correction of approximately2.3.1 In comparison, countries with per capita GDPs between US$ 8500 and US$12,000, like Turkey, Uruguay, Mexico, andBrazil, have an average PPP correction of around 1.6. It therefore appears that, as the per capita GDP of a country increases,its PPP correction becomes smaller. This would also indicate that due to this apparent fall in the PPP correction factor, therewould be some increase in prices. For example, in 1980 Brazil had a per capita GDP of US$ 1371 with a PPP correction of2.7. By 2009 it had a per capita GDP of US $ 8220 and a PPP correction of 1.3. India currently has an annual per capita GDPof around US$ 1300 with a PPP correction of 2.9. If it reaches a PPP correction level of 1.6 (average PPP correction ofcountries with per capita GDP US$ 8,500-12,000), over a period of around 30 years it would face an inflation of 2 per centper annum solely on account of this PPP adjustment (provided there is no currency appreciation).
The theoretical basis for this comes from the work of Balassa and Samuelson. As explained by Froot and Rogoff (1995), theBalassa-Samuelson effect posits that ‘after adjusting for exchange rates, CPIs in rich countries will be high relative to thosein poor countries and that CPIs in fast-growing countries will rise relative to CPIs in slow-growing countries.’ Theunderlying mechanism arises from the historical tendency wherein technological progress is faster in the traded goodssector than the non-traded. Rising wages in the traded goods sector lead to rising wages in the entire economy. The non-traded goods producer then needs to raise the relativeprice of non-traded goods to pay the higher wages.
Suppose we consider a basket of goods in India thatcosts ` 5000 today. Given an exchange rate of ` 50 perUS dollar, this costs US$ 100 in India. With a PPPcorrection factor of 2.9, the same basket of goods wouldcost US$ 290 in the US. If in say 30 years there is noinflation in the US, and the PPP correction factor forIndia comes down to around 1.6, the basket costing US$290 would cost approximately US$ 181 in India. If theexchange rate remains at ` 50 per US dollar, the basketwould cost ` 9050. This would imply a PPP catch-upinflation of about 2 per cent per annum for 30 years(compound annual growth rate--CAGR). The otherextreme possibility is that there is no inflation in Indiaand this adjustment occurs only because the ̀ 5000 basket becomes worth US$ 181 because the rupee appreciates to ̀ 27.6per US dollar.
Between these two extreme alternatives, there would be other combinations involving a smaller appreciation and a lowerinflation rate. If we consider real-world examples of current middle-income countries (Table 1), very few countries appearto have had currency appreciation as their per capita incomes increased. Brazil with its spectacular growth in per capitaGDP had a depreciating currency together with very high inflation. Poland, Uruguay, Chile, Venezuela, and Mexico alsohad significant growth, lowering of the PPP factor, currency depreciation, and inflation. These examples lend somecredence to the idea of PPP catch-up due to high growth leading to high inflation in the absence of currency appreciation.
0
2
4
6PP
P ad
just
men
t fac
tor
PPP adjustment factor andper capita GDP (2009)
0 20 40 60 80 100
120
1
3
5
Per capita GDP (2009) (in US$ thousands)
Table 1: Per capita GDPs, Currency Depreciation, Inflation and PPP Adjustment in Some Middle-income Countries.
Country Per capita Per capita Per capita Currency Average PPP PPPGDP 1980 GDP 1990 GDP 2009 Depreciation Annual Adjustment Adjustment
Note: Internal calculations based on International Monetary Fund (IMF) data.Data Source: IMF, World Economic Outlook (WEO) and International Financial Statistics (IFS).Reference: Kenneth A. Froot and Kenneth Rogoff (1995), ‘Perspectives on PPP and Long-run Real Exchange Rates’, in GeneGrossman and Kenneth Rogoff (eds.) Handbook of International Economics, Volume 3, North Holland, Amsterdam.1 Per capita GDP at current prices, not adjusted for PPP.
28 Economic Survey 2010-11
Website: http://indiabudget.nic.in
harm than good. Our enforcers have to be taught todistinguish between legitimate activities and genuinemalpractices. Hoarding, for instance, like cholesterol,can be both good and bad. When ordinary citizenshoard for a rainy day, they serve the useful role ofevening out price fluctuations. This falls in thecategory of good hoarding. When Government talksin terms of setting up new warehouses and storagefacilities, it implicitly recognizes the socially usefulfunction of this type of hoarding. On the other hand,when hoarding is done by large traders to deliberatelymanipulate prices, this can be detrimental to theeconomy and go against the interest of consumers.It is this latter kind of hoarding that we need to deter.The important press release by the Prime Minister’sOffice made on 13 January 2011, which led to thesetting up of the IMG referred to earlier, showsawareness of the need to distinguish betweendifferent kinds of hoarding stating as it does,‘Government will take stringent action againsthoarders and black marketers manipulating marketprices.’ The last three qualifying words are important.The same paragraph goes on to point out the needto use not just our Essential Commodities Act 1955,but also the Competition Act 2002.
2.15 The main relevance of the Competition Actoccurs in the context of the natural propensity ofestablished traders to prevent the entry of newtraders. It was observed in an earlier paragraph howthe same product on the same day had vastly differentprices at the farm gate and at different retailslocations. This does suggest the occurrence of entry-deterrence. For a policy analyst it is important torealize that the best antidote to these large pricemargins and the consequent large profits made bythe incumbent traders is the drive of others notcurrently operating in this market to make profit fromthe large margins. If we allow new traders to comeinto the market, buy where prices are low, and sellwhere prices are high, the large price differentialswill vanish. So the critical question is why such newtraders and farmers do not come into the market.Though a firm answer is not possible at this stage, itseems likely that there are barriers to their entry,caused by the rules and regulations of the Centraland State governments and by deliberate barriers toentry created by the incumbent traders. It is arguablethat our Agricultural Produce Market Committees(APMC) Act, by restricting the traders permitted totrade through the main mandis, facilitates collusivepricing. Also the various tolls and checks that a traderfaces in bringing supplies into a city make it difficult
for small, new traders and farmers to bring theirproducts to retail outlets. It is also believed that newtraders are deterred by incumbent traders. If this isestablished, then section 3 of the Competition Act2002, can be invoked to put an end to thesepractices.
2.16 Another, and quicker, method to curtail themargin between farm gate and retail prices is to bringin modern supply chain management systems andretail sellers into the picture. This will involve a lot ofnew know-how. A quick way to get at this is to allowforeign direct investment (FDI) in multi-product retailinto India. We will certainly need to have a regulatorystructure within which such foreign companies willbe required to function, even if it were argued thatlarge organized-sector firms would be more wary ofviolating the nation’s antitrust laws. At any rate, weare at a juncture where FDI in multi-product retail isworth considering. It could enable farmers to gethigher prices and consumers to have to pay less.We could, as a first step, consider limitinginternational multi-product retailers to a few outletsin each major city. This will prevent them from gettingfull control of the market and, at the same time, setan upper bound on the prices that other retailers willbe able to charge for their products. Further openingup can follow depending on the success we havewith this.
2.17 The policy changes discussed in the precedingparagraphs can improve our food delivery anddistribution systems and provide great benefit toconsumers. They can even achieve a once-and-for-all lowering of retail prices that consumers pay. Butthis in itself will not cure the risk of long-run inflation,which refers to a sustained across-the-board priceincrease. Sustained inflation is, in part, a by-productof growth and financial inclusion. As discussedearlier, with more people putting their savings in banksand mutual funds, the scope of the RBI andGovernment to increase money and run a fiscal deficitmay go down. A deficit that earlier did not causeinflation may now do so because ordinary citizensare putting their money into circulation. In the parlanceof economics, there may be a steady increase inthe velocity of circulation of money. Unfortunately,there are no known formulae for how much we haveto cut back on deficit and liquidity to counteract thefact of rising velocity. This will have to be achievedthrough trial and error. The secular lowering of inflationseen through this year suggests that the movesmade by the RBI and Government have been in theright direction.
29Micro-foundations of Macroeconomic Development
Website: http://indiabudget.nic.in
2.18 There is another novel dimension to inflationtoday that puts it beyond the full control of any singlenation. This has to do with globalization. As barriersbetween economies come down, and goods,services, and capital flow more easily betweennations, there is a natural tendency for each nation’smonetary authority to lose some of the effectivenessit earlier had. Equivalently, one nation’s monetarypolicy now has greater externalities for other nations.In earlier times, when one country increased itsmoney supply, it boosted demand in that nation,leading to a combination of greater output and someupward pressure on prices. Nowadays, it is possiblefor the newly created money to flow out of the nationto other countries and give rise to greater demandthere, boosting output but also creating inflationarypressures. It was realized a long time ago that forone economy to have more than one central bankwith money-creating rights can be destabilizing.Starting with the founding of the Bank of England in1694 it gradually became the norm to have onecentral bank for one economy. With globalizationand the lowering of boundaries between nations, theworld economy is gradually moving towards a single
economy. But since each nation has a central bank,we are unwittingly returning to a predicament thatwe had once escaped, to wit of having multiplemoney-creating authorities in a single economy. Thishas given rise to destabilizing currency competitionsand may be a factor behind the recent increase ininflation in emerging economies (see Table 2.1).
2.19 It is time for the world’s major economies toget together through appropriate internationalagencies such as the G-20 to address this problemand have systemically important economies try andachieve greater coordination in their monetary andfiscal policies. The global economy is beginning toexhibit some troubling characteristics that needattending to. What we have is a variant of stagflationat global level. But unlike the standard melting-potstagflation, where the stagnation and inflation occurin the same economy, the global economy ischaracterized by a salad-bowl stagflation—stag insome nations, flation in others. This is probably aconsequence of the world becoming increasinglyboundaryless. Money creation in such a world islike pouring water on a flat surface. No matter wherethe water is poured it ends up in the same place, inthis case stimulating growth and prices in thoseplaces, and not necessarily stimulating the economywhere the money was created.
2.20 Over the last year, there has been a lot ofeffort to strengthen economic inclusion. This is as itshould be. Of the Government’s lynchpin foreconomic policy, namely ‘inclusive growth’, thecountry has done very well on ‘growth,’ but needs topress more on the peddle for ‘inclusion’. To do betteron this front we have to define this target more sharplyand then pursue policies to achieve it. It was arguedin last year’s Economic Survey that one way offormalizing the inclusion target is to evaluate theperformance of an economy in terms of theperformance of the bottom quintile of the population.Thus, instead of treating the overall per capita incomeas a target, we should aim to enhance the growth ofthe per capita income of the bottom 20 per cent(what is called the quintile income) of the population.Such a definition would avoid the common pitfall oftreating growth and equity as pulling in differentdirections. Even with this clarity of definition, thequestion remains about how best to achieve thistarget? What should be the components of a policyaimed at raising the standards of the marginalizedpopulation?
Table 2.1 : Cross-country Inflation overthe Last Year
Inflation Food Inflation
Year Yearago 2010 ago 2010
Argentina 7.1 11.0 * 4.7 15.8 *
Brazil 4.3 5.9 ** 3.3 9.2 *
China 0.6 5.1 * 3.2 11.7 *
Egypt 10.7 11.6 *** 17.4 21.9 ***
India 13.5 8.3 * 17.6 5.4 *
Indonesia 2.8 7.0 ** 4.7 13.2 $
Iran 7.4 12.5 * 6.6 12.1 ***
Pakistan 10.5 15.5 ** 7.5 20.1 @
Philippines 4.3 3.0 ** 2.2 3.2 ***
Russia 8.8 8.8 ** - -
Thailand 3.5 3.0 ** 0.8 6.6 ***
Turkey 6.5 6.4 ** 9.3 7.0 **
Ukraine 12.3 9.1 ** 7.6 13.1 @
Vietnam 6.5 11.8 ** - -
Uruguay 5.9 6.9 ** 4.6 10.1 @
Source: International Labour Organization (ILO)Department of Statistics, World Bank, National Bureauof Statistics of China.
SKS Micro Finance, this sector seems to have comeof age. However, in 2010-11 the sector ran intodifficulty with reports of unfair practices by MFIs torecover loans and some farmer suicides attributedto these practices.
2.23 These developments have put the microfinancesector at crossroads. In regulating MFIs it has tobe recalled that they have played a major role indrawing poor people into India’s mainstream financeand enabling farmers to make useful investmentsand marginal workers to start up small self-employedenterprises. There are approximately 30 millionpeople throughout India who have been beneficiariesof MFI lending. There is evidence that some of thesepeople have been subjected to unfair threats to makethem repay loans. Such practices must be stopped.However, to react to this by announcing blanketamnesties and encouraging farmers to default enmasse will do more damage than good. Suchpractices would lead to the MFI sector disappearingsince no MFI, whether it be a profit-making one or anon-profit NGO, would want to give out loans knowingthat these will not be recovered. While we mustrecognize that borrowers in special situations havethe right to plead bankruptcy and not pay back, weneed an intelligent regulatory structure whichprotects borrowers and, at the same time, allowsthis sector to flourish. It is with this in mind that theRBI set up a committee headed by Y.H. Malegam tostudy and advise on the microfinance sector (seeBox 2.2). The report will, no doubt, give rise todiscussion, debate, and analysis. In the light of this,it is worthwhile recounting some of the principles wehave to keep in mind while regulating this importantsector.
2.24 The central principle of a good system offinance is a transparent contract. Hence the firstand foremost principle in drafting a regulatory systemfor the microfinance sector is to require that thelending MFI make the terms and conditions of theloan clear to the borrower. It is, for instance, wellknown that people often fail to understand themeaning of compound interest rates. A poor farmertold that he has to pay 10 per cent interest rate permonth tends to believe that he will be paying aninterest of 120 per cent over the year. However, if the10 per cent interest rate is meant to be a compoundrate, then this works out to an interest of 214 percent over the year. To misunderstand this can leadthe borrower to make huge losses and the lender tomake huge, unfair profits. We have seen these kindsof phenomena even in advanced economies like theUnited States where the sub-prime home borrowers
2.21 This Government took the view that in the largeagenda of inclusion, a central and in some wayspivotal feature is financial inclusion. In order to achievesuch inclusion, there are plans to expand India’sbanking sector, enable the creation of new financialproducts and use modern technology to enable thepoor to keep their savings in interest earningaccounts. One of the most ambitious schemes forachieving these is the Swabhimaan programme,which, takes off on the idea of financial inclusionproposed and developed in the RangarajanCommittee Report (Committee on FinancialInclusion). Swabhimaan, launched on 10 February,2011, is an innovative scheme to take banks to thedoorstep of the rural poor instead of the latter havingto go in search of banks. The idea is to have businesscorrespondents, or bank saathis, (who may be thelocal merchant) armed with electronic hand-helddevices, which can recognize the bio-markers of bankcustomers. The customers can then deposit anddraw money directly from the bank saathi, withouthaving to travel long distances to get to the nearestbrick and mortar bank branch. The programme willbe making use of aadhaar which will make it possiblefor individuals to establish their identities in any partof India. By combining India’s strength in informationtechnology with innovative ideas in banking,Swabhimaan promises to be a major catalyst forgrowth and inclusion.
2.22 Another constituent of financial inclusion,which could potentially benefit from Swabhimaan, isthe extension of the reach of micro finance.Microfinance can empower the poor so that theycan move on from relying on hand-outs to being self-sufficient and seeing their incomes grow. Formicrofinance this has been a year of remarkabledevelopments. The sector has grown rapidly but ithas also been mired in controversy. A micro financeinstitution (MFI) can take many different forms. Itcan be a non-government organization (NGO), a non-profit non-banking financial company (NBFC), or aprofit-making NBFC incorporated under the IndianCompanies Act 1956. Following the RBI guidelinesof 18 February 2000, MFIs have been taking bulkloans from banks and on-lending to small borrowers.MFIs cannot take in retail deposits and to that extentfall in the category of NBFCs. This sector has grownexponentially and on 31 March 2010, based onreturns filed with the National Bank for Agricultureand Rural Development (NABARD) we know that therewere 1659 MFIs availing a total credit of ` 13,955crore from the banking system. With the success ofthe initial public offer (IPO) of a leading MFI, namely
31Micro-foundations of Macroeconomic Development
Website: http://indiabudget.nic.in
took on loans without understanding the terms theywere signing on to. Government has to takemeasures to ensure that MFIs make the terms ofcontract transparent to the borrowers. This is moreimportant than setting caps on interest rates andother restrictions on the terms of the contract. Thisis not to deny that we may have to set some limitson the terms. But the economics of this is importantto understand before we go about ring-fencing theterms of the contract.
2.25 At first sight an MFI charging an interest rateof 24 per cent or 30 per cent per annum may seemextortionist since big urban borrowers manage toget money at much lower interest rates. However,there are two arguments against this reaction. First,it has to be kept in mind that lending to many smallborrowers is much more costly than lending to a fewlarge borrowers. Second, for a lot of these poorborrowers the alternative to an MFI is not a bank oran organized-sector financial institution but the rural
Box 2.2 : Issues and Concerns of the MFI Sector : Extracts from the Report of the Sub Committeeof RBI Central Board of Directors—the Malegam Committee.
Main Recommendations*
Categorization of MFIs
Creation of a separate category of NBFCs to be designated as NBFC-MFIs;
NBFC-MFIs need to be companies providing financial services predominately to low income borrowers with not less than90 per cent of total assets (other than cash and money market instruments) in the form of qualifying assets;
Terms of credit: borrowers, size and interest rate
Borrower can be a member of only one SHG or Joint liability group;
Limits on annual family income of borrowers recommended at ` 50,000;
Individual ceiling on loan to single borrower recommended to be ̀ 25,000;
Loans to be in small amounts with more frequent repayments than bank loans;
The interest charged from borrowers subject to a ‘margin cap’ of 10 per cent for MFIs with loan portfolio of ̀ 100 croreand 12 per cent for smaller MFIs;
Overall interest cap on loans at 24 per cent;
Tenure of loan to vary with loan size;
Restrictions recommended on the extent of ‘other services’ to be provided by MFIs;
Not more than two MFIs can lend to a single borrower.
Resources, capital structure and provisioning
Commercial Bank lending to NBFC-MFIs to qualify as ‘priority lending’;
Minimum net worth of 15 crore for NBFC-MFIs.
Capital Adequacy Ratio of 15%
All of the Net Owned Funds should be in the form of Tier I Capital.
MFIs encouraged to issue preference capital (with a ceiling on the coupon rate to be treated as part of Tier II capitalsubject to capital adequacy norms
Consumer protection, code of governance and regulatory issues
RBI to prepare a draft customer protection code;
Grievance redressal mechanism to be established
MFIs to observe code of corporate governance;
Responsibility of avoiding coercive recovery methods to rest on MFIs;
Credit information bureau to be established;
The Reserve Bank should have the responsibility for off-site and on-site supervision of MFIs;
A four pillar approach comprising of MFIs, Industry associations, banks and RBI for monitoring compliance of regulationssuggested;
NBFC-MFIs should be exempted from the provisions of the Money-Lending Acts, in view of the recommendation oninterest margin caps and increased regulation.
Note: *This is only a synoptic extract of the recommendations and not the full text.
Source: Report of the Sub-Committee of the Central Board of Directors of the Reserve Bank of India to Study Issuesand Concerns in the MFI sector, January 2011.
32 Economic Survey 2010-11
Website: http://indiabudget.nic.in
moneylender and such moneylenders often chargeinterest rates which, on annual basis, go up to 100per cent or even 200 per cent. Hence to place toosevere a cap on the maximum interest rate that anMFI can charge can drive some of the poorest andleast bankable borrowers towards even greaterextortion.
2.26 Is there then a case for having an interestrate cap or should we simply insist on transparencyof the terms of the contract, whatever those termsmay be? Even most industrialized nations such asthe United States have usury laws which cap theinterest rate that a lender can charge. Recentresearch in behavioural economics shows that humanbeings have a propensity to make inter-temporaldecisions badly. Over and above the old idea ofdiscounting through time, people have an additionalpropensity to value a bird in the handdisproportionately higher than all future birds in theirhands. Moreover, people typically tend tounderestimate the pace at which compound interestrates cause the repayment burden to rise over time.In other words, inter-temporal decision making isoften done in a way which is not fully in keeping witha person’s rational interest. This leads to a possibleview that when a person signs onto a contract wherethe interest rate is too high, that in itself shows thatthe person has miscalculated the repayment burden.This could be a justification for why consumers’sovereignty may have to be curtailed in the interestof the consumer’s own true interest. For this reason,there may be a case for setting some limits to thekinds of terms and conditions that go into a lendingcontract including a cap on interest rates. However,in figuring out the exact details of these, we have tokeep in mind the two factors earlier mentioned,namely that micro lending is costly to the lenderand to many a poor borrower the alternative to anMFI loan is money from the informal moneylenderwhose interest charges tend to be much higher.
2.27 These conceptual issues have a bearing onsome matters that pertain to larger questions oforganized finance. The financial crisis that beganwith the sub-prime housing mortgage market in theUS and spread to other parts of the world has raisedimportant questions about new financial productsand structured finance. Teaser loans, in which theinitial repayments are low but then escalate, overtime, to larger repayments, have come undercriticism. Collateralized debt obligations (CDOs),whereby new financial products are created bypackaging different mortgages of differing risk profilestogether and sold off in slices to other finance and
investment companies, also came under criticism.It can be argued that these CDOs caused a ‘ratinginflation’, since in mixing and matching thesemortgages, banks made sure that each such productmaking it to a certain rating category made it to justthe edge of that category. In earlier times, ratingsagencies, such as Standard and Poor’s or Fitch,used to rate whole companies or even nations. Sowhen debt issued by some company was given anAA+rating, the lender knew that this company’squality rating was somewhere in the interval fromAA+ to just below AAA. Once CDOs came intovogue, investment banks started creating new assetsthat were deliberately aimed at certain ratings. Sincethe demand for these CDOs depends on the ratings,it is not worthwhile creating tranches that lie in themiddle or upper end of a ‘rating interval’. In otherwords, these new securities were almost invariablyclustered at the bottom cut-off of each interval. It isarguable that many agents buying these assets failedto take adequate account of this change that hadoccurred as a consequence of structured finance.They were used to treating an AA+ asset as an assetsomewhere between the start of AA+ and below AAA.But with the arrival of CDOs that was no longer thecase. The average quality of assets in each ratecategory was invariably at the bottom end of theinterval. In other words, there was ‘rating inflation’the way some universities have had ‘grading inflation’.Just as happened in the early days of grade inflation,buyers of these assets were partly deceived. In theworld of finance, a small mistake per asset of thiskind can amplify into big errors and, given thecomplicated interdependencies in this market amonglenders, the total impact can be vastly amplified, ashappened in 2007 and 2008. Box 2.3 discusses someother reasons for rating inflation.
2.28 One way of handling this is to go for greatergranularity in grading as Standard and Poor’s ratingsystem specially designed for East Asian nationsdoes. But for India the more relevant matter rightnow is the status of new financial products like teaserloans. The terminology is sufficiently tainted for aneutral term to be of some value. We shall here referto loans in which the monthly repayment instalmentrises over time as a ‘terraced loan’. Unlike mostindustrialized countries, India has had considerablesuccess with terraced loans. The State Bank of India(SBI), for instance, came out with two differentterraced loan products—Happy Home Loan inFebruary 2009 and Easy and Advantage Home Loanin August 2009. Both these loans hold the interestrates fixed and below the market rate in the initialyears. In the case of Happy Home Loan this was
33Micro-foundations of Macroeconomic Development
Website: http://indiabudget.nic.in
fixed for the first 12 months and in the case of Easyand Advantage Home Loan interest was held constantand below the market rate for three years. Thereafterthe rates were expected to move to higher and floatinginterest rates. The response of the market to thiswas very good. The number of loans offered in January2009 was 18,780 with an aggregate value of ̀ 1499crore. By November 2009 this had risen to 28,492loans with an aggregate value of ` 3273 crore.Defaults on these have been negligible and cases offoreclosure rare. Also, these loans played a majorrole in promoting inclusiveness. Around 90 per centof the home loan borrowers were first-time homebuyers.
2.29 Two factors were behind the success of theseterraced loans. First, despite having the shape ofrepayment associated with conventional teaser loans
in the US, these loans in India were not given tosub-prime borrowers. In the case of Easy andAdvantage Home Loans, a borrower’s repaymentcapacity and hence eligibility was worked out underthe presumption that the person would have to payfrom the beginning what she would actually have topay from the fourth year onwards. Second, therewas a lot of effort made to keep the contractstransparent so that the borrowers knew exactly whatthey were getting into. Given what behaviouraleconomics has taught us, we know that this maynot always be adequate, that a borrower’s nod doesnot always mean that the borrower has fullycomprehended what it is that he or she is gettinginto. However, especially the decision not to makethese products available to the sub-prime borrowersbut instead to expand the choice available toborrowers with an assured capacity to replay playeda major role. The fact that this enabled many newhome buyers to enter this market speaks well of theinclusiveness of the scheme, even though the sub-prime segment was deliberately left out. This iswhat enabled India’s mortgage market to remainstable even as such markets in industrializedcountries faltered. The basic lesson is clear. Ingeneral, it is worthwhile giving banks and financialinstitutions the freedom to introduce new productsand thereby expand the options available toconsumers and firms. This can enhanceentrepreneurship and enable ordinary citizens toachieve a higher standard of living than wouldotherwise have been possible. The importantrestriction should be that banks and even NBFCsshould be discouraged from lending to categories ofborrowers who are clearly not in a position to takeon such debt burdens. As far as restrictions on thetypes of products go, these should be usedminimally and with judiciousness.
CAPITAL FLOWS AND GEOPOLITICALOPTIONS
2.30 Overall capital flows into India this fiscal yearhave been greater than ever before in the country’shistory. This has been caused largely by agroundswell of money coming through the foreigninstitutional investor (FII) route, in response to therobust performance of the Indian economy but alsobecause of low interest rates and returns in generalin industrialized nations. Midway through the fiscalyear, there was also ‘currency competition’, withChina allegedly holding its exchange rate at whatwas believed to be a depreciated level, the USresponding to this and its own sluggish growth and
Box 2.3 : Securities, Seniorities, and theLending Boom
A little less than 1 per cent of all corporate bonds get anAAA rating. During the lending boom, preceding thefinancial crash of 2007-09, close to 60 per cent of all asset-backed securities were rated AAA. What was the magicbehind these securities being rated so highly? As discussedin the text, the ability to create packages by mixing andmatching mortgages can cause some of this rating inflation.But there are other reasons as well. The popular practiceof creating securities of different seniority can alsocontribute to this.
Suppose a bank sells two mortgages of ` 100 each andsuppose each of these mortgages has a risk of defaultequal to one-eighth. Further assume that the risks of thetwo mortgages are un-correlated. Now, suppose that aclever finance consultant advises the bank to put thesetwo mortgages together and create two new securities ofRs100 each and sell them off to two buyers. These twosecurities are, however, given different levels of seniority.The junior security will see a default if any of the mortgagesdefaults. The senior security will incur a default only ifboth mortgages go into default. Note that the juniorsecurity is a little worse than one of the original mortgagesbecause the risk of default is two-eighths. On the otherhand, the senior security is vastly better because it is likethe original mortgage but with the risk of default reducedto one-sixty-fourth. It is this method of exploiting thelaws of probability and elevating certain pools of mortgagesinto inflated rating categories that was among the causesof the lending boom. Since by mixing and matching nothingfundamental at aggregate level is changed, the subsequentfinancial meltdown was all but inevitable.
References: M. Brunnermeier, (2009), ‘Deciphering theLiquidity and Credit Crunch 2007-2008’, Journal ofEconomic Perspectives, 23.
R.G. Rajan (2010), Fault Lines: How Hidden Fractures StillThreaten The World Economy, Collins Business.
34 Economic Survey 2010-11
Website: http://indiabudget.nic.in
high unemployment with two rounds of quantitativeeasing, and Japan buying up foreign exchange andreleasing yens on the market. All these movescontributed to a greater flow of money our way. Thiswas initially a matter of concern to India. However,there seems to have been no substantial appreciationof the nominal exchange rate of the rupee during theyear. This is testimony to India’s growing strengthand power of absorption.
2.31 This must, however, not lull us intocomplacency. We will have to keep open the optionsof having to take corrective measures should theseflows affect us adversely. The most important stepin this context is to work with the G-20 countriesand try to figure out collective decision rules wherebyeach country tries to intervene minimally in the flowof capital and, when it does intervene, it does sotaking into account the externalities on other nations.But till such a plan of coordinated action is workedout successfully, a nation has to be prepared to adoptpolicy measures on its own. In contemplating suchpolicy measures in India two inter-related factors haveto be kept in mind. First, although there is very littlenominal appreciation of the rupee, our real exchangerate, especially vis-a-vis the systemically importantcurrencies, has been on a fairly steady path ofappreciation. This is likely to have contributed to therelatively slow pickup of India’s exports, even thoughover the last few months these have done well. Ithas also contributed to the large current accountdeficit (CAD) that the country faces. In itself thiswould not be a matter of concern but, in this case, asubstantial part of the CAD is being financed byrelatively footloose capital. One possible strategy inresponse to this is the market-based intervention ofbuying up some of the foreign exchange coming inthrough this route. This will limit the amount of capitalavailable for financing the deficit and could alsostabilize the real exchange rate. Against this, wewill have to balance out the risk of inflationarypressures generated by the rupees that will bereleased on the market. However, it can be arguedthat since the rupees that will come on the marketwill be replacing other currencies, which areconvertible and therefore fairly liquid, the inflationaryimpact of this will not be as serious as is oftenpresumed. It is also hoped that with India’s savingsrate beginning to rise, some of the pressures on theCAD will ease.
2.32 All these policies must be complemented bythe effort to attract more FDI into India. FDI capitalis much more stable and, therefore, does not giverise to the kind of volatility that some forms of short-
term capital bring with them. Moreover, the kind ofapprehension that India once had about foreigninvestment and political interference is of much lessconcern now since it is now a much more robusteconomy and has greater say in international politicalmatters. To attract more FDI, we will have to think interms of new areas into which we may channel theseinvestments. But more than this, the seriousstumbling block to attracting FDI into India is thefact that our bureaucratic machinery continues tobe sluggish. Data released by the World Bank showthat in terms of the bureaucratic efficiency for “doingbusiness,” India ranks as low as 134th in the world.Clearly, this is one area with scope for improvement.If we can make our bureaucratic, administrativemachinery more efficient, the benefits for theeconomy will be enormous. There are examples ofnations that inherited the cumbersome bureaucraticsystem of colonial governments but managed toreform those. We can learn from those nations but,interestingly, we can also learn from within our owncountry. A simple calculation shows that if all of Indiaadopted the best practices found in some part ofIndia, for instance in terms of facilitating the openingof new business, enforcing contracts, simplifyingprocedures to help bankrupt firms close down quickly,it would rank 79th in terms of efficiency. In other words,we can improve our ranking by 55 positions simplyby learning from within our own nation. This is not topromote the parochialism of refusing to learn frombeyond our borders but to emphasize that there is alot that can be achieved even without that.
2.33 Digressing briefly, it is worth turning to theinteresting question of the economic andrepresentational power of Governments. There wasa comment earlier about India’s greater say in globaleconomic matters. Indeed, India’s G-20 membershipis recognition of this fact. The ‘economic power’ of aGovernment is an important indicator of how muchsay that Government has in global fora and also howmuch say it ought to have. The economic power of aGovernment is a more complex idea than theeconomic power of an individual. We usually measurethe latter by looking at a person’s income or wealth.Taking a cue from this, we may think of aGovernment’s power as measured by the totalamount of revenue the Government earns and so isable to disburse. We may also look at the ownershipof assets by a Government to get an approximateidea of the permanent income of the Government.However, a Government’s economic power dependsalso on the amount of human capital available in thenation and so at some level available to the
35Micro-foundations of Macroeconomic Development
Website: http://indiabudget.nic.in
Box 2.4 : Government Economic Power in the Post-crisis World
The economic abilities of nations and governments have always been a force to reckon with. While the process of globalizationsaw government economic power supplementing the forces of the market, the global economic crisis witnessed governmentsplaying a crucial role in stabilizing financial markets and managing to coordinate responses in order to prop up the worldeconomy. Governments also play a critical role in ensuring redistributive equity and development. Motivated by the needto develop a set of metrics to encompass this important phenomenon, an index of government economic power wasdeveloped. The index can also be of value in deciding on the voting rights and other powers the governments of variouscountries ought to have in international organizations like the IMF and the World Bank. The index has been created for 10years (2000-09) covering 112 economies.
The index of government economic power (IGEP) endeavours to capture the ability of a government to project itself in theinternational sphere. There is also a normative content to this. Since the index shows the extent of charge a government has,it also can be used to determine how much say the Government should have in multilateral fora. The index is composed offour variables: government revenues, foreign currency reserves, export of goods and services, and human capital. Thesevariables broadly capture a Government’s ability to raise resources, its creditworthiness and credibility in internationalfinancial markets, its influence on global economic activity, and its representational strength, that is how much of the global
0
0.2
0.4
0.6
Inde
x va
lues
Fig 1: Index values
2000
2001
2002
2003
2004
2005
2006
2007
2008
2009
0.1
0.3
0.5
Year
USA Japan China
0.02
0.06
0.10
0.14
Inde
x va
lues
Fig 2: Index values
2000
2001
2002
2003
2004
2005
2006
2007
2008
2009
0.04
0.08
0.12
Year
Germany Canada India
-4
0
4
8
Perc
ent
Fig 3: Change in GDP growth 2009 to 2010
0 50 100
150
200
250
300
350
400
450
-2
2
6
Percentage change in index value (2000 to 2009)
10
12
Source: A complete description of the index of government economic power and its implications is available in a forthcomingEconomic Division, Department of Economic Affairs, Ministry of Finance, working paper: ‘The Evolving Dynamics ofGlobal Economic Power in the Post-crisis World: Revelations from an Index of Government Economic Power’.
economy, including global manpower, it can claim torepresent. In order to ensure use of standard data, the indexhas been constructed using three widely accepted datasets;the IFS and WEO of the IMF, and the United NationsDevelopment Programme’s (UNDP’s) HumanDevelopment Index (HDI).
The 2009 results show that the top ten ranks are occupied by(1) the United States, (2) China, (3) Japan, (4) Germany, (5)India, (6) Russia, (7) Brazil, (8) France, (9) Italy, and (10) theUnited Kingdom. In 2000 the top ten places were held by (1)the United States, (2) Japan, (3) China, (4) Germany, (5)France, (6) the United Kingdom, (7) Italy, (8) (Republic of)Korea, (9) Canada, and (10) India. Among the top rankingeconomies some of the most dramatic rises in rank have beenBrazil’s ascent from 13th place in 2000 to 7th in 2009 andIndia’s rise from 10th position in 2000 to 5th in 2009. Japanwas replaced by China in the second spot in 2004. The UnitedKingdom went down from 6th place in 2000 to 10th in 2008and continued there in 2009. Canada fell from 9th in 2000 to15th in 2008.
The changing dynamics of global economic power can befurther seen if we analyse the index values over time for someof the larger economic entities. If we compare the three topranking countries of 2000, the US, Japan, and China, the USand Japan had a slow rise in index values, except for theslight fall in 2009. In contrast, China has risen rapidly and,after surpassing Japan in 2004, has almost reached the samelevel as the US in 2009 (see Figure 1).
On an analysis of the countries holding the 4th , 9th and 10th
positions in 2000 (namely, Germany, Canada, and India),India moves from an index value just below Canada in 2000to one very close to Germany by 2009 (Figure 2). Among thelarge economies, China and India also demonstrateremarkable robustness by not having lower index values in2009 unlike all the other countries occupying the top tenpositions in 2000.
Interestingly, there is a strong positive correlation betweenthe growth in economic power (percentage change in indexvalue between 2000 and 2009) and the change in GDP acrossthe post-crisis period (that is between 2009 and 2010)indicating a link between growth in economic power asmeasured by the index and the ability to recover from thecrisis (Figure 3). This does not establish a direct causalrelationship between the two variables but is of descriptiveinterest.
36 Economic Survey 2010-11
Website: http://indiabudget.nic.in
Government. A Government’s power further dependson the nation’s level of integration with the world. Anation that is rich but largely a closed economy maynot be of much importance to other nations and sonot able to exercise influence in international matters.On the other hand, a nation that exports and importsa lot has the power of leverage. The potential threatof interrupting these flows gives such a Governmentmore economic muscle than another nation that maybe wealthier but has negligible trade and capital linkswith the world. Combining all these factors, an indexwas created by researchers in the Economic Divisionof the Ministry of Finance and is reported in the Box2.4. It shows, as expected, that the US Governmenthas the greatest economic power. This is followed,in descending order, by China, Japan, Germany,India, Russia, Brazil, and France. What is interestingin this story is the rapid rise in the economic powerof India and, more so, China over the last decade.Box 2.4 is of interest in itself since there is so muchwriting nowadays on the shifting economic base ofthe world.
NEW INITIATIVES
2.34 The buoyant growth of the economy createsopportunities; and it is important to seize them sothat the growth becomes sustainable. There aremany areas with opportunities for new initiatives, andonly a few of these will be discussed here forillustrative purposes. It is widely accepted outsideof and within Government that we have a greatdistance to go in eradicating poverty and drawinginto the mainstream of our economy segments ofthe population that are currently marginalized andlive on the fringes. The first step towards this is tomake sure that no one is deprived of basic food andall attain minimal nutritional standards. There havebeen new initiatives on this front, such as the newfood security bill.
2.35 At this stage, some broad principles ofeconomic policy are worth outlining. There is acommon presumption that markets and inclusionare inimical to each other. The truth, however, is that,while markets have a natural propensity to deliveron efficiency, they do not have any innate propensityfor equity or equality. Hence it is true that foreradicating poverty and creating a more equitableand inclusive society, there is need for purposiveaction by Government—Central, State, and local.The view we take is that Government should play anenabling role vis-a-vis the market, facilitating trade,exchange, and enterprise. On the other hand, when
it comes to distribution and the mitigation of poverty,Government has to be more proactive with policyinterventions. However, wherever possible, theintervention should take the form of direct transfersfrom the better-off sections to the poor, with asminimal a tampering with prices as possible. Thefact that markets are not naturally inclined to deliveron equity and poverty eradication does not meanthat we should ignore the market. The laws of themarket will be there whether or not we acknowledgetheir presence. Good policymaking entailsrecognizing and understanding these laws andutilizing them to deliver on the targets that we have.
2.36 There are two reasons for having a system ofa minimal amount of food procurement anddistribution carried out by the State. The first is todo with evening out foodgrain availability and pricefluctuations from one year to another. This is alsorelated to the issue of self-sufficiency. In times offood shortage, we do not want to rely entirely onimports from other countries and should be able todepend on our own stocks and supply to ourconsumers. The second motive is to provide foodsecurity to the poor and vulnerable. No one, no matterhow poor, should have to suffer from food deprivationand malnutrition.
2.37 As far as the aim of evening out food pricesfrom one year to another goes, our success hasbeen moderate. Thanks to our procurement policy,mainly in wheat and rice, we have not had to be heldto ransom by international suppliers. However, astudy of our food stocks shows that we havecontinued to hold these at elevated levels in goodyears and bad. Likewise, procurement has takenplace from year to year without the cyclical featuresthat one would expect in an effective pricestabilization system. Thus, in 2006-07 the totalprocurement of wheat, rice, and coarse grain was34.3 million tonnes, in 2007-08 40.1 million tonnes,in 2008-09 57.7 million tonnes, and in 2009-10 57.2million tonnes. Clearly, given that the last fiscal yearwas one of high foodgrain price inflation, we wouldhave expected lower than usual procurement and alarger offloading of stored grains. But neither of thesehappened. Evidently, there is ample scope forimprovement in our strategy of foodgrain release.The current practice has some systemic flaws. Tryingto ensure that the procured food is not released at aprice which inflicts too large a loss on Government,we have often priced it so high that there were nobuyers. Not releasing foodgrain defeats the purposeof bringing down market prices.
37Micro-foundations of Macroeconomic Development
Website: http://indiabudget.nic.in
2.38 This has at times led to the suggestion thatthe state should just release this grain at near-zeroprice. At first sight, this sounds reasonable sincethere is excess foodgrain lying in warehouses andeven in the open and going waste. But there is aproblem with following this seemingly obvious policy.The way we run our minimum support price (MSP)policy is to have a fixed price and allow farmers tosell their foodgrain at that price to the Government.If with the MSP policy intact, we began the practiceof selling off excess food in Government granariesat near zero price, this is bound to give rise to foodrecycling. That is, traders will buy the food from theGovernment at zero or near zero price and sell itback to the Government at the MSP and again buyit back; and so on. There is evidence that a certainamount of food recycling happens even now. But ifthe gap between the MSP and the release pricebecomes sufficiently large, this problem can getexacerbated. Our problem of foodgrain policy cannotbe corrected through piecemeal action such asgetting the government to release food at near zeroprices without correcting other defects in the system.We need to take stock of both our release andprocurement policies. Procurement should vary fromyear to year, depending on production. Also, thewindows for procurement ought to be opened upmuch more widely in different parts of the country.Currently outside of a few States the MSP is a purelynotional price as far as farmers are concerned. Theyknow that they have the right to sell their food at thatprice but they have no access to Governmentgranaries or take-in windows where they can sell.There is also urgent need to increase storage spaceso that foodgrains do not go waste. It should beclear that the act of better storage, important thoughit is, is not going to cure inflation. For that we haveto develop effective strategies for releasingfoodgrains, and the release should take place not inlarge bulks, which would create monopolies but innumerous small batches.
2.39 On the second objective of guaranteeing foodto the poor there are several initiatives and theGovernment is currently considering a food securitybill which will give people legal right to a certainamount of basic foods. Before venturing into this, itwould be well to stress what is discussed elsewherein the Survey and also in various Plan documents,namely, the importance of increasing agriculturalproductivity and production. This sector used to lagbehind. But there are policies being implemented tocorrect this. The estimated growth of agriculture,forestry and fishing of 5.4% in 2010-11 raises hope
that some of these are working. We must nowendeavour to sustain the momentum.
2.40 Returning to the food security bill, this is animportant move that can transform the face of povertyand malnutrition in India. There has been a lot ofdebate about how extensive the coverage of thisprogramme ought to be. What is, however, notalways appreciated is that the coverage of thisprogramme will depend on the efficacy of themechanism through which we try to distribute thefood. The current system of handing over cheap foodto the approximately 500,000 ration shops all overIndia, and then requiring them to sell the it at below-market price to poor households leads to largeleakages. In the current method the subsidy ishanded over to the ration shop and not directly tothe poor households. Studies show (see Box 2.5)that ration shopkeepers often sell off the food at thehigh market price on the open market and turn awaythe below poverty line (BPL) households or adulteratethe food that the BPL households are supposed toreceive. Clearly, if we try to make the coverage ofsubsidized rice and wheat wide and stick to thepresent system of distribution, the total procurementwill have to be large to the point of being unachievable.Hence the important need is to plug the seepage inthe distribution mechanism; and the more effectivelywe manage to design this, the larger we will be ableto make the coverage of cheap food to our population.
2.41 The obvious way of doing this, and this hasbeen widely discussed in the economics literature,is to give the subsidy directly to the poor householdsand allow the PDS stores to sell food at market price.This will involve handing over smart cards or foodcoupons to poor households and then giving themthe freedom to go to any PDS or other store and buythe food at the prevailing market price by using thesmart card or the coupons. In this system, a poorcustomer is as valuable as a rich customer from theshopkeeper’s point of view, since both pay the sameprice. Also, if one shop adulterates its foodgrainsupply, people will have the freedom to go to anotherstore and this, in turn, will mean that the incentive toadulterate foodgrain will go down vastly. As thesystem of Aadhaar-based identification comes intoactivation, the smart card system will becomeportable. In other words, the poor can move fromone part of India to another and still be able to exercisetheir right to subsidized food. The current systemplaces an effective barrier on the ability of poor peopleto move location in response to better wages, sincethey risk losing out on other benefits.
38 Economic Survey 2010-11
Website: http://indiabudget.nic.in
2.42 The same idea carries over to other goodssuch as kerosene, diesel, and fertilizers. ThisGovernment’s policy of ensuring that these vitalgoods reach the poor, instead of leaving it all to thevagaries of the market as conservative analysts wouldrecommend, has much to commend it. But inchoosing the mechanism for reaching these goodsto the poor the same principles discussed in thecontext of foodgrains apply. As soon as we lowerthe price of a commodity by Government diktat, beit for kerosene, diesel, or fertilizers, we inviteadulteration, pilferage, and corruption. The need,therefore, is to design mechanisms of delivery whichare incentive-compatible and minimize thesedistortions. For the most part this means that it isbest not to distort prices to subsidize the poor butto give the subsidy to the poor directly. We may asa first step try this on one product, such as kerosene,by handing over the subsidy to the poor in the formof a smart card; and letting them buy kerosene from
the market at market price. This will improve targetingand cut out corruption. It is true that the poor maymisuse some of these subsidies on non-essentials,but it is surely better for the poor to do so than forthe shopkeeper to do so using the subsidy meantfor the poor.
2.43 There are other areas where new initiativesare likely to likely to yield large benefits for society.One example of this is tourism. Given the vastattractions in India, ranging from diverse naturalformations to historical monuments and relics goingback to more than two millennia, there is vast scopefor expansion of tourism in India. Till now we havenot reaped more than a fraction of this possibility. In2010 the total number of foreign tourists that arrivedin India was 5.58 million and they brought in a foreignexchange earning of ` 64,889 crore. It should bepossible for India to get many times more inboundtourists than it currently does. In 2007, for instance,there were 5.1 million tourists who came to India,compared to 54.7 million to China and 20.1 millionto Malaysia. Interestingly enough, India sends outmore outbound tourists than it gets inbound ones.This is fairly unusual for an emerging economy. Toexploit the huge potential that this sector has willrequire investment in infrastructure and evenimprovements in our immigration and visa services.But it will be unwise not to reap the large benefitsthat are lying unutilized in this sector.
2.44 Another sector with scope for developmentand large potential dividend is education, both school-level and higher education. India currently has a grossenrolment ratio (GER) of 13.5 per cent in highereducation, often also called the tertiary enrolmentratio. That is, 13.5 per cent of all those who areaged between 18 and 23 (that is the college-goingage) are actually enrolled in a college or a university.For the United States, the figure is 81.6 per cent.Even China and Malaysia over which India had alead a few decades ago have now crossed our GERwith figures of 22.1 and 29.7, respectively. Indiacurrently produces close to 6000 PhDs per annum.China, which in 1993 produced 1900 PhDs perannum, now produces close over 22,000. In principle,it is possible for India to quickly double the GERand reach 30 per cent within a decade from now. Inthe long run an economy’s growth depends on thequality of its citizenry and the human capital andinnovativeness of the population. Clearly we need toinvest more and more intelligently in this sector.
2.45 One large potential of our higher educationsector is to develop India as a hub for global
Box 2.5 : Food Subsidies and Leakages
It is a part of common wisdom that a large amount of thesubsidized foodgrain, targeted at BPL households, someAPL households, and other vulnerable groups, find its wayto the open market, where it is sold off at a higher price thanthe stipulated ration shop price. Is this true? And if so,what is the extent of the pilferage? Recent research by ReetikaKhera and by Shikha Jha and Bharat Ramaswami has comeout with careful statistical estimates, where earlier we hadto rely on guesswork. The Ministry of Food and ConsumerAffairs publishes monthly data on the offtake of wheatand rice under the public distribution system (PDS). TheNational Sample Survey (NSS) gives data based on randomsamples of the amount of PDS wheat and rice that areactually purchased by the households. The gap betweenthe offtake and the amount actually reaching householdsgives a measure of pilferage or diversion from the targetpopulation. Using this method, Khera shows that in 2001-02 18.2 per cent of PDS rice and 67 per cent of PDS wheatwas diverted. In other words, over 40 per cent of all graintargeted at the poor missed the poor. Jha and Ramaswamy,using the NSS expenditure survey of 2004-05, report anoverall diversion of 55 per cent of the grain meant for thepoor. No matter where the exact figure lies between 40 and55 per cent, the fact of the matter is the leakage that currentlytakes place is far too high. Once we give a legal guaranteeto people about the food that they are to receive, if we try todeliver on this promise using our current deliverymechanism, we shall have to send twice the targeted amountof grain towards the targeted population.
References: R. Khera, (2011), India’s Public DistributionSystem: Utilization and Impact, Journal of DevelopmentStudies, forthcoming.
S. Jha, and B. Ramaswami (2010), ‘How can FoodSubsidies Work Better? Answers from India and thePhilippines’, Asian Development Bank, Working PaperNo. 221.
39Micro-foundations of Macroeconomic Development
Website: http://indiabudget.nic.in
education. Given that historically we have been verystrong in higher education and also our advantage inthe English language, it is possible for India todevelop as a major centre for higher education wherestudents come from all over the world to study. Giventhe high cost of education in industrialized nations(annual tuition fees in leading US universities arearound $40,000), it is possible for India to attractstudents not only from developing and emergingcountries but even from the United States and otherindustrialized nations. We can offer these studentseducation at a price where we will cover all our costsand have a profit left over and they will get educationat a price which is vastly less than what they wouldhave paid in the United States, or the Governmentwould have paid for them in many Europeancountries. The profit can then be used to expand ouruniversities and colleges for the enrolment of ourown students. For all this, we need complementaryinvestments. There will have to be quality hostelsand broadband internet connectivity. We will alsoneed to tone up our bureaucratic processes. Wewill, for instance, need to give students visas formultiple years because no one will want to come tostudy for two years with a one-year visa and liveunder the uncertainty of it being extended. Theseinvestments in infrastructure and in creating a moreefficient bureaucracy can not only boost the highereducation sector, but all these initial costs will bemore than made up for by the high returns they willyield in the medium to long term.
2.46 As just discussed, underlying both the aboveinitiatives and other developmental projects is theneed for better infrastructure. This being the eve yearof the Twelfth Five Year Plan, it is a good moment totake stock of India’s infrastructural needs. Asdiscussed elsewhere in this Survey, India has, overthe last few years, made special effort to enhancethe country’s infrastructural base. The initiatives cutacross rural infrastructure, railways, highways, power,and the development of our cities, small and large.East Asian economies financed a lot of this throughpublic land sales implemented through well-designedauctions. There is a lesson in this for us to makesure that such large infrastructural expansionsremain fiscally viable.
2.47 The Planning Commission is working to givea major thrust to infrastructure over the next FiveYear Plan. To ensure that this happens, the big needis not so much a matter of bricks and mortar as offinance and mechanism design. Infrastructuralinvestments require long-term loans because some
of these investments may need 5, 10, or even 15years to become financially viable. Banks areunderstandably wary of making such long-maturityloans. The need, therefore, is to create appropriatesystems for drawing domestic and international, andprivate and public investments into infrastructure. Forprivate money to be directed into any form ofinvestment the critical ingredient is the reliability ofcontracts. Having put your money into aninvestment, can you be reasonably sure that theborrower will not renege? Of course, there will haveto be clauses under which a borrower can getlegitimate bankruptcy cover, but the legaladministrative set-up must be such as to ensurethat there is no spurious reneging on contracts. Thisis important not only for micro finance but even toensure that more money flows into infrastructuralinvestments.
SOCIAL BASIS OF ECONOMIC PROGRESS
2.48 The foregoing analysis emphasised that incrafting good economic policy it is important to treatthe various players on the market —the policeman,the ration-shop owner and the ordinary citizen—asreasonably self-seeking, rational agents. If theseagents get the opportunity to earn some extra moneywith little effort, they will seize the opportunity. Hence,to cut down on corruption and pilferage, we have todesign policies in such a way that there is no incentivefor ordinary citizens and the enforcers of the law tocheat. Accordingly, good mechanism design is theheart of the problem. Many a noble plan to reach outto the poor and increase the welfare of our citizenshas fallen on hard times because of the policymakers’propensity to assume that the policies are deliveredby flawlessly moral agents or perfectly- programmedrobots. Models based on such faulty assumptionsare destined to fail. It is important for Indian citizensto understand this because, in democracies, popularopinion plays an important role in promotingprogressive policies.
2.49 This analysis must not be taken to imply thatuncompromising self-seeking behaviour is innate inhuman beings. This dismal assumption, widespreadin some early mainstream economics, is, fortunately,not true. Recent research shows that human beingshave a natural propensity to cooperate, to betrustworthy, and to be honest. They are often willingto give up some personal gains in order todemonstrate pro-social behaviour. These qualitiesof honesty and trustworthiness can, however, varyfrom one society to another and, even within one
40 Economic Survey 2010-11
Website: http://indiabudget.nic.in
society, over time and depending on the context (seeBox 2.6). What is increasingly recognized is thatsuccessful economic development has a strongcorrelation with these human qualities of honestyand trustworthiness. The drive for greater profit andgreater personal ulility, devoid of these socialqualities, creates a dysfunctional and chaotic society.
2.50 There are studies showing that societies inwhich interpersonal trust is greater are societies thatexhibit faster economic growth. It is not difficult tosee why this is so. A modern and efficient economycritically depends on contracts and the ability ofindividuals to rely on these contracts. An individualgives money to a painter to paint her home. If therisk is high that the painter will breach the contractby taking the money and then doing an insignificant
job, people may prefer to leave their homes unpaintedfor longer stretches of time. A person lends moneyto a company with the company making a promiseof paying a certain interest rate over the next 10years and then paying back the principal. In a countrywhere such contracts are not dependable andcompanies are likely to renege on the contract, it isunlikely that people will invest money in companies.The bond market will flounder and companies will beable to invest less than what is optimal. In brief, amodern, vibrant economy relies critically on contractsand our ability to have trust in the contracts. A partof the responsibility for enforcing contracts lies withthe State and the Judiciary. Long-term contracts,like a mortgage for buying a house with the promiseof repayment over the next 20 years, necessarilyhave to rely on the State machinery for enforcement.
Box 2.6 : Pro-Social Behaviour and Economic Development
There is a growing literature in economics arguing that pro-social behaviour, which includes altruism and trustworthiness,is innate to human beings and, moreover, forms an essential ingredient for the efficient functioning of economies. In otherwords, human beings have a natural ability to forego personal gains for the sake of other people or because that is what isrequired because of a promise the person had made. This trait may well have evolutionary roots but its existence is now welldemonstrated in laboratory tests. The broad idea behind these laboratory experiments is the following. The experimenterpairs up all the subjects in a laboratory and then asks each pair to have the following interaction. One of the two persons, callhim A, is asked to hand over if he wishes a certain amount of money (which may be called A’s investment) to B. If A refusesto invest anything, their interaction is over, A and his partner, B, get nothing and they go home. If A invests a certain amountof money, that is gives this to B, then the experimenter adds some more money and lets B have it all. B is then asked whetherB wants to hand a part of the total money she received back to A. In other words, B is given an opportunity to pay back toA some of B’s gains, since B would have got nothing if A had not made the first move. In the Trust Game, once B decides howmuch to give A, that is given to A, and that is the end of the interaction. (The Hold-up game is a variant of this with a slightlydifferent closure rule.)
In a totally selfish world, we would expect B to offer nothing to A and for A, anticipating this, not to give any money to B tostart with. However, experiments conducted all over the world with this or related games demonstrated that in a largenumber of cases, the first player does give money to the second player and the second player does give back a part of herincome to the first player. Moreover, there are conditions which lead to a higher propensity among the players for this kindof cooperative behaviour. Recently, Hodaka Morita and Maros Servatka conducted an experiment on 258 undergraduatestudents at the University of Canterbury in the New Zealand Experimental Economics Laboratory, using the Hold-up game.They found that people typically did make positive investment and the person receiving the investment did give back somereturn to the investor. Moreover, if the players are initially primed so as to believe that they share a common group identity,they tend to be more cooperative.
What is not widely recognized but deserves mention is that one of the earliest statements of the Trust Game and the criticalrole of morality and trustworthiness in the efficient functioning of an economy occurred in David Hume’s 1739 classic, ATreatise on Human Nature (Book III, Part II, section iv): ‘[The] commerce of mankind is not confin’d to the barter ofcommodities, but may extend to services and actions, which we may exchange to our mutual interest and advantage. Yourcorn is ripe today; mine will be so tomorrow. ‘Tis profitable for us both, that I shou’d labour with you to-day and that youshou’d aid me tomorrow. I have no kindness for you, and know that you have as little for me. I will not therefore take painson your account; and shou’d I labour with you on my own account, in expectation of a return, I know I shou’d bedisappointed, and that I shou’d in vain depend on your gratitude. Here then I leave you to labour alone: You treat me in thesame manner. The seasons change; and both of us lose our harvests for want of mutual confidence and security.’
References: R.Benabou, and J. Tirole (2006) ‘Incentives and Prosocial Behavior,’ American Economic Review 96.T. Ellingsen and M. Johannesson (2008), ‘Pride and Prejudice’, American Economic Review 98.E.Fehr and S. Gachter (2000) ‘Fairness and Retaliation’, Journal of Economic Perspectives 14.F. Fukuyama,(1996) Trust: The Social Virtues and the Creation of Prosperity. Free Press.H. Gintis, S. Bowles, R. Boyd, and E. Fehr (2003) ‘Explaining Altruistic Behavior in Humans’, Evolution and HumanBehavior 4.H. Morita and M. Servatka (2011) ‘Group Identity and Relation-Specific Investment’, Mimeo: University of NewSouth Wales.
41Micro-foundations of Macroeconomic Development
Website: http://indiabudget.nic.in
However, these are not the only kinds of contracts.Economic life is full of little promises—I will supplyyou X today, and you will pay me Y tomorrow. Forthese, it is impossible each time to bring in thepoliceman and the judge to ensure enforcement. Thebest enforcer of these little contracts is our word ofhonour and the ‘culture of honesty’ andtrustworthiness. If a particular citizenry is known tobe trustworthy, people will be more likely to cut dealswith the people of that nation and, over time, thenation will do better and prosper economically.
2.51 For India to develop faster and do better asan economy, it is therefore important to foster theculture of honesty and trustworthiness. Thanks tothe fact of this social prerequisite of economicdevelopment remaining unrecognized for a very longtime, this has not received adequate attention in thescientific literature. Fortunately, a large body of recenteconomics research has been stressing theimportance of these social and cultural factors. While
it is true that we do not as yet have a hard scienceof how to develop these cultural qualities in apopulation, we know that even the mereunderstanding of the importance of certain qualitiesfor promoting the economic development of a groupof people, helps nurture these qualities in people.After all, people have learnt not to smoke in acrowded room even when not smoking is not in theirself-interest simply because they have come tounderstand that this is not in their collective interest.These good values are then further supported insociety through mechanisms of social stigma, whichhelp bring individual and social interests intoalignment. So once we recognize that honesty,integrity, and trustworthiness are not just good moralqualities in themselves but qualities which, whenimbibed by a society, lead to economic progressand human development, people will have a tendencyto acquire these qualities; and that should help builda more tolerant and progressive society.
42 Economic Survey 2010-11
Website: http://indiabudget.nic.in
Fiscal Developmentsand Public Finance CHAPTER
3
The fiscal outcome in the first nine months of the current financial year remainedbroadly on the consolidation track charted by the Budget. It might be recalled that theBudget for 2010-11 had begun the process of fiscal consolidation with a partial withdrawalof the stimulus measures as at that juncture there was clear evidence of economicrecovery. The policy stance was to continue to aid the growth momentum in the shortrun to facilitate its attaining pre-crisis levels and simultaneously to address long-runsustainability concerns. With growth reverting to pre-crisis levels in the current fiscal,revenues remaining buoyant, and a much higher than budgeted realization in non-tax revenues arising from telecom 3G/ BWA (third generation/broadband wirelessaccess) auctions, there was headroom for higher levels of expenditure at the given fiscaldeficit targets. The combined deficits of State Governments also indicated the overallconsolidation process at State level. With continued growth momentum, the prospectsfor sustaining and deepening the consolidation process remain bright.
3.2 The macroeconomic impact of the globalfinancial and economic crisis and theexpansionary fiscal stance was clearly visible inthe demand-side components of the nationalincome aggregates. A contraction of the aggregatedemand was manifest in the rates of growth ofprivate final consumption expenditure (PFCE) andgross capital formation in 2009-10, which hadshares of 58.4 per cent and 35.4 per centrespectively in 2008-09. Net indirect taxes minussubsidies, an important component of the nominalgross domestic product (GDP), also declined. Thelower levels of point contribution to growth from
these could be partly compensated by the rise inGovernment final consumption expenditure (GFCE)(Figure 3.1). As the crisis impacted the economyin the second half of 2008-09, movements inquarterly estimates of the demand side of the GDPprovided better indication of the recovery processand thus the Budget for 2010-11 envisaged a partialexit from the stimulus measures on the strength ofthe outcome of the second quarter of 2009-10. Thisresponse was broadly in line with the internationalpractices in this regard, which had preferred fiscalpolicy instruments for counteracting the adverseeconomic impact of the crisis.
-5
Poin
t co
ntri
buti
onpe
r ce
nt
Year
GDP(CMP)
Point contribution to GDP at current market prices
0
5
10
15
20
2005
-06
2007
-08
2006
-07
PFCE
GFCE
Figure 3.1
2008
-09
2009
-10 Indirect
tax–subsidy
43Fiscal Developments and Public Finance
Website: http://indiabudget.nic.in
year-on-year growth of 20.3 per cent, and was 7.8percentage points higher than envisaged at the timeof Budget formulation. As proportions of the GDPas per the AE, budgeted fiscal and revenue deficitswork out to 4.8 per cent and 3.5 per cent for thecurrent fiscal. Thus, as proportions of the GDP, therecent trends in deficit indicators, post-crisis, havebeen influenced to some extent by the swings in thelevels of aggregate demand (Table 3.1 and Figure3.2).
3.3 As a proportion of the GDP (purchasing powerparity [PPP]), the overall fiscal balance of the worldwas estimated by the International Monetary Fund(IMF) (Fiscal Monitor 2010) to have risen from -0.4 per cent in 2007 to - 2.0 per cent and - 6.8 percent respectively in 2008 and 2009; it was estimatedto have moderated to - 6.0 per cent in 2010 andprojected at - 4.9 per cent in 2011. At a majorgrouping level, advanced economies accounted forthe bulk of the fiscal expansion. Among the emergingeconomies, India had one of the largest fiscalexpansions of the order of about 10 per cent of theGDP in both 2009 and 2010. In terms of proportionsof potential GDP also, the expansion was sizeablein 2009 in the case of India; it was estimated tohave declined to - 8.7 per cent in 2010. Goingforward, the Fiscal Monitor indicated that the fiscaladjustment in emerging economies in general whichwas driven by economic recovery in 2010 would bedriven by discretionary policies in 2011--adevelopment that would be noteworthy in light of thefact that the discretionary impulse of the expansionwas estimated to be small.
3.4 In actual terms, the Budget for 2010-11 hadestimated the level of fiscal deficit at ` 3,81,408crore and revenue deficit at ` 2,76,512 crore. Atthe time of presentation of the Budget for 2010-11 itwas envisaged that nominal GDP (GDP at currentmarket prices) would grow by 12.5 per cent andwas estimated at ̀ 69,34,700 crore. As proportionsof the nominal GDP, fiscal and revenue deficits wereestimated at 5.5 per cent and 4.0 per centrespectively. As per the advance estimates (AE)released by the Central Statistics Office (CSO) on7 February 2011, the nominal GDP for 2010-11 wasplaced at ` 78,77,947 crore, which represents a
Table 3.1 : Trends in Deficits of CentralGovernment
Year Revenue Fiscal Primary RevenueDeficit Deficit Deficit Deficit as
per centof Fiscal
Deficit
(As per cent of GDP)
Enactment of FRBM Act
2003-04 3.6 4.5 0.0 79.7
2004-05 2.4 3.9 0.0 62.3
2005-06 2.5 4.0 0.4 63.0
2006-07 1.9 3.3 -0.2 56.3
2007-08 1.1 2.5 -0.9 41.4
2008-09 4.5 6.0 2.6 75.2
2009-10(P) 5.1 6.3 3.1 80.7
2010-11(BE) 3.5 4.8 1.7 72.5
Source: Union Budget documents.
BE-Budget estimates
P: Provisional actuals (unaudited)
FRBM : Fiscal Responsibility and Budget Management
Note: The ratios to GDP at current market prices are basedon the CSO’s National Accounts 2004-05 series.
-1
Per
cent
of
GD
P
Fiscaldeficit
Trends in deficits of Central Government
0
1
2
3
4
5
6
7
Revenuedeficit
Primarydeficit
Figure 3.2
Year
2004
-05
2007
-08
2006
-07
2008
-09
2010
-11
(BE)
2009
-10
(Pro
v)
2005
-06
44 Economic Survey 2010-11
Website: http://indiabudget.nic.in
CENTRAL GOVERNMENT FINANCES
3.5 The key driver of the rapid fiscal consolidationafter the notification of the FRBM Rules in July 2004was the buoyancy in tax revenues. As a proportionof the GDP, gross tax revenue rose from a level of9.2 per cent in 2003-04 to reach a peak level of11.9 per cent in 2007-08; after falling to 10.8 percent and 9.6 in 2008-09 and 2009-10 respectively,it was estimated to recover to 10.8 per cent in 2010-11 (BE) as per the then estimated levels of GDP.However, as a proportion of the GDP as per theadvance estimates of the CSO, it is at 9.5 per cent.Two significant developments in the recent past interms of the composition of taxes have been thegrowth in direct tax revenues, particularly corporateincome tax, and in service tax revenues. Union exciseduties that have traditionally been the single largestrevenue earner ceded place to corporate incometax in 2006-07. In 2009-10, owing to the fiscalstimulus package which envisaged significantreduction in duties and a demand slowdown, unionexcise duties declined substantially. In 2010-11, withpartial restoration in rates and surge in demand,union excise duties have done exceedingly well.With continuance of high growth in corporateincome tax and a higher than budgeted outcome inpersonal income tax in the current year, theprospects of revenue-led medium-term consolidationappears bright.
3.6 While tax revenues provided the anchor fordeepening of the fiscal consolidation process in thepost FRBM period (2004-05 to 2007-08), there wasalso some compression in the expenditure to GDPratio (Table 3.2 and Figure 3.3). Average annualgrowth in expenditure in the four-year period was11.2 per cent, below the 16 per cent growth in thenominal GDP. Besides, there were significant reform
initiatives in expenditure. First, below-the-lineissuance of bonds for financing under-recoveriesof petroleum oil companies (as also other suchbonds) was discontinued and all such funds werebrought into the Budget as subventions booked ascash expenditure. Second, the nutrient-basedsubsidy policy for fertilizers was put in place. Third,given the elevated levels of prices of internationalcrude petroleum, it was proposed that the level ofadministered prices for domestic petroleum productswould be calibrated to international prices.
Budgetary developments in 2010-113.7 Against the backdrop of the fast-pacedrecovery of the economy in 2009-10 and the elevatedlevels of food inflation as well as therecommendations of the Thirteenth FinanceCommission (ThFC), the budget for 2010-11resumed the path of fiscal consolidation to makeeconomic growth more broad based and ensurethat supply-demand imbalances are managed better.Acting on the ThFC recommendation for limitingthe combined public debt to GDP ratio to 68 percent by 2014-15, the Union Budget for 2010-11came up with a promise to analyse the issues in aStatus Paper, which would also unveil the roadmapfor reduction.
3.8 The Budget for 2010-11 indicated that effectivemanagement of public expenditure by bringing it inline with the Government’s objectives, particularlythrough proper targeting of subsidies, was a keyfactor in fiscal management. The Budget for 2010-11 also announced the operationalization of theNutrient Based Subsidy Policy for fertilizers effective1 April 2010 and indicated that the recommendationsof the Expert Group on a Viable and SustainableSystem of Pricing of Petroleum Products would alsobe operationalized in due course.
0
Per
cent
of
GD
P
Revenuereceipts
Receipts and expenditure of the Central Government
2.0
4.0
6.0
8.0
10.0
12.0
14.0
16.0
Figure 3.3
Revenueexpenditure
Capitalexpenditure
Capitalreceipts
Year
2004
-05
2007
-08
2006
-07
2008
-09
2010
-11
(BE)
2009
-10
(Pro
v)
2005
-06
45Fiscal Developments and Public Finance
Website: http://indiabudget.nic.in
Table 3.2 : Receipts and Expenditure of the Central Government
** Does not include receipts in respect of the Market Stabilization Scheme, which will remain in the cash balance of the Central
Government and will not be used for expenditure.
Note: 1. The ratios to GDP at current market prices are based on the CSO’s National Accounts 2004-05 series.
2. The figures may not add up to the total due to rounding/approximations.
46 Economic Survey 2010-11
Website: http://indiabudget.nic.in
Revenue and capital receipts
3.9 The full impact of the fiscal stimulus measuresrelating to excise duty cuts and the indirect impacton gross tax revenues became evident only in 2009-10. As a proportion of the GDP, gross tax revenuesdeclined from 10.8 per cent in 2008-09 to 9.6 percent in 2009-10; the levels would have been evenlower in 2008-09 had the nominal GDP grown attrend levels. Thus the Budget for 2010-11 partiallyrestored the excise duties and with economicrecovery gaining momentum envisaged a rise inthe tax to GDP ratio to 10.8 per cent in the currentfiscal; this implied a year-on-year growth of 19.1per cent and amounted to ` 7,46,651 crore. Therestoration of excise duty levels, albeit partial, wasexpected to result in a year-on-year growth of 26.1per cent in 2010-11 as against a level of 29.4 percent envisaged by the RE. It was also estimatedthat revenue from customs would grow at 36.5 percent in 2010-11. With service tax estimated to growby 16.3 per cent to reach a level of ` 68,000 crore,indirect taxes were estimated at ` 3,15,000 crore,implying an overall growth of 19.1 per cent in 2010-11 over 2009-10. Overall revenue from direct taxeswas expected to grow by 15.0 per cent in 2010-11to reach ` 4,22,500 crore. In part, this owed tosome positive developments arising from theeconomic recovery and growth in manufacturing/industry on the one hand and the higher levels ofexemption arising from broadening of the incometax brackets on the other. This was reflected in thebudget estimates of year-on-year growth of 23.2per cent in corporate income tax and decline of 1.4per cent in personal income tax. The varying levelsof growth in the different components of taxrevenues, given the levels of their relative shares ingross tax revenues, indicate changes in thecomposition of taxes.
3.10 At the beginning of the economic reformsprocess in 1991-92, the ratio of direct and indirecttaxes in gross tax revenue was 22.6 per cent and74.8 per cent respectively. As part of the largereconomic reforms, the reforms in the tax structureeffected through a gradual and sequencedreduction in the rates of duties in both customs andexcise together with the increase in the levels ofincome resulted in a gradual shift in the compositionof taxes. As a result in 2004-05--the year when theFRBM regime was operationalized--the ratios ofdirect and indirect taxes were 56.1 per cent and43.3 per cent of gross tax revenue; in 2009-10,
the ratios were 58.6 per cent and 39.5 per centrespectively (Table 3.3 and Figure 3.4).
Direct taxes
3.11 The Budget for 2010-11 carried forward thethrust on maintaining moderate levels of taxationand expanding the tax base. The tax slabs underpersonal income were broadened and the surchargeon corporate income tax was reduced from 10 percent to 7.5 per cent. At the same time, the rate ofminimum alternate tax was raised to 18 per cent toexpand the tax base and improve inter-se equity inthe taxation of corporates.
3.12 The Government had signalled its intentionto consolidate and comprehensively amend theexisting Income Tax Act 1961 and Wealth Tax Act1957 through a single legislation, by releasing adraft Direct Taxes Code (DTC) and a discussionpaper for public comments in August 2009. Basedon analysis of the numerous inputs received fromstakeholders, a revised discussion paper wasreleased in June 2010 followed by the introductionof the Direct Taxes Code Bill 2010 in Parliament inAugust 2010. It has now been proposed to make iteffective from 1 April 2012 (Box 3.1).
Indirect taxes
3.13 The Budget for 2010-11 had indicated thatthe formulation of indirect tax proposals was guidedby the need to return to the path of fiscalconsolidation without affecting the growth momentumof the economy and moving forward on the road toa goods and services tax (GST). There wasaccordingly a recalibration of the rates and certainrationalization and relief measures in the Budget.
3.14 The following were the important measurestaken in the Budget for 2010-11:
The standard rate of excise duty (CENVAT)which was brought down to 8 per cent after twosuccessive reductions in December 2008 andFebruary 2009 was increased to 10 per cent.
Excise duty on petrol and diesel was increasedby ` 1 per litre so as to restore it to pre-June2008 levels.
Full or partial excise duty exemptions/concessions available on some items werewithdrawn and duty imposed on them at therate of 4 per cent or 10 per cent.
* includes Taxes referred to in (a) & (b) and Taxes of Union Territories and ‘other’ Taxes.
Note: 1. Direct Taxes also include Taxes pertaining to expenditure, interest, wealth, gift, and estate duty.
2. The ratios to GDP at current market prices are based on the CSO’s National Accounts 2004-05 series.
0Per
cent
of
gros
s ta
x re
venu
e
Excise
Composition of gross tax revenue
5
10
15
20
25
30
35
40
Figure 3.4
Customs
Corporatetax
45
Personalincome tax
Servicetax
Year
1990
-91
2007
-08
2006
-07
2008
-09
2010
-11
(BE)
2009
-10
(Pro
v)
2005
-06
2004
-05
2003
-04
1995
-96
48 Economic Survey 2010-11
Website: http://indiabudget.nic.in
Box 3.1 : Direct Taxes Code (DTC)
The Direct Taxes Code Bill, 2010 introduced in Parliament, seeks to consolidate and amend the laws relating to alldirect taxes, that is income-tax, dividend distribution tax, and wealth tax so as to establish an economically efficient,effective, and equitable direct tax system which will facilitate voluntary compliance and help increase the tax to GDPratio. The salient features of the DTC are :
1.0 It consolidates and integrates all direct tax laws and replaces both the Income Tax Act 1961 and the Wealth TaxAct 1957 with a single legislation.
1.1 It simplifies the language of the legislation. The use of direct, active speech, expressing only a single pointthrough one sub-section and rearranging the provisions into a rational structure will assist a layperson to understandthe provisions of the DTC.
1.2 It indicates stability in direct tax rates. Currently, the rates of tax for a particular year are stipulated in theFinance Act for that relevant year. Therefore, even if there is no change proposed in the rates of tax, the Finance Billhas still to be passed indicating the same rates of tax. Under the Code, all rates of taxes are proposed to be prescribedin Schedules to the Code, thereby obviating the need for an annual finance bill, if no change in the tax rate isproposed. The Code proposes a corporate tax rate of 30 per cent against the current effective rate of 33.2 per cent andraises the exemption limit as well as broadens the tax slabs for personal income tax.
2.0 It strengthens taxation provisions for international transactions. In the context of a globalized economy, it hasbecome necessary to provide a stable framework for taxation of international transactions and global capital. Thishas been reflected in the new provisions. The new provisions with regard to international taxation are:
2.1 Advance Pricing Agreements for International Transactions--This will bring in certainty in transfer-pricingissues as any taxpayer can enter into an agreement with the tax administration, which will be valid for a period up tofive years, regarding the manner in which the taxpayer would compute arm’s length price in respect of the taxpayer’sinternational transactions.
2.2 Alignment of concept of residence (of a Company) with India’s tax treaties by introduction of concept of ‘placeof effective management’ instead of ‘wholly controlled’ in India.
2.3 Controlled Foreign Company Regulations--This is a provision which will assist in taxation of profits of a foreigncompany in the hands of resident share- holders who may have incorporated such a company in low tax jurisdictionsand are accumulating passive income (i.e. interest, dividends, capital gains, etc.) in the company without repatriatingthe income to India.
2.4 Branch Profit Tax on Foreign Companies–-Currently, foreign companies are taxed at the rate of 42.2 per cent(inclusive of surcharge and cess) while domestic companies are taxed at the rate of 33.2 per cent (inclusive of surchargeand cess) plus a dividend distribution tax at the rate of 16.6 per cent when they distribute dividend from accumulatedprofits. It is proposed to equate the tax rate of foreign companies with that of domestic companies by prescribing therate at 30 per cent and levying a branch profit tax (in lieu of dividend distribution tax) at the rate of 15 per cent. Thiswill provide tax neutrality between a branch and a subsidiary of a foreign company in India.
2.5 Taxation of assets held abroad under wealth tax—It is proposed to include certain assets of residents which areheld abroad, such as deposits in bank accounts in the case of individuals and interest in a foreign trust or in acontrolled foreign corporation. This will create a reporting requirement mechanism for assets held abroad.
3. Phasing out Profit-linked Tax Incentives and Replacing them by Investment-linked Incentives--It has been observedthat profit-linked deductions are inherently discriminatory, prone to misuse by shifting of profits from non-exemptto exempt entity or by reporting higher profits in exempt income entity, and also lead to high level of litigation andrevenue foregone. They also impede the Government’s efforts to give a moderate tax rate to other taxpayers as thehigher taxes paid by others by implication cross-subsidize the lower tax rates of the profit-linked deduction sectors.Such profit-linked deductions are being phased out of the Income Tax Act and have also been dropped in the DTC.They are being replaced by investment-linked deductions for specified sectors. Investment-linked incentives arecalibrated to the levels of creation of productive capacity and therefore are superior instruments. Profit-linkeddeductions currently being availed of have been protected for the unexpired period in the DTC.
4. Rationalization of Tax Incentives for Savings--In order to focus savings incentives on long-term savings for socialsecurity of the taxpayer during his non-working life, deduction of up to Rs 1 lakh has been provided for investmentsin approved provident funds, superannuation funds, and pension funds.
5. General Anti Avoidance Rule to Curb Aggressive Tax Planning—Direct tax rates have been moderated over thelast decade and are in line with international norms. A general anti-avoidance rule assists the tax administration indeterring aggressive tax avoidance in a globalized economy. Such general anti-avoidance rules already form a partof the tax legislation in a number of G-20 countries.
6. Taxation of Non-profit Organizations: It is proposed to tax non-profit organizations set up for charitable purposeson their surplus (at the rate of 15 per cent), after allowing for accumulation of a specified proportion for creation ofassets or for long-term projects, a further carry forward for receipts of the last month of the year, and also after abasic exemption limit of Rs 1 lakh. Donations to these non-profit organizations will be eligible for tax deduction inthe hands of the donor.
49Fiscal Developments and Public Finance
Website: http://indiabudget.nic.in
Excise duty on cigarettes and other tobaccoproducts was increased.
Ad-valorem component of excise duty on largecars, multi utility vehicles, and sports utilityvehicles was increased from 20 per cent to22 per cent.
Customs duty was increased on crudepetroleum from nil to 5 per cent; petrol anddiesel from 2.5 per cent to 7.5 per cent; andother specified petroleum products from 5 percent to 10 per cent—once again to restorethese duties to pre-June 2008 levels.
Customs duty on gold, silver, and platinumincreased by 50 per cent of the earlierapplicable specific rates.
Eight new services were brought under theservice tax net to broaden the tax base. Inaddition, scope of some existing taxableservices was expanded.
3.15 Fiscal concessions were given to priority/thrust areas of the economy like agriculture, foodprocessing, renewable energy and conservation ofenergy, and infrastructure. The objective was toattract fresh investments in the agricultural/foodprocessing and other related sectors like horticulture/apiary/diary/poultry for: (a) creation of farm tomarket supply chains; (b) prevention of wastage ofproduce; and (c) infusion of technology to boostproduction. In the energy sector, the aim was toreduce dependence on fossil fuels and harness thenew and clean sources of energy. In specific terms,the following major fiscal concessions were granted:
Project imports status, with concessional rateof basic customs duty of 5 per cent, forinstallation of mechanized handling systems andpallet racking systems in mandis or warehousesfor foodgrains and sugar along with exemptionfrom additional customs duty and specialadditional customs duty . Installation andcommissioning of such systems is also exemptfrom service tax.
Project imports status, with concessional rateof basic customs duty of 5 per cent, and fullexemption from service tax for the initial settingup or substantial expansion of a cold storage,cold room (including farm pre-coolers) forpreservation or storage or an industrial unit forprocessing of agricultural, apiary, horticultural,dairy, poultry, aquatic and marine produce, andmeat.
Full exemption from basic customs duty for truckrefrigeration units for the manufacture ofrefrigerated vans/trucks. Such units arealready exempt from excise duty.
Reduction of basic customs duty from 7.5 percent to 5 per cent on specified agriculturalmachinery such as paddy transplanters, laserland levellers, cotton pickers, reaper-cum-binders, straw or fodder balers, sugarcaneharvesters, tracks used for manufacture oftrack-type combine harvester, etc.
Full exemption from excise duty on specifiedequipment for preservation, storage, ortransportation of apiary, horticultural, dairy,poultry, aquatic and marine produce, and meatand processing thereof.
Exemption from service tax for transportationof cereals and pulses by road.
Exemption from service tax for testing andcertification of seeds.
Concessional basic customs duty rate of 5 percent on machinery items, instruments, andappliances required for initial setting up of solarpower generation projects or facilities. Theseitems are also exempt from excise duty.
Full exemption from basic customs duty andspecial additional customs duty for groundsource heat pump to tap geo-thermal energy.
Full exemption from excise duty on additionalspecified raw materials for the manufacture ofrotor blades for wind-operated electricitygenerators.
Mono Rail Projects for urban transport grantedproject imports status with concessional rate of5 per cent basic customs duty. Concessionalcustoms duty rate of 5 per cent presentlyavailable up to 6 July 2010 on specifiedmachinery for tea, coffee, and rubberplantations extended up to 31 March 2011.Excise duty exemption has also beenreintroduced on these items up to 31 March2011.
A uniform concessional rate of duty of 4 percent prescribed for parts, required formanufacture of all categories of electricalvehicles including cars, two wheelers, and threewheelers (like ‘Soleckshaw’) subject to actualuser condition. Such vehicles will also becharged excise duty at the rate of 4 per cent.
50 Economic Survey 2010-11
Website: http://indiabudget.nic.in
Excise duty reduced from 8 per cent to 4 percent on LED lights/lighting fixtures.
3.16 As regards simplification of procedures, witheffect from 1 April 2010 small-scale industrial (SSI)units were allowed to take full CENVAT credit oncapital goods in one instalment in the year of receiptof such goods. Facility of payment of excise dutyon quarterly basis was extended to SSI units. Therelaxation from brand name restriction under thegeneral SSI exemption scheme was extended toplastic bottles and plastic containers used as packingmaterial.
3.17 The following important relief andrationalization measures were also extended:
Varying rates of customs duty on medicalequipment were done away with and now allmedical equipment (with some exceptions)attracts 5 per cent basic customs duty, 4 percent countervailing duty (CVD)/excise duty, andnil special additional customs duty (i.e. effectiveduty of 9.2 per cent). Parts required for themanufacture and accessories of medicalequipment were also charged 5 per centconcessional basic customs duty with nil specialCVD.
Prior to the Budget, umbrellas attracted 4 percent excise duty while umbrella parts werecharged 8 per cent excise duty and umbrellacloth was fully exempt. The rate of excise dutyon umbrellas and all umbrella parts was unifiedat 4 per cent in the Budget.
Full exemption from excise duty was providedon articles of bedding wholly made of quiltedtextile materials; toy balloons made of naturalrubber; betel nut product known as ‘supari’;dementholised oil, deterpenated mentha oil,spearmint/ mentha piperita oils, and allintermediates and by-products of menthol.
Excise duty was reduced from 8 per cent to4per cent on replaceable kits for all household-type water filters (except those operating onRO technology); corrugated boxes/ cartonsmanufactured by stand-alone manufacturers;and latex rubber thread
Basic customs duty was reduced from 10 percent to 5 per cent on magnetrons of up to 1000kw for the manufacture of microwave ovens.
Promotional material like trailors of films areimported free of cost in the form of electronicpromotion kits /betacams were fully exempted
from basic customs duty and CVD. Projectimports status was accorded to ‘Setting up ofDigital Head End’ with 5 per cent concessionalbasic customs duty and nil special additionalcustoms duty .
Basic customs duty on rhodium which is usedprimarily for the manufacture of gold jewellery,was reduced from 10 per cent to 2 per cent.
The limit of ` 1 lakh per annum on duty-freeimport of samples was enhanced to ` 3 lakhper annum.
The list of exempted components, raw materials,and accessories for the manufacture of sportsgoods was enlarged by including someadditional items.
Collection rates
3.18 Various measures like simple average tariffs,weighted average tariffs, and tariff dispersionindicate the levels of protection in an economy andare often used for cross-country comparisons. Inmany emerging economies, the level of nominaltariffs as indicated in the schedule under the customsacts might be very different from the applied levelsas there are numerous exemptions. It is thereforeuseful to refer to such measures as collection ratesfor understanding the inter-temporal changes withinthe country better. The collection rates have steadilydeclined over the years. Given the fact that the ratesinclude CVDs, which are not counted as protection,the real levels of protection in India are much smaller.Barring chemicals, man-made fibres, metals, andcapital goods, the collection rates are in single digit(Table 3.4 and Figure 3.5).
Service Tax
3.19 Since its introduction in 1994-95, service taxhas helped widen the tax base of indirect taxes.There has been an increase in the number ofservices over the years (Table 3.5). The Budget for2010-11 announced the following measures:
(a) Rate of service tax was retained at 10 percent (which had earlier been reduced from12 per cent in February 2009 as part of thefiscal stimulus package).
(b) Eight new services were brought under theservice tax net:
(i) Services of promoting, marketing, ororganizing of games of chance, includinglottery.
51Fiscal Developments and Public Finance
Website: http://indiabudget.nic.in
Table 3.4 : Collection Rates for Selected Import Groups*(per cent)
Sl. CommodityNo. Groups 1990-91 2004-05 2005-06 2006-07 2007-08 2008-09 2009-10
(Prov.)
1. Food Products 47 22 32 23 19 4 3
2. POL 34 10 6 5 6 3 2
3. Chemicals 92 22 20 22 22 16 14
4. Man-made Fibres 83 39 34 28 30 17 22
5. Paper & Newsprint 24 7 9 10 10 8 8
6. Natural Fibres 20 11 13 12 13 6 4
7. Metals 95 26 25 24 24 17 17
8. Capital Goods 60 16 13 14 16 13 11
9. Others 20 6 5 6 6 4 4
10. Non-POL 51 12 12 12 13 9 8
11. Total 47 11 10 10 10 7 6
Source: Department of Revenue, Ministry of Finance
* Collection rate is defined as the ratio of revenue collection (basic customs duty + countervailing duty) to value of importsunadjusted for exemptions, expressed in percentage.
POL-Petroleum oil and lubricantsSl.No. 1 includes cereals, pulses, tea, milk and cream, fruits, vegetables, animal fats, and sugar.Sl.No. 3 includes chemical elements, compounds, pharmaceuticals, dyeing and colouring materials, plastic and rubber.Sl.No. 5 includes pulp and waste paper, newsprint, paperboards and manufactures, and printed books.Sl.No. 6 includes raw wool and silk.Sl.No. 7 includes iron and steel and non-ferrous metals.Sl.No. 8 includes non-electronic machinery and project imports and electrical machinery.
(ii) Health services, namely health check upundertaken by hospitals or medicalestablishments for the employees ofbusiness entities and health servicesprovided under health insuranceschemes offered by insurancecompanies.
(The tax on these health services would be payableonly to the extent payment for such medical check-up or preventive care or treatment, etc. is madedirectly by the business entity or the insurancecompany to the hospital or medical establishment);
(iii) Services provided for maintenance ofmedical records of employees of abusiness entity;
(iv) Services of promoting of a ‘brand’ ofgoods, services, events, businessentity, etc.;
(v) Services of permitting commercial useor exploitation of any event organizedby a person or organization;
(vi) Services provided by electricityexchanges;
0
Per
cent Total
Collection rates for selected import groups
10
20
30
40
50
60
70
Figure 3.5
Foodproducts
POL
Capitalgoods
Year
1990
-91
2007
-08
2006
-07
2008
-09
2009
-10
(Pro
v)
2005
-06
2004
-05
2003
-04
2002
-03
2001
-02
2000
-01
1995
-96
52 Economic Survey 2010-11
Website: http://indiabudget.nic.in
(vii) Services related to two types ofcopyrights hitherto not covered underexisting taxable service ‘IntellectualProperty Right (IPR)’, namely those on(a) cinematographic films; and (b)sound recording;
(viii) Special services provided by a builder,etc. to prospective buyers such asproviding preferential location orexternal or internal development ofcomplexes on extra charges.
(c) Certain modifications were made in thedefinition of existing taxable services to widenthe scope of the levy of service tax:
The scope of the taxable service ‘AirPassenger Transport Service’ expanded toinclude domestic journeys andinternational journeys in any class;
Prior to the Budget, ‘InformationTechnology (IT) Software Service’ wassubject to tax only in cases where such ITsoftware is used for furtherance ofbusiness or commerce. The scope of thetaxable service expanded to tax suchservice even if the service provided is usedfor purposes other than business orcommerce;
An explanation was added in the definitionof the taxable service ‘Commercial Trainingor Coaching Service’ to clarify that the term‘commercial’ appearing in the relevantdefinitions only means that such trainingor coaching is being provided for aconsideration whether or not such trainingor coaching is conducted with a profitmotive. This change was givenretrospective effect from 01.07.2003;
In the definition of the taxable service‘Sponsorship Service’, the exclusionrelating to sponsorship pertaining to sportswas removed;
In the definition of ‘Construction of ComplexService’, and ‘Commercial or IndustrialConstruction Service’, it was provided thatunless the entire consideration for theproperty is paid after the completion ofconstruction (i.e. after issuance ofcompletion certificate by the competentauthority), the activity of construction wouldbe deemed to be a taxable service providedby the builder/promoter/developer to theprospective buyer and the service taxwould be charged accordingly;
Amendments were made in the definitionof the taxable service ‘Renting of ImmovableProperty’ to: (i) provide explicitly that theactivity of ‘renting’ itself is a taxable service.This change was given retrospective effectfrom 1June 2007; and (ii) provide thatrenting of vacant land, where theagreement or contract between the lessorand lessee provides for undertakingconstruction of buildings or structures onsuch land for furtherance of business orcommerce during the tenure of the lease,shall be subject to service tax;
The definitions of the taxable services,‘Airport Services’, ‘Port Services’, and the‘Other Port Services’ were amended toprovide that (a) all services providedentirely within the airport/port premiseswould fall under these services; and (b)an authorization from the airport/portauthority would not be a precondition fortaxing these services;
Table 3.5 : Service Tax-A Growing RevenueSource
No. of Tax Revenue GrowthServices* Rate ( `̀̀̀̀ crore) in per
Source : Receipts Budget and Controller General ofAccounts.* Based on new entries added each year.** Growth for 2010-11 (April-December) is over
corresponding period previous year.*** Reduced to 10 per cent w.e.f. 24-2-2009.P : Provisional actuals (unaudited)
53Fiscal Developments and Public Finance
Website: http://indiabudget.nic.in
An explanation was added in the definitionof the taxable service‘ Auctioneer’s Service’to clarify that the phrase ‘auction byGovernment’ means an auction involvingsale of Government property by anyauctioneer and not when the Governmentacts as an auctioneer for sale of a privateproperty;
The definition of ‘Management ofInvestment under ULIP Service’ wasamended to provide that the value of thetaxable service for any year of theoperation of policy shall be the actualamount charged by the insurer formanagement of funds under ULIP or themaximum amount of fund managementcharges fixed by the Insurance Regulatoryand Development Authority (IRDA),whichever is higher;
(d) Certain exemptions from service tax wereprovided:
Statutory taxes charged by anyGovernment (including foreignGovernments, where a passengerdisembarks) on air passengers wereexcluded from taxable Value for thepurpose of levy of service tax under theAir Passenger Transport Service;
Exemption was provided from service taxon air transport of passengers for journeysoriginating from the north-eastern Region;
Exemption from service tax was providedto services relating to ‘Erection,Commissioning or Installation’ of,
Mechanized Food Grain HandlingSystems, etc.;
Equipment for setting up or substantialexpansion of cold storage; and
Machinery/equipment for initial settingup or substantial expansion of units forprocessing of agricultural, apiary,horticultural, dairy, poultry, aquatic,marine, or meat products;
Packaged IT software, pre-packed in retailpackages for single use, was exemptedfrom service tax leviable under IT SoftwareService, subject to specified conditions.
These conditions include that either thecustoms duty (in case of import) or exciseduty (in case of domestic production) hasbeen paid on the entire amount receivedfrom the buyer;
scope of exemption from service taxavailable for transport of fruits, vegetables,eggs, or milk by road by a goods transportagency was expanded by includingfoodgrains and pulses in the list of exemptedgoods;
Exemption from service tax was providedto Indian news agencies under ‘OnlineInformation and Database Retrieval Service’and ‘Business Auxiliary Service’ subject tospecified conditions ;
Exemption from service tax for ‘TechnicalTesting and Analysis Service’ and ‘TechnicalInspection and Certification Service’provided by Central and State seed testinglaboratories, and Central and State seedcertification agencies;
Exemption from service tax provided fortransmission of electricity.
Tax Expenditure
3.20 Tax expenditure statement (Statement ofrevenue foregone on account of tax incentives orpreferences) was first placed before Parliament inthe Budget for 2007-08. The estimates are somewhatcounterfactual in nature and seek to quantify thepotential revenue (including through a samplingprocess) had these exemptions been not given;assume that tax base and other conditions remainunaltered. Subsequently this continued to bepublished every year and in the Budget for 2010-11, tax foregone on account of exemptions undercorporate income tax for 2008-09 and 2009-10 wasestimated at ` 66,901 crore and ` 79,554 crorerespectively. Accelerated depreciation, deductionof export profits of units located in softwaretechnology parks and of export-oriented units(EOUs) were some of the major items under suchcorporate exemptions. Tax foregone on account ofexemptions under personal income tax wasestimated at ` 33,216 crore and ` 36,186 crorerespectively in 2008-09 and 2009-10 with deductionon account of certain eligible investments andexpenditures under section 80C of the IncomeTaxAct being the main exemptions.
54 Economic Survey 2010-11
Website: http://indiabudget.nic.in
3.21 Revenue foregone estimates in excise andcustoms broadly correspond to the differences instatutory or Schedule rates of duties and theeffective or applied rates of duties multiplied by thevalue assessed. Total revenue foregone in excisefor 2008-09 was estimated at ` 1,35,496 crore, ofwhich area-based exemptions amounted to ̀ 10,589crore. Tax expenditure is estimated to have risen to` 1,70,765 in 2009-10 with area-based exemptionsaccounting for only ` 5,882 crore. In customs,revenue foregone under various exemptions wasestimated to be of the order of ` 2,02,240 crore in2008-09 and ` 2,18,191 crore in 2009-10. Thefollowing sectors benefited the most from suchexemptions: crude oil and mineral oils; machinery;diamond, gold and jewellery; edible vegetable, fruits,cereals, edible oils; chemicals and plastics; andprimary metals and articles thereof. Revenueforegone on account of various export promotionschemes was estimated at ̀ 44,417 crore in 2008-09 and ` 37,970 crore in 2009-10. Overall, taxexpenditure as a proportion of aggregate taxcollection was placed at 68.6 per cent in 2008-09and is estimated to have risen to 79.5 per cent in2009-10.
Expenditure trends
3.22 In a 2x2 schema of classification of publicexpenditure into revenue and capital, and Plan andnon-Plan, the thrust of public expendituremanagement policies, particularly in terms of FRBMcommitments, has been on containing non-Planrevenue expenditure and raising the levels of Planexpenditure, preferably the capital variety. Non-Planrevenue expenditure has five major components,namely interest payments, subsidies, defence
expenditure, pay, and pensions. As a proportion ofthe GDP, defence expenditure and interest paymentshave been more or less stable. Given the committednature of other expenditure, the immediate and realcompression under this classification could onlycome from subsidies; hence the focus on reformsin subsidies in recent budgets. Front loading of Planexpenditure was possible in 2008-09 and 2009-10in view of the fiscal expansion to combat the adverseimpact of the global crisis. Though an amount of `3,25,149 crore (equivalent of 5.6 per cent of theGDP) was earmarked as Plan expenditure in Budgetestimates for 2009-10, as per the provisional actualdata released by the Controller General of Accounts(CGA), plan expenditure was at ` 3,02,199 crore(equivalent of 4.6 per cent of the GDP). As per theBudget for 2010-11, plan expenditure for the currentfiscal was placed at ̀ 3,73,092 crore, equivalent of4.7 per cent of the GDP. (Figures 3.6 and 3.7)
Interest payments
3.23 The levels of outstanding liabilities in end-March and assumption of incremental liabilitiesduring the fiscal have a crucial bearing on the levelsof interest payments in a given year. Reflecting theless than prudent fiscal management of the past,interest payments have been growing at a steadyrate and appropriating about 35 per cent of therevenue receipts in the last five years. Given thefact that the levels of outstanding liabilities couldonly come down in the medium to long term withfiscal consolidation, one of the important targets ofthe FRBM framework was the progressive reductionin assumption of incremental liabilities. Reflectingthis, as a proportion of the GDP, interest paymentscame down from 4.5 per cent in 2003-04 to 3.4 per
0
� t
hous
and
cror
e
Trends in Centre's revenue expenditure
100
200
300
400
Interest payments
Major subsidies
Defenceexpenditure
Grants to statesand UTs
Figure 3.6
Year
2003
-04
2007
-08
2006
-07
2008
-09
2010
-11
(BE)
2009
-10
(Pro
v)
2005
-06
2004
-05
50
150
250
350 Others
55Fiscal Developments and Public Finance
Website: http://indiabudget.nic.in
cent in 2007-08. Net of the interest payments on theNational Small Savings Fund (NSSF), the averagecost of borrowing has risen to 7.9 per cent from 7.7per cent in 2010-11 in the current fiscal reflectingthe higher levels of debt outstanding last year (Table3.6 and Figure 3.8).
Subsidies
3.24 As a proportion of the GDP, subsidies havegrown from 1.4 per cent in 2004-05 to 2.3 per centin 2008-09 (Figure 3.9). Below-the-line bonds issuedin lieu of subsidies also rose to a level of ̀ 1,10,510crore in 2008-09 (2 per cent of the GDP). This risein subsidies owes to the elevated levels of globalcrude oil prices and the less than full pass throughof the international prices to the domestic marketsand is also reflected in fertilizer subsidies as costof feedstock is the major cost. Following the globalfinancial crisis, there was a brief respite;nevertheless global crude prices have started totrend up. Some of the subsidies were also nottargeted properly. The Budget for 2010-11 alsoannounced the intent of bringing all subsidy-relatedliabilities to fiscal accounting. It was in this contextthat the recent Budgets have focused onrestructuring the subsidy regime in fertilizers andpetroleum. As a first step, pricing of petrol (motorspirit) was liberalized and a modest hike inadministered prices of kerosene and LPG (liquefiedpetroleum gas) was announced. The retail sellingprice of public distribution system (PDS) kerosenewas increased by ` 3 per litre in Delhi withcorresponding increase in the rest of the countryand the price of domestic LPG was increased by` 35 per cylinder (14.2 kg) in Delhi with correspondingincrease in the rest of the country.
Supplementary demands for grants
3.25 Supplementary demands for grants are placedbefore the Parliament to include all those expenditureproposals (excess or fresh or reappropriations) thatwere not envisaged at the time of presentation of theBudget and have to be incurred in the current year.Two supplementary demands for grants have so farbeen presented in the current fiscal. The first batchwas approved by Parliament in August 2010
Table 3.6 : Interest on Outstanding InternalLiabilities of Central Government
Out- Interest Averagestanding on Cost ofInternal Internal Borrowings
Liabilities Liabilities (per cent per annum)
(`̀̀̀̀ crore)
2004-05 1603785 105176 7.2
2005-06 1752403 111476 7.0
2006-07 1967870 128299 7.3
2007-08 2247104 149801 7.6
2008-09* 2565991 170388 7.6
2009-10(RE) 2902990 198797 7.7
2010-11(BE) 3306626 227942 7.9
Source: Union Budget documents.* Excludes `̀̀̀̀ 563 crore towards premium on account ofdomestic debt buyback scheme and prepayment ofexternal debt.
Note: 1. Average cost of borrowing is the percentageof interest payment in year ‘ t’ to outstandingliabilities in year ‘t-1’.
2. Outstanding internal liabilities exclude NSSFloans to States,with no interest liability on thepart of the Centre.
3. The figures of interest payments reported inthe earlier issues may differ as these figuresare net of interest payments on NSSF paid bythe Government since 1999-2000 i.e. constitutionof the NSSF.
20
Per
cent
Year
Composition of revenue expenditure
40
60
80
100
Interest payments
Major subsidies
Defenceexpenditure
Grants to statesand UTs
Others
2003-04 2004-05 2005-06 2006-07 2007-080
Figure 3.7
34.3
12.0
11.9
13.4
28.4
33.0
11.6
11.4
14.0
29.9
30.2
10.1
11.0
16.8
31.9
29.2
10.4
10.0
16.5
33.9
28.8
11.4
9.1
18.2
32.5
24.2
15.6
9.2
15.6
35.4
23.3
13.6
10.0
15.5
37.6
25.9
11.4
9.1
16.1
37.4
2009-10(Prov.)
2010-11(BE)
2008-09
56 Economic Survey 2010-11
Website: http://indiabudget.nic.in
(61 grants and two appropriations) for total grossadditional expenditure of ̀ 68,294.3 crore, of whichthose with a net cash outgo aggregated to ̀ 54,588.6crore. The main items entailing cash outgo includedcompensation to oil companies (` 14,000 crore);additional requirement of the Pradhan Mantri GramSadak Yojana(PMGSY) (` 7,337.5 crore); andtransfers to State and Union Territories Governments(` 6,379 crore). The second batch of supplementarydemands for grants approved by Parliament inDecember 2010 included 56 grants and twoappropriations. Total gross additional expenditureapproved by Parliament was ̀ 44,945.5 crore. Thisinvolves a net cash outgo aggregate of ` 19,812.4crore and technical supplementary involving grossadditional expenditure, matched by savings of theministries/departments or by enhanced receipts/recoveries aggregates of ̀ 25,132.5 crore. The mainitems entailing cash outgo included compensationto the Department of Fertilizers (` 5,000 crore) andthe Department of Food and Public Distribution (`5,000 crore); additional requirement for Central
paramilitary forces (` 2,000 crore); and additionalrequirement of the PMGSY (` 3,000 crore).
Central Plan outlay
3.26 With a higher level of gross budgetary support(GBS) of ` 2,29,163 crore and internal and extrabudgetary resources (IEBR) of Central public-sectorenterprises (CPSEs) of ` 1,96,427 crore, CentralPlan outlay was placed at ̀ 4,25,590 crore for 2009-10 ( revised estimates—RE). The GBS constituted53.8 per cent of the total outlay. With a growth of23.2 per cent over 2009-10 (RE), the Central Planoutlay now stands at ̀ 5,24,484 crore in the Budgetfor 2010-11. The outlay comprised budgetary supportof ̀ 2,80,600 crore and IEBR of CPSEs of ̀ 2,43,884crore. The broad sector-wise allocations for importantsectors included energy (27.9 per cent); socialservices (24.3 per cent); transport (19.4 per cent);communication (3.5 per cent); rural development(10.5 per cent); industry and minerals (7.4 per cent);agriculture and allied activities (2.3 per cent); andirrigation and flood control (0.1 per cent). Central
0
� t
hous
and
cror
eInterest on internal liabilities and average interest cost of borrowing
50
100
150
200
Figure 3.8
6
8
9
10
11
Per
cent
per
ann
um
Interest oninternalliabilities
(�)
Averagecost of
borrowing(%)
250 12
1990
-91
1991
-92
1992
-93
1993
-94
1994
-95
1995
-96
1996
-97
1997
-98
1998
-99
1999
-00
2000
-01
2001
-02
2002
-03
2003
-04
2004
-05
2005
-06
2006
-07
2007
-08
2008
-09
2009
-10
(RE)
2010
-11
(BE)
Year
7
0
� t
hous
and
cror
e
Subsidies as per cent of GDP
20
40
60
80
100
120
Figure 3.9
Per
cent
of
GD
P
0
1.0
1.5
2.0
2.5
3.0 Subsidies
Subsidiesas % of
GDP
140 3.5
0.5
Year
2004
-05
2007
-08
2006
-07
2008
-09
2010
-11
(BE)
2009
-10
(RE)
2005
-06
57Fiscal Developments and Public Finance
Website: http://indiabudget.nic.in
assistance to State and UT Plans in 2010-11 (BE) isplaced at ` 92,492 crore, a growth of 7.5 per centover 2009-10 (RE).
Government debt
3.27 In many countries, the fiscal rules also includea debt reduction target. The FRBM Rules 2004contain an incremental assumption rule for publicdebt which states that ‘the Central Government shallnot assume additional liabilities (including externaldebt at current exchange rate) in excess of 9 percent of GDP for the financial year 2004-05 and ineach subsequent financial year, the limit of 9 percent of GDP shall be progressively reduced by atleast one percentage point of GDP’. There is,however, no explicit rule targeting reduction in theoverall level of public debt. As a proportion of theGDP, public debt could come down through limitingits growth relative to growth in nominal GDP orthrough lower assumption of incremental liabilitiesor retirement of debt. The ThFC had recommendedlimiting the combined debt of the Centre and Statesto 68 per cent of the GDP by 2014-15. The Budgetfor 2010-11 announced the intent of bringing out astatus paper giving detailed analysis of the situationand a roadmap for curtailing overall public debtwithin six months. A status paper was presented tothe Parliament on November 2010 (Box 3.2).
3.28 As a proportion of the GDP, the outstandinginternal liabilities of the Central Government fell froma level of 58.7 per cent in 2005-06 to 51.5 per centin 2009-10 (RE). They were budgeted at 48 percent of the GDP in 2010-11 (Table 3.7A and Figure3.10). There has been steady decline in the levelstill 2007-08 subsequent to the operation of the FRBMAct. Thereafter there has been moderation indecline following the fiscal expansion in 2008-09and 2009-10; a modest deterioration is evident in2010-11 (BE) (Table 3.7B). This is also reflected inthe assumption of incremental liabilities, which havesignificantly gone up in the last two years.
Economic and functional classification ofthe Budget
3.29 While analysis on the basis of fiscal indicatorsare instructive in understanding the fiscal situationand management thereof, the macroeconomicdimensions of fiscal policies are better understoodthough a reclassification of the fiscal magnitudes interms of national income aggregates. The Economic
and Functional Classification of the CentralGovernment Budget details the impact of theoperations of the Central Government on the levelsof consumption expenditure and capital formation.Of the total expenditure of ` 10,79,985 crore in BE2010-11 (equivalent of 13.7 per cent of the GDP),21 per cent was used up as consumption expenditure(amounting to ` 2,24,027 crore or 2.8 per cent ofthe GDP) and 18 per cent resulted in capitalformation (amounting to ` 1,94,473 crore or 2.5per cent of the GDP) with the rest being accountedfor as transfer payments (mainly to States).The levelsof dissavings of the Government came downprogressively and in 2007-08 became positivesavings; however, the fiscal expansion resulted inthe re-emergence of dissavings in 2008-09 (Table3.8). After briefly going up in 2008-09 to a level of` 2,53,712 crore, the dissavings of the Governmentwere estimated at ̀ 1,92,705 crore in 2010-11 (BE).As the gap between the level of savings and capitalformation is financed preponderantly by draft onthe other sectors of the domestic economy, thereversal of dissavings is an imperative.
Fiscal outcome
3.30 The outcomes in terms of key fiscal indicatorswere much better than was envisaged by the Budgetestimates on account of the higher than estimatedrevenue from telecom 3G/BWA auctions and indirecttaxes. The headroom so available facilitatedadditional expenditure proposed throughsupplementary demands for grants. The data onUnion finances for April-December 2010 releasedby the CGA on 31 December 2010 indicated thatthe key fiscal indicators were broadly on theconsolidation track charted by the Budget for 2010-11. Growth in gross tax revenue in the nine monthsof the current fiscal was 26.8 per cent (year-on-year) as against a level of 17.9 per cent envisagedfor the fiscal by the BE. Non-tax revenues grew by136.4 per cent in the first nine months of currentfiscal as against a level of growth of 23.7 per centin the corresponding period last year and 32 percent envisaged by the BE. Revenue receipts grewby over 50 per cent in the first nine months (Table3.9). In major taxes the following were the year-on-year growth rates (as against growth envisaged bythe BE): customs 65.8 per cent (36.1 per cent);Central excise 36.5 per cent (29.4 per cent), servicetax 19.7 per cent (17.2 per cent); corporate incometax 20.4 per cent (18.1 per cent), and personal
58 Economic Survey 2010-11
Website: http://indiabudget.nic.in
Box 3.2 : Government Debt Report
In pursuance of the announcement made in the Budget for 2010-11 to this effect, a status paper on Government debtwas presented in November 2010. The paper made a detailed analysis of the situation and chalked out a roadmap forreduction in overall debt as a percentage of the GDP for the General Government during the period 2010-11 to 2014-15. The salient features of the report are detailed as follows:
The objectives of the debt management policy are to meet Central Government’s financing need at the lowestpossible long-term borrowing costs and also to keep the total debt within sustainable limits . Additionally, it aimsat supporting development of a well-functioning and vibrant domestic bond market.
The three important attributes of Government debt include source of financing, fixed interest nature of debt, andlong residual maturity. Of the overall Central Government debt, about 92 per cent is internal debt and 8 per centis external debt. Internal debt largely consists of market loans in the form of dated securities which are contractedthrough auction. Most of the dated securities (97 per cent) are fixed coupon and only the balance 3 per cent arefloating rate bonds. The weighted average maturity of these dated securities is about 10 years while the weightedaverage interest rate is about 7.8 per cent per annum.
Subsequent to the Report of the ThFC which had estimated debt to GDP ratios and a roadmap for its reduction,the CSO revised the nominal GDP significantly and as per the revised data the reduction in the levels of debt asproportion of the GDP could be made even with higher than recommended fiscal deficits. As such, a higher thanThFC recommended target was preferred whereby the fiscal deficit of the Centre would be reduced to 3 per centof the GDP by 2014-15 and accordingly debt as a proportion of the GDP would come down from 50.5 per cent in2009-10 to 43 per cent in 2014-15.
The outstanding debt of State Governments is estimated at 26.3 per cent of the GDP for 2009-10. However, afternetting of the liabilities on account of investments made in 14-days treasury bills of Central Government, thiscomes down to 24.8 per cent of the GDP. The roadmap for States has been prepared with fiscal deficit as apercentage of the GDP at the level recommended by the ThFC. With the foregoing assumption on fiscal deficit,consolidated debt for State Governments is estimated to reduce from 24.8 per cent of the GDP in 2009-10 to 23.1per cent in 2014-15.
After factoring in the impact of Central loans to States, the consolidated debt of General Government has comedown from 79.3 per cent in 2004-05 to 68.7 per cent in 2007-08. However, it has subsequently increased during theglobal economic crisis period to 71.1 per cent in 2008-09 and further to 73 per cent of the GDP in 2009-10. It may berecalled that the 12th Finance Commission had recommended a consolidated debt for the Centre and State Governments at 74 percent of the GDP for the year 2009-10. Even with slippage in 2008-09 and 2009-10 on fiscal deficit targets, the overall GeneralGovernment debt at 73 per cent of the GDP in 2009-10 has remained within the recommended target.
The suggested roadmap for consolidated General Government debt sets a target of reduction from 73 per cent ofthe GDP in 2009-10 to 64.9 per cent in 2014-15. This shows a reduction of 8.1 per cent of the GDP in the consolidateddebt for the General Government.
In the roadmap suggested for debt reduction during the period 2010-11 to 2014-15, the Government’s commitmenttowards fiscal consolidation has been reiterated. With the reduction in fiscal deficit for 2010-11, the trend witnessedin the last two years of increasing debt has been arrested. The Government has undertaken concerted efforts to reduce thefiscal deficit gradually so as to bring down the debt as a proportion of the GDP to the pre-crisis level of 68.7 per cent by 2013-14 and further improve to about 65 per cent of the GDP in 2014-15.
0
Totaloutstanding
liabilities
Debt GDP ratios
10
20
30
40
50
60
70
Figure 3.10
Internalliabilities
Marketborrowings
Externaldebt
(outstand-ing)
Per
cent
of
GD
P
Year
2004
-05
2007
-08
2006
-07
2008
-09
2010
-11
(BE)
2009
-10
(RE)
2005
-06
59Fiscal Developments and Public Finance
Website: http://indiabudget.nic.in
Table 3.7A : Outstanding Liabilities of the Central Government
(e) Contingent Liabilities ofCentral Government (` crore) 110626 109826 104872 113335 n.a. n.a.Contingent Liabilities ofCentral Government(as per cent of GDP) 3.0 2.6 2.1 2.0 n.a. n.a.
(f) Total Assets (` crore) 1194446 1339119 1571668 1569043 1590027 1754040Total Assets(as per cent of GDP) 32.3 31.2 31.5 28.1 24.3 22.3
Source: 1. Union Budget documents. 2. Controller of Aid Accounts and Audit. 3. Reserve Bank of India. n.a. : not available
* External debt figures represent borrowings by Central Government from external sources and are based uponhistorical exchange rates.
@ Converted at year end exchange rates. For 1990-91, the rates prevailing at the end of March,1991; For 1999-2000, therates prevailing at the end of March, 2000 and so on.
# Internal debt includes net borrowing of ` ` ` ` ` 29,062 crore for 2005-06, `̀̀̀̀ 62,974 crore for 2006-07, ` ` ` ` ` 1,70,554 crore for2007-08, ` ` ` ` ` 88,773 crore for 2008-09, ` ` ` ` ` 2,737 crore for 2009-10(RE) and ` ` ` ` ` 50,000 crore for 2010-11(BE) under the MarketStabilisation Scheme.
## This includes marketable dated securities held by the RBI.Note : The ratios to GDP at current market prices are based on the CSO’s National Accounts 2004-05 series.
60 Economic Survey 2010-11
Website: http://indiabudget.nic.in
Table 3.7B : Incremental Net Liabilities of the Central Government*
Target as per FRBM Rules 8 7 6 5 4 3(as per cent of GDP)
Actual ( ` crore) 265723 278451 298829 321753 356728 428692
Actual as per cent of GDP 7.2 6.5 6.0 5.8 5.4 5.4
*Incremental net liablities assumed has been compiled from data on liabilities given in Annex 3(i) of ReceiptsBudget, 2010-11.
income tax 13.1 per cent (-3.6 per cent).
3.31 Year-on-year growth in total expenditure in thefirst nine months of the current fiscal was at 11.2 percent as against a level of 18.5 per cent in 2009-10(April-December) and 8.5 per cent envisaged for thefull year by BE 2010-11. While Plan expenditure grewby 18.9 per cent in April-December 2010-11 asagainst 23.0 per cent in 2009-10 (April-December),non-Plan expenditure grew by 7.9 per cent as against16.6 per cent. As per the CGA, 84.7 per cent of thegross market borrowings were completed by end ofDecember 2010. Reflecting the above trend in revenueand expenditure, revenue deficit was placed at` 1,16,309 crore, which was 42.1 per cent of its BEand lower by 53.7 per cent than the April-December2009 level. Fiscal deficit was ̀ 1,71,249 crore, whichcame to 44.9 per cent of its BE (Table 3.10) andrepresented a decline of 44.8 per cent over thelevel in April-December 2009. The deficit indicatorswould thus remain at targeted levels even with apickup in expenditure in the next three months.
PERFORMANCE OF DEPARTMENTAL
ENTERPRISES OF THE CENTRAL
GOVERNMENT
Railways3.32 Indian Railways achieved a freight loadingof 887.79 million tonnes in 2009-10 with anincremental loading of 54.40 million tonnes over thelevels in 2008-09. However, freight loading during2009-10 fell short of the revised target by 2.2 milliontonnes. Consequently freight earnings at ̀ 58,502crore, though registering a growth of 9.5 per centover 2008-09, fell short of the revised target for2009-10 by ` 214 crore. Passenger earnings(excluding other coaching earnings) during 2009-10 were ` 23,488 crore as against ` 21,931 crorein 2008-09, registering an increase of 7.1 per cent.Overall traffic revenues for 2009-10 at ` 87,105
crore posted a growth of 9.1 per cent over 2008-09. Taking into account further accumulation of` 141 crore in the traffic outstandings, the grosstraffic receipts of the Railways for 2009-10 stood at` 86,964 crore.
3.33 Ordinary working expenses at ̀ 65,810 croreduring 2009-10 showed an increase of 21.1 percent over the preceding year. This higher growthin ordinary working expenses was primarilyattributable to payment of the second instalment (60per cent) of arrears of the Sixth Central PayCommission. The total working expenses includingappropriations for Depreciation Reserve Fund andPension Fund at ` 82,915 crore recorded anincrease of 15.4 per cent over the preceding year.
3.34 Taking into account the net variation of themiscellaneous receipts and miscellaneousexpenditure, Railways net revenue in 2009-10 was` 5,544 crore. After fully discharging the dividendliability of ` 5,543 crore for the fiscal, Railwaysduring 2009-10 generated an excess of around` 1 crore. Lower growth of traffic revenues on accountof prevailing economic conditions, stiff increase inworking expenses due to implementation of the SixthCentral Pay Commission recommendations andinflationary factors have adversely affected thefinancial health of the Railways in 2009-10, whichis reflected in its Operating Ratio1 deteriorating to95.3 per cent as against 90.5 per cent in 2008-09.The net revenue as a proportion of capital-at-chargeand investment from the Capital Fund for the fiscalwas 4.5 per cent.
3.35 The Plan Outlay for 2009-10 stood at ̀ 39,235crore including internally generated resources of` 12,196 crore (31 per cent of the total outlay) andmarket borrowings of ` 9,323 crore by the IndianRailway Finance Corporation which also includesborrowing for Rail Vikas Nigam Limited. Apart fromstrengthening of the golden quadrilateral under the
1The Operating Ratio represents the percentage of working expenses to traffic earnings.
61Fiscal Developments and Public Finance
Website: http://indiabudget.nic.in
Table 3.8 : Total Expenditure and Capital Formation by the Central Government and its Financing
(As per Economic and Functional Classification of the Central Government Budget)
2 Current Transfers 297267 356560 408676 543347 594989 651168
(As per cent of GDP)
1 Consumption Expenditure 3.1 2.8 2.6 3.1 3.5 2.8
2 Current Transfers 8.1 8.3 8.2 9.7 9.1 8.3
Source: Ministry of Finance, An Economic and Functional classification of the Central Government Budget-various issues.Notes: (i) Gross capital formation in this table includes loans given for capital formation on a gross basis. Consequently
domestic capital receipts include loan repayments to the Central Government.(ii) Consumption expenditure is the expenditure on wages and salaries and commodities and services for current use.
(iii) Interest payments, subsidies, pension etc. are treated as current transfers.(iv) Gross capital formation and total expenditure are exclusive of loans to States’/UTs’ against States’/UTs’ share in the small
savings collection.(v) The figures of total expenditure of the Central Government as per economic and functional classification do not tally with
figures given in the Budget documents. In the economic and functional classification, interest transferred to DCUs, loanswritten off etc, are excluded from the current account. In the capital account, expenditure financed out of Railways, Postsand Telecommunications own funds, etc. is included.
(vi) The ratios to GDP at current market prices are based on the CSO’s National Accounts 2004-05 series.
62 Economic Survey 2010-11
Website: http://indiabudget.nic.in
Table 3.9 : Central Government Finances
Budget April-December Col.4 as Per centEstimates per cent of change
Source: Controller General of Accounts, Ministry of Finance.
National Rail Vikas Yojana, certain important projectsand land acquisition work on dedicated freightcorridors are in progress. Railways has also startedwork on setting up of some mega workshops to meetits rolling stock requirements. It is also modernizingand upgrading its systems to augment rail services.
Department of posts
3.36 The gross receipts of the Department of Postsin 2009-10 were placed at ` 6,266.7 crore. Thegross and net working expenses during the year were` 13,346.9 crore and ` 12,908 crore respectively,
yielding a deficit of ` 6,641.3 crore. In the currentfiscal as per BE 2010-11, the gross receipts arebudgeted to go up to ̀ 6,955.5 crore and with grossand net working expenses estimated at ̀ 11,328.8crore and ` 10,892.1 crore respectively, the deficitis projected to be ̀ 3936.6 crore.
3.37 India Post is the largest Postal network inthe world and provides access to postal services ataffordable rates to all citizens in the country throughits vast network, which has grown from 23,344 postoffices at time of Independence to 1,54,979 postoffices as on 31 March 2010. Of the total, 1,39,173
63Fiscal Developments and Public Finance
Website: http://indiabudget.nic.in
post offices are in rural areas and 15,797 in urban.India Post has introduced franchisee outlets to caterto the growing demand for postal services where itis not possible to open departmental post offices.As on 31 March 2010, 1082 franchised outlets havebeen opened. The Department of Posts has beengiven the responsibility of disbursing wages to theMahatma Gandhi National Rural EmploymentGuarantee Scheme (MGNREGS) beneficiariesthrough post office savings bank accounts. Nearly4.67 crore MGNREGS Accounts have been openedup to October 2010 and the wages amounting to `7113 crore have already been disbursed during thecurrent financial year (up to October 2010). A totalof ̀ 18,876 crore has been disbursed as wages toMGNREGS beneficiaries through post offices sincethe inception of the scheme.
Broadcasting
3.38 Prasar Bharati, a public service broadcaster,incurred a total expenditure of ` 2949.4 crore in2009-10 (excluding charges on account of the spacesegment and spectrum charges and interest anddepreciation costs). The total gross revenue earnedin 2009-10 was ̀ 1352.7 crore and the net revenueworked out to ` 1176.3 crore. Prasar Bharati hastaken a number of steps to increase revenuegeneration by adopting aggressive marketing strategy
and catering to the advertising needs of variousentities through a single window facility. Doordarshanas Host Broadcaster for the Commonwealth Games(CWG) provided the entire TV coverage of the CWGin HDTV format, a noteworthy achievement in thebroadcasting sector. As Right Holder Broadcaster,Doordarshan provided customized TV coverage ofCWG for Indian viewers besides launching an HDTVchannel called DDHD to provide high quality services.Digitalization of the All India Radio network is one ofthe major thrust areas of the Eleventh Plan. There isan approved scheme of digitalization of transmitters,studios, and connectivity which, inter alia, envisagesdigitalization of 98 studios and connectivity and 100watts FM digital compatible transmitters at 100locations. Government has allocated a total ̀ 2,050crore including CWG 2010 in BE 2010-11 to coverthe resource gap in Prasar Bharati.
State-level finances
3.39 In the post-FRBMA period the performance ofcombined States was impressive with fiscal deficitdeclining to 2.4 per cent of the GDP in 2005-06and further to 1.5 per cent in 2007-08. With theexception of 2009-10 (RE), the level of fiscal deficithad remained below the 3 per cent of GDP mark. In2010-11 (BE), it has been estimated at 2.5 per centof the GDP (Table 3.11 and Figure 3.11). A more
Table 3.10 : Trends in Cumulative Central Government Finance (April-December) for 2010-11
Budget April April- April- April- April- April- April- April- April-Estimates May June July August Sept. Oct. Nov. Dec.
Source: Controller General of Accounts, Ministry of Finance.
64 Economic Survey 2010-11
Website: http://indiabudget.nic.in
noteworthy feature has been that a surplus onrevenue account has been recorded in the three-year period 2007-08 and 2008-09. Revenue receiptsgrew at the rate of 17.6 per cent and 10.7 per centfor 2007-08 and 2008-09 respectively. Buoyantrevenues of the States (as also Centre) and non-taxreceipts combined with a moderate growth inrevenue have helped in this regard. However, thereare significant variations among States in respectof these indicators.
State-level Reforms
3.40 Given the exceptional circumstances of 2008-09 and 2009-10, the fiscal consolidation process ofthe States was disrupted. States would be able toget back to their fiscal correction path by 2011-12,allowing for a year of adjustment in 2010-11. Thestimulus packages of the Central Government aswell as those announced by individual States coupledwith the increased transfers recommended by theThFC have implications for the financial position ofthe States in the medium term. Therecommendations of ThFC for the period 2010-15are presently under implementation. Therecommendations take into account the current andlikely macroeconomic and fiscal scenarios so as tosecure fiscal stability and adequate resourceavailability for the Centre, the States, and the localbodies. The higher levels of devolution of taxes andthe inter-se sharing thereof together with higherlevels of non-Plan grants under Article 275 of theConstitution which include specific grants like grantsfor elementary education, outcomes andenvironment related grants, maintenance grants, andstate-specific grants are likely to bring the combineddeficit of the States down to the targeted levels faster.The borrowing ceiling for each State for the year2010-11 has been fixed by the Government of India,keeping in view the recommendations of the ThFCbased on targets for fiscal deficit. Besides, the ThFChas also provided a basis for the finances of localbodies through a basic grant and a performancegrant based on a percentage of the divisible pool ofthe preceding year. The estimated total grantrecommended for local bodies aggregates to `87,519 crore over the award period of the ThFC.
3.41 In this year’s Budget, measures were alsotaken to facilitate movement towards a goods andservices tax (GST). These included unification ofrates between central excise (goods) and servicetax (services) at 10 per cent; removal of certain
exemptions in central excise; widening of servicetax base through inclusion of eight new servicesand expansion of scope of some of the existingones; reduction in excise duty from 16 per cent to10 per cent on medicines and toilet preparationscontaining alcohol (excise duty on medicinal andtoilet preparations is one of the taxes to be subsumedunder the GST); approval of a Mission Mode Projectfor the computerization of State Commercial TaxDepartments.
3.42 Though considerable progress has beenmade in moving towards a comprehensive GST, thetimeline of April 2011 for its introduction is not likelyto be met. This is because the convergence of viewsbetween the Centre and States needed for theintroduction of legislation for a constitutionalamendment in this regard is yet to be achieved. Inthe meantime, the working groups involved indeveloping the IT architecture, business processes,and draft legislations for the effective implementationof GST are continuing their work. An empoweredgroup under the Chairmanship of Dr NandanNilekani, Chairman UIDAI, is working out themodalities for creation of a special purpose vehicle(SPV) which envisages the setting up of a commonportal for the Centre and State Governments throughwhich taxpayers could interact with the two taxadministrations. Work is also under way to createand strengthen the IT infrastructure in StateVAT(value-added tax) departments so that theirtransition to the GST becomes easier.
CONSOLIDATED GENERAL GOVERNMENT
3.43 Given the grant dependance of local bodiesand limited availability of data, consolidated GeneralGovernment finances are taken to be theaggregation of Union and combined State financesafter due process of netting of inter-Governmentaltransactions. The macroeconomic impact of theGovernment’s fiscal operations is thus evaluated bylooking at consolidated General Governmentfinances. As with the Centre and States individually,collectively also a revenue buoyancy and relativelylimited growth in expenditure helped in the fiscalconsolidation phase in the post-FRBM period up to2007-08. In 2007-08, the gross fiscal deficit of theconsolidated General Government was placed at 4.1per cent of the GDP on a cash basis (Table 3.12 andFigure 3.12); and revenue deficit was close to zero.After the fiscal expansion in 2008-09 and 2009-10,
65Fiscal Developments and Public Finance
Website: http://indiabudget.nic.in
Table 3.11 : Receipts and Disbursements of State Governments*
Source: Reserve Bank of India.*: Data from 2008-09 onwards pertain to 27 State Governments.RE: Revised Estimates.Note: (1) Negative (-) sign indicates surplus in deficit indicators.
(2) The ratios to GDP at current market prices are based on the CSO’s National Accounts 2004-05 series.(3) Capital receipts include public accounts on a net basis.(4) Capital disbursements are exclusive of public accounts.
-1
Gross fiscaldeficit
Revenue and fiscal deficit of states
0
1
2
3
4
Figure 3.11
Revenuedeficit
Per
cent
of
GD
P
-2
Year
2004
-05
2007
-08
2006
-07
2008
-09
2010
-11
(BE)
2009
-10
(RE)
2005
-06
66 Economic Survey 2010-11
Website: http://indiabudget.nic.in
both revenue and fiscal deficits are estimated todecline sharply in 2010-11 (BE). Thus the outlook
for the economy as whole is bright with continuedfiscal consolidation.
0
Gross fiscaldeficit
Combined (centre and states) revenue and fiscal deficit
2
4
6
8
10
12
Figure 3.12
Revenuedeficit
Per
cent
of
GD
P
Year
2004
-05
2007
-08
2006
-07
2008
-09
2010
-11
(BE)
2009
-10
(RE)
2005
-06
Table 3.12 : Receipts and Disbursements of Consolidated General Government
B. Capital Receipts 8.3 5.8 5.4 8.8 9.7 7.7of which:
a) Disinvestment Proceeds 0.0 0.1 0.9 0.0 0.4 0.5b) Recovery of Loans & Advances 0.3 0.0 0.1 0.2 0.1 0.1
II. Total Disbursements (a+b+c) 26.0 25.8 26.4 28.6 29.1 26.3a) Revenue 21.8 21.7 21.5 24.3 24.8 22.2b) Capital 3.6 3.7 4.5 3.9 3.9 3.8c) Loans and Advances 0.6 0.5 0.4 0.4 0.4 0.3
III. Revenue Deficit 2.7 1.3 0.2 4.3 5.7 3.8
IV. Gross Fiscal Deficit 6.5 5.4 4.1 8.5 9.5 7.3Source: Reserve Bank of India.Note: The ratios to GDP at current market prices are based on the CSO’s National Accounts 2004-05 series.
67Fiscal Developments and Public Finance
Website: http://indiabudget.nic.in
Box 3.3 : Decomposition of Fiscal Deficit into Structural and Cyclical Components
The Government budget balance is basically influenced by both cyclical (temporary) and structural (permanent)
factors, entailing that change in the fiscal deficit could arise either in response to cyclical changes in output or to
structural factors. The cyclical changes in output have a transitory effect on the fiscal deficit, whereas the structural
factors have a more durable impact. A structural deficit occurs when a country generates a deficit even when the
economy of the country is operating at its full employment level. On the other hand, a cyclical deficit occurs when an
economy is not performing to its potential, for example if an economy is struggling through a recession. A structural
deficit means that a deficit will be posted regardless of how well an economy if functioning-–recession or boom.
When the economy is functioning strongly, revenue generation is higher due to more jobs, more spending, etc. but
with structural deficit the good and strong health of the economy is irrelevant--a deficit will be generated regardless.
Structural deficit could be further decomposed into three parts that is (a) fiscal drag, (b) discretionary fiscal policy
action, and (c) base year balance, to gain still more insight into the determinants of the structural deficit. Of the three
listed components, the first two are important from the point of understanding fiscal stance.
Fiscal Drag
Among the components of the structural deficit, the fiscal drag is important and normally refers to increase in
average tax rates in a progressive income tax scheme as a consequence of increase in nominal income over time--
either on account of higher levels of inflation or real GDP growth. It has been observed that fiscal drag is the
dominant contributory factor for structural deficit of Central Government balances.
Discretionary Fiscal Policy Action
On the other hand, the second component, i.e. discretionary fiscal policy actions, after remaining relatively weak up
to 2007-08, had shown increases in 2008-09 and 2009-10 which can be attributed to revenue losses due to slowdown
in the economy and duty cut together with higher expenditure to provide fiscal stimulus to sustain economic growth.
Traditional deficit indicators normally do not discriminate between these two effects, and hence fail to correctly
evaluate and portray the impact of fiscal operations on the economy as a whole. The decomposition of the budget
balance into its structural and cyclical components is obtained normally through the application of two important
methodologies, namely the IMF and Organization for Economic Cooperation and Development (OECD) methodologies.
The earlier research on the subject that had been done mostly in the pre-FRBMA period had indicated the presence
of the large structural rigidities in the composition of fiscal deficits in India and a very small cyclical component. The
preliminary findings of the study on this subject commissioned in the post-FRBMA period using OECD methodology
too have indicated continued dominance of the structural component in the budgetary balance of the Government;
this observation holds good in the decomposition of primary deficits of the Centre, combined States, and consolidated
General Government.
THE NATURE OF FISCAL CONSOLIDATION
3.44 The impact of the global financial crisis broughtto the fore the criticality of fiscal policies in combatingeconomic shocks. With little monetary headroom inadvanced economies and given the transmission lagsin emerging market economies, fiscal policies werethe preferred policy instruments across the globe.As per international institutional research on thesubject, advanced economies were able to put inplace large doses of fiscal stimuli as they had theadvantage of automatic stabilizers while emergingmarkets, including India, had large fiscal expansion
given the very low discretionary fiscal stimuli. In thefiscal consolidation phase in the post-FRBMA period(2004-05 to 2007-08), there was considerable fiscalspace generated that facilitated the high levels ofexpansion that India had. It is therefore instructiveto analyse the nature of fiscal deficits in India throughtheir decomposition into structural and cyclicalcomponents (Box 3.3).
PROSPECTS/OUTLOOK
3.45 With significant levels of reduction envisaged
(Contd....
68 Economic Survey 2010-11
Website: http://indiabudget.nic.in
Estimates of Structural and Cyclical Components of the GFD
(As per cent of GDP)
Year Structural Cyclical Gross Fiscal Year Structural Cyclical Gross Fiscal
in the combined State Government deficit in 2010-11 (BE) and the progress in the current fiscal inrespect of Central Government finances, theresumption of the process of fiscal consolidation atboth Centre and State levels as also of theconsolidated General Government has really begunafter two years of purposive expansion. With theroadmap laid out by the Medium Term Fiscal PolicyStatement coupled with that indicated in theGovernment Debt Report 2010, the prospects ofextending this process to the medium term andbeyond are bright. While the roadmap in terms ofdeficit indicators is important in itself, these beingin the nature of derived indicators, it is useful tolook at the process by which the reduction is soughtto be achieved. The Government Debt Report 2010indicates that between 2010-11 (BE) and 2014-15
the terminal year of the award of the ThFC, theproportion of total expenditure to the GDP is to godown by 2.5 percentage points to reach 13.5 percent of the GDP in 2014-15 and at the same timethe proportion of tax to GDP is set to rise by 1.4percentage points to reach 12.2 per cent of the GDPin 2014-15. This estimated level of growth in taxrevenues seems likely given the recovery in theeconomy to the pre-crisis levels and the fact that itwas at the same levels before the crisis. Thus it iscritical to anchor expenditure reforms to realize theprojected deficit levels. A beginning has already beenmade with the reforms announced in subsidies, someof which have already been implemented. Goingforward, deepening the reform process would holdthe key to sustaining the fiscal consolidationprocess.
Gross fiscaldeficit(GFD)
Decomposition of gross fiscal deficit into structural and cyclical components(As per cent of GDP)
Structuraldeficit(SD)
Cyclicaldeficit(CD)
1990
-91
1991
-92
1992
-93
1993
-94
1994
-95
1995
-96
1996
-97
1997
-98
1998
-99
1999
-00
2000
-01
2001
-02
2002
-03
2003
-04
2004
-05
2005
-06
2006
-07
2007
-08
2008
-09
2009
-10
Year
-1
Per
cent
of
GD
P
0
1
2
3
4
5
6
7
8
9
Box 3.3 Contd....)
Prices and MonetaryManagement CHAPTER
4
As the world economy has begun to stabilize in the aftermath of the global crisis,inflation has re-emerged as a major concern particularly in the fast- recoveringdeveloping economies. At present, the major pressure on prices is emanating fromthe food and energy sectors both at global and domestic levels. However, the risk ofits slippage into the core sector has increased and needs to be mitigated proactively.Notwithstanding slow recovery in the advanced economies, international commoditiesparticularly, oil, food, industrial inputs, and metals have witnessed rising pricestowards the end of 2010. International crude prices also briefly crossed US$ 90 abarrel in the wake of an unusually cold winter, putting pressures on the Governmentto take a relook at domestic fuel prices. The renewed inflationary pressure becameevident in December 2010 as headline wholesale price index (WPI) inflation increasedto 8.4 per cent from 8.1 per cent in November 2010. However, in January 2011 ithas moderated to 8.2 per cent. In addition to fuel, metal and mineral prices are alsoputting pressure on the domestic economy. Food inflation in particular has remainedstubbornly in double digits for over a year now, which has welfare costs. There isneed to remain cautious and be prepared to take proactive steps as the emergingscenario warrants, with the objective of bringing down inflation. Going forward,inflation is likely to moderate in line with the monetary tightening measures takenby the Reserve Bank of India and other steps taken by the Government to addressthe supply-side bottlenecks.
PRICES
Main features of the new WPI series
4.2 A new WPI series with 2004-05 base wasreleased on 14 September 2010. A representativecommodity basket comprising 676 items has beenselected and weighting diagram derived for thenew series. The total number of price quotationshas also increased from 1918 in the old series to5482 in the new series, indicating betterrepresentation of the prices in the wholesalemarkets. Sector-wise price quotations haveincreased from the old to new series from 455 to579 in primary group and from 1391 to 4831 in themanufactured products group. A comparison of theweighting diagram and number of commoditiesbetween the old and new series for the major groupsis drawn in Table 4.1.
4.3 Some of the important items included in thenew series basket are flowers, lemons, and crudepetroleum in primary articles and ice cream,canned meat, palm oil, readymade/instant foodpowder, mineral water, computer stationery, leatherproducts, scooter / motorcycle tyres, polymers,petrochemical intermediates, granite, marble, goldand silver, construction machinery, refrigerators,computers, dish antenna, transformers, microwaveovens, communication equipment (telephoneinstruments), TV sets, VCDs, washing machines,and auto parts in manufactured products.
General wholesale price situation4.4 During the first half of 2009-10, the headlineyear-on-year inflation remained significantly low at0.36 per cent on account of sharp increases in pricesrecorded in 2008-09. The second half of 2009-10
70 Economic Survey 2010-11
Website: http://indiabudget.nic.in
showed increasing food prices on account ofunfavourable agricultural supply conditions coupledwith the waning of base effect, leading to sharpincrease in inflation. Thereafter, the headline WPIinflation reached 10.23 per cent in March 2010.
4.5 Financial year 2010-11 started with 11 percent headline inflation in April 2010.During 2010-11, the monsoon situation has been better than lastyear. As per the Second Advance Estimates,production of foodgrains in 2010-11 is likely to be232.07 million tonnes as compared to 218.11 milliontonnes last year. However, demand pressuresbecame visible in early 2010.
4.6 At disaggregate level, the price behaviour ofthree major commodities groups has been in markedcontrast to the previous year when inflationremained low on account of global decline incommodity prices. From March to July 2010,headline inflation remained in double digits. Themajor contributors to this were primary articles
whose inflation hovered in the range of 14.7 percent to 21.5 per cent and fuel which recordedinflation in the range of 10.3 per cent to 14.4 percent. However, the inflation in manufacturedproducts remained in the lower range of 4.5 to 6.4per cent during the current year (Figure 4.1).
4.7 The Government is committed to ensuringavailability of cooking fuels to the common man ataffordable prices. In view of the importance ofhousehold fuels, namely kerosene and domesticliquefied petroleum gas (LPG), the Government hasdecided that the subsidies on these products willbe continued. The PDS Kerosene and DomesticLPG Subsidy Scheme 2002 as well as the FreightSubsidy (for Far-flung Areas) Scheme 2002 havebeen extended till 31 March 2014. However, in orderto reduce the burden of under-recoveries, it has beendecided to increase the retail price of publicdistribution system (PDS) Kerosene by ` 3 perlitre and of domestic LPG by `35 per cylinder, atDelhi, with corresponding increases in other parts
-15
-10
-5
0
5
10
15
20
25
Infl
atio
n (p
er c
ent) Primary
articles
Inflationary trend in major subgroups of WPIFigure 4.1
Fuel &power
Manufac-tured
products
All commo-dities
Year2009-10 2010-11
Apr
May Jun
Jul
Aug
Sep
Oct
Nov
Dec
Jan
Feb
Mar Apr
May Jun
Jul
Aug
Sep
Oct
Nov
Dec
Table 4.1 : Major Changes in the Weights and Commodities in the Revised WPI Series
Weights No. of Commodities
Items New Series Old Series New Series Old Series New Items(base: (base: (base: (base: Added/
2004-05) 1993-94) 2004-05) 1993-94) Revised
All Commodities 100.00 100.00 676 435 417
Primary Articles 20.12 22.03 102 98 11
Food Articles 14.34 15.40 55 54 1
Non-Food & Minerals 5.78 6.63 47 44 10
Fuel and Power 14.91 14.23 19 19 0
Manufactured Products 64.97 63.75 555 318 406
Food Products 9.97 11.54 57 41 25
Non-Food Products 55.00 52.21 498 277 381
Source : The Office of the Economic Adviser, Ministry of Commerce and Industry.
71Prices and Monetary Management
Website: http://indiabudget.nic.in
of the country. Prices of petrol and diesel, both atthe refinery gate and retail level, will be marketdetermined. However, it is proposed that increasein prices of diesel will be staggered over time tominimize the overall impact on the poor andvulnerable. It has also been decided that in case ofa high rise and volatility in international oil prices,Government will suitably intervene in the pricing ofpetrol and diesel.
Average trends in WPI inflation
4.8 The ten-year average of headline WPI inflationwas around 5.3 per cent from 2000-01 to 2009-10;in this decade 2000-01, 2003-04, 2004-05, 2006-07, and 2008-09 had higher inflation relative to thedecadal average. In the current financial year, theaverage inflation (April–December 2010) of 9.4 percent was also much higher than the decadal rate.The ten-year average inflation in fuel was around8.9 per cent. The major portion of that wascontributed by the high inflation of 2000-01. The years2003-04, 2004-05, 2006-07, and 2008-09 alsowitnessed high inflation in manufactured productsmainly on account of high prices of raw materialssuch as basic metal alloys and metal products, non-metallic mineral products, and machinery andmachine tools. The year 2008-09 was different fromthe previous three years as inflation in all the threesectors remained high on account of highinternational fuel and commodity prices. The year2009-10 was an abnormal one due to globalslowdown and unfavourable monsoon.Notwithstanding, the average inflation was 3.6 percent backed by negative inflation in fuel. In thecurrent financial year (2010-11), overall averageinflation from April-December 2010 at 9.4 per cent,is the highest recorded in the last ten years(Table 4.2).
Food Inflation in WPI
4.9 The food index consists of two subcomponents, namely primary food articles andmanufactured food products. The overall weight ofthe composite food index in the WPI is 24.31 percent, comprising primary food articles with a weightof 14.34 per cent and manufactured food productswith a weight of 9.97 per cent. A major concern inthe domestic economy has been a sharp rise infood price inflation during the year 2010-11. The WPIfood inflation has moderated to 8.59 per cent inDecember 2010 after reaching its peak of 20.22per cent in February 2010. Of its two components,primary food price inflation touched a historic high
in the revised series at 21.9 per cent in February2010, thereafter declining to 9.4 per cent inNovember 2010 and once again rising to 13.6 percent in December 2010 (Table 4.3). However,manufactured food products exhibited a decline ininflation from 19.3 per cent in December 2009 to0.4 per cent in December 2010. Among food items,sharp rise in prices was observed in onions, fruits,eggs, meat and fish, and milk. The prices offoodgrains, however, remained low on the back ofgood monsoons with a year-on-year inflation of-2.6 per cent in December 2010.
Main drivers of food inflation
4.10 In 2010-11, inflation in primary food articleswas mainly driven by rice, vegetables, potatoes,onions, fruits, milk, eggs, meat and fish, condimentsand spices, and tea. However, the WPI ofmanufactured food products with 2004-05 base isin the comfortable zone. It was 142.7 in December2010 as against 142.2 in December 2009. Thishas marginally increased due to vanaspati oil,groundnut oil, sunflower oil, rice bran extraction,
Table 4.2 : Annual Average Inflation Rate-based on WPI
(per cent)
Year Primary Fuel & Manufac- AllArticles Power tured Commo-
Products dities
Weights(%) 20.12 14.91 64.97 100
2000-01 2.8 28.5 3.3 7.2
2001-02 3.6 8.9 1.8 3.6
2002-03 3.3 5.5 2.6 3.4
2003-04 4.3 6.4 5.7 5.5
2004-05 3.7 10.1 6.3 6.5
1st 5 Years’
Average 3.5 11.9 3.9 5.2
2005-06 4.3 13.5 2.3 4.3
2006-07 9.6 6.5 5.6 6.5
2007-08 8.3 0.0 4.9 4.8
2008-09 11.0 11.6 6.2 8.0
2009-10 12.7 -2.1 1.8 3.6
2nd 5 Years’
Average 9.2 5.9 4.1 5.5
Decadal
Average 6.4 8.9 4.0 5.3
2009-10
(Apr.-Dec.) 9.8 -5.8 0.7 1.7
2010-11
(Apr.-Dec.)P 18.0 12.3 5.3 9.4
Source: The Office of the Economic Adviser, Ministryof Commerce and Industry.Note: P—Provisional
72 Economic Survey 2010-11
Website: http://indiabudget.nic.in
275
280
285
290
295
300
270
Food
Pri
ce I
ndex
(20
02-0
4=10
0)
FAO Annual Real Food Price Index
FAO annualreal food
price index
Year
1990
1991
1992
1993
1994
1995
1996
1997
1998
1999
2000
2001
2002
2003
2004
2005
2006
2007
2008
2009
2010
300
300
(2) Is India buffeted by rising international prices? While some spillovers of global prices to Indian markets areinevitable, world trade in agriculture is often very thin, with large trade restriction and tariff wedges between domesticand international prices. While domestic food prices cannot be fully insulated from global ones, local markets do differ,
Box 4.1: An Unexpected Surge in Food Inflation
Food inflation has been unexpectedly high in recent weeks—driven by surging prices of vegetables, fruits, dairy, oilseeds,and spices. It was unexpected because good rainfall in 2010 was expected to bring down prices. It did: for cereals (wheat,rice) and pulses, which together provide most of the energy and protein intake of households in India, especially of thepoor. But the surging prices of other foods caused the overall food inflation to rise. Given the critical importance of foodin India’s setting—with high rates of malnutrition and household food spending accounting for above 40 per cent of totalhousehold expenditure (versus some 7-8 per cent in richer countries)—we disentangle in this Box the relative importanceof some competing and popular sets of explanations or factors.
(1) Rising International Prices—Demand-Supply Shocks or Generalized Commodity Surge? There was a suddensurge in global food prices in 2006-08, which subsequently crashed with the global financial crisis. Prices, however, againstarted surging since late 2009, and have now surpassed the 2008 peak—led by sugar, oils and fats, and cereals (but notdairy and meat). What is driving this global increase? A July 2010 study (Baffes and Haniotis) looking at the previous2006-08 price rise provides evidence that it was due to a generalized commodity price rise, especially in oil, itself causedby a world awash with liquidity and a falling dollar. It also provides evidence that it was not, as popular explanationswould have us believe, because of (1) rising demand in emerging markets (such as China and India); (2) a shift to biofuels;and (3) a trend rise (because price variability dominates any trend). Nevertheless, the previous 53 per cent fall in real foodprices between 1975 and 2001 was probably overdone and some adjustment was inevitable. The 2009-10 price resurgenceis very similar. Everything from a poor summer wheat harvest in Russia to the recent Australian floods, dry spell inArgentina, Indonesian flooding, poor US maize yields, and rising demand in China and India is being blamed—butsudden price rises of this magnitude across such a variety of food products are difficult to attribute to any specificsupply or demand problem except in the context of a generalized commodity price surge (whose solutions lie elsewhere).
100
140
180
Ind
ex
(2
00
2-0
4=
10
0)
FAO Food Price Index
Jan
Feb
Mar
Apr
May
Jun
Jul
Aug
Sep Oct
Nov
Dec
120
160
200
2006 2007 2008 2009 2010
100
200
300
Inde
x (2
002-
04=
100)
Food Commodity Price Indices
Dec Jan
Feb
Mar Apr
May Jun
Jul
Aug
Sep
Oct
Nov
Dec
150
250
350
Meatprice index
Dairyprice index
Cerealsprice index
Oilsprice index
Sugarprice index
2009-10 2010-11
73Prices and Monetary Management
Website: http://indiabudget.nic.in
the volatility of global prices is far greater than that of domestic prices, and India’s prices have been much more stable,avoiding the highs and lows. Indeed, recent cereals prices have been declining in India relative to global ones.
(3) So, what caused the unexpected surge in non-cereal prices? Fundamentals versus uncompetitive markets.One popular explanation for suddenly rising prices of vegetables, spices, dairy, and similar products is rising incomesin India driving prices higher, as consumers are presumed to be shifting from low-value products to higher value ones(consistent with Engel’s Law). While this may certainly be true as a general demand-side explanation, it merits deeperexamination because of two other factors: (1) the sudden spike in prices; and (2) the generally high supply elasticitiesin such products that should prevent this. Instead, consistent with what is evident globally, when some unexpectedsupply or demand shocks happen, it is often easier for commodity prices to spike temporarily—unrelated tofundamentals and driven sometimes by local cartelization or other conditions such as sudden flows of speculativecapital into thin commodity futures markets. The case of onion prices is a good example of the former, and spices ofthe latter. Onion prices surged from Rs 15 per kg to over Rs 80 per kg over a matter of weeks, attributed popularlyto the effects of extended rainfall and damaged crop in Nashik. However, onions are in fact grown all over India, andthe all-India market is generally well-behaved and competitive—in that local prices converge to national ones. However,in the presence of unanticipated supply or demand shocks, local onion markets do fragment and become much more‘ill-behaved’ and it is possible to observe sudden temporary spikes and divergence that is more consistent with localcartelization conditions, supported by cascading entry barriers along the supply chain (including the restrictions of theAgricultural Produce Marketing Act [APMC] and the restrictions and fees at mandis). Fundamentals, however, catchup, as evident in onion prices crashing in recent weeks to about Rs. 25/kg at the retail level and even lower atwholesale market. Similar conditions apply in commodity exchanges where sudden speculative activity can drivefutures prices temporarily higher—until supplies and fundamentals bring spot and hence futures prices back toreality. Even vegetable prices (such as tomatoes), which had risen dramatically, are easing back, as supply catches up.
(Box 4.1 Continued)
200
400
600
US$/
ton
Wholesale price of rice: India, Thailand and China
Jan
2005
Jul 2
005
Jan
2006
Jul 2
006
Jan
2007
Jul 2
007
Jan
2008
Jul 2
008
Jan
2009
Jul 2
009
Jan
2010
Jul 2
010
Nov
2010
300
500
700
India Thailand China
800
900
100
250
400
US
$/t
on
Wholesale price of wheat, India and Brazil20
01
2002
2003
2004
2005
2006
2007
2008
2009
2010
175
325
475
India Brazil
550
0
20
40
Pri
ce: �
/Kg
Ret
ail
Temporarily less "well-behaved" weekly retailonion price movements, Northern India, Delhiversus Amritsar, Dec 2009 - Dec 2010
1 5 9 13 17 21 25 29 33 37 41 45 48
10
30
50
Amritsar Delhi
60
70
Weeks
2
6
10
�/Kg
.
“Well behaved” and convergent regional series ofonion retail prices, Andhra Pradesh, 2006-2008
4
8
12
Viziana-garam& Chittivalasa
Kakinada &Rajahmundry
Jaggaiahpet &Miryalguda
14
16
18
Avera
ge
2006
-07
Jan 2
006
Apr 2
006
Jul 2
006
Oct 2
006
Jan 2
007
Apr 2
007
Jul 2
007
Oct 2
007
Jan 2
008
Apr 2
008
Tirupathi &Renigunta
Nizamabad &Bodhan
Kothagudem &Palwaneha
74 Economic Survey 2010-11
Website: http://indiabudget.nic.in
(Box 4.1 Continued)
References: John Baffes and Tassos Haniotis (2010), ‘Placing the 2006/08 Commodity Price Boom into Perspective’, PolicyResearch Working Paper 5371, The World Bank. Food and Agriculture Organization (FAO), Global food price monitor,14 January 2011 and Global Information and Early Warning System (GIEWS) Country Data.
0
40
80� c
rore
s
Daily trading value futures surge for spices
20
60
100
Dailytradingvalue
futures forspices
groupedtogether:chillies,jeera,
dhaniya,castor,
turmericand pepper.
120
140
160
11 O
ct 1
0
22 O
ct 1
0
02 N
ov 1
0
13 N
ov 1
0
24 N
ov 1
0
05 D
ec 1
0
16 D
ec 1
0
27 D
ec 1
0
07 J
an 1
1
18 J
an 1
1
180
200
Table 4.3 : Monthly Break-up of WPI Food Inflation
(per cent)
All (A) (B) (A+B)Commodities Food Articles Food Products Food Combined
Wt% 100 14.34 9.97 24.31
Period 2009-10 2010-11 2009-10 2010-11 2009-10 2010-11 2009-10 2010-11
Source: The Office of the Economic Adviser, Ministry of Commerce and Industry.Note: P—Provisional.
75Prices and Monetary Management
Website: http://indiabudget.nic.in
tea and coffee process, and malt liquor. Themovement of index, inflation, and their contributionto overall inflation among food groups, may be seenin Table 4.4.
4.11 Core inflation is a measure of inflation thatexcludes items that face volatile price movement,notably food and energy. It is, therefore, a preferredtool for framing long-term policy. Core inflation, whichwas 0.55 per cent in November 2009, reached itspeak in April 2010 at 8.07 per cent (Table 4.5).Thereafter it has moderated in response to monetarymeasures taken by the Reserve Bank of India (RBI).However, inflation in non-food manufactured products(weight 55.00 per cent) had not increased muchand remained in the range of 5.1 to 5.9 per cent inthe current financial year. Notwithstanding, year-on-year inflation in the composite non-food index(weight 75.7 per cent) has increased to 8.36 percent in December 2010 after moderating to 7.96
per cent in September 2010 from 9.18 per cent inApril 2010.
4.12 Main items of concern in non-food inflationare raw cotton, raw jute, raw silk, copra, castor seed,sunflower, raw rubber, copper ore, zinc, iron ore,cotton textiles, petrochemical intermediate, andindustrial machinery and machine tools. Movementof index of non-food components in the WPI ispresented in Figure 4.2.
4.13 In the fuel and power group the majorcontribution to inflation is from mineral oilsaccounting for over 90 per cent (Table 4.6).
Annual inflation as per different price indices
4.14 The inflation in terms of the consumer priceindex for industrial workers (CPI-IW) remained indouble digits from July 2009 to July 2010. Theinflation in terms of the CPI-AL (Agricultural
Table 4.4 : Main Drivers of Food Inflation
WPI y-o-y y-o-y *Financial Financial
Inflation WC year year
inflation WC
Items Weight% Dec. Mar. Dec. Dec. Dec. Apr. Dec.
2009 2010 2010 2010 2010 Dec. 2010
2010
All Commodities 100.00 132.9 135.8 144.1 8.43 100.00 6.11 100.00
Source: The Office of the Economic Adviser, Ministry of Commerce and Industry.Note: Y-on-Y—year-on-year.WC- Weighted Contribution
Labourers) and CPI-RL (Rural Labourers) hadreached double digits in May 2009 and continuedso until July 2010. Further, inflation in terms of theCPI-AL and CPI-RL was higher than inflation basedon the CPI-IW during all these months. In August2010, the inflation in terms of all price indices has
come down to single digit for the first time in 15months (Table 4.7).
4.15 At 9.47 per cent, inflation in the CPI-IW hassubstantially declined in December 2010 from itspeak of 16.22 per cent in January 2010. The CPI
77Prices and Monetary Management
Website: http://indiabudget.nic.in
maintained higher levels last year relative to theWPI, mainly because of the larger weight assignedto food items. In consumer price indices, food itemscontribute a weight of 46.20 per cent in the CPI-IWand 69.15 per cent in the CPI-AL as against 24.31per cent in the WPI. The food inflation hasdecelerated after reaching its peak in January 2010.As a result CPI inflation rates have gone downsubstantially.
Disaggregated Consumer Price Inflation
4.16 Analysis at this level has assumedimportance in view of the fact that the current phase
of relatively high inflation is concentrated in food,pan, supari, tobacco and intoxicants, and housing.Two major contributors to high CPI-IW inflation werefood and housing. The housing sector is the thirdmajor contributor after food and the miscellaneousgroup, having a 15.3 per cent weight in the CPI-IWcommodities basket. However, the average inflation(April-December 2010) was lower than in thecorresponding period last year (Table 4.8).
4.17 The non-food inflation in CPI-IW hasincreased during April-December 2010 to 11.64 percent as against 8.78 per cent in the correspondingperiod last year. During April-December 2010, food
Table 4.8 : Quarterly Inflation Trend in CPI-IW by Major Commodity Groups (Base: 2001=100)
Source: Labour Bureau, Shimla and the Office of the Economic Adviser, Ministry of Commerce and Industry.Note: P : Provisional.
78 Economic Survey 2010-11
Website: http://indiabudget.nic.in
inflation has declined to 10.29 per cent ascompared to 14.70 per cent during thecorresponding period last year (Table 4.8). Inflationin the CPI-IW has increased in December 2010 to9.47 per cent as against 8.33 per cent in November2010. Food inflation in the CPI-IW has alsoincreased to 7.98 per cent in December 2010 from5.35 per cent in November 2010.
4.18 Inflation in fruits and vegetables and onionsbased on the CPI-IW in December 2010 was 15.3per cent and 77.6 per cent respectively as against22.77 per cent and 45.82 per cent respectively basedon the WPI. State-wise CPI-IW and year-on-yearinflation in December 2010 for onions shows
unprecedented rise in inflation in the northernregion, particularly Punjab (Figure 4.3).
Introduction of CPI-Urban and CPI-Rural
4.19 The Central Statistics Office (CSO) has takenup a new initiative of compilation of CPI (urban), CPI(rural), and CPI (rural+urban) for all States/UTs andall India by considering all sections of the urbanand rural population. These indices would reflectthe true picture of price behaviour of various goodsand services consumed by the urban and ruralpopulation. Box 4.2 is a short note on the CPI(urban), CPI (rural), and national CPI giving salientfeatures of this new series of indices.
Assa
m
Biha
r
Chan
diga
rh
Chha
ttisg
arh
Delh
i
Guja
rat
Hary
ana
Him
acha
l Pra
desh
Jam
mu
& Ka
shm
ir
Jhar
khan
d
Kera
la
Mad
hya
Prad
esh
Mah
aras
htra
Punj
ab
Raja
stha
n
Utta
r Pra
desh
Wes
t Ben
gal
All I
ndia
Inflation (%)Dec 10/Dec 09
Onions movement in Dec 2010: state wise CPI and Y-o-Y inflationFigure 4.3
500
100
200
300
400
CPI-
IW (
2001
=10
0)
700
600 150
30
60
90
120
Y-o-
Y in
flat
ion
(per
cen
t)
180
0
CPIDec 09
CPIDec 10
Box 4.2 : New Series of CPI numbers
1. The CSO has taken an initiative for compilation of new series of urban, rural, and combined (rural+urban) CPI atState/UT/all India level with increased scope and coverage.
2. CPI (rural) and CPI (urban) would be compiled for each State/UT as well as at all India level. Weighting diagrams(consumption pattern) of the indices have been derived from the results of the National Sample Survey (NSS) 61stround of Consumer Expenditure Survey (2004-05).
3. In urban areas, all cities/towns having population (2001 Population Census) more than 9 lakh and all state/UTcapitals not covered therein were selected purposively. In all 310 towns have been selected either on purposive orrandom basis from which 1114 quotations (price schedules) are canvassed every month.
4. In rural areas, with a view to having a manageable workload and considering that the CPI (rural) would provide theprice changes for the entire rural population of the country, a total of 1183 villages have been selected at all India level.The broad criterion of selection of villages is to have representation of all the districts within the State/UT andtherefore two villages from each district adjusted based on rural population of the State/UT have been selectedrandomly from different tehsils.
5. The CSO has also decided to bring out a national CPI by merging CPI (urban) and CPI (rural) with appropriateweights, as derived from NSS 61st round of Consumer Expenditure Survey (2004-05) data.
6. The Technical Advisory Committee on Statistics of Prices and Cost of Living (TAC on SPCL) in its 49th meeting heldon 10 November 2010 decided to take 2010(January-December) as the base year for a new CPI (urban), CPI (rural)and CPI(rural+urban)series .Indices for January 2011 are likely to be released by February 2011.
79Prices and Monetary Management
Website: http://indiabudget.nic.in
Private Final Consumption ExpenditureDeflator (PFCED)4.20 The gross domestic product (GDP) or grossdomestic income (GDI) is the market value of allfinal goods and services produced within a countryin a given period. It is often positively correlated withthe standard of living. Movement of the consumptionpattern of a country can be analysed through itsdeflator generated by the Private Final ConsumptionExpenditure (PFCE) at current prices over constantprices base 2004-05. Annual price indices data forthe CPI-RL, CPI-IW and PFCED from 2004-05onwards indicate an upward swing in the standardof living (Figure 4.4).
4.21 Price changes may cause consumers toswitch from buying one good to another. Whereasthe fixed basket CPI does not account for alteredspending habits caused by price changes, the PFCE
Sources: Labour Bureau and CSONote: The PFCED for 2010-11 is based on advance estimates, CPI-IW and CPI-RL for 2010-11 are for the periodApril-December 2010.
deflator’s ability to account for such substitutionsmakes it the preferred measure of inflation. TheCPI-RL represents rural areas, where price indicesare reigning higher than the CPI-IW in responseto improvements in purchasing power andconsumption pattern on account of variousemployment generation schemes of the Governmentlike the Mahatma Gandhi National Rural EmploymentGuarantee Scheme (MNREGS).
Global and domestic inflation
4.22 From April 2009 global food prices showedmuch lower volatility than the WPI-based domesticfood inflation. However, a higher volatility was seenin international food inflation from September 2010as compared to domestic food inflation in India.Costlier imports could push up domestic inflation(Figure 4.5 and Table 4.9).
-40
-30
-20
-10
0
10
20
30
40
Y-o-
Y in
flat
ion
(per
cen
t)
Global foodinflation
Global and domestic food inflationFigure 4.5
Domesticfood
inflation
Year2009-10 2010-11
Jan
Feb
Mar Apr
May Jun
Jul
Aug
Sep
Oct
Nov
Dec
Jan
Feb
Mar Apr
May Jun
Jul
Aug
Sep
Oct
Nov
Dec
2008-09
80 Economic Survey 2010-11
Website: http://indiabudget.nic.in
4.23 A comparison of the global food inflation andWPI-based domestic food inflation gives the actualpicture of food inflation (Table 4.9).
4.24 During the current year, high inflation in foodarticles is not unique to India and is widespread.The domestic food price situation could getexacerbated by the increase in global food pricesbecause of dependency on import of some fooditems like edible oils. Current growth and inflationtrends warrant persistence with an anti-inflationarymonetary stance.
Housing Price Index (NHB- RESIDEX)4.25 As one of the most populous and fastest-growing countries in the world, India has promisingconditions for a vibrant housing market withconsiderable growth potential. The housing sectorcontributes more than 9 per cent of nationalemployment. Housing finance in India, however,remains underdeveloped. The challenge in the Indianhousing market is primarily in the low and moderateincome segments. Though there is no lack ofdemand for housing, there is shortage of credit flow.
4.26 RESIDEX was first launched in 2007 by theNational Housing Bank (NHB) to provide an index ofresidential prices in India across cities and overtime. Initially a pilot study was conducted with 2001as base year during the period 2001- 05 to capturethe trend of price movements in residential property.
The pilot study covered 5 cities, namely Bengaluru,Bhopal, Delhi, Kolkata, and Mumbai. Thereafter,compilation of RESIDEX has been expanded to tenmore cities, namely Ahmedabad, Faridabad,Chennai, Kochi, Hyderabad, Jaipur, Patna, Lucknow,Pune, and Surat. RESIDEX is now being updatedon a quarterly basis with 2007 as base year. Thelatest data cover 15 cities and have been updatedup to June 2010 (April – June).
4.27 The movement in prices of residentialproperties has shown a mixed trend in the 15 citiescovered under the NHB RESIDEX in the first half of2010. Residential housing prices in 10 cities haveshown an increasing trend compared to the baseyear. They are Surat, Mumbai, Lucknow,Ahmedabad, Chennai, Pune, Kolkata, Patna,Faridabad and Bhopal. However, the 5 cities thathave shown correction in prices in first half of 2010are Jaipur, Bengaluru, Kochi, Delhi and Hyderabad.Jaipur has shown the maximum price correction inresidential property prices (Figure 4.6).
Measures to contain inflation
4.28 The Government monitors the price situationregularly as price stability remains high on itsagenda. Measures taken to contain prices ofessential commodities include selective ban onexports and futures trading in foodgrains, zeroimport duty on select food items, permitting import
Table 4.9 : Domestic and Global Y-o-Y Inflation Trend (per cent)
(base: 2004-05=100 )
Commodity Domestic Global Domestic Global Domestic GlobalDec-09 Dec-09 Mar-10 Mar-10 Dec-10 Dec-10
Agriculture 18.5 28.5 20.6 17.8 15.3 27.8
Beverages 6.5 27.8 8.2 23.0 5.3 32.4
Energy 4.6 55.4 13.8 60.1 11.2 19.7
Fats & Oils -0.7 34.6 3.3 18.2 5.0 35.4
Fertilizers 7.0 -41.7 6.2 -27.1 5.5 39.6
Food 20.2 23.8 18.5 8.5 8.6 25.3
Grains 19.5 5.0 13.2 -10.3 -2.6 25.3
Metal & Minerals -7.1 42.8 3.4 41.4 12.4 38.6
Non-fuel 7.4 27.8 9.6 23.0 7.9 32.4
Raw Materials 11.1 36.5 26.1 44.0 24.1 45.8
Timber -1.3 -9.2 8.8 -5.6 50.3 13.4
Other Raw materials 18.3 88.4 44.2 91.1 33.6 63.5
Other Food 16.3 30.7 7.0 16.9 -0.5 10.2
Sources : Pink sheet of the World Bank and the Office of the Economic Adviser, Ministry of Commerce and Industry.
81Prices and Monetary Management
Website: http://indiabudget.nic.in
Box 4.3 : Measures to Contain Inflation, Particularly Food Inflation
(A) Monetary Measures
As part of the monetary policy review, the RBI has taken suitable measures to moderate demand to levels consistentwith the capacity of the economy to maintain its growth without provoking price rise. It has already raised its keypolicy rates several times and has narrowed the liquidity adjustment facility (LAF) corridor to reduce volatility ofrates. The economy has witnessed aggressive tightening since March 2010. As per the announcement of the RBI on25January 2011, the repo rate and reverse repo rate are 6.5 per cent and 5.5 per cent respectively.
(B) Fiscal Measures
1. Import duties reduced to zero on rice, wheat, pulses, edible oils (crude), butter, and ghee and to 7.5 per cent onrefined and hydrogenated oils and vegetable oils;
2. Import of raw sugar allowed at zero duty under open general licence (OGL).
(C) Administrative Measures
1. Levy obligation in respect of all imported raw sugar and white/refined sugar removed.
2. Export of non-basmati rice, edible oils (except coconut oil and forest based oil) and pulses (except Kabuli chana)banned.
3. Minimum export price (MEP) used to regulate exports of onion (at US$1200 per tonne for December 2010) andbasmati rice (at US$900 per MT);
4. Futures trading in rice, urad, and tur suspended by the Forward Market Commission.
5. Stock limit orders extended in the case of pulses, paddy, and rice up to 30 September 2011 and edible oil andedible oilseeds up to 31March 2011.
6. Export of Onion (all varieties) not permitted with effect from 22 December 2010 until further orders.
7. Full exemption from basic custom duty, special additional duty and education cess provided to onions andshallots with effect from 21 December 2010.
8. NAFED and NCCF to undertake sale of onions at Rs 35 per kg from their retail outlets at various locations, withsuitable budgetary support to be provided for this purpose.
9. Other measures with a wider horizon include the following:
a. A scheme to support the State Governments in the setting up of farmers’ mandis and mobile bazaars andimprove the functioning of civil supplies corporations and cooperatives will be finalized urgently.
b. The existing PDS will be suitably strengthened through computerization and other steps, including openingmore procurement windows across the country.
c. State Governments would be urged to review the APMC Acts and, in particular, consider exempting horticulturalproducts from their purview thereby mitigating marketing and distribution bottlenecks in this crucial sector.State Governments will also be urged to consider waiving mandi tax, octroi, and other local levies which impedesmooth movement of essential commodities, as well as to reduce commission agent charges.
d. Investment will be encouraged in supply chains, including provisions for cold storages, which will be dovetailedwith organized retail chains for quicker and more efficient distribution of farm products, minimizing wastage.The DIPP, Department of Food and Public Distribution, Ministry of Food Processing Industries, and thePlanning Commission will jointly work out schemes for this purpose.
e. An Inter-Ministerial Group (IMG) has been set up under the Chief Economic Adviser, Ministry of Finance, toreview the overall inflation situation, with particular reference to primary food articles. The IMG will, inter alia,review production/ rainfall trends and build an institutional machinery to read warning signals, assessinternational trends, recommend action on the fiscal, monetary, production, marketing, distribution, andinfrastructure fronts to prevent price spikes, and suggest measures to strengthen collection and analysis ofdata and forecasting.
f. The Committee of Secretaries under the Cabinet Secretary will review the prices situation with individualStates, and advise the Departments concerned of the Central Government to maintain close coordination withState agencies to get direct feedback with a view to taking suitable remedial measures on a fast track.
82 Economic Survey 2010-11
Website: http://indiabudget.nic.in
of pulses and sugar by public-sector undertakings,distribution of imported pulses and edible oilsthrough the PDS, and release of higher quota ofnon-levy sugar. In addition, State Governments areempowered to act against hoarders of food itemsby holding in abeyance the removal of restrictionson licensing, stock limits, and movement of foodarticles under the Essential Commodities Act 1955.Some of the important anti-inflationary measurestaken are given in Box 4.3.
MONETARY DEVELOPMENTS DURING
2010-11
4.29 In response to the global financial crisisbeginning mid-September 2008, the RBI adoptedan accommodative monetary policy stance thathelped instil confidence among market participantsand ensure that the economy recovered as quicklyas possible. The Indian economy exhibitedacceleration in the momentum of recovery duringthe course of 2009-10. Despite a deficient monsoon,the expansionary monetary and fiscal stanceadopted in response to the global crisis contributedto the recovery. After remaining subdued duringthe first half of the year, headline inflation spikedin the second half, initially driven by high foodprices but turning more generalized over successivemonths. In view of rising food inflation and the riskof it impinging on inflationary expectations alongsidethe consolidating recovery, the RBI stated a clearshift in stance from ‘managing the crisis’ to‘managing the recovery’ and announced the firstphase of exit from the expansionary monetary policyin its Second Quarter Review of October 2009 byterminating some sector-specific facilities andrestoring the statutory liquidity ratio (SLR) of
scheduled commercial banks (SCBs) to its pre-crisis level.
4.30 As there were clear signs that the recoverywas consolidating, it was felt that the main policyinstruments were at levels more consistent with afast recovering economy than a crisis economyand it was imperative therefore to carry forwardthe process of exit from an accommodative policystance. Taking this consideration into account,during 2010-11 the RBI raised the policy rates sixtimes whereby the repo rate under the LAF hascumulatively been increased by 175 basis points(bps) to stand at 6.5 per cent and the reverse reporate by 225 bps to 5.5 per cent. The RBI hasmoreover retained the cash reserve ratio (CRR) at6 per cent of the net demand and time liabilities(NDTL) of banks. Thus in 2010-11, the persistentlyhigh inflation above the comfort level of the RBI ,together with growth buoyancy, necessitated thatthe monetary policy focus remain on containinginflation and inflationary expectations.
4.31 The RBI indicated in its First Quarter Reviewof Monetary Policy (27 July 2010) that it will nowundertake mid-quarter reviews roughly at theinterval of one and half months after each quarterlyreview. By instituting these, it was the Bank’sintention to take the surprise element out of off-cycle actions. Accordingly, the Reserve Bankannounced the mid quarter monetary policy reviewon 16 September 2010 and 16 December 2010.
4.32 In 2010-11, the RBI continued its policy ofmaintaining adequate liquidity in the system so thatall legitimate credit requirements for productivepurposes were met, consistent with the objective ofprice and financial stability. The management ofliquidity was achieved through appropriate use of
50
70
90
110
130
150
170
190
Inde
x (2
007=
100) 2007
Movement in city-wise average RESIDEXFigure 4.6
Sura
t
Pune
Patn
a
Mum
bai
Luck
now
Kolk
ata
Koch
i
Jaip
ur
Hyde
raba
d
Farid
abad
Delh
i
Chen
nai
Bhop
al
Beng
alur
u
Ahm
edab
ad
2008
2009
2010 H-1
83Prices and Monetary Management
Website: http://indiabudget.nic.in
open market operations (OMOs), the MarketStabilization Scheme (MSS), LAF, and a slew ofspecial facilities. While the overall liquidity in thesystem has remained in deficit consistent with thepolicy stance, the extent of tightness has beenbeyond the comfort level of the RBI of (+)/(-) 1 percent of NDTL, mainly due to the persistence oflarge Government cash balances. In addition, theliquidity deficit has been accentuated by structuralfactors such as significantly above-trend currencyexpansion and relatively sluggish growth in bankdeposits even as the credit growth accelerated in2010-11. While the liquidity deficit improvedtransmission of monetary policy signals with severalbanks raising deposit and lending interest rates,excessive deficits induce unpredictability in bothavailability and cost of funds, making it difficult forthe banking system to sustain credit delivery.
4.33 In view of the persistent liquidity pressures,the RBI in November 2010 implemented somemeasures such as additional liquidity support toSCBs under the LAF up to 2.0 per cent of theirNDTL, continuation of the second LAF (SLAF), andOMO purchase of Government securities.Subsequently in the mid quarter review, 16December 2010, the RBI reduced the SLR of SCBsfrom 25 per cent of their NDTL to 24 per cent witheffect from 18 December 2010. Furthermore, itdecided to conduct OMO auctions for purchase ofgovernment securities for an aggregate amount of` 48,000 crore in the next one month. It was alsoclearly communicated that as the economyexpands, it needs primary liquidity, which will haveto be provided in a manner consistent with themonetary policy stance. Such provision of liquidityshould not be construed as a change in the monetarypolicy stance since inflation continues to remain amajor concern.
4.34 To sum up, the underlying growth momentumof the Indian economy remains strong. Even asinflation has moderated, it remains significantlyabove the comfort level of the RBI. Moreover, risksto inflation remain on the upside, both from domesticdemand and higher global commodity prices. Thereis, therefore, a need for continued vigilance on theinflation front against the build-up of demand-sidepressures. A major challenge for the RBI in recenttimes has been liquidity management. It is the RBI’sendeavour to alleviate the liquidity pressure in amanner consistent with the monetary policy stanceof containing inflation and anchoring inflationaryexpectations.
4.35 The current monetary policy stance, asindicated in the Bank’s Second Quarter Review(November 2010) was as follows:
a. Contain inflation and anchor inflationaryexpectations while being prepared to respondto any further build-up of inflationarypressures.
b. Maintain an interest rate regime consistentwith price, output, and financial stability.
c. Actively manage liquidity to ensure that itremains broadly in balance, with neither asurplus diluting monetary transmission nora deficit choking off fund flows.
In the same document the RBI observed that ‘basedpurely on current growth and inflation trends, theReserve Bank believes that the likelihood of furtherrate actions in the immediate future is relatively low’.This indication of pause will not deter it from takingfurther policy actions if required and, accordingly, italso indicated that ‘however, in an uncertain world,we need to be prepared to respond appropriately toshocks that may emanate from either the global ordomestic environment’. In continuation of thatannounced policy, and renewed inflationarypressures, especially in food prices, the RBI raisedpolicy rates again in January 2010 by 25 bps intheir Third Quarter Review.
Trends in Monetary Aggregates4.36 During the year 2010-11, the growth rates ofreserve money (M
0) and narrow money (M
1)1 have
been higher as compared to the preceding yearwhile broad money (M
3) growth has been lower
(Table 4.10). The moderation in growth of narrowand broad money is largely on account of thedeceleration in growth of deposits, both demand andtime (up to 3 December 2010).
Reseve Money (M0)
4.37 During 2010-11, on a financial-year basis,M
0 expanded by 8.4 per cent (up to 10 December
2010), compared to an increase of 1.6 per centduring the corresponding period of the precedingyear (Table 4.11).
4.38 The net foreign assets (NFA) of the RBIincreased by 6.1 per cent during this period, asagainst an increase of 1.5 per cent during thecorresponding period of the previous year. On a year-on-year basis, as on 11 December 2010, the NFAof the RBI marginally increased by 0.6 per centcompared to a 6.8 per cent increase a year earlier(Figure 4.7).1For the period up to 19 November 2010.
84 Economic Survey 2010-11
Website: http://indiabudget.nic.in
Table 4.10 : Movement of select monetary parameters
(per cent)
Items Yearly Variation Growth rates as on December 3, 2010
Reserve money and RBI net foreign exchange assets-annual growth rateFigure 4.7
NFA
Year2009-10 2010-11
Mar Apr
May Jun
Jul
Aug
Sep
Oct
Nov
Dec
Jan
Feb
Mar Apr
May Jun
Jul
Aug
Sep
Oct
Nov
Dec
Table 4.11 : Sources of change in reserve money
(per cent)
Growth rate
Financial-year basis Year -on-Year
Dec. 11 Dec. 10, Dec. 11 Dec. 10,2009 2010 2009 2010over over over over
2009-10 March 31, March 31, Dec. 12, Dec. 11 2009 2010 2008 2009
Reserve Money 17 1.6 8.4 12.8 24.8
A. Components
a) Currency in Circulation 15.7 10.8 14 17.2 19
b) Bankers’ Deposits with RBI 21 -19.6 -4.1 1.2 44.2
c) Other Deposits with RBI -31.1 -34.4 0.3 -28 5.5
B. Select Sources of Reserve Money
1. Net Foreign Exchange Assets of RBI -3.8 1.5 6.1 6.8 0.6
2. Government’s Currency Liabilities to the Public 12.1 7.7 4.4 10.6 8.6
3. Net Non-monetary Liabilities of RBI -22.3 -1.5 17.1 19.5 -7.6
Source: RBI.
85Prices and Monetary Management
Website: http://indiabudget.nic.in
4.39 Net RBI credit to the Central Governmentincreased by ` 70,856 crore during the financialyear so far (up to 10 December 2010). This wasmainly on account of increase in repo operationsunder the LAF and open market purchases of theBank, partly offset by increase in the cash balancesof the Central Government. On a year-on-year basis,increase in the net RBI credit to the CentralGovernment, as on 10 December 2010, was` 2,10,714 crore as against an increase of ̀ 98,273crore a year earlier.
Narrow Money (M1)
4.40 Narrow money (M1) increased by 18.6 per
cent in 2009-10 as compared to an expansion of9.0 per cent during 2008-09. During 2010-11, M
1
growth has generally been higher than in 2009-10,though there was significant deceleration duringthe latest fortnight for which data are available (i.e.,3 December 2010). On a financial-year basis, M
1
increased by 3.1 per cent during the current year(up to 3 December 2010) compared to increase of5.1 per cent during the corresponding period ofthe previous year. On a year-on-year basis, as on3 December 2010, M
1 growth was 16.5 per cent as
compared to 18.3 per cent a year earlier (Figure4.8). During the current financial year (up to 3December 2010), currency with the publicexpanded by 12.9 per cent (` 99,324 crore),compared to an increase of 9.8 per cent (` 64,962crore) during the corresponding period of theprevious year.
4.41 The other important component of M1,
namely demand deposits with banks decreased by7.3 per cent during the period up to 3 December2010 as against a marginal increase of 0.1 per
cent during the corresponding period of theprevious year. On a year-on-year basis, as on 3December 2010, the growth of currency with thepublic was higher at 18.7 per cent as compared to17.2 per cent a year earlier. For the same period,growth in demand deposits was 13.7 per cent ascompared to 19.9 per cent a year earlier.
Broad money (M3)
4.42 Broad money (M3) supply increased by 16.8
per cent during 2009-10 which was lower than the17.0 per cent indicative growth envisaged in theAnnual Policy Statement of the Reserve Bank for2009-10.
4.43 The main components and sources of broadmoney are indicated in Table 4.12.
4.44 Time deposits with banks during 2010-11grew at a lower rate of 10.1 per cent (up to 3December 2010) as compared to 11.2 per centduring the corresponding period of the previousyear. On a year-on-year basis also, as on 3December 2010, the growth in time depositsmoderated to 14.9 per cent from 18.7 per cent ayear earlier (Table 4.12).
4.45 During the current financial year 2010-11(up to 3 December 2010) the growth in M
3 was 8.2
per cent as compared to 9.6 per cent during thecorresponding period of the previous year. On ayear-on-year basis, M
3 grew by 15.3 per cent on 3
December 2010, as against growth of 18.6 per centon the corresponding date of the previous year(Table 4.12 and Figure 4.9). This is lower than theindicative 17.0 per cent target set in the SecondQuarter Review of the Annual Policy Statement for2010-11.
4
6
8
10
12
14
16
18
20
22 2008-09
2009-10
2010-11
24
Per
cent
Narrow money (M1) - annual growth rateFigure 4.8
11 A
pr
25 A
pr
09 M
ay
23 M
ay
06 J
un
20 J
un
04 J
ul
18 J
ul
01 A
ug
15 A
ug
29 A
ug
12 S
ep
26 S
ep
10 O
ct
24 O
ct
07 N
ov
21 N
ov
05 D
ec
19 D
ec
02 J
an
16 J
an
30 J
an
13 F
eb
27 F
eb
13 M
ar
27 M
ar
86 Economic Survey 2010-11
Website: http://indiabudget.nic.in
Table 4.12 : Sources of Change in Money Stock (M3)
Growth Rate
31 March 31 March 31 March 5 December 4 December2009 2009 2010 2008 2009
to to to to to31 March 4 December 3 December 4 December 3 December
2010 2009 2010 2009 2010
(per cent)
I. M1 (Narrow Money) 18.6 5.1 3.1 18.3 16.5
II. M3 (Broad Money) (1+2+3+4) 16.8 9.6 8.2 18.6 15.3
1. Currency with the Public 15.4 9.8 12.9 17.2 18.7
2. Demand Deposits with Banks 22.8 0.1 -7.3 19.9 13.7
3. Time Deposits with Banks 16.1 11.2 10.1 18.7 14.9
4 Other’ Deposits with RBI -31.1 -33.7 9.1 -23.1 13.4
III. Sources of Change in Money Stock (M3)
1. Net Bank Credit to Government 30.5 19.4 8.7 38.2 18.8
of which:
Other Banks’ credit to
Government 19.7 19.5 6.9 26.7 7.1
2. Bank Credit to Commercial Sector 15.9 4.8 10.3 10.5 21.9
of which:
Other Banks’ credit to
Commercial Sector 16.3 5.1 10.3 10.4 22.0
3. Net Foreign Exchange Assets of
the Banking Sector -5.2 -0.3 5.3 9.0 0.1
4. Government’s Currency
Liabilities to the Public 12.1 7.7 4.4 10.6 8.6
5. Banking Sector’s Net Non-
monetary Liabilities Other than
Time Deposits 16.0 15.1 9.9 23.4 10.8
Memo Items:
1. Money Multiplier (M3\M
0) 4.85
2. Velocity of Money 1.20
3. Net Domestic Assets 25.4 13.5 9.1 22.2 20.6
4. Net Domestic Credit 20.2 9.2 9.8 18.2 20.9
Source : RBI.
16
18
20
22
24
2008-09
2009-10
2010-11
Per
cent
Broad money (M3) - annual growth rateFigure 4.9
11 A
pr
25 A
pr
09 M
ay
23 M
ay
06 J
un
20 J
un
04 J
ul
18 J
ul
01 A
ug
15 A
ug
29 A
ug
12 S
ep
26 S
ep
10 O
ct
24 O
ct
07 N
ov
21 N
ov
05 D
ec
19 D
ec
02 J
an
16 J
an
30 J
an
13 F
eb
27 F
eb
12 M
ar
27 M
ar
14
87Prices and Monetary Management
Website: http://indiabudget.nic.in
4.46 Among the sources of M3, however, bank
credit to the commercial sector has beenaccelerating since November 2009 (Figure 4.10).
Money Multiplier4.47 During 2009-10, the expansion in M
0 was
higher than that in M3. Accordingly, the ratio of M
3
to M0 (money multiplier) showed a decrease. At the
end of March 2010, this ratio was 4.8, marginallylower than the end-March 2009 figure of 4.11. Duringthe current financial year 2010-11, the moneymultiplier has generally shown a decreasing trendon account of reserve money registering a highergrowth than broad money supply. As on 3 December2010, the money multiplier was 4.9 compared to5.2 on the corresponding date of the previous year(Figure 4.11).
Movement in other monetary indicators
4.48 While the year-on-year money supply (M3)
growth at 16.5 per cent in December 2010 was
close to the indicative projection of 17 per cent,non-food credit growth at 24.4 per cent was muchabove the indicative projection of 20 per cent.Credit expansion in the recent period has beenrather sharp, far outpacing the expansion indeposits. Rapid credit growth withoutcommensurate increase in deposits is notsustainable, with banks having to rely on borrowingfrom the Central bank. As a result of injection ofprimary liquidity of over ` 67,000 crore throughOMO auctions since early November 2010, thestructural liquidity deficit in the system has declinedsignificantly.
4.49 Monetary deepening, as measured by theratio of average M
3 to the GDP, increased from
43.8 per cent in 1990-91 to 83.1per cent in 2009-10. This could be attributed to the spread of bankingservices in the country and development of thefinancial sector. The monetization of the economyas measured by the ratio of average M
1 to the GDP
5
10
15
20
25
2008-09
2009-10
2010-11
30
Per
cent
Bank credit to commercial sector - annual growth rateFigure 4.10
13 A
pr
27 A
pr
11 M
ay
25 M
ay
08 J
un
22 J
un
06 J
ul
20 J
ul
03 A
ug
17 A
ug
31 A
ug
14 S
ep
28 S
ep
12 O
ct
26 O
ct
09 N
ov
23 N
ov
07 D
ec
21 D
ec
04 J
an
18 J
an
01 F
eb
15 F
eb
29 F
eb
14 M
ar
28 M
ar
4.0
4.4
4.8
5.2
5.6
2008-09
2009-10
2010-11
6.0
Per
cent
Movements in money multiplierFigure 4.11
11 A
pr
25 A
pr
09 M
ay
23 M
ay
06 J
un
20 J
un
04 J
ul
18 J
ul
01 A
ug
15 A
ug
29 A
ug
12 S
ep
26 S
ep
10 O
ct
24 O
ct
07 N
ov
21 N
ov
05 D
ec
19 D
ec
02 J
an
16 J
an
30 F
eb
13 F
eb
27 F
eb
12 M
ar
26 M
ar
31 M
ar
88 Economic Survey 2010-11
Website: http://indiabudget.nic.in
10
20
30
40
50
60
70
80
Rat
ios
to G
DP
(per
cen
t)
Year
Aggregatedeposits
Select monetary aggregates as per cent of GDPFigure 4.12
90
1990
-91
1991
-92
1992
-93
1993
-94
1994
-95
1995
-96
1996
-97
1997
-98
1998
-99
1999
-00
2000
-01
2001
-02
2002
-03
2003
-04
2004
-05
2005
-06
2006
-07
2007
-08
2008
-09
2009
-10
M1
M3
has also shown an upward trend, albeit at a slowerrate, during this period. In 1990-91, this ratio was
15.3 per cent and it increased to 21.2 per cent in2009-10 (Table 4.13 and Figure 4.12).
Table 4.13 : Select monetary aggregates (ratios to GDP)
As per cent of GDP at Market Prices (1999-2000 base)
Currency Demand deposits Time deposits Aggregate M1 M3 with public with banks with banks deposits
1990-91 8.7 6.4 28.5 34.9 15.3 43.8
1991-92 8.8 6.9 28.8 35.7 15.9 44.7
1992-93 8.6 6.9 29.8 36.6 16 45.7
1993-94 8.8 6.6 30.3 36.9 15.7 46.1
1994-95 9.1 7.2 30.4 37.6 16.7 47.1
1995-96 9.4 6.7 29.8 36.5 16.6 46.4
1996-97 9.2 6.5 30.5 37 16.1 46.6
1997-98 9.3 6.7 33 39.7 16.3 49.2
1998-99 9.1 6.7 35.5 42.2 16 51.5
1999-00 9.5 6.8 37.7 44.5 16.4 54.1
2000-01 9.6 7.2 41.3 48.5 17 58.2
2001-02 10 7.4 44.9 52.2 17.5 62.3
2002-03 10.5 7.5 49 56.5 18.2 67.1
2003-04 10.7 7.8 48.9 56.7 18.7 67.6
2004-05* 10.4 8 47 55 18.5 65.5
2005-06* 10.3 8.8 46.8 55.6 19.3 66.1
2006-07* 10.5 9.4 48.8 58.2 20 68.9
2007-08* 10.5 9.5 52.7 62.2 20.1 72.8
2008-09* 11 9.3 57.5 66.8 20.4 77.9
2009-10* 11.4 9.7 61.9 71.5 21.2 83.1
Source : RBI.
Note:* Based on GDP data with 2004-05 as base.
89Prices and Monetary Management
Website: http://indiabudget.nic.in
LIQUIDITY MANAGEMENT
4.50 The Reserve Bank continued its active policyof liquidity management through the LAF, CRR,and OMOs. During 2010-11 so far, the centre’ssurplus balance with the RBI has been a key driverof autonomous liquidity. Currency in circulationhas been another key determinant of autonomousliquidity. The LAF window of the Reserve Bank,which remained in surplus mode for nearly 18months, switched into deficit mode towards end-May 2010 and largely maintained the trendsubsequently.
4.51 The liquidity conditions changed significantlyduring the first quarter of 2010-11. The gradualmoderation in volume of surplus liquidity in thesystem since February 2010 reflected thecalibrated normalization of the monetary policy bythe RBI. Accordingly, the LAF remained in theabsorption mode, though the absorption volumedeclined gradually. To anchor inflation and prevent
further build-up of inflationary pressure, the RBIincreased the repo and reverse repo rates as wellas CRR by 25 bps each in April 2010 in the AnnualMonetary Policy for 2010-11.The surplus liquidityin the domestic market gradually declinedthereafter. A significant development was that theLAF window of the RBI, after remaining in surplusmode for nearly 18 months, switched into deficitmode towards the end of May 2010 mainly onaccount of 3G (3rd generation spectrum) and BWA(broadband wireless access) auctions and theconsequent migration of liquidity to the CentralGovernment’s cash balance account with the RBI.In anticipation of temporary tightening of liquidityconditions, the RBI introduced measures allowingSCBs to avail of additional liquidity support underthe LAF to the extent of up to 0.5 per cent of theirNDTL and also access to the SLAF on a daily basisfor the period 28 May - 2 July 2010. The averagedaily liquidity injection under the LAF during June2010 was around ` 47,000 crore in contrast to the
Table 4.14 : Liquidity management
(` crore)
Outstanding as on last Friday LAF MSS Centre’s surplus* Totalof the month
Note : * Excludes minimum cash balances with the RBI in case of surplus.** Data pertain to 31March.-ve sign under LAF indicates injection of liquidity through the LAF.-ve sign under Centre’s surplus indicates WMA /OD (ways and means advances/overdraft).
90 Economic Survey 2010-11
Website: http://indiabudget.nic.in
-150
-100
-50
0
50
100
� t
hous
and
cror
es
FLAF
LAF reverse - repo and repo volumeFigure 4.13
150
200
SLAF
Year2009-10 2010-11
01 J
an
01 F
eb
01 M
ar
01 A
pr
01 M
ay
01 J
un
01 J
ul
01 A
ug
01 S
ep
01 O
ct
01 N
ov
01 D
ec
01 J
an
01 F
eb
01 M
ar
01 A
pr
01 M
ay
01 J
un
01 J
ul
01 A
ug
01 S
ep
01 O
ct
01 N
ov
01 D
ec
01 J
an
2008-09
Note: 1) Reverse repo is positive and repo is negative. 2) The second LAF (SLAF) is usually being conducted on Reporting Fridays with effect fromMay 8, 2009. As a part of liquidity easing measures, SLAF on a daily basis is temporarily being conducted till January 28, 2011.
average daily absorption of around ` 33,000 crorein May 2010 ( Table 4.14 and Figure 4.13).
4.52 During the second quarter, July-September,of 2010-11, the liquidity conditions generallyremained in deficit mode. On 2 July 2010, the RBIhiked the repo and reverse repo rates by 25 bpseach to 5.50 per cent and 4.0 per cent respectively.With the persistence of deficit liquidity conditions,the Bank extended the liquidity-easing measuresintroduced earlier. The SCBs were permitted to availof additional liquidity support under the LAF to theextent of up to 0.5 per cent of their NDTL2. TheSLAF on a daily basis was also extended till 16July 2010. On an assessment of the prevailingoverall liquidity conditions and with a view toproviding flexibility to SCBs in liquidity management,the RBI further extended the SLAF on a daily basistill 30 July 2010. The average daily liquidity injectionunder the LAF remained at around ` 47,000 croreduring July 2010. In view of the evolving inflationaryscenario, the RBI raised the repo rate and reverserepo rate further by 25 bps and 50 bps, to 5.75 percent and 4.50 per cent respectively in the FirstQuarter Review of Monetary Policy 2010-11
(announced on 27 July). The liquidity conditionsimproved in August 2010 (mainly on account of largepre-scheduled public debt redemptions on 28 July2010), and the average daily net injection of liquiditydeclined to around ̀ 1000 crore during the month.After a brief period of surplus liquidity (from end-August to early September 2010), the liquidityconditions again switched to injection mode asliquidity migrated to Government account with theRBI on account of quarterly advance tax outflows.On the basis of assessment of the macroeconomicsituation, the RBI increased the repo rate and reverserepo rate by 25 bps and 50 bps respectively in themid-quarter monetary policy review (announced on16 September 2010). The liquidity conditionsremained tight in the second half of September 2010as the surplus cash balances of the Centre startedbuilding up, and the average daily net outstandingliquidity injection was around ̀ 24,000 crore duringthe month.
4.53 The liquidity conditions tightened further inOctober 2010 on account of increase in Governmentsurplus balances and currency in circulation due tofestive season demand. The average daily netoutstanding liquidity injection was around ̀ 62,000
2For any shortfall in maintenance of the SLR arising out of availment of this facility, banks were allowed se ek waiver of penalinterest.
91Prices and Monetary Management
Website: http://indiabudget.nic.in
crore for the entire October 2010. However, the netliquidity injection crossed ` 1,00,000 crore on 29October 2010. In order to ease the frictional liquiditypressure, the RBI announced certain temporarymeasures, namely conduct of special SLAF on 29October and 1 November 2010, conduct of a specialtwo-day repo auction under the LAF on 30 October2010, and waiver of penal interest on shortfall inmaintenance of SLR (on 30-31October) to the extentof 1 per cent of NDTL for availing of additional liquiditysupport under the LAF. The RBI extended theseliquidity-easing measures further and conductedSLAF on all days during 1-4 November 2010 andextended the waiver of penal interest on shortfall inmaintenance of SLR ( to the extent of 1 per cent ofNDTL) for availing of additional liquidity support underthe LAF till 7 November 2010. To contain inflationand anchor inflationary expectations, the RBIincreased the repo and reverse repo rates by 25 bpseach in the Second Quarter Review of MonetaryPolicy on 2 November 2010. Consistent with thestance of monetary policy and based on theassessment of prevailing and evolving liquidityconditions, the RBI conducted purchase ofgovernment securities under its OMOs for anaggregate amount of ̀ 12,000 crore on 4 November2010 and accepted an aggregate amount of ̀ 8352crore in that auction. The high deficit liquidityconditions continued in November 2010 with thepersistence of high Government balances and risein currency in circulation. On 9 November 2010, theRBI has re-introduced liquidity-easing measures(SLAF on a daily basis, the waiver of penal interest
on shortfall in maintenance of the SLR to the extentof 1 per cent of NDTL for availing of additional liquiditysupport under the LAF), to remain in force till 16December 2010. The average daily net liquidityinjection during the month was around ` 99,300crore. The liquidity conditions have remained in highdeficit so far in December 2010 (till 20 December)as huge quarterly advance tax payments haveincreased the liquidity stress in the system. TheRBI conducted purchase of Government securitiesthrough auction as part of its OMOs for an aggregateamount of ̀ 12,000 crore each on 9 December 2010and 15 December 2010; and accepted an aggregateamount of ` 10,120 crore and `11,706 crorerespectively in the auctions. The average daily netoutstanding liquidity injection was around ̀ 1,10,000crore during 1-20 December 2010.
4.54 While the overall liquidity in the system hasremained in deficit consistent with the policy stance,the extent of tightness has been beyond the comfortlevel of the RBI. The RBI decided to (i) reduce theSLR of SCBs from 25 per cent of their NDTL to 24per cent with effect from 18 December 2010;(ii)conduct OMO auctions for purchase of Governmentsecurities for an aggregate amount of ̀ 48,000 crorein the next one month. These two measures areexpected to inject liquidity of the order of ` 48,000crore on an enduring basis. The reduction of the SLRwill free securities and once banks can borrow atthe LAF window with these excess SLR securities,borrowers can shift from costlier sources to the LAFwindow ( Figure 4.14 and Table 4.15).
0
50
100
150
200
250
300
� t
hous
and
cror
es
Actuals
Market stabilisation schemeFigure 4.14
Limits
Year2008-09 2010-11
Mar Apr
May Jun
Jul
Aug
Sep
Oct
Nov
Dec
Jan
Feb
Mar Apr
May Jun
Jul
Aug
Sep
Oct
Nov
Dec
Jan
Feb
Mar Apr
May Jun
Jul
Aug
Sep
Oct
Nov
Dec
Jan
Feb
Mar Apr
May Jun
Jul
Aug
Sep
Oct
Nov
Dec
2007-08 2009-10
92 Economic Survey 2010-11
Website: http://indiabudget.nic.in
MONEY MARKET
4.55 The money market generally remained orderlyduring 2010-11. At the commencement of thefinancial year 2010-11, the call rate mostly remainedaround the lower bound of the informal LAF corridorup to May 2010. With the tightening of liquidityconditions since end-May 2010, reflecting migrationof liquidity to the Central Government account withthe RBI on account of 3G auction/ advance taxpayments, the call rate firmed up. The average dailycall rate for the first quarter was at 4.16 per cent. Ithovered around the upper bound of the LAF corridortill July 2010 as deficit liquidity conditions persisteddue to the high Central Government cash balances.The call rate declined towards the end of Augustand early September with the change in liquidityconditions. However, it again firmed up from themiddle of September 2010 and breached the upperbound of the informal LAF corridor in the second
half of the month reflecting the onset of high deficitliquidity conditions. The average call rate increasedto 5.40 per cent in the second quarter (Table 4.15).The call rate has mostly remained above the upperbound of the corridor in the third quarter of 2010-11so far, reflecting the increased liquidity stress inthe system. The average call rate was 6.59 per centin the third quarter of 2010-11 (till 20 December 2010)(Figure 4.15).
4.56 The rates in the collateralized segments havecontinued to move in tandem with the call rate, albeitbelow it, so far during 2010-11. The weighted averageinterest rate in the collateralized segment of themoney market increased to 5.20 per cent duringthe second quarter from 3.97 per cent in the firstquarter of 2010-11. Transaction volumes in thecollateralized borrowing and lending obligation(CBLO) and market repo segments remained highduring this period, reflecting active market
Source : RBI.Notes : ^ : Average of daily weighted call rate. * : Average of weekly outstanding MSS.
# : Average daily absorption under LAF.
93Prices and Monetary Management
Website: http://indiabudget.nic.in
conditions. Banks continued to remain the majorgroup of borrowers in the collateralized segmentswhereas mutual funds (MFs) remained the majorgroup of lenders of funds in these segments. Thecollateralized segment of the money marketcontinued to remain the dominant segment,accounting for more than 80 per cent of the totalvolume so far during the year.
Certificates of Deposit (CDs)4.57 Though the average gross issuance of CDswas high during 2010-11 so far, the amount of CDsoutstanding declined, indicating decline in netissuances. The amount of outstanding CDs issuedby SCBs declined marginally from ̀ 3,41,054 croreat the end of March 2010 to ` 3,32,982 crore atthe end of November 2010. The outstanding amountconstituted 7.45 per cent (as on 19 November 2010)of aggregate deposits of CD-issuing banks withsignificant inter-bank variation. During April-November 2010, the average issuance was of theorder of around ` 22,000 crore as compared toaround `11,000 crore during the same period ofthe last financial year. The effective interest rate inrespect of aggregate CD issuances increased from6.07 per cent at the end of March 2010 to 8.16 percent as on 19 November 2010.
Commercial Paper (CP)4.58 During 2010-11 so far, the commercial paper(CP) market has also picked up and the size offortnightly issuance increased significantly. Theoutstanding amount of CP issued by corporates hasshown an increasing trend from ` 75,506 crore atthe end of March 2010 to `1,12,003 crore at theend of September 2010 and ̀ 1,17,793 crore at theend of November 2010. The weighted average
discount rate (WADR) of aggregate CP issuancesincreased from 6.29 per cent at the end of March2010 to 7.82 per cent at the end of September 2010,and reached 12.22 per cent at the end of November2010.The shares of ‘leasing and finance companies’,‘manufacturing companies’, and ‘other financialinstitutions’ in total outstanding CPs were at around50 per cent, 39 per cent, and 11 per cent respectivelyat the end of November 2010 (Table 4.16).
Treasury Bills (T-Bills)
4.59 T-Bills issuances during the year 2010-11were modulated according to the cash managementrequirements of the Government as well as evolvingmarket conditions. The notified amounts forcompetitive auctions of T-Bills were reduced duringthe first two quarters of the fiscal year. Theoutstanding stock of T- Bills went down from` 1,34,500 crore on 31 March 2010 to ` 1,26,269crore on 31 December 2010, after taking intoaccount a rise in non-competitive allotment. Theprimary market yields for T-Bills of different tenors(91 days, 182 days, and 364 days) moved upduring the year largely influenced by the liquidityconditions and monetary policy action by the RBI.The yield behaviour during 2010-11 vis-à-vis 2009-10 is shown in Figures 4.16, 4.17, and 4.18.
Cash Management
4.60 During the year, a new short-term instrument,named cash management bill (CMB), wasintroduced in May 2010. CMBs are non-standard,discounted instruments issued for maturities of lessthan 91 days, to meet the temporary cash-flow
0
2
4
6
8
Per
cent
Market repo(Non-RBI)
Movement of money market ratesFigure 4.15
1
3
5
7
Call money
CBLO
Reverserepo rate
Repo rate
Year2009-10 2010-11
Feb
Mar Apr
May Jun
Jul
Aug
Sep
Oct
Nov
Dec
Jan
Feb
Mar Apr
May Jun
Jul
Aug
Sep
Oct
Nov
2008-09
94 Economic Survey 2010-11
Website: http://indiabudget.nic.in
Table 4.16 : Activity in money market segments
(` crore)
Average daily volume Commercial Certificates of (one leg) paper deposit
Year/ Call Market CBLO Total Money Term Out- WADR Out- EIRmonth repo market money stand- (per- stand- (per-
Source: RBI.Notes: ^ Average of daily weighted call rate.
2
4
6
8
2010-11
2009-10
3
5
7
Cut-
off
yiel
ds(p
er c
ent)
Cut-off yields in the auctions of 91-day T-billsFigure 4.16
Apr
May Jun
Jul
Aug
Sep
Oct
Nov
Dec
Jan
Feb
Mar
2
4
6
8
2010-11
2009-10
3
5
7
Cut-
off
yiel
ds(p
er c
ent)
Cut-off yields in the auctions of 182-day T-billsFigure 4.17
Apr
May Jun
Jul
Aug
Sep
Oct
Nov
Dec
Jan
Feb
Mar
95Prices and Monetary Management
Website: http://indiabudget.nic.in
mismatches of the Government. During 2010-11,CMBs were issued twice in May 2010 for anaggregate amount of ̀ 12,000 crore, with a maturityof five and four weeks, respectively.
Central Government Borrowing
4.61 The Union Budget 2010-11 placed the netmarket borrowings (through dated securities)requirement of the Central Government at ̀ 3,45,010crore as against ` 3,97,957 crore raised duringthe previous year. Including repayments of `1,12,133 crore, gross market borrowings wereestimated at ` 4,57,143 crore (as compared to `4,51,000 crore raised in the previous year,including MSS de-sequestering of ̀ 33,000 crore).The actual issuances during the first half of thecurrent year amounted to ` 2,84,000 crore (asagainst issuances of ` 2,95,000 crore, excludingMSS de-sequestering of ̀ 28,000 crore, during thecorresponding period of the previous year).Theissuance calendar for dated securities released on23 September 2010 proposed to raise ` 1,63,000crore during the second half of the year, indicating areduction of ̀ 10,000 crore from the budget estimate.
4.62 The gross borrowings requirement in 2010-11 remained high as in the previous year. The marketborrowings programme is, however,carried out in a
smooth and non-disruptive manner. During the year,the Government undertook buy-back operationswhereby securities worth ̀ 11,767 crore were boughtback.
4.63 During 2010-11 (up to 31 December 2010),gross market borrowings raised through datedsecurities by the Central Government wereRs3,84,000 crore (net `2,98,342 crore) as against`3,83,000 crore (excluding issuances under theMSS) (net ` 3,46,911 crore) raised during thecorresponding period of the previous year. Theweighted average maturity of dated securitiesissued during the year (up to 31 December 2010)was moderately higher at 11.54 years as comparedto 11.15 years for issues during the correspondingperiod of the previous year. The weighted averageyield of dated securities during 2010-11(up to 31December 2010) increased to 7.87 per cent from7.21 per cent during the corresponding period ofthe previous year (Figure 4.19).
Yields on 10-year Government Securities
4.64 Secondary market yields on Governmentsecurities remained in a broad range during the year.Monetary policy, inflation concerns, and supplyissues were the major factors influencing yields ongovernment securities.
2
4
6
8
2010-11
2009-10
3
5
7
Cut-
off
yiel
ds(p
er c
ent)
Cut-off yields in the auctions of 364-day T-billsFigure 4.18
Apr
May Jun
Jul
Aug
Sep
Oct
Nov
Dec
Jan
Feb
Mar
6.0
6.5
7.0
7.5
8.0
2010-11
2009-10
Per
cent
Weighted average yield of primary issues of dated securities (cumulative)Figure 4.19
Apr
May Jun
Jul
Aug
Sep
Oct
Nov
Dec
Jan
Feb
Mar
96 Economic Survey 2010-11
Website: http://indiabudget.nic.in
4.65 Intra-year movements in yields on Governmentsecurities could be attributed to various factors.The upward movement in the month of April 2010was mainly on account of supply pressure in thewake of front-loading of the market borrowingsprogramme.
4.66 In the month of May, concerns regarding highfiscal deficit receded due to higher-than-budgetedcollections from auction of 3G and BWA licences.The improved sentiments drove down yields in themonth of May. The impact of the improvedsentiments, however, was offset by concerns of highinflation and policy tightening by the Reserve Bank.In the third quarter of the current financial year, tightliquidity conditions remained a major factor puttingupward pressure on yields. The 10-year yield, whichwas at 7.87 per cent on 31 March 2010, went up to7.94 per cent on 31 December 2010.
State Government Borrowings
4.67 Twenty-two State Governments have raisedan aggregate amount of ̀ 74,104 crore on a grossbasis up to end-December 2010 as compared to ̀1,00,085 crore raised by 25 State Governmentsduring the corresponding period of the previous year.The cut-off yields have ranged between 8.05 and8.58 per cent as compared to 7.04 and 8.49 percent during the corresponding period of the previousyear. The weighted average yield worked out to 8.36per cent up to end-December 2010 as compared to8.02 per cent during the corresponding period of2009-10 and 8.11 per cent for the year as a whole.The spread between the yield on State DevelopmentLoans (SDLs) and the 10-year benchmarkGovernment of India securities stood lower at 32-69bps up to December 2010 as compared to 45-129bps during the corresponding period of the previousyear. It is expected that the calibrated strategiesadopted for the market borrowings programme ofthe Government of India and the State Governmentswould ensure its completion in a non-disruptivemanner.
MONETARY POLICY STANCE DURING2010-114.68 The accommodative monetary policy whichwas pursued beginning mid-September 2008instilled confidence in market participants, mitigatedthe adverse impact of the global financial crisis onthe economy, and ensured that it started recovering
ahead of most other economies. However, in view ofthe rising food inflation and the risk of it impingingon inflationary expectations, the Reserve Bankembarked on the first phase of exit from theexpansionary monetary policy in October 2009 itself.By April 2010, available data suggested that therecovery was firmly in place, though inflationarypressures accentuated. Accordingly, both repo andreverse repo rates as well as the CRR wereincreased by 25 bps each. The monetary policystance in April 2010 was guided by the followingthree considerations. First, the need to move in acalibrated manner in the direction of normalizing thepolicy instruments in a scenario where real policyrates were still negative. Second, the need to ensurethat demand-side inflation did not becomeentrenched. Third, the need to balance the monetarypolicy imperative of absorbing liquidity while ensuringthat credit was available to both the Governmentand private sector. Significant developments tookplace subsequent to the announcement of themonetary policy in April 2010. Though recoverywas consolidating, developments on the inflationfront raised several concerns. The upward revisionin administered fuel prices on 25 June 2010 wasalso expected to influence inflation in the monthsahead. Accordingly, the repo and reverse repo ratesunder the LAF were increased by 25 bps each on 2July 2010. In the interests of consolidating and ofmore broad-based domestic recovery and with the
Table 4.17 : Revision in Policy Rates(per cent)
Effective Date Repo Reverse Repo CRR
rate rate
2009
05.01.2009 5.50 4.00
17.01.2009 5.00
05.03.2009 5.00 3.50
21.04.2009 4.75 3.25
2010
13.02.2010 5.50
27.02.2010 5.75
19.03.2010 5.00 3.50
20.04.2010 5.25 3.75
24.04.2010 6.00
02.07.2010 5.50 4.00
27.07.2010 5.75 4.50
16.09.2010 6.00 5.00
02.11.2010 6.25 5.25
25.01.2011 6.50 5.50
97Prices and Monetary Management
Website: http://indiabudget.nic.in
then level of consumer price inflation in double digits,the First Quarter Review of the RBI (July 2010)upwardly revised the baseline projection of real GDPgrowth for the year to 8.5 per cent and raised theprojection for WPI inflation for March 2011 to 6.0per cent (Table 4.18). Consistent with thisassessment, the repo rate was increased by 25bps and reverse repo by 50 bps. The monetary policyactions were intended to moderate inflation by reiningin demand pressures and inflationary expectations,maintain financial conditions conducive to sustaininggrowth, generate liquidity conditions consistent withmore effective transmission of policy actions, andreduce the volatility of short-term rates in a narrowercorridor. Given the context of the changing liquiditydynamics, particularly between surplus and deficitmodes, it was proposed to set up a working groupto review the operating procedure of the RBI’smonetary policy, including the LAF. It was alsoannounced that mid-quarter reviews of monetarypolicy would be made in June, September,December, and March. The changes in policy ratessince 2009 are brought out in Table 4.17.
Quarterly Reviews
4.69 As decided in the First Quarter Review, onthe basis of assessment of the macroeconomicsituation, the RBI in its Mid-Quarter Review on 16September 2010 decided to increase the repo rateunder the LAF by 25 bps from 5.75 per cent to 6.0per cent and the reverse repo rate by 50 bps from4.5 per cent to 5.0 per cent.
4.70 The Second Quarter Review of MonetaryPolicy for 2010-11 (released on 2 November 2010)noted that the fragile and uneven nature of therecovery and large unemployment in advanced
Table 4.18: Indicative Projections of Macro Parameters for 2010-11 by the RBI
Indicative projections for growth rates (per cent)
Annual Policy First Quarter Second Quarter Third Quarter2010-11 Review Review Review
Notes : * Includes investment by SCBs in bonds/debenture/shares of public-sector undertakings, privatecorporate sector, and CP.
** Old series.
economies raised concerns about the sustainabilityof the global turnaround whereas the Indianeconomy was operating close to the trend growthrate, driven mainly by domestic factors. However,notwith-standing some moderation in recentmonths, headline inflation in India remainedsignificantly above its medium-term trend and wellabove the comfort zone of the RBI (Table 4.18).Accordingly, the RBI further increased the reporate by 25 bps to 6.25 per cent and the reverserepo rate also by 25 bps to 5.25 per cent on(2 November 2010). The CRR has been retainedunchanged at 6 per cent of the NDTL of banks.
4.71 The RBI in its Third Quarter Review of theMonetary Policy (25 January 2011) indicated thatits stance is shaped by four importantconsiderations:
Inflation is clearly the dominant concern. Evenas the rate itself remains high, the reversal inthe direction of inflation is striking. Primaryfood articles inflation has risen again sharply.Non-food articles inflation and fuel inflation arealready at elevated levels. Non-foodmanufacturing inflation has remained sticky.There are signs of food and fuel price increasesspilling over into generalised inflation.
Second, there has been a sharp rise in globalcommodity prices which has heightenedupside risks to domestic inflation.
Third, growth has moved close to its pre-crisistrajectory even in the face of an uncertain globalrecovery.
Fourth, the uncertainty with regard to globalrecovery has reduced.
98 Economic Survey 2010-11
Website: http://indiabudget.nic.in
4.72 On the basis of the assessment of theexisting macroeconomic scenario, the RBI retainedthe bank rate at 6.0 per cent and the CRR ofscheduled banks at 6.0 per cent of their NDTL;increased the repo rate under the LAF by 25 bpsfrom 6.25 per cent to 6.5 per cent; and the reverserepo rate under the LAF by 25 bps from 5.25 percent to 5.50 per cent. On the basis of anassessment of the liquidity situation, the RBIextended additional liquidity support to the SCBsunder the LAF to the extent of up to 1 per cent oftheir NDTL, till 8 April 2011. For any shortfall inmaintenance of the SLR arising out of availment ofthis facility, banks were allowed to seek waiver ofpenal interest purely as an ad hoc measure.
CHALLENGES AND OUTLOOK
4.73 Inflation is clearly the dominant concern.Average headline inflation in April-December 2010-11 at 9.4 per cent is the highest ever in the decadalaverage. This is also true of annual average inflationbased on the WPI, for primary food articles, fueland power, and manufacturing products. During thecurrent financial year, even as the rate itself remainsuncomfortably high, the reversal in the direction ofinflation in December is also striking. After somemoderation between August and November 2010,inflation rose again in December 2010 on accountof sharp increase in the prices of primary foodarticles and the recent spurt in global oil prices.Non-food manufacturing inflation has also remainedsticky, reflecting buoyant demand conditions.However, in January 2011, headline inflation hascome down to 8.23 per cent and it is expected thatthis trend may continue in the next two months.
4.74 Going forward, the inflation outlook will beshaped by the food price situation and the demand-side pressures in the economy. Rise in food inflation
has not only persisted for quite some time, but hasalso been rather sharp. High inflation in food articlesis not unique to India, it has spiked in many othercountries as well. The domestic food price situationcould be exacerbated by the increase in global foodprices because of dependency on import of somefood items like edible oils. Current growth andinflation trends warrant persistence with an anti-inflationary monetary stance.
4.75 The issue of maintaining an environmentwhere the cost and availability of credit is supportiveof growth momentum, while ensuring that inflationfalls back to more comfortable target levels, will beat the centre stage of policy consideration in thenear term. This has to be seen in the context ofmore than expected inflation in the recent past,relative stickiness of prices, especially of food, andbuilding of wider inflationary expectations in theeconomy, even as monetary policy tools are beingused proactively to manage demand and dampeninflationary pressures in the economy. Theconcurrent consolidation of fiscal deficits will,however, be essential as it is expected to ease theconduct of effective monetary policy in the nearfuture. The reduced fiscal deficits will permit greateravailability of credit to sustain growth, while tightermonetary policy starts to transmit its impact inreducing inflationary pressures. The transmissionof monetary policy, however, comes with a lag.Inflationary pressures in the economy are alsoemanating in part from supply-side constraints,especially in food and other primary articles, aswell as the transmission of higher global food, oil,and other commodity prices. These considerationstherefore are complicating the issue in the nearterm. If external commodity negative price shocksbuild further, the dilemmas will become greater.Therefore, the policy challenge of maintaining thegrowth momentum in the economy with price stabilityis going to remain a key focus area for monetarypolicy and macroeconomic management.
Financial Intermediationand Markets CHAPTER
5
BANK CREDIT
5.2 Bank credit that started picking up from thelast quarter of 2009-10 continued its momentumduring 2010-11 as well. The pickup in credit reflectedthe improved demand conditions associated with
stronger industrial recovery and growth. Telecomoperators raised credit to pay for 3G/broadbandwireless access (BWA) spectrums, which partlycontributed to stronger credit growth in the firstquarter of 2010-11.
Broader and deeper financial markets will be crucial for mobilizing higher savingsand intermediating them efficiently to finance higher investment and growth. India’sfinancial markets continued to gain strength in recent years, in the wake of steadyreforms since 1991. Prudent regulations and institutions protected the economy fromthe recent global financial shocks. And its dynamism is a leading factor in the currentrecovery.
Year-on-year non--food credit growth was up 24 per cent at the end of December 2010,and financed many sectors more broadly (from the agriculture rebound to thirdgeneration [3G] spectrum sales and private infrastructure projects), while the overallcredit to gross domestic product (GDP) ratio rose to about 55 per cent, continuing itsprogress (but still structurally well below potential). Domestic capital markets performedwell in 2010, primary markets financing record levels, including the largest-ever initialpublic offering (IPO) (for Coal India), while secondary markets reached new highs.Record foreign inflows helped support the market. Pensions and insurance gained,with life insurance premium growing nearly 26 per cent and penetration doubling to5.4 per cent of GDP in 2009, from 2.3 per cent in 2000 when insurance reformsstarted. Looking to the future, the twin challenges are to continue this progress ongradual financial reform and to modernize regulations and institutions to ensure itscontinued safety and stability.
The past year saw banking deposit growth slow-down, as real interest rates weredepressed, especially compared to returns in other fast-recovering asset markets (realestate, gold, and stock markets). The priority is to considerably extend the reach ofbanking to help mobilize more savings, add more depth, and more efficientlyintermediate opportunities, including those in the traditional ‘priority’ sectors. Tomove ahead (1) financial inclusion needs to be accelerated as a next crucial step;innovative solutions will be needed in this regard; (2) similar efforts are needed todeepen domestic capital markets and the role of non-bank institutions, especiallyin corporate bond and debt markets; (3) the rapid lowering of fiscal deficits isneeded to help crowd-in such developments; and (4) the Government and ReserveBank of India (RBI) have already begun a series of essential regulatory overhaul,aimed at updating the modern legislation underlying financial markets, and improvingmacro-prudential safeguards and institutions. We need to continue along this path.The rest of the chapter describes this series of developments in the financial sector.
Website: http://indiabudget.nic.in
5.3 As against an increase of 17.5 per cent in2008-09, growth in bank credit moderated to 16.9per cent in 2009-10. Non-food credit during thesame period was 17.8 per cent and 17.1 per centrespectively. During 2010-11 credit started pickingup in a strong way from early June 2010 and sincethen the growth in bank credit has shown acontinuous increasing trend. During the financialyear 2010-11, growth in bank credit extended byscheduled commercial banks (SCBs) stood at 12.2per cent as on 17 December 2010 as comparedto 6.0 per cent for the corresponding period in2009-10. The year-on-year growth in bank creditas on 17 December 2010 was high at 23.7 percent as compared to 11.3 per cent for thecorresponding period of the previous year. It was
in fact above the Reserve Bank’s indicativeprojected trajectory of 20 per cent for the fullyear as set out in the Second Quarter Review for2010-11 (2 November). Growth in non-food creditso far in 2010-11 on financial-year basis was muchhigher at 11.9 per cent as compared to 6.2 percent in the previous year and 23.5 per cent year-on-year basis as compared to 11.8 per cent forthe corresponding period of the previous year.Growth in aggregate deposits so far in 2010-11have been lower than for the corresponding periodof the previous year (Table 5.1). The high expansionin credit relative to lower growth in deposits during2010-11 has caused increase in the credit- depositratio from 72.2 per cent in end-March 2010 to75.8 per cent on 17 December 2010 (Figure 5.1).
5.4 During the financial year so far, private-sectorbanks have been faring better in terms of growth incredit extended as compared to public-sector banks(PSBs) and foreign banks. Due to higher credit growthand tight liquidity condition, commercial banks’investment in Government and other approvedsecurities remained low at 27.3 per cent as comparedto 29.2 per cent in the previous year. Consequently,the investment-deposit ratio declined from 30.8 percent in end-March 2010 to 30.1 per cent on 17December 2010 (Figure 5.2) as the investment anddeposit growth of SCBs is lower.
INTEREST RATES
i. Deposit Rates
5.5 Domestic deposit rates of SCBs have movedup so far during 2010-11. Following the RBI’s raisingof the repo and reverse repo rates by 125 basis points(bps) and 175 bps respectively during March-November 2010, the SCBs increased their depositrates by 50 bps to 200 bps. Interest rates offeredby the PSBs, private-sector banks and foreign bankson deposits of maturity of one to three yearschanged from the range of 6.00-7.25 per cent, 5.25-7.75 per cent, and 2.25-8.00 per cent respectivelyin March 2010 to the range of 7.00-8.50 per cent,7.25-9.00 per cent, and 3.00-8.00 per centrespectively in December 2010 (Table 5.2).
ii. Lending Rates
5.6 The BPL` of SCBs remained unchanged fromJuly 2009 till end-June 2010. The base rate systemreplaced the BPLR system with effect from 1 July2010. The base rates of PSBs, private-sector banks,and foreign banks were fixed in the range of 7.50-8.25 per cent, 7.00-8.75 per cent, and 5.50-9.00per cent respectively. Subsequently, several banks
reviewed and increased their base rates. The baserate of PSBs and private-sector banks changed tothe range of 7.60-9.00 per cent and 7.00-9.00 percent respectively in December 2010 (Table 5.2).Subsequent to the migration to the base rate system,effective 1 July 2010, we find a large degree ofconvergence of base rates as announced by banks.Almost 60 banks with a of 97 per cent share in totalbank credit have fixed the base rate in the closerange of 7.00-8.50 per cent in November 2010.
iii. Interest Rates on Non-resident Indian(NRI)Deposits
5.7 The interest rates on non-resident external termdeposits (NRE) and foreign currency non-residentbank account (FCNR[B]) deposits are regulated byRBI. At present, NRE ceiling deposit interest ratestands at LIBOR plus 175 basis points and FCNR(B)ceiling deposit interest rate is at London Interbankoffered rate (LIBOR) plus 100 bps.
iv. Interest Rate on Rupee Export Credit
5.8 The validity of the reduction in interest rateceiling to 250 bps below the BPLR on pre-shipmentrupee export credit up to 270 days and post-shipmentrupee export credit up to 180 days was extended to30 June 2010 from 30 April 2010. However, the RBImeanwhile advised the SCBs on 9 April 2010 toreplace the BPLR system with a base rate systemfrom 1July 2010. This necessitated changes in theformula in respect of interest rate on export credit.Accordingly, it was decided to deregulate the interestrates on pre-shipment rupee export credit up to 270days and post-shipment rupee export credit up to180 days. Banks are, therefore, free to decide thelending rate on export credit at or above the baserate with effect from 1 July 2010.
5.9 The Government of India decided to extendinterest subvention of 2 percentage points with effectfrom 1 April 2010 to 31 March 2011 on pre- and post-shipment rupee export credit for four export sectors,namely handicrafts, carpets, handlooms, and smalland medium enterprises (SMEs) subject to thecondition that the interest rate after subvention willnot fall below 7 per cent, which is the rate applicableto a short-term crop loan under priority-sectorlending. With the changeover to the base rate system,the interest rates applicable to all tenors of rupeeexport credit advances with effect from 1 July 2010will be at or above base rate in respect of all fresh/renewed advances. Accordingly, banks may reducethe interest rate chargeable to exporters as per thebase rate system in the four sectors by the amountof subvention available. If, as a consequence, theinterest rate charged to exporters goes below thebase rate, such lending will not be construed to beviolative of the base rate guidelines.
SECTORAL DEPLOYMENT OF CREDIT
5.10 Disaggregated data on sectoral deploymentof gross bank credit from 47 banks accounting forabout 95 per cent of bank credit and non-food creditavailable up to 19 November 2010 showed thatamong the major sectors, credit (year-on-year) toagriculture recorded a growth of 20.0 per cent (22.9
per cent in March 2010), while that to industry(medium and large) recorded a growth of 28.9 percent (as against 24.8 per cent in March 2010). Creditto wholesale trade recorded a growth of 17.0 percent (as against 28.1 per cent in March 2010).
5.11 Credit to the priority sector grew by 21.0 percent (year-on-year) in November 2010 as comparedto 17.1 per cent in March 2010. Among the prioritysub-sectors, credit to micro and small enterprises(MSEs) (including service-sector enterprises)recorded a growth of 21.5 per cent (year-on-year) inNovember 2010 as compared to 20.8 per cent inMarch 2010. (Table 5.3).
Priority-sector Lending
5.12 A target of 40 per cent of adjusted net bankcredit (ANBC) or credit equivalent amount of off-balance sheet exposures (OBE), whichever is higher,as on 31 March of the previous year, has beenstipulated for lending to the priority sector bydomestic SCBs, both in the public and privatesectors Within this, sub-targets of 18 per cent and10 per cent of ANBC or credit equivalent amount ofOBE, whichever is higher, have been stipulated forlending to agriculture and the weaker sectionsrespectively. However, to ensure that the focus ofthe banks on the direct category of agriculturaladvances does not get diluted, the indirect lending
Table 5.2 : Movements in deposit and lending rates
a) Up to 1 Year 2.75-8.25 1.00-6.50 1.00-6.25 1.00-6.25 1.00-7.00 1.00-8.00
b) 1 Year up to 3 Years 8.00-9.25 6.00-7.25 6.00-7.25 6.00-7.25 6.75-7.75 7.00-8.50
c) Over 3 Years 7.50-9.00 6.50-7.75 6.50-7.75 6.50-7.75 7.00-7.75 7.00-8.75
Private-sector Banks
a) Up to 1 Year 3.00-8.75 2.00-6.50 2.00-6.50 2.00-6.50 2.50-7.25 2.50-7.60
b) 1 Year up to 3 Years 7.50-10.25 5.25-7.75 6.25-7.50 6.25-7.75 6.50-8.25 7.25-9.00
c) Over 3 Years 7.50-9.75 5.75-8.00 6.50-8.00 6.50-8.00 6.50-9.00 7.00-9.00
Foreign Banks
a) Up to 1 year 2.50-8.50 1.25-7.00 1.25-7.00 1.25-7.00 1.25-7.30 1.25-7.00
b) 1 year up to 3 years 2.50-9.50 2.25-8.00 3.00-8.00 3.00-8.00 3.00-8.00 3.00-8.00
c) Over 3 years 2.50-10.00 2.25-8.75 3.00-8.50 3.00-8.50 3.00-8.25 3.00-8.25
Source: RBI.Notes: * As on 10 December 2010.
2. Benchmark prime lending rate (BPLR).
103Financial Intermediation and Markets
Website: http://indiabudget.nic.in
to agriculture in excess of 4.5 per cent of ANBC orcredit equivalent amount of OBE, whichever is higher,are not reckoned for computing performance under18 per cent target. However, all agricultural advancesunder the categories ‘direct’ and ‘indirect’ arereckoned in computing performance under the overallpriority-sector target of 40 per cent of ANBC or creditequivalent amount of OBE, whichever is higher.
5.13 A target of 32 per cent of ANBC or creditequivalent amount of OBE, whichever is higher, hasbeen stipulated for lending to the priority sector byforeign banks having offices in India. Within theoverall target of 32 per cent to be achieved byforeign banks, the advances to MSEs and exportsectors should not be less than 10 per cent and 12per cent of the ANBC or credit equivalent amountof OBE, whichever is higher, respectively.
5.14 The outstanding advances granted by PSBs,private-sector banks, and foreign banks to the prioritysector as on the last reporting Friday of March 2008,2009, and 2010 are furnished in Table 5.4. Therewere shortfalls in the case of a few individual banksin the public and private sectors and foreign banks.
5.15 The outstanding priority-sector advances ofPSBs increased from ` 7,24,150 crore as on thelast reporting Friday of March 2009 to ` 8,64,564crore as on the last reporting Friday of March 2010,showing a growth of 19.39 per cent. Although, PSBsas a group had achieved the overall priority-sectorlending target of 40 per cent of ANBC or creditequivalent amount of OBE, whichever is higher, andformed 41.68 per cent of ANBC as on the lastreporting Friday of March 2010, three banks,namely State Bank of Mysore, Indian OverseasBank, and Industrial Development Bank of India(IDBI) Ltd, out of 27 public sector banks did notindividually achieve the target.
5.16 The outstanding priority-sector advances ofprivate-sector banks increased from ` 1,87,849crore as on the last reporting Friday of March 2009to ` 2,15,552 crore as on the last reporting Fridayof March 2010, showing a growth of 14.74 per cent.Although, private-sector banks as a group hadachieved the overall priority-sector lending targetof 40 per cent of ANBC or credit equivalent amountof OBE, whichever is higher, and formed 45.99 percent of ANBC as on the last reporting Friday of
Table 5.3 : Sectoral deployment of gross bank creditSl . Sector Outstanding as on (` ` ` ` ` crore) % Variation
No. 27 Mar. 20 Nov. 26 Mar. 19 Nov. 26 Mar./ 27 Mar. 19 Nov.2009 2009 2010 2010 2010 2009 2010 /
against Shares, Bonds, etc. 2287 2347 2863 2935 576 25.2 25.1
Source : RBI.
Note : Date the provisional & relate to select scheduled commercial banks (SCBs) which account for 95 per cent oftotal bank credit extended by all SCBs.
104 Economic Survey 2010-11
Website: http://indiabudget.nic.in
March 2010, two banks, namely Bank of RajasthanLtd., and State Bank of India (SBI) Commercial Bank,out of 22 private sector banks did not individuallyachieve the target individually.
5.17 The outstanding priority-sector advances offoreign banks increased from ̀ 55,415 crore as onthe last reporting Friday of March 2009 to ̀ 60,290crore as on the last reporting Friday of March 2010,showing a growth of 8.79 per cent. Foreign banksas a group had also achieved the overall priority-sector lending target of 32 per cent of ANBC orcredit equivalent amount of OBE, whichever ishigher, and formed 35.09 per cent of ANBC as onthe last reporting Friday of March 2010. However,two of the 28 foreign banks, namely Krung ThaiBank and Oman International Bank, did notindividually achieve the target. Table 5.4 gives figuresof priority-sector advances.
5.18 In order to improve and enhance the flowof credit to the priority sector, the following policyinitiatives were taken during 2010-11:
(i) All SCBs were advised to ensure that:
(a) of the total advances to the MSE sector, 40
per cent should go to micro (manufacturing)enterprises having investment in plant andmachinery up to ̀ 5 lakh and micro (service)enterprises with investment in equipment upto ` 2 lakh;
(b) of the total advances to the MSE sector, 20per cent should go to micro (manufacturing)enterprises with investment in plant andmachinery above ` 5 lakh and up to ` 25lakh, and micro (service) enterprises withinvestment in equipment above ̀ 2 lakh andup to ` 10 lakh. (Thus 60 per cent of MSEadvances should go to micro enterprises).
(ii) In terms of the recommendations of the PrimeMinister’s Task Force on Micro, Small andMedium Enterprises (MSMEs) (Chairman: ShriT. K. A. Nair) constituted by the Government ofIndia, banks were advised as follows :
(a) to achieve a 20 per cent year-on-yeargrowth in credit to MSEs to ensureenhanced credit flow;
(b) to achieve the allocation of 60 per cent ofthe MSE advances to micro enterprises in
Table 5.4 : Particulars of Priority-sector Advances
A. PUBLIC SECTOR BANKS (` crore)
As on the last reporting Friday of March 2008 March 2009 March 2010 (provisional)
Total Priority-sector Advances 6,10,450(44.7) 7,24,150(42.8) 8,64,564(41.7)
Total Advances to Agriculture* 2,49,397(18.3) 2,99,415(17.7) 3,70,730(17.3)
Total Advances to MSEs 1,51,137(11.1) 1,91,408(11.3) 2,78,398(13.2)
Advances to Weaker Sections 1,21,740(8.9) 1,65,829(9.8) 2,12,214(10.2)
2. PRIVATE-SECTOR BANKS
As on the Last Reporting Friday of March 2008 March 2009 March 2010(provisional)
Total Priority-sector Advances 1,64,068(47.8) 1,87,849(46.2) 2,15,552(46.0)
Total Advances to Agriculture* 58,567(17.0) 76,103(18.7) 89,769(15.6)
Total Advances to MSEs 46,912(13.7) 46,656(11.5) 64,534(13.7)
Advances to Weaker Sections 7152(2.0) 14,262(3.5) 25,690(5.5)
3. FOREIGN BANKS
As on the Last Reporting Friday of March 2008 March 2009 March 2010(provisional)
Total Priority-sector Advances 50,254(39.5) 55,483(34.3) 60,290(35.0)
Total advances to MSEs 15,489(12.2) 18,138(11.2) 21,080(12.3)
Total Export Credit (includes SSI export) 28,954(22.7) 31,511(19.4) 35,466(20.7)
Source: RBI
Note: 1. *Indirect agriculture is reckoned only up to 4.5 per cent of the ANBC or credit equivalent of OBE, whichever ishigher.
2. The figures in parentheses show percentage of advances to ANBC or credit equivalent amount of OBE, whichever
is higher.
105Financial Intermediation and Markets
Website: http://indiabudget.nic.in
stages, namely 50 per cent in the year 2010-11, 55 per cent in the year 2011-12, and 60per cent in the year 2012-13, and;
(c) to achieve a 10 per cent annual growth innumber of micro-enterprise accounts.
(iii) In terms of recommendations of the WorkingGroup constituted by the RBI to review the CreditGuarantee Scheme of the Credit GuaranteeFund Trust for Micro and Small Enterprises(Chairman: Shri V. K. Sharma, ExecutiveDirector, RBI) banks were advised not to acceptcollateral security in the case of loans up to `10 lakh extended to units in the MSE sector.
(iv) The limit for waiver of margin/ securityrequirements for agricultural loans wasenhanced from ` 50,000 to ` 1 lakh. Thus, atpresent, all agricultural loans up to ` 1 lakh donot require any collateral.
MICRO FINANCE
5.19 RBI guidelines to banks for mainstreamingmicro-credit and enhancing the outreach of micro-credit providers, inter alia, stipulated that micro-credit extended by banks to individual borrowersdirectly or through any intermediary wouldhenceforth be reckoned as part of their priority-sector lending. However, no particular model wasprescribed for micro-finance and banks have beenextended freedom to formulate their own model[s]or choose any conduit/intermediary for extendingmicro-credit.
5.20 Though there are different models forpurveying micro-finance, the self-help group (SHG)-Bank Linkage Programme has emerged as the majormicro-finance programme in the country. It is beingimplemented by commercial banks, regional ruralbanks (RRBs) and cooperative banks.
5.21 Under the SHG-Bank Linkage Programme,as on 31 March 2010, 69.53 lakh SHGs held savingbank accounts with total savings of ̀ 6199 crore asagainst 61.21 lakh SHGs with savings of ` 5546crore as on 31 March 2009. Thus, about 97 millionfamilies were associated with banking agenciesunder the Programme. As on 31 March 2010,commercial banks had the maximum share of SHGsavings with 40,52,915 SHGs (58 per cent) andsavings amount of ` 3674 crore (59 per cent)followed by RRBs with saving bank accounts of
18,20,870 SHGs (26.2 per cent) and savings amountof ̀ 1299 crore (21 per cent) and cooperative bankswith saving bank accounts of 10,79,465 SHGs (15.5per cent) and savings amount of ̀ 1225 crore (19.8per cent). The share under the Swarnajayanti GramSwarozgar Yojana (SGSY) in total savings accountswas 16,93,910 SHGs forming 24.3 per cent of thetotal SHGs having savings accounts in the banks.During the year under review, the average savingsper SHG with all banks marginally decreased from` 9060 as on 31 March 2009 to ` 8915 as on 31March 2010. They ranged from a high of ` 11,352per SHG with cooperative banks to a low of ̀ 7136per SHG with RRBs. As on 31 March 2010, theshare of women SHGs in total SHGs with savingsbank accounts was 53.10 lakh, i.e.76.4 per cent ascompared to last year’s share of 79.5 per cent.
5.22 As on 31 March 2010, 48.51 lakh SHGs hadoutstanding bank loans of ̀ 28,038 crore as against42.24 lakh SHGs with bank loans of ̀ 22,680 croreas on 31 March 2009 registering a growth of 14.8per cent in the number of SHGs and 23.6 per centin bank loans outstanding to SHGs. These figuresincluded 12.45 lakh SHGs (25.7 per cent) withoutstanding bank loans of ` 6251 crore (22.3 percent) under the SGSY as against 9.77 lakh SHGswith outstanding bank loan of ` 5862 crore as on31 March 2009. Commercial banks had themaximum share of outstanding bank loans to SHGswith a share of 66.7 per cent followed by RRBs witha share of 22.8 per cent and cooperative bankswith a share of 10.5 per cent. As on 31 March 2010,average bank loan outstanding per SHG was `57,795 as against ` 53,689 as on 31 March 2009.It varied from a high of ` 62,289 per SHG in thecase of commercial banks to a low of ` 33,894 inthe case of cooperative banks.
5.23 On the basis of the data received from banksby the National Bank for Agriculture and RuralDevelopment (NABARD), the gross non-performingassets (NPAs) in respect of bank loans to SHGswere 2.94 per cent of the bank loans outstanding toSHGs, as on 31March 2010. Table 5.5 providessome figures for the Programme.
5.24 The gathering momentum in the micro-financesector has brought into focus the issue of regulatingthe sector. A draft Micro-Financial Sector(Development and Regulation) Bill 2010 is underconsideration of the Government.
106 Economic Survey 2010-11
Website: http://indiabudget.nic.in
RURAL INFRASTRUCTURE
DEVELOPMENT FUND (RIDF)5.25 The Government of India set up the RIDF in1995 through contribution from commercial banksto the extent of their shortfall in agricultural lending.The Fund has continued, with its corpus beingannounced every year in the Budget. Over theyears, coverage under the RIDF has been mademore broad based in each tranche and, at present,a wide range of 31 activities under various sectorsis being financed. The annual allocation of fundsfor the RIDF announced in the Union Budget hasgradually increased from ` 2000 crore in 1995–96(RIDF I) to ` 16,000 crore in 2010-11 (RIDF XVI).
The aggregate allocations have reached `1,16,000crore. Further, a separate window wasintroduced in 2006-07 for funding the rural roadscomponent of the Bharat Nirman Programme, witha cumulative allocation of ` 18,500 crore till2009-10.
5.26 As against the total allocation of` 1,16,000crore, encompassing RIDF I to XVI,sanctions aggregating ̀ 1,13,437 crore have beenawarded to various State Governments anddisbursements under the Fund amounted to `73,687 crore up to end November 2010. TheNational Rural Roads Development Agency(NRRDA) was sanctioned the entire amount of` 18,500 crore (RIDF XII to RIDF XV) and it hadfully availed of it by March 2010 (Table 5.6).
5.27 During 2010-11, the disbursement to theStates amounted to ̀ 9649 crore till end-November2010 (Table 5.7).
Table 5.5 : Progress of Micro-finance Programme
Year New SHGs Financed by Banks Bank Loan*(` ` ` ` ` crore)
Table 5.6 : Sanctions and Disbursementsunder the RIDF and Bharat Nirman
(As on 30 November 2010) (` ` ` ` ` crore)
Region Sanction Disburse- Disburse-ment ment
as per centof Sanction
South 29,912 20’502 68.54
West 15,567 11,697 75.14
North 32,880 21,502 65.40
Central 9944 6290 63.25
East 19,788 10,767 54.41
NER & Sikkim 5346 2929 54.79
Sub Total 1,13,437 73,687 64.96
BHARAT 18,500 18,500 100.00NIRMAN
Total 1,31,937 92,187 69.87
Source: NABARD.
Table 5.7 : Disbursements during 2010-11
(As on 30 November 2010) (` crore)
Region Disbursement Achievement (%)
Target Achievement
South 3510 1401 39.91
West 1960 573 29.23
North 4550 1478 32.48
Central 1440 360 25.00
East 3250 1257 38.68
NER & Sikkim 790 179 22.66
Total 15,500 5248 33.86
Source : NABARD.
Note: NER—north-east region.
107Financial Intermediation and Markets
Website: http://indiabudget.nic.in
AGRICULTURAL CREDIT
Flow of Agricultural Credit
5.28 As against the target of ` 3,25,000 crore foragricultural credit in 2009-10, the banking systemdisbursed ̀ 3,84,514 crore to the agricultural sector,thereby exceeding the target by around 18 per cent.Commercial banks and RRBs together extendedcredit to 77.49 lakh new farmers during 2009-10and cooperative banks to13.43 lakh, thus taking thetotal number of farmers brought newly under thebanking system to 90.92 lakh. The total number ofagricultural loans financed as of March 2010 was4.82 crore. The total credit flow to agriculture during2010-11 by commercial banks, cooperative banks,and RRBs up to September 2010 was of the orderof ̀ 1,94,392.63 crore, amounting to 52 per cent ofthe annual target of ` 3,75,000 crore (Table 5.8).
Kisan Credit Card (KCC) Scheme
5.29 The KCC Scheme has become a widelyaccepted mechanism for delivery of credit tofarmers. The scheme now also covers borrowersof the long-term cooperative credit structure. In orderto safeguard the interests of KCC holders, NABARDhas allowed banks the discretion to opt for ‘anyinsurance company of their choice’. The banks haveto keep in mind the guiding principles of the PersonalAccident Insurance Scheme (PAIS), especially thepremium-sharing formula and coverage, whilenegotiating with insurance companies.
5.30 With a view to making the KCC more user-friendly, NABARD has enlarged its scope to coverterm loans for agriculture and allied activities,including a reasonable component for consumptionneeds, besides the existing facility of providing crop
Table 5.8 : Flow of Institutional Credit to Agriculture and Allied Activities
(` crore)
Sl. No. Agency 2005-06 2006-07 2007-08 2008-09 2009-10 2010-11*
Total 1,80,486 2,29,401 2,54,658 2,92,437 3,84,514 1,94,392
Source: NABARD.
Notes* Up to 30 September 2010. **Including Others.
Box 5.1 : Recommendations of Task Force ‘tolook into the issue of a large number of farmers,who had taken loans from privatemoneylenders, not being covered under theloan waiver scheme’
i. Financial literacy and counselling campaigns beundertaken to increase awareness among farmerson the KCC.
ii. Banks be encouraged to educate their rural branchstaff about the KCC.
iii. Banks use farmers’ cooperatives and SHGfederations as banking correspondents to increaseoutreach.
iv. The coverage of new farmers in the command areasof bank branches and new areas be ensured throughmeaningful and purposeful conduct of gram sabhasand kisan credit camps at regular intervals.
v. Bankers who have already been advised by the RBIto lend without any collateral, up to Rs1 lakh perfarmer, put such advice into more widespreadpractice through joint liability groups (JLGs) of tenantfarmers, sharecroppers, and oral lessees.
vi. State governments exempt agricultural loanagreements from stamp duty.
vii. The KCC be technology enabled, including theconversion to a smart card with withdrawals andremittances enabled at automated teller machines(ATMs), points of sale(PoS), and through hand-heldmachines; banks need to have core banking solutions(CBS) in place at the earliest, to enable technologyto benefit the farmer.
viii. The KCC limit be fixed for five years, based on thebanker’s assessment of total credit needs of thefarmer for a full year, and that the limit be operatedby the borrower as and when needed, with no sub-limits for kharif and rabi, or for stages of cultivation.
ix. Each withdrawal under the KCC be allowed to beliquidated in twelve months without the need tobring the debit balances in the account to zero atany point of time.
x. There be automatic renewal and annual increase oncredit limit linked to inflation rate.
108 Economic Survey 2010-11
Website: http://indiabudget.nic.in
A
Source: RBI
FINANCIAL PERFORMANCE OF BANKS
5.33 The consolidated balance sheet of the SCBsin India during 2009-10 showed relatively sluggishgrowth performance, marked mainly by slow depositgrowth. The growth in profits of SCBs too was lowerin 2009-10 than in the previous year. Further, therewas a rise in the NPA ratio of SCBs in 2009-10.Though asset quality emerged as a concern for thebanking sector, its capital adequacy remained fairlyrobust during the year, providing cushion for any futurelosses.
5.34 The overall growth in the consolidated balancesheet of SCBs in 2009-10 was 15.0 per cent, whichwas lower than the 21.1 per cent during the previousyear. Moreover, the decline in growth could be seenacross all bank groups with the notable exceptionof new private-sector banks. The working results ofSCBs under different bank groups are given in Table5.11.
5.35 The major factor contributing to the slowdownin growth of banks’ balance sheets was deposits.The growth in deposits of SCBs decelerated to
Table 5.9 : Agency-wise KCCs Issued and Amount Sanctioned
Note:*Since inception of the scheme (1998). —: Not available.
loan limit. Crop loans disbursed under the KCCScheme for notified crops are covered underRashtriya Krishi BimaYojana (National CropInsurance Scheme), a crop insurance schemeintroduced to protect the interests of the farmeragainst loss of crop yield caused by naturalcalamities, pest attacks, etc. The KCC has thusbecome a single window for a comprehensive creditproduct. The major policy recommendations of theTask Force ‘to look into the issue of a large numberof farmers, who had taken loans from privatemoneylenders, not being covered under the loanwaiver scheme’ under the chairmanship of ShriUmesh Chandra Sarangi, constituted by the Ministryof Agriculture, Government of India, are given inBox 1.1.
5.31 The banking system has issued 955.77 lakhKCCs involving a total sanctioned credit limit of` 4,37,241 crore as on 31 August 2010. The shareof commercial banks stood at 44.4 per cent of thetotal number of cards issued by the banking sectorfollowed by cooperative banks (40.9 per cent) andRRBs (14.7 per cent). The year-wise and agency-wise break-up of the KCCs issued is given inTable 5.9.
Agriculture Debt Waiver and Debt Relief(ADWDR) Scheme 2008
5.32 NABARD is the nodal agency forimplementing the Scheme in respect of cooperativecredit institutions and RRBs. The Bank has releasedof ` 24,994.89 crore towards debt waiver and` 3005.11 crore towards debt relief claims. Theagency-wise break-up of the releases under theADWDR is given in Table 5.10.
Table 5.10 : Release under ADWDR
(`̀̀̀̀ crore)
Agency Debt Debt TotalWaiver Relief
State Cooperative 15,540.63 2062.02 17,602.65Banks
SCARDB 3409.06 248.41 3657.47
RRBs 6045.19 694.68 6739.87
Total 24,994.89 3005.11 28,000.00
Note: SCARDB—State Cooperative Agriculture and RuralDevelopment Bank.
109Financial Intermediation and Markets
Website: http://indiabudget.nic.in
17.0 per cent in 2009-10 from 22.4 per cent in 2008-09. Further, credit growth constrained by a slowdownin deposits growth was placed at 16.6 per cent in2009-10 as compared to 21.1 per cent in 2008-09.The deceleration in credit growth was accentuatedon account of an overall slowdown of the economyin the aftermath of the global financial turmoil.However, while bank credit growth witnessed aslowdown on a year-on-year basis, bank credit ingeneral and credit to industry in particular, showeddistinct signs of recovery from October 2009onwards as economic recovery became morebroad-based. The credit-deposit ratio at the end ofMarch 2010 was 73.6 per cent, marginally lower
than that at the end of March 2009. There was anincrease in the proportion of current and savingsaccounts (CASA) in 2009-10 in contrast to adeclining trend noted in the recent past.
5.36 On a year-on-year basis, the major driversof non-food bank credit in 2009-10 were industryand agriculture. There was considerable slowdownin the growth in personal loans and also credit tothe services sector during the year.
5.37 The growth in investments of banksdecelerated to 18.6 per cent in 2009-10 from 23.1per cent in 2008-09. Also, there were notablechanges in the investment portfolio of banks. The
Table 5.11 : Working Results of SCBs
Items Foreign Old pvt. sector New pvt. All SCBPSBs banks banks sector banks
percentage contribution of investments in approvedsecurities declined in 2009-10 in contrast to anincrease in 2008-09, which was mainly due to banks’preference to park their funds in low-risk instrumentsagainst the backdrop of prevailing globaluncertainties. Consequently, the percentagecontribution of investments in non-SLR(statutoryliquidity ratio) securities by banks showed anincrease in 2009-10 driven mainly by an increasein investments in mutual funds.
5.38 Similar to the slowdown in growth in balancesheets, there was a moderation in the financialperformance of SCBs in 2009-10. The growth inboth income and expenditure of the SCBs sloweddown leading to a deceleration in the growth ofoperating and net profits of SCBs. Every indicatorof profitability also showed a decline in 2009-10.The most salient indicator of profitability, return onassets (RoA), declined to 1.05 per cent in 2009-10from 1.13 per cent in 2008-09. Further, return onequity (RoE) too declined to 14.3 per cent in 2009-10 from 15.4 per cent in 2008-09.
5.39 After abstaining during 2008-09, banksstarted resorting to the capital market for raisingresources in 2009-10. The resources raised fromthe capital market by banks were in the form of bothpublic issues and private placement in 2009-10.
Capital Adequacy Ratio
5.40 One of the major indicators of growing financialsoundness of the Indian banking system was theimprovement in the capital to risk-weighted assetsratio (CRAR). The CRAR of all SCBs under Basel Iframework improved to 13.6 per cent by end-March2010 from 13.2 per cent a year earlier, thus remainingsignificantly above the stipulated minimum of 9.0per cent. As all commercial banks in India excludingRRBs and local area banks became Basel IIcompliant as on 31 March 2009, it is essential toalso look at the capital adequacy position under thisframework. Under the Basel II framework too, theCRAR of SCBs showed an increase in 2009-10; theCRAR improved to 14.5 per cent at the end of March2010 from 14.0 per cent at the end of March 2009.At the bank group level, every bank group reportedCRAR, on an average, of over 13 per cent under theBasel II framework.
NPAs of the Banking Sector
5.41 The NPAs of SCBs emerged as a major areaof concern in 2009-10. Gross NPAs as percentageof gross advances of SCBs had remained unchanged
during 2008-09, when the global financial crisisintensified. However, in 2009-10, the gross NPA ratioincreased to 2.39 per cent from 2.25 per cent in2008-09. The total amount recovered and written offin 2009-10 was ̀ 49,210 crore. This was lower thanthe fresh NPAs added during 2009-10, which wereto the tune of ̀ 65,674 crore. The sectoral distributionshowed a growing proportion of priority-sector NPAsin 2009-10. Among the various channels of recoveryavailable to banks for dealing with non-performingloans, the Securitization and Reconstruction ofFinancial Assets and Enforcement of SecurityInterest (SARFAESI) Act has been by far the mostimportant channel. However, in 2009-10, there wasa decline in the amount of NPAs recovered underthe SARFAESI Act as a per cent of total amount ofNPAs involved under this channel.
5.42 Among bank groups, the gross NPA ratio ofPSBs increased to 2.19 per cent in 2009-10 from1.97 per cent in the previous year. The most notableincrease in NPA ratio in 2009-10 could be seen inthe case of foreign banks. The NPA ratio of foreignbanks increased to 4.29 per cent in 2009-10 from3.80 per cent in 2008-09.
Technological Developments in Banks
5.43 Banks in India are using informationtechnology (IT) not only to improve their own internalprocesses but also to increase facilities and servicesto their customers. Efficient use of technology hasfacilitated accurate and timely management of theincreased volumes of transactions of banks,consistent with a larger customer base. Of the totalnumber of PSB branches, 97.8 per cent were fullycomputerized at the end of March 2010.
5.44 ATMs, particularly off-site ATMs, act assubstitutes for bank branches in offering a means ofanytime cash withdrawal to customers. Growth ofATMs, which had generally been steadily rising inrecent years, was observed to be 37.8 per cent in2009-10. More importantly, the growth in off-site ATMstoo was comparably high at 44.6 per cent during theyear. At the end of March 2010, the percentage ofoff-site ATMs to total ATMs stood at 45.7 per centfor all SCBs.
5.45 Another important technological developmentin 2009-10 was a significant increase in thepercentage of PSB branches implementing CBS from79.4 per cent at the end of March 2009 to 90 percent at the end of March 2010. The percentage ofbranches under CBS was much larger for the SBIgroup as compared to nationalized banks.
111Financial Intermediation and Markets
Website: http://indiabudget.nic.in
5.46 With computerization in general, and CBS inparticular, having reached near completion, it isimportant to leverage this technological advancementto look at areas beyond CBS that can help in notjust delivering quality and efficient services tocustomers but also generating and managinginformation effectively. With regard to the secondaspect of information management, a system ofreceiving data from banks by the RBI in an automatedmanner without any manual intervention is underexamination.
5.47 Going forward, there are a number of issueswith regard to development of banking technologythat need to be addressed. These relate to furtherimprovement in back office management in the formof streamlining the management information system(MIS), strengthening centralized processing,customer relationship management (CRM), and ITGovernance. Back office technological advancementwould help divert banks’ resources more towardsfront office management, thereby increasing thecustomer focus of their services and supportinggreater financial penetration and inclusion.
NON-BANKING FINANCIAL
INSTITUTIONS (NBFIS)
Financial Institutions (FIs)
5.48 As at the end of March 2010, four institutions,namely Export Import Bank of India (Exim Bank),NABARD, the National Housing Bank (NHB), andthe Small Industries Development Bank of India(SIDBI) were regulated by the RBI as all-India FIs.In the wake of recovery in the global as well asIndian economy during 2009-10, the RBI issuedthe following instructions to roll back the liquiditysupport measures initiated for FIs during 2008-09for on-lending to housing finance companies(HFCs)/NBFCs/micro-finance institutions (MFIs) andexporters:
(i) The refinance facility of ` 7,000 crore, `5,000 and ` 4,000 crore for SIDBI, EximBank and NHB, respectively, under therelevant provisions of the Reserve Bank ofIndia Act, 1934 sanctioned in December2008 have been withdrawn with effect fromthe close of business on 31st March, 2010.
(ii) The ceiling on aggregate resources raisedincluding the funds mobilised under‘umbrella limit’ by SIDBI, NHB and EXIM
Bank was raised subject to conditions, witheffect from December 8, 2008, for a periodof one year. On a review, the relaxationallowed in December 2008 to select FIs(SIDBI, NHB and EXIM Bank) in resourceraising norms for FIs has been co-terminatedwith refinance facility. Accordingly,outstanding borrowings of FIs should bewithin the normal prudential limit i.e. ceilingon aggregate resources at 10 times of netowned fund (NOF) and umbrella limit at onetime of NOF with effect from 31st March,2010.
5.49 The guidelines regarding lending underconsortium arrangements/ multiple bankingarrangements, provisioning coverage for advances,prudential norms on creation and utilization of floatingprovisions, additional disclosures in notes toaccounts, and prudential norms on incomerecognition, asset classification and provisioningpertaining to advances—computation of NPA levelsand projects under implementation—issued to bankshave been mutatis mutandis applied to select FIs.Further, the guidelines regarding know your customer(KYC) norms/ anti-money laundering (ALM)standards/ combating of financing of terrorism (CFT)and sale of investments held under Held to Maturitycategory issued to banks are also applicable to selectFIs.
5.50 Resources raised by FIs during 2009-10 wereconsiderably higher than those during the previousyear. While the long-term resources raised witnesseda sharp climb during 2009-10 as compared to theprevious year, the short-term and foreign currencyresources raised increased marginally. SIDBImobilized the largest amount of resources, followedby Exim Bank and NHB (Table 5.12).
5.51 Total sources/deployment of funds of FIsincreased modestly by 1.8 per cent to ` 3,02,610crore during 2009-10. A major part of the funds of FIswas raised internally (51.8 per cent), followed byexternal sources (41.9 per cent); ‘other sources’formed only a small part. The funds raised frominternal sources declined by 18.9 per cent, whilethose from external sources rose by 38.8 per centover the year 2009-10 mainly due to recovery in theglobal financial markets during 2009-10. A large partof the funds raised was used for fresh deployments(56.8 per cent), followed by repayment of pastborrowings (38.0 per cent). Other deployments
112 Economic Survey 2010-11
Website: http://indiabudget.nic.in
including interest payments formed only a small partof the funds of FIs. The repayment of pastborrowings recorded a sharp increase of 103.2 percent, while fresh deployment registered a decline of11.7 per cent over the year (Table 5.13).
Non-Bank Finance Companies (NBFCs)
5.52 NBFCs as a whole account for 11.2 per centof assets of the total financial system. With thegrowing importance assigned to financial inclusion,NBFCs have come to be regarded as importantfinancial intermediaries particularly for the small-scale and retail sectors. There are two broadcategories of NBFCs based on whether they acceptpublic deposits, namely deposit-taking NBFCs(NBFCs-D) and non-deposit-taking NBFCs (NBFCs-ND).
5.53 The total number of NBFCs registered withthe RBI, consisting of NBFCs-D and NBFCs-ND,declined from 12,740 in end-June 2009 to 12,630 inend-June 2010. The number of NBFCs-D declinedfrom 336 to 308 during the same period, mainly dueto the exit of many NBFCs-D from deposit- takingactivity, while non-deposit-taking systemicallyimportant NBFCs (NBFCs-ND-SI with asset size` 100 crore and above) increased from 234 to 260during the same period. Under the NBFCs-D categorythere are two residuary non-banking companies(RNBCs) (Table 5.14)
Table 5.12 : Resources Mobilized by FIs
(`̀̀̀̀ Crore)
Financial Total Resources RaisedInstitutions
Long-term Short-term Foreign Currency Total Total Outstanding(as at the
Total 16,198 28,937 38,091 39,188 5161 6,180 59,450 74,3051,05,059 1,06,215
Source: Respective FIs.
Notes:-: (i) Nil/Negligible. (ii) Long-term rupee resources comprise borrowings by way of bonds/ debentures;and short-term resources comprise commercial papers (CPs), term deposits, certificate of deposits (CDs),
Table 5.13 : Pattern of Sources andDeployment of Funds of FIs*
(Amount in `̀̀̀̀ crore)
Item 2008-09 2009-10 PercentageVariation
in 2009-10
Sources of Funds (i+ii+iii) 2,97,296 3,02,610 1.8 (100.0) (100.0)
(iii) Other Deployment 45,993 15,673 -65.9 (15.5) (5.2) of which: Interest Payments 8809 16,561 88.0 (3.0) (5.5)
Source: Respective FIsNotes:* Exim Bank, NABARD, NHB, and SIDBI.**Includes cash and balances with banks and balanceswith the RBI and other banks. Figures in parentheses arepercentages to the totals.
113Financial Intermediation and Markets
Website: http://indiabudget.nic.in
5.54 The ratio of deposits of reporting NBFCs toaggregate deposits of SCBs dropped to 0.36 percent in end-March 2010 from 0.53 per cent in end-March 2009, mainly due to the decline in depositsof reporting NBFCs.
5.55 Total assets of NBFCs-D (including RNBCs)increased to ̀ 1,09,324 crore during 2009-10 from` 97,408 crore in the preceding year. Publicdeposits held by NBFCs-D and RNBCs togetherrecorded a decline to ` 17,247 crore in end-March2010 from ̀ 21,566 crore in end-March 2009. Net-owned funds (NOFs) witnessed a growth of 18.8 percent during 2009-10 and stood at ` 16,178 crore.
5.56 Total assets/liabilities of NBFCs-D (excludingRNBCs) expanded at the rate of 21.5 per cent during2009-10 as compared to 3.4 per cent during 2008-09. Borrowings, which are the major source of fundsfor NBFCs-D, increased by 23.6 per cent during theyear, while public deposits increased by 38.4 percent largely due to the increase in public deposits ofthree NBFCs-D. On the assets side, the majorcomponents—hire purchase assets and loans andadvances—witnessed growth of 7.6 per cent and 42.7per cent respectively during 2009-10 as comparedto 6.8 per cent and 14.7 per cent during the previousyear. Total investments of NBFCs-D increased by23.3 per cent during 2009-10 primarily on accountof rise in non-SLR investments.
5.57 Among NBFCs-D, asset finance companies(AFCs) held the largest share in total assets/liabilities(74.5 per cent) while loan companies accounted for25.5 per cent in end-March 2010. The increase inassets/liabilities of AFCs was mainly on account ofreclassification of NBFCs, which was initiated inDecember 2006. Of the total deposits held by allNBFCs-D, asset finance companies held the largest
share of 83.2 per cent, followed distantly by loancompanies with a 16.8 per cent share.
5.58 The asset size of NBFCs-D varies significantlybetween less than ` 25 lakh to above ` 500 crore.The asset-holding pattern remained skewed, with15 NBFCs-D with asset size of ‘above ̀ 500 crore’holding 97.5 per cent of total assets of all NBFCs-D, while the remaining 213 held about 2.5 per centin end-March 2010.
5.59 The financial performance of NBFCs-Dwitnessed moderate deterioration as reflected in thedecline in their operating profits during 2009-10. Thisdecline was mainly on account of higher growth inexpenditure than income of these institutions. Thedecline in operating profits along with marginalincrease in tax provision resulted in a decline in netprofits in 2009-10. The cost to income ratiodeteriorated from 74 per cent in 2008-09 to 81.8 percent in 2009-10. Non-interest cost at 97.4 per centcontinued to constitute the dominant share in totalcost of the NBFCs-D during 2009-10 while interestcost accounted for a smaller share.
5.60 There was a decline in the gross NPAs togross advances ratio of NBFCs-D in 2009-10 incontinuation of the trend observed in the recent past.Classification-wise, Gross NPA and net NPA ratiosof AFCs and loan companies declined during 2009-10 as compared to the previous year. Asset qualityof AFCs as reflected in various categories of NPAs(substandard, doubtful, and loss) shows sharpimprovement.
5.61 Capital to risk-weighted assets ratio (CRAR)norms were made applicable to NBFCs-D in 1998,whereby every NBFC-D is required to maintain aminimum capital, consisting of Tier I and Tier IIcapital, not less than 12 per cent (15 per cent in thecase of unrated deposit-taking NBFCs) of itsaggregate risk-weighted assets. As at the end ofMarch 2010, 212 out of 216 reporting NBFCs-D hadCRAR of more than 12 per cent as against 221 outof 225 in end-March 2009. It may be pointed outthat the NBFC sector has been witnessing aconsolidation process in the last few years, whereinthe weaker NBFCs are gradually exiting, paving theway for a stronger sector.
Profile of NBFCs-ND-SI
5.62 The balance sheet of NBFCs-ND-SI stood at` 5,63,476 crore in end-March 2010 as comparedto ` 4,82,907 crore in end-March 2009 therebyregistering a growth of 16.7 per cent during 2009-
Table 5.14 : Number of NBFCs Registeredwith the RBI
End June Number of Number of NumberRegistered NBFCs-D of
NBFCs NBFCs-ND-SI
2005 13,261 507 -
2006 13,014 428 149
2007 12,968 401 173
2008 12,809 364 189
2009 12,740 336 234
2010 12,630 308 260
Source: RBI.
114 Economic Survey 2010-11
Website: http://indiabudget.nic.in
10. This significant increase in balance sheet sizeof NBFCs-ND-SI is mainly attributed to sharpincrease in owned funds, debentures, bankborrowings, commercial paper, and other liabilities.Owned funds (which accounted for 25.8 per centof total liabilities) increased by 11.3 per cent during2009-10. Total borrowings (secured and unsecured)by NBFCs-ND-SI increased by 19.6 per cent to `3,81,850 crore and formed 67.7 per cent of totalliabilities. During the period ended June 2010, totalborrowings further increased by 8.3 per cent to `4,13,476 crore.
5.63 The pattern of deployment of funds by NBFCs-ND-SI in the year ended March 2010 remainedbroadly in line with that witnessed during the previousyear. Secured loans continued to constitute thelargest share (44.3 per cent of total assets), followedby unsecured loans (17.8 per cent), hire purchaseassets (7.4 per cent), investments (17.4 per cent),cash and bank balances (4.5 per cent),and otherassets (8.4 per cent) during the year ended March2010.
5.64 The financial performance of the NBFCs-ND-SI sector improved marginally as reflected in theincrease in net profit of ̀ 10,897 crore during 2009-10 over the previous year. However, their net profitto total assets declined during the same period.
5.65 Gross and net NPAs ratios of the NBFCs-ND-SI sector deteriorated marginally during the yearended March 2010. However, these ratios showedsome improvement in the quarter ended June 2010.Similarly, there was further diminution in value ofinvestments between March 2009 and March 2010.
Policy Initiatives
5.66 The regulatory and supervisory framework ofNBFCs continued to focus on prudential regulationswith specific attention to the systemically importantnon-deposit-taking companies (NBFC-ND-SI). Someof the important developments in chronological orderare as follows:
(i) Instances of NBFCs having made overseasinvestments without regulatory clearance ofthe Department of Non-Banking Supervision,RBI,which is a violation of Foreign ExchangeManagement (Transfer or Issue of Securityby a Person Resident outside India)Regulations 2004 and attracts penalty, wereobserved. Accordingly, it was reiterated thatall NBFCs desirous of making any overseasinvestment must obtain ‘No Objection’
certificates (NoCs) from the Department ofNon-Banking Supervision of RBI beforemaking such investment.
(ii) NBFCs-ND-SI engaged predominantly ininfrastructure financing had represented tothe RBI that there should be a separatecategory of infrastructure financing NBFCsin view of the critical role played by them inproviding credit to the infrastructure sector.As advised in the Second Quarter Reviewof Monetary Policy 2009-10, it was decidedto introduce a fourth category of NBFCs asinfrastructure finance companies(IFCs)satisfying certain criteria like a minimum of75 per cent of their total assets ininfrastructure loans, net owned funds of `300 crore or above, minimum credit rating ‘A’ or equivalent of CRISIL, FITCH, CARE,ICRA or equivalent rating by any otheraccrediting rating agency, and CRAR of 15per cent (with a minimum Tier I capital of 10per cent). Such NBFCs would be allowedto exceed credit concentration norms oflending to single/group borrowers by 5 percent above that of other infrastructure loans.
(iii) NBFCs-ND-SI were advised to submitStatement of Interest Rate Sensitivity [NBS-ALM3] within 20 days of the close of thehalf year to which it related. They were alsoadvised that eligible companies could filethe ALM returns on-line.
(iv) While granting finance to housing/development projects, NBFCs were advisedto stipulate as a part of the terms andconditions that:
(a) the builder / developer / owner / companydisclose in the pamphlets / brochures /advertisements the name(s) of the entityto which the property is mortgaged.
(b) the builder / developer / owner / companyindicate in the pamphlets / brochures,that they would provide NOC /permission of the mortgagee entity forsale of flats / property, if required. Fundswere would not be released unless theabove requirements were fulfilled.
(v) NBFCs having foreign direct investment(FDI) are required to submit certificates fromtheir statutory auditors on half-yearly basiscertifying compliance with existing terms
115Financial Intermediation and Markets
Website: http://indiabudget.nic.in
and conditions of FDI. NBFCs were advisedthat such certificates may be submitted notlater than one month from the close of thehalf year to which the certificate pertained.
(vi) In terms of the third proviso of para 18 of theNon-Banking Financial (Non- DepositAccepting or Holding) CompaniesPrudential Norms (Reserve Bank)Directions 2007, NBFCs were advised thatany NBFC-ND-SI not accessing publicfunds, either directly or indirectly, maymake an application to the Bank formodifications in the prescribed ceilings withregard to concentration of credit /investment norms. NBFCs-ND-SI may alsobe issuing guarantees and devolvement ofthese guarantees might require access topublic funds. Accordingly it was advisedthat any NBFC-ND-SI not accessing publicfunds either directly or indirectly or notissuing guarantees may approach theRegional Office of the Department of Non-Banking Supervision, RBI in whosejurisdiction the registered office of thecompany is located, for appropriatedispensation.
(vii) NBFCs were advised that there should beno discrimination in extending products andfacilities including loan facilities tophysically/ visually challenged applicants ongrounds of disability.
(viii) All NBFCs excluding RNBCs mayparticipate in the designated currency futuresand options exchanges recognized by theSecurities and Exchange Board of India(SEBI) as clients, subject to RBI (ForeignExchange Department) guidelines in thematter, only for the purpose of hedging theirunderlying forex exposures. Withappropriate disclosures in their balancesheets.
(ix) According to the Repo in Corporate DebtSecurities (Reserve Bank) Directions 2010,dated 8 January 2010 issued by the RBI,NBFCs registered with the RBI (other thanGovernment companies as defined inSection 617 of the Companies Act 1956)are eligible for participation in repotransactions in corporate debt securities.NBFCs participating in such repotransactions were advised to comply with
the Directions and accounting guidelinesissued by RBI.
(x) As announced in the Annual Policy 2010-2011, draft guidelines on core investmentcompanies (CIC) were placed on the RBIwebsite on 21 April 2010. Based on feedbackreceived from the market participants, theregulatory framework for CICs wasannounced. In order to bring more clarity inthe interest of the system it was decidedthat investing in shares of other companies,even for the purpose of holding stake shouldalso be regarded as carrying on the businessof acquisition of shares in terms of Section45I(c) (ii) of the RBI Act. CICs with an assetsize of ` 100 crore or more would beconsidered systemically important coreinvestment companies (CICs-ND-SI) andwould be required to obtain Certificate ofRegistration (CORs) from the RBI underSection 45-IA of the RBI Act even if theyhad in the past been advised that registrationwas not required. Capital requirements,leverage ratio to be maintained, etc. havebeen prescribed for CICs-ND-SI. Certainexemptions from maintenance of statutoryminimum NOF, prudential norms includingrequirements of capital adequacy, andexposure norms have been prescribed forthose CICs-ND-SI. CICs-ND-SI were advisedto submit annual certificates from theirstatutory auditors regarding compliance withthese guidelines within one month from thedate of finalization of their balance sheet.
(xi) In view of sub section (2) of Section 17 ofthe Credit Information Companies(Regulation) Act 2005, and Regulation 10(a) (ii) of the Credit Information CompaniesRegulations 2006, NBFCs were advised thatthose NBFCs which had become member/members of any new credit informationcompany / companies may provide themthe current data in the existing format. SuchNBFCs may also provide historical data inorder to enable the new credit informationcompanies to validate their software anddevelop a robust database. However, careshould be taken to ensure that no wrongdata / history regarding borrowers is givento credit information companies.
116 Economic Survey 2010-11
Website: http://indiabudget.nic.in
BOX 5.2 : CORPORATE BOND MARKETS
Economic vibrancy coupled with sophisticated state-of the- art financial infrastructure has contributed to rapid growthin the equity markets in India. In terms of market features and depth the Indian equity market ranks among the best inthe world. In parallel, the Government securities market has also evolved over the years and expanded given theincreasing borrowing requirements of the Government. In contrast, the corporate bond market has languished both interms of market participation and structure. Non-bank finance companies are the main issuers and very small amountsof finance are raised by companies directly. There are several reasons for this:
(i) Pre dominance of banks loans;
(ii) FII’s participation is limited;
(iii) Pensions and insurance companies and household are limited participants because of lack of investor confidence;and
(iv) Crowding out by Government bonds.
The corporate bond market as a result is only about 14 per cent of the total band market; and market liquidity andinfrastructure remain constrained. With the intervention of the Patil Committee recommendations, the corporate bondmarket is slowly evolving.
With bank finance drying up for long- term infrastructure projects in view of asset liability problems faced by bankingsystem, the need for further development of a deep and vibrant corporate bond market can hardly be overemphasised.The following table shows the status of corporate bond market in India:
Private placement of corporate bonds listed on NSE and BSE
Year No. of Issues Amount (` ` ` ` ` Crore)
2007-08 744 118,485
2008-09 1041 173,281
2009-10 1278 212,635
2010-11(till Nov-10) 929 147,400
Source: SEBI ( includes NBFCs)
The following table gives details of bond issuance in some of the emerging markets including India:
(in US$ billion)Region/Countries 2007 2008 2009
Latin America Argentina 3.4 0.1 0.5Brazil 9.9 6.7 10.1Chile 0.3 0.1 3.0Mexico 6.3 4.5 15.5
Asia China 2.1 2.1 3.3India 7.5 1.4 2.2Indonesia 1.8 4.2 5.5Malaysia 0.9 0.4 0.1Philippines 1.0 0.4 5.4.Thailand 0.8 0.5 -
Source: IMF, GFSR, April 2010
Earlier initiatives taken for development of corporate bond market in India
Regulatory jurisdiction over corporate bond market has been clearly defined and placed under SEBI. SEBI (Issueand Listing of Debt Securities) Regulations, 2008 simplified disclosures and listing requirements. A minimum marketlot criterion has been reduced from ` 10 lakhs to ` 1 lakh to encourage retail investors.
The limit of FIIs investment in corporate bonds has been increased to USD 20 billion from the existing limit of USD15 billion and the incremental limit of USD 5 billion has to be invested in corporate bonds with residual maturity ofover five years.
BSE, NSE and FIMMDA have set up reporting platforms. Aggregate data reported on these platforms is disseminatedto the public. Summary data is available on SEBI website. Repos in corporate bonds have been permitted, followingRBI guidelines, since March 2010. Exchange traded interest rates futures were introduced in August 2009.
117Financial Intermediation and Markets
Website: http://indiabudget.nic.in
Draft Credit Default Swap, (CDS) guidelines have been released by RBI in July, 2010.
The Finance Act, 2008 (with effect from 01/06/2008) mandated that no TDS (tax deduction at source) would bededucted from any interest payable on any security issued by a company, where such security is issued indematerialised form and is listed on a recognised stock exchange in India. The stamp duty on items in central list(debentures and bonds in the nature of promissory note) have been brought down and made uniform.
Clearing and settlement through clearing corporations have been mandated for trades between specified entitiesnamely mutual funds, foresight institutional investors, venture capital funds etc. Clearing and settlement is on DvPI basis.
Suggested initiatives to be taken for further development of corporate bond market1
Clearing and settlement on DvP (Delivery versus Payment) III basis. Market making with primary dealers. EnablingCredit Default Swap. Allowing banks to do credit enhancement -Guaranteeing of corporate bonds by banks. Relaxingnorms on short selling of Government bonds .(RBI).
Relaxing norms for use of shelf prospectus -requires amendment to Section 60 of Companies Act (MCA).
Empowering bond holder under SARFAESI (Department of Financial Services, RBI).
Creating of a comprehensive bond data base (RBI, SEBI, FIMMDA).
Amendment to Section 9 of the Stamp Act to lower stamp duties across states and make them uniform (Departmentof Revenue).
Major Policy Changes—SecuritizationCompanies/ Reconstruction Companies(SCs/RCs)
5.67 On 21 April 2010, the RBI modified theguidelines issued to SCs/RCs on various aspectsto bring in more transparency and market discipline.
CAPITAL MARKETS
Primary Market
5.68 The year 2010-11 has seen the Indian capitalmarket put the worst behind and move towards stronggrowth. The cumulative amount mobilized as on 30November 2010-11 through initial public offers(IPOs), follow on public offers (FPOs) and rights
issues stood at ` 46,701 crore as compared to `46,737 crore in 2009-10. During 2010-11, so far,40 new companies (IPOs) were listed both at theNSE and BSE amounting to ` 33,068 crore asagainst 39 companies amounting to ̀ 24,696 crorein 2009. The mean IPO size for the current financialyear is ` 827 crore as compared to ` 633 crore inthe previous financial year, showing an increase of30.6 per cent. Further, ̀ 2197 crore was mobilizedthrough debt issue as compared to ̀ 2500 crore in2009-10. The amount of capital mobilized throughprivate placement in 2010-11 (as on 30 November2010) is ` 1,47,400 crore as compared to `2,12,635 crore in 2009-10. Table 5.15 sums up thesefigures.
Table 5.15 : Resource Mobilization through the Primary Market
Total (1+2+3+4) 2,16,176 1,79,066 2,87,240 2,30,233
Source: SEBI and RBI (for Euro Issues).
Notes: NA indicates Not Available. * As on 30 November 2010
1 Agency responsible is indicated in bracket
118 Economic Survey 2010-11
Website: http://indiabudget.nic.in
Resource Mobilization by Mutual Funds
5.69 During 2010-11 (as in November 2010), mutualfunds mobilized ̀ 12,185 crore from the market ascompared to ̀ 83,080 crore in 2009-10. The marketvalue of assets under management stood at` 6,65,282 crore as on 30 November 2010 comparedto ` 6,13,979 crore as on 31March 2010, showingan increase of 8.4 per cent. Table 5.16 puts givesdetails in this regard:
Secondary Market
5.70 As on 31 December 2010, Indian benchmarkindices, the BSE Sensex and Nifty, increased by17.0 per cent and 17.9 per cent respectively overthe closing value of 2009-10. Nifty Junior and BSE500 also increased by 17.8 per cent and 15.1 percent respectively over their values in the previousfinancial year. (Figure 5.3)
5.71 The free float market capitalization of Nifty,the Sensex, Nifty Junior, and BSE 500 stood at
Table 5.16 : Trends in Resource Mobilization (net) by Mutual Funds
(` crore)
Sector 2006-07 2007-08 2008-09 2009-10 2010-11*
1. UTI 7326 10,677 -3659 15,653 -5237
2. Public 7621 9820 9380 12,499 -2956
3. Private 79,038 1,33,304 -34,018 54,928 20,378
Total (1+2+3) 93,985 1,53,802 -28,296 83,080 12,185
Source: SEBI.
Note: *As on 30 November, 2010
Table 5.17 : Index Returns, Volatility, Market Capitalization, and P/E ratio
` 18,27,097 crore, ` 16,32,236 crore, ` 3,37,573crore, and ̀ 29,52,135 crore respectively, showingan increase of 19.8 per cent, 22.8 per cent, 15.5per cent and 20.8 per cent respectively over theirvalues in financial year 2009-10.
5.72 The price to earnings (P/E) ratios of Nifty, theSensex, Nifty Junior, and BSE 500 as on 31December 2010 were 24.5, 23.6, 17.6 and 21.4respectively, indicating an increase of 10.1 per cent,10.5 per cent, 11.6 per cent and 4.5 per centrespectively over their 2009-10 values.
5.73 The details in respect of index return, volatilityMarket Capitalisation and P/E ratio are given intable 5.17.
5.74 In the capital market segment, the totalturnover of the BSE stood at ` 8,93,839 crore andof the NSE at ̀ 27,87,862 crore as on 31 December2010 as compared to ` 13,78,809 crore and` 41,38,024 crore respectively in 2009-10. Table 5.18displays these trends in the secondary market.
Equity Derivative
5.75 In the equity derivative segment, the NSEwitnessed a total turnover of ` 2,05,99,192 croreas on 31 December 2010 as compared to `1,76,63,665 crore during 2009-10. Similarly, thetotal turnover in the equity derivative segment ofBSE stood at ` 35 crore in 2010-11 (so far) ascompared to ` 234 crore during 2009-10. Table5.18. shows these trends while Table 5.19 showsthe volatility of weekly returns on Indian equitymarkets.
Further, in the debt segment, FIIs invested ̀ 24,839crore in 2010-11 (as on 31 December 2010) ascompared to ̀ 32,438 crore in 2009-10. So far during2010-11, total investment in equity and debt by FIIsstood at ̀ 1,37,461 crore as compared to ̀ 1,42,658crore in 2009-10.(Table 5.22)
International Comparison
5.80 The trend in major emerging markets alongwithP/E ratios are given in table 5.23 and 5.24respectively. Table 5.23 displays gains/losses postedby global indices over their 2003 levels from 2004 to2010.
Market Movements
5.81 The year 2010 has been one of strong growthfor the Indian capital markets . Bulls tossed off themarkets in the year 2010 to a net gain of 18percent, following global recovery and with FIIs pumpingmoney in to the market on account of solid domesticgrowth coupled with a resurging corporate sector.Indices achieved record highs during the specialone-hour muhurut trading on 5 November 2010 withthe Sensex touching 21004.96 and Nifty 6312.45.As on 31 December 2010, the markets stand just 3per cent away from this alltime peak and closed at20509.09 (+ 17.43 per cent from 31 December 2009for the Sensex-) and 6134.5 (+ 17.95 per cent forNifty).
5.82 Indian markets have been making gains foreight quarters in a row, their longest winning run inat least 20 years. While 2009 was basically a yearof recovery from the crisis year of 2008, 2010 wasone of consolidation of gains. From 9647 on 31stDec 2008, the Sensex climbed to 17464.81 on 31December 2009 and further consolidated its rally at20509.09 on 31 December 2010. The total marketcapitalization as on 31 December 2010 stands at` 72,96,725 crore compared to ̀ 60,81,308 crore ason 31 December, 2009.
Currency Derivative
5.76 The turnover at the MCX Stock Exchange(MCX-SX) in the currency derivatives segment stoodat ` 28,89,445 crore in 2010-11 (as on 30November,2010) as against ` 19,44,654 crore in2009-10. The NSE, witnessed a turnover of` 23,04,219 crore in 2010 (as on 30 November 2010)as compared to ` 17,82,608 crore in 2009-10.Further, the USE, which began operations in thecurrency derivatives segment on 20 September2010, witnessed a turnover of ` 5,37,836 crore ason 30 November 2010. (Table 5.20)
Interest Rate Derivative
5.77 Trading in interest rate futures started at theNSE on 31 August 2009. During 2010-11 (as on30 November 2010), the NSE witnessed a totalturnover of ̀ 53 crore in this segment as comparedto ` 2975 crore in 2009-10. (Table 5.21)
FIIs5.78 The number of registered FIIs increased to1718 as on 31 December 2010 from 1713 on 31March 2010. The number of registered sub-accounts also increased to 5503 from 5378 duringthe same period.
5.79 In the Indian equity market, FIIs invested` 1,12,622 crore during 2010-11 (as on 31 December2010) as compared to ̀ 1,10,221 crore in 2009-10.
Table 5.24 : P/E Ratios in Select Emerging Markets
Country Index 2008-09 2009-10 2010-11*
Korea Kospi 25.7 11.1 14.8
Thailand SET 15.7 12.3 15.0
Indonesia Jakarta Composite 20.1 16.6 20.9
Malaysia Kuala Lumpur Comp. 15.0 18.9 17.4
Taiwan TSEC weighted 65.7 19.1 15.7
India BSE Sensex 13.7 21.3 23.6
India S&P CNX Nifty 14.3 22.3 24.5
Source: BSE, NSE, and Bloomberg.
Note:* As on 31 December 2010.
122 Economic Survey 2010-11
Website: http://indiabudget.nic.in
5.83 In terms of month-on- month movement,indices witnessed a consolidation phase tillSeptember 2010. While individual stocks saw manyups and downs, the indices were mostly rangebound. The maximum monthly gains were recordedin September when the Sensex and Nifty made 11.67per cent and 11.62 per cent respectively againstthe closing price in August. Compared globally, whilethe Jakarta Composite in Indonesia gained the mostamong indices with about 45 per cent rise, US’ DowJones and UK’s FTSE 100 have each risen byaround 11 per cent and 9 per cent respectively.NASDAQ composite Index was up 16.91 percentwhile S&P rose by 13 per cent. However,Japan’s Nikkei 225 and China’s Shanghai Compositedipped 3 per cent and 14 per cent respectivelyduring the year, reflecting the rising yen andmonetary tightening in the respective countries.
Reasons For Market Movements
5.84 Markets are riding on the strong health ofthe Indian corporate sector; Also advance taxpayments by India’s top 100 corporate taxpayersrose by 18.7 per cent in December from a yearago, indicating better corporate performance in thethird quarter, reinforcing the belief in fundamentalsin the market sphere. India’s April-November taxmop-up was estimated to be ̀ 4.18 trillion comparedto ` 3.296 trillion a year ago, indicating the healthyfundamentals of the economy. India’s economy islikely to surpass the Government’s 8.5 percentgrowth target for the fiscal year, giving further fillipto bourses on the domestic front.
FII Flows at Historical levels: Historically low yieldsin developed markets due to accommodativemonetary policies and weak economic prospectshave pushed FII inflows to emerging markets torecord highs.
The primary market got a new lease of life thiscalendar year with Indian companies raising `69,192 crore through IPOs and FPOs. This was3.5 times higher than the previous year (` 19,567crore) and 53 per cent higher than the earlier recordof ` 45,142 crore in 2007. Over 72 per cent of theyear’s total mobilization was accounted for by public-sector units (PSUs). The year also witnessed thelargest ever IPO in India—of ̀ 15,199 crore—fromCoal India, which single-handedly accounted for22 per cent of the year’s total mobilization.
5.85 Global recovery also resulted in an upsurgein the markets. Boosting sentiments across the globe,the US economy expanded at a 2.6 per cent annual
rate in the third quarter, marking a pickup in growththat may extend into 2011 as consumers andcompanies gain confidence to spend. Chinesemanufacturing growth remains at relatively highlevels amidst inflation. Global attention is on Chinesegrowth as it is considered the driver of global growthin 2011. China´s manufacturing sector grew at theweakest pace in three months in December afterthe Government tightened monetary policy to restraininflation and closed factories to meet energy-efficiency targets. It is widely believed that followingChina, the rest of the central banks in emergingmarkets are also tightening their economies tosafeguard them from inflation, making less cashavailable for equities.
5.86 Globally, leaders are striving to keep the paceof growth intact. Most European and Asian shareindices rose as investors’ concerns over theEurozone’s debt crisis were allayed by an 85 billioneuro ($113bn; £72bn) bailout package for Irelandby the European Union and the InternationalMonetary Fund on 28 November). Greece, whichwas the first to be hit, had received a 110 billioneuro rescue package in May, which saved it frombankruptcy. The Monetary Policy Committee of theBank of England voted to carry forward its £200billion quantitative easing programme. The withdrawalof the programme set up by the US Federal Reserveto ease the strain from Europe’s debt crisis, wasextended from January to August. Amid signs ofrecovery, the US Federal Reserve introduced thepolicy of buying $ 600 billion in US Treasury bondsand keeping short-term interest rates near zero.The US Govt. also extended all Bush-era tax cuts.All these developments have created positive vibesin the market. While the measures to rescue theIrish banking system are in place, there is nowgrowing concern about the other two countries inthe euro group called PIGS (Portugal, Ireland,Greece, and Spain) dampening sentiments acrossthe globe.
MAJOR POLICY DEVELOPMENTS
Equity Finance For Small And MediumEnterprises (SMEs)5.87 In recognition of the need for making financeavailable to needy SMEs, the SEBI Board in itsmeeting held on 25 October 2007 had agreed uponthe creation of a separate exchange for SMEs.Accordingly, in May 2008 a discussion paper wasbrought out on the issue. Based on the feedbackreceived, the SEBI Board in its meeting held on 6
123Financial Intermediation and Markets
Website: http://indiabudget.nic.in
October 2008 decided to encourage promotion ofeither dedicated exchanges and/or dedicatedplatforms of the existing exchanges for listing andtrading of securities issued by SMEs. On 9November 2009, the SEBI Board took a decisionon the operational aspects of the exchanges/platforms of stock exchanges for SMEs. Accordingly,SEBI has permitted setting up of a stock exchange/trading platform for SMEs by a recognized stockexchange with nationwide trading terminals and hasalso issued guidelines for market making for thespecified securities listed on the SME exchange.Further, necessary amendments to the SEBIregulations have been carried out. Based on thefinalized regulations, applications have beenreceived by SEBI for setting up SME platforms.
Financial Sector Legislative ReformsCommission (FSLRC)5.88 The Government in its Budget 2010-11announced the setting up of the FSLRC with a viewto rewriting and cleaning up financial-sector laws tobring them in tune with current requirements.
5.89 The remit of the Commission will be to review,simplify, and rewrite legislation focusing on broadprinciples. It will evolve a common set of principlesfor governance of financial-sector regulatoryinstitutions. The Commission will also examine thecase for greater convergence of regulation and willstreamline the regulatory architecture of financialmarkets.
Financial Stability And Development Council(FSDC)
5.90 With a view to strengthening andinstitutionalizing the mechanism for maintainingfinancial stability and development, the Governmentset up an apex-level body—the FSDC. TheChairman of the Council is the Finance Minister ofIndia and its members include heads of thefinancial-sector regulatory institutions. Withoutprejudicing the autonomy of regulators, this Councilwill monitor macro prudential supervision of theeconomy, including the functioning of large financialconglomerates, and address inter-regulatorycoordination issues. It will also focus on financialliteracy and financial inclusion. The Council will haveone Sub-Committee headed by the Governor, RBI.The Secretariat of the said Council will be in theDepartment of Economic Affairs, Ministry ofFinance. The notification constituting the FSDC wasissued on 30 December 2010 and its first meetingwas held on 31December 2010.
External Commercial Borrowing (ECB)Policy
5.91 A prospective borrower can access ECBsunder two routes, automatic and approval routes. Acorporate, other than a financial intermediary,registered under the Companies Act,1956, canaccess ECBs under the automatic route up to US $500 million in a financial year both for rupeeexpenditure and / or foreign currency expenditurefor permissible end uses. Borrowers in the servicessector, namely hotels, hospitals, and softwarecompanies can access ECBs under the automaticroute up to US$ 100 million in a financial year forimport of capital goods and for rupee and / or foreigncurrency capital expenditure and NGOs engaged inmicro finance activities up to US$ 5 million in afinancial year. ECBs which are not covered by theautomatic route are considered under the approvalroute on a case-by-case basis by the RBI. The ECBpolicy is operationalized through notifications issuedby the RBI under the Foreign Exchange ManagementAct 1999. These can be accessed on RBI’s website.The norms applicable to ECBs are also applicableto FCCBs in all respects, except in the case of HFCsfor which criteria will be notified by the RBI.
5.92 Some aspects of the ECB policy modifiedrecently in 2010-11 are summarized as follows:
(a) As per extant norms, infrastructure financecompanies (IFCs), i.e. NBFCs categorizedas IFCs by the RBI were permitted to availof ECBs for on-lending to the infrastructuresector, as defined in the extant ECB policy,under the approval route. After a reviewundertaken in April-May 2010, as a measureof liberalization of the existing procedures,it has been decided to permit the IFCs toavail of ECBs, including outstanding ECBs,up to 50 per cent of their owned funds underthe automatic route, subject to theircompliance with the prudential guidelinesalready in place. ECBs by IFCs above 50per cent of their owned funds would requirethe approval of the RBI and, therefore, beconsidered under the approval route.
(b) As per the extant policy, using ECBs torefinance domestic rupee loans was notpermitted. However, keeping in view thespecial funding needs of the infrastructuresector, it has been decided to put in place ascheme of take-out finance arrangement
124 Economic Survey 2010-11
Website: http://indiabudget.nic.in
through ECBs, under the approval route, forrefinancing of rupee loans availed of fromdomestic banks by eligible borrowers in thesea port and airport, roads including bridges,and power sectors for the development ofnew projects, subject to conditionsstipulated by the RBI.
Indian companies were allowed to buy backtheir FCCBs under the approval route, upto 30June 2010. Based on a review ofpolicy and in view of the representationsreceived from the issuers of FCCBs, it hasbeen decided to consider applications,under the approval route, for buyback ofFCCBs until 30 June 2011, subject to theissuers complying with all the terms andconditions of buyback / prepayment ofFCCBs.
(c) At present, entities in the services sectors,namely hotels, hospitals, and software areallowed to avail of ECBs up to US$ 100million per financial year under theautomatic route, for foreign currency and/orrupee capital expenditure for permissibleend-uses. After a review it has beendecided to consider applications fromcorporates in the hotel, hospital, andsoftware sectors to avail of ECBs beyondUS$ 100 million under the approval route.ECBs Registered with the RBI is given inTable 5.25.
FII Investments In Government Securitiesand Corporate Bonds
5.93 At present, FIIs registered with SEBI arepermitted to invest in Government securities andcorporate bonds up to US$ 5 billion and US$ 15billion respectively. After a review in the context ofIndia’s evolving macroeconomic situation, its
increasing attractiveness as an investmentdestination, and need for additional financialresources for India’s infrastructure sector whilebalancing its monetary policy, it was decided toincrease the limit of FII investment both inGovernment securities and corporate bonds by US$ 5 billion each, raising the cap to US$ 10 billionand US$ 20 billion respectively. The incremental limitof US$ 5 billion has, however, to be invested insecurities with residual maturity of over five yearsand corporate bonds with residual maturity of overfive years issued by companies in the infrastructuresector.
Report of the Working Group on Foreign In-vestment In India
5.94 With a view to rationalizing the presentarrangements relating to foreign portfolio investmentsby FIIs/ non- resident Indians (NRIs) and otherforeign investments like foreign venture capitalinvestor (FVCI) and private equity entities, theGovernment set up a working group to look at varioustypes of foreign flows, which are taking advantageof arbitrage across the respective stand-aloneregulations, and generate recommendations to theGovernment. The group submitted its report to theFinance Secretary on 30 July 2010.
5.95 The group examined the structure ofregulation and the ways in which practices,institutions, and procedures inflect and shape thesepolicy decisions. It looked at foreign exchange lawwith regard to listed and unlisted equity, corporateand government securities, and derivatives as wellas tax policy related to these matters. It did not lookat FDI policy except in areas where FDI policy andportfolio investment were intertwined. The group’sreport also offers, alongside economic policycontextualizing capital flows in relation to the Indianand global economies, close scrutiny of thestructures and incentives created by the law in themain areas of the report’s mandate: foreignexchange controls with regard to listed and unlistedequity, corporate and government securitiesregulation, and derivatives trading. The focus of thegroup has been to identify procedures and practiceswhich can help avoid uncertainty, delay, or unequaltreatment and to recommend measures which couldsimplify the portfolio investment environment, at thesame time laying a strong emphasis on KYC norms.A copy of the report is available on the FinanceMinistry website at the following link: http://finmin.nic.in/reports/WGFI.pdf
Financial Action Task Force (FATF)5.96 The FATF is an inter-Governmental body,responsible for setting global standards on anti-money laundering (AML) and combating thefinancing of terrorism (CFT). India became Observerat the FATF in the year 2006. Since then, India hasbeen working towards full-fledged membership ofthe FATF.
As part of its membership, a joint FATF / Asia PacificGroup Mutual Evaluation Team visited India inNovember-December 2009 for on-site assessmentof India’s compliance with the 40+9Recommendations of the FATF.
5.97 The Mutual Evaluation Report on India andIndia’s membership issues were discussed in thethird meeting of the FATF Plenary-XXI held inAmsterdam the Netherlands from 23to 25 June2010. The FATF Plenary adopted the MutualEvaluation Report on India on 24 June 2010 and on25 June 2010 admitted India as 34th CountryMember of the FATF.
5.98 FATF membership is very important for Indiain its quest to become a major player in internationalfinance. It will help India build the capacity to fightterrorism and trace terrorist money and tosuccessfully investigate and prosecute offencesrelated to money laundering and terrorist financing.The FATF process will also help us in coordinationof AML/CFT efforts at international level.
India’s Membership of the Eurasian GroupOn Anti-money Laundering And CombatingThe Financing Of Terrorism (EAG)5.99 On 15 December 2010 India gainedmembership of the EAG which is an FATF-styleregional body, responsible for enforcing global AMLand CFT standards. The support for India’smembership was unanimous. India is the ninthmember of the group. The other members areRussia, China, Turkmenistan, Serbia, Tajikistan,Uzbekistan, Belarus, and Kazakhstan. The groupalso has 16 nations and 15 organizations asobservers.
INDIA’S SOVEREIGN RATING
5.100 Presently, India is rated by six internationalcredit rating agencies, namely Standard and Poor’s(S&P), Moody’s Investor Services, FITCH, DominionBond Rating Service (DBRS), the Japanese CreditRating Agency(JCRA), and the Rating and InvestmentInformation Inc., Tokyo(R&I). Information flow tothese credit rating agencies has been streamlined.
5.101 In the calendar year 2010, S&P upgradedIndia’s foreign currency outlook from negative tostable, FITCH upgraded its local currency outlookfrom negative to stable, and Moody’s upgraded itslocal currency outlook from Ba2 to Ba1. Creditratings issued by other agencies maintained statusquo.
FINANCIAL STABILITY BOARD (FSB)5.102 The Financial Stability Forum (FSF) wasestablished by the G7 finance ministers and centralbank governors in 1999 to promote internationalfinancial stability through enhanced informationexchange and international cooperation in financialmarket supervision and surveillance. It decided atits plenary meeting in London on 11-12 March 2009to broaden its membership and invite as newmembers the G20 countries that were not initially inthe FSF. These included Argentina, Brazil, China,India, Indonesia, Korea, Mexico, Russia, SaudiArabia, South Africa, and Turkey. In order to marka change and convey that the FSF would play amore prominent role in this direction in the future,the FSF was relaunched as the Financial StabilityBoard (FSB) on 2 April 2009, with an expandedmembership and broadened mandate to promotefinancial stability.
5.103 The current FSB comprises nationalfinancial authorities (central banks, supervisoryauthorities, and finance ministries) from the G20countries, as well as international financialinstitutions, international regulatory and supervisorygroupings, committees of central bank experts, andthe European Central Bank.
FINANCIAL STABILITY ASSESSMENTPROGRAMME
5.104 India’s Financial Sector AssessmentProgramme (FSAP) was made by the IMF/WorldBank in 2000-2001 but it was not made public as itwas part of a pilot FSAP assessment of 12 countries.The Committee on Financial Sector Assessment(CFSA) – chaired by the Deputy Governor, RBI andFinance Secretary had done a self-assessment in2009. The results are in the public domain (RBIwebsite).
FSB Members have committed to undergoingperiodic peer reviews. As a member, India hasrequested IMF/World Bank to conduct such a reviewby way of a full-fledged FSAP. India’s FSAP isscheduled for the calendar year 2011.
126 Economic Survey 2010-11
Website: http://indiabudget.nic.in
INSURANCE AND PENSION FUNDS
Insurance Sector
5.105 The insurance sector was opened for privateparticipation with the enactment of the Insurance
Regulatory and Development Authority Act 1999.While permitting foreign participation in ventures setup by the private sector, the Government restrictedparticipation of the foreign joint venture partner throughthe FDI route to 26 per cent of the paid-up equity ofthe insurance company.
Box 5.3 : Financial Inclusion and Literacy
Financial inclusion plays a crucial role in inclusive development and sustainable prosperity as is being increasinglyrecognised and acknowledged globally. Large segments of population need to be part of formal payment system andfinancial markets. Financial inclusion would also broaden and deepen financial savings and lead to higher economicdevelopment.
Previous initiatives: While financial sector policies in India have long been driven by the objective of increasing penetrationand outreach, the goal of inclusion has eluded us. About 41 per cent of adult population remains unbanked and thenumber of loan accounts covers only 14 per cent of adult population. The previous initiatives included (i) the expansionof network of co-operative banks to provide credit to agriculture and saving facilities in rural areas, (ii) nationalizationof banks in 1969 and expansion of branches and (iii) creation of an elaborate framework of priority sector lending withmandated targets as part of a strategy to meet the savings and credit needs of large sections of the Indian populationwho had no access to institutional finance. Given the sheer enormity of the challenge, however, the outcomes of theseefforts have so far been mixed.
Recent initiatives/out of box approaches: Recent initiatives include (i) “no frill” account for retail purpose; (ii) simplifiedKYC (Know Your Customer) (iii) Credit counselling centre (GCC) facilities; (iv) use of NGOs and formation of SHGs; (v)Kisan credit cards services and (vi) extension of Smart cards. The Finance Minister in his Budget Speech of 2007-08 alsolaid down provisions for funding of financial inclusion goals. The Rangarajan Committee also spelt out priorities formeeting financial inclusion objectives. Two of the more important approaches in the recent times included the use oftechnology such as smart cards and mobile telephone banking. The potential for their spread can be vast especially incombination with banking correspondence approach launched recently.
New entry and Competition: In addition, new competition and entry also play crucial roles as evident from the globalexperience. Two particular initiatives have included the role of Micro Financial Institutions (MFIs) and Non- BankFinance Companies (NBFCs). MFI activities have surged in recent years, but has come under scrutiny and regulation(see Chapter 2). Services expanded at a fast rate, providing access on better terms than the alternatives of traditionalmoney lenders. However, better regulation is also needed. On NBFCs, gold pawn establishments have also providedalternate access and are fast expanding in urban and semi-urban settings. As far as caps on interest rates are concerned,as in case of other products, “subsidies” in the form of low interest rates are often an inhibitor of access to servicesbecause of rationing and misuse.
What we need today, therefore, are new approaches to financial inclusion that build on the lessons of the past but alsoinvolve trying out newer approaches and instruments. Importantly, this also requires a change in the mindset on thepart of policymakers, practitioners and other stakeholders alike to figure out and put in place effective ways of reachingout to the hitherto un-reached and under-reached segments of our population.
Financial Literacy: Any policy initiative seeking to afford greater access to financial services to a large segment of thepopulation must necessarily address bridging the existing knowledge gap in financial education and literacy. Over thelast decade or so, researchers all over the world, especially in the developed countries, have, therefore, started to studyand explore whether individuals are well-equipped to make financial decisions. Financial education and literacy assumesurgency in any given scenario. No wonder policymakers all over are increasingly taking note of this and directing theirefforts to address it. In the UK, the Financial Services Authority has launched a big campaign to improve the financialskills of the population and enable a better appreciation of risks and rewards inherent in financial instruments andtransactions. The US Treasury, which established its Office of Financial Education in 2002, is working to promote accessto the financial education tools. The Financial Literacy and Education Commission, established by Congress in 2003 wascreated to improve financial literacy and education. In Australia, the Government established a National Consumer andFinancial Literacy Taskforce in 2002. In Malaysia, the Financial Sector Master Plan, launched in 2001, includes a 10-yearconsumer education programme. The Monetary Authority of Singapore has launched a national financial educationprogramme (Money SENSE). A nationwide, coordinated effort was also required in India and the Financial Stability andDevelopment Council (FSDC) is a step forward in this direction. It is expected that this new initiative will help adequatelyaddress the challenge of financial inclusion and literacy.
Idioms and metaphors of development economics keep on changing from time to time. Today, new financial sectorinitiatives in a country like ours - be it in the form of prompt and innovative policy responses from the Government,central bank, other authorities or be it in the form of implementation efficiency and inventiveness from the variedplayers - need to explicitly prioritize both financial inclusion and financial education and literacy.
127Financial Intermediation and Markets
Website: http://indiabudget.nic.in
New entrants in the insurance sector
5.106 Since the opening up of the sector, thenumber of participants has gone up from six insurers(including LIC of India, four public-sector generalinsurers, and the General Insurance Corporation asnational reinsurer) in the year 2000 to 48 insurersoperating in the life, non-life, and reinsurancesegments (including specialized insurers, namelythe Export Credit Guarantee Corporation [ECGC] andAgricultural Insurance Company [AIC]). Three of thegeneral insurance companies, namely Star Healthand Alliance Insurance Company, Apollo DKV, andMax Bupa Health Insurance Company Ltd., functionas standalone health insurance companies.
5.107 Of the 22 insurance companies that haveset up operations in the life segment post openingup of the sector, 20 are in joint ventures with foreignpartners. Of the 18 (including stand alone healthinsurance companies) insurers who have commencedoperations in the non-life segment, 16 are incollaboration with foreign partners. The threestandalone health insurance companies have beenset up in collaboration with foreign joint venturepartners. Thus, as on date, 36 insurance companiesin the private sector are operating in the country incollaboration with established foreign insurancecompanies from across the globe.
Life insurance
5.108 The post-liberalization period has beenwitness to tremendous growth in the insuranceindustry, more so in the life segment. In 2009-10,even after the outcome on account of the financialmeltdown, the life insurance segment saw an upwardtrend. The first-year premium, which is a measureof new business secured, underwritten by the lifeinsurers during 2009-10 was ` 1,09,894.02 croreas compared to ` 87,331.09 crore in 2008-09,registering a growth of 25.84 per cent. In terms oflinked and non-linked business during the year 2009-10, 54.53 per cent of the first-year premium wasunderwritten in the linked segment while theremaining 45.47 per cent was in the non-linkedsegment as against 51.13 and 48.87 respectively inthe previous year.
Non-life insurance
5.109 Non-life insurers in India (excludingspecialized institutions like the Export CreditGuarantee Corporation and Agriculture InsuranceCorporation and the standalone health insurance
companies) underwrote premiums of ̀ 34,620 crorein 2009-10, as against ` 30,352 crore in 2008-09.
Insurance Penetration
5.110 Insurance penetration is defined as the ratioof premium underwritten in a given year to the GDP.Insurance penetration in the year 2000 when thesector was opened up to the private sector was2.32 (life 1.77 and non-life 0.55) and it has increasedto 5.39 in 2009 (life 4.73 and non-life 0.66). Theincrease in levels of insurance penetration has tobe assessed against the average growth of over 8per cent in the GDP in the last five years.
Initiatives taken by the Authority in the In-surance Sector
5.111 The initiatives taken by the authority in theinsurance sector include the following:
1) Amendment to Insurance Legislation: TheInsurance Laws (Amendment) Bill 2008 introducedin Parliament recently proposes to amend theInsurance Act 1938, the Insurance Regulatory andDevelopment Authority (IRDA) Act 1999, and theGeneral Insurance Business (Nationalization) Act1972. The amendments to the Insurance Act andthe IRDA Act focus on the current regulatoryrequirements; the proposed changes provide forgreater flexibility in operations and are aimed atdeletion of clauses that are no longer relevant in thepresent context. The amendments also provide forenhancement of enforcement powers and levy ofstringent penalties.
2) Micro Insurance: The IRDA has formulatedthe Micro Insurance Regulations to distributeinsurance products that are affordable to the ruraland urban poor and to enable micro insurance tobecome an integral part of the country’s widerinsurance system. The main thrust of theseregulations is to provide low income people withaffordable insurance products as a hedge againstunforeseen risks. Total premium income in the microinsurance portfolio of life insurers for the year 2009-10 is ` 402 crore. Fourteen life insurers have sofar launched 28 micro insurance products and bythe end of March 2010 there were 8676 individualmicro insurance agents in India.
3) Guidelines on the AML Programme: TheIRDA issued guidelines on the AML Programme tothe insurance industry on 31 March 2006, wherebyinsurers were advised to put a proper AML policyframework in place in case of life insurance
128 Economic Survey 2010-11
Website: http://indiabudget.nic.in
companies and non-life insurance companieseffective from 1 August 2006 and 1 January 2007respectively. An updated master circular on Anti-Money laundering/Counter-financing of terrorism hasbeen issued by the Authority on 24 September 2010.The AML/CFT guidelines were reviewed by theAuthority to align certain stipulations with those ofthe 40 +9 recommendations of the FATF andadditional stipulations/clarifications were issued toinsurers vide circular dated 12 November 2010 to becomplied with by 31 December 2010.
4) Data Warehouse: The IRDA has initiated stepsto design, build, and manage a data warehouse forthe insurance industry recognizing that data will helpthe insurers design new products and allow scientificunderwriting, further calculations of actuarial risks,price setting, and various aspects relating to claimssettlement, management of hazards, etc. As a firststep, the IRDA has designed a data set relating tohealth and motor vehicle insurance. The IRDA alsoproposes to put in place a formal data warehouse toenable access by various stakeholders across theindustry.
5) Consumer Grievance Redressal Cell: TheGrievance Redressal Cell of the IRDA looks intocomplaints from policyholders. Complaints againstlife and non-life insurers are handled separately. ThisCell plays a facilitative role by taking up complaintswith the respective insurers.
6) Public Awareness Campaigns/Programmes:The IRDA’s strategy for consumer awareness/education includes campaigns through externalmedia, i.e. mass media, mainly print, television andthe Internet, and internal initiatives such as anexclusive consumer education web page and samplebooklets on various insurance-related topics,containing generic information, which insurers wouldalso be advised to publish and distribute.
7) Cap on Unit-linked Insurance plans (ULIP)Charges: The insurance industry has introducedULIPs which have found favour with customers inIndia. These products prescribe certain chargeswhich are deducted either from contributions or fromthe fund. In order to simplify and to ensure that thecharges are reasonable, relevant to the services beingprovided, and clear to customers, the IRDA hasmandated an overall cap on all charges put together.Care has been taken to ensure that the insurershave freedom to distribute charges across the termof the policy. This also imparts flexibility andfacilitates product innovation.
8) Corporate Governance guidelines: Corporategovernance guidelines have been rolled out forinsurance companies, effective from 1 April 2010.The objective of the guidelines is to ensure that thestructure, responsibilities, and functions of theBoards of Directors and senior management ofcompanies fully recognize the expectations of allstakeholders as well as those of the regulator. Theguidelines broadly cover major structural elementsof corporate governance.
9) Initiatives in the area of PolicyholdersGrievances Redressal
a) Grievance redressal guidelines effective from1 August 2010 specific to both life andgeneral insurance companies have beenissued by the IRDA fixing the turnaround timefor various grievances.
b) The IRDA has during July 2010 inauguratedthe nationwide toll-free grievance call centreno.’155255’ for policyholders to lodgecomplaints against insurance companies. TheGrievance Redressal Cell of the IRDA looksinto complaints from policyholders. This Cellplays a facilitative role by taking upcomplaints with the respective insurers forspeedy disposal.
c) Guidelines have been issued by the IRDAeffective from 1 June 2009 on renewabilityof health insurance policies clearly definingthe procedure while declining a renewal orimposing a loading and also regarding upfrontdisclosures in Prospectuses. Insurers werealso guided tocondone delay in renewal upto 15 days.
d) The IRDA has also instructed insurers onthe terms and conditions of health insuranceto senior citizens and made it mandatory forproducts filed after the circular date to allowentry at least till 65 years of age. The IRDAvide its circular dated 2 September 2009 hasalso advised insurers to provide a ‘free lookperiod’ for health insurance policies with termthree or more years.
e) The IRDA is in the process of developing thenew Integrated Grievance Managementsystem (IGMS) which will not only facilitatepolicyholders to register/track theircomplaints online with insurance companiesbut also facilitate the IRDA to monitor thegrievance redressal procedure of insurancecompanies
129Financial Intermediation and Markets
Website: http://indiabudget.nic.in
f) The IRDA being in receipt of severalcomplaints from policyholders relating toagency identification and servicing, keepingthe interests of policyholders in view, hasdirected all insurers to display the agencycode, agency name, and nobile number(landline if mobile number not available) andother contact details prominently on the firstpage of the policy document to beimplemented on or before 1 November 2010.
g) In respect of medical insurance policies, ifthere is a change in Preferred Provider ofNetwork (PPN) of Hospitals, the insurershave been directed on 24 August 2010 toinform the policyholders at all times of thenearest possible alternative hospitals wherethe cashless facility is available and theconditions thereof.
h) Guidance notes have been issued by theIRDA on 28 June 2010 on recent regulatorychanges on ULIPs.
10) For the Orderly Growth of Insurance andReinsurance industry:
(i) As the inter-company balances inreinsurance and coinsurance are growing,the IRDA, noting that these balances canhave serious implications for the liquidity ofseveral entities in the insurance sector, hasdecided to induce insurers and brokers tomove over to a computer system ofadministration and settlement of accounts inrespect of all inter-company transactions.
(ii) The IRDA (Sharing of Database forDistribution of Insurance Products)Regulations 2010 have been issued and allinsurers advised to terminate all the referralarrangements entered into prior to the cominginto effect of these regulations that are notin conformity with the provisions of theseregulations.
(iii) The IRDA (Insurance Advertisements andDisclosures) (Amendment) Regulations 2010have been issued to ensure the orderlygrowth of the insurance industry.
(iv) The IRDA ( Treatment of Discontinued LinkedInsurance Policies) Regulations 2010 havebeen issued detailing the procedure on policydiscontinuance and imposing a cap oncharges on policy discontinuation.
(v) Authority revamped its present agencylicensing portal with a new Agency portal inorder to widen the scope of the portal and tointegrate the various stakeholders with theagency licensing system. The portalcommenced its operations on 5/1/2010.
11) Credit Insurnace : New guidelines on tradecredit insurance policies have been issued by theIRDA effective from 13 December 2010, with a viewto standardizing the features of these products. Allinsurers have to revise their products in line withfile & use guidelines and trade credit insuranceguidelines. These guidelines specify that apolicyholder should necessarily be a supplier ofgoods and services and his loss should be by non-receipt of trade receivables and can only be issuedon whole turnover basis covering all buyers.
12) Variable Insurance products: Guidelines havebeen issued by the IRDA on variable insuranceproducts (VIP) on 23 November 2010. As per theseguidelines, all VIP products shall only be offeredunder non-unit-linked platform either as participatingor non-participating and shall not be permitted underunit-linked platform. Benefit is payable on thesepolicies either on death or maturity and only regularpremiums with minimum policy and payment termsof five years are allowed. Single premium, limitedpremium, and group insurance contracts are notallowed under these products.
13) Consumer Education: Consumer educationand policyholder protection being two sides of thesame coin, the Regulator encourages and supportsconsumer bodies to conduct seminars on insurance,thereby not only educating the consumer but alsoproviding a platform for the consumer to interactwith representative(s). The IRDA itself conducts/participates in and supports national-level seminarson different topics and is also proposing to launcha consumer portal shortly.
14) Persistency of Life Insurance Policies: Inorder to increase persistency in the interests of theinsurance industry and to create professionalismamongst agents and encourage them to build a long-term career, the IRDA has issued an exposure draftto set certain minimum standards and requirementsfor agents and mandate insurers to review theperformance of agents periodically.
These proposals would be a step forward inprotecting the interests of policyholders, who in theultimate analysis stand to gain if persistency is high,
130 Economic Survey 2010-11
Website: http://indiabudget.nic.in
both in terms of protection of life and profitability of the life insurance business which would benefit themin the long run.
15) IPO Guidelines: Several insurance companieswill be completing 10 years of their operationsshortly, after which they may be allowed by theRegulator to go in for an IPO. It is essential that theinvestors be made fully aware of the financialperformance, company profile, financial position,risk exposure, elements of corporate governancein place, and the management of such insurancecompanies. The IRDA is participating in the meetingsof the Standing Committee on Disclosures andAccounting Issues (SCODA) set up by SEBI tofinalize the disclosure requirements for insurancecompanies in their prospectus documents. Whilelaying down the stipulations on disclosurerequirements, the IRDA has drawn on internationalbest practices. It is proposed that the disclosurerequirements for life and non-life companies wouldbe separately mandated given the nature of theirrespective businesses.
16) Other activities: The IRDA along with NationalDisaster Management Authority (NDMA) hasconducted a seminar on Disaster Management inNew Delhi on 11 August 2010 to lay down a plan fordevising products for catastrophe perils and also todiscuss the collective role of the Government, NDMA,and IRDA representing insurance companies, ondisaster management.
Pension Sector
Highlights
5.112 Pension reforms in India have evolvedprimarily in response to the need of reform in theGovernment pension system. This had beendesigned to make a shift from defined-benefit todefined-contribution by putting a cap onGovernment’s liability towards civil servants’ pension.As a result of implementation of the New PensionSystem (NPS), all employees of the CentralGovernment and Central autonomous bodies, withthe exception of the armed forces, are now coveredby this defined-contribution scheme with effect from1 January 2004. Subsequently, 27 StateGovernments have notified and joined the NPS fortheir employees. As of now, the subscriber basefor the mandatory Government sector has crossed1.1 million with a corpus approaching to ̀ 70 billion.With opening up of the NPS to all citizens of India
from 1 May 2009, on voluntary basis, the challengeis to spread the message of the NPS and old ageincome security to people in the unorganized sectoracross the country. This involves spreading the NPSdistribution network such that NPS is easilyaccessible to all, and there is adequate awarenessabout it for people to decide voluntarily to openpension accounts.
NPS Design
5.113 The NPS architecture essentially involves aset of financial institutions, called points of presence(PoP), which are authorized to open NPS accountsand receive contributions; the Pension FundManagers (PFMs), or the PFMs, which areappointed by the Pension Funds Regulatory andDevelopment Authority (PFRDA) and are authorizedto manage the pension corpus of the subscribers;and the Central Recordkeeping Agency (CRA),which does the record keeping. A centralized recordkeeping for the NPS ensures that the individualpension account is completely portable across thecountry, professions, and employment. Themanagement of the NPS is highly technology driven;the transmission of information and funds is donein an electronic environment ensuring speed,accuracy, and efficiency. The investment of thepension funds is done in accordance withprescribed norms which specify different categoriesof investment instruments along with prudential limitson the quality and quantity of investments. Thepension fund managers manage three separatescheme, consisting of three asset classes, namely(i) equity, (ii) Government securities, and (iii) creditrisk- bearing fixed income instruments, with theinvestment in equity subject to a cap of 50 per cent.In the equity scheme, the fund managers will investonly in index funds that replicate either the BSESensex or NSE Nifty 50 index. The subscriber willhave the option to decide the investment mix of hispension wealth. In case the subscriber is unable orunwilling to exercise any choice regarding assetallocation, his contribution will be invested inaccordance with the ‘auto choice’ option with apredefined portfolio.
Recent Initiatives
5.114 Although the NPS is perhaps one of thecheapest financial products available in the country,in order to make it affordable for economicallydisadvantaged people, the PFRDA has recently
131Financial Intermediation and Markets
Website: http://indiabudget.nic.in
introduced a lower cost version of the NPS, knownas NPS-Lite, which enables groups of people to jointhe NPS at substantially reduced cost. The PFRDAhas so far authorized nine aggregators to implementNPS-Lite. One of the distinguishing features of NPShas been unstinted Government support inpopularizing the concept of old age income security.In this regard, the announcement of theSwavalamban scheme in budget 2010 by the FinanceMinister was significant. Swavalamban is an incentivescheme for the NPS. Under this any citizen in theunorganized sector, who joins NPS in 2010-11, witha minimum annual contribution of ` 1000 andmaximum of ` 12,000 will receive a Governmentcontribution of ̀ 1000 in his NPS account. With thisannouncement, the Government of India has becomea direct stakeholder in the old age income securityof every citizen. The scheme is presently availablefor another three years beyond 2010-11 and will go along way in promoting pension culture in the country.Efforts are under way to expand the reach of theNPS to new segments like Central and Stateautonomous bodies and the organized sector. ThePFRDA is in dialogue with several State Governmentautonomous bodies and undertakings for extendingthe NPS to their employees.
Performance of the NPS
5.115 In the unorganized sector, nearly 34,000subscribers had jointed the NPS as of December2010 on voluntary basis. The subscriber base in thenewly launched NPS-Lite is around 5000. For allcitizens including workers of the unorganized sector,the NPS is currently available through nearly 5000service provider branches of 35 PoPs.
5.116 Despite all its good features, popularizationof the NPS remains a challenge. To address thischallenge, the PFRDA has appointed an expertcommittee, called the Committee to Reviewimplementation of Informal Sector Pension (CRIISP),to look into a range of issues connected with theNPS, such as reasons of sluggish public response,viability of the NPS as a financial product, ways andmeans of marketing/proper popularizing of the NPSand the agency best suited to perform this role, asustainable and viable economic incentive model forthe NPS, and the role of NPS fund managers in theentire NPS architecture, and suggest remedialmeasures. Important challenges before the PFRDAare to expand the distribution network of the NPSso that it is available within easy reach of allcitizens, educate the citizens to take appropriate
investment decisions based on their risk and returnprofiles, and contribute to improving financial literacylevels. The PFRDA is doing every bit to ensure thatthe complete distribution network of the NPS is fullygalvanized so that access to the NPS is improvedIt is expected that the success of pension reformswill not only help in facilitating the flow of long-termsavings for development, but also help establish acredible and sustainable social security system inthe country.
CHALLENGES AND OUTLOOK
Licensing for new banks, recapitalizationof banks
5.117 Providing access to banking facility to allcitizens is one of the main objectives of the inclusivedevelopment agenda in India. While providingbanking access, the issue of regulatory robustnessfor the banking sector should not be compromised.Therefore, the issue of providing eligibility normsfor new entities to operate as banks is of paramountimportance.
5.118 Minimum capital requirement for banksshould be graded. Having two types of licences,namely one for providing basic banking to fulfil theobligation of financial inclusion and the other forfull banking encompassing all activities of acommercial bank could be considered.
5.119 As regards allowing industrial houses,business houses, and NBFCs to promote banks,they may be allowed full banking licence withprovision for avoiding conflict of interest issues. MFIsand NBFCs should be considered for being givenlicences for basic banking. It is very essential thatthe basic banking functions are clearly andobjectively defined.
5.120 The issue of the requirement for foreignpromoters in banking needs to be addressed andforeign promoters with credible banking experience,may be considered provided they meet the fitnesscriteria. Also the principle of reciprocity could beapplied to countries that have allowed Indian banksto expand in their jurisdictions.
5.121 There is another important issue relating tominimum and maximum caps on promotershareholding and other shareholders. One view isthat as the bank grows in business, the promoter’scontrol should decline and the bank managed moreprofessionally and independently.
132 Economic Survey 2010-11
Website: http://indiabudget.nic.in
Human Resource Issues in PSBs
5.122 One of the most daunting tasks for banks inthe near future is going to be HR management. Themarket in the financial sector and especially inbanking is seeing growth driven by new productsand services that include opportunities in creditcards, consumer finance, and wealth managementon the retail side and in fee-based income andinvestment banking on the wholesale side. Theserequire new skills in sales and marketing, credit,and operations. Furthermore, given the demographicshifts resulting from changes in age profile andhousehold income, consumers will increasinglydemand enhanced institutional capabilities andservice levels from banks. PSBs need tofundamentally strengthen institutional skill levelsespecially in sales and marketing, serviceoperations, risk management, and overallorganizational performance.
5.123 Banks may aggressively use technology/business process re-engineering to reduce the gapcreated by shortage of staff and improve overallmanpower efficiency. In addition, a pool of talentfor occupying leadership positions could be builtup by banks by training and preparing promisingofficers to assume future leadership roles.
Pension Reforms
5.124 In a paradigm shift wherein a defined-benefit pension system was replaced by defined-contribution basedone, the NPS has been introducedby the Government of India and made mandatoryfor all new recruits to the Government (except armedforces) with effect from 1 January 2004. The NPSwas opened to all citizens of India from 1 May 2009on voluntary basis. Twenty-seven State Governmentshave notified and joined the NPS for theiremployees. As of now, the subscriber base for themandatory Government sector has crossed 1.1million with a corpus approaching ` 70 billion.However, covering the majority of the populationfrom the unorganized sector for whom the systemwas designed remains a challenge. Many newinitiatives have been taken by the pension regulatorPFRDA to address the issue of distribution. Thereis no doubt that the NPS is designed very attractivelywith many consumer friendly features and a lowcost structure. Therefore, the basic structure of thepension scheme need not be altered. Governmenthas also provided a direct co-contribution of ̀ 1000per account from last year under the Swavlambanscheme.But in a distributor- and supply-driven
market, Government intervention is required increating awareness amongst potential investors inthe pension product. There is also need to considerpassage of the long pending Pension FundRegulatory and Development Authority Bill in orderto give a fillip to regulatory robustness in the pensionsector.
Financial Inclusion and Literacy
5.125 With proliferation in the number andcomplexity of financial products, risk is beingtransferred to the household. Investors and marketplayers are being exposed to formal banking andfinancial products, as well as new sales practices,for the first time. All these require a base level ofunderstanding of money, its management and use.The lack of this understanding has the potential offrittering away economic gains made at aggregatelevel by nations, resulting in wealth transfer fromthe financially illiterate to a small segment of thefinancially literate. Many researches have shownthat a financially literate population promoteseconomic growth and well-being by expanding thequality of available financial services and byenhancing the ability of individuals to moreeffectively use the services in their best interests.Work on the topic by financial literacy scholarAnnamaria Lusardi, Professor of Economics atDartmouth College and Research Associate at theNational Bureau of Economic Research (NBER),shows that individuals with low levels of financialliteracy tend not to plan for retirement and borrowat high rates of interest. No wonder, there is a rushto make citizens financially literate.
5.126 With a household saving rate of 34 per cent,the merits of saving over current consumption arewell understood in India. Unlike many developedcountries, where getting people to save is an issue,the need in India is for the efficient conversion ofthis saving into investment. A large part of this moneyis in low-yielding assets like bank deposits andtraditional insurance but there is a clear trend ofindividuals preferring security-based investments asthey move upwards in income level. Therefore it isa big challenge for Indian policymakers to preparean effective strategy to for financial literacy of thesenew savers, investors, and consumers to holisticallyplan for their financial well-being.
5.127 Simultaneously, as one segment of thepopulation, due to advantages of birth, location, andeducation has benefited from the growth spurt inthe Indian economy the other has been unable to
133Financial Intermediation and Markets
Website: http://indiabudget.nic.in
reap the benefits due to exclusion from the financialsystem. It is another policy challenge to reach outto this financially uncovered segment. Governmenthas already made its commitment clear byannouncing its intention of providing banking facilityto all areas including rural by 2012. Widespread useof new and cost-effective technology could be madeto achieve this goal.
Macro Prudential Regulations and FinancialStability : Real Estate Sector5.128 In recent times and especially after the globalfinancial crisis, the issue of financial stability hasdrawn great attention mainly due to transmission ofits impact on the real sector of the economy. Theslowdown in the real sector has compounded theneed for policymakers to consider steps formaintaining financial stability. One of the steps
considered and taken worldwide has been to firstlyconsider and re look at existing macro prudentialregulations in the financial sector and then tointroduce such regulations if they donot exist. Asthe financial crisis had its origin in the housing andreal sector in the US, a very close look is required atthe need for robust macro prudential regulations inthis sector. In India also the RBI has recognized thisand initiated steps in this direction in its quarterlymonetary policy review of 2 November 2010. Thesteps include increasing the risk weights for housingloans and also increasing the loan to value ratios forsuch loans. Such macro prudential regulations arerequired in every segment of financial markets inIndia. The advantage of such regulations is that theyare concentrated in the targeted segment and arenot embedded in monetary policy so as to spreadany negative impact over the entire economy.
Balance of Payments CHAPTER
6
The world economy, led by the buoyant economic activity in emerging economies,is gradually recovering from the crisis. The risks however remain, as advancedeconomies face large fiscal deficit, high public debt and unemployment levels andtepid aggregate demand, leading to subdued growth. The sovereign debt crisis inthe peripheral euro-zone countries is contributing to the uncertainty. At the sametime, large capital flows to emerging economies, rising oil and agricultural pricesare fueling inflationary pressures that may affect the nascent global recovery. Inthe backdrop of these developments, the Indian economy continues to exhibit resilience,moving steadily towards the pre-crisis growth path. The current account deficithowever, has widened due to robust import demand and lower invisibles surplus.These are being largely financed by the relatively higher capital flows, leading tomoderate accretion in reserves. There are however challenges that include volatilenature of foreign institutional investment that is characterized by surge and reversalof capital flows, deceleration in foreign direct investment and the risk of furtherslowdown in advanced economies that may affect exports and strain balance ofpayments.
GLOBAL ECONOMY
6.2 The world economy is exhibiting signs ofrecovery, driven largely by the robust growth inemerging economies. Advanced countries however,continue to face uncertainty with large fiscal deficit,high public debt and unemployment levels thattogether with the deleveraging of banks, corporateentities and individuals, is affecting aggregatedemand and impeding the recovery process.
6.3 The risk of sovereign debt crisis in peripheraleuro zone economies and the fear that it couldspread to the banking and insurance sectors withlarge sovereign debt exposure, have made themarkets nervous. The likely impact on the euro andthe risk that the financial sector may take a hit isalso responsible for the efforts to avoid haircut onsovereign debt of affected countries throughrestructuring.
6.4 With investors dithering, Ireland’s rescuepackage under the aegis of the European FinancialStability Facility (EFSF) and the International
Monetary Fund (IMF) has not had the desiredstabilization effect on the markets. Many alsobelieve that the size of EFSF is not large enough tobail out bigger economies like Spain and the highdebt countries such as Italy and Belgium in theevent of the crisis spreading to other euro zonecountries. The risk is that the crisis could furtherimpair the confidence of investors through contagionchannels and delay the incipient recovery of theglobal economy.
6.5 Investor nervousness is compounded by thehigh refinancing requirement of sovereign, bank andcorporate debts and the fear that there may not besufficient liquidity in the market to rollover thematuring obligations. There is also the apprehensionthat the stimulus effort by governments is simplysubstituting the high private debt before the crisiswith public debt, without benefitting the globaleconomy in a major way.
6.6 The investor uncertainty is reflected in highvolatility of the currency markets. Moreover, asnone of the currencies offers a safe haven, many
Website: http://indiabudget.nic.in
135Balance of Payments
Website: http://indiabudget.nic.in
Box 6.1 : BRIC Study Report
The term BRIC stands for Brazil, Russia, India and China. It was coined by Goldman Sachs in 2001 in a paper titled‘Building Better Global Economic BRICs’ that looked at the future growth prospects of the four largest emerging economies.BRIC countries have since come to play a major role on the global stage. The BRIC Heads of State and Finance Ministers alsoperiodically meet for increasing cooperation among the BRIC countries.
During the meeting of the BRIC Finance Ministers and Central Bank Governors in London on 4 September, 2009, a decisionwas taken to commission a study examining the prospects of the world economy and the role of the BRIC countries in thepost-crisis world. The communiqué of the meeting also noted that the emerging economies had helped the world economycounter the fallouts of the global crisis by absorbing the impact of the widespread deterioration in trade, credit flows anddemand.
Given the increasing importance of the BRIC economies on the global stage and the recognition that they would play adominant role in the world economy in the coming years, the purpose of the collaborative study is to identify possible areasof co-operation and synergies among the BRIC countries for promoting mutual growth and for collectively harnessingglobal economic recovery.
It was also decided that India would anchor the study project. A working group, drawing upon government/central bankexperts from each of the four countries, was constituted for successfully conducting the study. Members of this group havebeen collaborating among themselves by identifying best practices and lessons in the individual BRIC countries in widevariety of sectors. The first meeting of the working group was held in New Delhi in September 2010 and was attended byparticipants from all the four BRIC countries. The meeting finalized the phases of report preparation covering issuesrelating to mutual sharing of information, identification of crucial challenges and opportunities facing the BRIC economies,and a time frame for preparation of the draft study report.
The first draft of the report has been prepared by the Indian team and is under circulation among the BRIC countries forappraisal and inputs.
investors are taking refuge in commodities,facilitated by investor-friendly instruments likeExchange Traded Funds (ETF), commodity indicesand the ease of taking positions in the futuresmarket. Together with rising demand from theemerging economies, the trend is reflected inincreasing and volatile prices of gold, oil, metals andsoft products like foodgrains. The surge in pricesof commodities like oil and foodgrains, however isstraining the balance of payments of emergingeconomies and contributing to price rise, affectingtheir growth prospects.
6.7 The surge in capital flows to emergingeconomies to take advantage of interest differential(carry trade), higher stock market returns and bettergrowth prospects is another fallout of uncertain growthprospects and low interest environ in advancedcountries. The deluge of capital, however, is leadingto stock market/ real estate bubbles and appreciationof local currency, with excess liquidity contributingto inflationary pressures.
6.8 Economic theory, at the same time, is at across roads. With free market economicsdiscredited and prices no longer regarded an effectivesignalling mechanism, the confidence in the self-correcting attribute of the market mechanism isabating. The Keynesian approach of deficit financingand high public expenditure is also being doubted,
as it has led to the build up of public debt, withoutsuccessfully addressing unemployment andaggregate demand problems in advanced countries.
6.9 Some of the mainstream financial markettheories like the efficient market hypothesis that havebeen the mainstay of finance are similarly beingquestioned. The theories based on the risk freenature of sovereign debt that have been thecornerstone of financial market modelling, too havecome in for criticism due to the risk of default/restructuring in peripheral euro zone countries andthe build up of public debt to unsustainable levels inmany advanced countries. As a result, the bonds ofmany top notch corporate entities and emergingeconomies are being priced more competitively vis-a-vis some of the euro zone countries.
6.10 In the ensuing melee, there is an attempt torevisit both economics and finance. In the first place,it is being recognized that the markets are subjectto boom and bust cycles, which could assumeserious proportions due to credit induced asset pricebubbles that are characterized by a positive feedbackloop. Countercyclical measures and leaning againstthe wind may, therefore be necessary. Second, thereis renewed emphasis on integrating behaviouralfactors with mainstream economics and finance tomake theory correspond more closely with the realworld situation.
136 Economic Survey 2010-11
Website: http://indiabudget.nic.in
6.11 Third, there is increasing recognition that aprudent regulatory and supervisory framework isnecessary for smooth functioning of the markets. Atthe same time, coordination among regulatoryagencies of different countries is necessary tominimize the risk of regulatory arbitrage. Fourth,macro prudential regulation that takes a top downapproach to regulation is the new policy buzzword,as is evident from the recently announced Basel IIIrules that include countercyclical buffer and leveragerestrictions on bank capital to ensuremacroeconomic stability.
6.12 In the back drop of such uncertainty and effortsat stabilization, most emerging economies continueto perform well with high growth rates that signify ameasure of decoupling with the advancedeconomies. This is mainly because (i) manyemerging economies went through an introspectionand correction phase after the series of crises in1980s and 1990s, leading to lowering of externaland public debt levels, streamlining of publicexpenditure and institution building; (ii) emergingeconomies had minimal exposure to toxic assetsthat were responsible for the origin and spread ofthe crisis; and (iii) financial innovations likeCollateralized Debt Obligations (CDOs) and creditdefault swaps that contributed significantly to thecrisis, had made limited inroads in emergingeconomies.
6.13 India has been more fortunate in that (a) itsgrowth was largely domestic economy driven; (b)the calibrated approach to capital accountliberalization prevented interest arbitrage seekingsurge and reversal of capital flows; (c) strictsupervision of banks prevented exposure to toxicassets abroad and excessive lending to the realestate sector that insulated banks from the fallout ofpricking of the real estate bubble; (d) credit derivativeinstruments like credit default swaps that played thekey role in precipitating the crisis, are yet to beintroduced in the market.
BALANCE OF PAYMENTS
6.14 Balance of payment (BoP) comprises currentaccount, capital account, errors and omissions andchanges in foreign exchange reserves. Under currentaccount of the BoP, transactions are classified intomerchandise (exports and imports) and invisibles.Invisible transactions are further classified intothree categories, namely (a) Services–travel,transportation, insurance, Government not included
elsewhere (GNIE) and miscellaneous (such as,communication, construction, financial, software,news agency, royalties, management and businessservices), (b) Income, and (c) Transfers (grants, gifts,remittances, etc.) which do not have any quid proquo.
6.15 Under capital account, capital inflows can beclassified by instrument (debt or equity) and maturity(short or long-term). The main components of capitalaccount include foreign investment, loans andbanking capital. Foreign investment comprisingforeign direct investment (FDI) and portfolioinvestment consisting of foreign institutional investors(FIIs) investment, American Depository Receipts /Global Depository Receipts (ADRs/GDRs)represents non-debt liabilities, while loans (externalassistance, external commercial borrowings andtrade credit) and banking capital including non-resident Indian (NRI) deposits are debt liabilities.
6.16 BoP developments during 2009-10 indicatethat despite lower trade deficit, current account deficitwidened on account of slowdown in invisible receipts.There was also sharp increase in capital flows, whichled to accretion in foreign exchange reserves. Thecurrent account deficit of 2.8 per cent of the grossdomestic product (GDP) in 2009-10 vis-a-vis 2.3 percent in 2008-09, however remained well withinmanageable limits. The net capital flows increasedsubstantially to 3.8 per cent of GDP in 2009-10 ascompared to 0.5 per cent in 2008-09. This led to netaccretion of US$ 13.4 billion in foreign exchangereserves on BoP basis, as against the net outflow ofUS$ 20.1 billion in 2008-09.
6.17 BoP in 2009-10 had contrasting ramificationsfor economic recovery. The decline in exports ofgoods and services in response to weak globaldemand had a dampening impact on overall GDPgrowth. However, a higher current account deficit ledto stronger absorption of foreign capital. This impliedhigher investment activity financed by foreign capital,which partly contributed to the stronger recovery ingrowth. Major determinants of BoP transactions-such as external demand, international oil andcommodity prices, pattern of capital flows and theexchange rate changed significantly during thecourse of the year. With the turnaround in exportsand revival in capital flows, external sector concernsreceded gradually in the second half of 2009-10.
6.18 As per the latest data available, the highlightsof BoP developments during the first half (H1 – April-September 2010) of 2010-11 were higher trade and
137Balance of Payments
Website: http://indiabudget.nic.in
current account deficits as well as capital flows vis-a-vis the first half of 2009-10 (Table 6.1).
CURRENT ACCOUNT
Merchandise trade
6.19 India’s current account position during 2009-10 continued to reflect the impact of the globaleconomic downturn and deceleration in world tradewitnessed since the second half of 2008-09. On aBoP basis, India’s merchandise exports of US$ 182.2billion during 2009-10 posted a decline of 3.6 per
cent, as against US$ 189.0 billion in 2008-09, whichrecorded a positive growth of 13.7 per cent over theexports of US$ 166.2 billion in 2007-08. Similarly,import payments of US$ 300.6 billion also recordeda decline of 2.6 per cent in 2009-10, as compared toUS$ 308.5 billion in 2008-09, which was 19.8 percent higher than the imports of US$ 257.6 billion in2007-08. Though the decline in exports was relativelyhigher than that in imports, the merchandise tradedeficit in absolute terms decreased marginally toUS$ 118.4 billion (8.6 per cent of GDP) during2009-10 from US$ 119.5 billion (9.8 per cent ofGDP) in 2008-09.
Table 6.1: Balance of Payments : Summary (US$ million)
Source: Reserve Bank of India (RBI). PR: Partially Revised. P: Preliminarya includes among others delayed export receipts and rupee debt service.b Overall balance includes total current account balance, capital account balance and errors and omissions.
138 Economic Survey 2010-11
Website: http://indiabudget.nic.in
6.20 Commodity-wise analysis of India’s exportsindicated that the share of primary products in totalexports increased by 100 basis points from 13.9 percent in 2008-09 to 14.9 per cent in 2009-10. Similarly,the share of petroleum, crude and products (includingcoal) increased from 14.9 per cent to 15.8 per centduring the same period. The higher growth rate of3.8 per cent in primary products in 2009-10 (asagainst 1.7 per cent in 2008-09) and 2.3 per cent inpetroleum (as against negative growth of 3.0 per centin 2008-09) were responsible for increase in the shareof these in 2009-10. The share of manufacturedgoods, however, decreased from 68.9 per cent in2008-09 to 67.2 per cent in 2009-10 due to negativegrowth of 5.9 per cent in 2009-10, as against 23.1per cent growth in 2008-09. Among import items,the share of petroleum, oil and lubricants (POL)declined to 30.2 per cent in 2009-10, as against 31.3per cent in 2008-09 on account of negative growth of7.0 per cent in 2009-10. The other major componentof imports was gold and silver, whose share increasedby 100 basis points from 9.3 per cent in 2008-09 to10.3 per cent in 2009-10, because of a higher growthrate of 35.5 per cent in 2009-10 as against 22.3 percent in 2008-09. The detailed analysis of the tradeperformance of India is dealt with in the next chapter.
6.21 The widening of India’s current account deficitduring the first half of 2010-11(April-September 2010)reflects the impact of the growth asymmetry betweenIndia and the rest of the world. India’s exports andimports growth momentum, which started during thesecond half of 2009-10, continued during the firsthalf of 2010-11 also. On BoP basis, India’smerchandise exports during the first quarter (Q1-April-June 2010) and Q2 (July-September 2010) of2010-11 recorded a growth of 43.6 per cent and 25.0per cent respectively, as against a decline of 31.8per cent and 19.1 per cent in the correspondingquarters of 2009-10. During H1 of 2010-11, exportsrecorded a growth of 33.8 per cent as againstnegative growth of 25.7 per cent during thecorresponding period of the previous year. Similarly,imports witnessed a growth of 34.2 per cent and22.8 per cent during the first two quarters of 2010-11, as against a decline of 20.8 per cent and 21.3per cent recorded during the corresponding quartersof 2009-10. Imports posted a growth of 28.2 percent during the first half of 2010-11, as compared tonegative growth of 21.1 per cent during H1 of 2009-10. The rising imports of oil, pearls, and semi-precious stones have contributed significantly to aburgeoning import bill. Rising crude oil prices, alongwith growth in quantity of oil imports, has led to a
higher oil import bill during the first half of 2010-11.Despite the higher export growth compared toimports during April-September 2010-11, the tradedeficit widened in absolute terms by 19.7 per centto US$ 66.9 billion in the first half of 2010-11, ascompared to US$ 55.9 billion during the same periodlast year.
Invisibles6.22 The invisibles account of BoP reflects thecombined effect of transactions relating tointernational trade in services, income associatedwith non-resident assets and liabilities, labour,property and cross-border transfers, mainlyworkers’ remittances. Two components of thecurrent receipts namely software services andworkers’ remittances, continued to remain relativelyresilient in 2009-10, as was the case in 2008-09,despite the global economic meltdown and weremainly responsible for the net invisible surplus.
6.23 Invisibles receipts of US$ 163.4 billion in2009-10 recorded a decline of 2.6 per cent overUS$ 167.8 billion in 2008-09 (as against an increaseof 12.7 per cent in 2008-09 over US$ 148.9 billionin 2007-08), mainly due to lower receipts undermiscellaneous services such as business, financial,and communication services, together with lowerinvestment income. Receipts under all thecomponents of business services (such as trade-related services, business and managementconsultancy services, architectural, engineering andother technical services, and services relating tomaintenance of offices abroad) showed a declineduring 2009-10 reflecting lagged impact of the globalcrisis. Receipts under investment income declinedto US$ 12.1 billion in 2009-10 from US$ 13.5 billionin the previous year on account of significant declinein interest rates abroad.
6.24 Software receipts at US$ 49.7 billion however,showed an increase of 7.4 per cent in 2009-10(14.9 per cent a year earlier). Private transferreceipts, comprising mainly remittances fromIndians working overseas also increased to US$53.9 billion in 2009-10 (3.9 per cent of GDP) fromUS$ 46.9 billion (3.8 per cent of GDP) in theprevious year. Private transfer receipts constituted15.6 per cent of current receipts in 2009-10 (13.1per cent in 2008-09).
6.25 Invisible payments increased by 9.4 per centfrom US$ 76.2 billion in 2008-09 to US$ 83.4 billionin 2009-10 due to increase in payments under allthe components except software services, transfersand investment income. As a result, the net invisible
139Balance of Payments
Website: http://indiabudget.nic.in
balance (receipts minus payments) of US$ 80.0billion (5.8 per cent of GDP) in 2009-10 posted anegative growth of 12.7 per cent over US$ 91.6 billion(7.5 per cent of GDP) in 2008-09. The net receiptsunder the services component (travel, transportation,insurance, G.N.I.E. miscellaneous) went down by33.8 per cent from US$ 53.9 billion in 2008-09 toUS$ 35.7 billion in 2009-10. However, softwareservices registered a positive growth of 10.3 per centduring the same period from US$ 43.7 billion to US$48.2 billion. The other component of invisibles whichposted a positive growth was transfers (private aswell as official). The net private transfers of US$ 52.1billion in 2009-10 were higher by16.8 per cent fromUS$ 44.6 billion in 2008-09.
6.26 The impact of growth asymmetry between Indiaand the rest of the world was observed in India’sinvisibles account in the current fiscal 2010-11,leading to moderation in net invisibles balance in H1of 2010-11(April-September 2010). This moderationwas primarily due to the decline in investment incomeand private transfer receipts and increase in servicespayments.
6.27 The net invisibles surplus was lower by 8.0per cent at US$ 39.1 billion during H1 of 2010-11 asagainst US$ 42.5 billion during the correspondingperiod of 2009-10, essentially due to higher invisiblepayments (which recorded a growth of 33.4 per centas against a decline of 4.1 per cent a year earlier)driven by all major categories of services and declinein gross investment income receipts. Servicespayments increased by 46.9 per cent (against adecline of 4.7 per cent a year ago) mainly due tohigher payments under travel transportation, businessand financial services.
6.28 On the other hand, a significant decline inreceipts under investment income and privatetransfers offset, to a large extent, the increase inservices exports. Investment income receiptsdeclined sharply by 40.1 per cent (as compared to amarginal decline a year before) mainly due to thepersistence of lower interest rates abroad. Privatetransfer receipts at US$ 27.2 billion also recorded adecline of 1.1 per cent (as against an increase of4.3 per cent a year earlier). However, services exportswitnessed a major turnaround during the period,recording a growth of 27.4 per cent (as against adecline of 16.8 per cent a year earlier) led by all themajor components of services such as business,financial, software, travel and transportation services.Reflecting this, invisible receipts recorded a growth
of 11.1 per cent as against a decline of 8.9 per centa year earlier. However, as the growth in invisiblespayments was higher than the invisibles receipts,net invisibles surplus stood lower during April-September 2010, as compared with thecorresponding period of the previous year. Netinvisibles surplus financed about 58.3 per cent ofthe trade deficit during April-September 2010, asagainst 76.1 per cent during the same period lastyear.
6.29 The goods and services balance i.e. tradebalance plus services, increased by 25.9 per centfrom US$ 65.6 billion (5.4 per cent of GDP) in 2008-09 to US$ 82.6 billion (6.0 per cent of GDP) in 2009-10, on account of the decrease in net servicesreceipts by 33.8 per cent to US$ 35.7 billion in 2009-10 from US$ 53.9 billion in 2008-09. During the firsthalf of 2010-11, the goods and services deficitwidened by 28.8 per cent to US$ 47.4 billion fromUS$ 36.8 billion during the first half of 2009-10, onaccount of widening of the trade deficit while the netservices receipts remained at more or less the samelevel (Tables 6.1 and 6.2).
Current account balance
6.30 As a consequence of the decline in invisiblesurplus, despite the lower trade deficit, the currentaccount deficit increased by 37.5 per cent in 2009-10 to US$ 38.4 billion (2.8 per cent of GDP)from US$ 27.9 billion (2.3 per cent of GDP) in2008-09. Similarly, the lower invisible surpluscombined with higher trade deficit during the firsthalf of 2010-11 led to more than doubling of thecurrent account deficit to US$ 27.9 billion fromUS$ 13.3 billion during April-September 2009-10(Figures 6.1 and 6.2).
CAPITAL ACCOUNT
6.31 Stronger recovery in India, ahead of the globalrecovery along with positive sentiments of globalinvestors about India’s growth prospects, encourageda revival in capital flows during 2009-10. Theturnaround was mainly driven by large inflows underFIIs and short-term trade credits. The gross capitalinflows at US$ 345.7 billion during 2009-10 were 10.2per cent higher than the US$ 313.6 billion in 2008-09, while gross capital outflows at US$ 292.3 billionwere lower by 4.8 per cent from US$ 306.9 billion in2008-09. As a result, net capital flows at US$ 53.4billion (3.8 per cent of GDP) were much higher during2009-10 as compared to US$ 6.8 billion(0.5 per cent of GDP) in 2008-09.
140 Economic Survey 2010-11
Website: http://indiabudget.nic.in
Table 6.2 : Selected Indicators of the External Sector
20 Total Capital Account (net) 3.0 4.7 8.6 0.5 3.8 3.9 4.8
Source: RBI PR: Partially Revised. P: PreliminaryTC: Total Capital Flows (net); ECBs: External Commercial Borrowings;FER: Foreign Exchange Reserves; GDPmp: Gross Domestic Product at current market prices.
-12
-10
-8
-6
-4
-2
0
2
4
6
8
10
2005-06 2006-07 2007-08 2008-09
As
per
cent
of
GD
P
Currentaccountbalance
Current account balance, goods and services balance, trade balance,invisibles balance and net capital inflows as a per cent of GDP during2005-06 to 2009-10
Figure 6.1
Year
2009-10
-1.2 -1.0 -1.3-2.3 -2.8
-3.4 -3.4 -4.2-5.4-6.2 -6.5
-7.4
-9.8
5.0 5.5 6.17.5
5.8
3.04.7
8.6
0.5
3.8
-6.0
-8.6
Goods &servicesbalance
Tradebalance
Invisiblesbalance
Net capitalinflows
141Balance of Payments
Website: http://indiabudget.nic.in
6.32 Both inward as well as outward FDI showeddeclining trend in 2009-10 vis-a-vis 2008-09. Theinward FDI declined by 12.4 per cent to US$ 33.1billion in 2009-10 from US$ 37.8 billion in 2008-09.Similarly, outward FDI declined by 19.6 per cent fromUS$ 17.9 billion in 2008-09 to US$ 14.4 billion in2009-10. Consequently, the net FDI (inward FDIminus outward FDI) was marginally lower at US$18.8 billion in 2009-10, as compared with US$ 19.8billion in 2008-09. The FDI was channelled mainlyinto manufacturing followed by construction, financialservices and the real estate sector.
6.33 Portfolio investment witnessed net inflow ofUS$ 32.4 billion in 2009-10 as against a net outflowof US$ 14.0 billion in 2008-09. The attractivedomestic market conditions facilitated net FII inflowsof US$ 29.0 billion in 2009-10 (as against net outflowof US$ 15.0 billion in 2008-09). At US$ 3.3 billion,the ADRs / GDRs remained at the same level in2009-10 as in 2008-09. Net ECBs slowed down toUS$ 2.8 billion (US$ 7.9 billion in 2008-09) mainlydue to increased repayments.
6.34 The net short-term trade credits to Indiaincreased significantly to US$ 7.6 billion in 2009-10from net outflows of US$ 2.0 billion a year earlier,reflecting international confidence in domesticimporters. After recording net inflows under non-resident deposits during the first three quarters, therewere outflows during the last quarter of the 2009-10.Overall net non-resident deposits inflows stood lowerat US$ 2.9 billion during 2009-10 as compared toUS$ 4.3 billion during 2008-09.
6.35 Net capital inflows increased significantlyduring H1 of 2010-11, mainly due to FII inflows, short-term trade credits and ECBs. Net FII inflows werehigher at US$ 22.3 billion during April-September2010 as compared to US$ 15.3 billion a year earlierreflecting attractive returns in Indian stock markets.Inflows under short-term trade credits and ECBsincreased significantly on the back of strong domesticdemand and persistence of higher interest ratedifferentials between India and abroad. Accordingly,short-term trade credits increased to US$ 6.7 billionduring April-September 2010 as against a marginaloutflow witnessed during the corresponding periodof 2009-10. Net inflows under ECBs to India increasedto US$ 6.3 billion as compared to US$ 0.8 billion ayear earlier. The large increase in these inflows wasconsiderably offset by the moderation in net FDI toUS$ 5.3 billion during H1 of 2010-11 as againstUS$ 12.3 billion during the corresponding period of2009-10 due to decline in inward FDI. The inwardFDI declined by 36.4 per cent from US$ 19.8 billionduring H1 of 2009-10 to US$ 12.6 billion during H1of 2010-11. However, outward FDI remained atmore or less the same level at US$ 7.2 billion duringH1 of 2010-11, as compared to US$ 7.4 billion inH1 of the previous year. The share of net FDI innet capital flows also declined from 53.7 per cent inH1 of 2009-10 to 14.6 per cent in the first half ofthe current fiscal. With capital account surplusbeing higher than the current account deficit, theoverall balance was in surplus at US$ 7.0 billion,which resulted in a net accretion to foreignexchange reserves of an equivalent amount during
-12
-10
-8
-6
-4
-2
0
2
4
6
8
10
2009-10 H1 (Apr - Sep 2009)
As
per
cent
of
GD
PCurrent account balance, goods and services balance, trade balance,invisibles balance and net capital inflows as a per cent of GDP during H1of 2009-10 and 2010-11
Figure 6.2
Year
2010-11 H1 (Apr - Sep 2010)
-2.2-3.7
-6.2 -6.2
-9.4
7.2
3.94.8
-8.8
5.1Currentaccountbalance
Goods &servicesbalance
Tradebalance
Invisiblesbalance
Net capitalinflows
142 Economic Survey 2010-11
Website: http://indiabudget.nic.in
H1 of 2010-11 as compared to US$ 9.5 billion duringH1 of 2009-10.
6.36 As per the latest available information oncapital inflows, FDI inflows at US$ 19.0 billion werealmost at the same level during April-November 2010as it was during the corresponding period of theprevious year. Portfolio investment including FIIinflows, however, increased sharply to US$ 32.8billion during April-November 2010 from US$ 22.2billion a year earlier. The surge in FIIs could beattributed to relatively sound economic fundamentalsand increased international liquidity due to easymonetary policies followed by many advancedcountries.
6.37 The salient features of the BoP during2009-10 and in the first half of the current fiscal havebeen higher current account deficit due to lower netinvisibles surplus and large net capital inflows mainlyon account of higher inflows under portfolioinvestments and short-term trade credits, leading tonet accretion of foreign exchange reserves on BoPbasis.
FOREIGN EXCHANGE RESERVES
6.38 Foreign exchange reserves are an importantcomponent of the BoP and an essential element inthe analysis of an economy’s external position.India’s foreign exchange reserves comprise foreigncurrency assets (FCAs), gold, special drawing rights(SDRs) and reserve tranche position (RTP) in theInternational Monetary Fund (IMF). The level of foreignexchange reserves is largely the outcome of the RBI’sintervention in the foreign exchange market tosmoothen exchange rate volatility and valuationchanges due to movement of the US dollar againstother major currencies of the world. Foreignexchange reserves are accumulated when there isabsorption of the excess foreign exchange flows bythe RBI through intervention in the foreign exchangemarket, aid receipts, interest receipts, and fundingfrom institutions such as the International Bank forReconstruction and Development (IBRD), AsianDevelopment Bank (ADB) and InternationalDevelopment Association (IDA). Both the US dollarand the euro are intervention currencies. Foreigncurrency assets are maintained in major currencieslike the US dollar, euro, pound sterling, Australiandollar and Japanese yen. Reserves are denominatedand expressed in the US dollar, which is theinternational numeraire for the purpose.
6.39 The twin objectives of safety and liquidity arethe guiding principles of foreign exchange reservesmanagement in India, with return optimization being
embedded strategy within this framework. Theaftermath of the global financial crisis has, however,triggered a debate on the costs of building up foreignexchange reserves as a self-insurance mechanism.It needs to be acknowledged that foreign exchangereserves have helped insulate India from the worstimpact of the crisis. There is an argument that amultilateral option of a pre-arranged line of credit thatcan be easily and quickly accessed can be asubstitute for costly self-insurance. Such amultilateral option, however is necessary but notsufficient, as foreign investors often view the size offoreign exchange reserves as a key input in takinginvestment decisions.
6.40 In evaluating the level of reserves and thequantum of self insurance of a country, it is alsoimportant to distinguish between countries wherereserves are a consequence of current accountsurpluses and economies with current accountdeficits where reserves are a result of capital inflowsin excess of their economy’s absorptive capacity.India falls in the latter category, wherein reservescomprise mainly portfolio (FIIs) investment, whichare more vulnerable to sudden stops and reversalsand borrowings from abroad.
India’s foreign exchange reserves6.41 Beginning from a low level of US$ 5.8 billionat the end of March 1991, India’s foreign exchangereserves gradually increased to US$ 25.2 billion byend-March 1995, US$ 38.0 billion by end-March2000, US$ 113.0 billion by end-March 2004 and US$199.2 billion by end-March 2007. The reservesreached their peak at US$ 314.6 billion at end-May2008, before declining to US$ 252.0 billion at theend of March 2009. The decline in reserves in 2008-09 was inter alia a fallout of the global crisis andstrengthening of the US dollar vis-à-vis otherinternational currencies. During 2009-10, the level offoreign exchange reserves again increased to US$279.1 billion at the end of March 2010, mainly onaccount of valuation gain as the US dollardepreciated against most of the major internationalcurrencies. The component-wise details of foreignexchange reserves from 1950-51 to 2010-11 (up toDecember 2010) in rupee and US dollar are given inAppendices 6.1(A) and 6.1(B).
6.42 During 2009-10, of the total US$ 27.0 billionincrease in foreign exchange reserves, US$ 13.6billion was on account of valuation gain and balanceUS$ 13.4 billion was on BoP basis (Table 6.3). Theincrease in foreign exchange reserves during thisperiod also includes SDR allocations made by the
143Balance of Payments
Website: http://indiabudget.nic.in
Table 6.3 : Sources of Variation in Foreign Exchange Reserves on BoP Basis and ValuationEffect (US$ billion)
Sl. Items April-September
No. 2008-09 2009-10PR 2009-10PR 2010-11P
1 2 3 4 5 6
I Current Account Balance (-) 27.9 (-) 38.4 (-) 13.3 (-) 27.9
II Capital Account (net) (a to g) 7.9 51.8 22.7 33.1
a Foreign Investment (i+ii) 5.8 51.2 30.3 29.1
(i) FDI 19.8 18.8 12.3 5.3
(ii) Portfolio Investment (-) 14.0 32.4 17.9 23.8
of which:
FIIs (-) 15.0 29.0 15.3 22.3
ADRs/GDRs 1.2 3.3 2.7 1.6
b External Commercial Borrowings 7.9 2.8 0.7 6.0
c Banking Capital (-) 3.2 2.1 1.0 0.8
of which: NRI Deposits 4.3 2.9 2.9 2.2
d Short-term Trade Credit (-) 2.0 7.6 -0.1 6.7
e External Assistance 2.4 2.9 1.0 3.0
F Other Items in Capital Account* (-) 4.1 (-) 13.1 (-)10.2 (-)10.7
g Errors and Omissions 1.1 (-) 1.6 (-) 0.1 (-)1.8
h Overall balance (I+II) (-) 20.1 13.4 9.5 7.0
III Reserve Change on BoP Basis (+) 20.1 (-) 13.4 (-) 9.5 (-)7.0[Increase (-) / Decrease (+) ]
IV Valuation Change (-) 37.6 13.6 19.8 6.8Total Reserve Change (III+IV) (-) 57.7 27.0 29.3 13.8(Increase in reserves (+) /Decrease in reserves (-))
Source: RBI PR: Partially Revised. P: PreliminaryNote: *: ‘Other items in capital account’ include SDR allocations, leads and lags in exports, funds held abroad,
advances received pending issue of shares under FDI and transactions of capital receipts not includedelsewhere and rupee debt service. As per the BoP compilation practice, an increase in reserves isindicated by (-) sign and a decrease by (+) sign. For other items (+) sign indicates increase and (-) signmeans decrease. Difference, if any, is due to rounding off.
IMF to India in two consecutive tranches of SDR3,082.5 million (equivalent to US$ 4,821 million)under the general allocation on 28 August, 2009and SDR 214.6 million (equivalent to US$ 340 million)under special allocations on 9 September, 2009 and
purchase of 200 metric tonnes of gold from the IMFby the RBI, under the IMF’s limited gold salesprogramme at the cost of US$ 6.7 billion in November2009, as part of its foreign exchange reservesmanagement operation.
275
280
285
290
295
300
270
US$
billi
on
Foreign exchange reservesFigure 6.3
Foreignexchangereserves
Year
Mar
201
0
Apr 2
010
May
201
0
Jun
2010
Jul 2
010
Aug
2010
Sep
2010
Oct 2
010
Nov
2010
Dec
2010
144 Economic Survey 2010-11
Website: http://indiabudget.nic.in
Table 6.4 : Summary of changes in foreign exchange reserves (US$ billion)
Sl. Year Foreign exchange Total Increase / Increase/decrease Increase/decreaseNo. reserves at the decrease in in reserves in reserves due
end of financial reserves over on a BoP to valuation year (end March) previous period basis effect
Source: RBI.Note: Figures in parentheses indicate percentage share in total change.
6.43 In the current fiscal 2010-11, on month-on-month basis, foreign exchange reserves have shownan increasing trend. The reserves increased byUS$ 18.2 billion from US$ 279.1 billion at the end ofMarch, 2010 to US$ 297.3 at the end of December,2010 (Figure 6.3). This level of reserves providesabout 10 months of import cover.
6.44 A summary of changes in the foreignexchange reserves since 2005-06, with abreakdown into increase/decrease on BoP basisand valuation effect is presented in Table 6.4.
6.45 Foreign Currency Assets (FCAs) are themajor constituent of foreign exchange reserves inIndia. FCAs increased by US$ 13.1 billion (5.1 percent) from US$ 254.7 billion at end-March 2010 toUS$ 267.8 billion at end-December 2010. Theincrease was largely attributed to valuation gain,aid receipts and purchase of US dollar by theReserve Bank of India.
6.46 In line with the principles of preserving thelong-term value of the reserves in terms ofpurchasing power, minimizing risk and volatility inreturns and maintaining liquidity, the RBI holds FCAsin major convertible currency instruments. Theseinclude deposits of other countries’ central banks,the Bank for International Settlements (BIS) andtop-rated foreign commercial banks, and securitiesrepresenting debt of sovereigns and supranationalinstitutions with residual maturity not exceeding 10years, to provide a strong bias towards capital
preservation and liquidity. The annualized rate ofreturn, net of depreciation, on the multi-currencymulti-asset portfolio of the RBI declined from 4.2 percent in 2008-09 to 2.1 per cent in 2009-10.
6.47 Country-wise details of foreign exchangereserves show that India is the fourth largest foreignexchange reserve holder in the world, after China,Japan and Russia (Table 6.5).
Table 6.5 : Foreign exchange reserves ofsome major countries
Sl. Country Foreign exchangeNo. reserves
(US$ billion)
1 2 3
1 China (June 2010) 2,454.3
2 Japan (December 2010) 1,118.8
3 Russia (December 2010) 479.4
4 India (December 2010) 297.3
5 Korea (October 2010) 293.5
6 Brazil (November 2010) 285.5
7 China P R Hong Kong 268.8(December 2010)
8 Singapore (December 2010) 225.8
9 Germany (December 2010) 216.6
10 France (December 2010) 188.3
11 Italy (October 2010) 157.4
Source: IMF except for China;
For China: www.safe.gov.cn.
145Balance of Payments
Website: http://indiabudget.nic.in
6.48 A comparative picture of foreign exchangereserves and import cover, as measured by the ratioof foreign exchange reserves to import of goodsand services for select country groups and countriesincluding India is presented in Table 6.6. Among thecountry groups, “Developing Asia” and the “MiddleEast” accumulated reserves during the period 2005-09, leading to steady improvement in the ratio ofreserves to import of goods and services.
EXCHANGE RATES
6.49 The exchange rate policy is guided by thebroad principles of careful monitoring andmanagement of exchange rates with flexibility, whileallowing the underlying demand and supplyconditions to determine its movements over a periodin an orderly manner. Subject to this predominantobjective, RBI intervention in the foreign exchangemarket is guided by the goals of reducing excessvolatility, preventing the emergence of destabilizingspeculative activities, maintaining adequate levelsof reserves, and developing an orderly foreignexchange market.
6.50 During 2009-10, on the back of capital inflowsand positive growth outlook, the Indian rupeegenerally appreciated against the US dollar, thoughmarked by intermittent depreciation pressures. Aneasy supply situation in the market also led tomoderation in forward premia.
6.51 On a point-to-point basis, the rupee that stoodat 50.95 per US dollar on 31 March 2009, displayeda two-way movement with generally appreciating trendin the second half of 2009-10. The appreciation ofthe rupee in 2009-10 was generally led by FII inflows,driven by strong macroeconomic performance andbetter return. The growth in exports, continued capitalinflows and weakening of the US dollar against someof the major currencies contributed to appreciatingpressure on the rupee, taking the rupee-US dollarexchange rate to ̀ 45.14 per US dollar by end-March2010.
6.52 The Rupee/US dollar exchange ratemarginally appreciated by 0.7 per cent to ` 44.81per dollar between 31 March 2010 and 31 December2010. Over the same period, the rupee hasexperienced depreciation of 2.5 per cent against
Table 6.6 : International Comparison of Foreign Exchange Reserves (US$ billion) and Ratioof Reserves to Imports of Goods and Services
Sl. Country / Country 2005 2006 2007 2008 2009 2010 2011
No. Group (Projection) (Projection)
1 2 3 4 5 6 7 8 9
I Country
1 Russia 176.5 296.2 467.6 412.7 417.8 468.7 508.1
1 Developing Asia 201.1 248.5 330.0 335.5 393.0 459.4 508.2
(excluding China & (38.6) (42.5) (49.1) (41.8) (60.2) (58.2) (58.4)
India)
Source: World Economic Outlook Database, October 2010.
Note: Reserves are based on official holding of gold valued at SDR 35 an ounce. This convention results in amarked underestimation of reserves for countries that have substantial gold holdings.Figures in parentheses indicate ratio of reserves to imports of goods and services.
146 Economic Survey 2010-11
Website: http://indiabudget.nic.in
the Pound Sterling and 12.1 per cent against theJapanese yen, while it appreciated by 1.2 per centagainst the euro.
6.53 On annual average basis, rupee depreciatedagainst all major international currencies except thepound sterling in fiscal 2009-10. The annual averageexchange rate of the rupee was ` 45.99 per USdollar in 2008-09 and it depreciated by 3.0 per centto ̀ 47.42 in 2009-10. Similarly, the annual averageexchange rate of the rupee in 2008-09 was ̀ 65.06per euro and ` 46.20 per 100 Japanese yen, andit depreciated by 3.0 per cent and 9.6 per cent,respectively to ` 67.08 and ` 51.10 during2009-10. The annual average exchange rate of therupee per pound sterling however, showedappreciation of 3.2 per cent from ̀ 78.32 per poundsterling in 2008-09 to ̀ 75.89 in 2009-10.
6.54 The monthly average exchange rate of therupee has generally been range-bound, moving in
the range of ` 44-47 per US dollar between April-December 2010. The exchange rate of the rupee(monthly average of buying and selling by the ForeignExchange Dealer Association of India [FEDAI],depreciated by 1.5 per cent against US dollar from` 44.50 per US dollar in April 2010 to ` 45.16 perUS dollar in December 2010. Similarly, the rupeedepreciated by 3.2 per cent against the poundsterling, and 12.2 per cent against the Japaneseyen during the same period.
6.55 The month-wise exchange rate of the rupeeagainst major international currencies and the RBI’ssale/purchase of foreign currency in the foreignexchange market during 2010-11 are indicated inTable 6.7.
6.56 Appendix 6.5 presents the exchange rate ofthe rupee vis-à-vis select international currenciesyear-wise since 1980-81, and month-wise during2010-11.
Table 6.7 : Exchange Rates of Rupee per Foreign Currency and RBI’s Sale/Purchase ofUS Dollar in the Exchange Market During 2010-11
Annual/Monthly average exchange rates ( `̀̀̀̀ per foreign currency)*,
Month US$ Pound Euro Japanese RBI Net sale (-) /Sterling Yen** purchase (+)
Figures in parentheses indicate appreciation (+) and depreciation (-) over the previous month/year.
147Balance of Payments
Website: http://indiabudget.nic.in
NEER and REER6.57 The nominal effective exchange rate (NEER)and real effective exchange rate (REER) indices areused as indicators of external competitiveness ofthe country over a period of time. NEER is theweighted average of bilateral nominal exchange ratesof the home currency in terms of foreign currencies,while REER is defined as a weighted average ofnominal exchange rates adjusted for home andforeign country relative price differentials. REERcaptures movements in cross-currency exchangerates as well as inflation differentials between Indiaand its major trading partners. The RBI has beenconstructing six currency (US dollar, euro, poundsterling, Japanese yen, Chinese renminbi and HongKong dollar) and 36 currency indices of NEER andREER.
6.58 On a point-to-point basis, the six-currencytrade-based REER (base: 1993-94=100)appreciated by 20.0 per cent between March 2009and March 2010. In the current fiscal it appreciatedby 3.7 per cent between March 2010 and December2010. This indicates loss of competitiveness againstmajor trading partners, when inflation differentials
are taken into account. However, a significant shareof India’s foreign trade is invoiced and settled in USdollar. REER is less effective indicator of rupeecompetitiveness to that extent.
6.59 The six-currency trade-based NEER (base:1993-94=100) appreciated by 10.2 per centbetween March 2009 and March 2010 and by 0.3per cent between March 2010 and December 2010.As compared to this, the monthly average exchangerate of the rupee against the US dollar appreciatedby 12.6 per cent between March 2009 and March2010 and in the current fiscal by 0.8 per centbetween March 2010 and December 2010 (Table6.8 and Appendix 6.6).
US dollar exchange rate in internationalmarket
6.60 During 2009-10 (March 2009 – March 2010),the US dollar depreciated against major currencies.It fell by 4.9 per cent against the pound sterling, 1.7per cent against the euro, 7.4 per cent against theJapanese yen and 23.9 per cent against theAustralian dollar. The dollar however, gained somestrength against major currencies, especially in
Table 6.8 : Movement of Rupee and NEER and REER Indices during 2010-11
Month/year Rupee per Appreciation (+)/ NEER* REER* Appreciation (+)/ Appreciation (+)/US Dollar depreciation (-) depreciation (-) depreciation (-)
in Rupee per US in NEER over in REER overDollar over previous month previous month
December 2009, on the back of a pickup in economicactivity and market conditions turning more conduciveto economic growth in the USA. However, betweenend-March 2010 and end-December 2010, the USdollar depreciated by 3.3 per cent against the poundsterling, 10.7 per cent against the Japanese yen,and 11.1 per cent against the Australian dollar, whileappreciating by 1.2 per cent against the euro. Theappreciation against the euro could be attributed tothe sovereign debt problems in some of the membercountries of euro zone (Table 6.9).
EXTERNAL DEBT
6.61 India’s external debt stock stood at US$ 262.3billion ( ` 1,184,998 crore) at end-March 2010recording an increase of US$ 37.8 billion over end-March 2009 level of US$ 224.5 billion ( ̀ 1,143,951crore). Of the total increase, long-term debtaccounted for 28.7 billion, while short-term debt washigher by US$ 9.1 billion. Appendices 8.4(A) and8.4(B) present the disaggregated data on India’sexternal debt outstanding for the period from March1991 to September 2010 in Indian rupee and USdollar terms, respectively.
6.62 At end-September 2010, total external debtincreased by US$ 33.5 billion (12.8 per cent) to US$295.8 billion ( ` 1,332,195 crore) over end-March2010. The increase in India’s external debt was mainly
on account of higher commercial borrowings andshort-term debt. Taken together, these twocomponents contributed over 70 per cent of totalincrease in India’s external debt. The valuation effectarising from depreciation of the US dollar againstmajor international currencies contributed to anincrease of US$ 6.3 billion to the total increase.Excluding the valuation effect, the increase in externaldebt would have been US$ 27.2 billion.
6.63 The maturity profile of India’s external debtindicates the dominance of long-term borrowings.At the end of September 2010, the short-term debtat US$ 66.0 billion accounted for 22.3 per cent oftotal external debt, while the remaining 77.7 per centwas long-term debt (Table 6.10).
6.64 The long-term components, such ascommercial borrowings, NRI deposits andmultilateral borrowings constitute a significant shareof external debt. Taken together, these componentsaccounted for 60.5 per cent of total external debt atthe end of September 2010, while the remaining 17.2per cent was accounted by other components (i.e.,bilateral borrowings, export credit, IMF and rupeedebt). The share of commercial borrowings continuedto be the highest at 27.8 per cent in total externaldebt followed by NRI deposits (16.9 per cent) andmultilateral debt (15.8 per cent) (Table 6.11).
Table 6.9 : Exchange Rate of US dollar against International Currencies
6.65 The currency composition of India’s totalexternal debt shows that US dollar denominated debtaccounted for 53.9 per cent of total external debt atend-September 2010, followed by the Indian Rupee(18.8 per cent), Japanese Yen (11.8 per cent), SDR(9.8 per cent) and Euro (3.6 per cent). The currencycomposition of Government debt indicates pre-dominance of SDR denominated debt (39.9 per cent),which is attributable to borrowing from InternationalDevelopment Association (IDA) i.e., the soft loanwindow of the World Bank under the multilateral
agencies and SDR allocations by the InternationalMonetary Fund (IMF). The share of US dollardenominated debt was 28.1 per cent at the end ofSeptember 2010 followed by Japanese yendenominated (19.4 per cent) (Table 6.12).
6.66 The composition of India’s external debt hasundergone change over the years with shares ofboth multilateral and bilateral components showinga declining trend in long-term debt. There isincreasing share of private players in India’s totalexternal debt. Government (sovereign) external debt
Table 6.10 : India’s External Debt Stock
At end-March In US$ million In ` crore
Long-term Short-term Total Long-term Short-term Total
Source: Ministry of Finance and RBI.PR: Partially Revised; QE: Quick Estimates.
Table 6.11 : Composition of External Debt (Per cent to total external debt)
Sl. Component March March June September
No. 2009 PR 2010 PR 2010 PR 2010 QE
1 2 3 4 5 6
1 Multilateral 17.6 16.3 16.4 15.8
2 Bilateral 9.2 8.6 8.4 8.3
3 IMF 0.5 2.3 2.2 2.1
4 Export credit 6.4 6.4 6.4 6.2
5 Commercial Borrowings 27.8 27.4 27.3 27.8
6 NRI Deposits 18.5 18.3 17.6 16.9
7 Rupee Debt 0.7 0.6 0.6 0.6
8 Long-term debt (1 to 7) 80.7 80.0 78.8 77.7
9 Short-term debt 19.3 20.0 21.2 22.3
10 Total External Debt (8+9) 100.0 100.0 100.0 100.0
Source: Ministry of Finance and RBI.
PR: Partially Revised; QE: Quick Estimates.
150 Economic Survey 2010-11
Website: http://indiabudget.nic.in
stood at US$ 72.3 billion, while non-Government debtamounted to US$ 223.6 billion at end-September2010. The share of Government debt in total externaldebt declined from 25.6 per cent at end-March 2010to 24.4 per cent at end-September 2010. The ratioof Government external debt to GDP has remainedaround 5.0 per cent in the last four years.
6.67 Sovereign external debt is a small proportionof the overall public debt of the Government of India.
The bulk of sovereign debt is from domestic sources.In the domestic debt category also, a significantshare of dated securities is owned by commercialand co-operative banks and insurance companies.Given the composition of public debt and the factthat a sizeable share of banking and insurance is inthe public sector, the refinancing risk that has beenat the root of the euro zone crisis, is at best minimal(Box 6.2).
Table 6.12 : Currency Composition of India’s External Debt and Sovereign External Debt
Total external debt Sovereign external debt
Sl. Currency March March June Sept. March March June Sept.No. 2009PR 2010PR 2010PR 2010QE 2009PR 2010PR 2010PR 2010QE
1 2 3 4 5 6 7 8 9 10
1 US Dollar 54.1 53.4 54.9 53.9 29.6 26.5 28.8 28.1
4 Japanese Yen 14.3 11.4 11.5 11.8 19.9 18.6 18.7 19.4
5 Euro 4.1 3.6 3.3 3.6 5.2 4.3 3.8 4.0
6 Pound Sterling 2.0 1.8 1.7 1.7 0.1 0.0 0.0 0.0
7 Others 0.3 0.5 0.4 0.4 0.0 0.0 0.0 0.0
Total 100.0 100.0 100.0 100.0 100.0 100.0 100.0 100.0
Source : Ministry of Finance and RBI.
PR : Partially Revised. QE : Quick Estimates
Box 6.2 : India’s Sovereign Debt: Specific Attributes
There have been concerns about the level of public debt, with consolidated debt (Centre and State) at 78.8 per cent ofGDP as at end March 2010 (13th Finance Commission). For determining the vulnerability level of public debt, it isimportant however to look at the composition, refinancing requirements and the investor base. Following issueshighlight the specific attributes of Central Government public debt, which place it in a distinct class, making it lessvulnerable to market risks, as experienced in many advanced countries:
a) The share of sovereign external debt in total public debt was 10.8 per cent at end-September 2010. The bulk of the debtwas from multilateral and bilateral creditors with FIIs investment in Government securities accounting for less than1 per cent of total public debt. As India does not access international capital markets as a sovereign entity, therefinancing risk due to foreign commercial investors, which significantly contributed to the euro area sovereign debtcrisis, is therefore largely absent;
b) Domestic debt accounts for 89.2 per cent of the total Central Government sovereign debt. Out of this, 11.5 per cent isin non-marketable categories like securities issued to the National Small Savings Fund. The remaining 77.7 per cent ismarketable securities with 73.4 per cent in dated securities (long term) and 4.3 per cent in Treasury Bills (short term);
c) In the dated securities category, banks (including co-operative banks) accounted for 51.9 per cent and insurancecompanies (mainly Life Insurance Corporation) 22 per cent of the total debt. Given the Statutory Liquidity Ratio(SLR) requirement for banks and the fact that a significant share of banking and insurance sector remains in the publicsector, the refinancing risk, is at best minimal;
d) The average maturity of Central Government securities is nearly 10 years, making it less vulnerable to refinancing risk.
Despite the fact that the sovereign debt carries minimal refinancing and speculative risk, concerted efforts are underwayto lower the public debt levels to sustainable benchmarks through setting fiscal targets and the Medium Term FiscalPolicy Statement that are part of the Annual Budget of the Government of India.
151Balance of Payments
Website: http://indiabudget.nic.in
6.68 The key debt indicators show that India’sexternal debt to GDP ratio was 18.1 per cent (20.5per cent in 2008-09) and debt service ratio 5.5 percent during 2009-10 (4.4 per cent in 2008-09). India’sforeign exchange reserves provided a cover of 99per cent to the external debt stock at end-September2010 (106.4 per cent at end-March 2010). The ratioof short-term external debt to foreign exchangereserves was 22.5 per cent at end-September 2010as compared to 18.8 per cent at end-March 2010.The ratio of concessional debt to total external debtdeclined steadily and worked out to 15.6 per centat end-September 2010 as against 16.7 per cent atend-March 2010. The key external debt indicatorsare presented in Table 6.13.
6.69 The external debt management policy of theGovernment of India continues to focus on raisingsovereign loans on concessional terms with longermaturities, regulating ECBs through end-use andall-in-cost restrictions, rationalizing interest rates onNRI deposits and monitoring long as well as short-term debt.
International comparison
6.70 A cross country comparison of external debtof twenty most indebted developing countries, basedon the data given in the World Bank’s “GlobalDevelopment Finance, 2010”, showed that India wasthe fifth most indebted country, after the RussianFederation, China, Turkey, and Brazil, in 2008 interms of stock of external debt. The ratio of India’sexternal debt stock to gross national income (GNI)as of 2008 at 19.0 per cent was the fourth lowestwith China having the lowest ratio at 8.7 per cent.The element of concessionality in India’s externaldebt portfolio was fourth highest after Pakistan,Indonesia and the Philippines (Table 6.14).
6.71 In terms of the cover of external debt providedby foreign exchange reserves, India’s position wasfourth highest at 111.6 per cent after China, Thailandand Malaysia. A comparison of the share of short-term debt in total external debt across countriesreveals that India’s position was tenth lowest withPakistan having the lowest ratio.
Year External Total Debt- Foreign Concessional Short-term Short-termDebt External Service Exchange Debt to External Debt*(US$ Debt to Ratio Reserves Total Debt* to to total
billion) GDP to total External Foreign DebtExternal Debt Exchnage
debt Reserves
1 2 3 4 5 6 7 8
1990-91 83.8 28.7 35.3 7.0 45.9 146.5 10.2
1995-96 93.7 26.9 26.2 23.1 44.7 23.2 5.4
2000-01 101.3 22.5 16.6 41.7 35.4 8.6 3.6
2005-06 139.1 16.8 10.1# 109.0 28.4 12.9 14.0
2006-07 172.4 17.5 4.7 115.6 23.0 14.1 16.3
2007-08 224.4 18.0 4.8 138.0 19.7 14.8 20.4
2008-09 224.5 20.5 4.4 112.1 18.7 17.2 19.3
2009-10PR 262.3 18.1 5.5 106.4 16.7 18.8 20.0
End-June 2010 PR 272.9 - 3.9 101.0 15.9 21.0 21.2
End-Sept.2010 QE 295.8 - 3.8 99.0 15.6 22.5 22.3
Source: Ministry of Finance and RBI.
PR: Partially Revised. QE: Quick Estimates.- : Not worked out for the broken period. * : Short-term debt is based on original maturity.#: Works out to 6.3 %, with the exclusion of India Millennium Deposits (IMDs) repayments of US$ 7.1 billion and
pre-payment of US$ 23.5 million.
Note: Debt-service ratio is the proportion of gross debt service payments to External Current Receipts (net ofofficial transfers).
152 Economic Survey 2010-11
Website: http://indiabudget.nic.in
THE G206.72 The Group of Twenty (G20) was establishedin 1999 to bring together Finance Ministers andCentral Bank Governors of systemically importantindustrialized and developing economies to discusskey issues relating to the global economy andfinancial stability. By contributing to thestrengthening of the international financialarchitecture and providing opportunities for dialogueon national policies, international co-operation, andinternational financial institutions, the G-20 helps tosupport growth, financial stability and developmentacross the globe.
6.73 Since its inception, the G20 has held annualFinance Ministers and Central Bank Governors’
meetings and discussed measures to promotefinancial stability in the world and achieve sustainableeconomic growth and development.
6.74 In the wake of the global financial andeconomic crisis in 2008, the G20 was elevated to aLeaders Summit. It was designated as a premierforum for international economic cooperation in 2009,effectively replacing the G8 as a forum for steeringthe global issues. The move was considered amilestone in reforming global governance, makingit more inclusive since this forum comprises bothemerging as well as industrialized economies(Box 6.3).
6.75 Several landmark reforms of internationalfinancial institutions were initiated at the behest of
Table 6.14 : International Comparison of Top Twenty Developing Debtor Countries, 2008
Total Total debt to Short-term Foreign ConcessionalSl Countries External Gross to total Exchange to total
No. debt stock National external Reserves to external(US $ million) Income debt Total Debt debt
(per cent) (per cent) (per cent) (per cent)
1 2 3 4 5 6 7
1 Russian Federation 402,453 25.8 13.6 106.1 0.5
2 China 378,245 8.7 49.5 514.5* 10.8
3 Turkey 277,277 35.3 18.3 26.6 2.7
4 Brazil 255,614 16.2 14.3 75.8 1.4
5 India 230,611 19.0 19.6 111.6 20.5
6 Poland 218,022 42.1 29.8 28.5 0.2
7 Mexico 203,984 19.1 12.0 46.7 0.5
8 Indonesia 150,851 30.4 17.6 34.2 27.9
9 Argentina 128,285 39.9 29.2 36.2 1.6
10 Kazakhstan 107,595 95.0 9.9 18.5 1.1
11 Romania 104,943 54.7 29.7 37.9 1.5
12 Ukraine 92,479 51.7 22.1 34.1 1.6
13 Malaysia 66,182 35.1 34.5 139.3 6.5
14 Philippines 64,856 35.0 10.8 57.8 23.1
15 Thailand 64,798 32.0 37.4 171.3 11.1
16 Chile 64,277 41.3 23.2 35.9 0.3
17 Venezuela 50,229 16.0 33.8 85.7 1.0
18 Pakistan 49,337 28.7 2.8 18.3 60.6
19 Colombia 46,887 20.2 12.1 50.5 2.1
20 Latvia 42,108 127.3 33.5 12.5 0.3
Source: World Bank’s Global Development Finance, 2010.
*: Foreign exchange reserves data are sourced from State Administration of Foreign Exchange,Government of China.
Note: Countries are arranged based on the magnitude of debt presented in column no.3 in the Table.
153Balance of Payments
Website: http://indiabudget.nic.in
the G20 which heightened the expectation for bringingabout fundamental changes in the functioning of theglobal institutions and in the global governancestructure. India as a member of the G20 has beenactively engaged in global economic governance andin shaping the world order (Box 6.4).
Main Issues/Outcomes of G20 Summits
6.76 The most concerted response to the globaleconomic crisis came from the platform of the G20countries. G20 Leaders Summits have set theagenda rolling for both short and medium-term actionsto meet the crisis.
6.77 The first G20 Summit was held in November2008 in Washington DC under the shadow of thegreatest financial crisis in the post-war era. Itssignificant achievements were in the form of highlevel commitments to: reform international financialregulation; to expand the Financial Stability Forumand other major standard setting bodies; and to givegreater voice and representation to emerging anddeveloping countries in International FinancialInstitutions.
6.78 Four months later, G20 Leaders met again inLondon in April 2009, wherein they pledged to dowhatever was necessary to restore confidence,growth and jobs, promote global trade and investmentand reject protectionism. They also agreed toundertake unprecedented and concerted fiscalexpansion and monetary easing, and reached anagreement to provide over a trillion US dollar ofadditional resources to the global economy throughthe International Financial Institutions, of which 750billion US dollar was for the IMF.
6.79 The Third G20 Leaders’ Summit was held inPittsburgh, USA, on 24-25 September, 2009. Themajor outcomes related to (a) timelines for voiceand quota reforms in the World Bank and the IMF,(b) timelines for regulatory reform in the FinancialSector (c) launching of a Framework for StrongSustainable and Balanced Growth, (d) resolve tophase out and rationalize inefficient fossil fuelsubsidies, while protecting the interests of thepoorest, and (e) designating the G20 as the premiermultilateral forum for cooperation on economicissues.
6.80 The fourth G 20 Leaders’ Summit was held atToronto, Canada, on 26-27 June, 2010. Buildingon G20 achievements in addressing the globaleconomic crisis, leaders agreed on the next stepsthat the G20 countries should take to ensure a full
Box 6.4 : India and G 20
India is a member of the G20 since it was established asFinance Ministers Forum in 1999. India is the only G20member country from South Asia and one of the importantemerging market member countries in the G20.
Some important landmarks in India’s involvement in theG20 are:
G20 chair in 2002 and hosted G20 Finance Ministersand Central Bank Governors meeting in that year.
Co-chaired (represented by Deputy Governor, RBI)the G20 Working Group on Enhancing SoundRegulation and Strengthening Transparency (after theNovember 2008 Washington Summit).
Currently co-chair of the Working Group on G20Framework for Strong, Sustainable and BalancedGrowth along with Canada.
India is contributing to various thematic issues beingdeliberated in G20 such as:
Financial sector regulatory reforms
Climate change
IFIs reform
Growth and Fiscal Consolidation
Enhancing shareholding in forums such as FSB,IASB
Issues pertaining to Non-Cooperative Jurisdiction(Global Forum, FATF etc.)
Box 6.3 : G 20: Basic facts
The G20 comprises 19 countries - namely - Argentina,Australia, Brazil, Canada, China, France, Germany,India, Indonesia, Italy, Japan, Mexico, Russia, SaudiArabia, South Africa, the Republic of Korea, Turkey,the United Kingdom, the United States of Americaand the European Union which is represented by therotating Council presidency and the European CentralBank as the 20th member.
It represents 90 per cent of the global gross nationalproduct, 80 per cent of the world’s trade and two-third of the world’s population.
Five Summits at the level of G20 leaders or Head ofState have been held since breakout of the globaleconomic crisis in 2008.
Sl. Summit’s Month /No. Venue Year
1 Washington DC, USA 15 November, 2008
2 London, UK 2 April, 2009
3 Pittsburgh, USA 24-25 September, 2009
4 Toronto, Canada 26-27 June, 2010
5 Seoul, South Korea 11-12 November, 2010
The next G 20 Summit will be held in Cannes, Franceon 3-4 November, 2011.
154 Economic Survey 2010-11
Website: http://indiabudget.nic.in
return to growth with quality jobs, carry out growthfriendly fiscal consolidation, reform and strengthenfinancial systems, and create strong, sustainableand balanced global growth. Advanced economiescommitted to fiscal plans that will, at least halvedeficits by 2013 and stabilize or reduce governmentdebt-to-GDP ratios by 2016. In addition, there wasagreement on (i) strengthening social safety nets,enhancing corporate governance reform, financialmarket development, infrastructure spending, andgreater exchange rate flexibility in some emergingmarkets; (ii) pursuing structural reforms across theentire G-20 membership to increase and sustaingrowth prospects; and (iii) making more progresson rebalancing global demand. The leaders alsoagreed to renew for three years (until end 2013)the G20 commitment to refrain from raising barriersor imposing new restrictions on trade in goods and
services, imposing new export curbs or implementingWTO inconsistent measures to stimulate exports.Besides, the leaders agreed to support bringing theDoha Development Round to a balanced andambitious conclusion as soon as possible.
6.81 The fifth G 20 Summit was held in Seoul, SouthKorea, on 11 and 12 November, 2010. The summitwas notable for the increasing economic and politicalinfluence of the emerging economies and may wellbe indicative of the rebalancing of the globaleconomy. The earlier G-20 finance ministers’ meetingplayed an important role in mollifying the concern ofa possible currency war by pledging to move towardsmore market determined exchange rate systemsthat reflect underlying economic fundamentals andrefrain from competitive devaluation of currencies(Box 6.5).
Box 6.5 : Highlights of the Leaders’ Declaration of G 20 Summit held in Seoul, South Korea inNovember, 2010
Adoption of the Seoul Action Plan included country specific actions, to move closer to the shared objectives ofstronger, sustainable and balanced growth. The Plan includes commitment to:
a) Undertake macroeconomic policies, including fiscal consolidation to ensure ongoing recovery and sustainablegrowth and enhance the stability of financial markets, in particular moving towards more market determinedexchange rate systems, and refraining from competitive devaluation of currencies. Advanced economies, includingthose with reserve currencies, will be vigilant against excess volatility and disorderly movements in exchange rates;
b) Implement a range of structural reforms that boost and sustain global demand, foster job creation, and increasethe potential for growth; and
c) Enhance the Mutual Assessment Process (MAP) to promote external sustainability. To strengthen multilateralcooperation to promote external sustainability and pursue the full range of policies conducive to reducingexcessive imbalances and maintaining current account imbalances at sustainable levels. The leaders have taskedthe G 20 Framework Working Group (of which India is a co-chair along with Canada) with technical support of theIMF and other international organizations to develop indicative guidelines composed of a range of indicators thatwould serve as a mechanism to facilitate timely identification of large imbalances that require preventive andcorrective actions to be taken. Indicative Guidelines will then be put up for consideration of the G20 FinanceMinisters and Central Bank Governors in their April 2011 Ministerial.
Adoption of the Seoul Consensus for Development based on six principles (Focus on Economic Growth, GlobalDevelopment Partnership, Global or Regional Systemic Issues, Private Sector Participation, Complementarity and OutcomeOrientation) and nine pillars (Infrastructure, HRD, Trade, Private Investment in job creation, Financial Inclusion, Growth withResilience, Food Security, Governance and Knowledge sharing), including a multi-year action plan, and setting up of a HighLevel Panel (HLP) on Infrastructure.
Endorsement of the new instruments of the IMF for Global Financial Safety Nets, and the recent IMF work onimproving global capacity to cope with shocks of a systemic nature, including working with regional financingarrangements (RFAs). It also endorsed, amongst others, the use of macro prudential measures as a response tovolatile capital flows.
Endorsement of the Gyeongju G20 Finance Ministers and Central Bank Governors agreement on IMF reformsof a 6 per cent shift in quota in favour of under-represented and emerging market and developing countries (EMDCs),and a comprehensive review of quota formula by 2013 to better reflect the economic weights of EMDCs and completionof the next general review of quotas by January 2014.
Endorsement of the core elements of the new financial regulatory capital and liquidity framework (Basel III),and measures to better regulate the SIFIs on which work will continue. It was also agreed to work further on macroprudential policy frameworks, strengthen regulation and oversight of shadow banking, and regulate commodityderivates markets.
Recommit to resist all forms of protectionism, while recognizing that 2011 was a critical window of opportunity tointensify engagement to conclude the Doha Development Round.
Adopt the G20 Anti Corruption Action Plan.
155Balance of Payments
Website: http://indiabudget.nic.in
CHALLENGES
6.82 The continuing sovereign debt risk in peripheraleuro-zone countries and fear that it could spread tothe financial sector, together with the high fiscal andpublic debt in several advanced countries, poses arisk to global recovery. In the event of the crisisspreading, it could have fallout for the Indian economythrough reversal of capital flows and slowdown inexports.
6.83 Second, the fragile global recovery and therobust domestic growth have led to higher currentaccount deficit in 2009-10 and 2010-11 (April –September), which is a matter of some concern.
The problem may be further aggravated by the risinginternational oil prices.
6.84 Third, the periodic surge in capital flows couldlead to problem of absorptive capacity in theeconomy, fuelling asset price bubbles, currencyappreciation and stoking inflation. The challenge isin managing such surge in capital flows.
6.85 Fourth, the FDI inflows that are stable andproductive in nature, have declined from US$ 37.7billion in 2008-09 to US$ 33.1 billion in 2009-10 andUS$ 19.0 billion in the current fiscal (up to November2010). Moreover, the majority of the capital inflow isin the form of FIIs, which are volatile in nature. Stepshave to be taken to encourage FDI inflows vis-à-visother forms of capital.
International TradeCHAPTER
7
External trade growth collapsed in different countries in the tumultuous recession-ridden years of 2008 and 2009. The fall in trade, which was steeper than the declinein real GDP, was arrested in 2010, with trade growth recovering faster than real GDPgrowth. The recovery in trade growth has been made possible, in part, by the fiscalstimulus imparted by the governments and the low base of the preceding years.However, the extent of recovery differs substantially across countries and world traderemains below its pre-crisis level. India, which weathered the global crisis well, seemspoised to be among the few countries to surpass the earlier peak and even reach orsurpass the pre crisis trends in trade.
WORLD TRADE
7.2 The sudden and sharp decline in world tradefrom US $ 16 trillion in 2008 to US$ 12.4 trillion in2009 was followed by an impressive recovery in2010. World trade reached US$ 7.03 trillion in thefirst half of 2010, with a value growth of 24 percent. World trade volumes which fell by anunprecedented 10.7 per cent in 2009 have quicklyrecovered with a growth of 12 per cent in 2010 asper the International Monetary Fund’s (IMF), WorldEconomic Outlook (WEO), January 2011 (Table 7.1).
While this recovery is partially due to the base effect,the pickup in world output from the negative territoryof (-) 0.6 per cent in 2009 to a positive 5.0 per cent in2010 backed by the fiscal stimulus of differentcountries helped. As stated by the IMF, world traderemains below its pre-crisis trend and for someeconomies, particularly those hit by a banking crisis,it remains below pre-crisis levels. Growth in tradevolumes of emerging and developing economies in2010 was more robust than that of advancedeconomies, just as the fall in 2009 had been lesssevere.
Table 7.1 : Trends in growth in trade volumes(per cent change)
Projections
2009 2010 2011 2012
World Trade Volume (goods and services) –10.7 12.0 7.1 6.8
Imports
Advanced Economies –12.4 11.1 5.5 5.2
Emerging and Developing Economies –8.0 13.8 9.3 9.2
Exports
Advanced Economies –11.9 11.4 6.2 5.8
Emerging and Developing Economies –7.5 12.8 9.2 8.8
Source : IMF, World Economic Outlook, January 2011
Website : http://indiabudget.nic.in
157International Trade
Website : http://indiabudget.nic.in
7.3 Growth in world trade volume is expected tomoderate in 2011 and 2012 to 7.1 per cent and 6.8per cent respectively, as per IMF projections.However, the trade growth in emerging anddeveloping economies is expected to be more robustthan that in the advanced economies in 2011 and2012.
Trade Credit: International Scenario
7.4 While the global economic crisis adverselyaffected international trade, on the supply side thereis enough evidence to suggest that the financialcrisis might have reduced the availability of tradecredit. This could have resulted in a decline in thevolume of trade that would otherwise have takenplace even with the demand shock. Thus theshortage in trade credit might have deepened andprolonged the recession. Nearly 90 per cent of worldtrade reportedly depends on some form of tradefinance or insurance, with the total size of thismarket estimated at between US$ 10 to 12 trillionin 2008. The World Trade Organization (WTO) hasestimated a shortage in trade finance liquidity to thetune of US$ 25 billion as a fallout of the economicrecession, whereas the World Bank estimated thatthe shortage in trade finance accounted for 10 to15 per cent of the decline in trade.
7.5 A recent National Bureau of EconomicResearch (NBER) study provides new evidence thatadverse credit conditions were an important channelthrough which the global economic and financialcrisis affected trade volumes. Taking the case of theUS market, the study states that countries withhigher inter-bank rates and thus tighter creditavailability exported less to the USA. Thus not onlythe fall in US demand, but even the credit tighteningin the US, resulting in higher cost of trade financingfor firms exporting to the US, could have posed abigger challenge in countries with high cost ofcredit.
7.6 A study undertaken by the Organization forEconomic Cooperation and Development (OECD) inJune 2010 shows a differentiated picture in termsof the impact of trade finance on pre- and post-crisistrade, pointing to a threshold effect. The studyhighlights that availability of trade finance seems tohave a limited impact on exports under ‘normal’circumstances, i.e. outside crisis periods. However,an IMF-BAFT (Bankers’ Association for Finance andTrade) survey in March 2010 is of the view that thedrop in global demand was the most importantreason for the decline in trade, followed by reduced
trade financing. An International Chamber ofCommerce (ICC) survey of mid-2010 covering 161banks located in 75 countries indicates that thecosts of trade finance remain substantially higherthan they were in the pre-crisis period, raisingquestions concerning affordability for exporters.
7.7 According to an April 2010 report by the Groupof 20 (G-20) Trade Finance Experts Group, throughthe second half of 2009 and the first quarter of 2010,there is evidence that short-term trade financemarkets have generally improved. Average pricesfor letters of credit in large emerging economies havefallen from 150-250 basis points (bps) a year agoto 70-150 bps, and the markets in many advancedeconomies are quickly returning to normalcy.However, this recovery has not been universal andseveral regions have markets that remain stressed,especially in Africa. Market sources cite thatinternational or large pan-African banks continue tocharge 200 to 320 bps to endorse a letter of creditin countries regarded as having a lower risk inAfrica. Low-income countries in Asia and CentralAmerica seem to be in a better situation. In theseareas, liquidity has returned to near normal, butthere is still a market gap resulting from the generaldeterioration in the credit-worthiness of traders,coupled with greater risk aversion of commercialbanks. An interesting development is a potentiallylong-lasting shift towards structured trade finance.The financial crisis brought a heightened sensitivityto risk, which has led to an increase in the relativedemand for intermediated trade finance overtraditional open account financing. In fact, recentestimates indicate that the level of intermediated(bank-supported) trade finance in 2009 surpassedthat of open account transactions, reversing a long-term trend towards open account financing.
7.8 The G-20, in its Communiqué issued duringthe Seoul Summit (November 2010) has reiteratedthe need for enhancing the availability of tradefinance in developing countries, particularly the low-income countries. In this regard, the G-20 Ministershave agreed to monitor and assess trade financeprogrammes in support of developing countries andto evaluate the impact of regulatory regimes ontrade finance. The G-20 Trade Finance ExpertGroup, together with the WTO Experts Group onTrade Finance and OECD Export Credit Group, aremandated with assessing the current need for tradefinance in low-income countries, and, if a gap isidentified, will develop and support measures toincrease its availability in low-income countries.
158 Economic Survey 2010-11
Website : http://indiabudget.nic.in
7.9 BAFT-IFSA (the merged entity of BAFT andInternational Financial Services Association)announced the Master Partnership Agreement (MPA)in June 2008 for mitigating the trade finance risk.The MPA is an industry standard for use by banksand their counter parties around the globe to facilitatethe buying and selling of country and bank tradefinance related risk. It is designed to simplify theexchange of documentation, reduce legal costs,increase efficiency, and promote trade.
7.10 Multilateral organizations have introducedseveral supportive measures to stimulate availabilityof trade finance. More than 850 foreign tradetransactions for the total amount of •550 million weresupported by the European Bank for Reconstructionand Development’s (EBRD) Trade FacilitationProgramme (TFP) in 2009, providing additionalbenefits to the trade finance market. The AsianDevelopment Bank’s (ADB) Trade FinanceFacilitation Programme (TFFP) exposure limit wasincreased to US$ 1 billion. In 2009, the TFFPsupported US$2 billion in trade, an increase of over300 per cent compared to 2008. Under its GlobalTrade Finance Programme, the International financeCorporation (IFC) issued US$3.46 billion inguarantees in financial year 2010, a 44 per centincrease over the previous year.
7.11 Pre-export financing and loans backed byexport credit agencies have played a major role in2010 trade finance markets. National governmentsacross the globe devised strategies on war footingto support trade finance activities, some of themthrough the respective export credit agencies ordevelopmental institutions (see Box 7.1).
Trade Credit: Indian scenario
7.12 In the wake of the global crisis and theproblems being faced by exporters, the ReserveBank of India (RBI) had reduced the interest rateceiling to 250 bps below the benchmark prime lendingrate (BPLR) on pre-shipment rupee export creditup to 270 days and post-shipment rupee exportcredit up to 180 days. This facility was available upto 30 June, 2010. In addition, the Government ofIndia in its Union Budget for 2010-11 extendedinterest rate subvention of 2 per cent on pre andpost shipment rupee export credit for certainemployment-oriented export sectors such ashandicrafts, carpets, handlooms, and small andmedium enterprises up to 31 March 2011. On 9August 2010, the interest rate subvention schemewas further extended to leather and leathermanufacturers, jute manufacturing including floorcovering, engineering goods, and textiles for the
Box 7.1 : Response to Trade Credit Crunch in Select Countries
The policy responses of some select countries related to trade credit were as follows:
The US-Exim (Export-Import) Bank announced a programme for providing US$ 4 billion in new short-term tradefinance facilities and US$ 8 billion in medium- and long-term trade finance facilities to support export of US goodsto emerging markets. Similarly, China, through the China-Exim Bank, provided short- , medium- , and long-termtrade finance facilities for export of Chinese goods and services to emerging markets.
The Federal Reserve, USA announced currency swap facilities with the European Central Bank and central banks invarious countries to keep the foreign currency liquidity in the international financial system.
The UK Government announced plans to guarantee as much as £20 billion of bank loans to small and mediumcompanies ensuring flow of credit.
Germany announced a financial-sector rescue package of • 480 billion (US $ 672 billion), to secure confidence in andliquidity into the banking system.
The Central Bank of Russia announced schemes to lend to commercial banks without requisite collateral for up to sixmonths. In addition, the Central Bank granted a credit line of US$ 50 billion to Vnesheconomobank until the end of2009.
The Government of Hong Kong SAR has proposed extending the maximum guarantee period for working capital loanfor small and medium enterprises (SMEs) from two years to five years.
The Japanese Government announced US $1.0 billion trade finance facilitation initiative, to be developed in closecooperation with the IFC and ADB.
Banco Nacional de Desenvolvimento Economico e Social (BNDES), the export credit agency of Brazil announced R$6 billion working capital credit facilities for Brazilian companies.
The Brazilian Central Bank auctioned US$ 1 billion to banks (who will use it for trade credit lines) with repurchaseclauses.
Colombia and Venezuela jointly pledged US$ 100 million each for creation of a special fund in order to boost cross-border trade between the two countries.
159International Trade
Website : http://indiabudget.nic.in
period from 1 April 2010 to March 31, 2011. With theintroduction of a base rate, the lending rates chargedon rupee export credit were deregulated with effectfrom 1 July 2010. However, the RBI has stipulatedthat banks may reduce the interest rate chargeableas per the base rate in the sectors specified aboveby the subvention available, even if the interest ratecharged to exporters goes below the base rate,subject to a ceiling of 7 per cent.
7.13 As a result of difficult financing conditionsprevailing in the international credit markets andincreased risk aversion of the lending counterparties,the gross inflow of short-term trade credit to Indiaduring 2008-09 was lower than in 2007-08. Thegross inflows of short-term trade credit reached US$41.8 billion during 2008-09, while repayments(outflows of short-term trade credit) stood at US$43.8 billion, resulting in a net outflow of US$ 2.0billion during 2008-09. Thus financing of short-termtrade credit did not pose much of a problem in India.However, the situation changed in 2009-10 withshort-term trade credit inflows increasing by 27.5per cent to US$ 53.3 billion, while short-term tradecredit outflows increased only marginally by 4.5 percent to US$ 45.7 billion, thereby resulting in a netinflow of US$ 7.6 billion. This trend became furtherpronounced in financial year 2010-11. Short-termtrade credit to India recorded a large net inflow ofUS$ 6.7 billion in H1 of 2010-11 (as against amarginal net outflow of US$ 0.05 billion duringH1 of 2009-10) in line with the increase in importsassociated with strong domestic economic activityand improved conditions in the global financialmarkets. After the negative growth, as on 27 March2009, export credit grew moderately as on 26 March2010. This trend continued with export credit growthat 11.3 per cent as on 31 December 2010. Howeverexport credit as a percentage of net banking creditfell by 0.9 percentage points from 5.5 per cent ason 28 March 2008 to 4.6 per cent on 27 March 2009and 4.1 per cent as on 31 December 2010 (seeTable 7.2).
7.14 The various policy initiatives taken by the RBIthrough a hike in the all-in-cost ceiling for improvingthe trade credit mechanism, enhancement of thelimit on overseas borrowings by banks, extendingthe line of credit as well as swap facility to EximBank, have helped in easing the pressure on tradefinancing. This is further corroborated by the increasein share of short-term trade credit (both inflows andoutflows) in overall gross capital flows-– while shareof inflows increased from 10.9 per cent in 2007-08 to
15.6 per cent in 2009-10, share in outflows increasedfrom 9.6 per cent to 15.8 per cent during the sameperiod.
INDIA’S MERCHANDISE TRADE
7.15 India’s trade growth (in US dollar terms) hasbeen robust at 20 per cent plus since 2002-03. WhileIndia’s trade growth has a strong correlation withworld trade growth, it has been significantly higherthan world trade growth particularly in two timeperiods, first just following the 1990 reforms andsecond after 2003 (see Figure 7.1).
7.16 Unlike many other countries, the globalrecession only slightly jolted the continued upwardgrowth in India’s export sector with exports rising ata reasonable rate of 13.6 per cent in 2008-09. Thecompound annual growth rate (CAGR) for India’smerchandise exports for the five-year period 2004-05 to 2008-09 increased to 22 per cent from the 14per cent of the preceding five-year period. However,in 2009-10 export growth was negative at (-)3.5 percent, partly reflecting the effect of global recessionand partly the higher base effect due to lagged exportdata of 2008-09. Despite this negative growth, India’sranking in the leading exporters in merchandise trade
Table 7.2 : Export Credit
Outstanding Export Variations Exportas on Credit (Per credit as ( `̀̀̀̀ Crore) Cent) per cent
of NBC
24 March 2000 39,118 9.0 9.8
23 March 2001 43,321 10.7 9.3
22 March 2002 42,978 -0.8 8.0
21 March 2003 49,202 14.5 7.4
19 March 2004 57,687 17.2 7.6
18 March 2005 69,059 19.7 6.3
31 March 2006 86,207 24.8 5.7
30 March 2007 104,926 21.7 5.4
28 March 2008 129,983 23.9 5.5
27 March 2009 128,940 -0.8 4.6
26 March 2010 138,143 7.1 4.3
31 December 2010* 153,794 11.3 4.1
Source: Reserve Bank of India (RBI).
Notes:
* Variation over the figure as on 26 March 2010.
NBC—net banking credit.
Data up to March 2004 relate to select banksaccounting for 90 per cent of bank credit. Data 18March 2005 onwards, pertain to all scheduled banksexcluding regional rural banks (RRBs) availing ofexport credit refinance from the RBI.
160 Economic Survey 2010-11
Website : http://indiabudget.nic.in
which slipped marginally from 26th in 2007 to 27th in2008 improved to 21st in 2009.
7.17 However, this reasonably good overall picturefor the whole year hides some of the difficultiesthrough which the export sector went in the 12 crisisridden months. In the case of India, the rebound inexport growth from the second half of 2009-10 early2010-11 was as sharp as the earlier fall, partlyreflecting the low base and partly global trends (seeFigure 7.2). Some deft handling by the Governmenton the export front also lessened the pain for theexporters in these trying months.
7.18 Though export growth decelerated from Julyto November 2010 after high spurts from February2010 to June 2010, cumulative export growth in April-December 2010-11 was good at 29.5 per cent with
-40
-20
0
20
ExportGrowth (%)
Monthly trends in India's trade: values and growthFigure 7.2
ImportGrowth (%)40
60
80
2009-102008-09
Year
Apr
May Jun
Jul
Aug
Sep
Oct
Nov
Dec
Jan
Feb
Mar Apr
May Jun
Jul
Aug
Sep
Oct
Nov
Dec
Jan
Feb
Mar Apr
May Jun
Jul
Aug
Sep
Oct
Nov
Dec
ExportUS$ billion
ImportUS$ billion
2010-11
Per
cent
cumulative exports reaching US $ 164.7 billion duringthis period. Current indications are that India will notonly achieve the target of US$ 200 billion but surpassit in 2010-11.
7.19 Export growth in dollar terms decelerated in2008-09 while in rupee terms it exhibited an oppositemovement reflecting the direct effect of the highdepreciation of the rupee by 12.5 per cent. In 2009-10, while export growth in dollar terms was negative,in rupee terms it showed a very marginal increasedue to the marginal depreciation of the rupee by 3.1per cent. In 2010-11 (April-December), export growthwas robust both in dollar and rupee terms, the latterbeing slightly less due to the appreciation of therupee by 5.0 per cent (Figure 7.3). Import growthmovements in dollar and rupee terms exhibited similarmovements during the same period (Figure 7.4).
Source: Based on Directorate General of Commercial Intelligence and Statistics (DGCI&S) data.
-30
-10
10
3019
92
1993
1994
1995
1996
1997
1998
1999
2000
2001
2002
2003
2004
2005
2006
2007
2008
2009
2010
Per
cent
Year
India
Export growth of World and IndiaFigure 7.1
World
-20
0
20
40
Source: IMF & WTO
Note: Data for 2010 is only for three quarters
161International Trade
Website : http://indiabudget.nic.in
7.20 The deceleration in export growth in rupeeterms in 2009-10 was not only due to the largedeceleration of growth in unit values to 1.0 per centcompared to 16.9 per cent in 2008-09 but also dueto actual decline in quantum by 1.1 per cent
compared to the 9 per cent growth in 2008-09. Thiswas mainly due to the negative growth in both volumeand unit values of manufactured goods. Export volumeof food and food articles like rice, coffee, spices,and oilseed cake also fell (though their unit values
-10
0
10
20
30
40
50
Perc
enta
ge c
hang
e Exportgrowth inUS$ terms
Export growth and exchange rate changesFigure 7.3
1999
-200
0
2000
-01
2001
-02
2002
-03
2003
-04
2004
-05
2005
-06
2006
-07
2007
-08
2008
-09
2009
-10
Year
Exportgrowth in� terms
Exchangerate
changes
-20
-10
0
10
20
30
40
50
Perc
enta
ge c
hang
e Importgrowth inUS$ terms
Import growth and exchange rate changesFigure 7.4
1999
-200
0
2000
-01
2001
-02
2002
-03
2003
-04
2004
-05
2005
-06
2006
-07
2007
-08
2008
-09
2009
-10
Year
Importgrowth in� terms
Exchangerate
changes
-20
Source: Based on DGCI&S and RBI data.
Table 7.3 : Trade Performance : Volume and Unit Values
(Annual per cent change)
Exports Imports Terms of Trade
Value Value
Rupee US$ Volume Unit Rupee US$ Volume Unit Net Incometerms terms Value terms terms Value
Source: Computed from DGCI&S data.Note: * April-December 2010.Volume and unit value index of exports and imports are with new base (1999-2000=100)
162 Economic Survey 2010-11
Website : http://indiabudget.nic.in
increased) mainly due to supply constraints andpolicy interventions like ban on exports in the caseof non-basmati rice.
7.21 A dissection of the export quantum indicesregion-wise, shows that the negative quantum growthfor the first time in the decade was due to thenegative quantum growth for almost all the regions,except the South African Development Community,Asia-Pacific Economic Cooperation, and theEuropean Union. In particular, the (-) 8.0 per centgrowth for the Association of South East AsianNations (ASEAN) and the (-) 5.8 per cent growth forNorth America which are among our major tradingpartners and the high negative growth of 22 percent for the Commonwealth of Independent States(CIS) contributed to this fall in quantum of exports.Similarly a dissection of the import unit valueindices, region-wise, shows that the negative growthfor the first time in the decade was due to thenegative growth of unit values in imports from all theregions, with the South African DevelopmentCommunity being the exception.
7.22 The deceleration of imports in rupee terms in2009-10 was mainly due to the high negative growthof unit value indices even while volume growth wasmoderately high. This, in turn, was due to the highnegative unit value growth in chemicals and relatedproducts despite the moderate quantum growth;
negative unit value growth of machinery and transportequipment coupled with the low quantum growth;negative unit value growth in miscellaneousmanufactured articles and mineral fuels and non-fuel crude materials, despite their positive quantumgrowths.
7.23 The net terms of trade, which measures theunit value index of exports as a proportion of unitvalue index of imports, improved by 12.3 per cent.This was despite the very marginal positive growthin unit value index of exports as the growth of unitvalue index of imports was negative for the first timein this decade at 10 per cent. Income terms of trade,reflecting the capacity to import, grew at 11 percent like in the two previous years. But unlike theearlier two years this was due to the high favourablegrowth in net barter terms of trade while exportvolume growth was negative for the first time in thisdecade.
7.24 India’s share in world merchandise exportshas started rising since 2007 albeit by a very slow0.1 percentage point so as to reach 1.3 per cent in2009 and 1.4 per cent in 2010 (January-June). Thiswas mainly due to the relatively slow rise or greaterfall in world export growth than India’s (Table 7.4).The increase in China’s share of world exportsbetween 2000 and 2009 at 5.8 percentage points is50 per cent of the total increase in the share of
Table 7.4 : Export growth and share in world exports : India and other select countries
Value Growth rate % Share in world exports (%) change in
Source : Computed from IMF, International Financial Statistics, November 2010.Note: EDEs stand for emerging and developing economies.
163International Trade
Website : http://indiabudget.nic.in
negative growth of -5.0 per cent in 2009-10. Thiswas due to the fall in growth of petroleum, oil, and
emerging and developing countries over this period,while India’s rise in share of 0.7 percentage pointsforms only 6 per cent of the total increase. However,China’s export growth rate which was above 25 percent in this decade till 2007, moderated to 17.3 percent in 2008 and became a negative (-) 15.9 percent in 2009 due to global recession. It improved to35.1 per cent in the first half of 2010, following thegeneral trend, as a result of recovery and low baseeffect. India’s export growth was also negative at(-) 15.2 per cent in 2009 but recovered to 35.3 percent in 2010 (January-June). While Russia’s exportgrowth in the first half of 2010 at 51.4 per cent isvery high, standing at (-) 35.7 per cent in 2009, itsfall had been equally great with Russia’s share inworld exports falling from 3.0 to 2.5 per cent.
7.25 International trade activity in Asia, whichrebounded appreciably in the first two quarters of2010, has tapered in the third quarter. This ispartially due to the base effect and partially areflection of the global trend in trade in Q3 of 2010.Both exports and imports have exhibited almostsimilar growth patterns with a deceleration in Q3 formost emerging Asian countries, except Hong Kongand Philippines, where growth in exports haveimproved marginally compared to the earlier quarteror earlier two quarters.
7.26 India’s merchandise imports, also affected byglobal recession, fell to US$288.4 billion with a
Table 7.5 : Quarterly Trade Growth ofMajor Asian Economies in 2010
Source: Computed from WTO data.Note: Y-o-Y—year on year.
2006-07
0
50
100
150
200
2007-08 2008-09
250
300
350
400
450
Valu
e (�
tho
usan
d cr
ore)
& Q
uant
ity
(MM
T)
Value ofimports of
POL
POL ImportsFigure 7.5
2009-10 2009-10 (Apr-Dec) 2010-11 (Apr-Dec)
Quantityof POL
Source : Ministry of Petroleum and Natural Gas (MOPNG).
164 Economic Survey 2010-11
Website : http://indiabudget.nic.in
lubricant (POL) imports by 7.0 per cent and non-POL imports by 4.2 per cent. POL import growthwas low mainly due to decline in import price of theIndian crude oil import basket by 16.5 per centdespite the increase in quantity by 7.7 per cent(Figure 7.5).
7.27 International oil prices recorded anunprecedented rise during 2008 and remainedconsiderably volatile during the entire ensuingperiod. The price of the Indian basket of crude oilwhich moved in tune with international oil prices wasalso volatile, averaging at US $83.57 per barrel during2008-09 after reaching an unprecedented US $ 142per barrel on 3 July 2008 before declining sharplyfollowing global recession. The monthly movementsin oil prices from 2006-07 to 2010-11 (April-December)clearly reflect this volatility (Figure 7.6). Current oilprices are around US $ 95-100 per barrel with Brentcrude price even crossing the US$100 mark inFebruary 2011 and Indian crude oil baset reachingUS$ 98.4 per barrel on 11 February 2011.
7.28 Non-POL non-bullion imports declined by 8.6per cent in 2009-10 reflecting relatively low demandfor imports for industrial activity, partly due to lowindustrial growth and fall in exports resulting in lowerdemand for imports of inputs needed for exports.Imports also started picking up in the second half of2009-10, though with a month’s lag ending the nine-month continuous negative growth in December2009. The rebound in imports was much sharperwith import growth as high as 73.5 and 78.3 percent in February and March 2010. This was partlydue to base effect and partly due to the pickup inexports and industrial activity. During 2010-11 (April-December) import growth was at 19 per centaccompanied by an increase in both POL and non-POL imports at 17.7 per cent and 19.6 per centrespectively. Gold and silver imports registered agrowth of 8.7 per cent. Non-POL non-bullion importsincreased by 21.2 per cent due to recovery inindustrial activity and exports.
7.29 Trade deficit (on customs basis) increasedby 2.4 per cent to US$ 82 billion in 2010-11 (April–
Table 7.6 : Growth in POL trade and non-POL imports (US$ terms)
Total POL POL Net POL Non- POL Gold & Non-POL, non- imports imports exports imports imports silver gold & silver
December) from US$ 80.1 billion in the correspondingperiod of the previous year. Trade deficit reached apeak of US $ 118.4 billion in 2008-09 and moderatedto US $ 109.6 billion in 2009-10. The relatively higherimport growth compared to export growth in the firsthalf of 2010-11, raised the alarm of a possibleunmanageable current account deficit. With importgrowth slowing down from October 2010 and exportspicking up in November 2010, the fear that the highcurrent account deficit may be due to highmerchandise trade deficit is disappearing. Net POLimport growth, which has been positive since 2002-03, became negative at -10.9 per cent in 2009-10after a gap of seven years. However, during 2010-11(April-September), it turned positive again with agrowth of 15.1 per cent (Table 7.6).
TRADE COMPOSITION
Export composition
7.30 The export basket has seen majorcompositional changes in this decade with a 10percentage point fall in shares of manufactures, a12.6 percentage point gain in shares of petroleumcrude and products, and a 3.3 percentage point fallin shares of primary products. This trend continuedduring the last two years, i.e. from 2008-09 to thefirst half of 2010-11, with the share of the majorcategory, i.e manufactures, stagnating at 68.9 percent and even falling in 2009-10; share of primaryproducts falling to 12.7 per cent in the first half of2010-11 after increasing in 2009-10; and share ofpetroleum crude and products increasingcontinuously both in 2009-10 and the first half of2010-11 to reach 16.9 per cent. Withinmanufactures, there has been no majorcompositional change in the last two years. However,compared to 2000-01 the share of engineeringgoods has increased substantially while that oftextiles including readymade garments (RMG) hasfallen heavily from 23.6 per cent in 2000-01 to 9.5per cent in the first half of 2010-11. The chemicalsand related products category has made some gainsin share, while leather and leather manufacturesand handicrafts have lost shares.
7.31 A comparison of the commodity-wise growthof major exports of India to the major destinations inthe first half of 2010-11 over 2008-09 shows a fall inthe shares of manufactures exports to the USA andEU, while there is a rise in the case of ‘Others’. Inthe case of petroleum, crude, and products, there isa gain in export shares to all the three destinationswith a major gain to EU market, with high growth of
exports to EU and US markets in 2009-10 and thefirst half of 2010-11. In the case of primary products,the only major change was the fall in share of ‘Others’(see Table 7.7).
7.32 While India’s manufactures exports to the EUsuffered a high negative growth in 2009-10, therecovery in the first half of 2010-11 was moderatecompared to the robust recovery of manufacturesexports to the other two destinations. Amongmanufactures, the performance of different productgroups was varied. In the case of textiles exports tothe US and EU, there was a fall in shares with agreater fall in the case of the latter. Negative exportgrowth to the EU continued even in the first half of2010-11, while there was moderate export growth tothe US after three successive years of negativegrowth. In gems and jewellery also, in the first half of2010-11, the share of exports to both the US andthe EU fell with a higher fall in case of the former. Inthe case of exports of engineering goods to the USand EU there was a fall in shares with a relativelyhigher fall in the case of the latter in 2009-10 and arise in shares in the first half of 2010-11. There wasa rise in share of exports to ‘Others’ with a highgrowth of 50 per cent in the first half of 2010-11(see Box 7.2). In the case of chemicals and relatedproducts, the share of exports to the US increasedby nearly 3 percentage points, while it was stagnantin the case of the EU and fell slightly in the case of‘Others’ in the first half of 2010-11 compared to2008-09. The slowdown in India’s exports to the EUwhere the recovery from global recession is weak isa cause for concern.
Import composition
7.33 The composition of imports also underwentchanges in this decade. The share of food and alliedproducts imports which fell to 2.1 per cent in 2008-09 from 3.3 per cent in 2000-01, increased to 3.7per cent in 2009-10 and fell to 3.2 per cent in thefirst half of 2010-11 with slight fall in import shares ofedible oils and pulses (Table 7.8). The share of fuelimports, however, remained at around 33 per cent.The most notable change is the sudden rise in shareof capital goods imports from 10.5 per cent in 2000-01 to 15.0 per cent in 2009-10 and again a fall to13.1 per cent in the first half of 2010-11 due to thesee-saw movement in shares of imports of transportequipment. The share of gold and silver and electronicgoods in the import basket decreased in the firsthalf of 2010-11 compared to 2008-09 and 2009-10.The share of pearls, precious, and semi-preciousstones saw a see-saw movement with negative
166 Economic Survey 2010-11
Website : http://indiabudget.nic.in
Box 7.2 : Indian Engineering Sector : Need for More Focus
The engineering industry is the largest segment of the Indian industrial sector. It accounts for 3 per cent of India’s GDPwith a 30.5 per cent weight in the index of industrial production (IIP); 29.9 per cent share of total investment; and 62.8per cent share in foreign collaborations. Engineering exports are one of the largest foreign exchange earners for the countryand account for over 20 per cent of India’s total exports with around 35 per cent of the engineering exports contributedby the micro, small, and medium enterprises (MSME) sector.
India’s export of engineering goods grew at 25.2 per cent (CAGR) during 2000-01 to 2007-08. In 2008-09, the growthmoderated to 18.7 per cent and in 2009-10 it declined by 19.6 per cent because of global recession, with its share intotal exports falling to 18.2 per cent. In the first half of 2010-11, there was a robust growth of 46.0 per cent partiallydue to base effect and partially due to global recovery following stimulus measures.
The performance of principal categories of engineering items export shows that in 2009-10, all the major categoriesof engineering goods had negative growth. In the first half of 2010-11, all the major categories like machinery, ironand steel, and other engineering goods registered high growth with the major sub-categories like transport equipment,primary and semi-finished iron and steel, non-ferrous metals and manufactures of metals registering whoppinggrowths of 61.8 per cent, 65.0 per cent, 61.5 per cent, and 40.3 per cent respectively. Only one major sub-category, i.e.machinery and instruments registered moderate growth of 10.5 per cent (see Table 1)
Table 1 : Export Performance of Different Engineering Goods
Total Engineering Exports 21.8 18.2 19.5 21.8 -19.6 46.0
Source: DGCI&S
The major markets for Indian engineering exports are the USA, Singapore, UAE, UK, China, Germany, and Italy.Notably, while there was a fall in growth of India’s engineering exports to most of the markets in 2009-10, itsengineering exports to China grew by over 62 per cent.
With a 0.8 per cent share of world engineering exports in 2008, India ranks 30th—below all comparable countries—in the global engineering exports market. This low position is primarily attributable to three factors: 1) Low exports-to-GDP ratio: exports-to-GDP ratio of 15 per cent for India vis-à-vis 27 per cent for comparable countries 2) Lowengineering-to-total exports ratio: engineering exports to total exports ratio of 24 per cent for India vis-à-vis 30 per centfor comparable countries 3) Low technology-intensity of engineering exports: share of high and medium technologyproducts in engineering exports is 62 per cent for India vis-à-vis 71 per cent for comparable countries. Given India’scurrent low share of world engineering exports and the significant scope for improvement in competitiveness, there ispotential for achieving higher growth in this major sector of world trade.
167International Trade
Website : http://indiabudget.nic.in
Table 7.7 : Composition of exports by major markets Percentage share CAGR Growth ratea
Source : Computed from DGCI&S dataNote : Totals of I, II, and III may not add up to total exports due to some unclassified items.a Growth rate in US dollar terms
168 Economic Survey 2010-11
Website : http://indiabudget.nic.in
growth in 2009-10 and very high growth (129 per cent)in the first half of 2010-11.
Export diversification
7.34 In 2009, India had a global export share of 1per cent or more in 48 out of a total of 99 commoditiesat the two-digit Harmonised System (HS) level, but
a significant share of 5 per cent or more in 12 items(Table 7.9). Among these, three items, pearls,precious stones, metals, coins, etc.; manmadefilaments; and ores, slag, and ash had an increasein global share by 0.5 per cent point or more in 2009over 2008. Six items, which include silk; carpetsand other textile floor coverings; lac, gum, resins,
Table 7.8 : Commodity composition of imports
Percentage share CAGR Growth rate (per cent)a
Commodity Group 2000-01 2009-10 2009-10 2010-11 2000-01 2008-09 2009-10 2009-10 2010-11(Apr.- (Apr.- to (Apr.- (Apr.-Sept.) Sept.) 2007-08 Sept.) Sept.)
Source : Calculated from National Centre for Trade Information (NCTI) data based on UN-ITC Trade Map Data 2009.
169International Trade
Website : http://indiabudget.nic.in
vegetable saps and extracts; cotton; vegetableplaiting materials, vegetable products; and coffee,tea, mate, and spices, lost global shares in 2009over 2008. Noticeable is the near doubling in shareof pearls, precious stones, metals, coins, etc., withgrowth in trading activity, and the fall of nearly 2percentage points in lac, gums, resins, vegetablesaps, and extracts, due to crop failures coupledwith competition from substitute products andcompeting countries. Of the remaining 38 items, 11lost their shares in 2009 over 2008.
DIRECTION OF TRADE
7.35 The directional pattern of India’s trade afterchanging in the first half of this decade with theshare of the top 15 trading partners increasing by5.5 percentage points to 60.3 per cent in 2007-08compared to 2000-01, has not changed much afterthat with the top 15 countries continuing to hold theshare of around 60 per cent even in 2009-10 and2010-11 (April-September) (Table 7.10). In the firsthalf of 2010-11, their share was 59.8 per cent. Aninteresting development in the direction of India’strade is that the USA which was in first position in2007-08 has been relegated to third position in 2008-09, with the UAE becoming India’s largest tradingpartner, followed by China. This position continued
in 2009-10 and the first half of 2010-11. This is mainlydue to India’s exports and imports of gems andjewellery items followed by POL to the UAE. In both2009-10 and 2010-11(April-September), India’sexports to the UAE were higher than imports, whileIndia’s exports to China are lower than imports. Thehigh and rising trade with the UAE may also be dueto circular trading to some extent.
7.36 Export-import ratios in Table 7.10 show thatamong its top 15 trading partners, India had bilateraltrade surplus with five countries, namely the UAE,USA, Singapore, the UK, and Hong Kong in 2009-10and the first half of 2010-11. India’s trade deficit withthe USA and Singapore in 2007-08, turned into tradesurplus thereafter. The export-import ratio fell in 2008-09 in the case of Hong Kong, though it recovered in2009-10. India’s export-import ratio in the case ofChina is not only low but has been stagnating ataround 0.3 though it increased to 0.4 in 2009-10, toagain fall to 0.3 in the first half of 2010-11.
7.37 The UAE has displaced the USA as thetopmost destination of India’s exports in 2008-09and 2009-10 with an export share of 13.2 per centand 13.4 per cent respectively. In 2009-10, India’sexports to the top two destinations, i.e. the UAEfollowed by the USA, registered growth of (-)2.1, and(-)7.6, per cent respectively.
Table 7.10 : India's trade and export-import ratio with major trading partners
Source: Computed from DGCI&S data.Note: *A coefficient of export and import ratio between 0 and 1 implies that India’s imports are greater than exports
and if the coefficient is greater than one, India exports more than what it imports.
170 Economic Survey 2010-11
Website : http://indiabudget.nic.in
7.38 Region-wise, over half of India’s exports (53.5per cent) in the first half of 2010-11 were to Asia(including ASEAN), up from around 40 per cent in2001-02. During 2010-11 (April-September), exportsto Asia (including ASEAN) increased by 29.2 percent and to Europe by 23.3 per cent. India’smerchandise exports to South Asian countriesincreased by 29.2 per cent.
7.39 In 2010-11 (April-September), Asia andASEAN continued to be the major source of India’simports accounting for 61.5 per cent of the total.Country-wise, China remained the largest sourcewith a 12 per cent share in India’s total importsfollowed by the UAE (7.5 per cent), Saudi Arabia(6 per cent), and USA (5.9 per cent). India’s importgrowth from 13 of its top 15 trading partners waspositive, the USA and Iran being the exceptions.
SERVICES TRADE
7.40 In recent years, the focus of services tradehas shifted away from just facilitating trade in goodsas the sector has emerged as an independent entityin itself with services trade in the four supply modesopening up new opportunities. The integration oftelecommunication and computer technology hasmade virtually all services tradable across borders.Virtually all commercial services are now tradableacross borders. The trend towards globalization,reinforced by liberalization policies and the removalof regulatory obstacles, has fuelled steady growthof international investment and trade in services.
World Trade in Services
7.41 The US$ 3.35 trillion world export ofcommercial services was dominated by the developedcountries in 2009, with the exception of India andChina which were also among the top 12 exporters.As in the case of merchandise trade, India hasimproved its rank in commercial services trade. Asper the latest ‘International Trade Statistics 2010’
brought out by the WTO in 2009, world export andimport growth in services fell to (-)12 per cent in 2009.The decline was more or less similar in most of themajor regions like North America, Europe, and Asia.Import growth in commercial services fell in the US,EU, and Japan and was at (-)9 per cent,(-)13 percent, and (-)10 per cent, respectively. While India’simport growth and export growth of commercialservices were at (-)9 per cent and (-)15 per centrespectively, those of China were at 0 per cent and(-)12 per cent respectively. While India ranks 21st inworld merchandise exports in 2009 compared toChina which is in first position, in commercialservices exports it ranks 12th compared to China atfifth rank.
7.42 The three broad categories of commercialservices, namely transport, travel, and othercommercial services witnessed a decline in exportgrowth in 2009 (Table 7.11). Among top exporters/importers of services (with EU-27 taken as a singleunit) India ranked among the first five countries inthe export of other commercial services, computerand information services, communication services,and personal, cultural and recreational services in2009/2008 (Table 7.12).
7.43 As per the WTO’s International TradeStatistics 2010, in 2009, all commercial servicessectors were affected by the global crisis but not tothe same extent. Transport services growth fellmirroring the fall in world trade. Financial serviceswere severely hit due to the turmoil in the financialmarkets resulting in world exports of financialservices declining by 15 per cent in 2009 thoughthey began slowly to recover in the last few monthsof the year. Europe’s financial sector was the mostaffected by the economic crisis. The EU’s exportsof financial services plummeted by 19 per cent, toUS$ 133 billion in 2009. In the United States, thesecond largest world exporter of financial services,as well as in Hong Kong, the decline was by 7 percent. At the start of 2010, there was an upward trend
Table 7.11 : World exports of commercial services trade by major category, 2008
Value Annual percentage change(US$ billion)
2009 2000-09 2007 2008 2009
Commercial services 3350 9 20 13 -12
Transport 700 8 20 17 -23
Travel 870 7 15 10 -9
Other commercial services 1780 12 23 12 -9
Source : WTO
171International Trade
Website : http://indiabudget.nic.in
in exports of financial services. Estimates for thefirst quarter of 2010 indicate recovery across allcountries. Construction, the most dynamic sectorin 2008, also saw its growth fall sharply. Computerand information services as well as royalties andlicence fees were more resilient. World exports ofcomputer and information services decreased by 6per cent in 2009, after record growth of 23 per centin 2008. While exports of computer and informationservices fell by 9 per cent in Europe and by 14 percent in the CIS, in North America, they stagnatedand in Asia, fell by 2 per cent. In 2009, world travelexports fell by 9 per cent, reflecting the worldwidedrop in international tourism with tourist arrivals downby 4 per cent. The decline was most pronounced inEurope (-13 per cent), North America (-11 per cent),and the CIS (-22 per cent). Asian economies wereless affected with a 3 per cent decline. World tourismis recovering rapidly with forecasts from the WorldTourism Organization indicating that the number ofinternational tourists will increase by 3-4 per cent in2010.
7.44 In commercial services imports, India movedfrom 13th position in 2005 and 2008, to 12th positionin 2009, with a 2.5 per cent share. The United States,the European Union, China, and Japan are the majorimporters of services in the world.
India’s Services Trade
7.45 India and China are the two importantdeveloping countries which are making rapid stridesin the services trade sector. However, the pattern ofgrowth of the different services in India differs fromthat of other countries. While other commercialservices is the major category for most of the topservice exporters, in the Indian case its share isproportionately higher than in that of others at 77.4per cent in 2008 compared to 56.5 per cent for theUSA, 54.8 per cent for the EU, 45.9 per cent forChina, and 60.6 per cent for Japan. Thus this categorycontaining many dynamic services is important forIndia. The share of travel at 11.5 per cent is relativelylower than in most other countries. The shares ofthe US and China are more than double that of India.Even in transportation, India’s share is less than halfthat of many leading exporters of services, partlyreflecting India’s lower volume of merchandise tradeand partly the relatively lower participation of India’sshipping sector in India’s export trade. Thus thecomposition of services exports highlights the needto pay special attention to developing shipping andtravel services in India. The composition of India’simports compared to other service trading countriesalso shows the relatively higher importance of othercommercial services particularly in 2009-10.
Table 7.12 : India’s sector-wise Rank and Share in World Exports / Imports of Services
Source: Compiled from WTO, International Trade Statistics 2010.Note : * data relate to 2008; ** WTO Secretariat estimates.
172 Economic Survey 2010-11
Website : http://indiabudget.nic.in
India’s Services Exports
7.46 India, is moving towards a services-dominatedGDP growth with a 10 per cent CAGR for serviceswhich is higher than the 6.7 per cent for non-servicesduring 2004-05 to 2009-10. It is also moving towardsa services-dominated export growth with a CAGRof 16.7 per cent for services during 2004-05 to 2009-10 (the CAGR was 28.7 per cent during 2000-01 to2006-07) which is slightly higher than the 16.4 percent for merchandise exports during thecorresponding period. Services exports reached US$106 billion in 2008-09 with a moderate growth of17.3 per cent over the previous year. As a result ofglobal recession, they declined to US $ 95.8 billionin 2009-10 with a negative growth of (-)9.6 per cent.The miscellaneous item of services exports with anearly three-fourths share of total services exports,slightly improved its share in the first half of 2010-11 with a growth of 28.2 per cent. The share ofsoftware services declined to 45.7 per cent in thefirst half of 2010-11 from 50.8 per cent in thecorresponding period of 2009-10. This was a resultof moderate growth of 14.7 per cent in the first halfof 2010-11 and the revival of non-software servicesexports. Non-software services exports which hadregistered a high negative growth of(-)41.2 per cent in 2008-09 increased their share to29.5 per cent with the high growth of 56.9 per cent.
Table 7.13 : India's Exports of Services
Percentage share CAGR Growth rate*
Sl. Commodity Groups April- 2000-01 April-No. September to September
Source : Calculations based on RBI data.Note : * Growth rate in US dollar terms.GNIE= Government not included elsewhere.
The revival of this sector which had a CAGR of 33.9per cent during 2000-01 to 2007-08 is a good sign,though it is partially due to the base effect. Theincreasing share of business services in non-software services exports is noteworthy. Bothbusiness services and financial services exportsregistered very high growth of 111.4 per cent and64.9 per cent. More than the base effect, this wasdue to the revival of these exports, following globalrecovery (Table 7.13). The fall in share of travelservices from 21.5 per cent in 2000-01 to 11.4 percent in the first half of 2010-11 is a cause of concern.This reflects the fact that we have not yet tappedthe vast tourism potential of India.
India’s Services Imports
7.47 Imports of commercial services have becomeimportant in recent years reaching US$ 52 billion in2008-09 and US $ 60 billion in 2009-10. But it hadlow growth of 1.1 per cent in 2008-09 and moderategrowth of 15.3 per cent in 2009-10 (Table 7.14).Business services are the most important categoryof services imports, followed by transportation andtravel. Import growth of business services declinedby (-)7.5 per cent in 2008-09 picked up by 17.8 percent in 2009-10. It grew robustly at 62.9 per cent inthe first half of 2010-11. Import growth of transportationand travel which fell in 2009-10 turned positive in the
173International Trade
Website : http://indiabudget.nic.in
first half of 2010-11. Financial services imports grewby 68 per cent.
Balance of Trade in Services
7.48 There is growing concern about a highmerchandise trade deficit coupled with inflationderailing the growth momentum. However the lessknown fact is that the falling services trade surplusis adding to the woes on the current account deficitfront, instead of acting as a cushion as was the caseearlier. Services trade surplus which increasedsteadily in this decade to reach US$53.9 billion in2008-09, fell drastically in the global crisis year of2009-10 to US$ 35.7 billion. This was caused by thecollapse in exports of non-software services,particularly business services, the slow growth ofsoftware services, and the rise in import of non-software services, particularly business and financialservices. The low service trade surplus situationcontinued in the first half of 2010-11. This was dueto the sudden rise in imports of non-software services,particularly business and financial services whichovershadowed the rise in exports of business andfinancial services. If this situation continues in thesecond half of this year and coming years, then wehave to reconcile to the fact that the hitherto extracushion provided by the services sector for tradebalance will not be available. The impact on growthof the rising import of business and financial servicesalso needs to be evaluated (see Table 7.15).
Policies and Barriers to Trade in Services
7.49 In the light of the global recession, somemeasures were taken to help the services sector.These include extension of sunset clauses forSoftware Technology Parks of India (STPIs) and
Table 7.14 : India's Imports of Services
Percentage share CAGR Growth rate*
Sl. Commodity Groups April- 2000-01 April-No. September to September
Source : Calculations based on RBI data.Note : *Growth rate in US dollar terms. GNIE= Government not included elsewhere.
Table 7.15 : India’s Exports, Imports and Balance
of Trade in Services
(US $ billion)
Exports Imports Balance
2000-01 16.3 14.6 1.7
2001-02 17.1 13.8 3.3
2002-03 20.8 17.1 3.6
2003-04 26.9 16.7 10.1
2004-05 43.2 27.8 15.4
2005-06 57.7 34.5 23.2
2006-07 73.8 44.3 29.5
2007-08 90.3 51.5 38.9
2008-09 106.0 52.0 53.9
2009-10 95.8 60.0 35.7
2009-10 43.8 24.7 19.1(April-September)
2010-11 55.7 36.2 19.5(April-September)
Source : Computed from RBI data.
174 Economic Survey 2010-11
Website : http://indiabudget.nic.in
export-oriented units (EOUs) up to 2010-11 anddoubling of duty free entitlement to hotels under the‘served from India’ scheme. A coordinated andsynchronized effort is needed towards the servicessector as at present services activities are dispersedand fall within the purview of different departments ofthe Government (also see Box 7.6). There are alsomany barriers to trade in services. These includethe State-level licensing and the ‘Buy American’provisions in the case of business services and ITservices in the US; the requirement of the Office ofthe Comptroller of Currency (OCC) in the US andsome State banking supervisors to maintain ‘assetpledges’ in addition to the paid up capital theymaintain in their home country in the case of financialservices; the fragmentation of the US insurancemarket into 56 different jurisdictions and directdiscrimination on a number of fronts; restrictions inthe case of transport and related services and therecent protectionist policies in the US and othereconomies that deny market access to othercountries. There is need to negotiate at bilateral andmultilateral levels for the removal of the marketaccess barriers to trade in services.
TRADE POLICY
Recent Trade Policy measures
7.50 Trade policy measures taken by theGovernment and the RBI in 2009-10 and 2010-11focused on reviving exports and export-relatedemployment. The Government followed a mix ofpolicy measures including fiscal incentives,institutional changes, procedural rationalization, andenhanced market access across the world anddiversification of export markets. Improvement ininfrastructure related to exports; bringing downtransactions costs, and providing full refund of allindirect taxes and levies, were the three major areasof focus (see Box 7.3).
7.51 Some of the trade policy measures to checkinflation in the country are the following:
Import duties reduced to zero for rice, wheat,pulses, edible oils (crude), butter and ghee andto 7.5 per cent for refined and hydrogenatedoils and vegetable oils;
Import of raw sugar allowed at zero duty underopen general licence (O G L).
Import of white/refined sugar allowed. Thefacility has been extended up to 31 December2010 without any quantitative cap.
Levy obligation in respect of all imported rawsugar and white/refined sugar removed.
Export of non-basmati rice, edible oils (exceptcoconut oil and forest based oil), and pulses(except Kabuli chana) banned.
Minimum export price (MEP) used to regulateexports of onion (at $1200 per tonne forDecember 2010) and basmati rice ($900 PMT).
Export of onion (all varieties) includingBangalore rose onions and Krishnapuramonions fresh or chilled, frozen, provisionallyprepared, or dried but excluding onion cut,sliced, or broken in powder form not permittedwith effect from 22 December 2010 and untilfurther orders.
Full exemption from basic custom dutyprovided to onions and shallots with effect from21 December 2010. Consequently, these itemsalso exempt from special additional duty of 4per cent, education cess, and secondary andhigher education cess. The exemption is openended and does not carry a validity clauseprescribing a terminal date.
Policy for Promoting State-wise Exports
7.52 State-wise exports as reflected in the data onstate of origin of exports of goods show cleardomination of Maharashtra and Gujarat. Tamil Nadu,Karnataka, and Andhra Pradesh fall in the secondrung of exporting States. In 2009-10, the growth ofexports from all the States was negative, exceptHaryana, Kerala, Goa, and Rajasthan. High negativeexport growth was registered by Delhi, followed byUttar Pradesh, West Bengal, and Karnataka. In thefirst half of 2010-11 export growth to all destinationswas positive except for Kerala (Table 7.16) Toencourage exports outlay under the Assistance toStates for Developing Export Infrastructure and AlliedActivities (ASIDE) scheme for the Eleventh Five yearplan was increased to ̀ 3793 crore.
Market Access Initiative (MAI) and MarketDevelopment Assistance (MDA) Schemes
7.53 The MAI scheme was launched in 2003 toact as a catalyst for India’s exports on a sustainedbasis. The scheme is formulated on a focus product–focus country approach to evolve specific strategyfor specific market and specific product. To furtherenable better coordination, synergising, andfacilitating of India’s export promotion activities bythe Indian Missions abroad, a ‘Challenge Fund’ has
175International Trade
Website : http://indiabudget.nic.in
Box 7.3 : Trade Policy Measures
Market and Product Diversification and Expansion of Markets:
27 new markets added under the Focus Market Scheme (FMS) with incentive of duty credit scrip at 3 per cent ofexports.
Market Linked Focus Product Scheme (MLFPS) with incentive of duty credit scrip at 2 per cent, has been significantlybroadened by inclusion of a large number of products linked to their markets.
All of Africa, Latin America, and a large part of Oceania covered under the FMS and MLFPS (13 countries addedunder the MLFPS at the time of release of the FTP 2009-14 in August 2009 and two countries added in January2010).
The incentive available under the FMS has been raised from 2.5 per cent to 3 per cent; and for the Focus Productscheme (FPS) and MLFPS from 1.25 per cent to 2 per cent; and Special Focus Products at 5 per cent.
Additional benefit of 2 per cent bonus, over and above the existing benefits of 5 per cent / 2 per cent under theFPS allowed for about 135 existing products, which have suffered due to recession in exports. Major sectorsinclude all handicrafts items, silk carpets, toys and sports goods (all of which were earlier eligible for 5 per centbenefits); leather products and leather footwear, handloom products, and some of engineering items includingbicycle parts and grinding media balls (all of which were earlier eligible for 2 per cent benefit).
256 new products added under the FPS (at eight-digit level), which became entitled for benefits at 2 per cent ofFOB value of exports to all markets. Major sectors / product groups are engineering, electronics, rubber andrubber products, other oil meals, finished leather, packaged coconut water, and coconut shell worked items.
Instant tea and CSNL cardinol included for benefits under the Vishesh Krishi Gram Upaj Yojana (VKGUY) at5 per cent of FOB (free on board) value of exports.
Nearly 300 products (at eight-digit level) from the readymade garment sector incentivized under the MLFPS for afurther six months from October 2010 to March 2011 for exports to 27 EU countries.
Support for Technological Upgradation
The zero-duty Export Promotion Capital Goods (EPCG) Scheme and Status Holder Incentive Scrip (SHIS) schemeintroduced in 2009 for limited sectors and valid only for two years initially, extended by one more year till 31March 2012 and the benefit of the scheme expanded to additional sectors.
Three additional Towns of Export Excellence (TEEs) announced, taking the list to 24.
Availability of Concessional Export Credit:
Interest subvention of 2 per cent extended up to March 2011 for certain labour-intensive sectors of exports.
Interest rates on export credit in foreign currency reduced to LIBOR + 200 bps in February 2010 from the earlierLIBOR+350bps.
EOUs/STPIs
Sections 10A and 10B (sunset clauses for STPI and EOUs schemes respectively) extended for the financial year2010-11. Anomaly in Section 10AA relating to taxation benefit of ‘unit vis-à-vis assessee’ removed;
Services
FTP also provided fillip to the services sector (hotels) by doubling duty-free entitlement under the Served FromIndia Scheme (SFIS) from 5 per cent to 10 per cent of foreign exchange earnings.
Others
Duty Entitlement Passbook (DEPB) Scheme extended beyond 31 December 2010 till 30 June 2011.
Time period of export realization for non-status holder exporters increased to 12 months, on par with the statusholders. This facility has been extended up to 31 March 2011.
Advance Authorization for Annual Requirement now exempted from payment of Anti-dumping and Safeguardduty.
Value limit on duty-free import of commercial samples enhanced from Rs 1 lakh to Rs 3 lakh per annum.
DEPB and Freely Transferable Incentive Schemes provisionally allowed without awaiting receipt of bank realizationcertificate (BRC).
Export obligation period under Advance Authorization Scheme enhanced from 24 months to 36 months withoutpayment of composition fee.
Facilitation of Trade through various Electronic Data Interchange (EDI) initiatives, namely online filing andprocessing of various authorizations to reduce transaction cost and time.
176 Economic Survey 2010-11
Website : http://indiabudget.nic.in
recently been set up. Individual Missions would ‘bid’for support from the Fund by submitting innovativeexport promotion project proposals. Priority wouldbe given to focused, specific projects withquantifiable/tangible results. During 2010-11 (up to31 December 2010), a total of 205 projects/exportpromotion events and eight market studies/exportpromotion surveys were approved for assistanceunder this scheme.
7.54 To stimulate and diversify the country’s exporttrade, the Marketing Development Assistance (MDA)Scheme is under operation. During the year 2010-11 up to 31 December 2010, a total of 411 projects/export promotion events have been approved forassistance.
Special Economic Zones (SEZs)
7.55 India recognized early the effectiveness of theexport processing zone (EPZ) model in promotingexports, with Asia’s first EPZ set up in Kandla in1965. With a view to overcome the multiplicity ofcontrols and clearances; absence of world-classinfrastructure; and an unstable fiscal regime to attractlarger foreign investments in India, the SpecialEconomic Zones (SEZs) Policy was announced in
April 2000. SEZs in India functioned from 1 November2000 to 9 February 2006 under the provisions of theForeign Trade Policy and fiscal incentives were madeeffective through the provisions of relevant statutes. The SEZ Act 2005, supported by SEZ Rules, cameinto effect on 10 February 2006, providing for drasticsimplification of procedures and for single windowclearance on matters relating to Central as well asState Governments. The SEZ Rules provide fordifferent minimum land requirements for differentclasses of SEZs.
7.56 In addition to seven Central Government SEZsand 12 State/private-sector SEZs set up prior to theenactment of the SEZ Act 2005, formal approval hasbeen accorded to 580 proposals out of which 374SEZs have been notified. The performance of SEZshas been reasonably good despite some criticism(see Box 7.4)
Tariff Reforms
7.57 The global recession forced a review of thetariff reform process. The pause button was pressedon peak duties in the last two years with the highestrate on manufactures continuing at 10 per cent. Theonly movement in tariffs was in the area of free trade
Table 7.16 : State-wise Exports of Top 15 States
(US$ million)
(April-September) Share(%) Growth rate* (%)
Sl. 2010-11No. State 2008-09 2009-10 2009-10 2010-11 2009-10 2009-10 (Apr-Sept.)
Total exports 1,85,295 1,78,751 80,950 1,05,352 100.0 -3.5 30.1
Source : DGCI&S.* Growth rate in US $ terms
177International Trade
Website : http://indiabudget.nic.in
Box 7.4 : Performance of SEZs in India
SEZs are becoming increasingly important in India’s exports. The performance of SEZs is mainly examined in threeareas, exports, employment, and investment.
Exports: A total of 130 SEZs are already exporting. Out of this 75 are information technology (IT)/ IT enabled services(ITES), 16 multi-product and 39 other sector specific SEZs. The total number of units in these SEZs is 3139. The physicalexports from the SEZs have increased by 121 per cent to ̀ 2,20,711 crore in 2009- 10 with a CAGR of 58.6 per cent during2003-04 to 2009-10 compared to the CAGR of 19.3 per cent for total merchandise exports of the country for the sameperiod. When the whole world including India was reeling under the effects of the global recession, growth in exportsfrom SEZs was 121 per cent in 2009-10 compared to a paltry 0.6 per cent growth in total exports from India. Exportsduring the first three quarters of the current year have been to the tune of ̀ 2,23,132 crore. The share of SEZs in India’stotal exports has increased consistently from 4.7 per cent in 2003-04 to 26.1 per cent in 2009-10 and 29.7 per cent in thefirst three quarters of 2010-11 (see Table 1).
Table 1 : SEZs Exports and India’s Total Exports: A Comparison Year
Exports from SEZs Exports from India Share of SEZsExports
Value Growth Value Growth in Total Exports (` crore) (%) (` crore) (%)
2003-04 13,854 39.0 2,93,367 4.7
2004-05 18,314 32.2 3,75,340 27.9 4.9
2005-06 22,840 24.7 4,56,418 21.6 5.0
2006-07 34,615 51.6 5,71,779 25.3 6.1
2007-08 66,638 92.5 6,55,863 14.7 10.2
2008-09 99,689 49.6 8,40,755 28.2 11.9
2009-10 2,20,711 121.4 8,45,534 0.6 26.1
2010-11 (Apr.-Dec.) 2,23,132 - 7,51,633 23.4 29.7
One of the criticisms SEZs face is that exports are mainly from the old SEZs which were formerly free trade zones (FTZs)and not from greenfield SEZs. It is interesting to know that not only have many greenfield SEZs started exporting butalso the exports of new SEZs, i.e. SEZs notified under the SEZ Act 2005, have grown rapidly over the years resulting inthe highest share of 53.4 per cent for this category in 2009-10 compared to Central Government SEZs and StateGovernment /private SEZs established prior to the SEZ Act 2005 (see Table 2).
Table 2 : Exports from New and Old SEZs
2005-06 2006-07 2007-08 2008-09 2009-10
Central Govt SEZs
Value (in ̀ crore) 19,657 25,358 39,275 46,985 58,037
Growth (%) - 29 54.9 19.6 23.5
Share (%) 86.1 73.3 58.9 47.1 26.3
State Govt/Pvt SEZs Established prior to SEZ Act, 2005Value (in ̀ crore) 3183 9134 22,167 31,640 44,729
Growth (%) - 187 142.7 42.7 41.4
Share (%) 13.9 26.4 33.3 31.7 20.3
SEZs notified under SEZ Act, 2005Value (in ̀ crore) - 122 5195 21,064 1,17,946
Growth (%) 4158.2 305.5 459.9
Share (%) - 0.4 7.8 21.1 53.4
Employment: Out of the total employment of 6,44,073 persons in SEZs, an incremental employment of 5,09,369persons was generated after February 2006 when the SEZ Act came into force. At least double this number obtainsindirect employment outside the SEZs as a result of the operations of SEZ units. This is in addition to the employmentcreated by the developer for infrastructure activities.
(Contd.....)
178 Economic Survey 2010-11
Website : http://indiabudget.nic.in
Investment: The total investment in SEZs till 31 December 2010 is approximately ̀ 1,95,348 crore including ̀ 1,91,313crore in the newly notified zones. In SEZs 100 per cent FDI is allowed through automatic route.The Government’s role hasbeen more as a facilitator by fast tracking the approvals rather than providing any direct monetary support. SEZs beingset up under the SEZ Act 2005 are primarily private investment driven.
Issues: Some important issues relating to SEZs are the following:
Direct Tax Code (DTC) Impact: The issue is related to deadlines for profit-linked deductions: As per the DTC, SEZdevelopers will be allowed profit-linked deductions for all SEZs notified on or before 31 March 2012. Units in SEZs thatwill commence commercial operations by 31 March 2014 too will be allowed profit-linked exemptions. Developers andunits notified after these dates will only have investment-linked exemptions and not profit-linked exemptions. There isconcern about these dates among developers and units particularly in the big SEZs with long gestation time.
Goods and Services Tax (GST): As per the GST model being considered, GST will be levied on imports with necessaryconstitutional amendments. Though full and complete set off would be available on the GST paid on import of goodsand services, after the introduction of the GST, tax exemptions, remissions, etc. related to industrial incentives should beconverted, if at all needed, into cash refund schemes after collection of tax, so that the GST scheme on the basis of acontinuous chain of set-offs is not disturbed. Regarding special Industrial Area Schemes, such exemptions, remissionswould continue up to legitimate expiry time both for the Centre and the States. However, any new exemption, remission,or continuation of an earlier one would not be allowed. In such cases, the Central and State Government could providereimbursement after collecting the GST.
Issue of Power generation and distribution: Another area of concerns is the generation and distribution of power by theSEZ developers/units. While one opinion is that it should be left to the entrepreneur to decide whether he would like toprovide power as an infrastructure, as defined in the SEZ Act, or set up a unit to sell power as a good, another view isthat power cannot be an infrastructure and can be only a good to be generated and distributed by the unit. It may beworth considering appropriate policy to encourage power generation and distribution.
Coordination issues: The Directors, STPI, have been declared Development Commissioners (DCs) for the IT SEZs undertheir respective jurisdiction. An STPI is under administrative control of the Department of Information Technology.Other multi-product and sector-specific SEZs are under the charge of DCs appointed by the Department of Commerce.However a number of issues, for example processing of notification of IT SEZs, coordination with state governments etc,relating to IT SEZs are also looked after by the DCs appointed by the Department of Commerce. This leads to a situationof dual control adversely impacting effective coordination and needs to be resolved.
Disinvestment: The new SEZs have come up mainly in the private sector with no funding from the Government. Now thetime has possibly come to see whether some of the established SEZs which are state owned could also be privatized.Disinvestment in these SEZs could not only add to the kitty of the Government and release more money for social-sectordevelopment but could also make these SEZs more efficient.
Box 7.4 : Performance of SEZs in India (Contd....)
agreements (FTAs) like the one with ASEAN. Thetariff policy in 2009-10 focused on tackling inflationby lowering import duties of specific items. Whilethe current concerns on current account deficit maylead to the pause button remaining pressed, a stepforward in tariff reforms could be taken even in thesetrying times (see Box 7.5)
7.58 The other tariff reforms could include measureslike reducing end-use exemptions as the revenueforegone on account of export promotionconcessions in 2009-10 was ` 43,622 crore,rectifying the inverted duty structure, removingQuantitative Restrictions (QRs) from petroleumproducts as the Administrative Price Mechanism(APM) has been dismantled, and introducing sunsetclauses for export promotion schemes having tariffconcessions.
Contingency Trade Policy and Non-tariffMeasures
7.59 Anti-dumping investigations initiated by allcountries started falling after reaching a peak in2001, numbering 165 in 2007. However, in 2008, theyagain rose to 213. While they fell marginally to 209in 2009, there seems to be a downward movementin 2010, with only 69 investigations initiated in thefirst half of the year (Table 7.17). India’s anti-dumpinginitiations fell from 55 in 2008 to 31 in 2009. Inthe first half of 2010, there were 17 anti-dumpinginitiations by India. During 2010-11 (up to 31December 2010), the Directorate General ofAntidumping and Allied Duties has initiated 13 freshanti-dumping investigations. The products involvedare certain hot rolled flat stainless steel products,azodicarbonamide, sewing machine needles,
179International Trade
Website : http://indiabudget.nic.in
Box 7.5 : Lowering Peak Duties with Least Revenue Loss
Peak duties for manufactures could be reduced from 10 per cent by tinkering intelligently with the tariffs without anyfall in collection rates given the fact that total collection rates (an indicator of overall incidence of tariffs includingcountervailing and special additional duties) have fallen to a low of 5.9 per cent in 2009-10 (see Table 1). The fallingcollection rate is a function of both rising import volumes as well as leakages due to exemptions on account of end useand the countervailing excise duty applicable on import goods.
Table 1: Tariff collection Rates for selected import groups*
5 Paper and Newsprint 7.2 7.4 9.2 9.5 10.3 8.4 7.7
6 Natural Fibre 13 10.6 12.5 12.1 12.6 5.6 4.3
7 Metals 32 25.8 25 24.1 24.3 16.8 17.4
8 Capital Goods 19 15.8 12.5 14.3 15.7 12.5 11.3
9 Others 7.6 5.5 5.2 5.7 6.1 4 3.8
10 Non POL 14.4 12.1 11.5 12.3 12.8 8.7 7.6
Total 13.5 11.5 9.8 10.2 10.4 6.9 5.9
Source: Department of Revenue, Ministry of Finance.
* Collection rate is defined as the ratio of revenue collection (basic customs duty+ countervailing duty) to value of importsunadjusted for exemptions, expressed in percentage.
Sl No.1 includes cereals, pulses, tea, milk and cream, fruits, vegetables, animal fats, and sugar.
Sl No.3 includes chemical elements, compounds, pharmaceuticals, dyeing and coloring materials, plastic, and rubber.
Sl No.5 includes pulp and waste paper newsprint paperboards and manufactures and printed books.
Sl No.6 includes raw wool and silk.
Sl No.7 includes iron and steel and non ferrous metals.
Sl No.8 includes non-electronic machinery and project imports, electrical machinery.
In 2009-10, there are 340 tariff lines under capital goods and 4135 lines under intermediates consisting mainly of goodsgoing into manufacture of finished products with tariffs of 10 per cent and above. The two groups in the high dutycategory account for as much as 39 per cent in the total number tariff lines. The share of the two categories in the dutyslab of 10 per cent and above in notional duty (that is the revenue which should have come to the exchequer from theimport volumes and duty rates but for the end use exemption or special category like export promotion) is 2.5 per cent(in the case of capital goods) and 33.5 per cent (in the case of intermediate goods) of the total notional revenue estimatedat ̀ 2,02,705 crore. If both capital and intermediate goods are brought under the 7.5 per cent duty slab and if collectionrates are assumed to be the same, then there is a revenue loss of around ` 11,747 crore. However, in the case ofintermediate and capital goods the collection rates are higher in the 7.5 per cent duty slab compared to the 10 per centand above slab. If these collection rates were factored into the calculations, there could be an actual gain in revenue dueto better compliance and fall in undervaluation associated with improved collection rate in the low duty 7.5 per cent slabas compared to the 10 per cent plus slab. One of the reasons for this is that countervailing duty exemptions, for examplein textiles, are high in the 10 per cent slab compared to the 7.5 per cent slab.
Moving capital and intermediate goods to the 7.5 per cent slab would result in the number of tariff lines with duty of 7.5per cent accounting for 79.6 per cent (or nearly 80 per cent) of the total. They will cover 97.45 per cent of imports. Evenif some intermediate goods and all capital goods are moved to the 7.5 per cent and below category, then a major part ofmanufactures will have peak duty of 7.5 per cent or less. This will give a big push to industrial growth and exports,besides giving leverage power in WTO negotiations as well as FTAs.
Table 1 also shows that the collection rates for capital goods are still relatively high at 11.3 per cent in 2009-10 after allthe exemptions including concessions under the Export Promotion Capital Goods (EPCG) scheme. This also needsattention.
180 Economic Survey 2010-11
Website : http://indiabudget.nic.in
caustic soda, paranitroaniline , stainless steel coldrolled flat products of 200 series having width below600 mm, stainless steel cold rolled flat products of400 series having width below 600 mm, soda ash,opal glassware, melamine, morpholine, geogrids andaniline-III. The countries involved in theseinvestigations are the European Union, Korea, SouthAfrica, Taiwan, the USA, China PR, Thailand,Norway, UAE, Kenya, Iran, Pakistan, Turkey,Ukraine, Indonesia, Japan, Malaysia.
7.60 Over the last two decades the world haswitnessed rapid expansion of global trade andreduction in tariff rates both through the multilateralarrangement under the WTO as well as various typesof trade cooperation agreements including FTAs.However, at the same time developed countries areincreasingly resorting to the use of non-tariffmeasures (NTMs) to protect their domesticindustries.
7.61 The WTO-UNCTAD (United NationsConference on Trade and Development)-OECDReports on G-20 trade and investment measures(the fourth one being the latest) states that thenumber of new measures imposed by G-20 countriesis still increasing, but more slowly than in the pastand with a welcome decline in the initiation of new
trade remedy actions (anti-dumping duties,countervailing measures, and safeguards). The newrestrictive measures introduced during differentperiods following the global recession show a fall,covering only 0.3 per cent of total G-20 imports and0.2 per cent of world imports in May 2010-October2010 (see Table 7.18).
7.62 However, there is an accumulation of the traderestrictive measures with limited progress inunwinding them. Since October 2008, on aggregate,new G-20 trade restrictions have grown to cover 1.8per cent of G-20 imports and 1.4 per cent of totalworld imports. Only around 15 per cent of the traderestrictive measures introduced since the outbreakof the crisis have so far been removed, whichindicates that the bulk of them still remain in force.
7.63 In terms of number of trade measures, themost affected sectors include electrical machineryand equipment; chemical products; mineral fuel;machinery and mechanical appliances; iron andsteel; cereals; plastic products; and dairy products.The sectors most heavily affected in terms ofcoverage of restrictive trade measures were electricalapparatus for line telephony, bio diesel, and automaticdata processing machines. The large majority ofG-20 actions since mid-May 2010 have been trade
Table 7.18 : Share of New Trade Restrictive Measures
Oct. 2008–Oct. 2009 Nov.2009–May 2010 May 2010–Oct. 2010
In total world imports 0.8 0.4 0.2
In total G20 imports 1.0 0.5 0.3
Table 7.17 : Investigations initiated by top ten users of anti-dumping measures 1995-2010
European Community 33 32 28 30 25 35 9 19 15 8 414
Argentina 27 43 28 12 12 11 8 19 28 7 277
South Africa 16 21 6 6 23 3 5 3 3 0 212
Australia 5 15 23 9 7 10 2 6 9 4 212
Brazil 5 11 17 8 6 12 13 23 9 5 184
Canada 11 21 25 11 1 7 1 3 6 1 152
China PR 0 11 14 27 24 10 4 14 17 4 182
Turkey 0 7 15 25 12 8 6 23 6 1 145
All Countries 157 298 371 220 202 203 165 213 209 69 3752
Source: WTO *Upto June 2010.
181International Trade
Website : http://indiabudget.nic.in
remedies, in particular the initiation of new anti-dumping investigations, followed by increases intariffs and other import-related taxes. Among non-verified measures, the most frequent actions wererelated to export taxes or restrictions, non-tariffmeasures (import bans, licences, or other bordercontrols), and government measures aimed atfavouring domestic industries or products. The mostfrequently reported export measures concernrestrictions on some agricultural products (exportbans and quotas affecting grains) and some minerals(export quota reductions and reported informal banson rare earth minerals)
7.64 Some G-20 members have raised tariffs andintroduced new non-tariff measures to protectdomestic production in certain sectors, notably steeland motor vehicles. G-20 members have continuedto use trade defence mechanisms in these as wellas other sectors like non-automatic import licenses.The US and EU have re-introduced agricultural exportsubsidies for the dairy sector, measures that aregenerally acknowledged to be among the most highlytrade-distorting. Some of the fiscal and financialpackages that have been introduced to tackle thecrisis contain elements such as state aids, othersubsidies, and ‘buy/lend/invest/hire local’ conditionsthat favour domestic goods and services at theexpense of imports. Stricter application of Sanitaryand Phytosanitary measures (SPS) and TBT(technical barriers to trade) regulations and slowerprocedures and additional procedural requirementsare the other measures imposed by countries. Thus,in the area of trade, there has been policy slippagesince the crisis began and this has continued afterthe G-20 London Summit in April 2009.
7.65 India has adopted a multi-pronged strategyto deal with the issues relating to non-tariff measures(NTMs). On the export side, an online database hasbeen set up, on the SPS and TBT notification (whichmay result in NTMs) notified to the WTO by members.This is to provide information to exporters about theregulatory regime of other countries. Besides, stepsare being taken to upgrade the infrastructure andsurveillance system at the major ports and airportsto ensure due compliance with our standards andregulations. Moreover, wherever India’s exportinterest is affected, issues are raised by theGovernment in suitable redressal forums availableunder the WTO such as in the SPS and TBTCommittee. These issues are also taken up inbilateral forums.
WTO NEGOTIATIONS AND INDIA
Trade Negotiations
7.66 The Doha Round of trade negotiations at theWTO has been under way since 2001. Discussionswere slow to resume after they paused in December2008 and there has not been much progress since.A stock taking exercise at the level of senior officialstook place in the WTO in March 2010, wheremembers agreed to take the discussions aheadbased on the work already done while maintainingthe focus on the development dimension of theRound. The positive signals given by world leadersat the G-20 Leaders’ Summit held in Seoul inNovember 2010, have imparted a sense of urgencyamongst members regarding the Geneva processthat is supposed to resume in January 2011. TheDirector General, WTO, has suggested a cocktailapproach of discussions combining the Chair-ledprocesses within the negotiating groups and bilateralcontacts, both in specific areas and at horizontallevel. India is willing to work with the coalition groupsin the WTO towards an early conclusion of the DohaRound. Its stand, however, is unequivocal: theprotection of poor, subsistence farmers of developingcountries and vulnerable industries is a priority.
7.67 In the area of agriculture, discussions are stilltaking place on the basis of the revised draftagriculture modalities text of 6 December 2008. Asper this draft, developed countries would have toreduce their bound tariffs in equal annual installmentsover five years with an overall minimum average cutof 54 per cent. Developing countries would have toreduce their bound tariffs with a maximum overallaverage cut of 36 per cent, over a largerimplementation period of ten years. Both developedand developing country members would have theflexibility to designate an appropriate number of tarifflines as sensitive products, on which they wouldundertake lower tariff cuts. Developing countrieswould have a special products (SP) entitlement of12 per cent of agricultural tariff lines. An averagetariff cut of 11 per cent is proposed on SPs,including 5 per cent of total tariff lines at zero cuts.There are also reductions/disciplines proposed forvarious categories of domestic and export subsidies.
7.68 In the case of Non-Agricultural Market Access(NAMA) negotiations, the tariff reductions areproposed through a non-linear Swiss formula with athree-tiered coefficient of 20, 22 and 25 for formulareductions linked to specific flexibilities for protectingsensitive NAMA tariff lines of developing countries
182 Economic Survey 2010-11
Website : http://indiabudget.nic.in
and a coefficient of 8 for tariff reduction of developedcountries. With regard to the Sectoral proposal ofsome countries, by which the tariffs in certainidentified sectors are proposed to be brought to zeroor near zero levels, India’s negotiating position hasbeen that participation in sectoral initiatives mustbe non-mandatory and on a good faith basis withoutpre-judging the outcome. Another important aspectof NAMA negotiations pertain to Non-Tariff Barriers(NTBs). With regard to this, India is one of the initialproponents of the Horizontal Mechanism (HM)proposal. It aims to bring in a ministerial decision on“Procedures for the facilitation of NTBs’. Thisproposal has received the support of more than 100WTO Member countries. Though the Doha mandaterefer to NTBs in the context of ‘products of exportinterest to developing countries’, there have beensome moves to utilize this increasing market accessof remanufactured goods by some countries, led byUnited States of America. India’s negotiating positionon this is that since there is no agreed definition onremanufactured goods, a work programme is requiredin the first place for defining and distinguishingremanufactured goods in contrast to other secondhand goods which might have grave implications onthe environment and livelihood aspects of thedeveloping countries. The work programme has nowgot support from around 17 countries.
7.69 In services, India has been a demandeur. Ithas also offered substantial sectoral and modalcoverage in its initial offer (January 2004) and thefirst revised offer (August 2005) of the ongoingservices negotiation. At the Signaling Conference(July 2008) which was held on the sidelines of theMini-Ministerial meeting, some further improvementswere also conveyed. However, India’s offers / signalsare conditional on receiving satisfaction in respectof its Modes 1 / 2 and Mode 4 requests.
7.70 The services negotiations at the WTO havebeen rejuvenated after the G-20 Meeting. Substantiveinterest has been evinced by all members to intensifythe negotiations to make use of the limited windowof opportunity (2011) to conclude the negotiations.As a part of the plurilateral process (where morethan two countries are involved), 22 plurilateral groupshave been formed at the WTO in service sectors/modes. India is the coordinator of the plurilateralrequests in Mode 1 (cross-border supply) and Mode4 (Movement of Natural Persons) - the core areas ofits interest in the services negotiations. India is alsoco-sponsor of plurilateral requests in computer andrelated services (CRS) and architectural, engineeringand integrated engineering services.
7.71 India has shown considerable movement fromUruguay Round commitments to revised offers;however its primary requests in Modes 1 and 4 havenot been addressed by key developed countries.Some of the major developed country members haveshown little or no movement in their Mode 4 offerswhich is a major cause of concern to India. The USand other developed countries such as Australia aretrying to introduce a new approach to servicesnegotiations by way of the clustering initiative. Indiahas opposed this cluster approach on procedural aswell as substantive grounds. The lack of progress inservices under the Doha Round is not due to problemswith the approach of negotiations but because oflack of political will, inadequate response fromdeveloped countries in sectors and areas of exportinterest to developing countries, and little movementin agriculture and NAMA.
7.72 One of the areas of crucial interest to India isdevelopment of disciplines in domestic regulations(DR) involving qualifications and licensingrequirements and procedures without which Mode 4access gets severely impeded. Negotiations on thissubject are proceeding on the basis of theChairman’s text of March 2009. In order to take thenegotiations forward, a fresh round of offers wouldneed to be tabled at the WTO by member countries.A timeline for the submission of the second revisedoffers in services would be decided after abreakthrough is achieved in agriculture and NAMA.An ambitious outcome in services has to be anessential part of any breakthrough package. Indiahas repeatedly stated that any future work in servicesmust be anchored in Annex C of the Hong KongMinisterial Declaration. Members need to spell outclearly how they intend to meet the modal objectivesoutlined in Annex C. In particular, developed countriesneed to provide clear signals of market openings insectors and modes of interest to developingcountries, particularly in Modes 1 and 4.
Rules Negotiations
7.73 Negotiations are taking place in theNegotiating Group on Rules (NGR) aimed at clarifyingand improving disciplines under the Anti DumpingAgreement and the Agreement on Subsidies andCountervailing Measures (ASCM), while preservingthe basic concepts, principles, and effectiveness ofthese agreements and their instruments andobjectives. Members are also discussing newdisciplines for fisheries subsidies.
183International Trade
Website : http://indiabudget.nic.in
7.74 The discussions on Chair’s draft text of 18December 2008 continued during 2010. Consensuseludes on the bigger issues in anti-dumping suchas zeroing, sunset reviews, lesser duty rule, publicinterest, causation, and anti-circumvention. InSubsidies Agreement, considerable divergenceremains in the proposals on specificity, subsidiesin the case of inputs provided at regulated prices,and benchmarks for export finance. India has beenseeking strengthened anti-dumping rules so as toprohibit the use of zeroing in dumping margincalculation, strengthening of the rules for conductof sunset reviews, and mandatory application oflesser duty. In the Subsidies Agreement, India isopposed to the enlargement of the scope ofprohibited subsidies in the ASCM and /or limiting ofthe existing flexibilities for the developing countries.In the negotiations on the new disciplines on fisheriessubsidies, India is seeking effective special anddifferential (S&D) treatment for the developingcountries, particularly in the light of employment andlivelihood concerns for small, artisanal fishingcommunities and for retaining sufficient ‘policyspace’ so as to enable it to develop its infrastructure.
Trade Facilitation
7.75 Another important area of the Doha round isthe negotiations on trade facilitation. Simplificationof trade procedures by reducing trading costs is inthe interest of all WTO members. A DraftConsolidated Negotiating Text on Trade Facilitationwas worked out by the WTO members on14 December 2009. The draft text has since beenrevised six times in 2010 through discussions in themeetings of the Negotiating Group on TradeFacilitation. India has been actively participating inthese meetings and has also tabled a few proposalson ‘Customs Cooperation’, ‘Rapid Alerts System ofCustoms Union’, and ‘Appeal Mechanism’.Developed countries do not want to change theirtrade procedures but expect others to do so.Developing countries have, by and large, adoptedan extra defensive approach to negotiations. Leastdeveloped countries, in general, do not want toundertake any binding commitment. Capacityconstraints and lack of resources are two majorfactors that prevent developing countries (and leastdeveloped countries) from taking on bindingcommitments in trade facilitation. The currentscenario indicates that developed countries andother donors may not invest in building physicalinfrastructure in these countries, although the July2004 Framework Agreement clearly links
commitments to support and assistance forinfrastructure development. It is important that thislinkage is respected by the entire WTO membership,particularly the developed countries and thatadequate assistance is provided for implementationof commitments so that a high standards agreementon trade facilitation can be reached.
BILATERAL AND REGIONAL
COOPERATION
7.76 In the past, India had adopted a very cautiousand guarded approach to regionalism. However,recognizing that Regional and Preferential TradingAgreements (RTAs) would continue to featureprominently in world trade and given the slow natureof multilateral negotiations, India began moving inmost cases towards Comprehensive EconomicCooperation Agreements (CECAs). Some of therecent developments related to major FTAs/RTAs/CECAs are the following:
India-EU Trade and Investment AgreementNegotiations: Negotiations for a Broad-basedBilateral Trade and Investment Agreement(BTIA) between India and the EU started inJune 2007. So far eleven rounds have beenheld. The last round was held in India in January2011.
India-Japan Economic PartnershipAgreement (EPA) ComprehensiveEconomic Cooperation PartnershipAgreement (CEPA)Negotiations: Thenegotiations for a CEPA started in January 2007and an ‘in principle’ Agreement was signedduring the 14th Round on 9 September 2010in Tokyo.
India–Malaysia Comprehensive EconomicCooperation Agreement (CECA): India-Malaysia CECA negotiations were launchedin February 2008. The negotiations have beenconcluded in September 2010. The CECAincluding trade in goods, services, investment,and other areas of economic cooperation, wouldbe signed as a Single Undertaking. Taking intoaccount the India-ASEAN Trade in GoodsAgreement that was implemented in January2010 between India and Malaysia, both sideshave offered ‘ASEAN plus’ market access ingoods. On 27 October 2010, the PrimeMinisters of India and Malaysia haveannounced conclusion of the negotiations withthe Agreement scheduled to be signed by early2011 and implemented by 1 July 2011.
184 Economic Survey 2010-11
Website : http://indiabudget.nic.in
India-Korea CEPA: An India—Korea CEPAwas signed on 6 August 2009 and implementedwith effect from1 January 2010 covering tradein goods, investment, services and bilateralcooperation in areas of common interest. Underthe CEPA, tariffs will be reduced or eliminatedon 93 per cent of Korea’s tariff lines and 85 percent of India’s tariff lines. It will facilitate tradein services through additional commitmentsmade by both countries to ease movement ofindependent professional and contractualservice suppliers.
India-ASEAN Trade In Goods Agreement:On 13 August 2009, India and ASEANcomprising Brunei Darussalam, Cambodia,Indonesia, Lao PDR, Malaysia, Myanmar,Philippines, Singapore, Thailand, and Vietnamsigned the Trade in Goods Agreement underthe broader framework of a ComprehensiveEconomic Cooperation Agreement (CECA)between India and ASEAN. The Trade in GoodsAgreement provides for elimination of basiccustoms duty on 80 per cent of the tariff linesaccounting for 75 per cent of the trade in agradual manner starting from 1 January 2010.India has excluded 489 HS 6 digit lines fromthe list of tariff concessions and 590 HS 6 digitlines from the list of tariff eliminations toaddress sensitivities in agriculture, textiles,auto, chemicals, crude and refined palm oil,coffee, tea, pepper, etc.
Asia Pacific Trade Agreement (APTA): APTAincludes Bangladesh, the Republic of Korea,Sri Lanka, China, Lao PDR and India. The fourthround of negotiations was launched in Goa inOctober 2007 in the Second Session of theMinisterial Conference. To move forward thefourth round of negotiations, the third meetingof the Ministerial Council and the 35th Sessionof the Standing Committee were held on 15December 2009 and 13 – 14 December 2010respectively in Seoul, South Korea.
CHALLENGES AND OUTLOOK
Outlook
7.77 The outlook for India’s trade sector hasbrightened with a good growth of 29.5 per cent in2010-11 (April-December), a robust growth of 36.4per cent in December 2010 and similar signs forJanuary 2011. However, this bright picture needs tobe moderated on account of the recent developments
in world trade, though transient in nature at present.While world merchandise trade picked up in the firsthalf of 2010, there was a slowdown in the third quarterof 2010 due to the base effect and drying up of fiscalstimulus. The growth of exports and imports hasalso moderated in India’s major trading partners inthe last few months of 2010. In particular, the importgrowth of the EU has been decelerating even beforeit could fully pick up, falling to as low as 7.8 per centand 6.1 per cent in July and September 2010respectively and picking up in October and November2010 to 9.3 per cent and 12.6 per cent respectively.This situation in the EU may continue for some timewith fresh bouts of financial turbulence flaring up inthe periphery of the Euro area in the fourth quarter of2010. Deceleration was also registered in othermarkets like Hong Kong, USA, Japan, andSingapore.
7.78 On the import side there is new trouble brewingup in the Middle East resulting in oil prices (Brent)which were hovering at around US$ 95 per barrelcrossing the US $ 100 mark in February 2011 andgold prices steadying at around US$1341 per troyounce (as on 28 January 2011) after reaching a peakof US$1423 on 7 December 2010. Although theconcerns on the trade deficit front have subsidedwith pickup in exports in the last five monthsand slowdown in imports in the last three months of2010-11 (April-December), the situation needs to bewatched. However, the deceleration in net surplus ofservices trade is a cause for worry on the currentaccount deficit front.
Challenges
7.79 After withstanding the crisis successfully, theshort-term challenges on the trade front for India arerelated to speeding up and maintaining the tempo ofexport growth and ensuring that the slightly dimmedprospects on the trade growth front do not come inthe way of the reforms agenda. The gradualwithdrawal of stimulus measures by India and othercountries is not likely to adversely affect India’s risingexports. However, there is need to be vigilant aboutany fallout of the financial turbulence in the peripheryof the Euro zone and the new disturbances in theMiddle East. Equally important is the need to guardagainst new protectionist measures. Though manyof these are on the decline, those already in placeneed early winding up. India may have to raise itspitch in bilateral and international forums on earlywithdrawal of these trade distorting measures andalso insist on sunset clauses for the remainingmeasures. The continuation of inflation concerns on
185International Trade
Website : http://indiabudget.nic.in
Box 7.6 : Trade Policy Reforms : Some Challenges for the Medium and Long Term
Some important challenges for India’s trade sector in the medium and long term are the following:
Challenge of becoming a major player in world trade: The challenge for India is to achieve a share in world tradecommensurate with its size. Despite making great strides in its export growth with 20 per cent plus growth continuouslyfrom 2002-03 to 2007-08, India has not made much progress in terms of the share in world trade. While India’s exportswere higher than those of China till 1954, they started lagging thereafter. In 1990, shares in world exports of China andIndia were 1.8 per cent and 0.5 per cent respectively and in 2009, their respective shares stood at 9.7 per cent and 1.3 percent. If India can attain at least half of China’s share in world exports, the impact on its employment and manufacturingactivity will be enormous. While trade policy measures, shift in focus to some markets and some products, tradefacilitation, tariff reforms, etc. have helped in some measure, if India has to achieve a substantial share in world exports,a big push will be needed.
Challenge of real diversification of India’s exports: While India has diversified its export basket as well as exportmarkets over the years, substantial diversification in tune with world demand has not taken place. This can be seen bymatching India’s exports with the top 100 imports of the world at the six-digit HS level. The exercise based on PCTASdata 2010(data for 2008) shows that India’s presence in these top items of world demand is negligible except for a fewitems such as diamonds and jewellery, oil cakes, t-shirts, mens/boys trousers, flat rolled iron products, and maize(corn). There are many electronic, electrical, and engineering items (the three Es) in the top 100 imports of the world whereIndia’s presence is negligible.
Challenge of increasing export competitiveness: India’s export competitiveness is being challenged not only fromChina and the South East Asian countries but also from the newly emerging Asian countries, less developed countrieslike Bangladesh, and small countries like Vietnam in items like textiles. At macro level, the two major determinants ofexport competitiveness are the exchange rate and inflation reflected in the real effective exchange rate (REER). As per theRBI, there has been a distinct divergence between the movements of six-currency and 36-currency REER indices so farduring 2010-11. While the six-currency REER remained above base level by 16 to 20 per cent, signifying higher inflationdifferentials with these economies, the 36-currencyREER largely remained below or around base level, implying thatinflation in India has been comparable to or below the levels prevailing in its trading partners in the developing world.The magnitude of nominal exchange rate appreciation/depreciation of the currencies of these countries also differed, asreflected in the 30-currency REER derived after the exclusion of the 6-currency index from the 36-currency index. If thepositive inflation differentials persist and the tendency among some countries to use undervalued exchange rates toboost their export further amplifies, then the competitiveness of Indian exports may come under pressure. At the microlevel there are issues like the high transaction cost in exports. The recent Department of Commerce report of the ‘TaskForce on Transaction Cost in Exports’ also highlights this issue. Quoting the World Bank ‘Doing Business’ Report itstates that it takes 17 days to export a container from India and costs US$945 per container, compared to US$450 andUS$ 500 in Malaysia and China respectively. Denmark, Brazil, Mexico and China take 5 days, 12 days, 14 days and 21days respectively to export a container from their countries. The report estimates the magnitude of transaction cost atapproximately US$ 13 billion. It has identified 44 issues for action, of which 21 issues have been implemented and 11issues are under the process of implementation. Implementation of the 21 issues and another 2 issues is likely tomitigate the transaction cost by ` 2100 crore (i.e. around US$467 million). Further efforts to reduce transaction costcould increase India’s export competitiveness.
Challenges related to tariff reforms: India has been progressively lowering peak customs duty. The fall in peak dutyhas not led to the feared collapse in revenue collections. The duty cuts have neither wiped out the domestic manufacturingsector nor resulted in large-scale unemployment as forecasted by many. The data show that progressive peak duty cutshave been accompanied by rise in customs duty collections. However, further bold tariff reforms with minimum revenueloss are needed to reach levels comparable to those in ASEAN both for peak rate as well as total duty (also see Box 7.5).One area of tariff reforms is related to customs duty exemptions and export promotion schemes. As a percentage ofaggregate tax collection, revenue foregone remains high with more than half of all notional revenues flowing into theforegone account. What is worse, an increasing trend is visible over the last three years. In financial year 2009-10, only41.7 per cent of notional duty was collected compared to 44.6 per cent and 51.1 per cent in 2008-09 and 2007-08respectively. Substantial revenue is foregone on account of the different export promotion schemes. In 2010-11, revenueforegone will continue to be significant at more than ̀ 50,000 crore due to enlargement of the scope of schemes underthe Foreign Trade Policy 2009-14 (FPS/FMS/VKGUY) and improvement in export promotion rates in the Duty EntitlementPassbook (DEPB) Scheme coupled with pickup in exports. The revenue loss from end-use exemptions will also go upwith rising imports. There is also the question of accountability in the case of different schemes, which involve substantialexemptions. While some exemptions are needed particularly at this juncture to promote exports, there is scope forreducing the duty foregone by rationalization and convergence of these schemes. One such example is related to theExport Promotion Capital Goods (EPCG) scheme. With import duties of general capital goods being reduced consistently,the differential with total EPCG has come down from 35.4 per cent to 21.5 per cent during the last five years. Anotherreduction in import duties for all capital goods preferably to the 3 per cent duty level stipulated for the general EPCGand simultaneous withdrawal of the EPCG scheme could help in avoiding revenue leakages and serve as a major step
(Contd.....)
186 Economic Survey 2010-11
Website : http://indiabudget.nic.in
in rationalizing export promotion schemes. It will also serve as an upfront push to the import of capital goods formodernization of the manufacturing and services sector in general and export manufacturing in particular.
Challenges related to FTAs/Comprehensive Economic Cooperation Agreements (CECAs) in the absence of successfulWTO negotiations. The proliferation of FTAs in the world is characterized as the ‘spaghetti bowl’ in which trade criss-crosses in a complex fashion between countries based on tariff differentials and complicated rules of origin. In recent years,India too is a part of many regional and bilateral groupings. While there are benefits from these FTAs for Indian exports,in some cases the benefits to the partner countries are much more, with net gains of incremental exports from India beingsmall or negative. FTAs also lead to a new type of inverted duty structure with duties for final products being lower fromFTA partners compared to duties for the previous-stage raw materials imported from non-FTA countries. This acts as adisincentive to local manufacturing which is not competitive against FTA imports because of the inverted duty structurephenomenon. For example, the normal customs duty on Indian TV sets is 10 per cent, but in the case of imports fromThailand and Singapore there is zero duty subject to the rules of origin requirement. There are similar issues even inagricultural items. For example, arecanuts or betel nuts have a basic customs duty of 100 per cent. But this duty is nil orat concessional low rate at different levels for imports from Sri Lanka under the Indo-Sri Lanka FTA and the South AsianFree Trade Area (SAFTA) agreement and from FTA partners like Myanmar, Bhutan, and Nepal. This could affect someregions which depend mainly on cultivation of arecanuts for livelihood. Following the ban of some States on arecanutproducts, demand crashed. Allowing imports at concessional duties under FTAs for items that are banned by some Statesneeds reconsideration. The policy challenge related to FTAs/CECAs should take note of specific concerns of the domesticsector and ensure FTAs do not mushroom. Instead they should lead to higher trade particularly higher net exports fromIndia.
Challenges related to services trade: Services trade is uncharted territory with plenty of opportunities and challenges.A more conducive environment for trade in services can be created by liberalizing FDI in services as FDI inflows and tradein services have a close relationship given the nature of intra-firm trade of multinational parent firms with affiliates;rationalizing taxes in services like shipping and telecom; going forward with totalization agreements; streamlining domesticregulations like licensing requirements and procedures, technical standards, and regulatory transparency which can helpin the growth and export of services; and continuing with the focus on services in multilateral and bilateral negotiations.These, along with systematic marketing of services, collection and dissemination of market information by setting up aportal for services, streamlining the services data system, and a more focused, coordinated, and synchronized policy bythe different agencies involved, could help the services sector make further strides. (Also see Chapter 10)
Box 7.6 : Trade Policy Reforms: Some Challenges for the Medium and Long Term (Contd...)
the domestic front would also mean that trade policymeasures could be put to further test in the comingfiscal year to tackle inflation. This could further erodethe exports of the already battered agricultural exportsector. This has necessitated the formation of asystematic inflation-tackling mechanism with earlywarning systems, rather than resorting to ad hocpolicy measures.
7.80 The challenges in the medium to long termhave to be seen in the light of the many paradoxesin the Indian trade sector (Also see Box 7.6). WhileIndia is becoming an active player in world trade
negotiations and shaper of world trade policy, it isstill a small player in world trade. While it is tryingto gain markets and increase competitiveness innew areas, it is losing markets and competitivenessin some of the traditional areas. While it has madesome forays into exports of some dynamiccommodities having high shares and highgrowth, it has not been able to make a real dentin the trade of these big ticket items which are topof the list of world demand. Thus the potential forIndia in trade is great, but the challenges are alsoaplenty.
Agriculture and FoodManagement CHAPTER
8
Pioneering work by agriculture scientists and the efforts of farmers had helpedachieve a breakthrough in the agriculture sector in the 1960s, popularly known asthe ‘Green Revolution’. High agricultural production and productivity achieved insubsequent years has been the main reason for attaining food security to a largeextent. The country has not witnessed any big technological breakthrough inagriculture since then. The food safety net for each and every of the over a billioncitizens—a number that is growing— requires enhanced agricultural production andproductivity in the form of a Second Green Revolution. Further, special attention isrequired for achieving higher production and productivity levels in pulses, oilseeds,fruits, and vegetables, which had remained untouched in the First Green Revolutionbut are essential for nutritional security. In this regard, achieving high production ofpoultry, meat and fisheries is also essential. The relatively weak supply responses toprice hikes in agricultural commodities, especially food articles, in the recent pastbrings back into focus the central question of efficient supply chain management andneed for sustained levels of growth in agriculture and allied sectors. The choice beforethe nation is clear—to invest more in agriculture and allied sectors with the rightstrategies, policies, and interventions. This is also a ‘necessary’ condition for ‘inclusivegrowth’ and for ensuring that the benefits of growth reach a larger number of people.
8.2 The growth of agriculture and allied sectorsis still a critical factor in the overall performance ofthe Indian economy. As per the 2010-11 advanceestimates released by the Central Statistics Office(CSO) on 07.02.2011, the agriculture and allied sectoraccounted for 14.2 per cent of the gross domesticproduct (GDP), at constant 2004-05 prices. During
the period 2004-05 to 2007-08, the GDP for agricultureand allied sectors had increased from ` 5, 65,426crore to ` 6,55,080 crore, at constant 2004-05prices; thereafter it stagnated at this level for twoyears (2008-09 to 2009-10) (Figure 8.1). In 2009-10,it accounted for 14.6 per cent of the GDP comparedto 15.7 per cent in 2008-09 and 19.0 per cent in
550
GDP
GDP for agriculture and allied sectors
600
650
700
Figure 8.1
� t
hous
and
cror
e
Year
2004
-05
2007
-08
2006
-07
2008
-09
2010
-11
(AE)
2009
-10
(QE)
2005
-06
Website: http://indiabudget.nic.in
188 Economic Survey 2010-11
Website: http://indiabudget.nic.in
Table 8.1 : Agriculture Sector: Key Indicators
(per cent)
Sl. Item 2008-09 2009-10 2010-11No. (Advance
Estimates)
1 GDP—Share and Growth (at 2004-05 prices)Growth in GDP in agriculture & allied sectors -0.1 0.4 5.4Share in GDP—Agriculture and allied sectors 15.7 14.6 14.2Agriculture 13.3 12.3Forestry and logging 1.6 1.5Fishing 0.8 0.8
2 Share in Total Gross Capital Formation in the Country (at 2004-05 prices)Share of Agriculture & Allied Sectors in total Gross Capital Formation 8.3 7.7Agriculture 7.7 7.1Forestry and logging 0.07 0.06Fisheries 0.56 0.54
3 Agricultural Imports & Exports (at current prices)Agricultural imports to national imports 2.71 4.38Agricultural exports to national exports 10.22 10.59
4 Employment in the agriculture sector as share of total workers 58.2as per census 2001
Source : Central Statistics Office and Department of Agriculture and Cooperation.
2004-05. Its share in GDP has thus declined rapidlyin the recent past. This is explained by the fact thatwhereas overall GDP has grown by an average of8.62 per cent during 2004-05 to 2010-11, agriculturalsector GDP has increased by only 3.46 per centduring the same period. The role of the agriculturesector, however, remains critical as it accounts forabout 58 per cent of employment in the country (asper 2001 census). Moreover, this sector is a supplierof food, fodder, and raw materials for a vast segmentof industry. Hence the growth of Indian agriculturecan be considered a necessary condition for ‘inclusivegrowth’. More recently, the rural sector (includingagriculture) is being seen as a potential source ofdomestic demand, a recognition that is even shapingthe marketing strategies of entrepreneurs wishingto widen the demand for goods and services. In termsof composition, out of a total share of 14.6 per centof the GDP in 2009-10 for agriculture and alliedsectors, agriculture alone accounted for 12.3 per centfollowed by forestry and logging at 1.5 per cent andfisheries at 0.8 per cent (Table 8.1).
PERFORMANCE OF THE AGRICULTURESECTOR DURING THE CURRENT FIVEYEAR PLAN (2007-2012)8.3 During the first three years of the current FiveYear Plan, the agriculture sector (including allied
activities) recorded an average growth of 2.03 percent against the Plan target of 4 per cent per annum.In the first year, 2007-08, of the current Plan theagriculture sector had achieved an impressive growthof 5.8 per cent. However, this high growth could notbe maintained in the following two years andagriculture-sector growth fell into the negative zoneof - 0.1 per cent in 2008-09, although this was ayear of a record 234.47 million tonnes food production.The decline in growth of agricultural GDP wasprimarily due to the fall in the production of agriculturalcrops such as oilseeds, cotton, jute and mesta, andsugarcane. In 2009-10, despite experiencing theworst south-west monsoon since 1972 andsubsequent significant fall in kharif foodgrainproduction, the growth marginally recovered to 0.4per cent primarily due to a good rabi crop. Severaladvance measures taken by the government tosalvage the rabi crop had the desired effect ofchecking the impact of the drought situation on therabi crop. Things are looking bright in the currentyear with a relatively good monsoon and theagriculture-sector is expected to grow at 5.4 per centas per the 2010-11 advance estimates. Theagriculture sector growth in the first four years of thePlan is estimated at 2.87 per cent. In order to achievethe Plan target of average 4 per cent per year, theagriculture sector needs to grow at 8.5 per cent during2011-12.
189Agriculture and Food Management
Website: http://indiabudget.nic.in
GROSS CAPITAL FORMATION (GCF)IN AGRICULTURE AND THE ALLIEDSECTOR
8.4. The GCF in agriculture and allied sectors as aproportion to the GDP in the sector stagnated around14 per cent during 2004-05 to 2006-07. However,there is a marked improvement in this figure duringthe current Five Year Plan. It increased to 16.03 percent in 2007-08 and further to 19.67 per cent in 2008-09 (provisional) and to 20.30 per cent in 2009-10(quick estimates [QE]). However, the GCF inagriculture and allied sectors relative to overall GDPhas remained stagnant at around 2.5 to 3.0 per cent(Table 8.2). As a result the share of GCF in agricultureand allied sector in total GCF has remained in therange of 6.6 to 8.2 per cent during 2004-05 to 2009-10 (Table 8.3). There is need to significantly step upinvestment in agriculture, both by the private andpublic sectors to ensure sustained target growth of4 per cent per annum.
CROP PRODUCTION
8.5 For four consecutive years from 2005-06 to2008-09, foodgrains production registered a risingtrend and touched a record level of 234.47 million
tonnes in 2008-09. The production of foodgrainsdeclined to 218.11 million tonnes during 2009-10 (finalestimates) due to the long spells of drought in variousparts of the country in 2009. The productivity of almostall the crops suffered considerably, which led todecline in their production in 2009. As per the secondadvance estimates released by Ministry of Agricultureon 9.2.2011, production of foodgrains during 2010-11 is estimated at 232.07 million tonnes comparedto 218.11 million tonnes last year (Table 8.4). This isonly marginally below the record production of 234.47million tonnes of foodgrains in 2008-09. The countryis likely to achieve record production of wheat (81.47million tonnes), pulses (16.51 million tonnes) andcotton (33.93 million bales of 170 kg. each) this year.This high level of production has been achieveddespite crop damage due to drought in Bihar,Jharkhand, Orissa and West Bengal and the effectsof cyclones, unseasonal and heavy rains, and coldwave and frost conditions in several parts of thecountry.
GROWTH RATES OF AREA,PRODUCTION AND YIELD OF
AGRICULTURAL CROPS
8.6 Growth in the production of agricultural cropsdepends upon acreage and yield. Given thelimitations in the expansion of acreage, the mainsource of long-term output growth is improvement inyields. Trends in indices of area, production, andyield of different crops for two periods 1980-81 to1989-90 and 2000-01 to 2009-10 (base trienniumending[TE] 1981-82=100) are given in Table 8.5. Ananalysis of growth rates of area, production, and yieldof various crops based on their respective indiceshas been made in the following paragraphs.
Table 8.2 : GCF in Agriculture and Allied Activities (` ` ` ` ` crore at 2004-05 prices)
Year GDP Agriculture & allied GCF/GDP in GCF in
activities agriculture & agriculture as
allied per cent of
GCF GDP activities total
2004-05 29,71,464 76,096 5,65,426 13.46 2.56
2005-06 32,54,216 86,611 5,94,487 14.57 2.66
2006-07 35,66,011 90,710 6,19,190 14.65 2.54
2007-08 38,98,958 1,05,034 6,55,080 16.03 2.69
2008-09P 41,62,509 1,28,659 6,54,118 19.67 3.09
2009-10QE 44,93,743 1,33,377 6,56,975 20.3 2.97
Source : Central Statistics Office.Notes: P- provisional. Q-quick estimates.
Table 8.3 : Share of Agriculture & AlliedSectors’ GCF in total GCF (per cent) (at2004-05 prices)
2004-05 7.5
2005-06 7.3
2006-07 6.6
2007-08 6.5
2008-09 8.3
2009-10 7.7
190 Economic Survey 2010-11
Website: http://indiabudget.nic.in
Table 8.5 : Compound Growth Rates of Area, Production and Yield
(as per cent per annum with base TE 1981-82=100)
Crop 1980-81 to 1989-90 2000-01 to 2009-10
Area Production Yield Area Production Yield
Rice 0.41 3.62 3.19 -0.03 1.59 1.61
Wheat 0.46 3.57 3.10 1.21 1.89 0.68
Jowar -0.99 0.28 1.29 -3.19 -0.07 3.23
Bajra -1.05 0.03 1.09 -0.42 1.68 2.11
Maize -0.20 1.89 2.09 2.98 5.27 2.23
Ragi -1.23 -0.10 1.14 -3.03 -1.52 1.57
Small millets -4.32 -3.23 1.14 -5.28 -3.58 1.78
Barley -6.03 -3.48 2.72 -1.41 -0.25 1.17
Total Coarse Cereals -1.34 0.40 1.62 -0.76 2.46 3.97
Total Cereals -0.26 3.03 2.90 0.09 1.88 3.19
Gram -1.41 -0.81 0.61 4.34 5.89 1.48
Tur 2.30 2.87 0.56 0.26 1.82 1.56
Other Pulses 0.02 3.05 3.03 -0.34 -0.32 0.02
Total Pulses -0.09 1.52 1.61 1.17 2.61 1.64
Total Foodgrains -0.23 2.85 2.74 0.29 1.96 2.94
Sugarcane 1.44 2.70 1.24 0.77 0.93 0.16
Oilseeds 1.51 5.20 2.43 2.26 4.82 3.79
Cotton -1.25 2.80 4.10 2.13 13.58 11.22
8.7 Rice and wheat: During the 1980s the growthin area in rice was marginal at 0.41 per cent butgrowth in production and yield was above 3 per cent.From 2000-01 to 2009-10 the situation changed withgrowth in area turning negative and in productionand yield standing at 1.59 per cent and 1.61 percent respectively. In wheat too, during the 1980s thegrowth in area was marginal at 0.46 per cent but inproduction and yield was above 3 per cent. During2000-01 to 2009-10 the growth in area in wheat was1.21 per cent and in production and yield was 1.89per cent and 0.68 per cent respectively. This
suggests that in these two crops the yield levelshave plateaued and there is need for renewedresearch to boost production and productivity(Figures 8.2 and 8.3). Given the constraints in areaexpansion, there is no other alternative. Both publicand private-sector investment in research anddevelopment (R&D) needs to be encouraged. Figure8.4 shows changes in the index of area, production,and yields of rice during 2003-04 to 2009-10,Figure 8.5 shows changes in the index of area,production, and yield of wheat during 2003-04 to2009-10.
Table 8.4 : Agricultural Production 2010-11
(million tonnes)
Crops 2nd Target Percentage 2009-10 PercentageAdvance 2010-11 of 2010-11 (final change in
Estimates production estimates) 2010-112010-11 to target set compared to
for 2010-11 2009-10
Rice 94.01 102.00 92.17 89.09 5.52
Wheat 81.47 82.00 99.35 80.80 0.83
Coarse Cereals 40.08 44.00 91.09 33.55 19.46
Pulses 16.51 16.50 100.06 14.66 12.62
Total Foodgrains 232.07 244.50 94.92 218.11 6.40
Oilseeds 27.85 33.20 83.89 24.88 11.94
Sugarcane 336.70 315.00 106.89 292.30 15.19
Cotton* 33.93 26.00 130.50 24.22 40.09
Jute and Mesta** 10.08 11.50 87.65 11.82 -14.72
Notes : *million bales of 170 kg each **million bales of 180 kg each
191Agriculture and Food Management
Website: http://indiabudget.nic.in
-0.5
0
0.5
1.0
1.5
2.0
2.5
3.0
3.5
Com
poun
d gr
owth
rat
e (p
er c
ent)
Compound growth rate of area, production and yield of riceFigure 8.2
Area
1980-81 to1989-90
2000-01 to2009-10
YieldProduction
4.0
4.5
0
0.5
1.0
1.5
2.0
2.5
3.0
3.5
Com
poun
d gr
owth
rat
e(p
er c
ent)
Compound growth rate of area, production and yield of wheatFigure 8.3
Area
1980-81 to1989-90
2000-01 to2009-10
YieldProduction
4.0
0
Area
Index of area, production and yield of rice
100
200
Figure 8.4
Inde
x
Year
2003
-04
2004
-05
2005
-06
2006
-07
2007
-08
2008
-09
2009
-10
50
150
250
Production
Yield
0
Area
Index of area, production and yield of wheat
100
200
Figure 8.5
Inde
x
50
150
250
Production
Yield
Year
2003
-04
2004
-05
2005
-06
2006
-07
2007
-08
2008
-09
2009
-10
192 Economic Survey 2010-11
Website: http://indiabudget.nic.in
8.8 Coarse Cereals: In coarse cereals thesituation is totally different. Since there was notechnological breakthrough in these crops, the growthrate in area of total coarse cereals, in both theperiods (1980-81 to 1989-90 and 2000-01 to 2009-10) was negative reflecting either shift to other cropsor relatively dry area remaining fallow. In all the majorcoarse cereals there was negative growth in areaduring both the periods except for maize, whichrecorded a growth rate of 2.98 per cent in the 2000-01 to 2009-10 period. However, growth in productionand yield for coarse grains which was 0.40 per centand 1.62 per cent respectively in the 1980s improvedsignificantly to 2.46 per cent and 3.97 per centrespectively in the 2000-01 to 2009-10 period (Figure8.6). This increase is primarily driven by maize andbajra. Figure 8.7 illustrates changes in the index ofarea production and yield of total coarse cerealsduring 2003-04 to 2009-10. Special effort is requiredto promote production and productivity of all coarsecereals to ensure food security (Box 8.1)
8.9 Pulses: Pulses are the main source of proteinfor a large section of population in India. Gram andTur are the major contributors to the total production
Box 8.1 : Coarse cereals
The food and nutritional security of India currentlydepends to a great extent on the production of wheat andrice. These two crops together constituted 78 per cent oftotal foodgrains production in 2009-10, whereas coarsecereals constitute only 15 per cent in the same year. Thearea under coarse cereals has shown a decline over theyears whereas their yield has shown significantimprovement despite decrease in area in all the majorcoarse cereals except maize. The nutritional value of coarsecereals is also gradually being realized. There is everyreason to promote the production of these crops and helpthem realize their full potential with increased investmentin research and schemes to promote their cultivationparticularly in rain-fed areas.
-0.5
0
0.5
1.0
1.5
2.0
2.5
3.0
3.5
Com
poun
d gr
owth
rat
e (p
er c
ent)
Compound growth rate of area, production and yield of coarse cerealsFigure 8.6
Area
1980-81 to1989-90
2000-01 to2009-10
YieldProduction
4.0
-1.0
-1.5
0
Area
Index of area, production and yield of coarse cereals
100
200
Figure 8.7
Inde
x
50
150
250
Production
Yield
Year
2003
-04
2004
-05
2005
-06
2006
-07
2007
-08
2008
-09
2009
-10
of pulses in the country. During the 1980s there wasnegative growth in total area under pulses and growthin production and yield was 1.52 per cent and 1.61per cent respectively. During 2000-01 to 2009-10,whereas area and production have grown by 1.17per cent and 2.61 per cent respectively, growth inyield at 1.64 per cent has remained at about the
193Agriculture and Food Management
Website: http://indiabudget.nic.in
same level reflecting that the growth in production isprimarily because of increase in area (Figure 8.8). Atechnological breakthrough in pulse production isnecessary to keep pace with rising demand for thiscommodity. Figure 8.9 illustrates changes in theindex of area, production, and yield of total pulsesduring 2003-04 to 2009-10.
8.10 Sugarcane: The compound growth rate ofarea, production, and yield of sugarcane during2000-01 to 2009-10 has declined compared to the1980s. The decline in growth rate of yield duringthis period is because of relatively higher decline ingrowth rate of production compared to decline ingrowth rate of area (Figure 8.10). Concerted effortis required to increase yield rate of this crop toavoid fluctuations in production and spikes in priceof sugar. Figure 8.11 displays changes in the index
of area, production, and yield of sugarcane during2003-04 to 2009-10.
8.11 Oilseeds: The significant improvement inannual growth in indices of yield and area underoilseeds during 2000-01 to 2009-10 as comparedto the 1980s has resulted in increase in the annualgrowth rate of production of oilseeds. India, however,still imports a significant proportion of its requirementof edible oil (Figure 8.12). The current growth rateneeds to be maintained to ensure a reasonable levelof self-sufficiency in this crop. Figure 8.13 showschanges in the index of area, production, and yieldof oilseeds during 2003-04 to 2009-10.
8.12 Cotton: A significant improvement in yield hasresulted in an increase in growth rate of cottonproduction from 2.80 per cent during the 1980s to13.58 per cent per annum during 2000-10 (Figure
-0.5
0
0.5
1.0
1.5
2.0
2.5
3.0
Com
poun
d gr
owth
rat
e(p
er c
ent)
Compound growth rate of area, production and yield of total pulsesFigure 8.8
Area
1980-81 to1989-90
2000-01 to2009-10
YieldProduction
0
Area
Index of area, production and yield of total pulses
100
200
Figure 8.9
Inde
x
50
150
250
Production
Yield
Year
2003
-04
2004
-05
2005
-06
2006
-07
2007
-08
2008
-09
2009
-10
0
0.5
1.0
1.5
2.0
2.5
3.0
Com
poun
d gr
owth
rat
e(p
er c
ent)
Compound growth rate of area, production and yield of sugarcaneFigure 8.10
Area
1980-81 to1989-90
2000-01 to2009-10
YieldProduction
194 Economic Survey 2010-11
Website: http://indiabudget.nic.in
0
Area
Index of area, production and yield of sugarcane
100
200
Figure 8.11In
dex
50
150
250
Production
Yield
Year
2003
-04
2004
-05
2005
-06
2006
-07
2007
-08
2008
-09
2009
-10
0
0.5
1.0
1.5
2.0
2.5
3.0
3.5
Com
poun
d gr
owth
rat
e (p
er c
ent)
Compound growth rate of area, production and yield of oilseedsFigure 8.12
Area
1980-81 to1989-90
2000-01 to2009-10
YieldProduction
4.0
4.5
5.0
5.5
Area
Index of area, production and yield of oilseeds
100
200
Figure 8.13
Inde
x
50
150
250
Production
Yield
300
Year
2003
-04
2004
-05
2005
-06
2006
-07
2007
-08
2008
-09
2009
-10
-2
0
2
4
6
8
10
12
Com
poun
d gr
owth
rat
e(p
er c
ent)
Compound growth rate of area, production and yield of cottonFigure 8.14
Area
1980-81 to1989-90
2000-01 to2009-10
YieldProduction
14
195Agriculture and Food Management
Website: http://indiabudget.nic.in
0
Area
Index of area, production and yield of cotton
200
400
Figure 8.15In
dex
100
300
500
Production
Yield
Year
2003
-04
2004
-05
2005
-06
2006
-07
2007
-08
2008
-09
2009
-10
8.14). Figure 8.15 shows changes in the index ofarea, production, and yield of cotton during 2003-04to 2009-10.
AREA COVERAGE IN 2010-118.13 The total cropped area under foodgrains,oilseeds, sugarcane, and cotton during kharif 2010is higher by 2.33 lakh ha as compared to that inkharif 2009. Owing to drought in major rice-producingareas, i.e. Bihar, Jharkhand, West Bengal, andeastern Uttar Pradesh, the area under rice duringkharif 2010 is lower by about 5.40 lakh ha. Whilethe area under coarse cereals has gone down by3.42 lakh ha, there has been significant increase of6.11 lakh ha in the area under pulses with the resultthat total area under foodgrains in kharif 2010 is onlymarginally lower by 2.71 lakh ha than that in kharif2009. In oilseeds, while area under groundnut hasgone up by 4 lakh ha, seasmum, soyabean, andsunflower have recorded lower acreage; consequentlythe overall area under oilseeds during kharif 2010 islower by 8.27 lakh ha as compared to kharif 2009.However, there is significant increase in the areaunder sugarcane (6.53 lakh ha) and cotton (6.90 lakhha). Thus there appears to be some shift in thecropping pattern in kharif 2010.
Exports and Imports
8.14 Depending on domestic availability,Government allows exports and imports of fooditems especially wheat, rice, and pulses. Governmenthas reduced the import duty on wheat to nil from9 September 2006 to augment its supply. Export ofwheat has been prohibited since 8 October 2007.The import duty on semi-milled or wholly milled ricehas been reduced to nil from 20 March 2008 toaugment its supply. Export of non-basmati rice hasbeen prohibited since 15 October 2007 except fora quantity of 10,000 tonnes per annum of organicnon-basmati rice permitted since 7 December 2009.
Further, export of non-basmati rice is permitted ondiplomatic/humanitarian considerations. Export ofbasmati rice is permitted with a minimum exportprice (MEP) of US $ 900 per ton or ` 41, 400 perton. Government has reduced the import duty onpulses to nil from 8 June 2006 to augment theirsupply. Export of pulses except kabuli chana(chickpeas) has been prohibited with effect from1 April 2008.
AGRICULTURAL INPUTS
8.15 Agricultural inputs play a crucial role indetermining yield levels and in turn augmentation oflevel of production in the long run. Improvement inyield depends on application of technology, use ofquality seeds, fertilizers, pesticides, micronutrientsand irrigation.
Seeds
8.16 Seeds are a critical input for long-termsustained growth of agriculture. In India, more thanfour-fifths of farmers rely on farm-saved seeds leadingto a low seed replacement rate. Hence the CentralGovernment has been addressing this issue throughvarious programmes/schemes. This includes theIndian Seed Programme involving the participationof Central and State Governments, the Indian Councilof Agricultural Research (ICAR), State agriculturaluniversities, cooperatives and the private sector, andfarmers and plant breeders. Year-wise details ofproduction of breeder and foundation seeds anddistribution of certified seeds are given in Table 8.6.
8.17 The Ministry of Agriculture has beenimplementing the Central- sector Development andStrengthening of Infrastructure Facilities forProduction and Distribution of Quality Seeds schemesince 2005-06 with the aim of ensuring timelyavailability of quality seeds of various crops ataffordable prices. The major thrusts of the scheme
196 Economic Survey 2010-11
Website: http://indiabudget.nic.in
Table 8.6 : Production of Breeder andFoundation Seeds and Distribution ofCertified Seeds
Production of Production ofYear breeder foundation Distribution
seeds seeds of certified/(quintals) (lakh quality seeds
quintals) (lakh quintals)
2004-05 66,460 6.9 113.10
2005-06 68,654 7.4 126.74
2006-07 73,829 7.96 155.01
2007-08 91,960 8.22 179.05
2008-09 74,361 9.69 215.81
2009-10 94,410 11.46 257.11(Anticipated)
Source : Department of Agriculture and Cooperation.
are improving quality of farm-saved seeds throughseed village programmes to enhance seedreplacement rates, boosting seed production in theprivate sector, and helping public-sector seedcompanies contribute to enhanced seed production.Since the inception of the scheme in 2005-06,1,31,023 seed villages have been covered acrossthe country and 183.10 lakh quintals of certified/quality seeds produced till 2009-10, which is asignificant achievement. This effort needs to befurther promoted.
8.18 Under the component of assistance forboosting seed production in the private sector,credit-linked back-ended capital subsidy of 25 percent of project cost subject to a maximum limit of ̀25 lakh per unit is provided on seed infrastructuredevelopment. In order to establish/strengtheninfrastructure facilities for production anddistribution of quality seeds, States/UTs and StateSeeds Corporations are provided financialassistance for creating facilities for seed-processingplants and machinery for seed cleaning, grading,treating, and packing. Assistance is also providedfor creation/strengthening of seed-processingplants. The Protection of Plant Varieties andFarmers’ Rights (PPV&FR) Authority established inNovember 2005 at New Delhi has been mandatedto implement provisions of the PPV&FR Act, 2001.
8.19 Considering the vital importance of the seedindustry in promoting agricultural growth, the Ministryof Agriculture has been proposing replacement ofthe existing Seeds Act 1966 by suitable legislation.
The new Act is expected to (i) create a facilitativeclimate for growth of the seed industry, (ii) enhanceseed replacement rates for various crops, (iii) boostthe export of seeds and encourage import of usefulgerm plasm, and (iv) create a conducive atmospherefor application of frontier sciences in varietydevelopment and for enhanced investment in R&D.The Seeds Bill was introduced in the Rajya Sabhain 2004. It was referred to the Parliamentary StandingCommittee on Agriculture which recommendedseveral modifications in 2008. These will be takenup for further consideration.
Fertilizers
8.20 India is meeting 85 per cent its urearequirement through indigenous production butdepends heavily on imports for its phosphatic andpotash (P & K) fertilizer requirements. Urea, 21grades of P & K fertilizers, and 15 grades of NPK(nitrogen, phosphorus, and potash) complexfertilizers are provided to farmers at subsidizedprices. Farmers pay only 25 to 40 per cent of theactual cost and the rest of the cost is borne by theGovernment in the form of a subsidy, which isreimbursed to the manufactures/importers.
Production
8.21 The domestic production of urea, Di-ammonium phosphate (DAP), and complex fertilizersin the year 2009-10 has increased compared to 2008-09. The production of urea is estimated at 215.37lakh tonnes in 2010-11 and that of DAP andcomplexes at 39.58 lakh tonnes and 91.66 lakhtonnes, respectively (Table 8.7). Availability of rawmaterial/intermediates has been a major bottleneckin the increase in production of fertilizers.
8.22 Timely import of urea and other fertilizers wasarranged to ensure timely availability of fertilizers inrequired quantity (Table 8.8).
Table 8.7 : Production of Urea, DAP andComplex Fertilizers
(in lakh tonnes)
Year 2006- 2007- 2008- 2009- 2010-07 08 09 10 11*
Urea 203.10 198.60 199.20 211.12 215.37
DAP 48.52 42.12 29.93 42.46 39.58
Complex 74.64 58.50 68.48 80.38 91.66fertilizers
Note: *Estimated
197Agriculture and Food Management
Website: http://indiabudget.nic.in
8.23 Chemical fertilizers play a significant role inthe development of the agricultural sector. In India,the per hectare consumption of fertilizers in nutrientterms has been increasing (Table 8.9).
8.24 There have been major policy initiatives in thefertilizer sector. A few recent ones are as follows:
(i) Introduction of nutrient-based subsidy schemewith effect from 1 April 2010. Under the nutrient-based subsidy scheme (NBS), Governmenthas amended subsidy per kg of nutrients N, P,K and S contained in P & K fertilizers as wellas per MT of fertilizers. Maximum retail prices(MRPs) of the decontrolled P&K fertilizers havebeen kept open and companies are free toannounce their MRPs. However, manufacturers/importers of fertilizers are required to printMRPs along with applicable NBS on each bagof fertilizer clearly. The failure to do so invitesaction under the Essential Commodities Act1955.
(ii) A uniform freight subsidy policy has beenannounced under which rail freight is paid onactual and road freight on a normative averagedistrict lead for urea.
(iii) Government has included three new grades ofcomplex fertilizers under the NBS.
(iv) Distribution and movement of fertilizers aremonitored through the online web-basedfertilizer monitoring system (FMS), whichtracks the import, production, movement,availability, distribution, and sale of fertilizersin all States.
(v) Government has placed 20 per cent of theproduced/imported decontrolled P & K fertilizerunder the Movement Control Order of theDepartment of Fertilizers as per the EssentialCommodities Act 1955 with the objective ofmaking fertilizers available in the difficult areas.
(vi) The manufacturers of customized and mixturefertilizer are allowed by the Government tosource the subsidized fertilizers from themanufacturers/importers after their receipt inthe districts.
(vii) Government has put the export of (DAP) andMOP in the restrictive category to discourageexport and illegal diversion.
Irrigation
8.25 Irrigation is one of the most important inputsfor enhancing productivity and is required at differentcritical stages of plant growth of various crops. TheGovernment of India has taken up irrigation potentialcreation through public funding and is assistingfarmers to create potential on their own farms.Substantial irrigation potential has been createdthrough major and medium irrigation schemes. Thetotal irrigation potential in the country has increasedfrom 81.1 million hectares in 1991-92 to 108.2 millionhectares in March 2010.
8.26 The Central Government initiated theAccelerated Irrigation Benefit Programme (AIBP)from 1996-97 to extend assistance for thecompletion of incomplete irrigation schemes. Underthis programme, projects approved by the PlanningCommission are eligible for assistance. Further, theassistance, which was entirely a loan from theCentre in the beginning, was modified by inclusionof a grant component with effect from 2004-05. AIBPguidelines were further modified in December 2006to provide enhanced assistance at 90 per cent ofthe project cost as grant to special category States,Drought Prone Area Programme (DPAP) States/tribalareas/flood-prone areas, and Koraput-Balangir-Kalahandi (KBK) districts of Orissa. Under the AIBP,` 41,729.37 crore of Central loan assistance (CLA)/grant has been released up to 31 March 2010. Ason 31 March 2010, 281 projects have been covered
Table 8.9 : Per Hectare Consumption ofFertilizers in Nutrient Terms
under the AIBP and 120 completed. Irrigationpotential of 9.82 lakh ha is estimated to have beencreated from major/medium /minor irrigationprojects during 2009-10.
RAINFALL AND RESERVOIR LEVELS
8.27 Rainfall influences crop production andproductivity in a big way in India, with agriculturestill being largely rainfed. More than 75 per centof annual rainfall is received during the south-west monsoon season (June-September). Duringthe south-west monsoon season of 2010, thecountry as a whole received 2 per cent morerainfall than the long period average (LPA).Central India, north-west India, and the southernpeninsula experienced 4 per cent, 12 per cent,and 17 per cent more rainfall respectively. North-east India received 18 per cent less rainfall thanthe LPA. At district level, 28 per cent of districtsreceived excess rainfall, 41 per cent normal, 29per cent deficient, and 2 per cent scanty rainfall.During south-west monsoon 2010, out of 36subdivisions, 5 recorded deficient rainfall andthe remaining 31 excess/normal rainfall. Out of597 meteorological districts for which data areavailable, 413 (69 per cent) received excess/normal rainfall and the remaining 184 (31percent) deficient/scanty rainfall during the season.The performance of the south-west Monsoonduring 2001-10 (June-September) is given inTable 8.10.
Reservoir storage status
8.28 The total designed storage capacity at fullreservoir level (FRL) of 81 major reservoirs in thecountry monitored by the Central Water Commission(CWC) is 151.77 billion cubic metres (BCM). At theend of monsoon 2010, the total live storage in thesereservoirs was 115.23 BCM which is more than thelive storage of 89.84 BCM at the end of the monsoonin 2009 and also more than 100.25 BCM which isthe average of the last 10 years.
PRICE POLICY FOR AGRICULTURALPRODUCE
8.29 The price policy for agricultural commoditiesseeks to ensure remunerative prices to growers fortheir produce with a view to encouraging higherinvestment and production and safeguarding theinterest of consumers by making sure that adequatesupplies are available. The price policy also seeksto evolve a balanced and integrated price structurein the perspective of the overall needs of the economy.With this aim, the Government announces minimumsupport prices (MSPs) for major agriculturalcommodities each season and organizes purchaseoperations. The designated Central nodal agenciesintervene in the market for undertaking procurementoperations with the objective of ensuring that themarket prices do not fall below the MSPs fixed bythe Government. Over the years, the MSPs havebeen raised reasonably to ensure that farmers areincentivized to enhance production of their crops.
Year Number of meteorological subdivisions Percentage of Percentage districts with of long period
Normal Excess Deficient/ normal/ average rainfallscanty excess for the country
rainfall as a whole
2001 29 1 5 67 92
2002 14 1 21 39 81
2003 26 7 3 77 102
2004 23 0 13 56 86
2005 23 9 4 72 99
2006 20 6 10 60 99
2007 17 13 6 72 105
2008 30 2 4 76 98
2009 10 3 23 41 77
2010 17 14 5 69 102
Source : India Meteorological Department.Note: Excess: +20 per cent or more of LPA; Normal: +19 per cent to -19 per cent of LPA;Deficient: -20 per cent to -59 per cent of LPA; Scanty: -60 per cent to -99 per cent of LPA.
199Agriculture and Food Management
Website: http://indiabudget.nic.in
These operations involving high costs have putconsiderable fiscal strain on the economy. The MSPsof kharif and rabi crops of 2009-10 and 2010-11are given in Table 8.11.
8.30 In addition, Government has also notified theMSPs of commercial crops like copra, raw jute, de-husked coconut, and toria. The MSPs for fairaverage quality (FAQ) variety of milling copra andFAQ variety of ball copra for 2010 season havebeen fixed at ` 4450 per quintal and ` 4700 perquintal respectively. The MSP for de-huskedcoconut for 2010 season has been fixed at ` 12per kg, for TD-5 variety of ex-Assam raw jute for
2010 -11 season at ̀ 1575 per quintal , and for toriaof FAQ variety for 2010-11 to be marketed in 2011-12 at ̀ 1780 per quintal.
8.31 The National Agricultural CooperativeMarketing Federation of India Ltd. (NAFED), theCentral Nodal Agency for implementing price supportoperations for commercial crops, entered themarkets with a view to safeguarding the interest ofcoconut growers and procured 44,418 quintals ofmilling copra and 480 quintals of ball copra up to 4October 2010, as the wholesale prices ruled belowtheir MSPs for 2010 season. During the marketingseason 2010-11, month-end wholesale price of
Table 8.11 : Minimum support prices
(` per quintal)
2009-10 2010-11 Difference between
2010-11 and
2009-10 Prices
(in ̀ )
Kharif Crops
Paddy (common) 950 1000 50
Paddy (Gr.A) 980 1030 50
Jowar (Hybrid) 840 880 40
Jowar (Maldandi) 860 900 40
Bajra 840 880 40
Maize 840 880 40
Ragi 915 965 50
Arhar (Tur) 2300 3000* 700
Moong 2760 3170* 410
Urad 2520 2900* 380
Groundnut in shell 2100 2300 200
Sunflower 2215 2350 135
Soyabean (black) 1350 1400 50
Soyabean (yellow) 1390 1440 50
Seasmum 2850 2900 50
Nigerseed 2405 2450 45
Cotton (F-414/H-777/J34 2500 2500 0
Rabi crops
Wheat 1100 1120 20
Barley 750 780 30
Gram 1760 2100 340
Masur (lentil) 1870 2250 380
Rapeseed/Mustard 1830 1850 20
Safflower 1680 1800 120
Note: * An additional incentive at the rate of ` ` ` ` ` 5 per kg is also available for tur, moong, and urad sold toprocurement agencies during the harvest/arrival period of two months.
200 Economic Survey 2010-11
Website: http://indiabudget.nic.in
TD-5 grade raw jute ruled above the MSP andtherefore no procurement was made under the PriceSupport Scheme.
SCHEMES/PROGRAMMES IN THEAGRICULTURE SECTOR
8.32 Agriculture is a State subject. Hence theprimary responsibility for increasing agriculturalproduction, enhancing productivity, and exploring thevast untapped potential of the sector rests with theState Governments. Central Governmentsupplements the efforts of the State Governmentsthrough a number of centrally sponsored and Central-sector schemes. The major schemes/programmesare as follows:
National Mission for Sustainable Agriculture
8.33 While agricultural productivity is adverselyaffected by climate change, agricultural activity itselfcontributes to global warming. The adoption of‘ecological agriculture’, which integrates naturalregenerative processes, minimizes non-renewableinputs, and fosters biological diversity, hastremendous scope for reducing emissions andenhancing soil carbon sequestration. At the sametime, many ecological agricultural practices alsoconstitute effective strategies for adapting to climatechange, which is a priority for developing countries.This calls for more investment and policy support tobe devoted to this productive and sustainable formof farming. Recognizing the challenge of climatechange to Indian agriculture, the National Missionfor Sustainable Agriculture (NMSA), which is one ofthe eight Missions under the National Action Planon Climate Change (NAPCC) has beenconceptualized. It seeks to address issues regarding‘sustainable agriculture’ in the context of risksassociated with climate change by devisingappropriate adaptation and mitigation strategies forensuring food security, enhancing livelihoodopportunities, and contributing to economic stabilityat national level. While promotion of dry-landagriculture would receive prime importance by wayof developing suitable drought and pest resistant cropvarieties and ensuring adequacy of institutionalsupport, the Mission would also expand its coverageto rainfed areas for integrating farming systems withlivestock and fisheries, so that agriculture continuesto grow in a sustainable manner. The Missionidentifies ten key dimensions for promotingsustainable agricultural practices, which will berealized by implementing a programme of action
(PoA). The Mission also emphasizes the need toharness traditional knowledge and agriculturalheritage for in-situ conservation of geneticresources.
8.34 The PoA would be operationalized bymainstreaming adaptation and mitigation strategiesin ongoing R&D programmes and in flagshipschemes including the Rashtriya Krishi Vikas Yojana(RKVY), National Horticulture Mission (NHM), andNational Food Security Mission (NFSM) through aprocess of selective upscaling and course correctionmeasures. This would further be supplemented byintroduction of new programmatic interventions andby seeking convergence with other NationalMissions and collaborations with key Ministries/Departments for institutionalizing linkages in orderto address cross-sectoral issues.
Macro Management of Agriculture
8.35 The Macro Management of Agriculture (MMA)scheme was revised in 2008 to improve its efficacyin supplementing / complementing the efforts of theStates towards enhancement of agriculturalproduction and productivity and provide opportunityto draw upon their agricultural developmentprogrammes relating to crop production and naturalresource management, with the flexibility to use 20per cent of resources for innovative components. Therevised MMA Scheme has formula-based allocationcriteria and provides assistance in the form of grantsto the States/UTs on 90:10 basis except in case ofthe north-eastern States and Union Territories wherethe Central share is 100 per cent. MMA assistanceduring 2010-11 has been used to treat 3.02 lakh haof land under the National Watershed DevelopmentProject for Rainfed Areas (NWDPRA) and 1.94 lakhha under River Valley Projects (RVP) sub-schemesand for financing acquisition of 10,208 tractors and5766 power-tillers among other farm machinery.
The National Food Security Mission(NFSM)
8.36 The NFSM was launched in rabi 2007-08 witha view to enhancing the production of rice, wheat,and pulses by 10 million tonnes, 8 million tones,and 2 million tonnes respectively by the end of theEleventh Plan. The Mission aims to increaseproduction through area expansion and productivity;create employment opportunities; and enhance thefarm-level economy to restore confidence of farmers.The NFSM is presently being implemented in 476identified districts of 17 States of the country.
201Agriculture and Food Management
Website: http://indiabudget.nic.in
Besides, a series of activities for more vigorouspromotion of pulse crops has been adopted underthe NFSM to intensify the pulse productionprogramme from 2010-11. These are:
i) Merging of the pulse component of theIntegrated Scheme of Oilseeds, Pulses, OilPalm and Maize (ISOPOM) with the NFSM soas to increase the scope and area coverage ofthe pulses programme. Jharkhand and Assamhave also been included under the programmesince there is immense potential for pulsepromotion in rice fallows.
ii) Through a new programme under the NFSMcalled the Accelerated Pulses ProductionProgramme (A3P), 1000 block demonstrationsof technology have been launched from 2010-11. This programme will essentially promoteplant nutrients- and plant protection-centrictechnologies in compact blocks of 1000 haeach for five major pulse crops, namely, tur,moong, urad, gram, and lentil.
8.37 Focused and target-oriented technologicalintervention under the NFSM has made significantimpact since its inception, reflected in the increasein production of rice and wheat in 2008-09 and2009-10.
8.38 From 2010-11, as a new initiative, the A3Phas been launched as a part of NFSM Pulses. Underthe A3P, one million ha of potential pulses area,covering tur, urad, moong, gram, and lentil, has beentaken up for large-scale demonstration of technologyin compact blocks. A total of 600 A3P units of tur,urad, moong, gram, and lentil have been proposedfor 2010-11. For organizing A3P units at the farmers’fields, an amount of ̀ 54.66 lakh per unit has beenproposed.
8.39 Further, an amount of ` 300 crore has beenprovided in the Union Budget 2010-11 for promotingdry-land farming in 60,000 pulses and oilseedsvillages in rainfed areas. These funds have beenprovided as additional Central assistance under theongoing RKVY to the States of Andhra Pradesh,Gujarat, Karnataka, Madhya Pradesh, Maharashtra,Rajasthan, and Uttar Pradesh.
8.40 Another programme, namely Bringing GreenRevolution in the Eastern States is operational inseven states—Uttar Pradesh, Jharkhand, Bihar,West Bengal, Assam, Orissa, and Chhattisgarh. TheRice Development and Organizing Pulses andOilseeds Villages is another programme, beside the
pulses promotion strategies and other initiativesundertaken to boost agricultural productivity in thesestates.
8.41 The progress reports received from the Statesindicate significant achievements under the NFSMduring the course of its implementation in the lastfour years, i.e. during 2007-08 to 2010-11(till date).New farm practices have been encouraged through3.24 lakh demonstrations of improved package ofpractices. As many as 63,273 demonstrations ofthe system of rice intensification (SRI), and 32,344demonstrations of hybrid rice have been conducted.Nearly, 96.84 lakh quintals of high yielding varietyseeds of rice, wheat, and pulses and hybrid ricehave been distributed. About 72.27 lakh ha of areahas been treated with soil ameliorants, such asgypsum/lime/micro nutrients to restore soil fertilityfor higher productivity. An area of about 29.25 lakhha has been treated under Integrated PestManagement (IPM). Further, nearly 21.27 lakhimproved farm machineries, including water-savingdevices have been distributed. As a capacity-buildinginitiative, 33,205 farmers’ field school (FFS) - leveltrainings have so far been held. In addition, about353 (3.53 lakh ha) block demonstrations have beenconducted during the 2010 kharif under the A3P.
The Rashtriya Krishi Vikas Yojana (RKVY)
8.42 The RKVY was launched in 2007-08 with anoutlay of ` 25,000 crore for the Eleventh Plan toincentivize States to enhance public investment soas to achieve a 4 per cent growth rate in agricultureand allied sectors during the Plan. During the three-year period 2007-10, an amount of ̀ 7895.12 crorewas released under the RKVY. Out of the budgetprovision of ` 6722crore for implementation of theRKVY in the States, an amount of ` 3986.76 crorehas been released as on 25 November 2010. Specificallocation has to be made for the following three newinitiatives introduced under the RKVY in 2010-11:
(i) Extending the Green Revolution to the easternregion of the country, covering the States ofAssam, Bihar, Chhattisgarh, Jharkhand,Orissa, eastern UP, and West Bengal, withthe objective of increasing the crop productivityof the region by intensive cultivation throughrecommended agricultural technologies andpackage of practices.
(ii) Special initiatives for pulses and oilseeds indry-land areas by organizing 60,000 pulsesand oilseeds villages in identified watersheds
202 Economic Survey 2010-11
Website: http://indiabudget.nic.in
where pulse and oilseed farmers are providedfarm machinery and equipment on custom-hiring basis. These initiatives dovetail with otherschemes of the Government of India havingcomponents for promotion of oilseeds andpulses production.
(iii) Implementation of the National Mission onSaffron – Economic Revival of Jammu &Kashmir Saffron Sector during 2010-11.
8.43 The RKVY has linked 50 per cent of Centralassistance to the percentage of State Planexpenditure on agriculture and allied sectors. Thishas incentivized States to step up allocation toagriculture and allied sectors, which was 5.11percent of total State Plan Expenditure in 2006-07, to6.29 per cent in 2009-10. The RKVY has emergedas the principal instrument in financing developmentof agriculture and allied sectors in the country. Itsconvergence with other schemes like the MahatmaGandhi National Rural Employment Scheme(MGNREGA) is expected to boost development ofthe agrarian economy. The States will take upprojects under the RKVY primarily from amongstthose that appear in their District and StateAgriculture Plans. There will be increased synergybetween agricultural planning and implementationof schemes in the coming years, which will play acrucial role in promoting holistic development ofagriculture and allied sectors.
The Integrated Scheme of Oilseeds, Pulses,Oil Palm and Maize (ISOPOM)
8.44 The ISOPM is being implemented in 14 majorStates for oilseeds and pulses, 15 for maize, and 10for oil palm. The pulses component has been mergedwith the NFSM with effect from 1 April 2010. TheScheme provides flexibility to the States inimplementation based on a regionally differentiatedapproach to promoting crop diversification. Under theScheme, assistance is provided for purchase ofbreeder seed, production of foundation seed,production and distribution of certified seed,distribution of seed minikits, plant protectionchemicals, plant protection equipment, weedicides,gypsum/ pyrite/ liming/ dolomite, sprinkler sets, andwater carrying pipes, supply of rhizobium culture/phosphate solubilizing bacteria and improved farmimplements, publicity, etc. The Oil PalmDevelopment Programme under the ISOPOM isbeing implemented in the States of Andhra Pradesh,Karnataka, Tamil Nadu, Gujarat, Goa, Orissa,Kerala, Tripura, Assam, and Mizoram. Its Maize
Development Programme is under implementationin 15 States, viz. Andhra Pradesh, Bihar,Chhattisgarh, Himachal Pradesh, Jammu andKashmir, Gujarat, Karnataka, Madhya Pradesh,Maharashtra, Orissa, Punjab, Rajasthan, TamilNadu, Uttar Pradesh, and West Bengal.
Drought Management
8.45 Due to deficit rainfall during south-westmonsoon 2010 in Bihar, Jharkhand, Orissa, andWest Bengal, the Central share of the State DisasterResponse Fund (SDRF) for 2010-11 has beenreleased to enable these States to expeditiously takethe necessary drought-mitigation measures. In viewof drought/deficit rainfall in certain regions, it wasdecided to implement a Diesel Subsidy during kharif2010 (14 July 2010 to 30 September2010) in drought/deficit rainfall areas to save the standing crops inthe field.
ALLIED SECTORS
The National Horticulture Mission (NHM)
8.46 The Ministry of Agriculture has beenimplementing the centrally sponsored NHM for theholistic development of the horticulture sector since2005-06, duly ensuring forward and backwardlinkages, and with the active participation of all thestakeholders. All the States and the three UnionTerritories of Andaman and Nicobar Islands,Lakshadweep, and Puducherry are covered underthe Mission except the eight north-eastern Statesincluding Sikkim and the States of Jammu andKashmir, Himachal Pradesh, and Uttarakhand. Thelatter are covered under the Horticulture Missionfor the North East and Himalayan States(HMNEH).The scheme is being implemented in 372districts in the country. During 2005-06 to 2009-10, an additional 16.57 lakh ha of identifiedhorticulture crops has been covered. Apart fromestablishment of 2192 nurseries for production ofquality planting materials, 2.78 lakh ha has beencovered under rejuvenation of old and senileorchards. Organic cultivation of horticultural cropshas been adopted in an area of 1.37 lakh ha.
8.47 With the implementation of the NHM andother schemes, the production of horticulture cropshas increased from 170.8 million tonnes in 2004-05 to 214.7 million tonnes in 2008-09. The per capitaavailability of fruits and vegetables has increasedfrom 391 gram/day in 2004-05 to 466 gram/day in2008-09.
203Agriculture and Food Management
Website: http://indiabudget.nic.in
Technology Mission for IntegratedDevelopment of Horticulture in NorthEastern States, Sikkim, Jammu andKashmir, Himachal Pradesh, andUttarakhand
8.48 The Technology Mission for IntegratedDevelopment of Horticulture was launched in 2001-02 to address issues related to production andproductivity, post harvest handling, marketing, andprocessing of horticultural crops in the north- easternStates. The Mission was extended to the threeHimalayan States, namely Himachal Pradesh,Jammu and Kashmir, and Uttarakhand in 2003-04.It covers the entire spectrum of horticulturedevelopment right from production to consumptionthrough backward and forward linkages. During thecourse of its implementation, it was realized thatsome additional components need to be introducedto achieve the objective of holistic growth of thehorticulture sector. Accordingly, some newcomponents such as high density planting, vegetableseed production, and horticulture mechanization havebeen included in the Mission. This has now beenrenamed the Horticulture Mission for North East andHimalayan States (HMNEH) along with revision ofthe cost norms so as to incentivize investment andsupplement income generation for the beneficiaries.
8.49 The implementation of the Mission has helpedbring an additional 5,12,614 ha under varioushorticulture crops (fruits, vegetables, spices,plantation crops, medicinal plants, aromatic plants,root, and tuber crops) in these States. In addition,26,571 ha of senile and unproductive orchards havebeen rejuvenated to increase productivity. TheMission has succeeded in bringing 54,938 ha underorganic farming. Major infrastructure which has comeup under the Mission includes 974 nurseries, 10,979community tanks, and 12,758 tube wells. Dripirrigation has been extended to 16,303 ha. Twenty-five model floriculture centres, fifty-nine herbalgardens, twenty-five tissue culture units, and twenty-two disease forecasting units have also been setup. The Mission gave special thrust to protectedcultivation of high-value crops like tomato, colouredcapsicum, strawberry, and flowers to ensure qualityproduction. Special attention has been given topromoting and popularizing mechanization inhorticulture. So far 5,785 power tillers, 4,64,595manually operated machines, 12,542 power operatedimplements, and 12,887 diesel engines have beendistributed among the farmers of the region. Tostrengthen the hands of women farmers, self-helpgroups (SHGs) have been promoted. Till now 8527
SHGs have been formed that are involved in thepromotion of floriculture and in exports. For properhandling and marketing of horticultural produce, 47wholesale markets, 344 rural primary/Apni Mandies,35 cold storages, and 64 processing units have beenset up. Under the Mission 2,65,435 persons,including 53,276 women, have so far been trained.
Micro Irrigation8.50 The Centrally sponsored National Mission onMicro Irrigation (NMMI) was launched in June 2010in addition to the earlier Micro Irrigation Schemelaunched in January 2006. The Mission is beingimplemented during the Eleventh Plan period forenhancing water-use efficiency by adopting dripand sprinkler irrigation systems in all States andUnion Territories for both horticulture and agriculturalcrops. The scheme provides assistance at 60 percent of the system cost for small and marginalfarmers and at 50 per cent for general farmers.Since 2005-06, a sum of ` 2739 crore has beenreleased by the Government of India under thescheme and 2.27 lakh ha brought under micro-irrigation. The system is beneficial for farmers inincreasing crop productivity and water-useefficiency; reducing fertilizer consumption(fertigation through drip system) and electricity andlabour consumption; and enhancing income.
National Bamboo Mission (NBM)8.51 With a view to harnessing the potential ofthe bamboo crop in the country, the Ministry ofAgriculture has been implementing the centrallysponsored NBM in 27 States in the country with atotal outlay of ` 568.23 crore. The Mission aims topromote holistic growth of the bamboo sector byadopting an area-based, regionally differentiatedstrategy and to increase the area under bamboocultivation and marketing. Under the Mission, stepshave been taken to increase the availability of qualityplanting material by supporting the setting up of newnurseries/tissue culture units and strengthening ofexisting ones. To address forward integration, theMission is taking steps to strengthen the marketingof bamboo products, especially handicraft items.During the current year (2010-11), 7946 ha forestand 2079 ha non-forest area has been coveredunder bamboo plantation.
Rubber8.52 India is the fourth largest producer of naturalrubber (NR) with a share of 8.5 per cent in worldproduction in 2009. Despite not having the best of
204 Economic Survey 2010-11
Website: http://indiabudget.nic.in
geographically favourable regions for growing NR,India continued to record the highest productivityamong major NR-producing countries. Theproduction of NR in 2010-11 is projected at 851,000tonnes, which is an increase of 2.4 per cent over2009-10. India has emerged as the second largestconsumer of NR, overtaking the United States witha share of 9.6 per cent in world consumption in2009. Consumption of NR in 2010-11 is projectedat 948,000 tonnes, which is an increase of 1.9 percent over the previous year. Given the relativelyhigher domestic prices prevailing in the last manymonths, exports of NR are expected to be lowerand imports higher in 2010-11.
Coffee
8.53 India ranks sixth in coffee production afterBrazil, Vietnam, Columbia, Indonesia, and Ethiopia.It produces both Arabica and Robusta varieties ofcoffee in a proportion of 33:67. Coffee is cultivated inabout 3.99 lakh ha mainly confined to the southernStates of Karnataka, Kerala, and Tamil Nadu, whichform the traditional coffee tracts. To a lesser extent,coffee is also grown in non-traditional areas likeAndhra Pradesh, Orissa, and the north-easternStates, the main emphasis being tribal developmentand afforestation. Coffee is predominantly an export-oriented commodity in India with 65 to 70 per cent ofthe production being exported, thereby earningconsiderable foreign exchange. For the past five tosix years, the productivity in India has been around800 kg/ha. The production of coffee stood at 2,89,600MT in 2009-10. For the year 2010-11, the postmonsoon crop estimate is placed at 2,99,000 MT.
Tea
8.54 India is the largest producer and consumer ofblack tea in the world. Tea is grown in 16 States inIndia. Assam, West Bengal, Tamil Nadu and Keralaaccount for about 96 per cent of the total production.The teas originating from Darjeeling, Assam, andthe Nilgiris are well known for their distinctive flavoursthe world over. Tea production in India during theyear 2009-10 has been estimated at 991.18 millionkg against 972.77 million kg achieved in 2008-09.
ANIMAL HUSBANDRY, DAIRYING,AND FISHERIES
8.55 The livestock & fisheries sector contributedover 4.07 per cent to the total GDP during 2008-09and about 29.7 per cent to the value of output fromtotal agricultural and allied activities. The Eleventh
Five Year Plan envisages an overall growth of 6-7per cent per annum for the sector. In 2009-10, thissector produced 112.5 million tonnes of milk, 59.8billion eggs, 43.2 million kg wool, and 4.0 milliontonnes of meat. The result of the 18th LivestockCensus (2007), derived from village-level count, hasplaced the total livestock population at 529.7 millionand poultry birds at 648.8 million.
8.56 India ranks first in world milk production,increasing its production from 17 million tonnes in1950-51 to about 112.5 million tonnes in 2009-10(Table 8.12). The per capita availability of milk hasalso increased from 112 grams per day in 1968-69to 263 gram per day in 2009-10. It is however stilllow compared to the world average of 279.4 grams/day, as per FAOSTAT (Food and AgricultureOrganization Statistical Database) 2009 data. Box8.2 gives some details of the milk situation in India.
8.57 A major programme for genetic improvementcalled the National Project for Cattle and BuffaloBreeding (NPCBB) was launched in October 2000to be implemented over a period of 10 years in twophases of five years each. The NPCBB envisagesgenetic upgradation and development of indigenousbreeds on priority basis. At present, 28 States andone Union Territory are participating in the project.
Livestock insurance
8.58 A Centrally sponsored scheme of livestockinsurance is being implemented in all the States withtwin objectives: providing protection mechanism tothe farmers and cattle rearers against any eventualloss of their animals due to death; and demonstratingthe benefits of insuring livestock to the people. Thescheme, which was introduced in 100 selecteddistricts on pilot basis during 2005-06, has now been
Table 8.12 : Production and per capitaavailability of milk
Year Per capita Productionavailability (million tonnes)(grams/day)
1990-91 176 53.9
2000-01 220 80.6
2005-06 241 97.1
2006-07 246 100.9
2007-08 252 104.8
2008-09 258 108.5
2009-10 263 112.5
Source: Department of Animal Husbandry, Dairyingand Fisheries.
205Agriculture and Food Management
Website: http://indiabudget.nic.in
extended to 300 selected districts covering all states.The scheme benefits farmers and cattle rearershaving milch cattle and buffaloes. In 2010-11, ̀ . 20.12crore has been released up to December 2010 and20.63 lakh animals were insured from 2006-07 to2009-10.
Poultry
8.59 Poultry development is one of the mostresilient sectors in the country, fast adapting itselfto the changing biosecurity, health, and food safetyneeds. India produces more than 59.8 billion eggsper year, with per capita availability of 51 eggs perannum. The poultry meat production is estimated tobe 1.85 million tonnes in 2008-09. To providenecessary services to the farmers, four regionalCentral Poultry Development Organizations (CPDOs)have been restructured on the principle of one-window service. These are located at Chandigarh,Bhubaneswar, Mumbai, and Hessarghatta. They
impart training to farmers to upgrade their technicalskills. The Central Poultry Performance TestingCenter (CPPTC), located at Gurgaon is entrustedwith responsibility of testing the performance of layerand broiler varieties. This Center gives valuableinformation relating to different genetic stocksavailable in the country. The Centrally sponsoredPoultry Development scheme has three components,Assistance to State Poultry Farms, Rural BackyardPoultry Development, and Poultry Estates.Assistance to State Poultry Farms aims atstrengthening existing State poultry farms to enablethem to provide improved stocks suitable for ruralbackyard rearing. The main objective of the RuralBackyard Poultry Development component is toprovide supplementary income and nutritionalsupport to below poverty line (BPL) people. PoultryEstates are aimed primarily at educated,unemployed youth and small farmers with somemargin money, to make profitable ventures out of
Box 8.2 : Milk Scenario in India
Annual milk production in India has grown more than six times since independence. The average annual growth rate in the
production of milk in recent years has been close to 4 per cent. Even though the level of per capita availability at 263 gram/
day for India in 2009-10 is much lower than that in developed countries, it is well above the developing country average.
The Eleventh Five Year Plan envisages an overall growth of 6-7 per cent per annum for the sector. As per an assessment
made by the Planning Commission, the domestic demand for milk by 2021-22 is expected to be 172.20 million tonnes. As
projected under the proposed National Dairy Plan, the production of milk in the country is required to increase to 180
million tonnes by 2021-22 to meet the demand. However, the country has not been able to keep pace with the domestic
demand for milk. The domestic demand for milk is growing at about six million tonnes per year whereas annual
incremental production over the last ten years has been about 3.5 million tonnes per year. With higher growth of the
economy, increase in population, and increased health consciousness among the populace, it is only natural that the
demand for milk and milk products will increase leading the proportion of income spent on milk and milk products to
increase. Further, urban centres will demand more and more processed and packaged dairy products but in the rural areas
people may still prefer to purchase from the local milkmen.
About 80 per cent of milk produced in the country is still handled in the unorganized sector and only the remaining 20 per
cent is equally shared by cooperatives and private dairies. Despite the appreciable growth in the milk production in the last
six decades, the productivity of our animals is still low. Our marketing systems are also not modernized or developed to
a satisfactory level. Other issues in this sector are ineffective breeding programmes, limited availability and affordability
of quality feed and fodder, improper veterinary infrastructure, lack of vaccinations, inadequate access to formal credit
mechanisms, inadequate research capacity, limited processing capacity, and lack of transport. Considering that the
requirement of milk in 2021-22 is expected to be 180 million tonnes and the current level of milk production is 112 million
tonnes, the milk production must increase at around 5.5 per cent per annum in the next 12 years. If it fails to do so, India
may need to resort to imports from the world market. A large consumer like India entering the international market would
have the potential to cause international prices to spurt. Hence it is prudent that we depend on the domestic market and
develop the milk sector with the right attention and focus and the required investment. Recent hikes in prices of milk and
milk products have been a matter of concern. The gap between domestic demand for milk and production of milk has put
upward pressure on milk prices in the country. A strong supply response with focus on production and productivity can
only keep the prices stable.
206 Economic Survey 2010-11
Website: http://indiabudget.nic.in
various poultry- related activities. The Central-sector,Poultry Venture Capital Fund scheme encouragesentrepreneurship skills of individuals, coveringvarious poultry activities.
Livestock health
8.60 Animal wealth in India has increased manifoldprompting the animal husbandry sector to adoptmodern practices. With increased trade activity andextensive cross-breeding programmes, the chancesof ingress of exotic diseases into the country haveincreased. To ensure disease-free status and becompatible with the standards laid down by the WorldAnimal Health Organization, many animal healthschemes have been initiated, which provide financialassistance to States/UTs to control major livestockand poultry diseases and strengthen veterinaryservices including reporting of animal diseases. Allavian influenza outbreaks reported were effectivelycontrolled and the country declared free from avianinfluenza in June 2010.
Fisheries Fisheries
8.61 Fish production increased from 7.14 milliontonnes in 2007-08 to 7.85 million tonnes in 2009-10.Fishing, aquaculture, and allied activities are reportedto have provided livelihood to over 14 million personsin 2008-09, apart from being a major foreignexchange earner (Table 8.13).
Feed and fodder
8.62 Adequate availability of feed and fodder forlivestock is very vital for increasing milk productionand sustaining the ongoing genetic improvementprogramme. The estimated green fodder shortage inthe country is about 34 per cent. The Departmentof Animal Husbandry & Dairying has beenimplementing a modified centrally sponsored Fodder
and Feed Development Scheme with effect from 1April 2010 to supplement the efforts of the States toimprove fodder production. Financial assistance tothe tune of ̀ 2903.04 lakh (up to December 2010),has been provided to the States in 2010-11. Underthe Central Minikit Testing Programme, fodder seedminikits of latest high-yielding fodder varieties aredistributed free of cost to farmers. During the currentyear (2010-11) 11.79 lakh fodder seed minikits havebeen allotted to the States for distribution to farmers.
CREDIT AND INSURANCE
Agricultural Credit
8.63 From Kharif 2006-07 to 2008-09, farmerswere receiving crop loans up to a principal amountof ` 3 lakh at 7 per cent interest. In the year 2009-10, Government provided an additional 1 per centinterest subvention to those farmers who repaid theirshort-term crop loans as per schedule. TheGovernment has raised this subvention for timelyrepayment of crop loans from 1 per cent to 2 percent from the year 2010-11. Thus the effective rateof interest for such farmers will be 5 per cent perannum.
Revamping of Cooperative Credit Structure
8.64 In January 2006, the Government announceda package for revival of the Short-term RuralCooperative Credit Structure involving financialassistance of ` 13,596 crore. The National Bankfor Agriculture and Rural Development (NABARD)has been designated the implementing agency forthe purpose. States are required to signmemorandums of understanding (MoUs) with theGovernment of India and NABARD, committing toimplementation of the legal, institutional and otherreforms as envisaged in the revival package. So far
Table 8.13 : Production and export of fish
Fish production (million tonnes) Export of marine products
Year Marine Inland Total Qty Value(‘000 tonnes) (` ` ` ` ` crore)
1990-91 2.3 1.5 3.8 140 893
2000-01 2.8 2.8 5.6 503 6288
2005-06 2.8 3.8 6.6 551 7019
2006-07 3.0 3.8 6.8 612 8363
2007-08 2.9 4.2 7.1 541 7620
2008-09 3.0 4.6 7.6 602 8608
2009-10 2.98 4.87 7.85 664 9921
207Agriculture and Food Management
Website: http://indiabudget.nic.in
twenty- five States have executed such MoUs.Thiscovers 96 per cent of the primary agriculturalcooperative societies (PACS) and 96 per cent ofthe Central cooperative banks (CCBs) in thecountry. As of November 2010, an amount of `8009.75 crore has been released by NABARD asGovernment of India share for recapitalization of49,983 PACS.
Rehabilitation Package for DistressedFarmers
8.65 The Government is implementing arehabilitation package for 31 suicide- prone districtsin the States of Andhra Pradesh, Karnataka, Kerala,and Maharashtra involving a financial outlay of `16,978.69 crore. Special packages are beingimplemented in Kerala for the development ofKuttanad wetland ecosystem and mitigation ofagrarian distress in Idukki district with an outlay of` 1840.75 crore and ` 764.45 crore, respectively.
Kisan Credit Card (KCC) Scheme
8.66 The KCC scheme was introduced in August1998. About 970.64 lakh KCCs have been issued upto September 2010. The scheme includesreasonable components of consumption credit andinvestment credit within the overall credit limitsanctioned to the borrowers to provide adequate andtimely credit support to the farmers for their cultivationneeds
Task Force on Private Moneylenders
8.67 A Task Force has been constituted under thechairmanship of Chairman, NABARD, to look intothe issue of a large number of farmers who had takenloans from private moneylenders in the country. TheTask Force has submitted its report in June 2010.This has been circulated to stakeholders for furnishingtheir comments/ views.
Agricultural Insurance
8.68 Four crop insurance schemes, namely theNational Agricultural Insurance Scheme (NAIS), PilotModified NAIS (MNAIS), Pilot Weather Based CropInsurance Scheme (WBCIS), and Pilot Coconut PalmInsurance Scheme (CPIS) are under implementationin the country.
i) The National Agricultural Insurance Scheme(NAIS)
The NAIS is being implemented in the country fromrabi 1999-2000 season. The Agriculture Insurance
Company of India Ltd. (AIC) is the implementingagency (IA) for the Scheme. The main objective ofthe scheme is to protect farmers against crop lossessuffered on account of natural calamities. Thescheme is available to all the farmers—loanee andnon-loanee—irrespective of their size of holding. Itis operating on the basis of an area approach. Itenvisages coverage of all the food crops, oilseeds,and annual commercial/horticultural crops in respectof which past yield data are available for adequatenumber of years. Premium rates for food and oilseedscrops are ranging between 1.5 per cent and 3.5 percent. In case of annual commercial/horticultural crops,actuarial premiums are being charged. A 10 per centsubsidy is available for small and marginal farmers.All financial liabilities under the scheme are sharedby the Central and State Governments on 50: 50basis. The scheme is at present being implementedby 25 States and two UTs.
ii) The Pilot Modified NAIS (MNAIS)
Keeping in view the limitations/shortcomings of theexisting scheme, the Government has approved theModified NAIS for implementation on pilot basis in50 districts from rabi 2010-11 season. The majorimprovements made in the MNAIS are: actuarialpremium with subsidy in premium at different rates,i.e. 40 per cent to 75 per cent depending upon theslab, provided to farmers, all claims liability on theinsurer, unit area of insurance reduced to villagepanchayat level for major crops, indemnity forprevented/sowing/planting risk and for post harvestlosses due to cyclone, payment up to 25 per centadvance of likely claims as immediate relief, moreproficient basis for calculation of threshold yield,minimum indemnity level of 70 per cent instead of60 per cent, and private-sector insurers withadequate infrastructure allowed (at present, ICICI-Lombard, IFFCO-Tokio and Cholamandalam-MS).Only upfront premium subsidy is shared by theCentral and State Governments on 50: 50 basis andclaims are the liability of the insurance companies.Seven States have already notified the areas forimplementation of the scheme during rabi 2010-11.It is expected that the scheme will be notified by 14-15 States.
iii) Weather Based Crop Insurance Scheme(WBCIS)
Efforts have been made to bring more farmers underthe fold of crop insurance by introducing a WeatherBased Crop Insurance Scheme (WBCIS) asannounced in the Union Budget 2007 in selected
208 Economic Survey 2010-11
Website: http://indiabudget.nic.in
areas on pilot basis. The WBCIS is intended toprovide insurance protection to farmers againstadverse weather incidences, which are deemed tounfavourably impact crop production. It has theadvantage of settling claims within the shortestpossible time. The WBCIS is based on actuarial ratesof premium but to make the scheme attractive,premium actually charged from farmers have beenrestricted on a par with the NAIS. In addition to theAgriculture Insurance Company of India Ltd. (AIC),private insurers have also been included forimplementing the scheme in selected areas. Duringkharif 2007 to kharif 2010, about 81 lakh farmershave been covered under the pilot scheme.
iv) Coconut Palm Insurance Scheme (CPIS)
The CPIS is being implemented on pilot basis since2009-10 in selected areas of Andhra Pradesh, Goa,Karnataka, Kerala, Maharashtra, Orissa, Tamil Nadu,and West Bengal. The scheme is administered bythe Coconut Development Board (CDB) through theAIC. As on 30 July 2010, 14.33 lakh palms of about27,023 farmers have been covered under the scheme.
Agricultural Marketing
8.69 Organized marketing of agriculturalcommodities is being promoted in the countrythrough a network of regulated markets. Most of the
States and Union Territories have enactedlegislations (the Agriculture Produce MarketingCommittee [APMC] Act) to provide for regulation ofagricultural produce markets. Seventeen States/ UTshave amended their APMC Acts and the remainingare in the process of doing so (Table 8.14). Thereare 7157 regulated markets in the country as on31March 2010. The country has 21,221 ruralperiodical markets, about 15 per cent of whichfunction under the ambit of regulation. The adventof regulated markets has helped mitigate the markethandicaps of producers/ sellers at wholesaleassembling level. Internet connectivity is beingprovided to important agricultural markets in thecountry to establish a nationwide information networkfor speedy collection of prices and market-relatedinformation. Presently, wholesale prices of 300commodities and about 2000 varieties are beingreported on the Agricultural Marketing InformationNetwork (AGMARKNET) portal from more than 1900markets. But rural periodic markets in general andtribal markets in particular have remained outsidethe ambit of the APMC Act.
8.70 Other major initiatives include setting up ofterminal market complexes (TMC) for fruits,vegetables, and other perishables in important urbancentres in those States which provide for marketreforms as per the Model Act. These markets will
Table 8.14 : Progress of Reforms in Agricultural Markets (APMC Act) (as on 31 October 2010)
Sl. No. Stage of reforms Name of State/ Union territory
Note: * APMC Act has been repealed with effect from September 1, 2006.
1. Reforms to the APMC Act have been donefor Direct Marketing; Contract Farming andMarkets in Private/Coop. Sectors.
4. The APMC Act already provides for reforms Tamil Nadu
5. Administrative action has been initiated forthe reforms
Meghalaya, Haryana, J&K, Uttarakhand, West Bengal,Pondicherry, NCT of Delhi and Uttar Pradesh
209Agriculture and Food Management
Website: http://indiabudget.nic.in
provide state-of-the-art infrastructure facilities forelectronic auction, cold chain and logistics, andoperate through primary collection centresconveniently located in producing areas to allow easyaccess to farmers.
Extension Services8.71 A scheme called Support to State ExtensionProgrammes for Extension Reforms was launchedin 2005-06, with the aim of making the extensionsystem farmer driven and farmer accountable. Forthis purpose new institutional arrangements arebeing made for technology dissemination in the formof an Agricultural Technology Management Agency(ATMA) at district level to operationalize the extensionreforms with the active participation of farmers/farmer groups, non-government organizations(NGOs), Krishi Vigyan Kendras, Panchayati RajInstitutions and other stakeholders operating atdistrict level and below. Up to October 2010, 591district-level ATMAs have been established. Genderconcerns are being mainstreamed by mandatingthat 30 per cent of resources on programmes andactivities are allocated for women farmers andextension functionaries.
8.72 The Mass Media Support to AgricultureScheme focuses on use of Doordarshaninfrastructure for providing agriculture-relatedinformation and knowledge to the farmingcommunity. Audio/ video spots on emerging issues/schemes such as rabi/kharif campaign, Kisan CallCentre Scheme, and KCC are publicized using freecommercial time. Live ‘crop seminars’ onDoordarshan involving farmers and experts havealso been organized. The mass media initiative alsoincludes the use of 96 All India Radio FM transmittersto broadcast 30-minute area-specific agriculturalprogrammes six days a week. With a view to creatingawareness about assistance available under variousschemes, a ‘Focused Publicity Campaign’ has beenlaunched during 2010-11. Under this campaignpublicity through newspapers as well as electronicmedia was carried out.
8.73 The Kisan Call Centre scheme was launchedin 2004 to provide agricultural information to thefarming community through toll-free telephone lines.A country-wide common 11-digit number—1800-180-1551—has been allocated for KCCs. Repliesto the queries of the farming community are beingprovided in 22 local languages. Calls are attendedto from 6.00 am to 10.00 pm on all seven days ofthe week.
8.74 The Agri-clinic and Agri-business CentresScheme was launched in 2002 to provide extensionservices to farmers on payment basis through settingup of economically viable self–employment ventures.Selected trainees are provided agri-preneurshiptraining. NABARD monitors the credit support to Agri-Clinics through commercial banks. Provision of credit-linked back-ended subsidy at 33 per cent of thecapital cost of the project funded through bank loanas well as full interest subsidy for the first two yearson the bank credit has recently been approved underthe scheme. From the inception of the scheme22,158 unemployed agriculture graduates have beentrained up to September 2010.
8.75 Information dissemination through agri fairs/exhibitions is an excellent mechanism forshowcasing latest technological advancements anddissemination of information to the farming communityand also promoting business opportunities inagriculture and allied sectors. Agri fairs are promoted/organized at national, State, district, and block levels.
FOOD MANAGEMENT
8.76 The main objectives of food management areprocurement of foodgrains from farmers atremunerative prices, distribution of foodgrains toconsumers, particularly the vulnerable sections ofsociety at affordable prices and maintenance offood buffers for food security and price stability.The instruments used are MSP and Central issueprice (CIP). The nodal agency which undertakesprocurement, distribution, and storage of foodgrainsis the Food Corporation of India (FCI). Procurementat MSP is open-ended, while distribution is governedby the scale of allocation and its offtake by thebeneficiaries. The offtake of foodgrains is primarilyunder the targeted public distribution system (TPDS)and other welfare schemes of the Government ofIndia.
Procurement and Offtake of Foodgrains
8.77 During rabi marketing season (RMS) 2010-11, 22.52 million tonnes of wheat was procuredagainst 25.38 million tonnes in RMS 2009-10. Inkharif marketing season (KMS) 2009-10, the totalprocurement of rice was 31.46 million tonnes against33.69 million tonnes in KMS 2008-09. Procurementof coarse grains in 2009-10 stood at 4.07 thousandtonnes compared to 13.75 thousand tonnes in 2008-09. Procurement of foodgrains in States like Punjab,Haryana, Uttar Pradesh, Madhya Pradesh, Andhra
210 Economic Survey 2010-11
Website: http://indiabudget.nic.in
Pradesh, and Chhattisgarh is higher than in otherStates. In fact, Punjab and Haryana make themaximum procurement. Increased MSP along withvarious other steps taken by the Government hasresulted in higher levels of procurement of foodgrains.This has paved the way for comfortable levels of foodstocks to meet the TPDS needs and buffer stocksnorms. Offtake of wheat and rice from the Centralpool for the TPDS and other welfare schemes) hasgone up in the last many years (Table 8.15).
Decentralized Procurement Scheme
8.78 A number of States have opted forimplementation of the Decentralized ProcurementScheme (DCP) introduced in 1997, under whichfoodgrains are procured and distributed by the StateGovernments themselves. Under this scheme, thedesignated States procure, store and issuefoodgrains under the TPDS and welfare schemes ofthe Government of India. The difference between theeconomic cost fixed for the State and the CIP ispassed on to the State Government as subsidy. Thedecentralized system of procurement has theobjectives of covering more farmers under MSPoperations, improving efficiency of the PDS, providingfoodgrains varieties more suited to local tastes and
reducing transportation costs. As on 22 December2010, a total of ` 9376 crore of food subsidy hasbeen released to various States under DCPoperations in 2010-11. States under DCP operationshave shown a healthy trend of increase inprocurement of rice (94.9 lakh tonnes in KMS 2006-07 to 119.5 lakh tonnes in 2009-10). In KMS 2008-09 and 2009-10, the rice procurement by DCP stateswas 135.4 and 119.5 lakh tonnes respectively. Inthe case of wheat, however, the procurement inDCP States, particularly Uttar Pradesh and MadhyaPradesh was rather low in RMS 2006-07 and 2007-08 primarily due to aggressive purchases by privatecompanies on expectation of higher market prices,lower rates of taxes and levies than Punjab andHaryana and proximity to markets in southern andeastern States of the country. However, there wasrecord procurement of wheat in RMS 2008-09 and2009-10. Under the decentralized system ofprocurement, the procurement of wheat hasincreased from 0.5 lakh tonnes in 2006-07 to 60.7lakh tonnes in 2009-10. In 2010-11, the wheatprocurement in DCP states has gone down primarilydue to Uttar Pradesh withdrawing from the DCPscheme.
Table 8.15 : Procurement and offtake of wheat and rice (million tonnes)
8.79 The stock position of foodgrains in the Centralpool as on 1 October, 2010 is 46.2 million tonnescomprising 18.4 million tonnes of rice and 27.8 milliontonnes of wheat. This is adequate for meeting therequirements under the TPDS and welfare schemesduring the current financial year (Table 8.16).
Economic Cost of Foodgrains to the FCI
8.80 The economic cost of foodgrains consists ofthree components, namely MSP (and bonus if
applicable) as the price paid to the farmers,procurement incidentals, and the cost of distribution.The economic cost for both wheat and rice witnesseda significant increase during the last few years dueto increase in MSPs and proportionate increase inthe incidentals (Table 8.17 and Figure 8.16).
Food Subsidy
8.81 Provision of minimum nutritional support tothe poor through subsidized foodgrains and ensuingprice stability in different States are the twin objectivesof the food security system. In fulfilling its obligation
Table 8.16 : Buffer Stock Norms and Actual Stocks
(lakh tonnes)
As on WHEAT RICE TOTAL
Minimum Actual Minimum Actual Minimum ActualBuffer Norms Stock Buffer Norms Stock BufferNorms Stock
January 2008 82 77.12 118 114.75 200 191.87
April 40 58.03 122 138.35 162 196.38
July* 201 249.12 98 112.49 299 361.61
October 140 220.25 52 78.63 192 298.88
January 2009* 112 182.12 138 175.76 250 357.88
April 70 134.29 142 216.04 212 350.33
July 201 329.22 118 196.16 319 525.38
October 140 284.57 72 153.49 212 438.06
January 2010 112 230.92 138 243.53 250 474.45
April 70 161.25 142 267.13 212 428.38
July 201 335.84 118 242.66 319 578.50
October 140 277.77 72 184.44 212 462.21
Notes:* Buffer norms include Food Security Reserve of 30 lakh tonnes of wheat from 1 July 2008 and20 lakh tonnes of rice from 1 January 2009 onwards.
Table 8.17 : Economic cost of Rice and Wheat
(`/quintal)
Year 2002-03 2004-05 2006-07 2007-08 2008-09 2009-10 (RE) 2010-11 (BE)
Notes: * For rice, from 2006-07, weightage of levy rice incidentals is also being added in the procurement incidentals.** Weighted average of common and grade ‘A’ rice taken together.
BE : budget estimates; RE : revised estimates.
212 Economic Survey 2010-11
Website: http://indiabudget.nic.in
0
Rice
Economic cost of rice and wheat
1000
2000
Figure 8.16�
/qun
ital
Year
2002
-03
2007
-08
2006
-07
2008
-09
2010
-11
2004
-05
500
1500
2500
Wheat
2009
-10
Notes: Weighted average of common and grade ‘A’ rice taken together. For rice, from 2006-07, in the procurement incidental weightage of levy riceincidentals is also being taken.
towards distributive justice, the Government incursfood subsidy. While the economic cost of wheat andrice has continuously gone up, the issue price hasbeen kept unchanged since 1 July 2002. TheGovernment, therefore, continues to provide largeand growing amounts of subsidy on foodgrains fordistribution under the TPDS, other nutrition-basedwelfare schemes, and open market operations. Thefood subsidy bill has increased substantially in thepast few years (Table 8.18 and Figure 8.17).
TPDS Allocation and CIP
8.82 Allocations of foodgrains for the BPL andAntyodaya Anna Yojana (AAY) categories are madeat 35 kg per family per month for all accepted 6.52crore BPL (including 2.43 crore AAY) families in thecountry as per 1993-94 poverty estimates of thePlanning Commission and March 2000 populationestimates of the Registrar General of India (RGI).For the APL category, allocations to different States/UTs are made depending upon the availability ofstocks of foodgrains in the Central pool and pastofftake by the States. The allocation for the APLcategory has been increased from 10 kg to 15 kgper family per month from August 2010 for six
Table 8.18 : Quantum of food subsidiesreleased by Government
Year Food subsidy Annual growth
(` ` ` ` ` crore) (per cent)
1999-2000 9200.00 5.75
2000-01 12,010.00 30.54
2001-02 17,494.00 45.66
2002-03 24,176.45 38.20
2003-04 25,160.00 4.07
2004-05 25,746.45 2.33
2005-06 23,071.00 -10.39
2006-07 23,827.59 3.28
2007-08 31,259.68 31.19
2008-09 43,668.08 39.69
2009-10 58,242.45 33.37
2010-11* 51,196.97 -
Note: *Figures up to 22 December 2010.
0
Foodsubsidy
Quantum of food subsidies released by government
20
40
60
Figure 8.17
�th
ousa
nd c
rore
Year1999
-200
0
2007
-08
2006
-07
2008
-09
2009
-10
2005
-06
70
10
30
50
2004
-05
2003
-04
2002
-03
2001
-02
2000
-01
months. Accordingly, these allocations rangebetween 15 kg and 35 kg per family per month.Wheat and rice are issued by the Central
213Agriculture and Food Management
Website: http://indiabudget.nic.in
Government at uniform CIPs to States and UnionTerritories for distribution under the TPDS. Detailsof CIPs of wheat and rice since 2002-03 are givenin Table 8.19.
8.83 The difference between wholesale prices ofwheat and rice in the open market and the CIPs atwhich foodgrains are issued to cardholders haswidened in the last five years due to non-revision ofthe latter, as a result of which offtake under theTPDS, particularly by APL families has gone upsubstantially. During the current year, theGovernment has released a quantity of 470.80 lakhtonnes under the TPDS covering AAY, BPL andAPL families. In addition, 5.90 lakh tonnes offoodgrains was released to States as calamity relief,etc. Further, special ad hoc allocation of 30.66 lakhtonnes of foodgrains was made to States/UTs inMay 2010 for all accepted numbers of BPL/AAY/APL families in the country. The issue price of thisallocation was ̀ 8.45 per kg for wheat and ̀ 11.85per kg for rice. A total quantity of 25.00 lakh tonneshas been allocated as special ad hoc/additionalallocation for BPL families at BPL prices to all States/UTs in September 2010 for distribution over nextsix months. Further, during the current year, anallocation of 47.55 lakh tonnes of foodgrains hasbeen made till November 2010 for other welfareschemes such as the Midday Meal Scheme,Integrated Child Development Services (ICDS),welfare Institutions, and the Emergency FeedingProgramme.
Open Market Sale Scheme (Domestic)OMSS (D)
8.84 In addition to maintaining buffer stocks andproviding foodgrain stocks to meet the requirementof the TPDS and other welfare schemes, the FCI onthe behalf of the Government of India has beenundertaking sale of wheat and rice at predeterminedprices in the open market from time to time toenhance the supply so as to have a moderatinginfluence on open market prices. The quantity of
wheat and rice disposed of under the Open MarketSale Scheme (domestic) (OMSS [D]) during the lasttwo years is given in Table 8.20.
Sugar
8.85 Sugar production in India is cyclic in nature.The 2006-07 and 2007-08 sugar seasons (October-September) were years of high production whereasthe 2008-09 and 2009-10 seasons were years of lowproduction. The production of sugar in the 2008-09and 2009-10 sugar seasons is estimated at about146.7 lakh tonnes and 188 lakh tonnes compared to282 lakh tonnes and 263 lakh tonnes in 2006-07and 2007-08 respectively. The decline in sugarproduction in 2008-09 and 2009-10 put upwardpressure on domestic sugar prices and the CentralGovernment had to take a number of measures toaugment domestic stocks of sugar and contain sugarprices during this period such as allowing import ofduty-free sugar, imposing stock-holding and turnoverlimits on sugar, bringing khandsari sugar under theambit of stockholding and turnover limits andsuspension of futures trading in sugar. The sugarproduction in 2010-11 is expected to be better atabout 245 lakh tonnes, as per estimates given byCane Commissioners.
8.86 The concept of ‘statuary minimum price’ hasbeen replaced by that of ‘ fair and remunerative price’(FRP) for sugarcane to provide reasonable marginto sugarcane farmers on account of ‘risk’ and ‘profit’and is to be uniformly applicable to all States. Theamendments to the Sugarcane (Control) Order1966, have come into force from 22 October 2009.For the 2010-11 sugar season, the CentralGovernment has fixed an FRP of ̀ 139.12 per quintallinked to a basic recovery rate of 9.5 per cent subjectto a premium of ` 1.46 for every 0.1 percentageincrease in recovery above that level.
Edible Oils
8.87 The production of oilseeds (kharif 2010-11) andnet availability of edible oils from all domestic sources
Table 8.19 : CIPs
(`/quintal)
Year Category Wheat Rice
2002-03 APL 610 830
(w.e.f 1.7.2002 BPL 415 565
till date) AAY * 200 300
* CIPs for AAY households are effective since theinception of the scheme in December 2000.
Table 8.20 : Quantity of Wheat and RiceDisposed of under the OMSS (D)
Year Qty (lakh MT)
Wheat Rice
2009-10 16.28 4.94
2010-11* (as on 17.11.2010) 2.07 1 .67
Note: *Lifting after March 2010 against allocation madein 2009-10.
214 Economic Survey 2010-11
Website: http://indiabudget.nic.in
(primary) are estimated at 172.74 lakh tonnes and35.19 lakh tonnes respectively. In order to increasethe availability and control price of edible oils, theGovernment has reduced custom duties on crudeand refined edible oils to ‘nil’ and 7.5 per centrespectively since April 2008. It has been decidedthat this duty structure will continue till September2011. Export of all major edible oils from the countryhas been banned since March 2008 up to September,2011 (except coconut oil through Cochin Port andcertain oils from minor forest produce and edible oilsin branded consumer packs of up to 5 kg, with aceiling of 10,000 tonnes per year).The Governmentlaunched a scheme for ‘Distribution of SubsidizedEdible Oils’ in 2008-09 to provide relief to consumersfrom rising prices of edible oils. Under this Scheme,imported edible oil was distributed through StateGovernments/UTs at the rate of 1 litre per ration cardper month. The Scheme continued in 2009-10 witha subsidy of ` 15 per kg on imported oil up to 10lakh tonnes and has been extended till 31 March 312011.
COMMODITY FUTURES MARKET
8.88 The commodity futures market facilitates theprice discovery process and provides a platform forprice risk management in commodities. The marketcomprises 21 commodity futures exchanges, whichinclude five national and 16 (commodity-specific)regional commodity exchanges. During 2010, onecommodity exchange, namely the AhmadabadCommodity Exchange (ACE), was upgraded to anational exchange and rechristened ACE Derivativesand Commodity Exchange Limited, Ahmadabad.Agricultural commodities, bullion, energy, and basemetal products account for a large share of thecommodities traded in the commodities futuresmarket. Futures trading in zinc and lead, minicontracts were introduced for trading during 2010.
8.89 The total value of trade in the commodityfutures market has risen substantially in 2010 (Table8.21). The growth could be attributed to largerparticipation in the market, increase in globalcommodity prices, the advent of new commodityexchanges and the restoration of trade in some ofthe suspended agriculture commodities.
8.90 During the year 2010-11 (up to November2010), in value terms bullion accounted for themaximum share of traded value among thecommodity groups (45.22 per cent) followed bymetals (23.80 per cent), energy (19.45 per cent)
and agricultural commodities (11.53 per cent).However, in quantity terms trade in energy accountedfor 56.77 per cent followed by agriculturalcommodities (31.67 per cent), metals (11.51 percent), and bullion (0.05 per cent).
8.91 The Forward Markets Commission (FMC), theregulator for commodity futures trading under theprovisions of the Forward Contracts (Regulation) Act1952, continued its efforts to strengthen and broadbase the market during 2010. The efforts weredirected at enlarging the participation of physicalmarket stakeholders, especially farmers, as hedgersin the commodity futures market by increasing thelevel of awareness of physical market participantsand policymakers about the economic role of thismarket. The FMC also ensures the dissemination ofspot and futures prices of agriculture commoditiesat Agricultural Produce Market Committees (APMCs)through the implementation of the PriceDissemination Project, in coordination withAGMARKNET and the national commodityexchanges. The project envisages placement ofelectronic price ticker boards at APMC marketsdisplaying AGMARKNET spot prices and futuresprices of agriculture commodities discovered on theNational Exchanges, on a real-time basis. On theregulatory front, the FMC also took the followingsteps for the development of commodity futuresmarket:
i. The Commission amended the guidelines forgrant of recognition to new commodityexchanges under the Forward Contracts
Table 8.21 : Turnover on commodity futuresmarkets
(` crore)
Name of the Calendar year
exchange 2008 2009 2010(up to Nov.
2010)
Multi Commodity 42,84,653 59,56,656 78,95,404Exchange, Mumbai
National Commodity 6,28,074 8,05,720 9,73,217and DerivativesExchange, Mumbai
National Multi 37,272 1,95,907 1,80,738Commodity Exchange, Ahmedabad
Others 83,885 1,32,173 4,45,366
Total 50,33,884 70,90,456 94,94,725
215Agriculture and Food Management
Website: http://indiabudget.nic.in
(Regulation) Act 1952 by specifying the equitythat can be held by a single stock exchangeor commodity exchange and the cumulativeequity shareholding of all stocks andcommodity exchanges.
ii. The equity structure of the nationwide multi-commodity exchanges was specified after fiveyears of operation, in view of which, noindividual or persons acting in concert can holdmore than 15 per cent of the paid up equitycapital of the exchange. The original promoter/investors can also not hold more than 26 percent of the paid up equity capital of theexchanges. The amended clause also restrictsthe shareholding of stock exchange(s) andcommodity exchange (s) in the NationalCommodity Exchange.
iii. To protect the interests of customers,guidelines on market access throughauthorized persons for all national commodityexchanges were amended whereby the systemof sub-brokers was discontinued and themembers of the national commodity exchangeswere required to provide access to their clientsonly through authorized person(s) appointedas per the Commission’s guidelines.
iv. Guidelines were issued specifying theconditions which are required to be fulfilled bythe members of the commodity exchangeswilling to set up wholly owned subsidiaries andjoint ventures in the overseas markets.
DEVELOPMENT OF ELECTRONICS SPOTEXCHANGE
8.92 Four National Commodity Spot Exchangeswith electronic trading platforms were set up, namelythe National Spot Exchange Limited (NSEL), NCDEXSpot Exchange (NSPOT), Reliance Spot Exchange,and National APMC. Of these, the NSEL, NCDEXSpot Exchange, and Reliance Spot Exchange arein operation. At present, the spot exchanges offertrading in more than 30 commodities having deliverylocations spread over 15 states. Spot exchangeselectronically connect large numbers of buyers andsellers geographically located at distant places toconverge on a single platform to overcome problemsof time, distance, and information flow and alsoprovide guarantee for each trade market linkageamong farmers, processors, exporters and users witha view to reducing the cost of intermediation andenhancing price realization by farmers. They also
provide the most efficient spot price inputs to futuresexchanges. On the agricultural side, the exchangeswill enable farmers to trade seamlessly on theplatform by providing real-time access to priceinformation and a simplified delivery process, therebyensuring the best possible price. On the buy side,all users of the commodities in the commodity valuechain would have simultaneous access to theexchanges and be able to procure at the bestpossible price. Therefore the efficiency levels attainedas a result of such seamless spot transactions wouldresult in major benefits for both producers andconsumers.
OUTLOOK AND CHALLENGES
8.93 The country has made great strides towardsincreasing foodgrains production since the mid-sixties. Today, India ranks high in the production ofvarious commodities such as milk, wheat, rice, fruits,and vegetables. However, the agriculture sector inIndia is at a crossroads with rising demand for fooditems and relatively slower supply response in manycommodities resulting in frequent spikes in foodinflation. The technological breakthrough achievedin the 1960s is gradually waning. The need for asecond green revolution is being experienced morethan ever before.
8.94 Increasing agriculture production andproductivity is a necessary condition not only forensuring national food security, livelihood security,and nutritional security but also for sustaining thehigh levels of growth envisaged in the current Plan.However, with very little growth in area and marginalgrowth in yields of many crops during the lastdecade, increasing agricultural production remainsa challenge. Concerted and focused efforts arerequired for addressing the challenge of stagnatingproductivity levels in agriculture. A holistic approach,simultaneously working on agricultural research,development, dissemination of technology, andprovision of agricultural inputs such as quality seed,fertilizers, pesticides, and irrigation, would helpachieve the critical levels of productivity needed.Further, effective coordination and monitoring ofthe ongoing agriculture and allied sectorprogrammes needs to be ensured for optimumresults.
8.95 Capital investment in agriculture as apercentage of the GDP has been stagnating in recentyears, although the capital expenditure in agricultureas a percentage of the GDP in agriculture has shown
216 Economic Survey 2010-11
Website: http://indiabudget.nic.in
some improvement in the current Five Year Plan. Itmay, however, also be noted that the agriculturesector GDP has itself been stagnating during thelast three years from 2007-08 to 2009-10. The realchallenge in agriculture sector is to enhance capitalinvestment in the sector both by public and privatesector in a sustained way.
8.96 Sixty per cent of our net sown area is stillrainfed. Various studies indicate that the potential ofrainfed areas has not been fully utilized. A targeteddevelopment of rainfed areas should be prioritized.
8.97 Enhancing the returns farmers get on theirproduction is essential for incentivizing the farmersto produce more. Farmers need to realize the marketprice for their produce. Setting up of efficient supplychains is not only essential for ensuring adequatesupplies of essential items at reasonable prices butalso to ensure that producers get adequatelycompensated. Linking farmers to the market is,therefore, very important. The successful experienceof cooperatives in the milk sector in managing thesupply chain and providing remunerative prices tothe producers may be emulated in the case ofagricultural products.
8.98 The level of secondary food processing in Indiais very low compared to many western countries.With increasing income and population, demand forprocessed food is likely to increase. It is necessaryto cater to this changing demand and at the sametime enhance the income of farmers. So far the focusin food management has been on cereals, mainlyrice and wheat. However, the demand for processedfood is expected to increase. Investment in foodprocessing, cold chains, handling, and packagingof processed food needs encouragement.
8.99 Declining per capita availability of foodgrainshas been a matter of major concern. For ensuringnutritional security, it is not only important to increasethe per capita availability of foodgrains but also toensure that right quantities of food items are there inthe food basket of a common man. A thrust onhorticulture products is required for enhancing percapita availability of food items as well as ensuringnutritional security.
8.100 Addressing infrastructure requirements inthe agriculture sector, especially storage,communication, roads, and markets should be apriority. Public Private Partnership models can be ofhelp in ensuring faster development of these
requirements which are of vital importance for thegrowth of agriculture sector.
8.101 A higher growth rate of the economy andrising levels of income are putting pressure onproducts from the livestock sector. Many items suchas meat, milk, and poultry are experiencing upwardpressure in their prices adding to the wholesale foodprice inflation. A long-term strategy to increase theproduction of these items is the need of the hour.These steps would also help enhance rural incomeand supplement the livelihood options of the ruralpopulace.
8.102 There has been substantial increase in theMSPs of various crops over the last few years. Thisis considered necessary for incentivizing farmersto increase production and productivity. At the sametime, the MSP signals the floor price for theproduce which, in turn, has the potential ofincreasing the prices. Addressing the welfare ofthe agricultural producers and of the consumerssimultaneously poses a challenge. Further, inabilityof a large number of small and marginal farmers todirectly access the agri-market puts a question markon increases in MSP actually benefiting suchfarmers. Record procurement of rice and wheat inthe last few years has helped build up the bufferstock and strategic reserve of wheat and rice. Thereis, however, a huge cost involved in the process,which is met through budgetary sources in the formof food subsidy. The procurement operations linkedwith MSPs cause fiscal stress by way of increasingfood subsidies. The issue of efficient food stocksmanagement and offloading of stocks in time needsurgent attention.
8.103 One of the most pressing of emergingchallenges is that of conservation. Enactment oflaws for ecological foundations for climate resilientagriculture, management of agricultural waste,building carbon sequestration of soil and overallnatural resource management is urgently needed.
8.104 To conclude, raising farm productivity withadequate focus on rainfed areas, diversification ofIndian agriculture from just crop farming to livestock,fisheries and poultry and horticulture whilesimultaneously addressing environmental concernsshould be the focus for the agriculture sector. Higherlevels of investments are required for not onlyincreasing farm productivity but also creatingadequate infrastructure for transport, storage anddistribution of agricultural produce.
Industry
Growth in the industrial sector was buoyant during the first two quarters (April-June, July-September) of the current financial year. The manufacturing sector, inparticular, showed a remarkable robustness, growing at rates of 12.6 percent and 9.9percent respectively, during these two quarters. Thereafter industrial output growthhas begun to moderate. This compares with global trends as global manufacturingcontinued to rebound post crisis till the first half of 2010 and has thereafter moderated.India’s post recovery industrial output growth has been largely driven by a few sectorssuch as the automotive sector along with a revival in cotton textiles, leather, foodproducts, and metal products. Some sectors have shown extreme month-on-monthoutput volatility. The impact of favourable monsoon on the domestic-demand-drivenindustrial sector has not been widespread. On the consumer non-durable segment inparticular it has not been discernible so far but is expected to be visible in the fourthquarter of this fiscal year. A higher base effect had adverse impact on the industrialgrowth rate in the Q3 (October-December 2010) and accordingly may moderate theindustrial sector’s contribution to the gross domestic product (GDP) in Q3 of thecurrent financial year.
9.2 Industry-sector GDP, which includes grossvalue added (GVA) of the construction sector apartfrom mining, manufacturing, and electricity, hasshown quarterly growth rates comparable to growthrates based on the index of industrial production(IIP). IIP data for Q2 and Q3 of the current financialyear indicate that moderation has set in across allthe broad sectors covered under it. Manufacturinggrowth rate declined to 5.1 per cent in Q3 of thecurrent financial year. This is a moderateperformance compared to the peak growth of 16.8per cent achieved during Q4 (January-March) ofthe last financial year. Within the manufacturingsector, the capital goods segment has been the maindriver of growth though it has shown extreme volatilityas it registered a growth of 3.5 percent in Q1 of2009-10 and surged up to 45.7 per cent during Q4of the last financial year and continued to be indouble digit till Q2 and moderated further to 3.8 percent during Q3 of the current financial year. (Table9.1).
9.3 The IIP-based cumulative industrial outputgrowth rate during April-December 2010 was 8.6 percent, at par with the growth rate in the correspondingmonths of the previous year (Figure 9.1). Component-wise cumulative growth figures, however, show widevariation. Growth rates in the mining and electricitysectors have been comparatively low. Likewise, onthe basis of use-based classification, intermediateand consumer non-durable goods have also hadcomparatively lower growth.
9.4 Due to poor performance of the basic goodsand consumer non-durables segments, whichconstitute about 59 per cent of the IIP, a sizeablechunk of the industrial sector has not contributedsignificantly towards overall IIP growth. The growthhas mainly been driven by the capital goods and theconsumer durables segments. Weighted contributionof capital goods and consumer durables during April-December 2010 was about 29 per cent and 21 percent as against their weights of 9.26 per cent and5.37 per cent respectively in the IIP. The basic goods
CHAPTER
9
Website: http://indiabudget.nic.in
218 Economic Survey 2010-11
Website: http://indiabudget.nic.in
segment, which has a weight of 35.57 per cent inthe IIP, contributed only 20 per cent during April-December 2010 (Table 9.2).
9.5 The manufacturing sector, which has a weightof 79.36 per cent in the IIP, is its key driver.Manufacturing output growth has dipped from a peakof 18 per cent in April 2010 to 1.0 per cent inDecember 2010, as a result of which IIP growthhas also come down from 16.6 per cent in April2010 to 1.6 per cent in December 2010. However,this slowdown is in a large part driven by the baseeffect. Despite wide fluctuations, the April–December2010 cumulative growth rate has remained at arobust 9.1 per cent for the manufacturing sectorand 8.6 per cent for the IIP. Month-wise annualgrowth rate for the remaining months of the financial
Table 9.1 : Growth in the IIP and its major components
(per cent)
Period Mining Manu- Electri- Basic Capital Inter- Consu- Generalfacturing city goods goods mediate mer
goods goods
Q1 2008-09 4.0 6.1 2.0 3.3 9.2 3.0 8.7 5.6
Q2 2008-09 3.8 5.6 3.2 4.9 15.2 -1.3 7.0 5.2
Q3 2008-09 2.0 1.3 2.9 2.5 5.7 -5.9 4.8 1.5
Q4 2008-09 0.9 0.8 3.0 0.4 4.0 -3.0 3.2 1.0
Q1 2009-10 6.8 3.6 5.8 6.3 3.5 7.0 -0.3 4.0
Q2 2009-10 9.0 8.7 7.4 5.9 6.7 11.6 9.7 8.6
Q3 2009-10 10.3 14.4 3.8 6.1 22.7 19.4 10.6 13.3
Q4 2009-10 12.9 16.8 7.1 10.3 45.7 17.0 5.2 15.8
Q1 2010-11 10.2 12.6 5.6 6.8 31.9 10.5 9.2 11.9
Q2 2010-11 7.0 9.9 2.1 4.7 18.4 10.8 7.0 9.1
Q3 2010-11 5.8 5.1 6.5 6.8 3.8 6.5 3.7 5.3
Source : Central Statistics Office (CSO).
0
5
10
15
20
25
Per
cent
April-Dec2009-10
Growth (per cent) in the IIP and its major componentsFigure 9.1
April-Dec2010-11
Min
ing
Man
ufac
turin
g
Elec
trici
ty
Basi
c go
ods
Capi
tal g
oods
Inte
rmed
iate
Dura
bles
Non-
dura
bles
Gene
ral
8.7 8.9
5.7 6.1
11.212.5
22.7
1.4
8.67.7
9.1
4.76.1
16.7
9.2
21.4
0.7
8.6
Table 9.2 : Sector-wise weighted contribution
Weight contributionWeight April- April-
Dec 2009 Dec 2010
Sector
Mining 10.47 7 6
Manufacturing 79.36 88 90
Electricity 10.17 5 4
General IIP 100.00 100 100
Use-based
Basic goods 35.57 20 20
Capital goods 9.26 19 29
Intermediate goods 26.51 37 28
Consumer goods (total) 28.67 24 23
Consumer Durables 5.37 20 21
Consumer Non-durables 23.3 4 2
General IIP 100..00 100 100
Source : Central Statistics Office (CSO).
219Industry
Website: http://indiabudget.nic.in
year is likely to remain moderate but annual growthrate is expected to remain at par with the last yearsgrowth rate. (Figure 9.2).
9.6 During April-December 2010, out of theseventeen industrial groups covered under themanufacturing sector, nine have had higher than10 per cent cumulative growth rates and three higherthan 5 per cent. Only five groups have had lessthan 5 per cent or negative cumulative growth rates.The poor performance of basic chemicals andchemical products, with an IIP weight of 14 per
cent, has contributed significantly to pulling downthe IIP (Table 9.3).
9.7 The IIP with 1993-94 as its base has becomedated. It has, therefore, not been able to capturethe structural shift in manufacturing, both in termsof the products to be included and the coverage ofproducing units. There has been a consistentdownward bias in the IIP and this widens as thebase becomes dated. A comparative study of IIPand Annual Survey of Industries (ASI) data clearlyestablishes that the downward bias of IIP has
Table 9.3 : Growth of Industry Product Groups (at two-digit level)Index of Industrial Production (base 1993-94=100)
April- Dec. April- Dec.Industry Group Weight 2008-09 2009-10 (2009-10) (2010-11)
Manufacturing 793.6 3.3 11 8.9 9.1
Industrial Groups with Growth Rates above 10 per cent during April-December 2010-11
Table 9.4 : Rate of Growth of ASI Manufacturing (1999-2000 prices) and IIP Manufacturing
2004-05 2005-06 2006-07 2007-08 2008-09
ASI Output 22.01 9.26 19.72 10.17 8.90
ASI Gross Value Added 17.36 12.79 19.69 14.83 2.80
IIP Manufacturing 9.2 8.9 12.9 9.2 3.3
Difference 8.2 3.3 6.8 5.6 -0.5
Source : Office of the Economic Adviser, Department of Industrial Policy and Promotion (DIPP).
considerably increased and this has implications forGDP growth and the share of manufacturing in thisgrowth. Assessment of the growth of registeredmanufacturing based on the ASI and IIP for the lastfive years clearly indicates persistence of thiscontinued bias (Table 9.4).
Volatility in the IIP at individual items level
9.8 Since the weight of an item (4-digit NIC)broadly indicates its relative importance in the IIP,it is generally expected that contribution of an itemin any given monthly IIP would be close to itsassigned weight in the basket. In other words, anyexcess contribution over and above the base year’sassigned weight in the IIP would affect overall IIPgrowth. The Office of the Economic Adviser, DIPP,has carried out an exercise to identify the highlyvolatile items with high standard deviation (SD)during the past five years.
9.9 The exercise has identified 26 highly volatileitems with a weight of 8.2 per cent in the IIP. Withinthese 26 volatile items there are five with a weightof 1.8 per cent showing very high SD, namelyampicillin(200), alarm time pieces (875),agarbatti(409), well/offshore platforms(13,475) andinsulated cables and wires (204). These items havecreated wide fluctuations in the IIP. There is needto shift to a new base and an IIP series based onan updated basket.
Structural shift in the organized manufactur-ing sector
9.10 There is a general perception that in the Indianorganized manufacturing sector, there has not beenmuch increase in the rate of growth of employment.Product market reforms which eliminated capacityregulations and rent seeking in Indian industry wereexpected to provide impetus for greater absorptionof labour in line with resource availability. ASI data,which are the most comprehensive data set on theorganized sector, did indicate that the number ofpersons engaged in the organized manufacturingsector, after continuous increase in the initial years,witnessed a deceleration from 1997-98 onwards. Thedecline continued until 2003-04. From 2004-05onwards, there has been continuous increase inemployment in the organized manufacturing sector.Further, even in 2008-09, the latest year for whichASI data are available, there appears to be asignificant increase in the number of personsemployed. This is contrary to the anecdotal evidenceand various surveys undertaken during this periodwhich indicated a decline in the employment in theorganized manufacturing sector. While there hasbeen an increase in the capital employed per unit oflabour during the period and the output per unit oflabour, a sharper increase has been observed in therate of growth of labour absorption itself(Figure 9.3).
0
5
10
15
20
25
30 11
5
Out
put/
labo
ur a
ndca
pita
l/la
bour
rat
ios
Output/Labour
(� Lakhs)
Structural shift in organised manufacturingFigure 9.3
1981
-82
1982
-83
1983
-84
1984
-85
1985
-86
1986
-87
1987
-88
1988
-89
1989
-90
1990
-91
1991
-92
1992
-93
1993
-94
1994
-95
1995
-96
1996
-97
1997
-98
1998
-99
1999
-20
2000
-01
2001
-02
2002
-03
2003
-04
2004
-05
2005
-06
2006
-07
2007
-08
2008
-09
Year
Capital/Labour
(� lakhs)
Personsengaged
Persons engagedin m
illions
10
9
8
7
6
35 12
221Industry
Website: http://indiabudget.nic.in
Corporate-sector performance
9.11 Based on analysis of abridged financial resultsof the listed manufacturing companies, it is observedthat revenue growth in the second half (October-March) of 2009-10 rebounded to pre-crisis levelamidst improving demand conditions and confidence.Consequently, consumption of raw material as wellas power and fuel expenses followed an upward trendduring the considered period. Accumulated stocks-in-trade during the first half of 2008-09 were depletedduring the later quarters indicating adjustments ofinventory levels to changes in business demandwhich had picked up, during the latter half of 2009-10 and first quarter of 2010-11, indicating revival ofthe demand. The non-core ‘other income’ whichcontributed significantly to net profits was seen tobe at lower levels during Q2 and Q3 (July-September,October-December) of 2009-10 and contracted furtherin Q1 of 2010-11. However, in Q2 it has risen to apeak of 69.5 per cent.
9.12 The growth in net profits followed a downwardtrend and was very low in Q3 and Q4 of 2008-09.However, during the subsequent quarters, aided bylow base and momentum in demand, corporate
profits have recovered. But first half results in 2010-11 reveal pressures on net profits on account ofhigher commodity prices and staff costs and higherinterest outgo. With faster increase in totalexpenditure in relation to sales, the profitabilitymargin has contracted in recent months(Table 9.5)
INDUSTRIAL GROWTH BY SECTORS
Textiles
9.13 The IIP covers four textile groups, namelycotton textiles; wool, silk & man-made fibre textiles;jute & other vegetable fibre textiles (except cotton);and textile products (including wearing apparel).Cotton textiles production grew by 10.1 per centduring April –November 2010-11 as compared to 3.6per cent during April-November 2009-10. Jute textilesproduction have also recovered and grew by 6.8 percent as compared to a decline of 16.7 per cent duringApril-November 2009-10. Textile products grew by5.7 per cent during April-November 2010-11 ascompared to 3.9 per cent during the correspondingmonths of the previous year. In the wool, silk, andman-made fibres segment of textiles growth has,
Table 9.5 : Year-on-Year Growth in Sales and Expenditure of listed public limited manufacturingcompanies in the private sector
Source : Reserve Bank of India Studies on Corporate Performance based on a abridged results of selectcompanies in the private corporate sector.
Note: a: Numerator is negative; b : Denominator is negative
222 Economic Survey 2010-11
Website: http://indiabudget.nic.in
however, dipped to mere 0.1 per cent during April-November 2010 as compared to 13 per cent duringApril-November 2009-10.
9.14 Overall, the production of textile fabricsincreased by 1.9 per cent during April-October 2010-11. This is a moderate performance when comparedwith the robust increase of 8.8 per cent during 2009-10. The decline in textile fabrics/cloth during thecurrent financial year has been on account ofcomparatively lower growth rates in the productionof mill, power loom and hosiery segments.(Table 9.6).
9.15 Post slowdown/recession in the developedeconomies, the textile sector has gatheredmomentum yet the export performance of Indiantextiles continues to lag substantially behind that ofChina’s as regards rate of growth as well as share inworld textile exports. During 2009, China had a 28.3per cent share in world textile exports as againstIndia’s share of only 4.3 per cent. In clothing exports,China had a share of 30.7 per cent as against India’sshare of 3.6 per cent. India’s textile exports grew by6.31 per cent during 2009-10 as against a decline of5.0 per cent during 2008-09. As per the latestavailable data for April-September 2010, exports oftextiles and clothing were of the order of US$ 11.27billion, thus recording a growth of 11.47 per cent vis-à-vis exports worth US$ 10.11 billion in April-September 2009.
CHEMICALS, PETROCHEMICALS ANDFERTILIZERS
Chemicals
9.16 Major chemicals undergo several stages ofprocessing to be converted into downstreamchemicals. These processed chemicals are usedin agriculture and industry as auxiliary materialssuch as adhesives, unprocessed plastics, dyes, andfertilizers. Chemicals are also directly used byconsumers in the form of pharmaceuticals,cosmetics, household products, paints, etc. Thetrend in production of chemicals in the current yearvis-à-vis the preceding three is given in Table 9.7.During April-November 2010-11 dyes and dyestuffsregistered impressive growth of 18.52 per cent.
Petrochemicals
9.17 Petrochemicals include synthetic fibres,polymers, elastomers, synthetic detergents, andperformance plastics, apart from their intermediatessuch as synthetic fibre intermediates, syntheticdetergent intermediates, olefins, and aromatics. Themain sources of feedstock and fuel forpetrochemicals are natural gas and naphtha.Petrochemical products cover the entire spectrumof daily use items ranging from clothing, housing,construction, furniture, automobiles, householditems, toys, agriculture, horticulture, irrigation, andpackaging to medical appliances.
Table 9.6 : Production of fabrics/cloth (million sq. m)
Total Cloth Production 53,389 56,025 54,966 59,809 35,141 35,805
-7.70% -4.90% -0.019 -8.80% -1.90%
Source : Office of the Textile Commissioner, Mumbai.Notes : P is Provisional.
223Industry
Website: http://indiabudget.nic.in
9.18 The production of major petrochemicals inprimary form and the growth rates from 2007-08onwards are exhibited in the Table 9.8. It is worthnoting that polymers account for the largest shareby far of petrochemical production and in 2009-10this share was 58 per cent. During April-November2010-11 major petrochemicals have increased by8.17 per cent.
Foreign Trade in Chemicals and Petro-chemicals
9.19 The share of chemicals and petrochemicalsin total national exports declined from 11.6 per centto 9.96 per cent during the period 2003-04 to 2009-10. Likewise, imports declined from 9.2 per cent to7.2 per cent.
Fertilizers
9.20 India is meeting 85 per cent of its urearequirement through indigenous production but islargely import dependent for meeting the phosphorusand potassium (P&K) fertilizer requirements eitheras finished fertilizers or raw materials. The entire
requirement of potash, about 90 per cent ofphosphatic, and about 20 per cent of urea is metthrough imports.
9.21 In addition to urea, 21 grades of P & Kfertilizers, namely di-ammonium phosphate (DAP),muriate of potash (MOP), mono-ammoniumphosphate (MAP), triple super phosphate (TSP),ammonium sulphate (AS), single super phosphate(SSP), and 15 grades of NPK complex fertilizersare provided to farmers at subsidized rates, whichare much below the actual cost. Farmers pay only25 to 40 per cent of the actual cost and the rest isborne by the Government in the form of a subsidythat is reimbursed to the manufacturers/importers.
9.22 The domestic production of urea in the year2009-10 was 211.12 lakh MT, as compared to 199.20lakh MT in 2008-09. The production of DAP increasedsharply in 2009-10 and was at 42.46 lakh MT ascompared to 29.93 lakh MT in 2008-09. Theestimated production of urea in 2010-11 is projectedat 215.37 lakh MT and that of DAP and complexesat 39.58 lakh MT and 91.66 lakh MT respectively(Table 9.9)
Table 9.7 : Production of major petrochemicals
(000’ MT)
Years Alkali Other Organic Pesticides Dyes & TotalChemicals Inorganic Chemicals (Tech.) Dyestuffs Major
Chemicals Chemicals
2007-08 5443 609 1552 83 44 7731
2008-09 5442 513 1254 85 32 7326
2009-10 5602 518 1280 82 42 7524
April-Nov 2009 3659 341 846 60 27 4933
April-Nov.2010 3876 365 867 56 32 5196
Growth rate 5.93 7.04 2.48 -6.67 18.52 5.33
Source : Department of Chemicals and Petrochemicals. Note: MT- Metric Tonne
Table 9.8 : Production of major petrochemicals
(000’ MT)
Years Synthetic fibers Polymers Elastomers Synthetic Performance Total majordetergent plastics petro-
intermediates chemicals
2007-08 2524 5304 105 585 157 8675
2008-09 2343 5060 96 552 141 8192
2009-10 2601 4791 106 618 172 8287
April-Nov 2009 1727 3152 70 406 117 5472
April-Nov. 2010 1824 3450 65 422 124 5915
Growth rate 7.35 9.45 -7.14 3.94 5.98 8.17
Source : Department of Chemicals and Petrochemicals. Note: MT- Metric Tonne
224 Economic Survey 2010-11
Website: http://indiabudget.nic.in
Steel
9.23 India ranked as the fourth largest producer ofcrude steel in the world during January–November2010, after China, Japan, and the USA as per theWorld Steel Association. This was a slip in rankfrom its number three position in 2009. The countryhas also been the largest sponge iron producer inthe world since 2002. Domestic crude steelproduction grew at a compounded annual growthrate of 8.4 per cent during 2005-06 to 2009-10(Table 9.10).The increase in production rode on theback of capacity expansion, mainly in private-sectorplants, as also higher utilization rates.
9.24 The Indian steel industry has diversified itsproduct mix to include sophisticated value-addedsteel used in the automotive sector, heavymachinery, and physical infrastructure. It, however,suffers from the high ash content of locally availablemetallurgical coal and a marked dependence onimported coal. The issues regarding raw materialsecurity (e.g. getting iron ore mining lease),
infrastructure (affecting logistics and transport), anduncertainties in land acquisition have emerged asbottlenecks to greenfield expansion. During April-November 2010-11, consumption, imports, andexports of finished steel recorded growth rates of9.8 per cent,11.1 per cent, and 13.8 per centrespectively.
Information technology and electronics
9.25 The revenue aggregate of the informationtechnology (IT)-business process outsourcing(BPO) industry has grown by 5.4 per cent to reachUS $ 73.1 billion in 2009-10 as compared to US $69.4 billion in 2008-09. IT services exports wereUS $ 27.3 billion in 2009-10 as compared to US $25.8 billion in 2008-09, showing a growth of 5.8 percent. Information Technology Enabled Services(ITeS)-BPO exports have increased from US $ 11.7billion in 2008-09 to US $ 12.4 billion in 2009-10,registering a year-on-year (Y-o-Y) growth of 6 percent. Revenue from the domestic market (IT servicesand ITeS-BPO) has grown to US $ 14 billion in the
Table 9.9 : Production and import of fertilizers
( lakh MT)
Production Imports
Year 2008-09 2009-10 2010-11* 2008-09 2009-10 2010-11*
Urea 199.2 211.12 215.37 56.67 52.09 45.83
DAP 29.93 42.46 39.58 61.91 58.89 68.12
Complex Fertilizers 68.48 80.38 91.66
MOP Nil Nil Nil 56.72 52.86 47.84
Source : Department of Chemicals and Petrochemicals
Note : * estimated; MT- Metric Tonne.
Table 9.10 : Production, consumption, import and export of total finished steel and pig iron
Production for Sale TFS 46.56 52.53 56.07 57.16 59.69 4.4
PI 4.69 4.93 5.284 6.21 5.73 -7.6
Import TFS 4.31 4.93 7.03 5.84 7.3 25
PI 0.03 0.03 0.11 0.08 0.11 38
Export TFS 4.8 5.24 5.08 4.44 3.24 -27
PI 0.44 0.71 0.56 0.35 0.28 -21
Real Consumption** TFS 41.43 46.78 52.12 52.35 56.48 7.9
PI 4.13 4.33 4.62 5.87 5.46 -6.9
Source : JPC, Ministry of Steel.Notes : TFS= total finished steel, both alloy and carbon; PI=pig iron;*provisional.; ** adjusted for stock variation and double counting.
225Industry
Website: http://indiabudget.nic.in
year 2009-10 as compared to US $ 12.8 billion in2008-09, a growth of about 9 per cent. Total ITsoftware and services employment has reached2.28 million in 2009-10 (excluding employment inthe hardware sector) as against 2.20 million in 2008-09.The IT-ITeS industry’s contribution to nationalGDP is estimated to increase from 6.0 per cent in2008-09 to 6.1 per cent in 2009-10. NASSCOMexpects IT-BPO exports to grow by at least 18 percent in 2010-11 to reach US $58.7 billion as againstUS $ 49.7 billion in 2009-10.
Electronics hardware manufacturing
9.26 The production of electronics is estimated togrow by 13 per cent to reach Rs.109,940 crore in2009-10 as compared to ` 97,260 crore in 2008-09. Electronics hardware exports are estimated tobe ` 31,250 crore in 2009-10 as compared to` 31,230 crore in 2008-09. The cumulative exportfigure in electronics during 2010-11 (April to July)is estimated at US $ 1.36 billion (` 6259 crore)whereas during the same period in the previousyear, exports of electronics amounted to US $ 1.92billion (` 9339 crore).
Micro, small, and medium enterprises(MSMEs)
9.27 The role of MSMEs in the economic and socialdevelopment of the country is widely acknowledged.They are nurseries for entrepreneurship, often driven
by individual creativity and innovation, and makesignificant contributions to the country’s GDP,manufacturing output, exports, and employmentgeneration. MSMEs contribute 8 per cent of thecountry’s GDP, 45 per cent of manufactured output,and 40 per cent of exports. The labour-capital ratioin MSMEs is much higher than in larger industries.Moreover, MSMEs are better dispersed. In view ofthese factors, MSMEs are important for achievingthe national objective of growth with equity andinclusion.
CENTRAL PUBLIC-SECTORENTERPRISES (CPSES)9.28 There were altogether 249 CPSEs under theadministrative control of various ministries/departments as on 31March 2010. Of these, 217were in operation and 32 under construction. Thecumulative investment (paid-up capital plus long-term loans) in all the CPSEs stood at ` 579,920crore as on 31 March 2010, an increase of 12.93per cent over 2008-09. The capital employed in allthe CPSEs went up by 14.73 per cent during thesame period. A great deal of investment in CPSEsis accounted for by internal resources rather thanthrough investment from outside.
9.29 The net profit of the profit-making CPSEs (158)stood at ̀ 108,434.68 crore in 2009-10. The net lossof the loss-making enterprises (59) on the other hand,
Table 9.11 : Performance of CPSEs during 2009-10
(` crore)
Sl. Particulars 2009-10 2008-09 % change overNo. previous year
2. Capital employed (net fixed assets + working capital ) 910,120 793,240 14.73
3. Total turnover 1,235,060 1,271,529 -2.87
4. Profit of Profit Making CPSEs 108,435 98,488 10.10
5. Loss of Loss Making CPSEs 15,842 14,621 8.35
6. Net worth 660,245 665,686 -0.82
7. Dividend declared 33,223 25,501 30.28
8. Corporate tax 119,529 131,583 -9.16
9. Interest paid 35,720 39,300 -9.11
10. Contribution to Central Exchequer 139,828 151,529 -7.72
11. Foreign Exchange Earnings 77,745 74,206 4.77
12. Foreign Exchange Outgo 420,415 433,332 -2.98
Source: Department of Public Enterprises.
226 Economic Survey 2010-11
Website: http://indiabudget.nic.in
stood at ̀ 15,842 crore during the same period. Theyear also witnessed severe financial under-recoveriesby public-sector oil marketing companies (OMCs)as they had to keep prices on sale of petroleumproducts low in the domestic market. The foreignexchange earnings of the CPSEs amounted to `77,745 crore during 2009-10 and were clearlyovertaken by the foreign exchange outgo of ̀ 420,415crore (Table 9.11).
Tourism Sector
9.30 Foreign Tourist Arrivals (FTAs) in the first eightmonths of 2010-11 have registered significant growthof 9.4 per cent after the negative growth in 2008-09and low growth in 2009-10. This compares favourably
with growth of about 6 per cent for the world. Foreignexchange earnings (FEEs) from tourism in 2010-11(April-November) increased by 16.8 per cent in rupeeterms, and by 22.7 per cent in US dollar terms, ascompared to the corresponding period of 2009-10(Table.9.12).
FINANCING AND INVESTMENT
Industrial Credit
9.31 On a year-on-year basis, credit growth toindustry sharply accelerated to 27.0 per cent inNovember 2010 from 14.2 per cent in November2009 (Table 9.13). The sectoral composition of thegross deployment of bank credit to industry,
Table 9.13 : Industry-wise deployment of gross bank credit
Sector % Growth (y-o-y) Share in outstandingcredit to industry(%)
Note: *provisional;** advance estimates.Source: Department of Tourism.
227Industry
Website: http://indiabudget.nic.in
including infrastructure, shows widely varyingpatterns. It is the infrastructure sector that kept creditgrowth to industry at the level of 27.0 per cent duringthe year ended November 2010. Net ofinfrastructure, year-on-year credit growth to industrywas 20.0 per cent in November 2010, compared to4.6 per cent during the corresponding period of theprevious year.
9.32 Industrial credit to micro and small enterprises(MSEs), including service-sector, grew at a higherrate of 21.5 per cent in November 2010 compared to19.3 per cent during the corresponding period of theprevious year. Further, industrial credit to MSEs inthe manufacturing sector grew at 16.9 per cent duringNovember 2010 as compared to 19 per cent duringNovember 2009.
Industrial Investment
9.33 The industry sector has been attracting asizeable chunk of domestic capital formationresulting in an addition to productive capacities. Asper the new series of National Accounts (2004-05),average annual growth of new investment in theindustrial sector (excluding construction) was 11.3per cent, as against average GDP growth of 8.6 percent during 2004-05 to 2009-10. The rate of growthof gross capital formation (GCF) for mining, registeredmanufacturing, and the electricity sector was evenhigher. There was a decline in the share of industryGCF in the total GCF in 2008-9, which could beconsidered an abnormal year because the globaleconomic meltdown had affected investor sentimentresulting in a dip in investment and deferment ofinvestment decisions. The internal accruals of thecorporate sector were also adversely affected. A
decline in stock market indices also affectedvaluation gains and the combined effect of thesefactors led to a decline in industry GCF. But during2009-10, industry GCF as a share of overall GCFhas increased to 43.8 per cent due to revival ofinvestment sentiments (Table 9.14).
9.34 While the GCF indicates actualization ofinvestment, investment intentions indicated in theIndustrial Entrepreneur Memorandums (IEMs) filedare lead indicators of likely investment flow to industryand of entrepreneurs’ perception. The investmentintentions also provide the sectoral preferences ofinvestors and shifts in these preferences over time.During 2001-09, overall investment indicated in theIEMs filed increased at an average annual rate of35.5 per cent. There was, as expected, a decline ininvestment intentions in 2009, but investmentintentions in 2010 (January-November) indicate revivalof business sentiment and an improvement inentrepreneurs’ perception. Metals, machinery,cement, chemicals, and the auto sector continue todominate as the preferred industries. This isconsistent with the growth of these industries(Table 9.15).
Foreign Direct Investment (FDI)
9.35 Domestic savings in India have not been largeenough to wholly meet investment requirements.Capital inflows from other countries, particularly ofan investment nature, have become important. Theratio of domestic savings to GDP has generally beenlower than that of GCF to GDP. During 2004-08,this gap was 1.3 per cent of GDP. Equity inflowsare more stable and bring in managerial skills andtechnological knowhow together with the investment.
Table 9.14 : Gross Capital Formation (GCF) in Industry
Total Industry GCF* 435,139 521,980 609,001 764,979 572,770 758,620 11.76
Rate of growth (%) 19.96 16.67 25.61 -25.13 32.45
Total GCF excluding valuables1,011,178 1,183,485 1,365,019 1,606,013 1,542,642 1,731,209 11.35
Share of industry in total GCF 43.0 44.1 44.6 47.6 37.1 43.8
Source: Office of the Economic Adviser, DIPP and CSONotes: CAGR- compound annual growth rate; * Industry GCF excludes construction
228 Economic Survey 2010-11
Website: http://indiabudget.nic.in
To encourage FDI inflows, FDI policy has continuedto be fine tuned and progressively liberalized,allowing FDI in more and more industries under theautomatic route. In the year 2000, Governmentallowed FDI up to 100 per cent on the automaticroute for most activities; a small negative list wasnotified where either the automatic route was notavailable or there were limits on FDI. Since then,the policy has been gradually simplified andrationalized and more sectors have been opened upfor foreign investment.
9.36 There has been tremendous growth in FDIinflows to India since 2003-04. Equity inflows haverisen nearly thirteen-fold, from US$ 2.23 billion in2003-04 to US$ 27.31 in 2008-09 and US$ 25.89billion in 2009-10. Total FDI inflow into India sincethe onset of the liberalization process (August 1991-May 2010) is nearly US$ 136.86 billion. Thisrepresents only the equity capital component. Underinternational practices of reporting, i.e. includingequity capital, reinvested earnings, and intra-company loans, the figure comes to US $168.94billion as against US$ 6.13 billion in 2001-02, US $35.18 billion in 2008-09, and US $ 37.19 billion in2009-10. While the FDI inflows have somewhatflattened out over the course of the last three years,the pace of inflows has been stable, including during2009-10. This is despite the fact that the UnitedNations Conference on Trade and Development
(UNCTAD) World Investment Report (WIR), 2009,had noted a fall in global FDI inflows from a historichigh of US$1.979 trillion in 2007 to US$1.697 trillionin 2008, a decline of 14 per cent. UNCTAD hadsubsequently predicted a fall in global FDI investmentflows by 30 per cent, from US $ 1.7 trillion in 2008 toUS$ 1.2 trillion in 2009. The Organization forEconomic Cooperation and Development (OECD),in its report on investment, released in March 2010,had also noted significant stagnation in globalinvestment activity due to the global economic crisis.
Total 353,956 588,550 827,500 1,522,566 1,039,848 1,617,397
Source: Office of the Economic Advisor, DIPP.
Table 9.16 : Growth in FDI inflows
(US$ billion)
Financial As per Per- FDI Per-Year International centage Equity centage
Practices* Growth Inflows# Growth
2003-04 4.32 (-) 14% 2.23 (-) 18%
2004-05 6.05 (+) 40% 3.78 (+) 69%
2005-06 8.96 (+) 48% 5.97 (+) 58%
2006-07 22.83 (+) 155% 16.48 (+) 176%
2007-08 (P) 34.84 (+) 53% 26.86 (+) 63%
2008-09 (P) 35.18 (+)1% 27.99 (+)4%
2009-10 (P) 37.18 (+)6% 27.15 (+)3
2010-11 (April-Oct 2010) 14.9 - 12.62 -
Source : Office of the Economic Adviser, DIPP.Note: * As per Reserve Bank of India (RBI) estimates.# As per DIPP estimates.
229Industry
Website: http://indiabudget.nic.in
9.37 FDI equity inflows, as a percentage of theGDP, grew from 0.37 per cent in 2003-04 to nearly2.21 per cent in 2008-09. As a percentage of theGCF, they grew from 1.35 per cent to nearly 6.32per cent during the same period. The 2009 survey ofthe Japan Bank for International Cooperation (JBIC),conducted among Japanese investors, continued torank India as the second most promising country foroverseas business operations, after China. The WIR,2010, in its analysis of global trends and sustainedgrowth of FDI inflows, has ranked India as the secondmost attractive location for FDI for 2010-12. Accordingto it, the top five most attractive locations for FDI for2009-11 are China, India, Brazil, the United States,and the Russian Federation. The WIR, 2009, hadlisted India as the third most attractive destination.For India to maintain its momentum of GDP growth,it is vital to ensure that the robustness of its FDIinflows is also maintained.
9.38 In FDI equity investments, Mauritius tops thelist of first ten investing countries followed by theUS, the UK, Singapore, Netherlands, Japan,Germany, France, Cyprus, and Switzerland. Among
the sectors attracting highest FDI are services,telecommunications, computer software andhardware, housing and real estate, and construction.Sectors like agricultural services, sea transport, andelectrical equipment have shown a quantum jump inFDI inflows during 2009-10. Sector–wise FDI inflowsinto some of the key industrial and infrastructuresectors are given in Table 9.17.
POLICY DEVELOPMENTS ANDPROGRAMMES
Textiles
9.39 The two flagship schemes of the Ministry ofTextiles, namely the Technology Upgradation FundScheme (TUFS) and Scheme for Integrated TextileParks (SITP), have been approved for continuationin the Eleventh Five Year Plan. TUFS, which wascommissioned on 1 April 1999 with a view tofacilitating the modernization and upgradation of thetextile industry by providing credit at reduced ratesto entrepreneurs both in the organized and theunorganized sectors, has been fine tuned to induce
Table 9.17 : Sector-wise FDI Inflows into industry and infrastructure
Total 14,926.0 16,047.6 10,748.5 13,080.8 11,493.0 7831.2
Source: DIPP.Note : Total excludes inflows to services sector and other NRI schemes;
*=includes Non-conventional energy sector
230 Economic Survey 2010-11
Website: http://indiabudget.nic.in
rapid investments in the targeted segments of thetextile industry. Under the scheme, an amount of` 85,091 crore was sanctioned against project costof ` 207,747 crore and loans worth ` 85,091 crorewere disbursed to 28,302 applicants up to 30 June2010(P). Under the SITP, 40 integrated textiles parksof international standards, covering the weaving,knitting, processing, and garmenting sectors withproject proposals worth ` 4133.09 crore (of whichassistance from the Government is ̀ 1419.69 crore)have been sanctioned. So far, eight textile parkshave been inaugurated.
9.40 The Ministry of Textiles formulated a draftNational Fibre Policy incorporating inputs from allthe major stakeholders. The Policy has beendesigned with a decadal perspective (2010-20) andseeks to place India firmly on the world fibre map bystrengthening the existing policy framework andproviding institutional and technological support forrapid fibre growth in the country in the coming decade.
9.41 A new scheme, namely the ‘Integrated SkillDevelopment Scheme’ for the textiles and apparelsector including jute & handicrafts, was launchedon 5 August 2010 with the objective of capacitybuilding of institutions providing skill developmentand training for workers in the textiles sector. TheScheme envisages an investment of ̀ 272 crore, ofwhich the Government contribution would be ̀ 229crore during 2010-11 and 2011-12 with a target of2.56 lakh persons to be trained.
9.42 The Government of India has decided toinclude sericulture activities up to the stage of cocoonproduction along with extension system for cocoonproduction in agri-enterprises up to the stage of yarnproduction and marketing to be eligible for fundingunder the Rashtriya Krishi Vikas Yojana (RKVY).The benefits of the RKVY can now be availed of forimprovement of the sericulture extension system,enhancement of soil health, development of rain-fedsericulture, and integrated pest management.
Electronics and IT
9.43 Several Governments across the world,including in India, have devised e-Governancestrategies and are employing technology applicationsin the delivery of public services. The National e-Governance Plan(NeGP) has been approved by theCabinet in May 2006 with a vision to providing accessto critical public services and promoting ruralentrepreneurship. The NeGP consists of 27 MissionMode Projects (MMPs) (9 Central, 11 State, and 7Integrated) and 8 Support Components. Over
` 40,000 crore has been planned to be invested bythe government to e-enable delivery of over 1100services across the country in public privatepartnership (PPP) mode; to make available aconverged backbone network for data, voice, andvideo communications throughout States/UTs, andto provide common secure IT infrastructure to hostState-level e-Governance applications/data in orderto enable seamless G2C, G2B, and G2C services.Significant progress has been made in creatingthese core e-infrastructures comprising State WideArea Networks (SWAN), State Data Centres (SDC),State Service Delivery Gateways (SSDG), and one-stop shop front-end service access points—theCommon Services Centres (CSCs).
9.44 The Government had decided to establish aNational Knowledge Network (NKN) with scalablemultiples of 10 Gbps capacity high speed datacommunication network. It will connect about 1500nodes covering Institutions of higher learning,research, and governance. A core backboneconsisting of 17 Points of Presence (PoPs) havebeen established. The total number of operationalNKN core links is 37. Around 88 institutions of higherlearning and advanced research have already beenconnected to the network and 15 virtual classroomsset up.
9.45 To maintain an edge there is need to beattentive and continuously work towards generatingquality manpower. The Government announced theNational Skill Development Policy in 2010 which hasset a target of equipping 500 million with skills by2022. The policy also aims at taking the advantageof the demographic dividend, i.e. increasingpopulation of the working age group of 15 to 59years in India. The Department of InformationTechnology (DIT) has been listed under the skilldevelopment initiative and given the target of training10 million persons by the year 2022.
9.46 Recognizing the importance ofnanotechnology, the DIT initiated a NanotechnologyDevelopment Programme in 2004 with the objectiveof creating infrastructure for research innanoelectronics and nanometrology at national leveland also funding small and medium-level researchprojects in specific areas such as nanomaterials,nanodevices, carbon nano tubes (CNT), andnanosystems. A nanometrology laboratory is beingset up at the National Physical Laboratory, Delhi.The facilities created at the Indian Institute ofScience, Bangalore (IISc), and Indian Institute ofTechnology, Powai (IITP), are made available to
231Industry
Website: http://indiabudget.nic.in
researchers in the country through the IndianNanoelectronics Users Programme (INUP) throughwhich more than 40 organizations are alreadyaccessing these facilities from all over the countryfor R&D activities.
9.47 In order to promote indigenous productionof medical electronic equipment in the country, theDIT has been supporting technology developmentactivities for the development of diagnostic,therapeutic, and related medical electronic devices.Under the Jai Vigyan Mission (JVM), six JMVintegrated medical linear accelerators (linac) forcancer treatment have been developed and deployedat the Mahatma Gandhi Institute of Medical Sciences(MGIMS), Wardha, and Regional Cancer Centre(RCC), Adyar, and are being used for treatment ofcancer patients and four more machines are underdevelopment for deployment in other hospitals inthe country. Telemedicine centres have been setup in the rural and remote areas of Tripura, Punjab,Himachal Pradesh, West Bengal, Kerala, and TamilNadu and tele-consultations been provided throughthese centres to patients in remote areas.
9.48 For alignment of IT process with businessprocesses and for IT to deliver the correct andappropriate business solutions, there is a need forquality assurance in the field of electronics and ITin the country. This is being carried out by theDirectorate of Standardization, Testing and QualityCertification (STQC) of the DIT. It provides testing,calibration, training, and certification servicesthrough its well-developed network of test laboratoriesspread across the country including the north-eastregion. These services have been primarily utilizedby small and medium-scale industries and so farmore than 10,000 organizations have availed ofthem.
9.49 For deriving economic benefits from an IT-led society, a holistic approach was made towardse-commerce and information security with thepassage of the Information Technology Act 2000and its amendment in 2008. The Indian ComputerEmergency Response Team (CERT-In) has beendesignated as nodal agency for coordinating allmatters related to cyber security and emergencyresponse.
MSMES
9.50 The report of the Task Force on Micro, Smalland Medium Enterprises, presented to the Hon’blePM on 30th January, 2010, provides a roadmap for
the development and promotion of MSMEs. Thedetailed recommendations cover six major thematicareas, namely credit, marketing, labour,rehabilitation and exit policy, infrastructure,technology and skill development, and taxation asalso special measures for the north-eastern regionand Jammu and Kashmir. The implementation ofthese recommendations is being monitoredperiodically by the Steering Group constituted underthe chairmanship of Principal Secretary to the PrimeMinister. Further, a Council on Micro, Small andMedium Enterprises under the chairmanship of thePrime Minister has been set up to lay down broadpolicy guidelines and review the development of theMSME sector.
9.51 The National Manufacturing CompetitivenessProgramme (NMCP) is the nodal programme of theGovernment of India for developing globalcompetitiveness among Indian MSMEs throughimprovement in their processes, designs, andtechnology and market access. With the balancethree schemes operationalized this year, all its tencomponents are now under implementation. Theseten components include Building Awareness onIntellectual Property Rights for MSMEs, Scheme forproviding Support for Entrepreneurial andManagerial Development of SMEs throughIncubators, Enabling the Manufacturing Sector tobe Competitive through Quality ManagementStandards and Quality Technology Tools (QMS/QTT), Mini Tool Rooms under PPP mode, MarketingAssistance Support to MSEs (Bar Code), LeanManufacturing Competitiveness Programme forMSMEs, Promotion of Information & CommunicationTools (ICT) in the Indian MSME Sector; DesignClinics Scheme for MSMEs, Marketing Assistanceand Technology Upgradation Scheme for MSMEs,and Technology Quality Upgradation Support toMSMEs.
9.52 In line with the overall target set by the PrimeMinister’s National Council on Skill Development,the Ministry of MSME has taken up skill developmentas a high priority area. The agencies under theMinistry will conduct skill development programmesfor about 4.16 lakh trainees during 2010-11. Further,the Ministry aims to train 4.78 lakh trainees in theyear 2011-12 through its various programmes forthe development of self-employment opportunitiesas well as wage employment opportunities in thecountry.
9.53 The Government has adopted the clusterapproach as a key strategy for enhancing the
232 Economic Survey 2010-11
Website: http://indiabudget.nic.in
productivity and competitiveness as well as capacitybuilding of MSEs and their collectives in the country.The guidelines of the MSE Cluster DevelopmentProgramme have been comprehensively modifiedto provide higher support to the MSEs. During 2010-11,12 new clusters were taken up for diagnosticstudy, 11 new clusters for soft interventions, and 6clusters approved for setting up of common facilitycentres (CFCs). With this, a total of 471 clustersspread over 28 States and seven UTs have so farbeen taken up for diagnostic study, softinterventions, and setting up of CFCs and effortsare under way to cover more and more clustersfrom all the States/UTs.
9.54 Under the Credit Guarantee Fund Schemefor Micro and Small Enterprises, over 1.5 lakh MSEproposals for an amount of ̀ 7568 crore have beenapproved for extending loans without collateral/third-party guarantee during the year (up to November2010)—thereby registering a growth of over 150per cent in terms of number of proposals and over200 per cent in terms of credit amount over thecorresponding period of last year. Cumulatively,about 4.50 lakh MSE proposals for loans of ̀ 18,946crore have been approved under the scheme up toNovember 2010.
9.55 Under the Credit Linked Capital SubsidyScheme,15 per cent capital subsidy is providedupfront on loans subject to a maximum of ̀ 15 lakh,for technology upgradation through adoption of well-established and improved technologies approvedunder the Scheme. The ambit of the Scheme wasrecently enlarged to include 201 new technologies,including 179 in the pharmaceutical sector. Duringthe year (upto November 2010) 1963 MSEs havebeen assisted and subsidy amounting to ` 117.3crore has been sanctioned.
9.56 Under the Prime Minister’s EmploymentGeneration Programme (PMEGP) launched inAugust 2008, over 2.65 lakh applications have beenreceived up to November 2010, of which 1.13 lakhhave been selected by the District Level Task Forceconcerned for assistance.Financial assistance for30,881 projects has been sanctioned by banks andloans were disbursed in 23,059 cases which will giveemployment to about 2.31 lakh persons. It isexpected that 6 lakh additional employmentopportunities will be generated in 2010-11.
9.57 A flexible growth stimulating and artisan-centric scheme named Market DevelopmentAssistance (MDA) to promote production and sales
of khadi and polyvastra has been introduced from2010-11. The scheme provides for assistance up to20 per cent of the value of production to be sharedamong artisans, producing institutions, and sellinginstitutions in the ratio 25:30:45.
9.58 The Government has tied up financial aidfrom the Asian Development Bank (ADB) amountingto US$150 million over a period of three years forimplementing a comprehensive Khadi ReformProgramme worked out in consultation with the ADBand Khadi and Village Industries Commission(KVIC). Under this reform package, it is proposedto revitalize the khadi sector with enhancedsustainability of khadi, increased incomes andemployment for artisans, and artisans’ welfare andto enable the KVIC to stand on its own with graduallydecreasing dependence on Government grants.Initially, the programme will be initiated in 300 khadiinstitutions keeping the needs of regional balance,geographical spread, and inclusion of backwardareas in view. The first tranche fund of ` 96 crorehas already been released to the KVIC forimplementation of the programme.
CPSES
9.59 With a view to delegating enhanced financialand operational powers to the CPSEs, theGovernment had introduced the Navratna andMiniratna schemes. During 2010-11, theGovernment has introduced the Maharatna schemeto empower mega Navratna CPSEs to expand theiroperations both in domestic as well as foreignmarkets. During the year, four CPSEs, namelyIndian Oil Corporation Ltd., National Thermal PowerCorporation Ltd., Oil and Natural Gas CorporationLtd., and Steel Authority of India Ltd., were grantedMaharatna status. Two more CPSEs, i.e. Oil Indiaand Rashtriya Ispat Nigam Ltd., were grantedNavratna status in 2010-11 and there are now 16Navratna CPSEs as a result. Three more CPSEs,namely the Bridge & Roof Company Ltd., BharatPumps & Compressors Ltd. and National SeedsCorporation Ltd., were granted Miniratna statusduring the year and presently there are 62 MiniratnaCPSEs.
9.60 Besides endeavouring to professionalize theBoards of Directors of these enterprises, theGovernment has issued guidelines on corporategovernance of CPSEs. The Government,furthermore, established the Board for Reconstructionof Public Sector Enterprises (BRPSE) in December
233Industry
Website: http://indiabudget.nic.in
2004 to advise the Government, inter alia, on revival/ restructuring of sick and loss-making CPSEs. TheBRPSE has made recommendations in respect of62 cases until 31 December 2010. The Government,in turn, has approved the proposals for revival of 40CPSEs and closure of two. The total assistanceapproved by the Government in this regard up to 31December 2010 has been ̀ 23,612 crore, of which` 3,290 crore comprises cash assistance and `20,322 crore non-cash assistance. Out of 20 revivedCPSEs (which posted profit in 2008-09), 11 havebeen posting profit consistently for three years.
Tourism
9.61 The Ministry of Tourism is making concertedefforts for development of nationally andinternationally important destinations and circuitsthrough Mega Tourism Projects. These projects area judicious mix of cultural, heritage, spiritual, andeco tourism in order to give tourists a holisticexperience. The Ministry is also combining with otherCentral Government ministries such as Railways,Civil Aviation, Road Transport & Highways, FoodProcessing and Urban Development as well as theconcerned State Governments to achieveconvergence and synergy with their programmesso that the impact of investment in these destinationsis maximized.
9.62 The Visa-on-Arrival (VoA) scheme wasstarted in the country from January 2010 on pilotbasis for nationals of five countries, namely Finland,Japan, Luxembourg, New Zealand, and Singapore.A total of 5644 VoAs were issued during January-November 2010. The scheme is being extended tonationals of five more countries, namely Cambodia,Laos, Phillipines, Myanmar, and Vietnam fromJanuary 2011.
9.63 The Reserve Bank of India has delinked creditfor hotel projects from real estate, thereby enablinghotel projects to avail of credit at relaxed norms andreduced interest rates.
9.64 The Ministry of Tourism has adopted the Codeof Conduct for ’Safe & Honourable Tourism’ in July2010 essentially to strengthen the critical pillar of‘Suraksha’ (Safety) and ensure that Indian tourismfollows international standards of safe tourismpractices, applicable to both tourists and localresidents, i.e. local people and communities whomay be impacted by tourism in some way. The Codehas been formed to sensitize travellers and the travelindustry, close all possibilities of exploitation,
specifically of women and children, and make Indiaa safe tourism destination. As a follow-up of theefforts of the Ministry of Tourism to developSustainable Tourism Criteria, a Pledge forCommitment towards Safe, Honourable, andSustainable Tourism was taken by the stakeholdersof the travel trade and hospitality industry on WorldTourism Day, 27 September 2010.
9.65 The Ministry of Tourism continued promotionalefforts under the ‘Incredible India’ campaign inoverseas and domestic markets. Emphasis was alsolaid on social awareness campaigns in the domesticmarket to sensitize the masses and variousstakeholders to the importance of tourism.
Fertilizers
9.66 The Government is examining the feasibilityof revival of Hindustan Fertilizer Corporation Ltd.(HFCL) and Fertilizer Corporation of India Ltd.(FCIL), subject to confirmed availability of gas. AnEmpowered Committee of Secretaries, constitutedto look into the various financial models for revivalof the closed units, has submitted itsrecommendations. Various modules of revivals areunder consideration. Proposals are underconsideration for revamp of Madras FertilizersLimited (MFL).
9.67 The concession scheme for decontrolledP & K fertilizers which was allowed to continue bythe Government from 1992 to 31 March 2010 waschanged to a Nutrient Based Subsidy scheme (NBS)with effect from 1 April 2010, whereby for P & Kfertilizers, the Government has announced subsidyper kg of nutrients N, P, K, and S as well as per MTof fertilizers under the NBS during 2010-11 and 2011-12. The Government has also provided additionalsubsidy on fertilizers fortified with secondary andmicro- nutrients, namely boron and zinc. Anadditional subsidy of ` 300 and ` 500 per tonnerespectively has been sanctioned for boron- and zinc-fortified fertilizers. With the objective of providing avariety of subsidized fertilizers to farmers dependingupon soil and crop requirements, the Governmenthas included three new grades of complex fertilizersunder the NBS, namely NP 24-24-0-0, NPK 16-16-16-0, and NPKS 15-15-15-09, in 2010-11.
9.68 Under the NBS, freight subsidy ondecontrolled P & K fertilizers (except SSP) for railmovement is being paid as per the actual claim.The secondary freight is also paid. Freight for directroad movement from plant or port is subject to lower
234 Economic Survey 2010-11
Website: http://indiabudget.nic.in
of the actual claim or the equivalent rail freight up toa maximum distance of 700 km with effect from 1st
January 2011. Manufacturers have been allowed tofix the maximum retail price (MRP) of boronatedSSP higher than that of powered or granulated SSP.To ensure easy availability of fertilizers in all partsof the country, a uniform freight subsidy policy hasbeen announced under which rail freight is paid onactual basis and road freight on a normative averagedistrict lead for urea.
9.69 The Government has placed 20 per cent ofproduced/imported decontrolled P & K fertilizersunder the control of Department of Fertilizers underthe Essential Commodities Act 1955 with theobjective of making fertilizers available in the difficultareas. In order to improve availability of fertilizersin the country, import of all the subsidized fertilizershas been permitted.
9.70 The manufacturers of customized and mixturefertilizer are allowed by the Government to sourcethe subsidized fertilizers from the manufacturers/importers after their receipt in the districts. With aview to ensuring adequate availability in the countryand the subsidy paid, the Government has put theexport of DAP and MOP in the restricted categoryto discourage exports and illegal diversion. Stepsare being taken to put all P & K fertilizers under therestricted category. Possibilities for setting up ofjoint venture ammonia/urea projects in countriesabroad where adequate gas is available are beingexplored. Indian entities are in dialogue for jointventures in the field of phosphatic and potassicfertilizers in resource-rich countries.
Steel Sector
9.71 The World Steel Association forecast for steelconsumption in India is optimistic, indicating thatIndia’s steel demand is likely to grow by 8.2 percent in 2010 and 13.6 per cent in 2011. For 2010-11, with Indian GDP likely to register steady growthand provided that the current performance trendsof its major end-use segments (manufacturing,construction, consumer durables includingautomobiles, capital goods )are sustained,consumption of finished steel is likely to end theyear with 9 per cent growth.
9.72 Responding to the improving economicoutlook, the Government rolled back the earlier-effected reduction in excise duty, leading to a hikein the duty rate from 8 per cent to 10 per cent. Importof hot rolled coils was also moved from the restricted
to the free list. However, most of the other policymeasures adopted to safeguard the economy duringthe recessionary period like removal of export dutyon steel remain in place. At the same time, thegovernment has set up an Inter-Ministerial Group tofacilitate interaction between investors and variousagencies in matters of acquisition of land, miningrights, power, and transportation including rail, road,and port sectors.
SOME CRITICAL DIMEMSIONS OFINDUSTRIAL DEVELOPMENT
Recent trends in industrial pollution
9.73 Industrial effluents comprising organicpollutants, chemicals and heavy metals and run-offfrom land based activities such as mining are amajor source of water pollution. The major water-polluting industries include fertilizers, refineries, pulpand paper, leather, metal plating, and other chemicalindustries. Continued monitoring by the CentralPollution Control Board (CPCB) and State PollutionControl Boards of water quality of aquatic resourceshas revealed that organic pollution continues to bepredominant pollutant of aquatic resources. Basedon the primary water quality criteria evolved in termsof bio-chemical oxygen demand (BOD), 150stretches on 105 rivers have been identified aspolluted.
9.74 Rapid industrialization and urbanization havealso resulted in increase in pollution load on rivers.According to CPCB estimates, against an estimatedsewage generation of about 38,254 million litres perday (mld) from Class I cities and Class II towns ofthe country, the available treatment capacity is for11,787 mld, indicating a wide gap between sewagegenerated and treatment capacity created. Dischargeof untreated waste water constitutes a major sourceof pollution load for the rivers.
9.75 Existing pollution abatement infrastructure inthe country provides adequate treatment facilitiesto various streams of pollution generated byindustries. Fly-ash, phospho-gypsum, and iron andsteel slags are the main forms of Industrial solidwastes generated in India. It is estimated that around112.29 million tonnes of fly-ash is generated annuallyby thermal power plants, of which only 53.92 milliontonnes is utilized by different sectors like cement,road embankments, fly ash bricks and products,and back filling of mines. Besides, there are 36,145hazardous-waste- generating industries in the
235Industry
Website: http://indiabudget.nic.in
country producing 6.2 MT hazardous waste everyyear, brought about by expansion of chemical-basedindustries. It is further estimated that 1.47 lakh MTof e-waste was generated in the country in 2005,which is expected to increase to about 8.0 lakh MTby 2012. Presently there exist 23 e-waste recyclingunits with 90,000 MTA capacity.
Current programmes and policy9.76 The Government has notified emission andeffluent standards for relevant pollutants for 74categories of processes and industries, including17 categories of highly polluting industries under theEnvironment (Protection) Act 1986. The concernedState Pollution Control Boards / Authorities alongwith the CPCB monitor the discharges from theseunits. A total number of 2504 units have beenidentified under these 17 categories, out of which1810 have set up pollution control facilities to complywith standards, 265 are defaulting, and 429 havebeen closed.
9.77 There exists a charter on CorporateResponsibility for Environmental Protection (CREP)covering 17 categories of highly polluting industries.Industrial-sector-specific action points for eachcategory were identified and listed for implementationafter consulting various stakeholders.
9.78 Other measures taken by the Governmenttowards effective control of industrial pollution includeinspection and enforcement of emission and effluentstandards through issue of directions and consentmechanism, mandatory prior environmentalclearance for designated development projects,financial assistance for establishment of CETPs forsmall-scale industrial units located in industrialclusters, identification of critically polluted areas, andpreparation of action plans for abatement of pollution.
9.79 Prior environmental clearance of developmentprojects based on environmental impact assessmentis mandatory for designated sectors/projects.Various steps, including involvement of stakeholdersthrough public hearings, have been taken to bringgreater transparency and professionalism in thegranting of environmental clearances. Status ofprojects appraised in 2010 is displayed inTable 9.18.
Labour relations9.80 Due to constant endeavour of the industrialrelations machineries of both the Centre and States,the industrial relations climate has generallyremained peaceful and cordial. The number ofincidences of strikes and lockouts has exhibited adeclining trend over the past few years. Strikes andlockouts have declined from 349 in 2009 (P) to 99 in2010(P). Correspondingly, the total number of man-days lost has also declined from 9,169,037 in 2009to 1,699,826 in 2010(P) (Table 9.19).
9.81 As regards spatial/industry-wise dispersionsof incidences of strikes, lockouts, there exist
Table 9.18 : Projects appraised during April-November 2010
Nature of Project Cleared Pending Rejected/ Returned/withdrawn EC
Source: Ministry of Environment and Forests.Notes: EC – Environmental clearance; TOR - Terms of Reference
Table 9.19 : Strikes and Lockouts(man-days lost )
Year Strikes Lockouts Total Man-days lost
2005 227 229 2,96,64,999
2006 243 187 2,03,24,378
2007 210 179 2,71,66,752
2008(P) 240 181 1,74,32,965
2009(P) 157 192 91,69,037
2010(P) 79 20 16,99,826
Source : Labour Bureau, Ministry of Labour
236 Economic Survey 2010-11
Website: http://indiabudget.nic.in
widespread variations among different States/UTs.The maximum incidences were recorded in the Stateof Gujarat. Wage and allowance, bonus, personnel,indiscipline and violence, and financial stringencywere the major reasons for these strikes andlockouts.
CHALLENGES AND OUTLOOK
9.82 Looking at IIP data for the past few months,in the short-term the industrial sector is likely togrow at moderate but sustainable rates. Continuedbuoyancy in corporate sales, comparatively highercredit flow to industry, larger number of investmentintentions across all major industries and States,accelerated growth in some sectors, and robustmerchandise exports so far are likely to sustainindustrial activities in the remaining months of thefinancial year. Over the medium to long term, tosustain double-digit output growth and reduce thevulnerabilities of the sector, there is need to put inplace a policy framework for embarking on anotherround of multifaceted reforms.
9.83 The latest available data on bank credit andthe financial resources from non-bank sourcesflowing to the industrial sector indicate increasedinvestment activities in the sector. Gross bankingcredit to the industrial sector net of infrastructurehas increased by 20.0 per cent in November 2010,compared to 4.6 per cent during the correspondingperiod of the previous year. At the same timeincreasing cost of financing and slowdown in theflow of FDI equity inflows during the current financialyear are causes of concern. Long-term foreigninvestment supplements the domestic investablefunds and eases the liquidity crunch that constrictsthe sector from time to time. Industrial credit toMSEs in the manufacturing sector grew at 16.9 percent in November 2010, marginally lower comparedto last year. For medium to long-term sustainablerobust growth, availability and ease of credit flowto the industrial sector in general and MSE sectorin particular is critical. The MSE sector seems tobe relatively less favourably placed in terms of creditavailability and credit cost of working capital ascompared to the medium and large scale industrialand services sectors. This persistent bias needs tobe corrected.
9.84 The manufacturing sector, despite being thedriver of industry, has not grown significantly overtime in terms of its share in the GDP. The share ofIndian manufacturing in world manufacturing is also
less than 1.4 per cent. The growth of manufacturingis crucial for employment generation, augmentationof domestic supply, resource utilization and valueaddition, and for sustainable growth of exports.Neglect of research and development (R&D) in newtechnology and skill development continues toshackle growth in the manufacturing sector. Hightechnology base and skilled manpower are crucialfor enhancing manufacturing competitiveness in theglobalized economy. For many of the economicallysuccessful emerging economies, promotion ofmanufacturing has been a key objective. Some ofthese countries like South Korea have becometechnological giants solely on the basis ofindigenous learning, skill, and R&D effort. China hasbeen the most successful in building the world’slargest manufacturing base by giving specialattention to technology development and by gearingFDI policy to promote technology transfer. All ofthese countries have also laid emphasis on makingtheir SME sector highly competitive and the driverof technology. There is a strong case for enhancingpublic investment and building PPP in the R&D inskill and technology development.
9.85 Manufacturing inflation so far has been benigncompared to overall inflation. Point to pointmanufactured products inflation rate for the monthof December 2010 was 4.46 per cent as comparedto 3.61 per cent a year ago. But the domestic pricesof minerals, mineral oil, electricity, and other inputs(except coal) are on the rise partly due to thehardening of international commodity prices.Persistent high inflation is also leading to rise inaverage wages and this may impact labour-intensiveindustries such as textiles and leather etc. In theshort to medium term, rising input costs mayundermine the competitiveness of some sectors andalso dampen domestic and foreign demand.
9.86 Overall production of the six core industries,namely crude oil, petroleum refinery products, coal,electricity, cement, and finished steel, hasmarginally gone up so far during this financial yearbut there is a huge gap in terms of the requiredcapacity addition needed to catch up with theprojected demand in some sectors. There has notbeen significant capacity addition in some of thecore industries. Likewise slow rate of capacityaddition in physical infrastructure sectors isconstricting industrial sector growth. Capacityaddition in core sectors and removal of infrastructurebottlenecks would spur industrial sector output inthe medium to long term.
Services Sector CHAPTER
10
India stands out for the size and dynamism of its services sector. The contribution of
the services sector to the Indian economy has been manifold: a 55.2 per cent share ingross domestic product (GDP), growing by 10 per cent annually, contributing to
about a quarter of total employment, accounting for a high share in foreign direct
investment (FDI) inflows and over one-third of total exports, and recording very fast(27.4 per cent) export growth through the first half of 2010-11.
10.2 The data on this sector is still sparse andhas to be collected from multiple sources. Whilethe latest available data has been taken fromdifferent national and international sources, carehas been taken as far as possible to use data fromonly reliable sources. It is hoped that having aseparate chapter on services will be a catalyst forbetter and more regular data on this sector in thefuture. Some services, such as infrastructure(roads, railways, civil aviation), financial services,and social services (health and education) arediscussed in other chapters of the survey. Theconstruction industry is briefly discussed in thischapter, because of similar related characteristicsand RBI and international institutions like WTOincluding it under services, even though from anational accounts classification, it is part of thesecondary rather than the tertiary sector.
10.3 This chapter examines the role of servicesin India’s economy in terms of contribution to GDP,employment, FDI, and States’ domestic product,and draws some international comparisons. Thechapter goes on to examine the performance ofdifferent services sub-sectors which are not well-covered in other chapters such as domestic trade;tourism including hotels and restaurants; shippingand port services; storage; telecommunicationsrelated services; real estate; information technology(IT) and IT enabled services (ITeS); accounting andauditing services; research and development (R&D)
services; legal services and consultancy;construction; and some specialized social servicessuch as sports.
IMPORTANCE OF THE SERVICES
SECTOR FOR INDIA
10.4 The importance of the services sector canbe gauged by looking at its contributions to differentaspects of the economy.
Services GDP
10.5 The share of services in India’s GDP atfactor cost (at current prices) increased rapidly:from 30.5 per cent in 1950-51 to 55.2 per cent in2009-10. If construction is also included, then theshare increases to 63.4 per cent in 2009-10.
10.6 The ratcheting up of the overall growth rate(compound annual growth rate [CAGR]) of theIndian economy from 5.7 per cent in the 1990s to8.6 per cent during the period 2004-05 to 2009-10was to a large measure due to the acceleration ofthe growth rate (CAGR) in the services sector from7.5 per cent in the 1990s to 10.3 per cent in 2004-05 to 2009-10. The services sector growth wassignificantly faster than the 6.6 per cent for thecombined agriculture and industry sectors annualoutput growth during the same period. In 2009-10,services growth was 10.1 per cent and in 2010-11
Website: http://indiabudget.nic.in
238 Economic Survey 2010-11
Website: http://indiabudget.nic.in
(advance estimates—AE) it was 9.6 per cent. India’sservices GDP growth has been continuously aboveoverall GDP growth, pulling up the latter since 1997-98. It has also been more stable (Figure 10.1).
Services Employment in India
10.7 Although the primary sector (agriculturemainly) is the dominant employer followed by theservices sector, the share of services has beenincreasing over the years while that of primary sectorhas been decreasing. Between 1993-94 to 2004-05, there was a sharp fall in the share of the primarysector in employment. The consequent rise in shareof employment of the other two sectors was almostequally divided between the secondary and tertiarysectors. In 2007-08 compared to 2004-05, though
the trend was similar, the fall in employment inprimary sector was less (at -1.1 per cent) with asmall commensurate rise in employment in the othertwo sectors, which was again almost equally dividedbetween the other two sectors (Table 10.1)
FDI in Services in India
10.8 The measurement of the share of servicesin FDI inflows encounters problems as it is difficultto clearly differentiate activities between servicesand goods in sectors such as computer hardwareand software, telecommunications, andconstruction. Nevertheless, the share of the foursectors combined (services [financial and non-financial], computer hardware and software,telecommunications, and housing and real estate),predominantly consisting of services, in FDI equity
Table 10.1 : Share of Broad Sectors in Employment (UPSS)
Shares Change in shares
Sectors 1993-94 2004-05 2007-08 2004-05 over 2007-08 over 2007-08 over1993-94 2004-05 1993-94
Primary 64.5 57.0 55.9 -7.5 -1.1 -8.6
Secondary 14.3 18.2 18.7 3.9 0.5 4.4
Tertiary 21.2 24.8 25.4 3.6 0.6 4.2
Note : For the years 2004-5 and 2007-8 projected population at mid-point of these two rounds was obtainedby applying projected population figures from the Registrar General of India’s (RGI) office. For theyear 1993-94, the population at mid-point of the survey period was obtained by interpolation ofcensus population of 1991 and 2001. Work participation rates of rural males, rural females, urbanmales, and urban females were obtained separately from unit-level data of the National sampleSurvey (NSS) and by multiplying them with the respective population, the total numbers of UsualPrincipal and Subsidiary Status (UPSS) workers for these four categories were obtained. Then thedistribution of employment from unit-level data for broad sectors (primary, secondary, and tertiary)was obtained. From the number of workers in the four categories and sectoral distribution ofemployment, total employment for three sectors for each of these four categories was obtained.From this, overall employment distribution at broad sectoral level was calculated.
Source : Central Statistics Office (CSO)
6
8
10
12
2005-06
Ann
ual g
row
th(p
er c
ent)
Year
ServicesGDP
Growth rate of GDP and services sector GDPFigure 10.1
OverallGDP
7
9
11
2006-07 2007-08 2008-09 2009-10
5
4
3
2
1
0
239Services Sector
Website: http://indiabudget.nic.in
inflows in April 2000–December 2010 is around 44per cent. If construction is included then the sharerises to 51 per cent. The financial and non-financialservices sector which falls purely in the servicescategory is the largest recipient of FDI equity inflowswith a 21 per cent share. This is followed by theother two sectors, namely computer software andhardware, and telecommunications each with 8 percent share. Housing and real estate, andconstruction with 7 per cent share each were nextin importance (Table 10.2).
10.9 The year 2009-10 has seen a drying up ofFDI inflows to India due to the global crisis with afall of 5.5 per cent. Mirroring this trend, FDI inflows
in the services sector also fell by 29.1 per cent (inUS dollar terms). The first nine months of 2010-11have also not shown any improvement on the FDIfront, overall and in services sectors.
State-wise Comparison
10.10 A comparison of the share of services inthe gross state domestic product (GSDP) of differentStates and Union Territories shows that the servicessector is the dominant sector in most States of India(Figure 10.2). States such as Delhi, Chandigarh,Kerala, Maharashtra, Bihar, Tamil Nadu and WestBengal have shares equal to or above the all-Indiashare.
Source : Department of Industrial Policy and Promotion.Note : Figures in parantheses are US$ million.
Note: Data in the case of Goa and Jammu and Kashmir are for 2007-08. Shares in current prices, Growth rateconstant prices.
0
20
40
60
80
Per
cent
Share ofservices
Share and growth of services sector in 2008-09Figure 10.2
Servicesgrowth
Chat
tisga
rh
Him
acha
l Pra
desh
Jhar
khan
d
Goa
Guja
rat
Raja
stha
n
Punj
ab
Jam
mu
& Ka
shm
ir
Oris
sa
Mad
hya
Prad
esh
Utta
r Pra
desh
Andh
ra P
rade
sh
Hary
ana
Assa
m
Utta
rakh
and
Karn
atak
a
All i
ndia
Wes
t Ben
gal
Tam
il Na
du
Biha
r
Mah
aras
htra
Kera
la
Chan
diga
rh
Delh
i
Overallgrowth
10
30
50
70
90
240 Economic Survey 2010-11
Website: http://indiabudget.nic.in
10.11 State-wise growth of GSDP is also closelyassociated with faster growth of the tertiary sector.Interestingly, Bihar which has the highest overallgrowth rate in 2008-09 also has the fastest growthamong States in services, in part due to its rapidprogress from a low base (only Goa’s growth ratein services is higher than that of Bihar, but this isfor 2007-08). Even small States such asChhattisgarh and relatively low-income States suchas Orissa and Rajasthan which have relatively lowoverall growth rates have started piggy-backing onthe good performance of their services sectors toclimb up the ladder of progress. Thus, the servicesrevolution in India seems to be becoming morebroad based rather than being concentrated in onlya few States.
Services Exports
10.12 India is also moving towards a services-ledexport growth. During 2004-05 to 2008-09 as perthe Balance of Payments data, merchandise andservices exports grew by 22.2 and 25.3 per centrespectively. Services growth slowed in 2009-10 asa result of the global recession, but the decline was
less pronounced than the slowdown in merchandiseexport growth, and has recovered rapidly in the firsthalf of 2010-11 with a growth of 27.4 per cent. Theoverall openness of the economy reflected by totaltrade including services as a percentage of GDPshows a remarkable increase from 29.2 per cent in2000-01 to 53.9 per cent in 2008-09, though it dippedto 46.1 per cent in 2009-10 due to the global crisis.The dip was more due to fall in share of merchandisetrade to GDP to 35 per cent in 2009-10 comparedto 41 per cent in 2008-09. The fall in the share ofservices trade to GDP was less than 2 percentagepoints from 12.9 per cent to 11.2 per cent.
Important Services for India
10.13 Some services have been particularlyimportant for this improving performance in India.Software is one sector in which India has achieveda remarkable global brand identity. Tourism- andtravel-related services and transport services arealso major items in India’s services. Besides these,the potential and growing services include manyprofessional services, infrastructure-relatedservices, and financial services.
Table 10.3 : Share of different services categories in GDP at factor cost (current prices)
10.14 CSO’s classification of the services sectorfalls under four broad categories, namely a) trade,hotels, and restaurants; b) transport, storage, andcommunication; c) financing, insurance, real estate,and business services; and d) community, social,and personal services. Among these, financing,insurance, real estate, and business services; andtrade, hotels and restaurants are the largest groupsaccounting for 16.7 per cent and 16.3 per centrespectively of the national GDP in 2009-10. Thecommunity, social, and personal services categoryaccounts for a 14.4 per cent share, while transport,storage, and communication accounts for a 7.8 percent share. Construction, which is a borderlineservices inclusion, has a share of 8.2 per cent(Table 10.3).
SERVICES SECTOR : INTERNATIONAL
COMPARISON
Services GDP
10.15 With an overall share of 64.2 per cent inworld GDP in 2009 (Table 10.4), the services sector
across the globe has been playing a dominant rolein the growth of economies, especially in high-income economies which have transited toservices-led economies. India with a services sectorshare of 52 per cent in national GDP in 2009 and55.2 per cent in 2009-10 compares well even withthe developed countries in the top 12 countries withthe highest overall GDP. China’s share of servicesin its national GDP at 39.2 per cent is relativelylow, though it is ahead of India in absolute terms(as its overall GDP is more than three times thatof India). In terms of services growth rate, China(10.5 per cent) followed by India (8.9 per cent) arethe two fastest growing economies in the top 12countries. In the global crisis year of 2009, whenmost of the top 12 countries registered negativegrowth in services, only China(9.4 per cent), India(6.8 per cent), and Brazil (2.6 per cent) registeredpositive growth. India’s world ranking in overall GDPat current prices in 2009 was 11 and in servicesGDP it was 12. Except for the Russian Federationmoving to 11th position and India moving to 12th inservices, there is no major change in rank in termsof overall GDP and services GDP.
Table 10.4 : Performance in Services Growth of Top 12 Countries
Country Rank Overall GDP Share of Services Services Growth (US$ billion) (% of GDP) Rate (%)
Overall Services At AtCurrent ConstantPrices Prices
GDP GDP 2009 2009 2000 2008 2009 2000 2008 2009 2000-09(b)
United States 1 1 14119 12,899 74.1 76.8 76.5 3.4 0.9 -3.1 2.0
Source : UN National Accounts Statistics accessed on 4 February 2011.
Note : Rank is based on current prices.Growth rates are based on constant prices (US$).(a) In 2009-10 as per CSO, India.(b) CAGR is estimated for 2000-09.
242 Economic Survey 2010-11
Website: http://indiabudget.nic.in
FDI in the Services Sector
10.16 The global economic and financial crisis hada dampening effect on cross-border FDI flows. Thoughthe crisis took a heavy toll on flows to manufacturingactivities, the services sector was also affected. Asper the United Nations Conference on Trade andDevelopment (UNCTAD), the impact of the crisisacross sectors has resulted in a shift in their relativeweights in FDI flows-it has fallen in manufacturing,relative to the primary and services sectors. The shareof manufacturing in total cross-border mergers andacquisitions (M&As) was lower in developedcountries--where it stood at 30 per cent of their valuein 2009--than in developing and transition economies,where it accounted for 32 per cent of the transactionvalue. The shares of the primary sector and servicesin total cross-border M&As by value, on the otherhand, were higher in developed countries than indeveloping and transition economies. Businessservices were among the sectors where investmentexpenditures were hard hit by the crisis, registeringa reduction of greenfield investment projects in theworld by 20 per cent in 2009 compared to the previousyear. Greenfield investments in financial services alsodeclined from 1616 in 2008 to 1267 in 2009 (Table10.5).
10.17 On the positive side, at global level, medium-term prospects for services are generally better thanthose for the manufacturing sector with internationalinvestment in the services sector expected to growrelatively faster. In addition, many servicestransnational companies, which some years agowere mainly focused on their home markets, arenow pursuing internationalization strategies involvingambitious investments abroad. Developing andtransition economies, particularly in Asia, areconsidered as most attractive destinations.
Trade in Services
10.18 India has made much progress in Trade inservices, which is dominated by developed
countries, and was among the top 12 serviceexporters of the world in 2009. However, China infifth rank is ahead of India with 12th rank (seeChapter 7 for details).
INDIA’S SERVICES DATA
10.19 One of the important challenges faced bythe country is collection of data on the servicessector. The challenge of data collection leads todifficulties in compilation of an index for servicessector production, non-representation of manyservices sectors in the calculation of the wholesaleprice index, limited availability of published data onpricing of services, and limited data on trade inservices. Even where data are available, they sufferfrom deficiencies related to definition, method ofcollection, suitability for pricing, and constructionof indices.
10.20 Recently some efforts are being made tocollect services data (see Box 10.1). While theseinitiatives have to be speeded up, a lot more effortin coordination may be needed.
PERFORMANCE OF SUB-SECTORS
10.21 The two fast-growing broad servicescategories are: a) financing, insurance, real estateand business services; and b) transport, storage,and communication. The latter overtook the formerin 2009-10 with a high growth of 15 per cent (Table10.6). A third category, growth of trade, hotels, andrestaurants, slowed in 2008-09 and has recoveredmoderately in 2009-10. The fourth category,community, social, and personal services, saw asudden jump in 2008-09 to overtake the growth ofall other categories, reflecting the high growth inpublic administration and defence. This categoryhas continued to grow rapidly in 2009-10, despite aslowdown in growth in public administration anddefence (with the commitments for pay arrearsunder the new revised scale for Government
Table 10.5 : Number of Greenfield FDI Projects in Services Industries 2007–2009
Sector 2007 2008 2009
Hotels & Tourism 297 553 370
Transport, Storage, and Communications 1024 1269 1133
Communications 448 594 544
Financial Services 1161 1616 1267
Business Services 2922 3647 2927
Source: UNCTAD, World Investment Report 2010.
243Services Sector
Website: http://indiabudget.nic.in
Box 10.1 : Some Recent Efforts to Collect Services Data
1. Index of services production (ISP) : The contribution of the services sector to the national economy, both in terms ofvalue addition and employment generation, is growing over the years. However, there is no short-term indicator tomeasure the dynamics of this vast and heterogeneous sector. To fill this gap, the ISP is being compiled by the CSO.The index for railways, air transport, and ports has been completed.
2. Services price index (SPI) : Dr Rangarajan Commission (2001), set up by the Ministry of Statistics and ProgrammeImplementation, had recommended the compilation of a separate SPI, which should eventually be merged with thewholesale price index (WPI) once it has stabilized and established its robustness. Ten sectors, namely banking, trade,business services, postal services, telecommunication, air transport, port services, insurance, rail transport, and roadtransport have been identified in the initial phase for development of an experimental SPI. Methodologies fordeveloping the SPI have been finalized for seven sectors, namely railways, trade services, business services, banking,telecommunications, postal services, and air transport. A common format is developed for the sector-specificmethodologies approved by the Expert Committee covering the scope of the index, products to be covered, andweighting diagram. Construction of the SPI on experimental basis is to be undertaken sequentially beginning with theindex of banking services and rail transport.
3. Trade in services data : There are some developments on the services trade front also. While the RBI has beenproviding data on services at a more disaggregate level in recent years, as per the recommendations of the WorkingGroup on Balance of Payments (BOP) manual, the RBI will also provide aggregate data on trade in services with a lagof 45 days from April 2011, i.e. April 2011 data will be available on 15 June 2011. The working group had suggestedthat disaggregated data on services should be released on a quarterly basis. As a follow up, RBI has started releasingdisaggregated quarterly data on trade in services beginning the first quarter of 2010-11, which has been published inthe February 2011 issue of the RBI bulletin. A joint committee on International Trade in Services formed by theDepartment of Commerce had also submitted its report in 2001 and in 2010 an expert group on Strengthening ofInstitutional Mechanism for Regular Collection and Compilation of Data on International Trade in Services has beenset up by the Ministry of Statistics and Programme Implementation.
Table 10.6 : Annual Growth in India’s Services GDP at Factor Cost (in constant prices)
Tourism Foreign Tourist Arrivals Million 5.08(a) 5.28(a) 5.11(a) 5.58(a)Foreign exchange earnings from tourist arrivals US $ Million 10,729(a) 11,750(a) 11,394(a) 14,193(a)
Shipping Gross Tonnage of Indian Shipping Million GT 8.84(a) 9.31(a) 9.39(a) 10.1(c)No. of ships Numbers 867 925 1003
Ports Port Traffic Million Tonnes 521.47 532.53 562.74 416.61(d)
Railways Freight Traffic by Railways Million Tonnes 804.11 833.31 887.99 673.31(e)Net Tonne Kilometers of Railways Million 523,000 538,226 584,760 444,515(e)
Sources: Directorate General of Civil Aviation, Telecom Regulatory Authority of India, Ministry of Tourism, Ministryof Shipping, Ministry of Railways and Central Warehousing Corporation. (Compiled by EXIM Bank of India)
Notes : (a) calendar years, for example 2007-08 for 2007.(b) April-November.(c) As on 01 September 2010.(d) April – October.(e) April – December.
employees coming down), due to the offsetting risein growth of other services reflecting the fiscalstimulus to social sector activities. Among the sub-categories, in 2008-09, double-digit growth wasregistered by communication (25.8 per cent), publicadministration, and defence (20.2 per cent),banking and insurance (14 per cent) and storage(10.5 per cent). Negative growth was registered onlyby hotels and restaurants (-3.1 per cent). Amongbusiness services, the two important categories arecomputer-related services and the categoryconsisting of many services like R&D services,market research, business and managementconsultancy, architectural engineering, andadvertising, with shares of 3.26 per cent and 0.88per cent respectively in the GDP. While computer-related services, which grew by 21.2 per cent in2008-09, registered a moderate growth of 5.2 percent in 2009-10 due to the global crisis, R&Dservices registered good growth of 19.6 per centand 19.9 per cent in 2008-09 and 2009-10respectively. Among other services, the twoimportant ones in terms of share of GDP areeducation and medical health, with the formergrowing at 13.9 per cent and the latter at 5.3 percent in 2009-10. All other services are of minorimportance in India’s GDP. While total servicesincluding construction grew by 9.7 per cent, total
services excluding construction grew by 10.1 per
cent in 2009-10. In 2010-11(AE), they grew by 9.4
per cent and 9.6 per cent respectively.
10.22 The two broad services categories, namely
trade, hotels, transport and communication; and
financing, insurance, real estate and business
services, comprising many dynamic services have
performed well with growth of 11 per cent and 10.6
per cent, respectively in 2010-11 (AE). Only
community, social and personal services have
registered a low growth of 5.7 per cent due to base
effect of fiscal stimulus in the previous two years,
thus contributing to the slight deceleration in the
growth of the services sector. Construction sector
grew at a moderate 8 per cent.
10.23 A comparison of the different indicators
related to different services in India shows good
performance in services like telecom, aviation, and
railways. Storage services show a fall in the number
of warehouses which is a just a reflection of demand
and supply in different places (Table 10.7). The
performance and outlook for the services sector
based on the limited firm-level data, though sketchy
and based on estimates and forecasts also indicates
a robust performance in services activities in 2010-
11 and 2011-12 (see Box 10.2).
245Services Sector
Website: http://indiabudget.nic.in
Box 10.2: Performance of Services Firms: A Sectoral Analysis
The Centre for Monitoring Indian Economy’s (CMIE) analysis of the sector-wise performance of services activities basedon firm-level data is given here. The data for 2010-11 and 2011-12 are based on estimates and forecasts.
Transport logistics: The sales of the transport logistics services industry are estimated to have grown by a healthy 7.2 percent during 2009-10. This growth is likely to have been achieved by a combination of higher cargo volumes and betterrealizations. In 2010-11 as a whole, the sales of this sector is expected to grow by 13 per cent and Profit After Tax (PAT)is expected to grow by 11 per cent.
Shipping: The shipping sector’s sales are expected to fall by 3 per cent in 2010-11. Freight rates are likely to remain weakduring the second half of the year. After two consecutive years of decline, the sales growth is likely to pick up in 2011-12at 3.2 per cent with a slow recovery in cargo volumes and an improvement in freight rates. However, the industry’s PATis expected to decline by 3.3 per cent in 2011-12 with a sharp growth in depreciation charges and interest expenses, by 12.6per cent and 13.7 per cent , respectively, which is likely to eat into a major part of the industry’s operating profits. Asubstantial tonnage addition to its fleet during the two years is also likely to affect the rise in these expenses.
Aviation: Oil marketing companies hiked aviation turbine fuel (ATF) prices for the fortnight beginning 1 January 2011.The ATF price ex-Mumbai rose by 5.9 per cent as compared to the corresponding fortnight a month ago, to Rs.48,059 perkilolitre. This was 16.6 per cent higher than the average ATF price in January 2010. In 2010-11 as a whole, sales areexpected to grow by 25.9 per cent. This will be due to an expected rise in passenger volumes and the passing on of higherATF prices. In 2011-12, sales are likely to grow by a healthy 14 per cent.
Retail sector: Retail sector is expected to record healthy sales in 2010-11 and grow by 10.2 per cent in 2011-12. Thesector’s PAT margin is expected to expand over the next three years on account of a faster rise in income vis-a-vis expense.For the year ending March 2011, projects worth Rs.8,281 crore are expected to be completed adding retail space of 115.1lakh square feet. During 2011-12, projects worth Rs.24,143 crore are expected to be completed adding a capacity of 168.6lakh square feet.
Health Services: The health services sector’s sales is expected to grow by a healthy 25.6 per cent in 2010-11 and 19.8 percent in 2011-12 driven by a healthy rise in sales. The sector’s PAT increased by a whopping 107.1 per cent in the quarterending September 2010-11 on account of a faster rise in income vis-a-vis expenses and is expected to grow by 45 per centin 2010-11.
Hotel: After falling in 2009-10, the hotel sector’s sales are likely to grow in 2010-11 by 18.1 per cent due to both, higheroccupancies and Average Room Rate (ARRs). However, fresh room additions in 2011-13 will keep the ARRs under check.Sales are expected to grow by 15.1 per cent in 2011-12.
Telecom: After rising by just 2.2 per cent during 2009-10, sales growth of the telecom industry witnessed a recovery andimproved during the first half of 2010-11. This recovery in sales growth is expected to continue. During 2010-11 and2011-12, sales are expected to rise by 11.4 per cent and 14.6 per cent respectively driven by an increase in the subscriberbase and a deceleration in the fall of both, average revenue per user (ARPU) and the minutes of usage per user (MOU).
Software: The Indian software industry is mainly export-oriented. The industry garners around 60-70 per cent of the totalrevenue from its two largest markets, namely the US and Europe. The economic slowdown in these major exportdestinations led to a deceleration in growth of sales of the Indian software industry to 5.9 per cent. However, sales areexpected to grow at 16.9 per cent and 17.8 per cent, respectively during 2010-11 and 2011-12 due to higher clientadditions and an uptick in billing rates.
Construction and allied activities: Sales growth of the construction industry is expected to pick up in the second halfof 2010-11. With increased activity in the industrial and infrastructure construction segments, due to Government’sthrust on infrastructure creation, sales growth of this sector is expected to rise by 20.2 per cent and 21.7 per cent in 2010-11 and 2011-12 respectively.
Source: Compiled by EXIM Bank of India based on CMIE Industry Analysis.
PERFORMANCE OF SOME MAJOR
SERVICES
Trade10.24 Trade is an important segment in India’sGDP. The GDP from trade (inclusive of wholesaleand retail in the organized and unorganized sectors)at constant prices increased from ̀ 4,33,967 crore
in 2004-05 to ̀ 6,71,396 crore in 2009-10, at a CAGR
of 9.1 per cent. The share of trade in the GDP,however, remained fairly stable at around 15 per cent
in the last four years.
10.25 The last decade has witnessed acceleration
in the growth rate of real GDP. It has been in the
range of 8-9 per cent during the last five years.
246 Economic Survey 2010-11
Website: http://indiabudget.nic.in
This fast growth means rising disposable income ofthe population, in particular that of the middle class.With the growth in consuming population, the retailbusiness also got a boost. There are no officialestimates of the size of retail trade in the country,though such estimates have been made by someinstitutions. Quoting a NSSO Survey, theInternational Council for Research on InternationalEconomic Relations (ICRIER) study of 2008 placesemployment in the retail trade at 35.06 million, whichconstitutes 7.3 per cent of the workforce in thecountry. On the basis of employment intensity inretail trading, the contribution of the retail sector inthe GDP is estimated in the range of 10 to12 percent. A large number of small and decentralizedtraders dominate the Indian retail scene. Oneestimate puts their number at 1.3 crore. Theorganized corporate sector has started showinginterest in the retail business. With fast growth inthe GDP and rising disposable income of theconsuming classes, the modern format of retailing(i.e. organized retailing) is attracting domestic andforeign investment (Box 10.3).
Tourism, including Hotels and Restaurants
10.26 Tourism is one of the major engines ofeconomic growth in most parts of the world including
India. Since tourism does not fall under a singleheading in the National Accounts Statistics, itscontribution has to be estimated. In 2007-08, thecontribution of tourism to the country’s GDP, and tototal jobs (direct and indirect) in the country wasestimated at 5.92 per cent, and 9.24 per centrespectively. In absolute numbers, the total numberof tourism jobs in the country increased from 38.6million in 2002-03 to 49.8 million in 2007-08.According to the UN World Tourism Organization,tourism provides 6 per cent to 7 per cent of theworld’s total jobs directly and millions more indirectlythrough the multiplier effect in this sector. Tourismalso plays an important role in the country’s foreignexchange earnings, as its share in India’s export ofservices accounted for 13 per cent of the total exportof services in 2009-10.
10.27 In India, the tourism sector witnessedsignificant growth in recent years. During the period2004 to 2009, the CAGRs of foreign tourist arrivalsand foreign exchange earnings from tourism inrupee terms were 8.1 per cent, and 14.5 per centrespectively. Foreign tourist arrivals in India, whichwere at 5.28 million in 2008, fell to 5.11 million in2009 due to the global crisis. These arrivals, whichregistered negative or low growth rates in the firsteleven months of 2009, started recovering fromDecember 2009 with a good growth of 21 per cent.In the year 2010, the recovery continued with foreigntourist arrivals at 5.58 million registering a growthof 9.3 per cent. The foreign exchange earnings fromtourism in the year 2010 witnessed a growth of 18.1per cent over the previous year in rupee termscompared to the decline of 3.3 per cent in 2009.Domestic tourism also plays an important role inoverall tourism development in the country. Thenumber of domestic tourist visits increased to 650million in 2009 as compared to 562.98 million in2008, witnessing a growth of 15.5 per cent in spiteof various adverse factors during this period.
10.28 The hotels and restaurants sector is animportant sub-component of the tourism sector.Availability of good quality and affordable hotelrooms plays an important role in boosting the growthof tourism in the country. Presently there are 1593classified hotels with a capacity of 95,087 rooms inthe country. The hotels sector comprises variousforms of accommodation, namely star categoryhotels, heritage category hotels, timeshare resorts,apartment hotels, guest houses, and bed andbreakfast establishments. The share of the hotelsand restaurant sector in the overall economy
Box 10.3 : FDI in Retail Trading in Indiaand Other Countries
In India, retail trade is a state subject. There is no nationalframework for its regulation and development and stateshave their own regulations. At central level, only theflow of FDI into the sector is regulated. While FDI incash and carry wholesale trading is permitted in India,FDI in multi-brand retailing is prohibited. FDI in single-brand retailing up to 51per cent has been allowed since2006. A total of 94 proposals have been received till May2010, of which 57 were approved. During the periodApril 2006 to March 2010, FDI inflows valued at US $194.69 million have come into this sector, accounting for0.21 per cent of total FDI inflows during this period.FDI in retail trading is permitted in Brazil, Argentina,Singapore, Indonesia, China, and Thailand without limitson equity participation, while Malaysia has equity capson FDI in the retail sector. Permitting FDI in retail in aphased manner beginning with metros and incentivizingthe existing retail shops to modernize could help addressthe concerns of farmers and consumers. FDI in retailmay also help bring in technical know-how to set upefficient supply chains which could act as models ofdevelopment.
Source: Based on the Department of Industrial Policy andPromotion’s Discussion paper, ‘FDI in Multi brand RetailTrading’, Department of Consumer Affairs’ inputs, andworking paper No.1. 2010, Department of Economic Affairs.
247Services Sector
Website: http://indiabudget.nic.in
increased from 1.46 per cent in 2004-05 to 1.69 percent in 2007-08, and then decreased to 1.53 percent and 1.45 per cent in 2008–09 and 2009-10respectively. The CAGR in the GDP contributed bythe hotels and restaurants sector was 8.5 per centin 2004–05 to 2009–10. There was, however, negativegrowth (-3.41 per cent) in 2008–09 over the year 2007–08, which was due to the adverse global economicconditions in this year, while in 2009-10, the sectorregistered a growth of 2.2 per cent. Several studieshave identified the demand-supply gap in hotel roomsin India; some of them have estimated a gap of150,000 hotel rooms, of which 100,000 rooms are inthe budget segment. Since the construction ofhotels is primarily a private-sector activity and iscapital intensive with a long gestation period, theGovernment is making efforts to stimulateinvestments in this sector and speed up the approvalprocess.
10.29 Various financial and fiscal incentives havebeen announced by the Government for thehospitality sector including a five-year tax holidayunder the Income Tax Act for two, three, and fourstar category hotels located in all United NationsEducational, Scientific and Cultural Organization(UNESCO) World Heritage sites (except Mumbaiand Delhi) for hotels starting operations from 1 April2008 to 31 March 2013; a five-year tax holidayannounced in 2007-08 for two, three, and four starcategory new hotels and convention centres comingup between 1 April 2007 and 31 July 2010 in theNational Capital Territory of Delhi and someneighbouring districts of the National Capital Region.Other incentives include: relaxation of externalcommercial borrowings (ECB) to reduce the liquiditycrunch being faced by the hotel industry for settingup new hotel projects; allowing FDI up to 100 percent under the automatic route for the hotel andtourism-related industry; delinking of credit to hotelprojects from commercial real estate by the RBI,thereby enabling hotel projects to avail of credit atrelaxed norms and reduced interest rates; and aninvestment-linked deduction under Section 35 ADof the Income Tax Act announced in the UnionBudget 2010-2011 for establishing new hotels of 2-star category and above, all over India, thus allowing100 per cent deduction in respect of the whole orany expenditure of capital nature. Government alsohas a voluntary scheme of granting approval tobonafide tour operators, travel agents, touristtransport operators, and adventure tour operators
who satisfy certain criteria specified in terms ofturnover, infrastructure, and manpower.
10.30 Since infrastructure development holds thekey to India’s sustained growth in the tourism sector,the Government has been making efforts to developquality tourism infrastructure at tourist destinationsand circuits. A scheme has been launched fordevelopment of nationally and internationallyimportant destinations and circuits through megaprojects. So far, 38 projects have been identified outof which 23 have been sanctioned. The megaprojects are a judicious mix of heritage and cultural,spiritual, and ecotourism in order to give tourists aholistic experience. In order to meet the huge skillgap in the hospitality industry, the Government hasput in place a multipronged strategy which includesstrengthening and expanding the institutionalinfrastructure for training and education. Besides,steps are being taken for skill training of youth inthe hospitality sector and providing skill certification.Special efforts were also made for theCommonwealth games including creation ofadditional hotel accommodation and assistance fortraining of service providers like tourist taxi drivers,auto drivers and immigration personnel in Delhi, theNCR region, and Agra for making them touristfriendly and hospitable. While the general securitysituation has improved, to strengthen the NationalTourism Policy 2002’s critical pillar of Suraksha(Safety), the Government has adopted the Code ofConduct for ‘Safe and Honourable Tourism’ on 1July 2010.
10.31 Along with the continuation of promotionalefforts under the Incredible India campaign, theGovernment has introduced the Visa-on-Arrival(VoA) scheme for tourists from five countries,namely Singapore, Finland, New Zealand,Luxembourg, and Japan on a pilot basis with effectfrom 1 January 2010. During January–December2010, a total of 6549 VoAs were issued under thisscheme. The VoA scheme has been extended tothe nationals of Cambodia, Vietnam, Laos, andPhilippines with effect from 1 January 2011 andMyanmar and Indonesia from 25 January 2011.
10.32 Despite these efforts, there is a lot more tobe done given the potential of this sector. In fact at11.5 per cent, the share of travel in India’s exportsof commercial services in 2008 is relatively lowerthan that of many other exporters of services andhalf the shares of the USA, EU, and China(Table 10.8).
248 Economic Survey 2010-11
Website: http://indiabudget.nic.in
10.33 India’s share in international tourist arrivalsis a paltry 0.58 per cent in 2009. In fact, at 11.07million, outbound Indians in 2009 were more thandouble the inbound tourists, though foreign exchangeoutgo due to outbound Indians is much less thanthe foreign exchange inflow from inbound tourists.These facts show that this high potential sector withmultiplier effects on income and employmentgeneration is still relatively untapped.
Some Transport Related Services
Shipping
10.34 Shipping plays an important role in theeconomic development of the country, especially inIndia’s international trade. The Indian shippingindustry also plays an important role in the energysecurity of the country, as energy resources, suchas coal, crude oil, and natural gas are mainlytransported by ship. Further, during crisis situations,Indian shipping contributes to the uninterruptedsupply of essentials, and can serve as second lineof defence. Approximately, 95 per cent of thecountry’s trade by volume, and 68 per cent in termsof value, is being transported by sea. Though Indiahas one of the largest merchant shipping fleetsamong the developing countries, it was rankedeighteenth in the world in terms of dead weighttonnage (DWT) as on 01 January 2010. Leavingthe ‘flags of convenience’ countries, India’s shareis low at 1.17 per cent, while China’s is aroundthree times higher than India’s (see Table 10.9).Indian shipping tonnage (capacity) was practicallystagnant at around 7 million gross tonnage (GT) tillthe beginning of 2004-05. However, the tonnagetax regime introduced by the Government of Indiain that year boosted the growth of the Indian fleetas well as its tonnage. The Indian fleet presentlystands at 10.16 million GT and 1040 ships (as on01 January 2011), with the Shipping Corporationof India, a public-sector undertaking, having a majorshare of 35.3 per cent in India’s shipping tonnage.Of this 9.1 million GT with 340 ships caters to India’s
overseas trade and the rest to coastal trade. Thegross foreign exchange earnings/ savings of Indianships during 2007-08 were at a record level of` 14,589 crore. Net foreign exchange earnings/savings of Indian shipping companies, afteraccounting for financial costs at ̀ 8952 crore werearound 61 per cent of gross earnings/ savings.
10.35 In order to facilitate growth of the Indianshipping industry and make it competitive atinternational level, the government has initiatedseveral measures like bringing acquisition of alltypes of ships under open general licence; allowing100 per cent FDI in the shipping and port sectors;cargo support to Indian shipping lines by providing
Table 10.8 : Composition of Commercial Services Exports of India and Other Major ServicesExporters
Source: calculated from World Trade organization (WTO) data.
Table 10.9 : Share of Merchant Fleets byFlags of Registration as on 1 January 2010
Rank Flag of Registration DWT Share(In ‘000) (%)
1 Panama 2,88,758 22.63
2 Liberia 1,42,121 11.14
3 Marshall Islands 77,827 6.09
4 Hong Kong 74,513 5.83
5 Greece 67,629 5.30
6 Bahamas 64,109 5.02
7 Singapore 61,660 4.83
8 Malta 56,156 4.40
9 China 45,157 3.54
10 Cyprus 31,305 2.45
11 South Korea 20,819 1.63
12 Norway 20,811 1.63
13 UK and Northern Ireland 20,176 1.58
14 Japan 17,707 1.39
15 Germany 17,570 1.38
16 Italy 17,276 1.35
17 Isle of Man 16,711 1.30
18 India 14,970 1.17
World Total 12,76,137 100
Source : UNCTAD, Review of Maritime Transport2010.
249Services Sector
Website: http://indiabudget.nic.in
for centralized shipping arrangements through theChartering Wing (Transchart) of the Ministry ofShipping; introducing tonnage tax system during2004-05; formulating a Cruise Shipping Policy ofIndia in June 2008; and establishing the IndianMaritime University in November 2008.
10.36 According to the National Council of AppliedEconomic Research (NCAER), a 5 per centincrease in the national shipping tonnage saves orearns an additional 17 per cent of the freight billand according to a report by The Energy andResources Institute (TERI), a 1 per cent change ingross registered tonnage (GRT) is likely to bringabout a 0.0068 per cent change in the GDP. WhileIndia’s overseas seaborne trade has been growingsubstantially over the years from 224.62 milliontonnes in 1999-2000 to 598.70 million tonnes in2008-09 with a CAGR of 10.57 per cent during 2004-05 to 2008-09, there is a sharp decline in the shareof Indian ships in the carriage of India’s overseastrade from about 40 per cent in the late 1980s to9.5 per cent in 2008-09 with a 5.7 per cent share inIndia’s export trade and 12 per cent share in India’simport trade. Given the relatively low participationof Indian ships in India’s export trade and given thefact that Indian ships are ageing, with the averageage of the Indian fleet increasing from 15 years in1999 to 18.3 years in 2009, there is urgent need toincrease the shipping fleet for a country of India’ssize. This can lead not only to higher growth of theeconomy but also higher foreign exchange earnings/savings and higher employment.
Port Services
10.37 Being the gateways of international trade,ports play a vital role in the overall economicdevelopment of the country. India is blessed with along coastline with 13 major ports and around 200non-major ports. While around 72 per cent of thetotal cargo handled by volume was through India’smajor ports and the rest through non-major ports till2008-09, with the development of private ports theshare of major ports fell to 67 per cent during 2009-10. Despite the recessionary trend and decline inexports, during the years 2008-09 and 2009-10,traffic at major ports attained a growth of 2.2 percent and 5.74 per cent respectively over the previousyear. Some recent developments in the port servicessector include the finalization of a model concessionagreement for awarding projects on public privatepartnership (PPP) basis in 2008 and introductionof web-based port community systems. The ranking
of ports in the world in 2008 places Singapore,followed by Shanghai and Rotterdam at the top, withMadras and the Jawaharlal Nehru Port Trust (JNPT)in the 70th and 71st positions in terms of total cargovolume. In terms of container traffic also, Singaporefollowed by Shangai are at the top, while the JNPTranks 25th.
10.38 The average turnaround time in major Indianports was 4.38 days in the year 2009-10 and wasrelatively higher in some ports like Paradip,Kolkata,Vizag, and Kandla, while average output pership-berth-day was 10,168 tonnes with more thandouble the average in the JNPT and around one-fifth the average in Kolkata port. With the averageturnaround time in India already relatively high byinternational standards, the turnaround time ofSingapore being less than a day, what is cause forfurther worry is the rise in average turnaround timeand average pre-berthing time and fall in averageoutput per ship-berth-day in 2009-10. (See Table10.10)
10.39 A lot of attention needs to be paid to ourport sector. There is need to follow a holisticapproach for improving the existing infrastructureand services at ports through modernization of thesystems using latest technology. The infrastructurefacilities at major ports for handling crude oilparticularly need to be strengthened through afacilitative policy on single-point moorings. Thefacilities at existing ports with regard to cargohandling, stevedoring, pilotage services, bunkerservices, and warehousing facilities need to beupgraded. The trans-shipment of Indian cargo takingplace outside the country at present needs to behandled at Indian ports through concertedmeasures. This would include increasing the drafts
Table10.10 : Some PerformanceIndicators for Major Ports in India
Year Average Average AverageTurnaround pre-Berthing Output per
Time Time Ship Berth(in days) (in hours) day (in
tonnes)
2004-05 3.41 6.03 9298
2005-06 3.50 8.77 9267
2006-07 3.62 10.05 9745
2007-08 3.93 11.40 10071
2008-09 3.87 9.55 10473
2009-10(P) 4.38 11.67 10168
Source : Ministry of Shipping website.
250 Economic Survey 2010-11
Website: http://indiabudget.nic.in
available at Indian ports, rationalization of port duesand providing differential levels of tariff for differentsizes of vessels or for different cargoes so as toattract mother ships to berth at Indian ports. Themany port charges in India need to be reduced asthey are higher than in many other countries due toinefficiency of ports and inclusion of unrelated costslike pension and other contributions to labour inport services.
Storage Services
10.40 The warehousing services sector plays animportant role in the economy of the country.Warehousing services are an important cog both ininbound logistics, as raw materials, parts, and storeshave to be stocked, inventory control maintained,and materials which do not meet specificationsreturned to suppliers, as well as outbound logisticsas the goods produced have to be stored in differentgeographical locations before shipping/ dispatch asper demand/ order inflows. In India, the mostimportant component of warehousing is agriculturalstorage for agri-produce, foodgrains, fertilizers,manure, etc. Other components include industrialwarehousing for industrial goods, import cargo, andexcisable cargo; inland container depots (ICDs)/container freight stations (CFSs) for facilitatingimport/export trade; and special warehouses for coldand temperature controlled storage. The warehousingsector also provides ancillary services like handling,transportation, pest control, farmer extensionschemes, dedicated warehousing at doorsteps,consultancy, and project execution.
10.41 The Government has established the CentralWarehousing Corporation (CWC) with the objectiveof providing scientific storage facilities for agriculturalimplements and produce and other notifiedcommodities. Besides, with the same objective, 17State Warehousing Corporations (SWCs) were alsoset up under the Warehousing Corporations Act1962. The CWC and the respective StateGovernments are equal shareholders of theseSWCs. The commercial outreach with socialobjectives has resulted in the CWC operating a largewarehousing network across the country. As on 31December 2010, the CWC was operating 476warehouses, with a total storage capacity of 102.24lakh MTs and an average utilization of 85 per cent.It made an entry into operation of public bondedwarehouses in the late 1970s, when the CentralBoard of Excise and Customs, acknowledging theexpertise of the CWC in the field of storage andwarehousing, identified it as a custodian for dutiable
goods. The CWC has also diversified its businessinto CFSs/ICDs and also started Container RailTransportation from Loni (UP) to Jawaharlal NehruPort. The expansion of the overall capacity of theCWC has been slow as it is cost intensive. Theprofits generated are being ploughed back toconstruct additional warehouses therebystrengthening the warehousing infrastructurethroughout the country. At State level, the 17 SWCsmeet the storage requirements and complement thework of the CWC. As on 31 October 2010, theseSWCs were operating a network of 1585warehouses with an aggregate storage capacity of214.41 lakh MT.
10.42 Major policy initiatives taken recently by theGovernment include construction of godowns underthe seven-years guarantee scheme of theGovernment of India, most of them being managedby the CWC or SWCs; permission of up to 100 percent FDI in the construction of warehousinginfrastructure; and construction of warehousesunder the Grameen Bhandaran Yojana of NABARDand the Rastriya Krishi Vikas Yojana. In the year2007-08, the Government enacted the Warehousing(Development & Regulation) Act 2007 to make thewarehouse receipt fully negotiable. Recently theGovernment took another major initiative forconstruction of godowns under its PrivateEnterpreneurs Godown (PEG) scheme. The CWChas constructed 0.9 lakh MT godowns during theyear 2009-10 and has planned to constructadditional capacity to the tune of 1.77 lakh MT duringthe year 2010-11.
10.43 Some issues related to the warehousingsector include increasing high quality storagecapacity as well as the numbers of trained samplers/graders; addressing issues like storage loss due todeterioration of the produce during storage, lack ofprovision for dealing with cases where stocks arepledged with banks and the depositor eitherabsconds or refuses to take delivery; delay indelivery and deposit of stocks due to extension of‘no-entry’ zones in cities, levy of property tax onwarehouses and high fees by ports.
Telecom and Related Services
10.44 The opening of the telecom sector in Indiahas not only led to rapid growth but also helped agreat deal towards maximization of consumerbenefits as tariffs have been falling across the boardas a result of increasing competition, with the telecomservice price index falling from 100 in 2004-05 to
251Services Sector
Website: http://indiabudget.nic.in
85.08 in 2007-08. The telecom sector has grownfrom a level of 22.8 million telephone subscribers in1999 to 54.6 million in 2003, and further to 764.77million at the end of November 2010. Wirelesstelephone connections have contributed to thisgrowth as the number of wireless connections rosefrom 3.57 million in March 2001 to 729.58 millionby the end of November 2010. Tele-density, whichwas 2.32 per cent, increased to 64.34 per cent inNovember 2010. However, there is a wide gapbetween rural tele-density (30.18 per cent inNovember 2010) and urban tele-density (143.95 percent in November 2010). This shows that the marketstill has large untapped potential.
10.45 The Internet, which is another growing modeof communication, is a worldwide system ofcomputer networks. Broadband is often called ‘high-speed’ Internet, because it usually has a high rateof data transmission. Broadband subscribers grewfrom 0.18 million in 2005 to 10.71 million as at theend of November 2010. The number of Internet andbroadband subscribers is expected to increase to40 million and 20 million, respectively by 2010.Introduction of BWA (Broadband Wireless Access)services will enhance the penetration as well asgrowth of broadband subscribers. Wi-Max has alsobeen making headway in penetration of wirelessbroadband connectivity across all sectors. (Forfurther details, see Chapter 11.)
Real Estate Services
10.46 The real estate sector includes developmentof commercial and residential real estates, withparticipation and involvement of both Governmentagencies and private developers. The GDP fromthe real estate sector (including ownership ofdwellings) along with business services witnesseda growth of 7.5 per cent (at constant prices) in theyear 2009-10. In terms of share, it accounted for9.3 per cent of the GDP in the year 2009-10. Fiscalincentives for the housing sector provided insuccessive budgets together with liberal investmentand credit policies and reforms brought the housingand real estate sector to the centre stage of theIndian economy. The policy measures includepermission for FDI in townships, housing, built-upinfrastructure, and construction developmentprojects, including SEZs, under the automatic route,which has attracted foreign investors into this sector.However, FDI is not allowed in real estate business.The National Housing Bank (NHB) established with
the objective of promoting housing finance institutionsboth at local and regional levels has conceptualizedthe reverse mortgage loan product exclusively forcovering house-owning senior citizens. It hasintroduced the residential real estate price index(RESIDEX), which is an initiative towards providingthe housing finance sector with an index whichreflects the trends in the prices of residentialproperties across the country.
10.47 The global economic crisis impacted theIndian real estate industry significantly. However,various measures taken by the Government to boostthe demand for residential properties, as also therelaxation in provisioning requirements by the RBIfor banks and NHB for Housing Finance Companies(HFCs), has minimized the impact of economiccrisis on this sector. The sector has startedrecovering following the increasing activity in theIndian economy, however with a fundamentaldifference. Customers are now going for need-based purchases rather than investment based onthe euphoria and hype witnessed in 2007 and 2008.
10.48 A joint study by Price Waterhouse Coopers(PWC) and Urban Land Institute of India (ULI) hascited India as one of the emerging markets for realestate sector in the Asia Pacific region. The studyclassifies India as semi-transparent market in theAsia Pacific region, and ranks it 41st on a globaltransparency scoring scale. It places Mumbai(ranked 3rd), New Delhi (5th), and Bangalore (10th)among the top 10 prospective cities for real estateinvestment for the year 2011. Mumbai and New Delhiin that order capture the top two places in terms ofcity development prospects for the year 2011.
10.49 In this emerging services sector, while shortterm worries like hardening interest rates need tobe addressed, there is also need for somefundamental reforms like tackling the high stampduty issue which makes even honest citizens dealin black money and problems related to foreclosureof loans and the Urban Land Ceiling RegulationsAct (ULCRA).
Some Business Services
IT and ITeS
10.50 India has gained a brand identity as aknowledge economy due to its IT and ITeS sector.The IT-ITeS industry has four major components:IT services, business process outsourcing (BPO),engineering services and R&D, and software
252 Economic Survey 2010-11
Website: http://indiabudget.nic.in
products. The growth in the services sector in Indiahas been led by the IT-ITeS sector which has becomea growth engine for the economy, contributingsubstantially to increases in the GDP, employment,and exports. This sector has improved its contributionto India’s GDP from 4.1 per cent in 2004-05 to 6.1per cent in 2009-10 and an estimated 6.4 per cent in2010-11. The industry has also helped expand tertiaryeducation significantly. The top seven States thataccount for about 90 per cent of this sector’s exportshave started six to seven times more colleges thanother States.
10.51 The Indian IT-ITeS industry has registeredrobust growth since 2004-05. According toNASSCOM, the year 2010-11 is characterized bybroad-based growth across mature and emergingverticals. The overall Indian IT-ITeS revenue has grownto US $ 63.7 billion in 2009-10 and an estimated US$ 76.1 billion in 2010-11, translating into a CAGR of22.5 per cent from 2004-05 to 2010-11. The industrygrew by an estimated 19.5 percent in 2010-11compared to the moderate growth of 6.2 per cent in2009-10 (see Table 10.11). Exports dominate the IT-ITeS industry, and constitute about 77 per cent oftotal industry revenue. Total IT-ITeS exports havegrown from US$ 17.7 billion in 2004-05 to US $ 49.7billion in 2009-10 and an estimated US $ 58.9 billionin 2010-11 registering a CAGR of 22.2 per cent from2004-05 to 2010-11.
10.52 Though the IT-ITeS sector is export driven,the domestic market is also significant with a revenuegrowth of US $ 14 billion in 2009-10 and an estimatedrevenue of US $ 17.2 billion in 2010-11. The IT andBPO industry (excluding hardware) witnessed a quickrebound in growth and has been estimated to havegrown by 19.5 per cent, aggregating revenues of US$76.1 billion in 2010-11 with exports at US$ 58.9 billionaccounting for a major portion.
10.53 This sector has also led to employmentgeneration. Direct employment in the IT services andBPO/ITeS segment was 2.3 million in 2009-10 andis estimated to reach nearly 2.5 million by the endof financial year 2010-11. Indirect employment of over8.3 million job opportunities is also expected to begenerated due to the growth of this sector in 2010-11. These jobs have been generated in diverse fieldssuch as commercial and residential real estate,retail, hospitality, transportation, and security.
10.54 India continues to be the dominant playerin the global outsourcing sector. However, its futurewill depend on how the challenges related to itscontinued competitiveness are tackled. Theseinclude increasing competition, rising costs, talentshortfall, infrastructure constraints, increasing riskperception, protectionism in key markets, anddeteriorating business environment.
10.55 The Government has been supporting theIT and ITeS sector in many ways. This was continuedin the 2010-11 Budget with policies like Governmentexpenditure for improving IT infrastructure anddelivery mechanism, reduction in surcharge from10 per cent to 7.5 per cent for IT companies andGovernment’s E-Governance plan. There are someissues in the IT-ITeS sector which need attention.These include shifting from low-end services to high-end services like programming in the light ofcompetition in BPO from other countries and policiesin some developed countries like UK to employlocals; addressing data protection issues as half ofoffshore work does not come to India; concludingtotalization agreements with target countries toresolve the social security benefits issue as is beingdone now; and increasing the coverage and depthof IT and ITeS services in the domestic sector.
Table 10.11: IT-ITeS Revenue and Exports (US $ billion)
Year 2009-10 2010-11 Growth Rate CAGR (2005-06 to(Estimated) in 2010-11 (%) 2010-11) (%)
Total IT-BPO Services Revenue 63.7 76.1 19.5 22.5
Exports 49.7 58.9 18.5 22.2
Domestic, of which 14.0 17.2 22.8 23.7
(i) IT Services 8.9 10.9 22.5 20.8
(ii) ITeS-BPO 2.2 2.8 27.3 29.3
(iii) Software Products 2.9 3.5 20.7 30.7
Source : Nasscom.
253Services Sector
Website: http://indiabudget.nic.in
Accounting and Auditing Services
10.56 Accounting, auditing, and book-keepingservices are part of ‘business services’. Theaccounting profession in India is highly developedwith the potential to become internationally morecompetitive. As per the WTO data, in the $33.76billion other business services exports by India in2008, the share of legal, accounting, management,and public relations services was 17.4 per cent andin the $21.06 billion imports of other businessservices by India, their share was 17.9 per cent.Indian accounting firms are increasingly gettingintegrated, and are providing associated servicessuch as management consultancy, corporatefinance, and advisory services, in addition to theircore business of accounting, auditing, and taxservices. The accounting profession is structuredin India as partnership with few partners orproprietorship concerns. The Indian accountingsector mainly comprises small and mediumenterprises (SMEs), matching the existing economicstructure of India. The number of charteredaccountancy firms with five or more partners is about2000 out of more than 13000 firms. The remainingare practicing as proprietary firms or in theirindividual names. The Chartered AccountancyProfession in India has globally benchmarked itsqualification, training and standards (includingconvergence to global standards on IFRS) forincreased mobility and has entered into qualificationrecognition arrangements with accounting bodiesin UK, Australia, Canada and Ireland.
10.57 The cost and management accountingprofession in India has attained great maturity withthe quality of professional cost and managementaccounting services being on par with the best in
the world. However, there is limited use of cost auditand cost management techniques in India. Scientificuse of management accounting tools on a widerscale can bring about higher cost efficiency inoperations and take the Indian accounting industryto greater heights.
10.58 There is need to tap outsourcing in nicheareas like actuarial and accountancy services asthere is good scope for outsourcing actuarial servicesand accountancy services to India including settingup back offices. But Indian service providers needhigh-quality training in tax laws of US and othercountries besides laws related to insurance, pension,etc. Tie-ups to overcome the weakness of small sizeof domestic accountancy firms can also help India’saccounting sector grow manifold.
R & D
10.59 As per the Department of Science andTechnology estimates, the national investment onR&D activities was ` 37,777.9 crore in 2007-08.Though India, with a R&D share of 0.8 per cent inthe GDP in 2007-08, is ahead of other developingcountries like Mexico, Malaysia, and Chile, it lagsbehind countries like South Korea (3.5 per cent),Russia (1.1 per cent ), China (1.5 per cent), andBrazil (1per cent)
10.60 A cross-country comparison of expenditureon R&D by sectors shows the dominance of thebusiness enterprises sector in other countries. Inthe US and China, the business enterprises sectoraccounted for as much as 72 per cent of total R&Dexpenditure in 2007 and in the UK, this figure was64 per cent. In India, while the Government sectorcontinues to account for a leading share, an
Table 10.12 : R&D Expenditure by Sectors : A Cross-country Comparison
(per cent)
2002 2007Country Business Govt Higher Pvt. Business Govt. Higher Pvt.
important development has been the rising share ofthe business enterprises sector from 19 per cent in2002 to almost 30 per cent in 2007 (Table 10.12)
10.61 As per estimates in 2009-10, the sectorswhich attracted largest R&D expenditures includepharmaceuticals, electrical and non electricalmachinery, transport equipment, electronics, andplastics. R&D intensity (R&D as per cent of sales)for the pharmaceuticals sector was much higherthan that for other sectors.
10.62 There is huge potential for R & D services,particularly in healthcare, biotech and electronics.However, there are issues related to intellectualproperty rights (IPRs) in the sector. India hasamended the IPR laws in the past two decades andits laws are fully compliant with WTO regulations.There is an impartial judicial process in India whichimplements the laws. The Government has takenmany measures to encourage R&D like enhancingthe weighted deduction on expenditure incurred onin-house R&D from 150 per cent to 200 per centfor the manufacturing business and from 125 percent to 175 per cent for payments made to nationallaboratories, research associations, colleges,universities, and other institutions for scientificresearch, and allowing a 125 per cent weighteddeduction for approved associations engaged inresearch in social sciences or statistical research,besides exemptions in the income from approvedresearch associations in the Budget 2010-11.Equipped with these incentives, the private sectorshould take a cue from other countries and step upits R&D investments.
Legal Services
10.63 The legal systems in India, the USA, and inthe UK are rooted in British common law, thusmaking Indian lawyers competent, without muchadditional training, to undertake standard legal worksuch as vetting of contracts, patent registrations, orreviewing of documents. India has an estimated600,000 legal practitioners and is next only to USAin terms of numbers. According to industry sources,Indian commercial law practice is approximately ofthe order of ` 600 crore to ` 650 crore per annumin revenues. The service providers are individuallawyers and small or family-based firms. In India,the practice of law is governed by the AdvocatesAct of 1961. Under this Act, foreign law firms arenot allowed to engage in practice of law in India.Many foreign legal firms have set up liaison offices(currently permitted under the law), while a few have
established referral relationships with Indian firms.
10.64 India has over 750 law colleges and about30,000 lawyers graduating every year. The BarCouncil of India, which lays down the standards ofprofessional conduct and etiquette, as alsostandards for legal education, has been constitutedunder the Advocates Act 1961. In addition, thereare also State Bar Councils that enrol advocatesand enforce discipline. Government has constitutedthe National Legal Services Authority, under the LegalServices Authorities Act 1987 to monitor andevaluate implementation of legal aid programmesand lay down policies and principles for makinglegal services available under the Act. The NationalLitigation Policy has also been launched with theobjective of reducing Government litigation in courtsso that court time can be used for resolving otherpending cases and average pendency time reducedfrom 15 years to three years, a goal set by theNational Legal Mission.
10.65 India is ranked 41st, with a score of 4.8, interms of judicial independence, according to theGlobal Competitiveness Report (2010-11) of theWorld Economic Forum. As regards efficiency ofthe legal framework in settling disputes, India isranked 47th, with a score of 4.1. India rises to 37th
position when it comes to the efficiency of the legalframework in challenging regulations, with a scoreof 4.2.
10.66 Over the years, the legal system in Indiahas undergone changes with the increasingglobalization of the Indian economy. This hasenabled transformation of Indian lawyers into globalservice providers. Trans-border mergers, corporaterestructuring, acquisitions, IPRs are some of theareas in which Indian lawyers have acquiredexpertise. Since liberalization, Indian lawyers havebeen gaining dynamic experience in handling casesspanning fields such as banking, telecom,insurance, power, civil aviation, and transportation,which were earlier largely under the purview of thepublic sector. In addition, they have acquiredexperience in areas related to taxation, mergers andacquisitions, joint ventures, IPRs, FDI, and specialeconomic zones. The conclusion of The TradeRelated Intellectual Property Rights (TRIPS)Agreement and Information Technology Agreementhas brought the necessary experience in newerdimensions of patent services, analysis andprosecution support and internet-based disputes andcyber crimes.
255Services Sector
Website: http://indiabudget.nic.in
10.67 India’s prominence in the legal process off-shoring (LPO) segment is being widelyacknowledged in the global market. Potential existsfor India to tap a significant share of world LPObusiness. India holds significant advantage invarious parameters that work in favour of drivingthe LPO industry towards India. Off-shoring legalwork to India saves about 80 per cent of the costthat may be incurred in a developed country likeUSA. It is estimated that the cost of employing afresh law graduate in the USA would be US $150,000 per annum as compared to US $ 15,000per annum in India. On per hour basis, this worksout to US $ 600 in the USA as compared to US $ 70in India. Establishment cost to set up a legal firm inIndia is also low as compared to the USA or Europe.According to estimates, India is 40 times more cost-effective than in the USA in this regard.
Consultancy
10.68 Consultancy is essentially a knowledge-based profession with an underlying developmentalrole spanning a wide range of sectors. Not only doconsultancy services play an important role in thedevelopment of the economy, but such consultancyexports enhance the visibility of Indian technicalexpertise abroad and boost the external sector inmultiple ways, including foreign exchange revenues,promotion of export of technology and merchandise(especially capital goods and raw materials), andtraining of personnel, while contributing significantlyto national development in the host country.Revenues of Indian consulting industry are estimatedat US$ 4.41 billion in 2007. Though the consultingprofession contributed only 0.44 per cent to theGDP in 2007, growth rates of the industry havebeen extremely promising over the last few yearswith a CAGR of about 73.68 per cent between 2002and 2007. The Asia Pacific (APAC) consultingindustry generated revenues worth US$33.5 billionin the year 2008 with India’s contribution at US$1.81billion, i.e. a share of 5.4 per cent of the total APACmarket.
10.69 The consultancy services market can bebroadly categorized into management consultancyand engineering consultancy. Some of thecommonly provided services across both fields ofconsultancy include detailed project reports, impactstudies, evaluation/ assessment studies, advisoryservices, design and detailed engineering.Consulting services in India are being provided bya host of entities, the major categories beingindividual consultants, consulting firms, R&D
organizations, academic institutes, and professionalbodies. Consulting firms are the dominant players(64 per cent) followed by individual consultants (22per cent), R & D organizations (10 per cent),academic institutes (3 per cent), and professionalbodies (1 per cent). The client sectors to whichconsulting services are provided include agriculture,banking and financial services, chemicals,education, energy, entertainment, environment,governance, public administration and policy,hospitality, infrastructure, manufacturing, real estate,retail, information technology, telecommunications,transport, and utilities.
10.70 The Indian management consultancy marketis one which is still in its nascent stage, with highgrowth and large entry of players being the keycharacteristics. Although it is still relatively small inrevenue size as compared to the global managementconsultancy market, standing at US$ 1.5 billion inthe year 2006-07, the Indian managementconsultancy industry has shown high growth partlydue to the low base from which it picked up. Growthin management consultancy exports was also highwith exports amounting to US$7.3 billion in the year2006-07.
10.71 The Indian engineering consultancy marketis experiencing a boom, with many large-scaledevelopment projects driving its growth. It is a moredeveloped market as compared to the managementconsultancy market. Although it is still relatively smallin revenue size as compared to the globalengineering consultancy market standing at US$2.91 billion in the year 2006-07, the Indianengineering consultancy industry has shown asteady growth over the last few years.
10.72 Over the past decade, India has emergedas one of the fastest growing consultancy marketsworldwide. This is largely attributable to increasedinvestment activities due to liberalization of FDIrestrictions, entry of many new players into theIndian market, high growth in most key sectors,and India being an emerging economy and a low-cost sourcing destination.
Construction
10.73 The construction industry in India is animportant indicator of development as it createsinvestment opportunities across various relatedsectors. The construction industry has contributedan estimated ` 3,84,282 crore (at constant prices)to national GDP in 2010-11 (a share of around 8per cent). The industry is fragmented, with a handful
256 Economic Survey 2010-11
Website: http://indiabudget.nic.in
of major companies involved in construction activitiesacross all segments; medium sized companiesspecializing in niche activities; and small andmedium contractors who actually work onsubcontract basis and carry out the work in thefield. The sector is labour intensive and, includingindirect jobs, provides employment to more than 35million people.
10.74 Creation of physical assets is an importantoutcome of construction activity. Prior toliberalization, the sector was dependent onGovernment spending on infrastructure as alsoconstruction activity undertaken by the private sectorfor housing complexes. The sector was givenindustry status in the year 2000. Since then, thereare more initiatives by the Government to undertakeprojects on PPP basis. These initiatives haveresulted in more private ownership of build-operate-transfer (BOT), build-operate-own-transfer (BOOT),and build-operate-lease-transfer (BOLT) projects.FDI is allowed upto 100 per cent under the automaticroute in townships, housing, built-up infrastructure,and construction of development projects (whichinclude housing, commercial premises, educationalinstitutions, and recreational facilities).
10.75 The construction sector has major linkageswith the building materials industry since theyaccount for sizeable share of the construction costs(approximately 40 per cent to 50 per cent). Theconstruction component, on an average, accountsfor more than half of the investment required forsetting up critical infrastructure like power projects,ports, railways, roads, and bridges. The sectortherefore is critical for enhancing the productivecapacity of the overall economy. With plans toenhance infrastructure investment to US $ 1 trillion,the construction sector is all set to become one ofthe growth engines of the Indian economy in theforeseeable future.
10.76 Construction services have been broughtunder the ambit of services tax since the year 2004.However, certain infrastructure projects like dams,roads, bridges, railways, and airports and projectsawarded by Government/ local bodies are exemptfrom services tax. Construction service providershave been allowed to avail of Central value addedtax (CENVAT) credit on capital goods, inputs, andinput services since 2004. Moreover, excise dutyon supply of goods to deemed export projects isrefunded. The existing VAT Act provides fordeduction of subcontractor turnover based ondocumentary evidence.
10.77 Some initiatives that could be taken in theconstruction sector include using the standardcontract document for all domestic civil engineeringprojects, setting up consortiums to bid effectivelyfor international projects, and resolving the issue ofprecondition in most of the overseas tenders floatedby clients wherein equipment to be supplied by thecontracting company has necessarily to be sourcedfrom an approved list of suppliers from developedcountries. Another area that needs consideration isthe possibility of a double guarantee avoidancetreaty on the lines of the double taxation avoidancetreaty as overseas clients insist on bank guaranteesto be issued under the contract being routed througha local bank operating in the country of projectexecution which results in Indian contractingcompanies being called upon to pay the bankguarantee charges to Indian banks as also to thelocal overseas banks which issue the final endguarantees to the client, based on the counterguarantees from the Indian banks.
Some Social Services
10.78 Healthcare and education are the two majorsocial services (see chapter 12). Besides these two,some other social services like sports are gainingimportance in India.
Sports
10.79 Sports have always been seen as an integralpart of all round development of the humanpersonality. Apart from being a means ofentertainment and physical fitness, sports have alsoplayed a great role in national identity and bondingwith the international community. Organizing sportsevents is emerging as an important activity for inflowof tourists and generation of employment and isthereby contributing to national income.
10.80 Physical education, games, and sports havebeen receiving attention over successive Plans.However, it was only after India hosted the NinthAsian Games in 1982 that ‘sports’ became a subjectof policy. The National Sports Policy 1984 was thefirst move towards developing an organized andsystematic framework for the development andpromotion of sports in the country and it wassucceeded by the National Sports Policy 2001. Thepolicy envisages broad-basing of sports,upgradation and development of infrastructure,strengthening of scientific and coaching support,among others. The Sports Authority of India (SAI)was established in 1984 with the objective of spottingand nurturing talent at all levels, by providing the
257Services Sector
Website: http://indiabudget.nic.in
requisite infrastructure and equipment, coachingfacilities, scientific back-up, nutritious diet, andexposure to competition.
10.81 The 19th Commonwealth Games (CWG), amega sporting event held every four years, in which71 countries and territories participate, wereorganized successfully by India. The event hassignificantly contributed to employment generation,infrastructure development, tourism inflow, andgrowth in national income. The Sports Ministry hadundertaken a massive and unprecedented trainingprogramme for the top sportspersons of India, toprepare the Indian contingent for CWG 2010. AScheme for Preparation of Indian Athletes for CWG2010 was put in place for providing comprehensiveand intensive training and exposure to Indiansportspersons, both domestically and abroad. In thiseffort, 170 Indian and 30 foreign coaches and 78supporting technical personnel were involved. Thishas resulted in the best-ever performance by Indiain any major, multi-disciplinary sports event with ahaul of 101 medals (38 gold, 27 silver, and 36 bronze),which is more than double the medals India won atCWG, Melbourne, 2006. This achievement placedIndia second in medals tally after Australia and aheadof major sporting countries such as England,Canada, and South Africa.
CHALLENGES AND OUTLOOK
Outlook10.82 The outlook for the services sector whichhad slightly dimmed due to the fallout of the sub-prime crisis in the US and the global financial crisishas once again brightened. Recent businessperformance indicators of different service firms indifferent sub-sectors also support this healthyprognosis. Even during the crisis year, annualservices growth was around the 10 per cent mark,which it has maintained since 2005-06. This is incontrast to the overall GDP growth which fell to 6.8per cent in 2008-09 from 9.3 per cent in 2007-08.Thus the resilience of the services sector has greatlycontributed to the resilience of the economy.
Challenges
10.83 Given the myriad activities in services,supporting its growth will require careful anddifferentiated strategies. The opportunities in thisfast-growing, employment-oriented, FDI attractingsector, with vast export-potential are striking.However, the challenges are also many. One of thechallenges in this area is to retain India’scompetitiveness in those sectors where it hasalready made a mark such as IT & ITeS andTelecommunications. Their deeper and broader usein the domestic sectors would also have a dramaticpotential to increase the efficiency and productivityof other goods and services. The second challengelies in making inroads into some traditional areassuch as tourism and shipping where other countrieshave already established themselves, but where thepotential for India is nevertheless very high. Thethird challenge is in making forays into globallytraded services in still niche areas for India, suchas financial services, health care, education,accountancy, and other business services whereIndia has a large domestic market and has alsoshown recent signs of making a dent in theinternational market, but only a very small part ofthe full potential has been tapped. There are alsochallenges related to collecting better data anddeveloping a better coordinated strategy to pulltogether all the dispersed information. Regulatoryimprovements will also be important as manydomestic regulations and market access barrierscould come in the way of fully tapping this growth-accelerating sector. Since there are diverse sectorswithin services, the issues and policies cannot beseparated into watertight compartments. Addressingthese challenges and issues could furtherstrengthen the services sector which is the drivingforce for India to realize double-digit growth potential,both overall and at state level, while providing moreand better jobs. to help achieve more inclusive andbalanced growth.
Energy, Infrastructureand Communications CHAPTER
11
One of the major requirements for sustainable and inclusive economic growth is
an extensive and efficient infrastructure network. It is critical for the effective
functioning of the economy and industry. The key to global competitiveness of the
Indian economy lies in building a high class infrastructure. To accelerate the pace
of infrastructure development and reduce the infrastructure deficit, the Government
has initiated a host of projects and schemes to upgrade physical infrastructure in
all crucial sectors. Despite several challenges, the positive results of the Government’s
initiatives are showing in some sectors. However, required capacity addition in a
time-bound manner needs focused attention in other sectors.
11.2 The Planning Commission in its Mid-TermAppraisal of the Eleventh Five Year Plan has takenstock of total investment in infrastructure (electricity,roads and bridges, ports, airports, telecommuni-cations, railways, irrigation, water supply andsanitation, storage, and oil and gas pipelines) duringthe first two years (2007-08 and 2008-09) of the Plan.It has revised the estimates of total investment ininfrastructure during the Eleventh Plan period basedon the revised data available during the first two yearsof the Eleventh Plan and it is now estimated that itwould be ` 20,54,205 crore, which is comparablewith the initial investment planned. The contributionof the private sector during the first two years was34.32 per cent and 33.74 per cent respectively, higherthan the targeted 30 per cent. The investment ininfrastructure has reached 7.18 per cent of the grossdomestic product (GDP) in 2008-09 and this isexpected to increase to 8.37 per cent in the terminalyear of the Plan. Total investment in infrastructureduring the Eleventh Plan is, therefore, likely toincrease by 2.47 percentage points of the GDP ascompared to the Tenth Plan. During the first threeyears (2007-08 to 2009-10) actual expenditure inthe ten infrastructure sectors (including investmentin gas pipelines along with oil) is about ̀ 10,65,828crore as against the target of ̀ 9,81,119 crore.
OVERVIEW OFPERFORMANCE11.3 While the overall investment in infrastructureseems on target, the targets in some sectors havenot been achieved. During 2007-08 to 2009-10,capacity addition has been lower than the target inpower, roads (National Highways DevelopmentProject [NHDP]), new railway lines, and doublingof railway lines. The sub-sectors whereachievements have been above or close to targetare telecommunications, villages electrified underthe Rajiv Gandhi Grameen VidyutikaranYojana(RGGVY), railway lines electrification,railway gauge conversion, and new and renewal ofroads construction under the Pradhan Mantri GramSadak Yojana(PMGSY).
11.4 The Department of ProgrammeImplementation monitors the progress in Central-sector projects costing ̀ 150 crore and above on amonthly basis. The progress report of October 2010indicates that projects such as roads, power,railways, petroleum, telecom, coal, and steelconstitute about 92 per cent of the total 559monitored projects and overtime project delays havebeen creeping up. As on October 2010, out of the559 projects, 14 are ahead of schedule, 117 are on
Website: http://indiabudget.nic.in
259Energy, Infrastructure and Communications
Website: http://indiabudget.nic.in
schedule, and 293 are delayed. Of the balanceprojects, no dates have been fixed for commissioning.In the road transport and highways sector, 51projects have reported delay in the range of 1 to 36months. In the power sector, 20 projects havereported delays in the range of 1to18 months overthe completion schedule earlier targeted. In thepetroleum sector, 16 projects have reported delaysin the range of 1 to16 months.
11.5 There has been a steady decline in the timeand cost overruns of Central-sector projects costing` 150 crore and above and this can be attributed tocloser monitoring and system improvements by theMinistries concerned. An examination of costoverruns in the last twenty years as against originally
approved costs shows that the former declined from61.6 per cent in March 1991 to 12.06 per cent inMarch 2008. There is, however, an upward trendfrom March 2008 as cost overruns reached 14.72per cent in March 2010 and further climbed to 20.7per cent in October 2010. The rise is partly due toexclusion of projects costing less than ̀ 150 crorefrom the monitoring system as these had lower costoverruns compared to the bigger projects. Theincrease is also partly dueto steep rise in prices ofsteel and cement in 2006-07.
11.6 During April-November 2010, the performanceof core industries and infrastructure services hasbeen mixed. The switching capacity addition andcellphone connections in the telecommunications
Table 11.1 : Growth in core industries and infrastructure services (in per cent)
Sl. Sector 2006-07 2007-08 2008-09 2009-10 2010-11No. (April-Nov.)
1 Power 7.3 6.3 2.5 6.8 4.6
2 Coal 5.9 6.0 8.2 8.0 0.6
3 Finished Steel 12.2 6.8 13.2 3.2 6.7
4 Railway Revenue Earning
Freight Traffic 9.2 9.0 4.9 6.6 3.3
5 Cargo Handled at Major Ports 9.5 12.0 2.2 5.7 0.8
6 Telecommunications:
a) Addition in Switching Capacity -23.0 -25.4 101.0 -3.6 39.7
b) Telephone Connections -19.6 83.7 - -
c) Cellphone Connections 85.4 38.3 80.9 47.3 27.1
7 Fertilizers 3.3 -8.6 -2.6 13.2 0.0
8 Cement 9.4 7.8 7.6 10.1 4.1
9 Petroleum:
a) Crude Oil 5.6 0.4 -1.8 0.5 11.5
b) Refinery 12.6 6.5 3.0 -0.4 0.8
c) Natural Gas -1.4 2.1 1.4 44.8 19.8
10 Civil Aviation:
a) Export Cargo Handled 3.6 7.5 3.4 10.4 17.7
b) Import Cargo Handled 19.4 19.7 -5.7 7.9 26.1
c) Passengers Handled at Inter- national Terminals 12.1 11.9 3.8 5.7 12.7
d) Passengers Handled at DomesticTerminals 34.0 20.6 -12.1 14.5 15.9
11 Roads:*
Upgradation of Highways
i) NHAI -12.5 164.6 30.9 21.4 -32.2
ii) NH(O) & BRDB -10.5 12.5 17.3 4.0 -0.2Notes: * Includes widening to four lanes and two lanes and strengthening of existing weak pavement only.NHAI—National Highways Authority of India. BRDB- Border Road Development Board.
Source: Ministry of Statistics and Programme Implementation (MOSPI).
260 Economic Survey 2010-11
Website: http://indiabudget.nic.in
sector have increased by 39.7 per cent and 27 percent respectively. Crude oil production has increasedby 11.5 per cent and natural gas production by19.8 per cent. The civil aviation sector has alsoperformed comparatively better than the previousyear both in terms of cargo and passengers handled.The power and cement sectors have grown atcomparatively lower rates. Coal-sector growth hasbeen very low at 0.6 per cent as compared to theprevious year's 8 per cent. Lower coal-sector outputhas impacted thermal power generation this year.Fertilizer production has also not seen any rise asagainst the previous year's 13.2 per cent growth(Table 11.1).
POWER
Generation
11.7 Electricity generation by power utilitiesduring 2010-11 has been targeted to go up by 7.7per cent to 830.757 billion KWh. The growth in powergeneration during April-December 2010 was about4.5 per cent as compared to about 6.17 per centduring April-December 2009, with nuclear, hydro,and thermal power generation registering growth of33 per cent, 8 per cent and 3 per cent respectively(Table 11.2). Good monsoon and improved availabilityof water moderated demand as well as supply ofpower. On the one hand the agricultural requirementof power reduced; on the other hand, there weresome developments adversely affecting growth inthermal generation. Some thermal units had to beput under reserve shut down. Scheduling ofgeneration from costlier liquid fuel and gas basedplants was also affected. Commissioning ofstabilization of some of the new thermal powerstations, unscheduled/ extended plannedmaintenance of some of the thermal units, shortage
of domestic /imported coal also affected the thermalgeneration.
11.8 In the thermal category, growth in generationfrom coal, lignite and gas-based stations was of theorder of 2.77 per cent, 4.75 per cent and 6.71 percent respectively. The overall plant load factor (PLF),a measure of efficency, of thermal power stationsduring April-December 2010, though less than thatachieved during April-December 2009, exceeded thetarget of 71.35 per cent for the first three quarters ofthe current financial year (Table 11.3).
Table 11.2 : Power Generation by Utilities (Billion KWh)
Power Generation 723.8 771.551 571.573 597.290 4.50
Hydroelectric* 113.0 106.680 83.360 90.145 8.14
Thermal 590.0 640.876 469.694 483.932 3.03
Nuclear 14.8 18.636 13.408 17.849 33.12
Bhutan Import 5.9 5.358 5.111 5.364 4.96
Note: *Excludes generation from hydro stations up to 25 MW.
Source: Ministry of Power;
Table 11.3 : Thermal power generationduring April-December 2010
Components Generation Growth PLF (in per cent)(Billion (%) Apr.- Apr.-
KWh) Dec. Dec.2009 2010
Coal 387.912 2.77 76.46 73.23
Lignite 18.808 4.75 74.40 70.68
Gas Turbine 75.139 6.71 66.03 66.03
Multi-fuel 0 0 - 0
Diesel 2.072 (-)30.62 - -
Thermal Total 483.932 3.03 76.17 72.86
Source: Ministry of Power.
11.9 The sector-wise and region-wise break-up ofthe PLF from 2007-08 to 2010-11 (April-December)shows the continuity and change over time as wellas regional variation (Table.11.4). Out of the totalinstalled generation capacity in the country, about11 per cent is based on gas or liquid fuel (excludingdiesel). The commencement of production of gasfrom D-6 fields of the KG (Krishna-Godavari) basinsince April 2009 has improved gas availability forelectricity generation.
261Energy, Infrastructure and Communications
Website: http://indiabudget.nic.in
Box 11.1 : Power Sector Reforms
Taking Stock : Electricity reform in India started in the early 1990s, prompted by the rising losses of State ElectricityBoards (SEBs) and their inability to meet demand. It followed worldwide reforms that began in the United Kingdom,Norway, Canada, and the USA and were later adopted in Latin America as well. In developed countries, sweeping reformsfocused on restructuring vertically integrated cost-of-service monopolies and introducing wholesale competition, whiledeveloping countries focused on their need to accelerate power generation investment. In India, reforms have made majorprogress in the following areas:
entry by private independent power producers (IPP); corporatization of state-owned enterprises; unbundling of generation,transmission, and distribution (T&D)
a national enabling legislation (Electricity Act 2003); independent power regulation at national level (CERC) and inStates
bulk transmission improvements (for example Powergrid), with wholesale electricity markets emerging in inter-Statetrading and merchant power sales (as an alternative to long-term power purchase agreements in cost-of-supplymemorandums of understanding [MOUs]with States) and spot and futures markets
Some, limited, private entry into distribution (for example Orissa, Delhi,), and splitting up of some State electricitydistribution companies into discoms (distribution companies); and
Central incentives (APDRP, accelerated power development, and reform programme) to support the implementation ofelectricity reform in States including accelerated metering and reducing high unaccounted-for T&D losses.
A composite reform index (although it does not assess quality), ranks India among the top reformers worldwide---comparable to Latin America (for example Chile, Brazil), better than East Asia (for example China, Indonesia, Thailand)and a step behind the most advanced (for example France, the UK, some US states). Among States in India itself, thereremain significant variations. The highest ranked include most of the larger states, i.e. Andhra Pradesh, Gujarat, Haryana,Madhya Pradesh, Maharashtra, and West Bengal (as evident in their utilization of APDRP incentives), apart from Orissaand Delhi, two States with private distribution (with mixed impacts). With expected lags and some temporary reversals,outcomes are now beginning to emerge : accelerated power generation investments and competition; switch to tariff-basedawards for new power projects; more efficient fuel sourcing (offshore natural gas, imported coal); rapid development of anational grid (with four out of five regions synchronized and the fifth--southern--interconnected), with greater reliability;and increased wheeling of electricity generated with emergence of a national bulk market with open access to States andwholesale trading.
Future Directions : Nevertheless, reform remains incomplete. And performance lags behind accelerating demand, especiallygiven the massive future investment requirements and the critical role of the power sector in sustaining growth:
economic growth and higher incomes are fuelling rapid demand growth (6 per cent a year) and rising unmet demand(peak deficits of 12-13 per cent);
unreliable services are hampering agriculture and industry and penalizing households with large welfare losses; progresson connecting rural households and habitations as yet unconnected to grid-based electricity supply is also slow;
very high unmetered and unaccounted-for sales (35 per cent), among the highest in the world, is draining publicrevenues, forcing larger price increase requirements, and causing massive losses (combined annual losses of the SEBs areabout 1 per cent of the GDP);
electricity tariffs don't match economic values (extensive subsidies, cross-subsidies) because of political economyreasons, hampering efficient use of scarce public resource (for example excessive mining of ground-water) and deterringefficient supply;
competition in many critical segments of the industry, especially distribution, is inadequate or incomplete and remainsunder threat (including peak price escalation), while existing monopolies of State-owned distribution continue tounderperform (unmetered sales, leakages, outages, lack of transparency in financial accounts and performancemanagement).
Reforms are now essential in three directions:
(1) Strengthening Regulation : Worldwide, and in India, electricity reform is technically challenging and politicallyconstrained. The States have a crucial role in implementing further reform and the Centre in setting out a broaderframework. Political economy conflicts are often complicated, with multiple actors and interests:SEBs, generation,transmission and distribution companies, wholesale and retail actors, and a variety of consumers--the farm sector,urban households, and industry. In this setting, and given substantial 'natural' monopolies in parts of the chain, thestrong role of independent regulators is crucial: to balance these interests, promote competition, and enhance theworking of the market. Worldwide evidence suggests that electricity reform works only in the presence of strong,independent regulators, insulated from political and commercial pressures. For example, regulators will need to ensureadequate competition and act on uncompetitive behaviour in wholesale trade, including capping wholesale tariffs andinvestigating competition.
262 Economic Survey 2010-11
Website: http://indiabudget.nic.in
(2) Improving Distribution and Opening Bulk Supply to Competition : The next step is to introduce competition andopen access at bulk level. Most power distribution is still the monopoly of SEBs, with mounting losses and poor services.Three different models of restructuring are possible, with States adopting whichever model works best and setting-upsurrogate competition amongst these modes: (a) public private partnership (PPP) mode with open access. Long-termconcessions granted to private distribution companies, incorporating high investment requirements, performance standards,tariffs subject to regulation, and permitting bulk consumers open access to networks (similar to telecom). (b) Distributionfranchisee mode. Competitive bidding to select franchisee operators, where ownership of assets remains with statediscoms and licencee supplies bulk electricity to franchisee at predetermined prices, franchisee retains predefined portionof revenues and pays discoms annual rate bids, T&D losses are monetized and borne by discoms with incentives to lowerthem and tariffs remain the same as in larger licensing area. (c) Performance-based State electricity discoms. Withmanagement independence and overhaul, and strict commercial performance standards, some stronger state discomscould potentially provide competitive services, with bulk consumers again permitted open access to networks.
(3) Revising Tariffs to More Economic Levels : The previous two steps will not be enough without a strong politicaleconomy decision by all States to revise electricity tariffs to economic levels and reduce subsidies and cross-subsidies.India currently has some of the lowest and most uneconomic average electricity tariffs in the world--8 cents/kwh at retaillevel, compared to about 12-15 cents/kwh in countries much better-endowed with coal or gas energy (Canada, SouthAfrica, the USA), and 19-20 cents/kwh elsewhere (much of Europe, developing countries). The current tariffs levels areunsustainable, cannot elicit needed investments, drain resources, and are not targeted at the poor. Instead, lifelinemetering and supply measures with explicit subsidies that are more carefully targeted are possible. Consumers preferreliable supplies over subsidized and unreliable supplies. The evidence in India itself clearly suggests that better performingStates have more economic pricing (till they reach a threshold level) and lower cross-price subsidies and distortions intariffs (with industrial supply price ratio to domestic tariffs rationalized). Better tariff setting thus goes hand-in-handwith better performance.
Source: Economic Division, Department of Economic Affairs (DEA), estimates.
Bibliography: (1) Gajendra Haldea, 2010. Infrastructure at Cross-roads; (2) Rahul Tongia, 2003. The Political Economyof Indian Power Sector Reforms, Working Paper No. 4, Stanford. (3) Himachal Power Engineers' Association, 2008.Power Sector Reforms: Reorganisation & Restructuring of SEBs, Issues, Concerns and Some Suggestions. (4) KeyaGhosh, 2009. Electricity Reforms in West Bengal, CUTs Calcutta Resource Centre.
0
200
400
600
Dom
esti
c el
ectr
icit
yta
riff
(pa
isa/
kwh)
State level electricity reform anddomestic tariffs, 2008
0 1 2 3 4 5 6 7
100
300
500
700
State Electricity Reform Index
Rat
io o
f in
dust
rial
to
dom
esti
c ta
riff
State level electricity reform andratio of industrial to domestic tariffs, 2008
0 1 2 3 4 5 6 7
State Level Reform Index
0
1.0
2.0
3.0
0.5
1.5
2.5
3.5
Power deficit
11.10 The deficit in power supply in terms of peakavailability and total energy availability rose steadilyfrom 2003-04 to 2007-08, a period of high growth inpeak demand and total energy requirement. Despitemodest growth in electricity generation, the peakdeficit came down significantly in 2008-09 onaccount of a slowdown in growth of peak demand.During April-December 2010, the peak and totalenergy deficits came down to 10.2 per cent and 8.8per cent respectively from 12.6 per cent and 9.8 per
cent during the corresponding period in the previousyear, mainly due to growth of availability of powerexceeding the growth in its requirement.
Capacity addition
11.11 The Eleventh Plan envisaged capacityaddition of 78,700 MW in the power sector, of which19.9 per cent was hydro, 75.8 per cent thermal,and the rest nuclear power. This has been revisedto 62,374 MW now comprising 8237MW hydro,50,757 MW thermal, and 3380 MW nuclear power.
263Energy, Infrastructure and Communications
Website: http://indiabudget.nic.in
Capacity addition of 32,032 MW has been achievedtill 31 December 2010 and projects with a capacityof 30,725 MW are under construction forcommissioning during the remaining period ofEleventh Plan.
11.12 Against the revised target of 12,039 MW,capacity addition of 9,263 MW was achieved during2007-08. On account of revision in the definition ofcommissioning of thermal projects, the capacityaddition target for the year 2008-09 was revised to7,530 MW, against which a capacity of 3,454 MWwas added. The capacity addition target for the year2009-10 was 14,507 MW, against which a capacityof 9585 MW was added up to 31 March 2010. In thecurrent fiscal, 9730.5 MW has been added till 31December 2010 which is higher than the highestever capacity addition of 9585 MW in a single year,i.e 2009-10 (Table11.5).
11.13 The main reasons for underachievement ofcapacity addition targets were delayed and non-sequential supply of material by suppliers, shortageof skilled manpower for construction andcommissioning of projects, contractual disputes
between project authorities, contractors and theirsub-vendors, delay in readiness of balance of plantsby the executing agencies, design problems inCFBC boilers, and shortage of fuel.
Ultra Mega Power Projects (UMPPs)Initiative
11.14 The Ministry of Power had launched aninitiative for development of coal-based super criticalUMPPs each of about 4000 MW capacity underCase II bidding route. Four UMPPs, i.e Sasan inMadhya Pradesh, Mundra in Gujarat,Krishnapatnam in Andhra Pradesh, and Tilaiya inJharkhand have already been transferred to theidentified developers and are at different stages ofimplementation. Two units of 800 MW each of theMundra UMPP are expected to be commissionedin the Eleventh Five Year Plan.
Development of hydropower
11.15 As per the reassessment study carried outby the Central Electricity Authority(CEA), theidentified hydroelectric potential of the country(having installed capacity above 25 MW) is 1,45,320MW. As of now, 172 schemes with installed capacityof 37,367 MW are under operation, 46 (installedcapacity 13,785 MW) are under construction, 31(installed capacity 16,087 MW) have been approvedby the CEA, detailed project reports (DPRs) of 44(installed capacity 15,441 MW) have been preparedand are under various stages of examination, and108 schemes (installed capacity 41,945 MW) areunder survey and investigation. The hydro capacityaddition of 15,627 MW planned for the Eleventh FiveYear Plan has been revised to 8237 MW in the Mid-Term Appraisal (MTA) of the Eleventh Plan. Of this,3,921 MW has been added till 31December 2010.
11.16 The main reasons for slow development ofhydro-power include difficult and inaccessiblepotential sites, difficulties in land acquisition,rehabilitation, environmental and forest-related
Table 11.5 : Capacity Addition Target (original) and Achievement during April – December 2010(MW)
Sector Thermal Hydro Nuclear Total
Target Actual Target Actual Target Actual Target Actual
issues, inter-State issues, geological surprises, andcontractual issues. A multi-pronged strategy hasbeen adopted to harness the hydro potentialresources in the country. Some of the policymeasures and initiatives taken by the Governmentare finalization of an investor-friendly New HydroPolicy 2008 and the liberal National Rehabilitationand Resettlement Policy, 50,000 MW HydroelectricInitiative, and Mega Power Project Policy. The salientfeatures of the New Hydro Policy 2008 are a levelplaying field for private hydro projects; exemptionfrom tariff-based competitive bidding up to January2011 to private hydro projects; private developers tohave the facility of merchant sale of up to 40 percent of saleable energy; an additional 1 per centfree power over and above 12 per cent to beearmarked for a Local Area Development Fund; eachproject-affected family (PAF) to get free 100 units ofelectricity every month for a period of 10 years aftercommissioning of the project; and project authoritiesto bear the 10 per cent of the State contributionunder the Rajiv Gandhi Grameen VidyutikaranYojana (RGGVY) for electrification of the affectedarea.
TRANSMISSION, TRADING, ACCESS,AND EXCHANGE
National Grid11.17 An integrated power transmission grid helpseven out supply-demand mismatches. The existinginter-regional transmission capacity of about 22,400MW connects the northern, western, eastern, andnorth-eastern regions in synchronous modeoperating at the same frequency and the southernregion in asynchronous mode. This has enabledinter-regional energy exchanges of about 38,000million units in financial year 2010-11 (till November2010), thus contributing to greater utilization ofgeneration capacity and an improved power supplyposition. Proposals are under way to havesynchronous integration of the southern region withthe rest.
Open access
11.18 The regulations on open access in inter-Statetransmission and on inter-State trading are issuedby the Central Electricity Regulatory Commission(CERC). The responsibility for introduction of openaccess at distribution level rests with the StateElectricity Regulatory Commissions (SERCs).
11.19 Open access in inter-State transmission isfully operational. During financial year 2009-10, the
total number of transactions under open access atinter-State level was 18,128. The CentralTransmission Unit (CTU) has received 225applications from private developers for long- termopen access amounting to 1,62,898 MW. At Statelevel, as per information available with the Forum ofRegulators Secretariat, 24 SERCs have notifiedterms and conditions of open access regulations,20 have determined cross-subsidy surcharge, 25have allowed open access up to 1 MW, 22 havedetermined transmission charges, and 18 havedetermined wheeling charges. In addition, the PowerSystem Operation Corporation Limited (POSOCO),has been operationalized by the Government of Indiawith effect from 1 October 2010 to manage loaddispatch functions earlier being managed by theCTU, i.e. the power grid.
Trading of Electricity
11.20 Power trading helps in resource optimizationby facilitating the disposal of surplus power withdistribution utilities and in meeting the short-termdemand. The Central and State ElectricityRegulatory Commissions have powers to grant inter-State and intra-State trading licences respectively.The CERC has so far granted 47 inter-State tradinglicences, of which 38 were in existence as on31 December 2010. Details of electricity trading bylicensed inter-State traders, in terms of volume,price, and margin are given in Table 11.6.
Power Exchange
11.21 The CERC has issued power marketregulations that focus on the creation of an overallpower market structure, the role of power exchangetraders, and also provide for market oversight andsurveillance. The two power exchanges, namely theIndian Energy Exchange Ltd. (IEX), New Delhi, andPower Exchange India Ltd. (PXIL), Mumbai, alreadyin operation from 27June 2008 and 22 October 2008respectively have been deemed to be registeredunder these regulations. The price of electricitytraded through the exchanges was high during theinitial months of the current financial year but itshowed a declining trend over the year. The weightedaverage price of power traded through the IEX in themonths of November and December 2010 was` 1.99 per kWh and ̀ 2.36 per kWh respectively. Inaddition to transactions in the day ahead market(collective transactions), power exchanges havebeen undertaking transactions in the term aheadmarket (i.e. transactions through intra-day contracts,
265Energy, Infrastructure and Communications
Website: http://indiabudget.nic.in
day ahead contingency contracts, and weeklycontracts) since September 2009. The volume ofelectricity transacted in the term ahead market ofthe two power exchanges, i.e. IEX and PXIL, duringApril-October 2010 has been 486.47 MUs and656.71 MUs respectively.
Promotion of Green Power
11.22 The CERC has amended the Terms andConditions for Tariff Determination from RenewableEnergy Sources Regulations 2010 for increasing thevisibility of the generic tariff determined for solar photovoltaic (PV) and solar thermal projects. The capitalcost and other norms applicable for the year 2010-11 shall also apply for solar PV projects during theyear 2011-12; for solar thermal projects during theyears 2011-12 and 2012-13, if the power purchaseagreements in respect of the solar PV and solarthermal projects are signed on or before 31 March2011; and the entire capacity covered by the powerpurchase agreements is commissioned on or before31 March 2012 in respect of solar PV projects andon or before 31 March 2013 in respect of solarthermal projects.
11.23 The CERC has also notified Terms andConditions for the recognition and issuance ofRenewable Energy Certificate for Renewable EnergyGeneration Regulations 2010 on 18 January 2010as well as their first amendment on 1 October 2010.These Regulations assume special importance infulfillment of the mandate to promote renewablesources of energy and development of a market inelectricity. The Renewable Energy Certificate (REC)framework is expected to give a push to renewableenergy capacity addition in the country.
11.24 The REC is a market-based instrument topromote renewable energy and facilitate renewable
purchase obligations (RPOs). It can make therenewable electricity market stable and predictableby maximizing the benefits of renewable generationwhile reducing costs. It could also be used by thoseStates that do not have substantial renewable energyresources to meet their RPOs. The CERC andSERCs created the necessary regulatory andinstitutional framework and rolled out the schemefrom November 2010. The REC mechanism setsthe way forward for encouraging competition andeventually mainstreaming renewable energy.
Aggregate Technical and Commercial(AT&C) losses and Restructured APDRP
11.25 The focus of the Re-structured AcceleratedPower Development Reforms Programme(R-APDRP) is on actual, demonstrable performancein terms of reduction in AT&C losses. Projects underthe scheme will be taken up in two parts in urbanareas--towns and cities with population of morethan 30,000(10,000 in case of special categoryStates).
11.26 Part-A of the Scheme shall include projectsfor the establishment of baseline data and InformationTechnology (IT) applications for energy accounting/auditing and IT-based consumer service centres.Preparation of baseline data for the project areacovering consumer indexing, GIS (geographicinformation system) mapping, metering ofdistribution transformers and feeders, and automaticdata logging for all distribution transformers andfeeders and SCADA(supervisory control and dataacquisition) / DMS (distribution managementsystem) system is only for big cities. It wouldinclude asset mapping of the entire distributionnetwork at and below 11 kV transformers andadoption of IT applications for meter reading, billing
Table 11.6 : Electricity trading
Period Volume of Weighted average Weighted average Tradingelectricity purchase price sale price margin
Note:* The prices have come down during the months of November and December 2010.
266 Economic Survey 2010-11
Website: http://indiabudget.nic.in
and collection, energy accounting and auditing,redressal of consumer grievances, andestablishment of IT-enabled consumer servicecentres. The baseline data will be verified by anindependent agency appointed by the Ministry ofPower.
11.27 Part B of the scheme will include regulardistribution strengthening projects. These includerenovation, modernization and strengthening of 11kV-level substations, transformers/transformercentres, re-conductoring of lines at 11kv and belowlevel, load bifurcation, load balancing, high voltagedistribution system (HVDS), and installation ofcapacitor banks and mobile service centres. Inexceptional cases, where the sub-transmissionsystem is weak, strengthening at 33 kV- or 66 kV-level may also be considered.
Rural Electrification
11.28 Under the RGGVY, 87,791 villages have beenelectrified and connections released to 135.31 lakhbelow poverty line(BPL) households up to 30November 2010. Under the Tenth Five Year Plan,235 projects covering 68,763 villages and 83.10 lakhBPL connections were sanctioned at a cost of `9,732.90 crore. In Phase I of the Eleventh Planperiod, 338 projects have been sanctioned forimplementation at a cost of ` 16,620.61 crore forelectrification of 49,736 villages and release ofconnections to 163.34 lakh BPL households. Till30 November 2010, 333 projects have been awardedand franchisees are in place in 1,10,567 villages in16 States.
Energy Conservation and efficiency
11.29 Several measures have been taken by theMinistry of Power and Bureau of Energy Efficiency(BEE) to promote energy conservation and itsefficient use targeting 5 per cent reduction in demandduring Eleventh Plan through schemes beingimplemented by BEE. The Ministry of Power hasalso launched an awareness programme whichincludes giving incentives for efficiency andconservation efforts by way of National EnergyConservation Awards, painting, debate and essaycompetitions for schoolchildren, and creatinggeneral awareness through the media on the needfor energy conservation.
11.30 The National Mission for Enhanced EnergyEfficiency (NMEEE) is one of the eight missionsunder the National Action Plan on Climate Change.It has been approved and will soon be implemented.
The objective of the Mission is to achieve growthwith ecological sustainability by devising cost-effective strategies for end-use demand-sidemanagement. The Ministry of Power and BEE havebeen entrusted with the tasks of preparing theimplementation plan for the NMEEE and upscalingthe efforts to create and sustain a market for energyefficiency and unlock investment of around ̀ 74,000crore. The Mission, by 2014-15, is likely to achieveabout 23 million tonnes oil-equivalent of fuel savingsin coal, gas, and petroleum products, along with anexpected avoided capacity addition of over 19,000MW. The carbon dioxide emission reduction isestimated to be 98.55 million tonnes annually.
PETROLEUM
Oil and gas production
11.31 Efficient and reliable energy supplies are aprecondition for accelerated growth of the Indianeconomy. While the energy needs of the country,especially oil and gas, are going to increase at arapid rate in the coming decades, the indigenousenergy resources are limited. Oil and gas constitutearound 45 per cent of total energy consumption. Atthe same time, the dependence on imports ofpetroleum and petroleum products continues to bearound 80 per cent of total oil consumption in thecountry.
11.32 During the current financial year (2010-11),production of crude oil is estimated at 37.96 millionmetric tonne (MMT), which is about 12.67 per centhigher than the crude oil production of 33.69 MMTduring 2009-10. The projected production for naturalgas, including coal bed methane (CBM), for 2010-11 is 53.59 billion cubic metres (BCM) which is 12.80per cent higher than the production of 47.51 BCM in2009-10. The increase in natural gas production isprimarily from the KG deepwater block.
Exploration of Domestic Oil and Gas
11.33 India has an estimated sedimentary area of3.14 million sq. km, comprising 26 sedimentarybasins. Prior to the adoption of the New ExplorationLicensing Policy (NELP), only 11 per cent of India'ssedimentary basin was under exploration. Sinceoperationalization of the NELP in 1999, theGovernment of India has awarded 47.3 per cent of itfor exploration. So far 87 oil and gas discoverieshave been made by private/joint venture (JV)companies in 26 blocks and more than 640 MMT ofoil-equivalent hydrocarbon reserves have been
267Energy, Infrastructure and Communications
Website: http://indiabudget.nic.in
added. As on 1 October 2010, investment made byIndian and foreign companies was of the order ofUS $ 14.8 billion, of which, US $ 7.5 billion was inhydrocarbon exploration and US$ 7.3 billion indevelopment of discoveries.
Offering of NELP Blocks under NELP IX
11.34 The ninth round of NELP (NELPIX) waslaunched on 15 October 2010 and 34 explorationblocks including 8 deepwater, 7 shallow water, 11on-land, and 8 Type-S on-land were offered. On-landblocks are spread over six States, namelyAssam(2), Gujarat(11), Madhya Pradesh(2),Rajasthan(2), Tripura(1), and Uttar Pradesh(1).
Domestic Exploration of Other GaseousFuel
Coal Bed Methane (CBM)
11.35 CBM is found embedded in coal seams. TheCBM policy has provided a level playing field forexploration and commercial exploitation of CBM bynational and international companies since the 2000.Total CBM resources in 26 blocks awarded so farare estimated at 1374 BCM. In the fourth round, theGovernment of India has awarded 7 CBM blocks inthe States of Assam, Chhattisgarh, Jharkhand,Madhya Pradesh, Orissa, and Tamil Nadu andsigned 33 contracts. Commercial production of CBMin India has now become a reality with current CBMgas production at about one lakh cu. mper day. TheCBM gas produced in the country is being utilizedby nearby industries in and around Raniganj blockin West Bengal.
Underground Coal Gasification (UCG)
11.36 The Oil and Natural Gas Commission(ONGC) has entered into an Agreement ofCollaboration (AOC-MOU) with the National MiningResearch Centre-Skochinsky Institute of Mining(NMRC-SIM) in Russia. In the selected Vastan mineblock, seismic survey was carried out and 18boreholes dril led for detailed UCG sitecharacterization. Based on geological, hydrological,and geo-mechanical data analysis, Vastan in Gujaratand Hodu Sindri in Rajasthan have been found suitablefor UCG stations. Pilot production of UCG at Vastanby the ONGC is expected to commence by the endof the Eleventh Five Year Plan period.
Gas Hydrate
11.37 Gas hydrate is at research and development(R&D) stage world over. A cooperation programme
between the Directorate General of Hydrocarbons(DGH) and U S Geological Survey (USGS), USA forexchange of scientific knowledge and technicalpersonnel in the field of gas hydrate and researchenergy is in progress. An MOU was recently signedin the area of marine gas hydrate research andtechnology development between the LeibnizInstitute of Marine Sciences, Germany, and DGHfor research on methane production from gas hydrateby carbon dioxide sequestration.
Shale Gas
11.38 Shale gas is being explored as an importantnew source of energy in the country. India has severalshale formations which seem to hold shale gas.The shale gas formations are spread over severalsedimentary basins such as Cambay, Gondwana,and KG on land and Cauvery river. The DGH hasinitiated steps to identify prospective areas for shalegas exploration and acquisition of additional geo-scientific data. An MOU has been signed with theUSA during the visit of President Obama to India inNovember 2010 for cooperation in the field of shalegas assessment and development.
Gas production from KG-D6 Basin
11.39 Gas production from KG-D6 began on 1 April2009. The current gas production from the KG-D6field is about 53 MMSCMD, of which about 45MMSCMD is being produced from D1 and D3 fieldsand about 8 MMSCMD from MA field. The approvedField Development Plan of D1 and D3 envisagesgas production to the tune of 80 MMSCMD from thethird year of commercial production, i.e. with effectfrom 2012-13.
Crude Oil Production from Rajasthan
11.40 Crude oil production by the Rajasthan CairnEnergy India Pvt. Ltd has started in block RJ-ON-90/1 with effect from 29 August 2009 at the initialproduction rate of 3500 barrels per day. Current crudeoil production from this block is about 1,25,000 bopd.The Government has designated Indian OilCorporation Limited (IOC), Mangalore Refinery andPetrochemicals Ltd (MRPL), and HindustanPetroleum Corporation Ltd (HPCL) for lifting part ofthe crude oil production from this block afterascertaining the capacity of receiving refineries ofthe nominees. The oil production from thisblock during 2009-10 was about 0.447 MMT andduring 2010-11, up to 30 November 2010 about3.12 MMT.
268 Economic Survey 2010-11
Website: http://indiabudget.nic.in
Development of Marginal Fields
11.41 Concerted efforts have been made to putnew and marginal fields in production through in-house resources as well as through servicecontracts. The ONGC has an inventory of 165marginal fields and 131 have either been monetizedor are under various stages of development throughin-house efforts. So far, 10 fields have been awardedon service contract.
Equity Oil and Gas from Abroad
11.42 In view of unfavourable demand-supplybalance of hydrocarbons in India, acquiring equityoil and gas assets overseas is one of the importantcomponents of enhancing energy security. TheGovernment is encouraging national oil companiesto aggressively pursue equity oil and gasopportunities overseas. Apart from ONGC VideshLimited (OVL) (40 projects in 15 countries), the otheroil public-sector undertakings (PSUs), namely IndianOil Corporation Limited (IOCL) (9 projects in 6countries), Oil India Limited (IOL) (12 projects in 8countries), Bharat Petroleum Corporation Limited(BPCL) (12 projects in 7 countries), GAIL (India)Limited (4 projects in 2 countries), and HindustanPetroleum Corporation Limited (HPCL) (2 projectsin 2 countries), have acquired overseas explorationacreages. The total investment by oil PSUs (OVL,OIL, GAIL, IOCL, BPCL, and HPCL) overseas ismore than US$ 13 billion (` 59,000 crore). OVLproduced about 8.87 MMTOE oil and oil-equivalentgas in 2009-10 from its overseas assets in Sudan,Vietnam, Venezuela, Russia, Syria, Colombia, andBrazil. The latest acquisition in May 2010 by OVL(along with OIL and IOCL) is 11 per cent participatinginterest of Carabobo-1 project in the hydrocarbon-rich Orinoco belt of Venezuela, with proposedinvestment of US$ 1.3 billion. The projectedproduction is 400,000 bopd and the first oil isexpected in 2013.
Import of Liquefied Natural Gas(LNG)
11.43 Petronet LNG Limited (PLL), promoted byONGC, GAIL, IOCL, and BPCL, was formed toimport LNG and set up an LNG regasification plantat Dahej. PLL signed a contract with RasGas, Qatar,in July 1999 for import of 7.5 million metric tonnesper annum (mmtpa) LNG for a period of 25 years.As per the contract, supply of 5 mmtpa commencedin 2004 and of the balance 2.5 mmtpa in January2010. In addition to these term contracts, LNG isalso being sourced from the spot market by PLL
and Hazira LNG Private Ltd. (HLPL). During 2009-10, about 8.91 mmtpa LNG was imported. This isequivalent to about 31 million standard cubic metreper day (mmscmd) of regasified LNG (RLNG). DuringApril-November 2010, 4.91 mmtpa of LNG has beenimported.
11.44 As part of the concerted efforts to augmentthe country's supply of LNG, PLL has tied up 1.44mmtpa for its Kochi LNG terminal from Exxon Mobilfrom its share in the Gorgon project, Australia, for20 years . The sale and purchase agreement (SPA)for it was executed in August 2009. In addition, GAILand PLL are exploring the possibility of import ofLNG from various potential suppliers.
11.45 In order to handle increased LNG imports,additional infrastructure is being created in thecountry. Capacity at PLL's Dahej LNG terminal hasbeen expanded to 10 mmtpa in July 2009. DabholLNG terminal is expected to be commissioned thisyear. The terminal will, however, become fullyoperational only after completion of breakwaterfacilities in 2012. PLL is setting up an LNG terminalat Kochi which is planned to be commissioned in2011-12.
Refining Capacity
11.46 There had been increase in domestic refinerycapacity by 19.46 per cent in 2009-10 to reach177.97 MMT from 148.97 MMT in 2008-09 and it isfurther expected to reach 185.40 MMT by 1 April2011 and 238.96 MMT by the end of 2011-12.Refinery production (crude throughput) during 2009-10 was160.03 MMT (excluding Jamnagar Refineryunder special economic zone [SEZ ]by RelianceIndustry Ltd) showing an increase of 16 per centover 2008-09. During April-November 2010 it was106.53 MMT.
Pipeline Network and City Gas DistributionNetwork
11.47 There has been substantial increase in thepipeline network in the country with current figuresof 28 product pipelines of 11,037 km length and 67.2MMT capacity. There are also 17 crude pipelines of7,425 km and additional LPG pipelines of over 2,000km. With increased availability of gas in the countrythe city gas distribution network has been enlargedto cover compressed natural gas (CNG) in 19 citiessupplying gas for domestic consumers, publictransport, and commercial/industrial entities. InVision-2015, provision of pressurized natural gas
269Energy, Infrastructure and Communications
Website: http://indiabudget.nic.in
(PNG) to more than 200 cities across the countryis envisaged.
Rajiv Gandhi Gramin LPG Vitaran Yojana(RGGLVY)
11.48 The 'Vision-2015' adopted for the liquefiedpetroleum gas (LPG) sector, inter-alia, focuses onraising the population coverage of LPG in rural areasand areas where coverage is low. The RGGLVY forsmall-size LPG distribution agencies was launchedon 16 October 2009. This scheme targets coverageof 75 per cent of the population by 2015 by releaseof 5.5 crore new LPG connections. Oil marketingcompanies (OMCs) have issued advertisements toset up 2329 LPG distributors in 22 States, namelyAndhra Pradesh, Arunachal Pradesh, Assam, Bihar,Chattisgarh, Gujarat, Himachal Pradesh, Jharkhand,Karnataka, Madhya Pradesh, Maharashtra, Manipur,Mizoram, Meghalaya, Nagaland, Orissa, Rajasthan,Tamil Nadu, Tripura, Uttar Pradesh, West Bengal,and Pondicherry. Out of this, 75 LPG distributorshave already been commissioned. Selection for therest of the locations is in progress as per policy.The price of administered pricing mechanism (APM)gas produced by ONGC and OIL has been increasedfrom June 2010 to the level of US$ 4.2/mmbtu, lessroyalty, which is equal to the price of gas producedby NELP operators.
Free LPG Connections to BPL Rural House-holds
11.49 A proposal for providing one-time financialassistance to BPL households for acquiring newLPG connections is under consideration of theGovernment. Under the proposed scheme, theGovernment and Oil Marketing Companies wouldprovide one-time assistance of ̀ 1400 for acquiringa new LPG connection to a BPL family. The schemewould cover all eligible households in the BPL list ofthe State Government/Union Territory. About 32-40lakh new LPG connections are to be releasedannually under this scheme.
11.50 The annual financial implication of thescheme is estimated to be ` 490 crore. Theproposed budgetary support has been restricted tothe extent of 50 per cent of the total funds required.The remaining 50 per cent would be partly drawnfrom the Corporate Social Responsibility Funds(CSRFs) of the six major oil companies, namelyONGC, IOCL, BPCL, HPCL, OIL, and GAIL andpartly borne by the three oil marketing companies(OMCs) namely IOCL, HPCL, and BPCL in the ratio
of LPG connections released to BPL householdsby each company. It is expected that the OMCswill incur ` 6.00 crore during the current financialyear.
Special Efforts for Energy Conservation
11.51 The Petroleum Conservation ResearchAssociation (PCRA) is a national government agencyengaged in promoting energy efficiency in varioussectors of the economy. It has been providingservices leading to improvement in energy utilizationin the industrial, transport, agriculture and domesticsectors of the economy. The PCRA conducts anumber of activities leading to energy conservationthrough a mix of direct and indirect services tovarious sectors of the economy. During 2010-11, atotal of 3420 field activities were carried out up toNovember 2010 against 5122 activities during2009-10.
Coal
11.52 More than 90 per cent of the coal productionin India is of non-coking coal. The production of rawcoal during April to November 2010 was 319.80 milliontonne (MT), against 317.79 MT in the same periodof the previous year. Coking coal production duringthis period was 28.72 MT against 25.64 MT duringthe same period last year, registering a growth of12.01 per cent. The growth rate in the production ofraw coal increased from 5.85 per cent during 2006-07 to 7.98 per cent in 2009-10, due to enhancedproduction by all the stakeholders, especially captiveblocks and large PSUs like Coal India Ltd. (CIL) andSingareni Collieries Company Ltd. (SCCL). The lowergrowth in production during the current year isprimarily due to environmental restrictions,particularly application of the comprehensiveenvironmental pollution index (CEPI), non-availabilityof forestry clearance against some of the projects,poor law and order situation in the States of Jharkhandand Orissa, and excessive rainfall in the westernparts of the Country. During 2009-10 the import andexport of coal was about 67.744 MT and 2.171 MTrespectively.
11.53 Under the scheme of e-auction, CIL andSCCL have been carrying out e-auction of coal.During 2009-10, CIL sold 56.28 MT and SCCL 1.29MT of coal through e-auction. During April-December 2010 CIL has offered 37.73MT and sold32.36MT of coal through e-auction, with an increaseof 81 per cent in the notified price. Similarly SCCLhas also offered 1.95MT and sold 1.66MT of coal
270 Economic Survey 2010-11
Website: http://indiabudget.nic.in
through e-auction, with a 48 per cent increase onnotified price up to December 2010.
11.54 The Government has formed a specialpurpose vehicle (SPV), namely International CoalVenture Limited (ICVL), comprising leading PSUsincluding CIL for securing metallurgical coal andthermal coal assets overseas. Aspects like thefunctioning of ICVL and strength of personnel arebeing finalized. The Empowered Committee ofSecretaries constituted for considering ICVL'sproposals for acquiring coal properties abroad willalso consider CIL's proposals for investing in coalassets abroad which are worth more than ` 1,000crore.
11.55 For increasing the output of washed cokingand non-coking coal, CIL has envisaged setting upof 20 new coal washeries for an ultimate raw coalthroughput capacity of 111.10 MT per annum with anestimated capital investment of about ̀ 2,500 crore.These include seven coking coal washeries and13 non-coking coal washeries.
11.56 For increasing production from undergroundmines, initiatives like identification of high-capacityunderground mines for development with latesttechnology, restarting mining in abandoned minesforming JVs with reputed mining companies,introduction of continuous miners and powersupported long wall (PSLW) as a mass productiontechnology in more mines, introduction of high wallmining, and upgradation of equipment size are beingtaken.
11.57 As of now, 216 coal blocks with geologicalreserves of about 50 billion tonnes have beenallocated to public/private companies. Out of these,10 blocks have been de-allocated and out of thede-allocated blocks, 2 reallocated to eligiblecompanies. At present, there are thus 208 coalblocks allocated to various public/private companies,of which, (a) 96 with geological reserves of about27,941.94 MT have been allotted to the governmentcompanies, (b) 100 with geological reserves of about17,269.01 MT to private companies, and (c) 12 withgeological reserve of about 4,846.26 MT allotted forultra mega power projects (UMPPs)/ tariff powerprojects based on bidding. Out of the total allocatedblocks, 26 (14 private and 12 public) havecommenced production. The production from thesecoal blocks for the year 2009-10 was 35.31 MT andwas 23.90MT (provisional) during April-November2010-11.
RAILWAYS
Rationalization of railway freight rates andpassenger fares
11.58 Freight structure has been rationalized bythe Indian railways. There has been continuous thruston bringing in transparency and simplification whileintroducing measures to make rail tariff morecompetitive so as to attract additional traffic. Adynamic pricing policy has been introduced inrecent years, wherein tariff measures are modulatedin response to the market scenario for bettermanagement of regional and seasonal skew indemand with the objective of maximizing revenuesthrough optimal utilization of transport capacities.Iron ore for export has also been brought under theambit of the dynamic pricing policy. An inflationconcession of ̀ 100 per wagon is being granted onfoodgrains for domestic use and kerosene oil.
11.59 To increase revenue from the freightbusiness, a slew of freight incentive schemes havebeen launched. Based on the feedback of theRailways and customers, these schemes are mademore attractive for better utilization of railway assetsin traditional empty flow directions, encouragingfreight forwarders, incremental traffic in lean season,loading of bagged consignment in open wagons,etc.
Freight performance of the Indian railways
11.60 Freight loading on Indian Railways in theperiod April-November, 2010 was 593.43 MT ascompared to 574.40 MT in April-November 2009—an increase of 3.31 per cent. (Table 11.7) This wasshort of the proportionate target of 605.11 MT by11.68 MT. The low growth was primarily on accountof negative growth in iron ore. Iron ore loading hasbeen primarily affected in the current year due tothe restrictions imposed by the State Governmentsof Orissa and Karnataka. Frequent bandhs byNaxalites adversely affected loading, particularly inthe Bailadila sector on East Coast Railway.
Upgradation of passenger amenities
11.61 Indian Railways has decided to add 206 morerailway stations to the existing list of 378 AdarshStations. Railways will develop Adarsh Stations withbasic facilities such as drinking water, adequate
271Energy, Infrastructure and Communications
Website: http://indiabudget.nic.in
toilets, catering services, waiting rooms, anddormitories especially for lady passengers. Workhas started at various stations.
11.62 The computerized passenger reservationsystem (PRS) of Indian Railways is the largestpassenger reservation network in the world, availableat 2,222 locations with more than 8,074 terminals.On an average 4.28 crore passengers per month arebooked through the PRS with an average earning of` 1,722.01 crore per month. Indian Railways hastied up with India Post for providing the PRS facilitythrough post offices and is functional at 112 suchpost offices.
11.63 The computerized unreserved ticketingsystem(UTS), initiated to provide a fast, flexible, andsecure method of issuing unreserved tickets, enablespassengers to get unreserved tickets up to threedays in advance from any counter and any stationto any station in a defined cluster. ComputerizedUTS is available at 4,468 locations with approximately8,080 counters provided till end of November 2010.Automatic ticket vending machines have beeninstalled at 375 locations.
11.64 The freight operations information system(FOIS) gives an account of all demands, number ofloads/rakes/trains and their pipeline, freight locos,
Notes: * Excluding Konkan Railway loading, E – Excluding Metro Kolkata,** calculated in terms of 8 wheelers, P= provisional
Source: Ministry of Railways.
272 Economic Survey 2010-11
Website: http://indiabudget.nic.in
provided with data loggers. Automatic block signallingto improve line capacity has been provided on 77RKM.
Investment in capacity
11.68 During the Eleventh Five Year Plan period,electrification of 3,500 RKM was planned with anoutlay of ̀ 3,000 crore. In the Mid-Term review of theEleventh Plan, a revised target of 4,500 RKM hasbeen approved. In all 2,416 RKM has been electrifiedin the first three years of the Eleventh Plan and 1,000RKM and 1,084 RKM targeted for electrificationduring 2010-11 and 2011-12 respectively. During April-November 2010, 216 RKM has been electrified. Anadditional requirement of ̀ 1,000 crore was projectedin the Mid-Term Review while increasing the targetfrom 3,500 to 4,500 RKM.
Infrastructure improvement
11.69 To optimize the operational expenditure byobtaining electricity at economical tariffs, IndianRailways has planned to set up its own captivethermal power plants. To avail of electric power supplyat economical rates, Railways, in partnership withthe National Thermal Power Corporation (NTPC), issetting up a 1000 MW Thermal Power Plant at NabiNagar. The power supply from this plant is likely tobe available during 2012. Railways is planning toset up a coal-based thermal power plant at Adra inPurulia district of West Bengal. An MoU has beensigned between the NTPC and Railways to set upthe proposed plant by a JV between the NTPC andRailways.
11.70 A greenfield electric loco manufacturing unitis being set up at Madhepura, Bihar, to manufacture12,000 hp locomotives on the basis of a long-termprocurement-cum-maintenance contract throughPPP on build, own, and operate (BOO) basis, byselecting a JV partner through internationalcompetitive bidding (ICB). The cost of the project is` 1,293 crore and equity contribution of IndianRailways and its JV partner will be in the ratio of26:74. The Cabinet has approved setting up of agreenfield rail coach factory at Kanchrapara, WestBengal to manufacture and supply 500 railcars perannum over a period of 10 years.
Dedicated Freight Corridor project (DFC)
11.71 The DFC project envisaging a Western DFC(1534 km) from Mumbai to Rewari/TKD to caterlargely to the container transport requirement and
stock at aggregate level, etc. FOIS phase I (rakemanagement system--RMS) module, implementedat 243 locations, covers all major yards/ lobbies andcontrol offices in divisions and zones. FOIS phase II(terminal management system— TMS) has beencommissioned at 678 locations.
11.65 RailTel was set up for creating optical fibrecable (OFC)-based communication infrastructure formodernizing the communications system for traincontrol, operation, and safety and to generate revenuethrough commercial exploitation of surplus capacity.RailTel has set up an OFC network of 39,000 routekm (RKM) of which 27,982 is of high bandwidthcapacity. Till date 234 important stations and about3,575 other stations have been connected to theOFC network. RailTel has also set up a country-wide Next Generation Network and it has been putto use to carry railway voice traffic.
Rail safety
11.66 Safety is the prime concern of IndianRailways and all possible steps are undertaken ona continuing basis to prevent accidents. As a result,the number of consequential train accidents includingcases of trespassing at unmanned level crossingscame down from 415 in 2001-02 to 165 in 2009-10.During 2010-11 (April to November) also, a similardeclining trend has been observed as the number ofconsequential train accidents including cases oftrespassing at unmanned level crossings came downfrom 106 to 93 in comparison to the correspondingperiod of the preceding year. Accidents per milliontrain kilometres, an important index of rail safety,also came down from 0.55 in 2001-02 to 0.17 in2009-10. This is expected to fall further during2010-11.
Initiatives taken during April-November2010 to modernize and improve signallingsystem
11.67 In order to increase efficiency and enhancesafety in train operations, electrical/electronicinterlocking along with multi-aspect colour lightsignalling system replaced the outdated mechanical/multi cabin system at 227 stations. To improvereliability and visibility of signals, outdated filament-type signals have been replaced with long life, highlydurable light emitting diode (LED) signals at 506stations. A centralized online monitoring/diagnosticsystem with the provision of data loggers has beenintroduced in Indian Railways for predictivemaintenance and intensive supervision of thesignalling system and 337 stations have been
273Energy, Infrastructure and Communications
Website: http://indiabudget.nic.in
an Eastern DFC (1839 km) from Ludhiana to Dankunilargely to serve coal and steel traffic is beingimplemented by the Dedicated Freight CorridorCorporation of India Ltd. (DFCCIL). The base projectcost is estimated at about ̀ 50,761 crore (excludingescalation, contingencies, taxes/duties, and interestduring construction). The project is being fundedthrough a debt to equity ratio of 2:1 with major debtexpected from bilateral/multilateral funding agencieslike the Japan International Cooperative Agency andWorld Bank. Along the Western DFC alignment,the Delhi-Mumbai industrial corridor is also comingup. Considering the need for DFCs on other importantroutes, a preliminary engineering cum traffic survey(PETS) is being undertaken on the following routes---north-south (Delhi to Chennai), east-west (Kolkatato Mumbai), east-south (Kharagpur to Vijayawada),and south (Goa to Chennai)
ROADSNational Highways Development Project(NHDP)
11.72 About 25 per cent of the total length ofNational Highways (NHs) is single lane / intermediatelane, about 52 per cent is two lane standard, andthe balance 23 per cent is four lane standard ormore. In 2010-11, the achievement under variousphases of the NHDP up to November 2010 has beenabout 1,007 km and projects have been awarded fora total length of about 3,780 km. The status of the
NHDP as in November 2010 is shown in Table 11.8.
11.73 Steps taken to expedite the progress of theNHDP include regular monitoring of contracts andprogress reviews, appointment of senior officials byState Governments as nodal officers for resolvingproblems associated with implementation of theNHDP, setting up of a Committee of Secretariesunder the Cabinet Secretary to address inter-ministerial and Centre-State issues such as landacquisition, utility shifting, environment approvalsand clearances of railway over-bridges (ROBs),simplification of the procedure of issue of landacquisition (LA) notifications, and posting of aRailways officer to the (NHAI) to coordinate with theMinistry of Railways in expediting the constructionof ROBs. The NHAI has also set up Regional Officesheaded by Chief General Managers for closemonitoring of projects. So far 14 Regional Officeshave been set up.
Revised strategy for implementation ofNHDP
11.74 The NHAI formulated Work Plans (WorkPlans I and II) for awarding of about 12,000 km eachduring the years 2009-10 and 2010-11. These planslay down a specific time frame for various activitiesand are being monitored very closely at variouslevels. Under Work Plan I so far 73 projects of 6,426km length have been awarded and bids for a furthernine are at various stages. Under Work Plan II, one
Table 11.8 : NHDP Projects as on November 2010
Sl. NHDP Total Completed Under Balance forNo. components Length 4/6 Lane implementation Award of
km) (km) Civil Work (km)Length No. of
(km) Contracts
1 GQ 5,846 5,809 37 10 -
2 NS-EW 7,142 5385 1,332 106 425
3 Port Connectivity 380 291 83 6 6
4 Other NHs 1,383 926 437 7 20
5 SARDP-NE 388 - 112 2 276
6 NHDP Phase III 12,109 1922 5,207 73 4,980
7 NHDP Phase IV 20,000 - 486 4 19,514
8 NHDP Phase V 6,500 407 1,893 16 4,200
9 NHDP Phase VI 1,000 - - - 1,000
10 NHDP Phase VII 700 - 41 2 659
Total 55,448 14,740 9,628 226 31,080
Notes: GQ—Golden Quadrilateral connecting Delhi, Mumbai, Chennai, and Kolkata; NS-EW—north-south andeast-west corridor; SARDP-NE—Special Accelerated Road Development Programme in the North-eastern Region.
Source : Ministry of Road Transport and Highways (MoRT&H).
274 Economic Survey 2010-11
Website: http://indiabudget.nic.in
project of 170 km length was awarded and bids forfive more projects are under various stages ofprocess.
11.75 A committee under the Chairmanship of ShriB. K. Chaturvedi, Member Planning Commission,submitted a report containing the recommendationson the urgent issues for key changes in theimplementation framework and modified financingplan of the NHDP. The Government considered andaccepted the recommendations contained in thereport of the Committee in November 2009 with theproviso that the financing plan from 2010-11onwardswould be considered by the Empowered Group ofMinisters (EGoM) for further action.
11.76 The EGoM has since given the in-principleapproval for Work Plan II for 2010-11 for award ofprojects covering a length of about 12,000 km andalso has approved additional budgetary support forthe SARDP-NE and J&K projects. The EGoM hasalso approved the Work Plan for 2010-11 onwardswith the stipulation that of the total NH length to bedeveloped, broadly 60 per cent would be taken upon build, operate, and transfer (BOT) (Toll) basis,25 per cent on BOT (Annuity) basis, and theremaining 15 per cent on engineering procurementcontract (EPC) basis.
11.77 The NHAI is setting up 192 special landacquisition units (SLAUs) in various States forexpediting the LA process, which is identified as amajor bottleneck in the implementation of theprojects, and 122 such units have already been setup. Besides, Chief Ministers have been requestedto set up High Level Coordination Committees underChief Secretaries to sort out issues involvingcoordination between departments. Most Stateshave constituted these High Level CoordinationCommittees.
11.78 To expedite the progress of the NHDP, theMoRT&H has taken up implementation of about 4700km under NHDP IV through State Public WorksDepartments (PWDs)/Corporations. It consists ofimplementation of about 1800 km under NHDP IVA(approved by the Government in July 2008) andabout 2900 km under NHDPIVB (yet to be approvedby the Government). Of the 1800 km under NHDPIVAtaken up through State PWDs / Corporation, oneproject of 108 km has been awarded up to November2010 and another of 670 km is at an advanced stageof award. Advance action has also been taken forproject preparation work for about 2900 km underNHDP IVB.
Financing of the NHDP
11.79 A part of the fuel cess imposed on petroland diesel is allocated to the NHAI to fund theimplementation of the NHDP. The NHAI, wheneverrequired, leverages the said cess flow to borrowadditional funds from the debt market. Till date suchborrowings have been limited to funds raised through54 EC (capital gains exemption) bonds and theshort-term overdraft facility.
11.80 The Government of India has also taken loansfor financing various projects under the NHDP fromthe World Bank (US$ 1965 million), AsianDevelopment Bank(ADB) (US$ 1605 million), andJapan Bank for International Cooperation (32,060million yen) which are passed on to the NHAI partlyin the form of grants and partly as loan. The NHAIhad also availed a direct loan of US $ 149.78 millionfrom the ADB for the Surat Manor ExpresswayProject (Table 11.9)
SARDP-NE11.81 The SARDP-NE aims at improving roadconnectivity to State capitals, district headquarters,and remote places of the north-east region. Itenvisages two / four laning of about 4798 km of NHsand two laning / improvement of about 5343 km ofState roads. This will ensure connectivity of 88district headquarters in the north-eastern States totwo- lane NHs / two-lane State roads. Theprogramme has been divided into Phases 'A' and 'B'and the Arunachal Pradesh Package of Roads &Highways.
11.82 With the approval of the Cabinet Committeeon infrastructure (CCI) on 8 April 2010 for transfer/addition of 1503 km roads to Phase 'A' of the SARDP-
Table 11.9 : Financial Structure of NHAI
(` ` ` ` ` crore)
Year Cess External Borrow- BudgeFund Assistance ings 54-EC tary
Bonds Support
Grant Loan
2005-06 3269.70 2350.00 600.00 1289.00 802.00
2006-07 6407.45 1582.50 395.50 1500.00 570.67
2007-08 6541.06 1776.00 444.00 305.18 559.00
2008-09 6972.47 1515.00 378.80 1630.74 159.00
2009-10 7404.70 272.00 68.00 1153.63 200.00
Source: Department of Road Transport & Highways.
275Energy, Infrastructure and Communications
Website: http://indiabudget.nic.in
NE, Phase 'A' now consists of improvement of 4099km of roads consisting of 2041 km of NHs and 2058km of State roads at an estimated cost of ̀ 21,769crore. Out of the 4099 km, the Border RoadsOrganization (BRO) and State PWDs have beenassigned the development of 3213 km. Theremaining length of 886 km will be built by the NHAI,Ministry / Arunachal Pradesh PWD, and BRO afterinvestment approval is received from the CCI. Out ofthe 3213 km, projects covering a length of 2219 kmhave been approved till December 2010 and work isin different stages of progress. Phase 'B' has nowbeen modified to cover two laning of 1285 km ofNHs. Further approval for preparation of DPRsfor two laning / improvement of 2438 km of Stateroads has also been given. Till December 2010, aDPR was prepared for 450 km.
11.83 The Arunachal Package covering a 2319 kmstretch of road was approved by the Government aspart of the SARDP-NE on 9 January 2009. Of this,776 km has been approved for execution on BOT(annuity) basis and the remaining for tendering onEPC basis. Two projects under BOT (annuity) for58 km length have been awarded and the award forthe remaining two covering 718 km is under process.For other stretches to be taken up on EPC basis,estimates have been sanctioned/ DPR is underprocess.
Initiatives for development of the entire NHnetwork to minimum acceptable two-lanestandard
11.84 Keeping in view the targets stipulated in theEleventh Plan for accelerated efforts to bring theNH network up to a minimum two-lane standardwithin the next 10 years (i.e. by the end of the TwelfthPlan) and also for removing existing deficiencies,the Ministry has proposed a World Bank loan aswell as budgetary allocations to reach this goal byDecember 2014. DPR consultants have beenengaged for preparation of a DPR for about 3800km proposed to be developed under World BankAssistance. The MoRT&H has also initiated actionfor improvement of the remaining 2500 km of single/ intermediate lane NHs through budgetaryresources. In order to make a visible impact, thework would be taken up for upgradation on corridorconcept. Therefore, corridors would includestrengthening (in adjoining reaches) in addition towidening to two lane/ two lane with paved shoulder
standards in order to have better facility in longcontinuous stretches.
11.85 In general, the larger stretches costing morethan ` 150 crore have been taken up with loanassistance from the World Bank under the NationalHighways Interconnectivity Improvement Programme(NHIIP). DPR consultants have been engaged forpreparation of a DPR for about 3800 km. The smallerstretches costing less than ̀ 150 crore have beentaken up through budgetary support. In this category,a 2200 km length (51 projects) with an estimatedcost of ` 5800 crore has been taken up. Provisionof these projects has been made in the Annual Plan2010-11 and Demands for Grants 2010-11. DPRsare prepared by State PWDs and the estimates aredirectly submitted by them to the Ministry forsanction.
Development of Roads in Left Wing Extrem-ism (LWE)-affected areas
11.86 The project covering 1126 km of NHs and4351 km of State roads in LWE-affected areas isspread over 34 district in eight States, namelyAndhra Pradesh, Bihar, Chhattisgarh, Jharkhand,Madhya Pradesh, Maharashtra, Orissa, and UttarPradesh. An allocation of ` 1000 crore has beenmade for the project from the gross budgetarysupport (GBS) under the Annual Plan for 2010-11.As against the total target till December 2010,projects for a total length of 4897 km at an estimatedcost of ` 5998 crore have been sanctioned /processed till November 2010. Of these, projectsfor a length of 3012 km at an estimated cost of` 3537 crore have been awarded till November 2010and an expenditure of ̀ 256 crore incurred.
Construction of rural roads under thePradhan Mantri Gram Sadak Yojna(PMGSY)
11.87 The PMGSY was launched to provide singleall-weather connectivity to eligible unconnectedhabitations having population of 500 persons andabove in plain areas and 250 persons and above inhill States, the tribal (Schedule-V) areas, desert (asidentified in the Desert Development Programme)areas, and LWE-affected districts as identified bythe Ministry of Home Affairs.
11.88 Under the programme, up to November 2010about 4.19 lakh km roads to benefit 1,07,974
276 Economic Survey 2010-11
Website: http://indiabudget.nic.in
Box 11.2 : Auction for an efficient, cost effective and transparent system of award of PPP projectsfor National Highways Development
Highways are a critically important infrastructure for an emerging nation. And the design of appropriate contracts is thecritical instrument for meeting the challenge of highways. What are these challenges? To put it in one sentence, the objectiveor the challenge is to maximize the difference between:
(a) the additional welfare that our citizens get from having more and better roads and,
(b) the present value of the cost of building (henceforth, building should be taken to mean building or renovating) thoseroads.
The broad principles above translate into these following general rules.
(1) We have to have a cut off rule to decide which projects are worthwhile and which not.
(2) Between two identical roads if one can be done at a lower cost, we should choose the one with the lower cost, subjectto that being viable in the sense of (1), above.
(3) All costs do not take the form of brick and mortar. A build up of fiscal deficit is also a form of cost. This may bedifficult to reduce to the equivalent of brick and mortar cost but must not be omitted for that reason.
Some of the problems can be overcome if projects are awarded on the basis of a transparent and hands-off auction system.The heart of an efficient, cost effective and transparent system of PPP partnership whereby the Government gives out thetask of developing new highways to the private sector is the system of auction. Auctions work best when the product isbeing sold lock, stock and barrel to a bidder. Hence, systems such as BOT (toll) and annuitized BOT (toll) are better suitedto being given out through competitive auction than the BOT (annuity). In the case of BOT (toll) and annuitized BOT (toll)the developer basically gets to own the road for the next 20 years. Hence, this comes close to a lock, stock and barrel sale.
Auctions are, however, highly specialized objects and their detailed good design require specialist input. The details of theauction should therefore be worked out with inputs from specialists. No attempt should be made to apportion in advancedifferent groups of bidders to different projects. All private bidders willing to bid, subject to their meeting the qualificationrequirement, should have the right to bid.
The current practice in the case of BOT (toll), is to allow for a viability gap funding (VGF) of up to 40% of the project cost.However, it has been seen that some developers make so much profit at the start of the project because of the 40% VGF thatthey do not, after that, take adequate interest in maintaining the highways. And, knowing this, they will not even have theincentive to build the road properly in the first place. To make good-quality road building incentive compatible with thedeveloper's interest and at the same time serve the national interest it is recommended that we allow for up to 10% VGFupfront. Then for any VGF over and above 10% and limited to a maximum of 40%, the balance should be converted into anannuity to be paid in equal installments each year for the next 20 years. Unlike under the BOT (annuity) system, the toll willstill be managed and collected by the private developer who wins the bid and therefore the incentives are aligned.
Given that the developer would continue to receive "annuitized" payments from the Government it will be in the interest ofthe developer to maintain the road as he is obligated to do to the Government. Further, since the developer will be collectingtoll, he or she will have a direct interest in maintaining the road. And since he himself will be maintaining the road, by theargument of backward induction it follows that the developer will have an interest in building good-quality roads, forwhich the maintenance cost is not excessive.
Source: Report on Methodology for PPP (Public Private Partnership) project for National Highways Development underthe chairmanship of Dr. Kaushik Basu, Chief Economic Adviser.
habitations have been cleared with an estimatedcost of ` 1,18,298 crore. A sum of ` 75,404 crorehas been released to the States/UTs and about` 74,345 crore has been spent. So far, 2,98,809.72km road length has been completed and newconnectivity has been provided to over 73,651habitations. Work on a road length of about 1,20,181km is in full swing.
11.89 Rural roads has been identified as one ofthe six components of Bharat Nirman and has thegoal to provide all-weather road connectivity to allvillages with a population of 1000 (500 in the case
of hilly or tribal areas). In effect, Bharat Nirmanproposes to provide new connectivity to a total of54,648 habitations. This would involve constructionof 1,46,184 km of rural roads. In addition to newconnectivity, Bharat Nirman envisages upgradation/renewal of 1,94,130 km of existing rural roads. Underthe rural roads component of Bharat Nirman, 38,144habitations have been provided all-weather roadconnectivity up to November 2010 and projects forconnecting 15,426 habitations are at different stages.During 2010-11, up to November 2010 over 24,411km all-weather road has been completed under the
277Energy, Infrastructure and Communications
Website: http://indiabudget.nic.in
programme. New connectivity has been provided tonearly 3271 habitations with an expenditure of ̀ 8705crore.
CIVIL AVIATION11. 90 The Civil Aviation Sector witnessed a strongrecovery during 2010 from the adverse impact of therecent global financial crisis. The scheduled domesticpassenger traffic at 51.53 million clocked a growthrate of 19 per cent during January-December 2010as compared to 43.3 million during the correspondingperiod in 2009. Domestic cargo transported by airincreased from 3.4 million tonnes in 2009 to 4.7 milliontonnes in 2010 registering a growth rate of 30 percent. At present 12 scheduled airlines are operational(10 passenger and 2 cargo). The total number ofaircraft in their fleet has risen by one to 419 at theend of December 2010. The non-scheduled operatorsas on December 2010 have 360 air-craft in their fleet.
11.91 The civil aviation sector in India has resumeda higher trajectory of growth after emerging fromadverse impact of global financial crisis. India's airtraffic has grown by about 18 per cent per year since2004. The potential for higher levels of growth in thefuture is also very high. Industry forecasts suggestthat India will be the fastest growing civil aviationmarket in the world by 2020 with about 420 millionpassengers being handled by the Indian airportsystem as against 140 million in 2010. Such growthprospects pose a number of challenges on manyfronts.
11.92 Keeping in view the pace of developments inthis area and to draw upon expertise available outsidethe system to address issues that are predominantlyeconomic in content, the Civil Aviation EconomicAdvisory Council (CAEAC) has been set up underthe Chairmanship of the Secretary, Civil Aviation, withexperts drawn from different sub-segments of theindustry and from other related fields. The CAEACmet once in December 2010 and once in January2011 and is scheduled to meet periodically at regularintervals and advise the Ministry in charting out aframework of analysis for addressing issues facingthe sector that are predominantly economic incontent.
11.93 In pursuance of the decision taken in thefirst meeting of the CAEAC, a Working Group onRegulatory Framework to protect consumer interestsincluding disclosure of passenger tariffs andconditions of service by domestic airlines has beenset up on 20 December 2010 with the mandate torecommend measures to enhance transparency and
disclosure and to suggest improvements in thesystem of monitoring. Another Working Group onAir Cargo/Express Service Industry has been set upon 17 January 2011 to look into issues of long-termsignificance for the industry and advise the Ministryon policy initiatives required in this regard.
Protection of interest of Air Travellers
11.94 In order to ensure appropriate protection forair travellers in the event of flight disruptions, i.e.cancellations and delays without due notice topassengers, airlines have been directed to providecompensation in addition to the refunding of ticketprices for the inconvenience caused. Additionally,airlines have been mandated to compensatepassengers with confirmed bookings who are deniedboarding against their will in addition to refund of airticket in accordance with the Civil AviationRequirements dated 6 August 2010. The TariffMonitoring Unit set up in the DGCA continues tomonitor the passenger fares offered by scheduleddomestic Airlines to ensure that the competition inthe market is fair.
Air India Ltd
11.95 With effect from November 2010, the nameof the Company has been changed from NationalAviation Company of India Ltd to Air India Ltd. Inview of its critical financial position, it was decidedthat Air India would come up with a revised businessplan along with a financial restructuring plan, afterconsultation with professional financial/managementconsultants, indicating the operational measures asalso financial restructuring measures required toimprove the financials of the company. Air India hasreported that a number of measures were taken forcost reduction and improved revenue generation asa result of which it is confident of turning around itsperformance during the next 18 to 24 months subjectto other factors remaining favourable. With a view toaddressing the debt-equity ratio, ` 800 crore wasinfused as equity into the company in 2009-10 and` 1200 crore in 2010-11. This would give the companyflexibility in its financial restructuring.
Airport development
11.96 As part of the restructuring and modernizationof metro airports, Delhi and Mumbai airports are beingrestructured and modernized PPPs. Phase-1 of thedevelopment work of the Indira Gandhi InternationalAirport (IGIA), Delhi, has already been completedwith the operationalization of Termial-3 at an
278 Economic Survey 2010-11
Website: http://indiabudget.nic.in
estimated cost of ̀ 12,857 crore. Development workat Chhatrapati Shivaji International Airport (CSIA),Mumbai, will be completed by 31 December 2012with an estimated cost of ` 9802 crore. Similarly,the Airport Authority of India (AAI) has undertakendevelopment work at Kolkata and Chennai airportswith an estimated cost of ` 1942 crore and ` 1808crore respectively, subsequently revised to ` 2325crore and ̀ 2015 crore respectively. The revision incost is under consideration. As per the revisedschedule, the Kolkata project is to be completed byOctober 2011 and the Chennai project by May 2011(domestic terminal ) and July 2011 (internationalterminal).
Modernization of non-metro airports
11.97 The Committee on Infrastructure(COI) in its12th meeting held on 8 June 2006 had approved themodernization of 35 non-metro airports.Of these 35,the cost of development work on 30 is less than `150 crore. The development work on 11 such projectshas already been completed and on 19 is either atplanning stage or in progress. The cost ofdevelopment work on the remaining five projects, ismore than ̀ 150 crore. The work on one such project,namely Thiruvananthapuram, has been completedand work is in progress on the remaining four.
GAGAN Project:
11.98 Implementation of the GPS-aided GEO-augmented Navigation (GAGAN) project over IndianAirspace for seamless navigation of civil aircraft is inprogress.. The total cost of the project is ̀ 774 crore,out of which ` 148 crore has been spent on theGAGAN-Technology Demonstration System (TDS)Phase with the AAI's contributing ` 108 crore andthe Indian Space Research Organization (ISRO) ̀40 crore. An amount of ` 626 crore has beenearmarked for GAGAN-Final Operational Phase(FOP) out of which the AAI is required to contribute` 496 crore and ISRO the balance.
Corporatization of Air Traffic Control(ATC)services
11.99 The Government had constituted a committeeheaded by Shri Naresh Chandra, former CabinetSecretary, to suggest a road map for the civil aviationsector in India. The committee had recommendedthat keeping in view the efficiency required in manyfunctional areas and international trends, ATCservices should be hived off from the currentjurisdiction of the AAI and a separate corporate entity
constituted. The process of corporatization of ATCservices has already been set in motion. This is oneof the major developments in the area ofinfrastructure for the aviation sector in the country.
Outstanding Issues
11.100 Indian carriers operate in an exceptionallyhigh-cost environment. The single largest elementcontributing to airline costs is aviation turbine fuel(ATF) which accounts for 40 per cent of the operatingcost of Indian carriers, as against a figure of only 20per cent for international carriers. ATF in India ispriced, on an average, almost 60 per cent higherthan internationally. The widening differential in ATFprices and its huge negative impact on airline balancesheets are eroding its competitiveness. In the back-drop of higher oil-crude prices, there is severe riskof dampening of passenger market growth byquickly making air travel out of reach for a significantportion of the market, which was fuelling its growth.The losses being registered by Indian carriers mayresult in reduced connectivity thereby affectinggrowth in this sector.
TELECOMMUNICATIONS
Growth
11.101 The opening of the sector has not only ledto rapid growth but also helped a great deal towardsmaximization of consumer benefits as tariff havebeen falling across the board. From only 76.54million telephone subscribers in 2004, the numberincreased to 764.77 million at the end of November2010. Wireless telephone connections havecontributed to this growth as their number rose from35.62 million in March 2004 to 729.58 million at theend of November 2010. The wire-line has shown adecline from 40.92 million in 2004 to 35.19 millionin November 2010(Table 11.10).
Table 11. 10 : Growth of telephone connections
(in millions)
March March March Nov.2008 2009 2010 2010
Wireline 39.41 37.96 36.96 35.19
Wireless 261.08 391.76 584.32 729.58
Gross Total 300.49 429.73 621.28 764.77
Annual 46 43 45 19Growth (%)
Source: Department of Telecommunications.
279Energy, Infrastructure and Communications
Website: http://indiabudget.nic.in
Teledensity
11.102 With increasing private-sector participation,the share of the private sector in total telephoneconnections has increased to 84.5 per cent inNovember 2010 from a meager 5 per cent in 1999.Teledensity, an important indicator or telecompenetration, rose from 7.02 per cent in March 2004to 64.34 per cent in November 2010. Thus therehas been continuous improvement in the overallteledensity of the country. Rural teledensity whichwas above 1.57 per cent in March 2004 hasincreased to 30.18 per cent at the end of November2010. Urban teledensity has increased from 20.74per cent in March 2004 to 143.95 per cent at theend of November 2010.
11.103 With the penetration of mobile services andflourishing of private service providers, ruraltelephone connections have gone up from 12.3million in March 2004 to 250.94 million in November2010. The share of rural telephones in totaltelephones has steadily increased from around 16per cent in 2004 to 32.81 per cent as on 30 November2010. During 2009-10, the growth rate of ruraltelephones was 62.6 per cent as against 37.32 percent for urban telephones. The private sector hascontributed crucially to the growth of rural telephonesby providing about 84.5 per cent of telephones as inNovember 2010.
Internet / Broadband
11.104 With supportive policies, broadbandsubscribers grew from 8.77 million as in March 2010to about 10.71 million up to November 2010. A targetof 20 million by 2010 has been set. in broadbandpolicy. The auction of BWA spectrum has beensuccessfully conducted. Newer Accesstechnologies like Broad Band Wireless Access(BWA) can significantly transform the character ofinternet/broadband scenario in India. This willencourage further expansion of wireless service witha vision of providing 'Broadband for all'.
New horizons for further growth
11.105 Third-generation (3G ) telecom services:The explosive growth of the telecom industry in Indiais being followed by the urge to move towards bettertechnology and the next level of service delivery.While the last five years have been transformationalfor Indian telecom industry, the next few years lookeven more exciting. One of the key new frontiers is3G technology. The auction of 3G/WBA spectrum
has been successfully conducted. This willencourage further expansion of wireless services
11.106 Mobile number portability (MNP): MNPallows any subscriber to change his service providerwithout changing his mobile phone number. Themuch-awaited MNP was launched on 25 November2010 in Haryana and is now available to more than700 million subscribers across the country from20January, 2011.
11.107 Manufacturing: Indian telecom industrymanufactures a complete range of wireline telecomequipment using state-of-the-art technology.Considering the growth of wireless, there areexcellent opportunities for domestic and foreigninvestors in manufacturing sector. Presently mostof the wireless core equipment is being importedand there is great potential to manufacture theseitems in the country. The last five years saw manyrenowned telecom companies setting up theirmanufacturing bases in India. The production oftelecom equipments in value terms increased from` 48,800 crore during 2008-09 to ` 51,000 croreduring 2009-10. The worth of telecom equipmentincluding customer premises equipment (CPE)produced during 2010-11 is expected to be about ̀53,500 crore . There are favourable factors such aspolicy moves taken by the Government, incentivesoffered, large talent pool in R&D, and low labourcost which can provide an impetus to the industry.Exports of telecom equipment have also increasedfrom ` 11,000 crore in 2008-09 to ` 13,500 croreduring 2009-10 and are expected to increase to `14,000 crore in 2010-11.
Activities under Universal ServiceObligation Fund (USOF)
11.108 The USOF continues to be used tosubsidize the development of the telecom sector inrural areas. Support is provided from the USOF foroperation and maintenance of village publictelephones (VPT) in revenue villages identified asper Census 2001. There are still about 62,443uncovered villages which would also be provided withVPT facility with subsidy support from the USOF.Agreements were signed with Bharati SancharNigam Limited (BSNL) whereby 40,101 villages havebeen covered under VPTs. As on 31December 2010,61,985 VPTs have been provided by BSNL. In orderto provide broadband connectivity to rural areas underthe purview of the USOF, out of a total of 8,88,832wireline broadband connections, 2,32,852 have beenprovided till 30 November 2010.
280 Economic Survey 2010-11
Website: http://indiabudget.nic.in
POST11.109 India Post has the largest postal networkin the world with 1,54,979 post offices across thelength and breadth of the country. As on 31 March2010, out of this total, 1, 39,182 were in rural areasand 15,797 in urban areas. On an average eachpost office serves 7176 people and covers an areaof approximately 21.21 sq. km. India Post has sofar introduced 1082 franchisee outlets to cater tothe demand for postal services where it is notpossible to open departmental post offices.
Project Arrow
11.110 The Department has launched ProjectArrow, to lay the foundation for a comprehensive,long-term transformation of India Post. Project Arrowaims at comprehensive improvement of the core postoffice operations as well as the ambience in whichpostal transactions are undertaken. The responseof the general public and the staff of the Departmentto the initiative have been overwhelmingly positiveand Project Arrow offices have shown significantincrease in revenue earnings. The initiative 'ProjectArrow--Transforming India Post' has also won thePrime Minister's award for Excellence in PublicAdministration for the year 2008-09. So far 1530post offices have been covered under this project.
Mail Operations
11.111 The Mail Network Optimization Project hasbeen launched to optimize the existing mail networkof Department of Posts and streamline core mailoperations. It also seeks to bring in greaterstandardization and improvement in the operationalprocesses relating to mail processing, transmission,and delivery. The Department has undertaken aproject to set up Automated Mail Processing Centres(AMPCs) in Delhi, Mumbai, Kolkata, Chennai,Bangalore, and Hyderabad with a view to automatingmail sorting. This automated sorting of mail, whichwould help the Department increase productivity atpost offices in these cities.
11.112 The Department of Posts has inducted adedicated cargo aircraft for carriage of mail, parcels,and logistics in the north-east region in order to bringin consistency in mail transmission. The India Postaircraft operates on the Kolkata-Guwahati-Imphal-Agartala-Kolkata route on a regular basis. Thisinitiative has provided a vital communication link forthe north-east region with the rest of the countryand helped the Department resolve the problems
associated with mail transmission to and from thisregion.
Computerization and Networking of PostOffices
11.113 Under the Plan project of computerizationand networking of post offices, the Department ofPosts has supplied computer hardware, peripherals,and power back-up equipment to 14,324 post officestill date in the Eleventh Plan period Upgradedcomputer hardware, namely servers, desktops andperipherals, and power back-up equipment likeUPSs and gensets have been supplied to 1939 postoffices computerized during earlier five year plans.Wide Area Network (WAN) connects1308 sites/locations including all head post offices,administrative offices, major speed post centres andaccounts offices. Broadband facilities have beenprovided to 10,530 offices. The IT ModernizationProject Phase II of India Post under the EleventhPlan envisages computerization of all the non-computerized post offices in the country(Departmental single-handed post offices) and allextra-departmental post offices phased over thefinancial years 2010-11 and 2011-12.
Banking and insurance services
11.114 India Post is pursuing the objective offinancial inclusion through its 1,39,182 post officesin rural areas and 15,797 post offices in urban areas.The total number of post office savings bankaccounts has increased from 14.23 crore in 2003-04 to 24.10 crore in 2009-10 The outstandingbalance in them in 2009-10 was ` 5,83,789 crore.India Post has already computerized its savingsbank operations in 11,000 post offices. The postoffices also provide insurance services to theGovernment and semi-Government employees andthe rural populace under the banner of Postal LifeInsurance (PLI) and Rural Postal Life Insurance(RPLI). The number of RPLIs has increased from26.66 lakh in 2003-04 to 70 lakh in 2008-09 andmore than 99 lakh in 2009-10. There were more than44 lakh PLI policies as on 31March 2010.
Leveraging of the postal network
11.115 The Department of Posts has been giventhe responsibility of disbursing wages to MahatmaGandhi National Employment Guarantee Scheme(MGNREGS) beneficiaries through post officesavings bank accounts. Starting with AndhraPradesh postal circle in 2006, the payment of wages
281Energy, Infrastructure and Communications
Website: http://indiabudget.nic.in
under the MGNREGS is currently operational in19 postal circles comprising 26 States and 5 UTs.The scheme is operational through 96,895 postoffices. Nearly 4.67 crore NREGS accounts havebeen opened up to October 2010 and the amountdisbursed in this financial year (April-October 2010)amounts to more than ̀ 7113 crore.
11 .116 The Department of Posts in collaborationwith the National Bank for Agriculture and ruralDevelopment (NABARD) provides micro-creditfacility to self-help groups (SHGs) through identifiedpost offices on agency basis. The corpus fund forimplementation of this project is given by NABARD.The pilot is in operation in five districts involving sevendivisions of Tamil Nadu circle. So for, 1207 SHGshave been provided more than ̀ 3.29 crore in loan.
11.117 The Department has designated 4707Central Assistant Public Information Officers(CAPIOs) at least one in each tehsil across thecountry. Officers in charge of the computerizedcustomer care centres have been identified to actas CAPIOs for the Department and to receive Rightto Information (RTI) requests and appeals on behalfof other Central public authorities who have agreedto avail of this facility in post offices in pursuance ofSection 5 (2) and 19 of the RTI Act 2005. Thedesignated CAPIO at a post office receives RTIrequests and appeals for forwarding to the CentralPublic Information Officer or senior officer specifiedunder sub-section (1) of section 19 of the RTI Act2005 or the Central Information Commission (CIC),as the case may be.
International Operations of India Post
11.118 India Post has also launched a premiumexpress service called WorldNet Express in aunique collaboration with Duetsche Post, thenational postal carrier of Germany. This serviceenables customers to despatch express parcels toover 200 countries and has advanced features liketracking of parcels through internet, telephone, andSMS. This service is also supported by a 24-hourtelephone help line.
URBAN INFRASTRUCTURE11.119 In 2001, just 27.8 per cent of India's totalpopulation lived in urban areas. Yet, in absoluteterms, with about 285 million persons living in urbanareas, India has the second largest urban populationin the world. It is expected that the urban population
will rise to constitute 38 per cent of total populationby 2026.
11.120 Urbanization has increased the demand forurban services. In this context, improving the urbaninfrastructure covering basic civic services likedrinking water supply, sewerage, solid wastemanagement, and urban transport assumes greatsignificance. Municipal institutions responsible forproviding these civic services are facing acuteshortage of capacity and resources.
11.121 The Eleventh Five Year Plan had estimatedthe total fund requirement for implementation of thetarget for urban water supply, sewerage andsanitation , drainage, and solid waste managementto be ̀ 129,237 crore and that for urban transport tobe ̀ 132,590 crore. According to estimates basedon the City Development Plans(CDPs) prepared bythe States under the Jawaharlal Nehru NationalUrban Renewal Mission (JNNURM) launched in2005-06, the requirements for both urbaninfrastructure services and urban transport wereestimated to be as high as ` 8,00,000 crore.
JNNURM11.122 The JNNURM was launched in 2005-06 toencourage cities to initiate steps to bring aboutimprovement in existing civic service levels in asustainable manner in Mission mode over a seven-year Mission period. The components under theSub-Mission Urban Infrastructure and Governance(UIG) include urban renewal, water supply (includingdesalination plants), sanitation and sewerage, solidwaste management, urban transport, developmentof heritage areas, and preservation of water bodies.The allocation for the JNNURM (UIG) was increasedfrom ` 25,500 crore to ` 31,500 crore in February2009. On 3 December 2010, the Mission hascompleted five years.
11.123 All the selected 65 cities under the UIGcomponent of the JNNURM have preparedcomprehensive CDPs, charting out their long-termvision and goals in urban governance anddevelopment. These plans also include investmentplans, with a focus on provision of city-wide urbaninfrastructure services such as water supply,sanitation, drainage, and provision of basic servicesto the urban poor.
11.124 With the launching of the JNNURM, thereform of urban local bodies (ULBs) has begun.
282 Economic Survey 2010-11
Website: http://indiabudget.nic.in
Memorandums of Agreement (MoAs) in respect ofthe reforms agenda to be undertaken by States andcities has been negotiated and signed with 65Mission cities and six ULBs falling under urbanagglomeration of cities. There is now betterappreciation at State level of the importance ofdeveloping and sustaining infrastructure throughappropriate user charges. Further, States and ULBshave started meeting timelines committed forimplementation of the reforms under the MoAs.
11.125 The JNNURM is a reforms-drivenprogramme. As against commitments to achievereforms by the fifth year in accordance with theirrespective MoAs, 29 out of 29 States/UTs haverepealed the Urban Land Ceilings Act, 21 out of 29have constituted District Planning Committees, 15out of 15 have rationalized stamp duties to 5 percent, and 17 out of 26 States have transferred /integrated water supply and sanitation functions.Also 42 out of 62 ULBs have shifted to double-entry-based accounting system.
11.126 A Community Participation Fund (CPF) wasestablished on 4 June 2007 with an initial corpus of` 100 crore with the provision of an additional ̀ 90crore for the remaining years of the Mission period.So far 45 proposals have been approved under theCPF.
11.127 For 2010-11 ` 6556.12 crore has beenprovided for the UIG. A total number of 526 projects,as on 31December 2010, have been sanctioned atan approved cost totalling ̀ 60,215.44 crore for 62cities out of the listed 65 Mission cities across 31States/UTs. Additional Central Assistance (ACA)admissible for these projects is ̀ 27,878.44 crore.As on 31December 2010, ` 12,978.93 crore hasbeen released as ACA to various States and UTs forthe projects, financing of buses, CPF and e-Governance projects approved under the JNNURMand also for reimbursement cost of CDPs and DPRs.
11.128 While sanctioning projects under theJNNURM, highest priority has been accorded tosectors that directly benefit the common man andthe urban poor, namely water supply, sanitation, andstorm water drainage. Cumulatively, more than 95per cent of the seven-year ACA allocation of ̀ 31,500crore under the UIG Sub-Mission has already beencommitted. During 2010-11, up to 31 December2010, 10 projects have been approved with projectcost of ` 2706.99 crore. The ACA admissible forthese projects is ` 996.52 crore of which ̀ 557.46crore has been released.
E-Governance
11.129 A Mission mode project on e-Governancein municipalities was conceptualized as part of theEleventh Five Year Plan for making urban Governancemore efficient and effective. It was decidedsubsequently that initially the e-Governance projectwould be a part of the JNNURM for 35 cities withpopulation of over 10 lakh and a new Centrallysponsored scheme (CSS) for other cities and townswould be taken up after watching the implementationunder the JNNURM. Accordingly, the guidelines forthe National Mission Mode Project (NMMP) on e-Governance in municipalities was prepared andcirculated to the States/ULBs for submission ofDPRs The DPRs with State-level solutions fromJharkhand and Uttar Pradesh have already beenapproved. This is in addition to seven DPRs alreadyapproved for Nagpur, Vijayawada, Cochin, Pimpri-Chinchwad, Navi Mumbai, Ulhasnagar, and Chennai.The DPR for Jharkhand covers e-Governance inDhanbad ULB and the Uttar Pradesh DPR coverse-Governance in Kanpur ULB.
Urban Infrastructure Development Schemefor Small and Medium Towns (UIDSSMT)
11.130 The UIDSSMT is a sub-component of theJNNURM for development of infrastructure facilitiesin all towns and cities other than the 65 Missioncities. For obtaining assistance under the UIDSSMT,States and ULBsneed to sign MoAs committing toimplement reforms. From its inception in December2005 till December 2010 as many as 764 projectsacross 641 towns and cities at a cost of ̀ 12,928.93crore were sanctioned under the UIDSSMT,comprising inter alia 418 water supply projects, 96sewerage projects, 65 storm water drainage projects,56 solid waste management projects, and 108 roadprojects. So far, the committed ACA under theUIDSSMT for approved projects is ̀ 10,435.93 crore,against which ` 7110.29 crore has been releasedtill 31 December 2010.
Other Urban Infrastructure Schemes andinitiatives in Urban Governance
11.131 Under the pilot scheme for UrbanInfrastructure Development in Satellite Towns aroundSeven Mega-Cities (UIDSST), i.e. Mumbai, Kolkata,Delhi, Chennai, Hyderabad, Bangalore, andAhmedabad, a total of six projects worth` 234.08 crore were sanctioned for Pilkhuwa, Vasai-
283Energy, Infrastructure and Communications
Website: http://indiabudget.nic.in
Box 11.3 : Cities and Growth, Land Markets and Urban Development
Cities may hold the key to our future. India is entering what we term as "Three Great Transformations": (1)growth of cities; (2) jobs to meet rising aspirations of a young adult population; and (3) doubling householdincomes. Some 200 million new entrants to the labour force will migrate from rural to urban areas, and liftIndia's economy-wide (including rural) productivity, growth and average incomes. Urbanisation is pullingpeople out of rural poverty. But the process is knife-edge: failure will lead to chaotic cities, unfulfilledaspirations, and slower growth.
...As a Demographic Bulge Looms (millions in age-group)
Patterns : India's urban population is underestimated, partly because of definitional reasons, and will approachsome 45% of the population (495 million), compared to 30% (295 million) in 2009. This is equivalent tobuilding 1 additional Greater Mumbai or Greater Delhi every year. Growth is taking place in peripheries ofmajor agglomerations: Greater Mumbai, Delhi, Kolkata, Chennai, Bangalore, Hyderabad, Ahmedabad. Thenumber of 1 million plus cities grew from 9 in 1971 to 35 in 2001, and may rise shortly to 47 such cities(including our second-tier faster growing cities, such as Kanpur, Surat, Jaipur, and Lucknow). Below them arestill smaller but bourgeoning towns. Satellite imagery of night-time lights shows the growing urban "hot-spots".
Urbanisation Lags....
15
25
35
45
Per
cent
pop
ulat
ion
Year
Urban population (per cent total)
1960
1963
1969
1975
1981
1984
1990
1993
1999
2002
2005
2008
India
Indonesia
China
Nigeria
Thailand
55
20
30
40
50
0
0.4
0.8
1.2
Popu
lati
on(m
illio
ns)
Year
China falling
1950
1970
1990
2010
2030
2050
0.2
0.6
1.0
<15 15-64 64+
0
0.4
0.8
1.2
Popu
lati
on(m
illio
ns)
Year
India rising
1950
1970
1990
2010
2030
2050
0.2
0.6
1.0
<15 15-64 64+
Managing Land Markets : Land prices are climbing across India. Once conversion from agricultural to urbanuse is permitted---a difficult regulatory process---land prices can jump twenty-fold. The reason: land valuesreflect the capitalisation of future expected income stream in urban settings (than in farming). As land pricesrise, they drive cost-push inflation. The answer does not lie in tightening land conversion regulations, but to
284 Economic Survey 2010-11
Website: http://indiabudget.nic.in
act counter-intuitively to: (1) improve land conversion processes; (2) sell publicly acquired lands in auctions;and (3) lean with markets and improve the supply of accessible land through better transport. Land isabundant (urban land area is only some 2% of total arable land); it is accessible land that is scarce.
Cities On the Brink : A recent rating on sanitation (19 indicators) by the Ministry of Urban Developmentreveals that 190 out of 423 municipalities in India are on the brink of environmental disaster (coded red)---many in the poorest states of UP and Bihar, but also Andhra Pradesh. Another 229 are judged in need ofmajor improvement, many in the richest states. The sanitation standards in Gaya and Aligarh make up themedian of India's 423 cities. Only 4 make it to safe levels, and none to the highest standard.
Institutions : Institutional reforms are urgent. Absent reform, it can undermine public trust: from masterplanning, to regulatory improvements, basic local services (water, sanitation, roads, public transport,safety, low-cost housing), and greater independence and accountability of locally elected city managers, asintended under the 74th Constitutional Amendment Act for urban local bodies. While the JawaharlalNehru National Urban Renewal Mission (JNNURM) launched in 2005 is funding infrastructure projects in65 cities (requirements include an urban plan, project report, and an MOU which commits to a set ofreforms, including implementation of the 74th Amendment, community involvement, municipal reforms,and earmarking funds and lands for the poor), the project remains limited. Local capacity is also severelylimited. Financial management and procurement systems are weak and PPPs to fund investments limited.
Financing Urban Investments : The scale of funding needs is enormous. A recent study estimated that someUS$1.2 trillion would be required over two decades, and annually an average of about US$95 per capita,versus one-fifth that currently. An alternative estimate: some 7-8 percent of GDP annually, versus the 0.6percent currently. Lessons from elsewhere, especially in East Asia, adapted to India's setting, could beuseful. Possible elements:
Urban Land Value Capture. Public land sales by transparent auctions are essential, instead of beingcaptured by others. In China, while originally unregulated and non-transparent, a constitutional changein 1988 required all public land transactions (land use rights) to be auctioned under open, competitivebidding, similar to Singapore and Hong Kong, with proceeds flowing to the municipalities. Between1990-2002, the speed and extent of such transactions is what permitted much of new urban landscape inChina to emerge (from Guangdong to Shanghai). Mumbai auction of public lands (Bandra-Kurla) haveraised large sums.
Enforcement and Dispute Settlement: Improving Land Administration and Courts. Land administrationneeds to be improved. Specialized courts to handle contract disputes are needed to restrain opportunisticbehavior by developers or local authorities.
Public Redistributive Uses. Some part of land value has to be transparently provided to the community,especially low-cost public housing, which has long dominated successful East Asian urbanization; andimproved connectivity in rural areas and communities, including rehabilitation and resettlement.
Public Land, Densification, Land taxes, and user charges. Publicly owned land has to be fully listed,encroachments removed, and managed transparently---including regular sales to manage land markets.Similarly, eased floor-area-ratios can expand the supply of buildable space (density). Land taxes and usercharges need to brought to economic levels.
State governments to improve area planning and wider connectivity. Local municipalities should handlelocal needs. But larger urbanization strategy will need state government master plans for overlappingjurisdictions and area-wide planning, including new cities and transport corridors. Tamil Nadu, AndhraPradesh and Gujarat are testing new ways.
Increased Central government funding. JNNURM will need redesign, expansion and deepening, addressingmuch larger funding needs---for critical public needs, such as low-cost housing, urban transport, slum re-development, and water and sanitation. A programmatic transfer, rather than project-by-project sanctions,may be needed, benchmarked against front-loaded reforms and results.
Sources: (1) Isher Judge Ahluwalia and others, 2011. Urbanisation and Economic Growth in India, mimeo.(2) McKinsey Global Institute, April, 2010. India's Urban Awakening: Building Inclusive Cities, SustainingEconomic Growth. (3) IDFC, 2009. India Infrastructure Report-Land A Critical Resource for Infrastructure(4) Dowall David, and Paavo Monkkonen, 2008. Urban Development and Land Markets in Chennai, India.International Real Estate Review, Vol. 11 No. 2, pp 142-165
285Energy, Infrastructure and Communications
Website: http://indiabudget.nic.in
Vihar, and Vikarabad during 2010-11. These projectswill contribute towards amelioration of basic servicesin these towns. Approved in 2009, the scheme isperceived as co-terminus with the Eleventh Five YearPlan, i.e. operational till 2012.
11.132 The North Eastern Region UrbanDevelopment Programme (NERUDP) was launchedin November 2009 with ADB assistance. The projectaims to assist the States of Tripura, Mizoram,Sikkim, Meghalaya, and Nagaland to addresschallenges of urban development in their capitalcities. During 2010-11, the States worked onpreparing projects related to water supply and solidwaste management.
Urban transport
11.133 Urban transport is one of the key elementsof urban infrastructure. As compared to privatemodes of transport, public transport is energyefficient and less polluting. The public transportsystem also helps improve urban-rural linkage andimproves access of the rural/semi-urban populationin the periphery to city centres for the purpose oflabour supply without proliferation of slums withinand around cities.
11.134 In this background, the major objective ofurban transport initiatives is to provide efficient andaffordable public transport. A National UrbanTransport Policy (NUTP) was laid down in 2006,with the objectives of ensuring easily accessible,safe, affordable, quick, comfortable, reliable, andsustainable mobility for all.
11.135 In order to provide better transport,proposals for bus rapid transit system (BRTS) wereapproved for Ahmedabad, Bhopal, Indore, Jaipur,Pune, Rajkot, Surat, Vijayawada, andVishakhapatnam cities under the JNNURM. Duringthe current financial year, one more proposal for aBRTS in Kolkata has been approved under theJNNURM taking the number of cities supported forBRTS to 10, covering a total length of 452.20 km ata total estimated cost of ` 5203.79 crore.Admissible Central financial assistance out of thisamount is about ̀ 2374.45 crore.
11.136 Purchase of 15,260 buses at a total cost of` 4723.97 crore has been approved under thescheme, out of which ACA admissible is ̀ 2088.84crore. Till December 2010, more than 10,000 modernintelligent transport system(ITS)-enabled, low floorand semi-low floor buses have been delivered toStates/Cities.
Metro Rail Projects
11.137 In order to give proper legal cover to metroprojects, the Metro Railways Amendment Act 2009was brought into effect in September 2009, providingan umbrella 'statutory' safety cover for metro railwork in all the metro cities of India. The Act wasextended to the National Capital Region, Bangalore,Mumbai, and Chennai metropolitan areas with effectfrom 16October 2009.
11.138 The Government of India had approved theimplementation of the Bangalore Metro Rail Projectof 42.3 km length by Bangalore Metro RailCorporation Ltd. (BMRCL). The project commencedon 20 January 2007 and is targeted for completionby 31March 2013.The Government of India hadapproved implementation of the east-west metrocorridor of 14.67 km length in Kolkata by KolkataMetro Rail Corporation Ltd (KMRCL). The project istargeted for completion by 31January 2015.TheGovernment of India had also approved theimplementation of the Chennai Metro Rail Projectof 46.5 km length by Chennai Metro Rail Ltd.(CMRL). The project is targeted for completion by31March 2015.
11.139 In addition, metro rail projects have beentaken up on PPP basis in Mumbai for Versova-Andheri-Ghatkopar (11.07 km), Charkop toMankhurd via Bandra (31.87 KM) and HyderabadMetro (71.16 KM) with viability gap funding (VGF)support from the Government of India.
FINANCINGINFRASTRUCTURE
Debt financing
11.140 Net bank credit to infrastructure in 2009-10 defined as the difference between outstandinggross deployment of bank credit to infrastructure inMarch 2009 and March 2010, increasedsubstantially in the current fiscal (Table 11.11). Ascompared to net bank credit increase of ` 64,322crore during April-November 2009-10 there has beenan increase of ` 1,02,301 crore during April-November 2010, showing 59 per cent rise.
11.141 The total FDI inflows during April-November2010 have been low compared to the inflows duringthe same period in the previous year. FDI inflowsinto the petroleum and natural gas and air transport
286 Economic Survey 2010-11
Website: http://indiabudget.nic.in
sectors have been comparatively higher during thecurrent financial year. FDI inflows into the power,telecommunications, and information andbroadcasting sectors have been comparatively lowerduring 2010-11 (Table 11.12)
Infrastructure development and PPPs11.142 Given the enormity of the investmentrequirements and limited availability of publicresources for investment in physical infrastructure,it is imperative to explore avenues for increasinginvestment in infrastructure through a combinationof public investment, PPPs and, occasionally,exclusive private investment wherever feasible.
11.143 With the objective of stimulating andmobilizing increased private-sector investments,either from domestic sources or foreign avenues,the Government has offered various incentives forthe infrastructure sector for sustained economicgrowth. These include: allowing 100 per centFDI(under the automatic route) in all infrastructuresectors including the roads, power, ports, and airportsectors; 74 per cent in telecom services and 100per cent in telephone equipment; 49 per cent to100per cent for various services in the aviation sector;extended tax holiday periods up to ten-year taxholidays (under section 80-IA of the Income Tax Act1961) to enterprises engaged in the business ofdevelopment, operation, and maintenance ofinfrastructure facilities; and emphasis on PPP asone of the preferred modes for projectimplementation.
11.144 The Government of India is activelyencouraging PPPs through several initiatives. Theappraisal mechanism for PPP projects has beenstreamlined to ensure speed, eliminate delays, adoptinternational best practices, and have uniformity inappraisal mechanism and guidelines. The appraisalmechanism notified includes setting up of the PublicPrivate Partnership Appraisal Committee (PPPAC)responsible for the appraisal of PPP projects in theCentral sector. The Committee has mandateddetailed guidelines for submitting proposals andfollows a predetermined time frame for accordingapproval to proposals submitted in a time-boundmanner. Standardized bidding and contractual
Table 11.12 : FDI flows to infrastructure (US$ million)
documents have been notified. Further, projectsponsors are encouraged to award projects througha transparent open competitive bidding process,which leads to greater transparency andconsistency.
11.145 PPP projects that are economicallyessential but commercially unviable are providedfinancial assistance in the form of Viability GapFunding(VGF) and long tenor loans through the IndiaInfrastructure Finance Company (IIFC) Limited. IIFC(UK) Ltd., a subsidiary of the IIFCL at London, hasbeen established with the objective of borrowing fundsfrom the RBI and lending to Indian companiesimplementing infrastructure projects in India solelyfor meeting capital expenditure outside India. In orderto ensure quality project development activities bythe States and Central Ministries, the IndiaInfrastructure Project Development Fund (IIPDF)supports up to 75 per cent of the project developmentexpenses in the form of interest-free loans. Theprojects, sponsored by State Governments andmunicipalities represent various sectors wherePPPs are increasingly being adopted, namely urbansector, health and education, civil aviation, androads.
11.146 PPP cells have been established in twenty-four State Governments/UT Administrations andthirteen Central Infrastructure Ministries, which havebecome the central core to catalyse PPPs in anefficient and effective manner in their respectivesectors/States. The Government is providingassistance in the form of professional assistance(PPP and MIS Experts) to the PPP cells of theselected States and Central Ministries. An onlinedatabase on PPP projects in the countrywww.pppindiadatabase.com and the websitewww.pppinindia.com have been developed. Thepurpose of the website is to provide comprehensiveand current information on the status and extent ofPPP initiatives in India at the Central, State, andsectoral levels. A panel of transaction advisers forPPPs has been notified for use by the States andother entities who are undertaking PPP transactions.
11.147 The Department of Economic Affairs (DEA),in collaboration with the ADB initiated the PPP PilotProjects Initiatives where the process of structuringof PPP projects is closely watched over by theCentral Government to develop demonstrable PPPprojects in challenging sectors. Sixty PPP projectsin various States, municipalities, and Central
Ministries have been identified and are being thusdeveloped, encompassing sectors such as ruralsecondary education, elementary education,greenfield hospitals and diagnostic centres, watersupply and sanitation, affordable housing, trainingcentres, and rural infrastructure.
11.148 As part of a wide-ranging effort to createan enabling environment for PPPs, the DEA hasdeveloped the National PPP Capacity BuildingProgramme, in collaboration with the World Bankand the German KfW. The strategy is essentiallyaimed at enhancing the capacities of publicfunctionaries engaged in identification,conceptualizing, structuring, and management ofthe PPP project development cycle. It alsoenhances awareness of key decision makersregarding the critical issues and choices in a PPPcontext. The nation-wide programme comprises fourbuilding blocks, namely training needs assessment,curriculum development, training of trainers, and roll-out. The training needs assessment and curriculumdevelopment have been completed and the NationalPPP Capacity Building Programme has beenlaunched by the Finance Minister on 22 December2010. The Programme will be implemented throughState Administrative Training Institutes (ATIs) andCentral Training Institutes (CTIs). Two level of trainingwould be imparted through the training institutes,namely PPP sensitization courses and specializedmodules on managing PPPs. Sector-specific PPPtoolkits covering four sectors (highways, ports, solidwaste management, and urban transport) have beenlaunched by the Finance Minister on 22 December2010. Risk and contingent liability frameworks andcommunication strategy for greater advocacy ofPPPs is being developed.
11.149 Many State Governments haveinstitutionalized measures to encourage private-sector engagement in creation of infrastructure anddelivery of services. Infrastructure Development andEnabling Acts have been developed by AndhraPradesh, Bihar, Gujarat, and Punjab. PPP policiesand guidelines to facilitate PPP projects have beennotified by Karnataka, Haryana, Orissa, Assam,Goa, Madhya Pradesh, and West Bengal. Othermeasures include development of sectoral policiesfor promoting PPPs, establishing nodal departments/PPP cells, establishing VGFs (to supplement theVGF provided by the Central Government),establishing Project Development Fund (to
288 Economic Survey 2010-11
Website: http://indiabudget.nic.in
Table 11.13 : State-wise and Sector-wise PPP Projects
State Total Number Up to ` ` ` ` ` 100 Between `̀̀̀̀ 251 More than Value ofof Projects crore and 500 crore `̀̀̀̀ 500 crore Contracts
Urban Development 81 2996.13 3484.28 10132 16612.41
Total 518 15,260.85 48,152.99 2,10,433.41 2,73,847.25
Source: I&I Division, DEA, Ministry of Finance.
289Energy, Infrastructure and Communications
Website: http://indiabudget.nic.in
supplement GOI grant under IIPDF), establishingpanels of transaction advisers, and developingstandardized bid documents, sectoral templates,and handbooks on PPPs. Awareness of schemes,guidelines, initiatives, and resource materialsprepared is being created through PPP websites ofCentral and State Governments. These measureshave resulted in a robust pipeline of over 518 projects(at different stages, i.e. bidding, construction, andoperational ) in diverse sectors with an estimatedproject cost of over ` 2,73,847.25 crore. (Table11.13).
CHALLENGES AND OUTLOOK
11.150 The level of investment and capacity additionmade in the key infrastructure sectors during thefirst three years of the Eleventh Plan vis a vis thefinancial and physical performance achieved in theTenth Plan indicates an optimistic outlook forinfrastructure sector as a whole. Yet, to acceleratethe pace of infrastructure development further, certainchallenges need to be overcome. The foremost is tomake huge capacity addition in a time-bound mannerwhile ensuring that projects embody value for moneyand investment results in world class infrastructure.Infrastructure should at the same time be affordableand sustainable.
11.151 The Planning Commission has carried outa preliminary assessment of the investment ininfrastructure during the Twelfth Plan(2012-17). Theprojected investment requirement would be of theorder of ̀ 40,99,240 crore(about US$1025 billion). Itis projected that at least 50 per cent of thisinvestment would have to come from the private sectoragainst about the 36 per cent anticipated in theEleventh Plan. The public-sector investment wouldhave to increase from ` 13,11,293 crore in theEleventh Plan to about ` 20,49,620 crore. Thusfinancing infrastructure would be a big challenge inthe coming years and to meet the challenge someinnovative ideas and new models of financing wouldbe required. Channelling domestic and foreignfinancial savings of this scale into infrastructurerequires a judicious mix of policy interventions whichbalances the growth and stability objectives. TheDeepak Parikh Committee has recommendeddeveloping the domestic debt capital market, tappingthe potential of the insurance sector, and enhancingthe participation of banks, financial institutions, andlarge non-banking financial companies (NBFCs)specializing in infrastructure financing.
11.152 Apart from the need for substantial financialoutlays for infrastructure, there are several non-financing constraints that need to be addressed toavoid time and cost overruns. Urgent action is calledfor in addressing the problems of (i) tendering ofunviable projects; (ii) bad quality of engineering andplanning at DPR stage; (iii) lack of standardized andsub-optimal contracts; (iii) land acquisition delaysand slow approval processes, especiallyenvironmental and forest clearances; (iv) insufficientoptimization of procurement costs (of PSUs);(v) weak performance management in nodal agenciesand PSUs and; (vi) inadequate availability of skilledand semi-skilled manpower.
11.153 It is important that priority should also beaccorded to the physical outcomes frominfrastructure development in India. There is urgentneed to streamline land acquisition and environmentclearance for infrastructure projects. There is astrong case for bringing in parity between thecompensation package admissible under the LandAcquisition Act 1894 and that applicable to landacquisition under the National Highways Act 1956to enable faster acquisition. The price discoveryissues could perhaps be circumvented by allowingprivate parties to bid for supply of the land involved.It is also important that the 80 per cent minimumnorm for physical acquisition of land beforetendering should be strictly enforced throughsuitable disincentives. In case of road expansionprojects, there may also be a case for excludingthe land which is part of the original lanes frombeing counted as part of the acquired land. Anational forest land bank, with clear paperwork andtitles, could significantly reduce the approval timefor forest clearances.
11.154 To overcome execution issues during theconstruction/building stage, the best availabletalent/skilled manpower, for the planning processand at project document preparation stage, needsto be hired. Significant upfront investment inengineering and planning (for example projectcreation, contracting, tendering, project scheduling)is required. Cost overruns may also be mitigatedby moving away from item rates to lump sum EPCcontracts for large projects and creation of greatercapacity for project management and monitoringthrough a multidisciplinary agency. Investment inbuilding managerial and technical capabilities ofexecuting agencies on a par with the private sector(for example procurement, DPR, and monitoring)
290 Economic Survey 2010-11
Website: http://indiabudget.nic.in
is crucial. A way forward would be to kick-start aconstruction-focused vocational training programmethrough a commercially viable PPP.
11.155 There is also need to reassess theexisting criteria and priorities used for allocation offunds to different sectors, for example, taking into
account the growing need for peaking power ratherthan the base load capacity in the power sector,greater focus on rail and water transport, moredemand-side measures in water rather than makinghuge investments in water supply augmentation. Allthis will require a macro-level approach and greaterinter-Ministerial coordination.
Human Development, Equityand Environment CHAPTER
12
The ultimate objective of development planning is human development or increased
social welfare and well-being of the people. Increased social welfare of the peoplerequires a more equitable distribution of development benefits along with better
living environment. Development process therefore needs to continuously strive for
broad-based improvement in the standard of living and quality of life of the peoplethrough an inclusive development strategy that focuses on both income and non-
income dimensions. The challenge is to formulate inclusive plans to bridge regional,
social and economic disparities. The Eleventh Five Year Plan sought to address thischallenge by providing a comprehensive strategy for inclusive development, building
on the growing strength of the economy.
12.2 This chapter focuses on issues related to'inclusive development' in India and uses bothinternational as well as inter-State comparisons toshed light on the subject. Apart from highlightingthe international position of India vis-à-vis otheremerging market economies and similarly placedcountries in terms of the human development index(HDI), an attempt has been made to examine theinterrelations between different parameters of theHDI. From the domestic angle, the chapter focuseson trends in social-sector spending both at thecentre and the state levels. It looks at social-sectorpolicies implemented by the Government, particularlypoverty alleviation and employment generation,health, education, rural infrastructure, developmentof the weaker sections of society, women and childdevelopment, and social security. It also discussesclimate change and its impact on development inthe context of intergenerational equity.
HUMAN DEVELOPMENT AND GENDER
12.3 The HDI reported in the Human DevelopmentReport (HDR) published by the United NationsDevelopment Programme (UNDP) is an alternativeto the more standard method of measuring growthusing gross domestic product (GDP). It capturesprogress in terms of three basic capabilities: to live
a long and healthy life, to be educated andknowledgeable, and to enjoy a decent economicstandard of life. According to HDR 2010, the HDIfor India was 0.519 in 2010 with an overall globalranking of 119 (out of the 169 countries) comparedto 134 (out of 182 countries) in 2007 (HDR, 2009).However, a comparable analysis of the trends during1980-2010 (Table12.1) shows that although lowerin HDI ranking, India has performed better than most(including very high and high human development)countries in terms of average annual HDI growthrate. India with an HDI improvement rank of 6 (1980-2010) has performed much better than mostcomparable countries except China (Table12.1).
12.4 However, there should be no room forcomplacency as India is still in the medium humandevelopment category with countries like China, SriLanka, Thailand, Philippines, Egypt, Indonesia, andSouth Africa having better overall HDI ranking withinthe same category. The existing gap in health andeducation indicators as compared to developedcountries and also many of the developing countriesindicates a need for much faster and wider spreadof basic health and education. Life expectancy atbirth in India was 64.4 years in 2010 as against 81years in Norway, 81.9 years in Australia, 74.4 yearsin Sri Lanka, and 73.5 years in China (Table 12.2).
Website: http://indiabudget.nic.in
292 Economic Survey 2010-11
Website: http://indiabudget.nic.in
Table 12.1 : Trends in the HDI 1980-2010
Avg. Annual HDI HDIGrowth Rate (percent) Improv-
ment RankHDI Country 1980 1990 1995 2000 2005 2009 2010 1980- 1990- 2000- 1980-
Source: HDR 2010Note: * Refers to an earlier year than specified.Figures in parentheses in Column 2 give ranking among 169 countries.
293Human Development, Equity and Environemnt
Website: http://indiabudget.nic.in
It is less than the global average of 69.3 years.Similarly, the performance of India in terms of meanyears of schooling is not only much below that ofcountries like Sri Lanka, China, Egypt, and Vietnam,but also lower than the global average.
12.5 In terms of gender equality index (GEI), Indiawith an index value of 0.748 ranks 122 out of a totalof 168 countries in 2008. The GEI captures the lossin achievement due to gender disparities in the areasof reproductive health, empowerment, and labourforce participation with values ranging from 0 (perfectequality) to 1 (total inequality). The GEI index valueof 0.748 indicates a higher degree of genderdiscrimination in India compared to countries likeChina (0.405) and Sri Lanka (0.599).
Trends in India's social-sector expenditures
12.6 The Central Government expenditure on socialservices and rural development (Plan and non-Plan)which contributes to human development has goneup consistently over the years (Table 12.3). It hasincreased from 13.75 per cent in 2005-06 to 19.27per cent in 2010-11. The Central support for socialprogrammes has continued to expand in variousforms although most social-sector subjects fall within
the purview of the States. Major programme-specificfunding is available to the States through CentrallySponsored Schemes.
12.7 Expenditure on social services (which includeeducation, medical and public health, family welfare,water supply and sanitation, welfare of ScheduledCastes (SCs), Scheduled Tribes (STs) and OtherBackward Classes (OBCs), labour and labourwelfare, social security, nutrition, and relief for naturalcalamities, etc.) by the General Government (Centreand States combined) has also shown increase inrecent years (Table 12.4) reflecting the higher prioritygiven to this sector. Expenditure on social servicesas a proportion of total expenditure increased from21.1 per cent in 2005-06 to 23.8 per cent in 2008-09and further to 25.2 per cent in 2010-11 (BE). As aproportion of GDP, its share increased from 5.49 percent in 2005-06 to 6.63 per cent in 2010-11 (BE).Expenditure on education as a proportion of totalexpenditure has increased marginally from 10 percent in 2005-06 to 11.3 per cent in 2010-11 (BE).While the expenditure on health as a proportion ofthe GDP has increased from 1.23 per cent in 2005-06 to 1.27 per cent in 2010-11 (BE), its share in totalexpenditure has increased marginally from 4.7 percent in 2005-06 to 4.8 per cent in 2010-11 (BE).
Table 12.3 : Central Government Expenditure (Plan and non-Plan) on Social Services andDevelopment
(as Per Cent of total expenditure)ITEM 2005-06 2006-07 2007-08 2008-09* 2009-10 2010-11
Inclusive Development12.8 This section and the one that follows on socialsector initiatives, examines the major dimensionsof inclusive development like poverty alleviation,employment generation, health, education, andsocial welfare besides giving the progress ofimportant Government programmes in those sectors.
12.9 Inclusive development can be seen in terms ofprogress in social inclusion and financial inclusion.Despite more than six decades of planned economicdevelopment, a large part of the population, particularlysegments like landless agricultural labourers, marginalfarmers, SCs, STs, and OBCs, suffers social andfinancial exclusion. Accordingly, the Government'spolicies are directed towards economic and socialupliftment of these segments so as to enable everyoneto reap the benefits of growth.
12.10 There is a close connection between socialinclusion and financial inclusion. Accordingly, theGovernment has devised many schemes for financialinclusion of the socially excluded like SCs, STs,OBCs, and the disabled. The details of some of theseare given in Table 12.5. A major financial inclusionintiative was formally launched as “Swabhimaan” on10 February, 2011 which aims at providing branchlessbanking through the use of technology. Banks willprovide basic services like deposits, withdrawal andremittances using the services of BusinessCorrespondents (Banks Saathi). The initiativeenables Government subsidies and social securitybenefits to be directly credited to the accounts ofthe beneficiaries, enabling them to draw the moneyfrom the Business correspondents in their villageitself.
Table 12.4 : Trends in Social Services Expenditure by General Government(Central and State Governments combined)
(` crore)
Items 2005-06 2006-07 2007-08 2008-09 2009-10 2010-11Actual Actual Actual Actual (RE) (BE)
Total 196.51 98.3 17.87 312.68 48,049 76,663 9,539 1,34,251
Source: Ministry of Social Justice & Empowerment.
Notes: * including estimated number of beneficiaries on average loan basis against released advance fundsto State Channalising Agencies (SCAs).NSCFDC—National Scheduled Caste Finance and Development Corporation;NSKFDC-National Safai Karamcharis Finance Development Corporation;NBCFDC—National Backward Classes Finance Development Corporation;NHFDC—National Handicapped Finance and Development Corporation.
12.11 Special efforts are being made by theGovernment of India for the social and economicupliftment of the north-east region. While in terms ofsome parameters like gross state domestic product(GSDP) growth and literacy rate the north-eastern
states are doing comparatively better, they are stilllagging behind in terms of financial inclusion. Thetribal population which constitutes a major chunk ofthe population is very much distanced from thesocio-economic development visible in the rest of
Box 12.1 : North-Eastern States and Financial Inclusion
In terms of financial inclusion the north-east region lags behind the rest of the nation. Banks have entered the north-easternstates very late. Among north eastern states, only Assam, Meghalaya, Tripura and Sikkim have had local banks operatingfor the last few decades. Private-sector banks are conspicuous by their low presence in these states. If the gross inadequacyof the branch network is one of the factors hindering financial inclusion, political disturbances resulting in the non-functioning of some of the existing branches is another. For extending credit, some banks have liberally issued Kisan CreditCards to farmers. Self-help groups are also being promoted in large numbers for providing micro-finance to the poor. Yet,the number of those who remain beyond the reach of banks is more than those who have been covered by bank branches.
The banking penetration ratio (defined as the proportion of the households availing banking facilities) is very low in thenorth-east region. According to the Analytical Report on Household Assets, Census of India 2001, the banking penetrationratio in almost all states except Arunachal Pradesh is lower than the national average, with Manipur having the lowest ratio(see Table).
Table(in per cent)
State Banking Penetration Ratio State Banking Penetration Ratio
The National Sample Survey (NSS) data of 59th Round (2003), reveal that the proportion of farm households excludedfrom accessing credit from institutional sources to total farm households is as high as 96 in the north eastern States. Thusbanking development indicators show the poor state of banking and resultant low level of financial outreach in these states.
The Central Government's "New Initiatives for North Eastern Regions" announced in 1996 proposed a number of measuresincluding setting up of the North Eastern Development Finance Corporation Ltd. for integrated development of the region.The RBI has also set up a committee for a financial-sector plan for the north-east region in 2006. To improve bankingpenetration in the north-east, the RBI has asked the state governments in the region as well as banks to identify centreswhere there is a need for setting up branches or banking facilities. RBI would bear the one time capital cost and recurringcost per annum for a limited period of 5 years under the Viability Gap Funding scheme for the north-east region. RBI hasalso permitted banks to open branches in rural, semi urban and urban centers in north-eastern states without its permissionsubject to reporting. Awareness programme for educating the uninitiated rural population are being organized by all bankswith the active support of the RBI. However, a lot more needs to be done for financial inclusion of the north-east region.
296 Economic Survey 2010-11
Website: http://indiabudget.nic.in
the country. Moreover, each of the eight north-eastern states has its own ethnic and socio-economic problems for which there is no uniformsolution, making the implementation of policymeasures difficult. Added to this are inherentproblems of lower growth rate, low populationdensity, lack of infrastructure development, andinsurgency. Social inclusion in the north-east isclosely linked to financial inclusion and correctivesteps are needed in this direction (Box 12.1).Recognizing this reality, the Eleventh Five Year Planaimed at faster and more inclusive growth byrestructuring policies with special focus on thisregion. Within this policy paradigm, the ReserveBank of India (RBI) has also launched acomprehensive programme with financial inclusionas a goal of the banking system.
POVERTY AND INCLUSIVE GROWTH
12.12 The HDR 2010 measures poverty in termsof a new parameter, namely multidimensional povertyindex (MPI), which replaced the human poverty index
(HPI) used since 1997. The MPI indicates the shareof the population that is multidimensionally pooradjusted by the intensity of deprivation in terms ofliving standards, health, and education. Accordingto this parameter, India with a poverty index of 0.296and poverty ratios of 41.6 per cent (in terms of PPP$ 1.25 a day ) and 28.6 per cent (national povertyline) is not favourably placed when compared withcountries like China and Sri Lanka. In fact, thedifference in population below the poverty line (BPL)widens substantially in case of India when thisindicator is used instead of the national poverty lineindicator, while for other countries, there is less of adifference and in some cases even a fall (Table 12.6).
12.13 The Planning Commission which is the nodalagency for estimating the number and proportionof people living below the poverty line at nationaland State levels, separately for rural and urbanareas, makes poverty estimates based on a largesample survey of household consumptionexpenditure carried out by the National SampleSurvey Organization (NSSO) after an interval of
Table 12.6 : Multidimensional Poverty Index
Population below Income Poverty Line
Country Multidimensional PPP $1.25 National PovertyPoverty Index* a day Line2000-2008** 2000-2008** 2000-2008**
Poland — (41) Less than 2 14.8
Malaysia ——(57) Less than 2 12.8
Russia 0.005 (65) Less than 2 19.6
Brazil 0.039 (73) 5.2 21.5
Turkey 0.039 (83) 2.6 27
China 0.056 (89) 15.9 2.8
Sri Lanka 0.021 (91) 14 22.7
Thailand 0.006 (92) Less than 2 —-
Philippines 0.067 (97) 22.6 ——
Egypt 0.026 (101) Less than 2 16.7
Indonesia 0.095 (108) 29.4 16.7
South Africa 0.014(110) 26.2 22.0
Vietnam 0.075(113) 21.5 28.9
India 0.296 (119) 41.6 28.6
Pakistan 0.275(125) 22.6 —
Kenya 0.302(128) 19.7 46.6
Bangladesh 0.291(129) 49.6 40.0
Source: HDR 2010.
Note: * Not all indicators were available for all countries; Caution should thus be used in cross-countrycomparisons.
** Data refer to the most recent year available during the period specified.Figures in parentheses in Column 2 give ranking among 169 countries.
297Human Development, Equity and Environemnt
Website: http://indiabudget.nic.in
approximately five years. The Commission has beenestimating the poverty line and poverty ratio since1997 on the basis of the methodology spelt out inthe report of the Expert Group on 'Estimation ofNumber and Proportion of Poor' (known asLakdawala Committee Report). On the basis of NSS61st Round (July 2004 to June 2005) consumerexpenditure data, the poverty ratio is estimated at28.3 per cent in rural areas, 25.7 per cent in urbanareas, and 27.5 per cent for the country as a wholein 2004-05 using uniform recall period (URP). InURP, consumer expenditure data for all the itemsare collected for a 30-day recall period. Based onmixed recall period (MRP) for the same period, thepoverty ratios are 21.8 per cent in rural areas, 21.7per cent in urban areas, and 21.8 per cent for thecountry as a whole. In MRP, consumer expendituredata for five non-food items, namely clothing,footwear, durable goods, education, and institutionalmedical expenses, are collected for a 365-day recallperiod and the consumption data for the remainingitems are collected for a 30-day recall period. Thepoverty estimate in 2004-05 based on URPconsumption (27.5) is comparable to that of 1993-94 (36). The poverty estimates in 2004-05 basedon MRP consumption (about 21.8) is roughly (butnot strictly) comparable to that of 1999-2000 (26.1).Table 12.7 shows the comparable poverty estimatesbased on the URP and MRP methods.
Methodology for Estimation of Poverty andBPL Households
12.14 While the estimation of poverty at nationaland State levels, separately for rural and urban areas,is done by the Planning Commission, the Ministryof Rural Development has been conducting the BPLcensus to identify individual households below the
poverty line in rural areas while ensuring that thetotal number of such households corresponds tothe Planning Commission estimates. Themethodology of estimating poverty and theidentification of BPL households have been a matterof debate. Two committees under the chairmanshipof Prof. Suresh D. Tendulkar and Dr. N.C. Saxenahave submitted their reports on methodology forestimation of poverty and methodology forconducting BPL census in Rural areas, respectively.Further, an expert Group under the chairmanshipof Prof. S.R. Hasim has been set up to recommendmethodology for identification of BPL families inurban areas (Box.12.2).
Inequality
12.15 According to HDR 2010, inequality in Indiafor the period 2000-10 in terms of the income Ginicoefficient was 36.8. India's Gini index was morefavourable than those of comparable countries likeSouth Africa (57.8), Brazil (55), Thailand (42.5),Turkey (41.2), China (41.5), Sri Lanka (41.1),Malaysia (37.9), Vietnam (37.8), Indonesia (37.6),and even the USA (40.8), Singapore (42.5), HongKong (43.4), Portugal (38.5), and Poland (34.9) whichare otherwise ranked very high in human development.
12.16 Inter-State inequality as reflected in theLorenz ratio, estimated by the NSSO based onhousehold consumer expenditure for 2004-05, for ruralIndia and urban India for total consumptionexpenditure was 0.30 and 0.37 respectively. Thisindicates, higher relative inequality in urban areas.Lower inequality was seen in rural areas of Assam(0.197), Meghalaya (0.155), and Manipur (0.158) thanin Kerala (0.341), Haryana (0.323), Tamil Nadu(0.315), and Maharashtra (0.310). Similarly, lowerinequality was seen in urban areas of ArunachalPradesh (0.243), Jammu & Kashmir (0.244),Meghalaya (0.258), and Manipur (0.175) than inChattisgarh (0.439), Goa (0.405), Kerala (0.400), andMadhya Pradesh (0.397). Disparities in cerealconsumption are less marked than disparities in totalconsumption expenditure, whereas greaterdisparities exist in consumption of durable goodsthan in total consumption.
Employment
12.17 The key strategy for achieving inclusivegrowth in the Eleventh Plan has been generation ofproductive and gainful employment, with decentworking conditions, on a sufficient scale to absorbthe growing labour force. The Eleventh Plan
Table 12.7: Poverty Ratios by URP and MRP
(per cent)
Sl. No. Category Years
By URP Method 1993-94 2004-05
1. Rural 37.3 28.3
2. Urban 32.4 25.7
3. All India 36.0 27.5
By MRP Method 1999-2000 2004-05
4. Rural 27.1 21.8
5. Urban 23.6 21.7
6. All India 26.1 21.8
Source: Planning Commission.
298 Economic Survey 2010-11
Website: http://indiabudget.nic.in
Box 12.2 : Expert Groups for Estimating Poverty and BPL Families
I. Tendulkar Committee Report to Review the Methodology for Estimation of Poverty
The Planning Commission constituted an Expert Group in December 2005 under the chairmanship of Professor Suresh D.Tendulkar to review the methodology for estimation of poverty. The Expert Group submitted its report in December 2009.While acknowledging the multidimensional nature of poverty, the Expert Group recommended moving away from anchoringpoverty lines to the calorie - intake norm to adopting MRP based estimates of consumption expenditure as the basis forfuture poverty lines and MRP equivalent of the urban poverty line basket (PLB) corresponding to 25.7per cent urbanheadcount ratio as the new reference PLB for rural areas. On the basis of the above methodology, the all-India rural povertyheadcount ratio for 2004-05 was estimated at 41.8 per cent, urban at 25.7 per cent, and all-India at 37.2 per cent. It may,however, be mentioned that the Tendulkar Committee's estimates are not strictly comparable to the official povertyestimates because of different methodologies. The relevant estimates for 1993-94 and 2004-05 are shown in the Table.
As has been indicated in the Mid Term Appraisal of the Eleventh Five Year Plan, the revised poverty lines for 2004-05 asrecommended by the Tendulkar Committee have been accepted by the Planning Commission. The Tendulkar Committeehas specifically pointed out that the upward revision in the percentage of rural poverty in 2004-05, resulting from theapplication of a new rural poverty line should not be interpreted as implying that the extent of poverty has increased overtime. These estimates, as reported by the Committee, clearly show that whether we use the old method or the new, thepercentage of BPL population has declined by about the same magnitude.II. Saxena Committee Report to Review the Methodology for Conducting BPL Census in Rural AreasAn Expert Group headed by Dr N.C. Saxena was constituted by the Ministry of Rural Development to recommend asuitable methodology for identification of BPL families in rural areas. The Expert Group submitted its report in August2009 and recommended doing away with score-based ranking of rural households followed for the BPL census 2002. TheCommittee has recommended automatic exclusion of some privileged sections and automatic inclusion of certain deprivedand vulnerable sections of society, and a survey for the remaining population to rank them on a scale of 10.
Automatic Exclusion Households that fulfil any of the following conditions will not be surveyed for BPL census: Families who own double the land of the district average of agricultural land per agricultural household if partially or
wholly irrigated (three times if completely unirrigated). Families that have three or four wheeled motorized vehicles, such as, jeeps and SUVs. Families that have at least one mechanized farm equipment, such as, tractors, power tillers, threshers, and harvesters. Families that have any person who is drawing a salary of over ` 10,000 per month in a non-government/ private
organization or is employed in government on a regular basis with pensionary or equivalent benefits. Income tax payers.
Automatic InclusionThe following would be compulsorily included in the BPL list: Designated primitive tribal groups. Designated most discriminated against SC groups, called Maha Dalit groups. Single women-headed households. Households with a disabled person as breadwinner. Households headed by a minor. Destitute households which are dependent predominantly on alms for survival. Homeless households. Households that have a bonded labourer as member.
Survey of the remaining rural households is to be conducted and scores given depending upon the different socio-economicparameters recommended by the committee. The Ministry of Rural Development is in the process of conducting the pilotstudies and participatory rural appraisal (PRA) exercises to fine tune the methodology.
III. Expert Group (S.R. Hashim Committee) on the Methodology for Identification of BPL Families in Urban Areas.
The Ministry of Housing and Urban Poverty Alleviation (HUPA) is the nodal Ministry for issue of guidelines to identifyBPL families in urban areas. Till now, no uniform methodology was being followed by the States/UTs to identify the urbanpoor. An Expert Group under the Chairmanship of Professor S.R. Hashim has been constituted by the Planning Commissionto recommend the methodology for identification of BPL families in urban areas. The Expert Group is expected to submitits report shortly.
299Human Development, Equity and Environemnt
Website: http://indiabudget.nic.in
(2007-12) aims at generation of 58 million workopportunities in twenty-one high growth sectors sothat the unemployment rate falls to 4.83 per cent bythe end of the Plan. The 64th round (2007-08) ofNSSO survey on employment-unemploymentindicates creation of 4 million work opportunitiesbetween 2004-05 and 2007-08.
12.18 As highlighted in Economic Surveys ofprevious years based on NSSO data, employmenton a current daily status (CDS) basis during 1999-2000 to 2004-05 had accelerated significantly ascompared to the growth witnessed during 1993-94to 1999-2000. During 1999-2000 to 2004-05, about47 million work opportunities were created comparedto only 24 million in the period between 1993-94 and1999-2000 and employment growth accelerated from1.25 per cent per annum to 2.62 per cent per annum.However, since the labour force grew at a faster rateof 2.84 per cent than the workforce, unemploymentalso rose. The incidence of unemployment on CDSbasis increased from 7.31 per cent in 1999-2000 to8.28 per cent in 2004-05.
Unemployment
12.19 The next quinquennial round of survey i.e.the 66th NSS round for estimating unemploymentrates is under way with fieldwork undertaken during2009-10. The updated information based on thisround is awaited. However, an estimate ofunemployment rates based on the 64th round isshown in Table 12.8. A comparative study of differentestimates of unemployment during 2007-08 indicatesthat the CDS estimate of unemployment rate beingthe broadest is the highest. The higherunemployment rates according to the CDS approachvis-a-vis weekly and usual status approachesindicate a high degree of intermittent unemployment.
The CDS captures the unemployed days of thechronically unemployed, the unemployed days ofthe usually employed who become intermittentlyunemployed during the reference week, andunemployed days of those classified as employedaccording to the current weekly status criterion.
Employment in the Organized Sector
12.20 Employment growth in the organized sector,public and private combined, increased during theperiod 1994- 2008. This has primarily been due toemployment growth in the private sector.Employment in establishments covered by theEmployment Market Information System of theMinistry of Labour and Employment grew at 1.20per cent per annum during 1983-94 but the growthdecelerated to 0.05 per cent per annum during 1994-2008. This decline was mainly due to a decrease inemployment growth in public-sector establishmentsfrom 1.53 per cent per annum in the earlier period to(-)0.65 per cent per annum in the later period. Theprivate sector, on the other hand, showed acceleratedgrowth from 0.44 per cent to 1.75 per cent perannum (Table12.9).
Table 12.8 : All-India Rural and UrbanUnemployment Rates* from the NSS64th Round 2007-08: Different Estimates
Sl. No. Estimate Rural Urban
1 UPS 2.2 4.5
2 US(adj.) 1.6 4.1
3 CWS 3.9 5.0
4 CDS 8.4 7.4
Notes:* As per cent of labour force.
UPS– usual principal status; US (adj.)–usuallyunemployed excluding subsidiary status workers;
CWS–current weekly status.
Source: NSS Report No. 531(64/10.2/1).
Effect of Global Financial Crisis and Eco-nomic Slowdown
12.21 The global financial crisis of 2008 loweredthe growth rate for 2008-09 to 6.8 per cent from over9.0 per cent during each of the previous three years.As the Government was concerned about thepossible fallouts of the global slowdown on the Indianeconomy, including job loss and on creation ofadditional employment, financial and fiscal stimuluspackages were announced. As a result, the Indianeconomy started to recover robustly, climbing backto near pre-crisis levels, and recording one of thefastest growth rates in the world. The Governmenthas been continuously monitoring the effect of the
Table 12.9 : Rate of Growth of Employmentin the Organized Sector
(per cent per annum)
1983-94 1994-2008
Public Sector 1.53 -0.65
Private Sector 0.44 1.75
Total Organized 1.20 0.05
Source: Planning Commission and DirectorateGeneral of Employment and Training (DGET), Ministryof Labour and Employment.
300 Economic Survey 2010-11
Website: http://indiabudget.nic.in
global financial crisis and economic slowdown onemployment in India. The Quarterly QuickEmployment Surveys conducted by the LabourBureau indicate that the upward trend in employmentsince July 2009 has been maintained (Box.12.3).
Socio- Economic Development: Inter Statecomparison
12.22 Inclusive development also includes theobjective of reduction of inter-State and inter-regionaldisparities. The national Human Development Report2001 of the Planning Commission had made detailedcomparisons in this respect using developmentindicators. No such major official exercise has sincebeen carried out , though there are many studies bydifferent organizations. The Economic Survey 2007-08 had also made inter-State comparisons basedon socio-economic indicators. The inter-Statecomparisons of socio-economic development ofselected states based on the available indicatorsgiven in Table 12.10 show some interesting results
(Box 12.4). However, a word of caution is needed asthe latest data for many of the important indicatorsare not available at national level.
12.23 The socio-economic performance of Stateshas been varied. While developed states like Gujarat,Maharashtra, Karnataka, Haryana, Kerala, and TamilNadu have performed well in terms of manyindicators, many hitherto backward states like Bihar,Orissa, and Uttarakhand are showing good growthperformance and many of the backward states likeRajasthan, Uttar Pradesh, Madhya Pradesh, andBihar are benefiting from poverty-alleviationemployment schemes like the MGNREGS andNRHM.
Poverty-alleviation and employment-genera-tion programmes
12.24 With a view to achieving inclusivedevelopment, several poverty-alleviation andemployment-generation programmes are beingimplemented by the Government of India. Some ofthe important schemes are as follows:
(i) The Mahatma Gandhi National RuralEmployment Guarantee Scheme(MGNREGS):
12.25 This flagship programme of the Governmentof India touches the lives of the rural poor andpromotes inclusive growth. The MGNREGS aims atenhancing livelihood security of households in ruralareas of the country by providing at least one hundreddays of guaranteed wage employment in a financialyear to every household whose adult membersvolunteer to do unskilled manual work. It alsomandates 33 per cent participation for women. Theprimary objective of the Scheme is to augment wageemployment. This is to be done while also focussingon strengthening natural resource managementthrough works that address causes of chronic povertylike drought, deforestation, and soil erosion and thusencourage sustainable development. The MGNREGAct was notified in 200 districts in the first phasewith effect from 2 February 2006 and then extendedto an additional 130 districts in the financial year2007-08. The Act has been notified throughout thecountry with effect from 1 April 2008. During 2009-10, 5.26 crore households were providedemployment under this scheme as against morethan 4.51crore during 2008-09. During 2010-11,the budget estimate for the MGNREGS is ̀ 40,100crore out of which ` 29,822.59 crore have beenreleased to the States/ UTs till February 10, 2010.
Box 12.3 : Eighth Quarterly Survey Report onEffect of Economic Slowdown on Employmentin India July to September 2010
The Labour Bureau conducted eight quarterly quickemployment surveys to assess the impact of the economicslowdown on employment in India. The results for selectedsectors, i.e. textiles including apparel, leather, metals,automobiles, gems and jewellery, transport, informationtechnology (IT)/business process outsourcing (BPO) andhandloom / powerloom are briefly summarized asfollows:-
While comparing the results of the last four quarterlysurveys, i.e. September 2010 over September 2009,overall employment has increased by 12.96 lakh, withthe highest increase of 9.36 lakh in IT/BPO followed by0.79 lakh in textiles, 0.99 lakh in metals, 1.15 lakh inautomobiles, and 0.39 lakh in gems and jewellery.
An upward trend in employment has been continuouslyobserved since July 2009. During the quarter July toSeptember 2010, employment has increased in respectof all eight sectors and overall employment by 4.35lakh. At sectoral level, the maximum increase of 2.45lakh during the period is in textiles including apparel,followed by 1.08 lakh in IT/BPO, 0.29 lakh inautomobiles, and 0.27 lakh in metals.
In export-oriented units, overall employment hasincreased by 3.05 lakh whereas in non-exporting units,it has increased by 1.30 lakh during the periodSeptember 2010 over June 2010.
301Human Development, Equity and Environemnt
Website: http://indiabudget.nic.in
Box 12.4 : Socio-economic Development in Indian States
Growth related The best performer in terms of growth during 2002-03 to 2008-09 was Gujarat, followed by Bihar, Orissa, Haryana,
and Uttarakhand. States like Madhya Pradesh, Assam, Punjab, and Uttar Pradesh registred a relatively lowergrowth rate. Interestingly, the best performer in 2008-09 was Bihar with a growth rate of 16.59 per cent. While thegood growth performance of some of the hitherto backward states like Bihar and Orissa is a welcome sign, this mayalso be partially due to the low base effect because of the growth deficit in earlier years. In fact, many states likeBihar, Chattisgarh, Orissa, and Uttarakhand that showed high growth in 2002-03 to 2008-09, had witnessed lowgrowth in 1994-95 to 2001-02.
Poverty Related
The percentage of people below the poverty line is very high in states like Orissa, Bihar, Chhattisgarh, Jharkhand,Uttarakhand, and Madhya Pradesh, both in terms of URP and MRP. Punjab is the best performing state in terms of thisindicator.
Income inequality measured by the Gini coefficient (in rural areas) is highest in Haryana followed by Kerala, Maharashtra,Punjab, Tamil Nadu, and West Bengal. Though inequality is lowest in rural areas of Bihar and Assam, this may meangreater equality at low levels of income.
In urban areas, income inequality is highest in Madhya Pradesh followed by West Bengal, Haryana, Karnataka, Kerala,Maharashtra, and Chhattisgarh.
Health Related
Infant mortality rates (IMR) i.e. the number of infant deaths (one year of age or younger) per 1000 live births, for whichrelatively recent data are available, were highest in Madhya Pradesh, Orissa, Uttar Pradesh, Assam, Rajasthan,Chhattisgarh, and Bihar. Kerala was by far the best performing State, way above Tamil Nadu and Maharashtra.
Birth rates in 2008 were lowest in Kerala, while UP had the highest rates, followed by Bihar, Madhya Pradesh, andRajasthan.
While death rates do not show large variation across States, the worst performer in this regard was Orissa, followed byMadhya Pradesh, Assam, and Uttar Pradesh.
Education Related
Interestingly, the best performer in terms of gross enrolment ratio (GER) for elementary education was Jharkhand,followed by Madhya Pradesh, Chhattisgarh, and Gujarat and the worst performers were Haryana, Kerala, and Punjabwhich were the best performers in many other areas. This may be due to overage children studying in primary schoolsin backwards states and double entry of data in some states. GER for secondary education was highest in HimachalPradesh, Tamil Nadu, Kerala, and Madhya Pradesh while Bihar was the worst performing State.
MGNREGS
Under the Mahatma Gandhi National Rural Employment Guarantee Schemes (MGNREGS), maximum employmentduring 2009-10 was provided in Rajasthan followed by Andhra Pradesh, Uttar Pradesh, Madhya Pradesh, TamilNadu and Bihar.
In terms of share in person days under the MGNERGS, the share of SCs was highest in Punjab followed by TamilNadu, Uttar Pradesh, Haryana, and Bihar, while the share of STs was highest in Madhya Pradesh followed byJharkhand, Gujarat, and Chhattisgarh. The share of women was highest in Kerala followed by Tamil Nadu, Rajasthan,and Andhra Pradesh.
NRHM
Under the National Rural Health Mission (NRHM), the maximum number of primary health centres were operatingin Tamil Nadu, followed by Karnataka, Andhra Pradesh, Maharashtra, Uttar Pradesh and Bihar.
About 4.10 crore households have been providedemployment during 2010-11 till December 2010. Outof the 145 crore person days created under thescheme during this period, 23 per cent and 17 percent were accounted for by SC and ST populationrespectively and 50 per cent by women. Manyinitiatives are being taken for better and moreeffective implementation of the MGNREGS (Box12.5). However, there is scope for improvementslike shifting to permanent asset creation and
infrastructure building activities, reducing transactioncosts, better monitoring, and extension to urbanareas.
(ii) Swarnjayanti Gram Swarojgar Yojana(SGSY)
12.26 The SGSY is a major ongoing schemelaunched in April 1999 to help poor rural families(Swarozgaris) cross the poverty line by assistingthem to take up income- generating economic
302 Economic Survey 2010-11
Website: http://indiabudget.nic.in
activities through a mix of bank credit and governmentsubsidy. The scheme involves selection of keyactivities, planning of activity clusters, organizationof the poor into self-help groups (SHGs), and buildingof their capacities through training and skilldevelopment, creation of infrastructure, andtechnological and marketing support. The SGSYspecially focuses on vulnerable sections among therural poor with SCs/STs to account for at least 50
per cent and women 40 per cent of the swarozgaris.The share of minorities and disabled persons will be15 per cent and 3 per cent respectively. Also, 15 percent of the SGSY allocation is set apart for specialprojects that are implemented with different modelsof self-employment generation and to enhance theincome-generating capacity of the rural poor. Sinceits inception, up to December 2010, 40.04 lakh SHGshave been formed under the SGSY, with women
Table 12.10 : Socio Economic Profile of Major States of India
Source : Planning Commission, Office of Registrar General of India (RGI), Ministry of Human Resource Development (HRD), Ministryof Health and Family Welfare* MRP–Mixed recall period, *URP-Uniform recall period, HH—household.**Data relating to Bihar, MP, and UP include Jharkhand, Chattisgarh, and Uttrakhand respectively.
SHGs accounting for about 68 per cent of the total.During this period, a total of about 154.87 lakhswarojgaris have been assisted with bank credit andsubsidy. The total investment under the SGSY is ̀37,927 crore, including ̀ 25,743.29 crore credit and` 12,183.58 crore subsidy. Under the Special Projectcomponent of the SGSY, a placement-linked skilldevelopment programme has been taken up withthe objective of helping a specific number of BPL
families cross the poverty line through regular wageemployment. About 9.00 lakh rural BPL beneficiariesare to be covered through 116 projects sanctioned /approved so far with an outlay of about ̀ 1200 crore.About 2.25 lakh youth have already been trained /are under training and 1.75 lakh placed so far. Anew initiative has also been taken up for setting upa Rural Self Employment Training Institute(RSETI)in each district of the country for basic and skill
*** Quick estimates given in Key Statistics of Gujarat State, 2009-10, Directorate of Economics and Statistics, Government of Gujarat.
Jhark- Karna- Kerala Madhya Mahara- Orissa Punjab Rajas- Tamil Uttar Uttar- West All-hand taka Pradesh shtra than Nadu Pradesh khand Bengal India
Box 12.5 : MGNREGS : Major Initiatives for Effective Implementation
Major initiatives for effective implementation of the MGNREGS are as follows:
(a) Increasing Transparency and Public Accountability:
Social Audits: States have reported that social audits have been conducted in 93 per cent of the Districts . Around 2.41lakh social audit reports have been uploaded on the MGNREGS website indicating verification of 45,428 lakh documentsin 2009-10.
A new scheme for monitoring by eminent citizens has been introduced whereby 61 eminent citizens have been engaged.Each has been assigned one district to provide first- hand feed-back on the implementation of the MGNREGS.
An ombudsman has been instituted in each district for effective grievance redressal.
(b) Effective Administrative and Financial Management of the MGNREGS:
Labour Budget: Under Section 14(6) of the NREGA, District Programme Coordinators are required to prepare labourbudgets in the month of December for the next financial year containing the details of anticipated demand of unskilledmanual work. The procedures and principles for labour budget have been put in place and operationalized in 2010-11.The labour budget principle ensures smooth fund flow on rational basis to the districts for implementation of theMGNREGS scheme.
State Employment Guarantee Fund: Under Section 21(1) of the NREGA, States have been instructed to establish StateEmployment Guarantee Funds. The State Funds will give greater flexibility to the States in fund management forimplementation of the MGNREGS. State Funds have been set up in eleven States, namely Rajasthan, Andhra Pradesh,Karnataka, Himachal Pradesh, Orissa, West Bengal, Madhya Pradesh, Uttar Pradesh,Tamil Nadu, Punjab, and Gujarat.The Central fund for the MGNREGS has been directly released to State Fund accounts of the respective States.
Strengthening administrative support systems: Permission is given for the use of 6 per cent of the budget available foradministrative expenses by the State. The Central Government has recommended for the recruitment of one GramRozgar Sewak Sahayak in every panchayat, one technical assistant for every five gram panchayats, at least onecomputer assistant per block, and one full-time dedicated programme officer in every block. This issue has beenconstantly monitored with States.
Pilot Initiatives: To build on the current programme implementation and to leverage the MGNREGS for sustainabledevelopment, the Central Government has started pilot projects in Rajasthan. These initiatives include training and skillbuilding for MGNREGS workers, basic literacy, computer and financial literacy, and facilitating wage payment throughthe business correspondent mode.
Convergence: In view of the inter-sectoral linkages of the MGNREGS, the need to create durable assets, improvelivelihood security, facilitate more flexibility in choice of works to suit the specific conditions of States and serve betterthe common target groups of certain development programmes with the MGNREGS, the Central Government hasdeveloped and disseminated convergence guidelines with different schemes and specific programmes, namely theIndian Council of Agricultural Research, National Aforestation Programme, and other schemes of the Ministry of Forestand Environment, Schemes of the Ministry of Water Resources, the PMGSY (Department of Rural Development),Swarnjayanti Gram Swarozgar Yojana (SGSY) (Department of Rural Development), Watershed DevelopmentProgrammes (Department of Land Resources, Ministry of Rural Development) , Ministry of Agriculture and Fisheries,and schemes of the Ministry of Agriculture. Convergence pilot projects have been taken up in 115 districts and 23 Statesacross India. State-level reviews and field visits are being undertaken to monitor these initiatives. The National Instituteof Rural Development (NIRD) and independent agencies are closely monitoring the convergence projects.
development training of rural BPL youth to enablethem to undertake micro-enterprises and wageemployment. The Government has approved 215RSETIs out of which funds have been released to149. During 2009-10, approximately 77,000 ruralyouth (including 54,000 BPL youth) were trained in99 RSETIs functioning in the country
(iii) Swarna Jayanti Shahari Rozgar Yojana(SJSRY)
12.27 The SJSRY launched by the Government ofIndia in December 1997 has been revamped witheffect from April 2009. The scheme provides gainful
employment to the urban unemployed andunderemployed through encouraging the setting upof self-employment ventures or provision of wageemployment, The revamped scheme has the followingfive components: (i) Urban Self EmploymentProgramme (USEP) (II) Urban Women Self-helpProgramme (UWSP) (iii) Skill Training forEmployment Promotion amongst Urban Poor (STEP-UP) (iv) Urban Wage Employment Programme(UWEP), and (v) Urban Community DevelopmentNetwork (UCDN). The annual budgetary provisionunder the SJSRY for the year 2010-11 is ̀ 589.68crore of which ̀ 427.91 crore had been released by
305Human Development, Equity and Environemnt
Website: http://indiabudget.nic.in
31 December 2010. A total of 6,80,325 beneficiarieshave been benefited upto 31 December 2010.
Social Protection Programmes12.28 Keeping in view the importance of the informalsector's share in the total work-force, the Governmenthas been focusing on expanding the coverage ofsocial security schemes so as to provide a minimumlevel of social protection to workers in theunorganized sector and to ensure inclusivedevelopment (Box. 12.6).
Rural Infrastructure and Development12.29 The Government of India has accordedhighest priority to building rural infrastructure withthe objective of facilitating a higher degree of rural-urban integration and for achieving an even patternof growth for the poor and disadvantaged sections ofsociety. Some of the initiatives taken by theGovernment to facilitate building of ruralinfrastructure and development include the PMGSY,Bharat Nirman, Total Sanitation Campaign, andNRHM.
Bharat Nirman12.30 This programme, launched in 2005-06 forbuilding infrastructure and basic amenities in rural
areas, has six components, namely rural housing,irrigation potential, drinking water, rural roads,electrification, and rural telephony. It is an importantinitiative for reducing the gap between rural and urbanareas and improving the quality of life of people inrural areas.
12.31 Rural Roads have been identified as one ofthe six components of Bharat Nirman and a goalhas been set to provide connectivity to all villageswith a population of 1000 (500 in hilly or tribal areas)with all-weather roads. New connectivity is proposedto be provided to a total of 54,648 habitations underBharat Nirman. This will involve construction of1,46,184 km of rural roads. In addition to newconnectivity, Bharat Nirman envisages upgradation/renewal of 1,94,130 km of existing rural roads.Under the rural roads component of Bharat Nirman,38,575 habitations have been provided all-weatherroad connectivity up to December 2010 and projectsfor connecting 14,995 habitations are at differentstages of implementation. During 2010-11, over28,963 km of all-weather roads has been completedup to December 2010. New connectivity has beenprovided to nearly 3949 habitations with anexpenditure of ` 9677 crore under PMGSY.
Box 12.6 : Some Important Social Protection measures taken by the Government
Aam Admi Bima Yojana (AABY) : Under this scheme launched on 2 October 2007, insurance is provided against naturalas well as accidental and partial /permanent disability of the head of the family of rural landless households in thecountry. Up to July 2010, the scheme has covered 1.45 crore lives.
Rashtriya Swasthya Bima Yojana (RSBY): The RSBY was launched on 1 October 2007 to provide smart card-basedcashless health insurance cover of ` 30, 000 per family per annum to BPL families (a unit of five) in the unorganizedsector. The scheme became operational from 1 April 2008. The premium is shared on 75:25 basis by the Centre and StateGovernments. In the case of States of the north-east region and Jammu and Kashmir, the premium is shared on 90:10basis. The scheme provides for smart card portability by splitting the card value for migrant workers. Till 31 January2011, 27 States and Union Territories have initiated the process of implementing the scheme. Out of these 27 States/UTs,25 States/UTs have started issuing smart cards and more than 2.26 crore smart cards have been issued.
The Unorganized Workers' Social Security Act 2008: The Act came into force from 16 May 2009 with the objective ofproviding social security to unorganized workers. The Unorganized Workers' Social Security Rules, 2009 have also beenframed. The Act provides for constitution of the National Social Security Board and State Social Security Boards whichwill recommend social security schemes for unorganized workers. The National Social Security Board has since beenconstituted. As part of its mandate, the National Social Security Board constituted a Sub-Committee of the Board toexplore the extension of social security schemes to unorganized workers. Subsequently, the Board recommended thatsocial security schemes, namely the RSBY providing health insurance, Janashree Bima Yojana (JBY) providing death anddisability cover, and Indira Gandhi National Old Age Pension Scheme (IGNOAPS) providing old age pension, may beextended to building and other construction workers, MGNREGA workers, Asha workers, Anganwadi workers andhelpers, porters/coolies/gangmen, and casual and daily wagers.
Bilateral Social Security Agreements: Bilateral social security agreements have been signed with Belgium, Switzerland,the Netherlands, and Denmark to protect the interests of expatriate workers and companies on a reciprocal basis.Negotiations for a similar agreement have been completed with Norway. These agreements help workers by providingexemption from social security contribution in case of posting, totalization of contribution period, and exportability ofpension in case of relocation to the home country or any third country.
306 Economic Survey 2010-11
Website: http://indiabudget.nic.in
for changing the behaviour of people from a youngage. The components of the TSC include start-upactivities, IEC, individual household latrines (IHHL),community sanitary complexes (CSC), SSHE,Anganwadi toilets, alternate delivery mechanism, inthe form of rural sanitary marts (RSMs) andproduction centres (PCs), and administrativecharges. The component of solid/liquid wastedisposal in villages was included in TSC projects in2006, providing up to 10 per cent of each districtproject cost. A total of 607 TSC projects have beensanctioned so far in rural districts of the country at atotal outlay of ̀ 20,024 crore, with a Central shareof ̀ 13,026 crore. The annual budgetary support forthe TSC has gradually been increased from ̀ 202crore in 2003-04 to ` 1580 crore in 2010-11. Withthe scaling up of the TSC, combined with higherresource allocation, the implementation of theprogramme has resulted in substantial increase inrural sanitation coverage from 21.9 per cent in 2001to about 67.86 per cent as on November 2010.
12.34 The Nirmal Gram Puraskar (NGP) incentivescheme has been launched to encouragePanchayati Raj institutions (PRIs) to take upsanitation promotion. The award is given to thosePRIs which attain 100 per cent open-defecation-freeenvironment. The concept of Nirmal Gram Puraskarhas been acclaimed internationally as a unique toolof social engineering and community mobilizationand has helped a difficult programme like sanitationto pick up. Each gram panchayat getting the NGPhas a ripple effect on the surrounding villages, amovement sustained by active people's participation.The Nirmal Gram Puraskar has ignited theimagination of Panchayat leaders throughout thecountry and made them champions of sanitation.Under the NGP, a total of 22,443 gram panchayats,165 intermediate panchayats, and 10 districtpanchayats have received the award in the last five
Rural Drinking Water
12.32 Supply of safe drinking water in uncovered,slipped back and quality-affected habitations is oneof the components of Bharat Nirman. Habitationswith arsenic and fluoride content in water have beenaccorded highest priority followed by those with iron,salt, and nitrate content. Expenditure for drinkingwater supply during the Bharat Nirman periodincreased considerably from ̀ 4098 crore in 2005-06 to ` 7989.72 crore in 2009-10. In order to giveeffect to the policy initiatives mentioned in theEleventh Five Year Plan document, the guidelinesfor the rural water supply programme have beenrevised. The revised programme called the NationalRural Drinking Water Programme (NRDWP) has abudgetary provision of ` 9000 crore for 2010-11against which ̀ 7103.56 crore has been utilized sofar. Considering the importance of the Bharat NirmanProgramme and its implementation status at the endof 2008-09, the Government has extended Phase IIof the programme up to 2012. The implementationstatus of the NRDWP under Bharat Nirman Phase IIshows that against a physical target of 76,316habitations to be covered up to 2010-11, a total of43,193 habitations have been covered as on 31December 2010 (Table 12.11). All the uncovered andquality- affected habitations that may still beuncovered by the end of 2010-11 are targeted to becovered during 2011-12.
Rural Sanitation: Total Sanitation Campaign(TSC)
12.33 The TSC is one of the flagship programmesof the Government of India. The TSC follows acommunity-led and people-centred approach. Itplaces emphasis on information, education, andcommunication (IEC) for demand generation forsanitation facilities. It also places emphasis onschool sanitation and hygiene education (SSHE)
12.11 : Status of NRDWP under Bharat Nirman Phase II as on December 31, 2010
Components Total Balance Target CumulativeRural Remaining (2009-10 Achievement
Habitations as on 1 April and 2010-11) during BharatNirman Phase II
years. Sikkim has become the first 'Nirmal State' inthe country.
Urban Infrastructure, Housing, and Sanita-tion
12.35 The Government of India is playing animportant role in shaping policies and programmesrelated to urban infrastructure, housing, andsanitation in the country as a whole. Apart fromdeciding national policy issues, the CentralGovernment is also allocating resources to StateGovernments through various centrally sponsoredschemes and providing finances through nationalfinancial institutions in the country as a whole. Someof the initiatives taken by the Government in thisarea are as follows:
Jawahar Lal Nehru National Urban RenewalMission (JNNURM)
12.36 The JNNURM, a seven year programmelaunched in December 2005, provides financialassistance to cities for infrastructure, housingdevelopment, and capacity development. Two of itsfour components-Basic Services to the Urban Poor(BSUP) for 65 select cities and Integrated Housingand Slum Development Programme (IHSDP) for othercities and towns--are devoted to shelter and basicservice needs of the poor. The JNNURM alsoemphasizes the implementation of the following threemandatory pro-poor key reforms to enhance thecapacity of urban local bodies (ULBs) - (i) internalearmarking within local body budgets for basicservices to the urban poor;(ii) earmarking at least20-25 per cent of developed land in all housingprojects (both public and private agencies) forthe economically weaker section (EWS)/lowerincome group (LIG) category; (iii) implementation ofseven-point charter for provision of seven basicentitlements/services. As the first national flagshipprogramme for urbanization, the JNNURM hassignificantly triggered the creation of many innovativeideas in States that will increase their ability tomaintain the momentum of the urban transformationthey have initiated. More than 1.5 million houseshave been sanctioned by 8 February 2011 and 1456projects with an outlay of more than ` 37,771.30crore have been approved with a committed Centralshare of ̀ 20,787.90 crore (89.6 per cent of seven-year allocation for 2005-12). Additional Centralassistance of ̀ 10,013.37 crore has been released.While all States are covered under the BSUP, allStates and UTs except Goa and UT of Lakshadweephave been covered under the IHSDP.
Affordable Housing in Partnership (AHIP)
12.37 The Government has launched the AHIPscheme with an outlay of ` 5000 crore forconstruction of one million houses for the EWS/LIG/middle income group (MIG) with at least 25 per centfor the EWS category. The scheme aims atpartnership between various agencies/ Government/parastatals/ ULBs/ developers for realizing the goalof affordable housing for all.
Rajiv Awas Yojana (RAY)
12.38 The Government has announced the visionof a 'slum-free India' through a new scheme, the RajivAwas Yojana. Subsequent to this announcement,extensive consultations have been held with variousMinistries, experts, state Governments, non-governmental organizations (NGOs), financial andurban experts, and private industry to frame theguidelines. These draft guidelines have been criticallyappraised by an expert committee. The preparatoryphase of RAY, called the Slum Free City PlanningScheme has been implemented. Under this schemean amount of ̀ 60 crore has been released to Statesfor undertaking slum surveys, mapping of slums,developing slum information systems, undertakingcommunity mobilization, preparation of slum-free city/State plans, etc. before seeking support under RAY.A budgetary allocation of ` 1270 crore has beenmade for the preparatory phase of RAY for the year2010-11.
Skill Development
12.39 As mentioned in the Economic Survey 2009-10, a three-tier structure for coordinated action onskill development has been set up. The three-tierstructure consists of (i) the Prime Minister's NationalCouncil on Skill Development, (ii) the National SkillDevelopment Coordination Board (NSDCB), and (iii)the National Skill Development Corporation (NSDC).The Prime Minister's National Council has outlinedthe core operating principles which, inter alia,advocate the need for co-created solutions for skilldevelopment based on partnerships between States,civil society, and community leaders. The emphasisis on making skills bankable for all sections of societyincluding the poorest of the poor. The issue ofoptimum utilization of existing infrastructure availablein the States and using the same for skill training isalso emphasized. By the end December 2010, 28States and five Union Territories had set up SkillDevelopment Missions. As a next step, all theseStates/UTs need to assess the skill gaps in the major
308 Economic Survey 2010-11
Website: http://indiabudget.nic.in
sectors and formulate action plans for bridging them.The NSDC, set up on 31July 2008 as a non-profitpublic-private partnership (PPP) in skill developmentfor co-coordinating/ stimulating private-sectorinitiatives, has been mandated to achieve the targetof creation of skilled workforce of 150 million personsby 2022 under the National Skill Development Policy.As a first step towards achieving the target, acomprehensive skill gap study for 21 high-growthsectors has been completed in order to build abaseline for formulation of a comprehensive strategy.This has generated a lot of interest in private sectorin investing in skill development. The corporation hasdeveloped a strong governance structure for thedisbursal of funds. So far 22 projects have beenapproved by the NSDC. This will result in creation of38.59 million skilled workforce over a period of 10years. The contribution of the NSDC in the form ofequity/loan/grant for the 22 projects is ` 607.56crore. Out of the 22 projects, two that had themandate to create a skilled workforce of 1.018 millionover 10 years were approved in 2009-10 with a totalcontribution of ̀ 35.68 crore from the NSDC.
Unique Identification Authority of India(UIDAI)
12.40 Significant progress has been made sincethe UIDAI was created through a notification issuedby the Government in January 2009. Phase II of theUIDAI now referred to as the Aadhaar programmehas commenced with an allocation of ` 3023.01crore in July 2010 for enrolling 10 crore residentsthrough multiple registrars and for setting up of otherinfrastructural requirements for the project phase offive years ending March 2014. The scheme wasformally launched on 29 September 2010 at Thembalivillage of Nandurbar district in Maharashtra when allthe residents in the village were enrolled making itthe first 'Aadhaar Gaon'. All the 35 States and UTshave signed a memorandum of understanding (MoU)with the UIDAI. MoUs have also been signed withthe Ministry of Human Resource Development,Ministry of Rural Development, Ministry of Petroleumand Natural Gas, Department of Posts, 23 public-sector banks, the Life Insurance Corporation ofIndia, Indira Gandhi National Open University, andthe National Coalition of Organizations for Securityof Migrant workers.
12.41 The UIDAI is partnering with financialinstitutions to both augment enrolments through themand to provide bank accounts to residents duringAadhaar enrolment. Enrolment statistics indicate that
about 80 per cent of residents have given consentfor opening bank accounts during enrolment. In orderto simplify the process of opening Aadhaar-enabledbank accounts for the marginalized population, theAadhaar-based Know Your Resident (KYR) leadingto issue of Aadhaar numbers has been accepted asequivalent to banks' Know Your Customer (KYC)norms. Further, the Aadhaar letter has been declaredan officially valid document for opening of bankaccounts by the Government in December 2010. TheUIDAI is also working towards linking MNREGSpayments with the Aadhaar number of the residentand routing the payments through his/her Aadhaar-enabled bank account. The stage is now set forrealizing the service-delivery potential of Aadhaar. Inaddition to help in cleaning up databases by ensuringthat there are no duplicates and fakes, Aadhaar canhelp in better targeting and delivery of services andreducing the cost of delivery. Transformation in thedelivery of services is expected through the use ofAadhaar authentication services.
Education12.42 India is a nation of young people. Out of apopulation of above 1.1 billion, 672 million peopleare in the age group 15 to 59 years, which is usuallytreated as the 'working-age population'. It is predictedthat India will see a sharp decline in the dependencyratio over the next 30 years, which will constitute amajor 'demographic dividend' for India. But thisadvantage can only be realized if it is supplementedwith skill enhancement of the young through themedium of education. In the year 2001, 11 per centof the population of the country was in age group 18-24 years and this is expected to rise to 12 per centby the end of the Eleventh Five Year Plan. This youngpopulation should be considered as a valuable assetwhich, if well equipped with education and skills,can contribute effectively to the development of thenational as well as global economy.
Right of Children to Free and CompulsoryEducation Act 2009 (RTE Act)
12.43 Free education for all children between theage of 6 and 14 years has been made a fundamentalright under the RTE Act 2009. While the RTE Actwas notified on 27 August 2009 for generalinformation, the notification for enforcing theprovisions of the Act with effect from 1 April 2010was issued on 16 February 2010. The Ministry ofHRD had set up a committee to identify SarvaShiksha Abhiyan(SSA) norms that require to bebrought in conformity with RTE norms and standards,
309Human Development, Equity and Environemnt
Website: http://indiabudget.nic.in
including, for example, pupil-teacher ratio andteacher-classroom ratio. On the basis of therecommendation of this committee, SSA norms havebeen modified to align them with the requirement ofthe RTE Act 2009. The main changes made in thenorms relate to opening of new primary and upperprimary schools as per neighborhood norms ,upgradation of all alternate schooling facilities providedthrough centres under the Education GuaranteeScheme (EGS), revised pupil-teacher ratio (PTR)norms, provision of special training for out-of-schooland drop-out children to facilitate age-appropriateadmission, provision of grant and teaching learningequipment to facilitate States to merge Classes Vand VIII in primary and upper primary cycle stageand approval of additional 1073 Kasturba GandhiBalika Vidyalayas (KGBVs) for educationallybackward blocks (EBBs) .
Elementary and Secondary EducationSchemes
12.44 Several initiatives have been undertaken bythe Government in the field of elementary andsecondary education in recent years. Some of theimportant schemes are as follows:
The Sarva Shiksha Abhiyan SSA : Theprogramme is being implemented in partnershipwith the States to address the needs of childrenin the age group of 6-14. The goals of the SSAinter alia include enrolment of all children inschool, education guarantee centres (EGCs),alternate schools, 'back-to-school' camp,retention of all children till the upper primarystage by 2010, bridging of gender and socialcategory gaps in enrolment with retention andlearning, and ensuring that there is significantenhancement in the learning achievement levelsof children at the primary and upper primarystages. The achievements under the SSA tillSeptember 2010 include opening of 309,727 newschools, construction of 254,935 schoolbuildings, construction of 1,166,868 additionalclassrooms, 190,961 drinking water facilities,construction of 347,857 toilets, supply of freetextbooks to 8.70 crore children, andappointment of 11.13 lakh teachers. Moreover,around 14.02 lakh teachers have received in-service training under this programme. There hasbeen significant reduction in the number of out-of-school children on account of SSAinterventions. An independent study states thatthe number of out-of-school children has come
down from 134.6 lakh in 2005 to 81.5 lakh in2009.
Kasturba Gandhi Balika Vidyalayas (KGBVs):The KGBV is a scheme for setting up residentialschools at upper primary level for girls belongingpredominantly to the SC/ ST, OBC, and minoritycommunities. The scheme is being implementedin the EBBs where rural female literacy is below30 per cent and in select urban areas wherefemale literacy is below the national average.The KGBV scheme was merged with the (SSA)with effect from 1 April 2007. The schemeprovides for minimum reservation of 75 per centof the seats for girls belonging to SCs, STs,OBCs or minority communities and priority forthe remaining 25 per cent to girls from BPLfamilies. The scheme is being implemented in27 States. The Government of India hassanctioned 2573 KGBVs up to 31 March 2010and 2565 KGBVs are reported to be functionalin the states. A total of 2,38,600 girls wereenrolled in KGBVs with SC and ST girlsaccounting for 27.14 per cent and 28.67 per centrespectively. While the shares of OBC girls andBPL girls stood at 26.84 per cent and 9.19 percent respectively, minority girls accounted for8.17 per cent.
National Programme for Education of Girls atElementary Level (NPEGEL): The NPEGEL, isa focused intervention of the Government ofIndia to reach the 'Hardest to Reach' girls. It isan important component of the SSA, whichprovides additional support for enhancing girl'seducation over and above the normal SSAinterventions. The programme provides forsetting up of a 'model school' in every clusterwith more intense community mobilization andsupervision of girls' enrolment in schools.Gender sensitisation of teachers, developmentof gender-sensitive learning materials, andprovision of need-based incentives like escorts,stationery, workbooks, and uniforms are someof the endeavours under the programme. Thescheme is being implemented in the EBBswhere the level of rural female literacy is lessthan the national average and gender gap isabove the national average; in blocks of districtswhich are not covered under EBBs but whereat least 5 per cent of population is SC/ST andwhere SC/ST female literacy is below 10 percent; and also in select urban slums. About3286 educationally backward blocks are
310 Economic Survey 2010-11
Website: http://indiabudget.nic.in
covered under the scheme in 25 eligible States.
National Programme of Midday Meals inschools: Under the National Programme ofMidday Meals in schools, cooked mid-day mealis provided to all the children attending ClassesI-VIII in Government, local body, Government-aided and National Child Labour Projectschools. EGCs/alternate and innovativeeducation centres including madarsas/maqtabssupported under the SSA across the countryare also covered under this programme. Atpresent the cooked midday meal provides anenergy content of 450 calories and proteincontent of 12 grams at primary stage and anenergy content of 700 calories and proteincontent of 20 grams at upper primary stage.Adequate quantity of micro-nutrients like iron,folic acid and vitamin A are also recommendedfor convergence with the NRHM. During 2009-10, the budget allocation under this programwas ` 7359.15 crore against which the totalexpenditure incurred was ` 6937.79 crore. Atotal number of 11.04 crore children (7.85 crorein primary and 3.19 crore in upper primarystages) have been benefitted under theprogramme during 2009-10.
Rashtriya Madhyamik Shiksha Abhiyan(RMSA): The RMSA was launched in March2009 with the objective of enhancing access tosecondary education and improving its quality.The implementation of the scheme started from2009-10. It envisages raising the enrolment rateat secondary stage from 52.26 per cent in 2005-06 to 75 per cent within five years by providinga secondary school within reasonable distanceof any habitation. The other objectives includeimproving quality of education imparted atsecondary level by ensuring that all secondaryschools conform to prescribed norms, removinggender, socio-economic and disability barriers,providing universal access to secondary-leveleducation by 2017, i.e. by the end of the TwelfthFive Year Plan, and achieving universal retentionby 2020. The Central Government and StateGovernment bear 75 per cent and 25 per centof the project expenditure respectively duringthe Eleventh Five Year Plan. The funding patternis in the ratio of 90:10 for the north-easternStates.
Inclusive Education for the Disabled atSecondary Stage (IEDSS): The IEDSS schemewas launched in 2009-10 replacing the earlier
scheme of Integrated Education for DisabledChildren (IEDC). It provides 100 per cent Centralassistance for inclusive education of disabledchildren studying in Classes IX-XII inGovernment, local body, and Government-aidedschools. The aim of the scheme is to facilitatecontinuation of education of children withspecial needs up to higher secondary level. Thescheme provides for personal requirements ofthe children in the form of assistive devices,helpers, transport, hostel, learning material,scholarship for the girl child, etc up to ` 3000per disabled child per annum. A budget of` 70.00 crore was allocated for this schemeduring 2010-11. Over 1.30 lakh disabled childrenare proposed to be covered with the assistanceof 3000 teachers in 20,000 Governmentsecondary and higher secondary schools in2010-11.The scheme is extremely important asa natural corollary to the success achieved inenrolment and retention of children atelementary stage (SSA).
Saakshar Bharat : In the context of theGovernment's overall policy aimed atempowerment of women and in recognition ofthe fact that literacy is a prerequisite for socio-economic development, the National LiteracyMission has been recast as 'Saakshar Bharat'with prime focus on female literacy. Thisflagship programme of the Government will coverall adults in the age group of 15 and abovethough its primary focus will be on women.Several new features have been added to thescheme and basic literacy, post literacy, andcontinuing education programmes, will nowform a continuum, rather than sequentialsegments under this programme. Besides thevolunteer-based mass campaign approach,provision has been made for alternativeapproaches to adult education. The Jan ShikshaKendras (adult education centres-AECs) will beset up to coordinate and manage allprogrammes within their territorial jurisdiction.The state governments, as against the districtsin the earlier versions, and Panchyati Rajinstitutions, along with communities, will be thevalued stakeholders. The budgetary support hasalso been substantially enhanced. To minimizeregional, social, and gender disparities, theprogramme in its first phase, that is during theEleventh Plan period will remain confined to365 districts with female adult literacy rates of50 per cent or below as per the 2001 census.
311Human Development, Equity and Environemnt
Website: http://indiabudget.nic.in
Besides, 33 districts affected by left wingextremism will also be covered, irrespective ofthe existing literacy rate in those districts.
12.45 The Annual Status of Education Report(ASER) by Pratham, an NGO, is an annual surveyof rural children since 2005. In 2010, which is itssixth year, the ASER was conducted in 522 districts,over 14,000 villages, 300,000 households, and almost
700,000 children. Over six years, the ASER hasobserved a clear rise in enrolment (Box 12.7).
Higher and Technical Education
12.46 Higher Education is of vital importance forthe country, as it is a powerful tool to build aknowledge-based twenty-first century society.Improvement of access along with equity and
Box 12.7 : Main Findings of ASER 2010
Enrolment : In 2010, 96.5 per cent of children in the 6 to 14 age group in rural India are enrolled in school. While 71.1per cent of these children are enrolled in government schools, 24.3 per cent are enrolled in private schools.
Out of school girls: In 2010, 5.9 per cent of girls in the 11-14 age group are still out of school. However, this percentagehas gone down as compared to 6.8 per cent in 2009. In states like Rajasthan and Uttar Pradesh this percentage remainshigh and shows little change since 2009 whereas in Bihar, the percentage of out of school girls and boys in all age groupshas been declining steadily since 2005.
Rise in private school enrolment: Enrolment in private schools in rural India increased from 21.8 per cent in 2009 to24.3 per cent in 2010. This number has risen steadily since 2005 when it was 16.3 per cent nationally. Between 2009 and2010, the southern states have shown a substantial increase in private school enrolments. While the percentage ofchildren in private schools increased in southern states like Andhra Pradesh , Tamil Nadu, Karnataka and Kerala andin northern states like Punjab, enrolment remained low in Bihar, West Bengal, Jharkhand , Orissa and Tripura.
Increasing numbers of five year olds enrolled in school: The percentage of five year olds enrolled in schools increasedfrom 54.6 per cent in 2009 to 62.8 per cent in 2010. The highest increase was observed in Karnataka. Enrolment of fiveyear olds increased substantially between 2009 and 2010 in several other states such as Punjab, Haryana, Rajasthan ,Uttar Pradesh and Assam.
Nationally, not much change in reading ability, except in some states: Even after five years in school, close to halfof all children are not even at the level expected of them after two years in school. Only 53.4 per cent children in Std Vcould read a Std II level text. However, Andhra Pradesh, Gujarat, Haryana and Rajasthan saw an increase in theproportion of children in Std I who were able to recognize letters. There was also an increase in the proportion of childrenin Std V who could read Std II level text in Andhra Pradesh, Gujarat, Assam, Himachal Pradesh, Punjab, Uttar Pradeshand West Bengal.
Maths ability shows a declining trend: On an average, there has been a decrease in children's ability to do simplemathematics. The proportion of Std I children who could recognize numbers from 1-9 declined from 69.3 per cent in2009 to 65.8 per cent in 2010. Similarly, the proportion of children in Std III who could solve two digit subtractionproblems decreased from 39 per cent to 36.5 per cent in the same period. Children in Std V who could do simple divisionproblems also dropped from 38 per cent in 2009 to 35.9 per cent in 2010. Contrary to this trend, Punjab's performancein basic arithmetic has improved over the last few years.
Middle school children weak in everyday calculations: About two thirds of all children could answer questionsbased on a calendar and only half could do the calculations related to area. The questions related to area seemed to bethe most difficult for children to solve, even though such problems are usually found in textbooks in Std IV or V.Children in Std VIII in Kerala and Bihar solved the area related questions the best.
Tuition going down for private school children: A clear decrease is seen in the incidence of tuition among childrenenrolled in private schools across all classes up to Std VIII. This proportion has not changed much among childrenenrolled in government schools, although in states like Bihar, West Bengal and Orissa, where private school enrolmentis low, the proportion of children in Std V enrolled in government schools who take tuition classes is high.
RTE compliance: Over 60 per cent of the 13,000 schools visited satisfied the infrastructure norms specified by the RTE.However, more than half of these schools will need more teachers. A third will need more classrooms. The all Indiapercentage of primary schools (Std 1-4/5) with all teachers present on the day of the visit shows a consistent decreaseover three years, falling from 73.7 per cent in 2007 to 69.2 per cent in 2009 and 63.4 per cent in 2010. For rural India asa whole, children's attendance shows no change over the period 2007- 2010. Attendance remained at around 73 per centduring this period. But there is considerable variation across states.
excellence, adoption of State-specific strategies,enhancement of the relevance of higher educationthrough curriculum reforms, vocationalization,networking and information technology (IT), anddistance education are some of the main policyinitiatives in the higher education sector. The otherimportant policy initiatives in higher education areprogrammes for general development of universitiesand colleges; special grants for the construction ofhostels for women; scholarships to students;scheme to provide interest subsidy on educationalloans for professional courses to ensure that nobodyis denied professional education because he or sheis poor; and making interventions to attract andretain teaching talent in higher and technicaleducation. Emphasis has been laid on expansionwith equity, use of information and communicationtechnology (ICT), and promotion of qualityeducation. Some of the major initiatives takenduring the Eleventh Plan for promoting higher andtechnical education are as follows:
Scheme for incentivising States for establishingnew higher educational institutions/expandingexisting ones: A new Scheme has beenenvisaged in the Eleventh Plan for providingCentral assistance to State Governments in theratio of 1:2 (1:1 for special category States) forestablishing new higher educational institutions/expanding existing ones. The scheme will betaken up on a pilot basis for the remainingduration the Eleventh Plan. The physical targetsfor this scheme are (i) 8 new universities(including 2 in special category States), (ii) 83new colleges, (iii) 10 new engineering colleges,and (iv) Expansion of colleges so as to achieveadditional enrolment of 100,000 (one lakh)students. Priority will be given for setting up ofinstitutions in locations predominantly inhabitedby SCs/STs/ educationally backward minoritiesso as to address equity concerns.
Scheme of setting up of 374 Model Colleges: Inorder to remove regional imbalance, theGovernment has planned to set up 374 ModelDegree Colleges one each in identifiededucationally backward districts where the GERis less than the national average. Under thisscheme, the Central Government shall provideassistance to the extent of one-third of thecapital cost for establishment of each college,with a limit of ` 2.67 crore. For special categoryStates, the Centre's share shall be 50 per centof the capital cost, with a limit of ` 4.00 crore.
During the current financial year, 14 proposalshave so far been approved and 18 are in thepipeline.
Setting up of new Indian Institutes of InformationTechnology (IIITs): To address the increasing skillchallenges of the Indian IT industry, theGovernment has approved setting up of twentynew IIITs on a PPP basis. The partners in settingup the IIITs would be the HRD Ministry,Governments of the respective States where eachIIIT will be established, and industry, with thecapital cost of `128 crore for each IIIT to becontributed in the ratio of 50:35:15 by the threepartners respectively. In the north-eastern States,industry participation for capital expenditure willbe kept at 7.5 per cent whereas Central andState Government participation will be 57.50 percent and 35 per cent respectively. During thefirst four years of setting up of each IIIT, theCentral Government will provide assistancetowards recurring expenditure to the extent of` 10 crore, year-wise requirement of which willvary depending on the growth of institutes andrequirement of funds. The project is targeted tobe completed in nine years from 2011-12 to2019-20. In the first year, 5-10 new IIITs wouldbe set up depending upon the response of theState Governments and private partners.
Establishment of institutions : The Governmenthas approved setting up of ten new NationalInstitutes of Technologies (NITs) in ArunachalPradesh, Sikkim, Meghalaya, Nagaland,Manipur, Mizoram, Goa, Delhi, Uttarakhand, andPudduchhery. The Government of India has setup five Indian Institute of Science Education andResearch (IISERs) at Pune, Kolkata, Mohali,Bhopal, and Thiruvananthapuram. The IISERs areenvisaged to carry out research in frontier areasof science and to provide quality scienceeducation at undergraduate and postgraduatelevels. All the five new IISERs have becomefunctional. During the first four years of theEleventh Plan, five new Indian Institutes ofManagement (IIMs) have already becomeoperational and the remaining two will becomeoperational in 2011-12. Eight new Indian Instituteof Technology (IITs) and two new School ofPlanning and Architecture (SPAs) have alsobeen opened in the first four years of the EleventhPlan.
Reform measures in the higher and technicaleducation Sector: The Department of Higher
313Human Development, Equity and Environemnt
Website: http://indiabudget.nic.in
Education has initiated a number of steps foreducational reforms including in regulatory andgovernance structures in the higher educationsystem (Box. 12.8).
Health
12.47 An analysis of the performance of healthdelivery facilities in terms of selected indicators
suggests that significant progress has been madeover the last three decades (Table 12.12).
12.48 However, despite this progress, as per HDR2010, India fares poorly when compared tocountries like China and Sri Lanka in terms ofparameters like per capita expenditure on health,number of physicians/hospital beds (per 10,000persons), and IMR. In addition, within the country,the improvement has been quite uneven across
Box : 12.8 Reform Initiatives in the Higher and Technical Education Sector
An important challenge in the higher education sector is to bring about reforms not only in the institutions of higherlearning but also in the regulatory structures of the higher education system. There are also the challenges of maintainingquality and excellence while ensuring rapid expansion and attracting and retaining good faculty in adequate numbersto meet the demands of the rapidly expanding sector. The Government has accordingly taken a number of steps forreforms in the regulatory and governance structures of the higher education system. A few of these reform initiatives areas under:
Proposal to establish an autonomous overarching authority for prescribing standards and laying down policy for
higher education and research to subsume the University Grants Commission (UGC), All India Council for Technical
Education (AICTE), National Council for Teacher Education (NCTE), and academic functions of other regulatory
bodies in higher education.
Proposal for prohibition and punishment of unfair practices in technical educational institutions, medical educationalinstitutions and universities.
Proposal for mandatory assessment and accreditation in higher education including institutions and programmesand creation of an institutional structure for the same.
Qualifying the National Eligibility Test (NET) has been made mandatory for appointment as teacher in universitiesand colleges with exemption provided to those who have obtained PhD degree in accordance with the standardsspecified by the regulation.
Review of performance of deserving institutions like research councils, deemed universities.
7. Life Expectancy at Birth: (1981-85) (1989-93) (2002-06)**
Total 55.4 59.4 63.5
Male 55.4 59.0 62.6
Female 55.7 59.7 64.2
Source: Ministry of Health and Family Welfare.
*Sample Registration Survey (SRS).
** Abridged Life Table 2002-06, RGI India.
314 Economic Survey 2010-11
Website: http://indiabudget.nic.in
regions/States, gender, rural/urban areas, etc. Thehealth system in India is a mix of the public andprivate sectors, with the NGO sector playing a smallrole. Over the last six decades, a large number ofhealth institutions catering to the health needs ofthe people at primary, secondary, and tertiary levelshave been set up. The country has developed awell-structured three-tier public health infrastructure,comprising community health centres (CHCs),primary health centres (PHCs), and sub-centresspread across rural and semi-urban areas as wellas tertiary medical care comprising multispecialtyhospitals and medical colleges located almostexclusively in the urban areas. However, theinadequate health-related infrastructure, includingshortages of doctors and paramedical professionalshas severely restricted the delivery of healthservices, particularly in rural areas. In order tobridge the gap in existing health infrastructure andto provide accessible, affordable, and equitablehealth care, the Government of India has launcheda large number of programmes and schemes asfollows:
National Rural Health Mission (NRHM): TheNRHM was launched in 2005 to provideaccessible, affordable, and accountable qualityhealth services to rural areas with emphasis onpoor persons and remote areas. It is beingoperationalized throughout the country, withspecial focus on 18 states, which include 8empowered action group States (Bihar,Jharkhand, Madhya Pradesh, Chhattisgarh, UttarPradesh, Uttarakhand, Orissa, and Rajasthan),8 north-eastern States, Himachal Pradesh, andJammu and Kashmir. The NRHM aims to providean overarching umbrella to the existingprogrammes of Health and Family Welfareincluding the Reproductive Child Health Project(RCH-II) and Malaria, Blindness, Iodine Deficiency,Filaria, Kala Azar, T.B., Leprosy and IntegratedDisease Surveillance programmes bystrengthening the public health delivery systemat all levels. The Sub-centres, PHCs, and CHCsare being revitalized through better humanresource management, including provision ofadditional manpower, clear quality standards,revamping of existing medical infrastructure,better community support, and through untiedfunds to facilitate local planning and action.Flexible, decentralized planning is the pivot onwhich the Mission rotates. Further, the Missionaddresses the issue of health in the context of asector-wide approach addressing sanitation and
hygiene, nutrition, and safe drinking water as thebasic determinants of good health. Keeping thisin view, it seeks greater convergence among therelated social-sector departments, namelyAYUSH (Ayurveda, Yoga and Naturopathy,Unani, Siddha, and Homoeopathy), Women &Child Development, Sanitation, ElementaryEducation, Panchayati Raj, and RuralDevelopment. The achievements under the NRHMas on September 2010 are as follows:
ASHAs/Link Workers: So far 8.33 lakh accreditedsocial health activists (ASHAs) have beenselected. Of these, 7.82 lakh have receivedtraining in at least the first module and 5.7 lakhhave been provided with drug kits in their respectivevillages.
Addition of Human Resources: Under the NRHM1572 specialists, 8284 MBBS doctors, 26,734staff nurses, 53,552 auxiliary nurse midwives(ANMs), 18,272 paramedics have been employedon contract.
Conversion of Health Facilities into 24 X 7: A totalof 16,338 additional primary health centres(APHCs), PHCs, CHCs, and other sub-districtfacilities are functional on 24 x 7 basis.
Janani Suraksha Yojana (JSY) Beneficiaries: Over3.4 crore women have so far been covered underthe JSY.
Rogi Kalyan Samitis (RKSs): Around 599 districthospitals (DHs), 4210 CHCs, 1136 other than CHChospitals, and 17,097 PHCs have their own RKSswith untied funds for improving quality of healthservices.
Village Health and Sanitation Committees: So far,4.98 lakh villages (78 per cent) have their ownVillage Health and Sanitation Committees andeach of them has been provided ̀ 10,000 as untiedgrant per year.
Village Health and Nutrition Days (VH& NDs):Thirty-five lakh VH& NDs in 2006-07, 49 lakh in2007-08, 58 lakh in 2008-09, 58.7 lakh in 2009-10, and 34.6 lakh so far in 2010-11 have beenobserved to reach basic health services to ruralareas.
Mobile Medical Units (MMUs): About 381 MMUsare functional under the NRHM so far.
AYUSH: AYUSH services have been co-locatedin 14,766 health facilities and 9578 AYUSHdoctors and 3911 AYUSH paramedics have beenadded to the system.
315Human Development, Equity and Environemnt
Website: http://indiabudget.nic.in
Programme Management Units: Under theNRHM, 627 district programme managers, 618district accounts managers, 539 district datamanagers, 635 district programme managementunits (DPMUs), 3529 block managers, 3261accountants, and 3529 Block PMUs have beenadded.
Strengthening of primary health infrastructure andimproving service delivery: There has been asteady increase in health care infrastructureavailable over the Plan period ( Table12.13).However, there is still shortage of 20,486 sub-centres, 4477 PHCs, and 2337 CHCs as per 2001population norms. Further, almost 40 per cent ofthe existing health infrastructure is in rentedbuildings or rent-free panchayat /voluntary societybuildings. Poor upkeep and maintenance and highabsenteeism in rural areas are the main problemsin the public-sector health delivery system. TheNRHM seeks to strengthen the public healthdelivery system at all levels.
Janani Suraksha Yojana (JSY): The JSY waslaunched with focus on demand promotion forinstitutional deliveries in States and regions wherethese are low and integrates cash assistance withdelivery and post-delivery care. It targets loweringof the maternal mortality rate (MMR) by ensuringthat deliveries are conducted by skilled birthattendants. The JSY scheme has shown rapidgrowth in the last three years, with the number ofbeneficiaries reaching 100.78 lakh in 2009-10. Thestrengthening of infrastructure, coupled withimprovement in manpower and training, hasresulted in significant improvement of institutionaldeliveries in all major states. A mid-term evaluationof the RCH II programme also confirmed theincrease in the number of JSY beneficiaries. Theissues of governance, transparency, andgrievance redressal mechanisms are now thethrust areas for the JSY.
Pradhan Mantri Swasthya Suraksha Yojana(PMSSY): The PMSSY has been launched withthe objectives of correcting regional imbalancesin the availability of affordable/reliable tertiaryhealthcare services and augmenting facilities forquality medical education in the country. ThePMSSY has two components in its first phase.The first is the setting up of six All India Instituteof Medical Sciences (AIIMS)-like institutions. Thecivil works related to the construction of medicalcolleges and hostels have commenced in all sites.The construction of residential complexes inRishikesh and Patna is expected to be completedby March 2011 whereas in Bhopal andBhubaneswar, it is likely to be completed by June2011 and August 2011 respectively. As regardsthe work on hospital complexes, lay-out work isunder way for all the institutions. The secondcomponent of the PMSSY is the upgradation of13 existing Government medical collegeinstitutions. Civil works under this component havebeen completed in the medical colleges inTrivandrum, Salem, Bangalore, and Lucknow, areon the verge of completion in Hyderabad, Kolkata,Jammu, Tirupati, and Mumbai, and in Varanasi,Srinagar, Ahmadabad, and Ranchi are likely tobe completed by mid-2011. In the second phaseof the PMSSY, two more AIIMS-like institutionswill be set up and upgradation of six more medicalcolleges is being taken up.
National AIDS Control: According to recent HIVestimates based on HIV Sentinel Surveillance2008-09, the number of people living with HIV inIndia in 2009 was 23.9 lakh, with an adult HIVprevalence of 0.31 per cent. The estimateshighlight an overall reduction in adult HIVprevalence and HIV incidence (new infections) inIndia. Adult HIV prevalence at national level hasdeclined from 0.41 per cent in 2000 to 0.31 percent in 2009. The estimated number of new annualHIV infections has declined by more than 50 percent over the past decade from 2.7 lakh in 2000to 1.2 lakh in 2009. The epidemic is concentratedwith high prevalence among the high risk groups(HRGs), injecting drug users (IDUs) (9.2 per cent),men who have sex with men (MSMs) (7.3 percent), females sex workers (FSWs) (4.9 per cent),and sexually transmitted infection (STI) clinicattendees (2.5 per cent). Based on sentinelsurveillance, 156 districts have been identified ascategory 'A' districts where prevalence of HIVamong antenatal clinic attendees (proxy forgeneral population) is more than 1 per cent; and
Table 12.13: Health Care Infrastructure
Facilities No.
Sub-centre /PHC/CHC*(2009) 1,73,795
Dispensaries and Hospitals (all) ** 35,071
Nursing personnel (2009)** 16,52,161
Doctors (modern system) (2009)** 7,57,377
Sources:* RHS: Rural Health Statistics in India 2009.
** National Health Profile, 2009.
316 Economic Survey 2010-11
Website: http://indiabudget.nic.in
39 districts as category 'B' districts whereprevalence amongst high risk population is greaterthan 5 per cent. These districts are given highpriority in the implementation of the programme.The National AIDS Control Programme Phase-III(NACP-III) is being implemented for the period2007-12 with a total outlay of ̀ 11,585 crore.
Others : Others programmes like the RevisedNational TB Control Programme (RNTCP),National Vector Borne Diseases ControlProgramme (NVBDCP), National Programme forControl of Blindness (NPCB), and NationalLeprosy Eradication Programme have also beenstrengthened and are being implementation in atime-bound and focused manner. The IntegratedDisease Surveillance Project (IDSP) has beenlaunched with the objective of detecting andresponding to early warning signals of diseaseoutbreaks. Surveillance units have beenestablished at all State and district headquarters.The Central Surveillance Unit of the IDSP presentlyreceives weekly disease surveillance data from85 per cent districts in the country, Of these, 55per cent districts report data through portal alsowhich is for data entry, view reports, outbreakreporting, data analysis, training modules, andresources related to disease surveillance. A totalof 553 outbreaks were reported and responded toby States in 2008, 799 in 2009 and 938 in 2010(up to December 2010).
Ayurveda, Yoga & Naturopathy, Unani, Siddha andHomeopathy (AYUSH): Mainstreaming of AYUSHin national health care delivery is an importantgoal under the NRHM, for which the Governmenthas sanctioned ` 165.70 crore in the currentfinancial year upto 31 January, 2011. In September2009 a new component ‘Upgradation of AYUSHHospitals’ in the States was incorporated in theexisting Centrally Sponsored Scheme ofDevelopment of AYUSH Hospitals andDispensaries. Further, in July 2010 ‘Upgradationof AYUSH Dispensaries’ in the States has beenincorporated as a new component in the existingCentrally Sponsored Scheme of development ofAYUSH Hospitals and Dispensaries. TheGovernment has already recognized Ayurveda,Yoga and Naturopathy, Unani, and Siddha asofficial Indian Systems of medicine. It isimplementing the National Mission on MedicinalPlants which is aimed at supporting market-drivenmedicinal plant cultivation on private land withbackward linkages for establishment of nurseriesand supply of quality planting material, and forward
linkages for post-harvest management, marketing,infrastructure, certification, and crop insurance ina Mission mode. During the current financial year,26 States have been covered and financial supportof ` 46.41 crore was released for undertakingdifferent activities under the scheme includingcultivation of important medicinal plant speciesin over 24,214 hectare of land.
12.49 The demand for health services is likely torise considerably in the future with increase inhealth-seeking behaviour resulting from better levelsof education, income status, and urbanization. Therole of the Government is critical for meeting thehealth-care needs of major sections of thepopulation and to control escalation of cost of healthcare, while private-sector investment is crucial forsatisfying the increasing demand for health services.The private sector plays a dominant role the deliveryof health services in the country. The sector ispredominant in medical education, training,diagnostics and technology, manufacture ofpharmaceuticals, hospitals design, and constructionand management of ancillary services. As per theNational Commission on Macroeconomics andHealth (NCMH) 2005, around 70 per cent of allhospitals and 37 per cent of total beds in the countryare in the private sector.
12.50 Another important development in the Indianhealth-care sector has been the growing use oftelemedicine. In 2001, the Indian Space ResearchOrganization (ISRO) launched a pilot project thatconnects 78 hospitals in remote areas to superspecialty hospitals in the cities. Telemedicine hasopened up possibilities of professionals providingexpert healthcare service in remote rural areasfrom their locations in cities. It has also opened upthe possibility of patients in India availing ofprofessional advice from physicians in the developedcountries.
12.51 Human resources are the critical variable foreffective provision of health care to the population.To increase human resources in medical education,the Central Government has revised the teacher-student ratio from 1:1 to 1:2 which has resulted inapproximately 4000 additional postgraduate seatsin various disciplines in Government medicalcolleges from the academic year 2010-11. Further,in order to increase the number of medical collegesand specialists, the Central Government has alsorelaxed the norms in respect of land requirement,bed strength, bed occupancy, maximum admissioncapacity, and age of teaching faculty . Besides, the
317Human Development, Equity and Environemnt
Website: http://indiabudget.nic.in
Central Government also provides financialassistance to State Government medical collegesfor increasing the postgraduate seats to strengthenthe existing public health delivery system. Thirty-four Government medical colleges have beenapproved for Central assistance during 2010-11.With the implementation of the scheme by 2011-12, approximately 4000 additional postgraduateseats would be available.
Women and Child Development
12.52 The Government has started severalschemes and initiated many new policy initiativesfor the welfare and development of women andchildren. These include initiatives for economic andsocial empowerment of women and for securinggender equality in various aspects of social,economic, and political life. The scope and coverageof the schemes for women and child developmenthas been expanding, as is reflected in the progressiveincrease of expenditure incurred under various planschemes by the Government. Some of the importantschemes of the Ministry are as follows:
Integrated Child Development Services (ICDS)Scheme: This was launched in 1975 for holisticdevelopment of children below 6 years of age andfor proper nutrition and health education ofpregnant and lactating mothers with 33 projectsand 4891 anganwadi centres (AWCs). It has beencontinuously expanded to uncovered areas andhas now been universalized with the Governmentof India cumulatively approving 7076 projects and14 lakh AWCs including 20,000 anganwadis 'on-demand'. Apart from universalizing the ICDSScheme, the Government has taken varioussteps, such as revision in financial norms ofexisting interventions including the SupplementaryNutrition Programme (SNP), revision in nutritionaland feeding norms of supplementary nutrition, andintroduction of new WHO growth standards. Inaddition, the Government of India also introducedcost-sharing between the Centre and States from2009-10 in the ratio of 90:10 for all componentsincluding the SNP for the north-east. This ratiowill be 50:50 for the SNP and 90:10 for all othercomponents for all States other than north-east.Alongside gradual expansion of the scheme, itsbudgetary allocation has also increased. TheAnnual Plan outlay for 2010-11 for the ICDS was` 8700 crore against which an amount of` 6988.88 crore has been released to States/ UTs
up to 31December 2010. Of the total 7073sanctioned ICDS projects, 6719 were operationalas on 31 December 2010. Of the total 13.67 lakhsanctioned AWCs, 12.42 lakh were operationalas on 31 December 2010.
Rajiv Gandhi Scheme for Empowerment ofAdolescent Girls (RGSEAG): This scheme waslaunched on 19 November 2010 with the objectiveof empowering adolescent girls in the age group11-18 years by bringing improvement in theirnutritional and health status and upgrading variousskills like home skills, life skills, and vocationalskills. To start with, it will be implemented in 200selected districts across the country on a pilotbasis. RGSEAG would be implemented throughState Governments / UT Administrations with 100per cent financial assistance from the CentralGovernment for all inputs other than nutritionprovision for which 50 per cent Central assistanceto states/UTs would be provided. Anganwadicentres will be the focal points for delivery ofservices. Nearly 100 lakh adolescent girls in 200districts are expected to be benefited per annumunder the scheme. In these 200 districts, KishoriShakti Yojna (KSY) and the Nutrition Programmefor Adolescent Girls (NPAG) have been mergedin the RGSEAG. In the remaining districts, theKSY will continue as before.
The Rajiv Gandhi National Creche Scheme forChildren of Working Mothers: This schemeprovides for day-care facilities to 0-6 year-oldchildren of working mothers by opening crèchesand development services, i.e., supplementarynutrition, health-care inputs like immunization,polio drops, basic health monitoring, andrecreation. The combined monthly income of boththe parents should not exceed ̀ 12000 for availingof the facilities. The scheme is presently beingimplemented through the Central Social WelfareBoard (CSWB) and Indian Council for ChildWelfare (ICCW). As of now 22,599 crèches arefunctional and the number of beneficiary childrenis 5,64,975. Under the revised scheme, an amountof ` 1.70 lakh per annum per crèche has beenproposed against ̀ 42,384 per annum per crèchein the existing scheme. This will provide for betternutritional support as well as better services forchildren.
Integrated Child Protection Scheme (ICPS): Thisscheme was launched in 2009-10 with theobjective of providing a safe and secure
318 Economic Survey 2010-11
Website: http://indiabudget.nic.in
environment for comprehensive development ofchildren in the country who are in need of careand protection as well as children in conflict withthe law. The ICPS provides preventive andstatutory care and rehabilitation services to anyvulnerable child including, but not limited to,children of potentially vulnerable families andfamilies at risk, children of socially excludedgroups like migrant families, families living inextreme poverty, families subjected to or affectedby discrimination and minorities, children infectedand / or affected by HIV / AIDS, orphans, childdrug abusers, children of substance abusers, childbeggars, trafficked or sexually exploited children,children of prisoners, and street and workingchildren. The allocation of funds under this schemefor 2010-11 is ̀ 300 crore. The Scheme is CentrallySponsored and is being mainly implementedthrough State Governments / UT Administrationsfrom 2009-10 and 33 states/UTs have signed theMOUs for implementation of this scheme. During2010-11, ̀ 82.37 crore have been released underthe scheme upto 11 February, 2011. Thirteen moreStates/ UTs have agreed to implement this it andare at various stage of preparation of plansincluding financial proposals.
Support to Training and Employment Programmefor Women (STEP) Scheme : This scheme seeksto provide updated skills and new knowledge topoor women in 10 traditional sectors for enhancingtheir productivity and income generation. It is beingimplemented through public-sector organizations,State corporations, cooperatives, federations, andregistered voluntary organizations with minimumexistence of three years. With a view to expandingthe reach of the programme and furtherstrengthening implementation and monitoring, thenorms and parameters of this scheme have beenrevised in November 2009. The major changes inthe norms relate to the number of beneficiaries tobe covered, project duration, and per capita costand the scheme now provides for introduction oflocally appropriate sectors in consultation withState governments. The number of beneficiariesin each project may now vary from 200 to 10,000with the funding ceiling at ̀ 16,000 per beneficiaryup to a period of five years. During 2010-11, atotal number of 91 STEP projects were ongoingand 196 more were under consideration atvarious stages as on 30 November 2010. A sumof ̀ 25 crore has been allocated in the financialyear 2010-11 to achieve a target of 35,000beneficiaries.
Other Schemes : Some of the other schemesimplemented by the Ministry of Women and ChildDevelopment, include: (i) Dhanlakshmi, which isa conditional cash transfer scheme for the girlchild which was launched as a pilot project inMarch 2008. The objective is to encourage familiesto educate girl children and to prevent childmarriage. The scheme provides for cash transfersto the family of a girl child on fulfilling certainspecific conditionalities relating to birth andregistration, immunization, and enrolment andretention in school up to Class VIII. The Schemeis being implemented in 11 blocks of seven Stateson pilot basis. The entire approved outlay of` 5 crore for 2009-10 was released, benefiting42,077 girls. During 2010-11, 10,384 familieshad been supported up to 30 September 2010.(ii) Scheme for the Welfare of Working Childrenin Need of Care and Protection providing for non-formal education, vocational training, etc. toworking children to facilitate their entry/re-entryinto mainstream education. There are 120 projectsof 100 children each currently being funded underthe Scheme. (iii) Bal Bandhu Scheme forprotection of children in areas of civil unrest isbeing implemented through the NationalCommission for Protection of Child Rights(NCPCR) with the grant sanctioned from the PrimeMinister's National Relief Fund. (iv) Swadharscheme for providing temporary accommodation,maintenance, and rehabilitative services to womenand girls rendered homeless and women in difficultcircumstances (v) Short Stay Home (SSH)scheme being implemented by the Central SocialWelfare Board with similar objectives/target groupas in case of the Swadhar scheme. (vi) Ujjawala,a comprehensive scheme for prevention oftrafficking with five specific components–prevention, rescue, rehabilitation, reintegration,and repatriation of victims–was launched on 4December 2007. Under this scheme, 134 projectsincluding 73 rehabilitation homes, spread over 16States, have been sanctioned.
Scheme for Gender Budgeting : This has beenincluded in the Eleventh Plan. At present, 56Ministries / Departments have set up genderbudget cells and a number of Ministries /Departments have reflected allocation for womenin the Gender Budget Statement of the UnionBudget.
National Mission for Empowerment of Women(NMEW) : This has been set up with a view to
319Human Development, Equity and Environemnt
Website: http://indiabudget.nic.in
empowering women socially, economically, andeducationally. The Mission aims to achieveempowerment of women on all these fronts bysecuring convergence of schemes / programmesof different Ministries / Departments of theGovernment of India as well as StateGovernments. Alongside, the Mission shallmonitor and review gender budgeting by Ministries/ Departments as well as effective implementationof various laws concerning women.
Rashtriya Mahila Kosh (RMK) : This was createdin 1993 with a corpus fund of ` 31crore. Since,its creation, the RMK has established itself asa premier micro-credit agency of the country,with its focus on poor women and theirempowerment through the provision of credit forlivelihood-related activities. The RMK providesmicro-credit in a quasi-informal manner, lendingto intermediate micro-credit organizations (IMOs)(for example NGOs/voluntary organizations,women development corporations, women'scooperative societies, and suitable Government/ local bodies). The IMOs in turn lend to self-helpgroups (SHGs), which, in turn, lend to individualmembers at a rate not above the ceilingprescribed by the RMK, i.e. 18 per cent perannum on reducing balance method.
Welfare and Development of SCs, STs,OBCs, and other weaker sections
12.53 As part of the strategy to achieve inclusivedevelopment, the Government is committed towardsthe economic and social empowerment andeducational upliftment of socially disadvantagedgroups and marginalized sections of society.Accordingly, a number of schemes andprogrammes are implemented by the CentralGovernment through State Governments, UTAdministrations, and NGOs. The PPP approach isalso being explored for effective delivery of serviceswith more accountability and transparency.
Scheduled Castes (SCs)
12.54 A number of schemes are beingimplemented to encourage SC students to continuetheir studies from school to higher education level.During the year 2010-11, the physical target underthe Scheme of Pre-Matric Scholarship for thosestudents whose parents are engaged in uncleanoccupations was eight lakh beneficiaries/students.Against an allocation of ` 80 crore for 2010-11, an
amount of ` 51.26 crore has already been releasedto State Governments/UT Administrations forproviding scholarships to an estimated 6.30 lakhbeneficiaries up to 31 December 2010. The schemeof Post-Matric Scholarships for students belongingto SCs for studying in India has been revised witheffect from 1 July 2010 so as to (i) raise the parentalannual income ceiling for eligibility from ` one lakhto ` two lakh, (ii) rationalize the grouping of courses,and (iii) upwardly revise maintenance and otherallowances by 60 per cent . Consequent upon therevision in the Scheme, an ad hoc Centralassistance of ` 378 crore was released to nineStates that had fulfilled the eligibility criteria up toDecember 2010. The number of beneficiaries during2010-11 is estimated at 45 lakh. The Rajiv GandhiNational Fellowship Scheme was launched in 2006to provide financial assistance to SC studentspursuing M Phil and Ph D courses. The number ofscholarships under the Scheme has been increasedfrom 1333 to 2000 with effect from 1 April 2010.During 2010-11, an amount of ` 113 crore wasreleased up to December 2010 against the revisedallocation of ` 160 crore for 2000 new fellowshipsand 5332 renewals. The specified subjects underNational Overseas Scholarships have been revisedfor the selection year 2010-11 and subjects, namelymedicine, pure sciences, engineering, agriculturalsciences and management, have been specifiedfor providing financial assistance to pursue Masters-level courses and PhD/post-doctoral coursesabroad. Thirty awards are given per year. During2010-11, the amount released up to December 2010was ` 1.92 crore against an allocation of ` 6 crore.The earlier Centrally sponsored scheme for hostelsfor SC boys and girls was revised and renamedBabu Jagjiwan Ram Chhatrawas Yojna with effectfrom 1 January 2008. As part of this revision, Centralassistance for the construction of girls hostels wasraised from 50 per cent to 100 per cent. During2010-11, the physical target is to construct 49hostels for girls and 59 for boys and `11.74 crorewas released up to December 2010 against anallocation of ` 121 crore for construction of 12hostels. Special Central assistance is given to theScheduled Castes Sub Plan, a major scheme foreconomic advancement of SCs. During 2010-11,the physical target is to cover over 6 lakhbeneficiaries. An amount of ` 518.69 crore wasreleased to State Governments/UT Administrationsagainst a revised allocation of ` 600 crore up toDecember 2010. During 2010-11, the National
320 Economic Survey 2010-11
Website: http://indiabudget.nic.in
Scheduled Castes Finance and DevelopmentCorporation (NSCFDC) has given concessionalloans amounting to ` 121 crore to 33,659beneficiaries as on 31December 2010.
12.55 The Scheme of Top Class Education for SCsprovides financial assistance for quality educationto SC students up to degree/post-degree level. SCstudents, who secure admission in the notifiedinstitutions, are awarded scholarships. During 2010-11, the amount released up to December 2010 was` 9.64 crore to assist 1036 SC students studyingin institutions like IITs and IIMs against a budgetallocation of ` 25 crore. Two new IITs (Indore andMandi) and three new IIMs (Ranchi, Raipur, andRohtak) have been added in the notified list ofpremier institutions under the Scheme with 12scholarship slots per annum per institute, witheffect from the current financial year.
Scheduled Tribes (STs)
12.56 For the welfare and development of the STs,an outlay of ̀ 3206.50 crore has been provided inthe Annual Plan for 2010-11. During 2010-11, ̀ 960.50crore has been provided as Special CentralAssistance (SCA) to the Tribal Sub-Plan (TSP),which includes ` 60.50 crore for development offorest villages. The SCA to TSP is a 100 per centgrant extended to States as additional funding totheir TSP for family-oriented income-generatingschemes, creation of incidental infrastructure,extending financial assistance to SHGs, community-based activities, and development of forest villages.The outlay for grants-in-aid under Article 275(1) during2010-11 is ̀ 1046.00 crore. The funds are providedto States with the objectives of promoting the welfareof STs and improving administration to bring themon a par with the rest of the States and to enablethem take up such special welfare and developmentprogrammes which are otherwise not included in thePlan programmes. Under the Scheme for Post-MatricScholarships, 100 per cent financial assistance isprovided to ST students whose family income is lessthan or equal to ` 1.45 lakh per annum to pursuepost-matric-level education including professionaland graduate and postgraduate courses inrecognized institutions. The Scheme of Top ClassEducation for STs provides financial assistance forquality education to 625 ST students per annum topursue studies at degree and post-degree level inany of 125 identified Institutes. The family income ofthe beneficiary ST student from all sources shouldnot exceed ̀ 2 lakh per annum. Financial assistanceis also provided to 15 eligible ST students for
pursuing higher studies abroad in specified fields atMasters and Ph D level under the National OverseasScholarship Scheme.
12.57 The economic empowerment of STs bymeans of extension of financial support through theNational Scheduled Tribes Finance and DevelopmentCorporation (NSTFDC) continued. Financial supportis extended to ST beneficiaries/entrepreneurs in theform of loans and micro-credit at concessional ratesof interest for income-generating activities. The TribalCooperative Marketing Development Federation ofIndia Limited (TRIFED) is engaged in marketingdevelopment of tribal products and their retailmarketing through its sales outlets. As perinformation collected from the States till 31December 2010, more than 30,31,624 claims havebeen filed under the Scheduled Tribes and OtherTraditional Forest Dwellers (Recognition of ForestRights) Act and more than 11,06,541 titles have beendistributed. Around 32,000 titles are ready fordistribution. A scheme for Strengthening of Educationamong ST Girls in Low Literacy Districts to bridgethe gap in literacy levels between the general femalepopulation and tribal women is being implemented.
Minorities
12.58 Five communities-Muslims, Christians,Sikhs, Buddhists, and Parsis-were notified by theGovernment as minority communities under Section2 (c) of the National Commission for Minorities Act1992. As per the 2001 Census, minority communitiesconstitute 18.42 per cent of total population. For thedevelopment of minorities, the plan outlay was raisedfrom ̀ 1740 crore in 2009-10 to ̀ 2600 crore in 2010-11. Three scholarship schemes, namely Pre-Matric,Post-Matric, and Merit-cum-means-based, are beingimplemented exclusively for the minorities with thetotal provision enhanced from ̀ 450 crore in 2009-10 to ` 850 crore in 2010-11. A Multi-sectoralDevelopment Programme to address the'development deficits', especially in education, skilldevelopment, employment, health and sanitation,housing, and drinking water, in 90 minorityconcentration districts (MCDs) was launched in 2008-09. The outlay for this programme was enhancedfrom ̀ 990 crore in 2009-10 to ̀ 1400 crore in 2010-11. Work on implementation of this programme toimprove the selected development indices in theMCDs has picked up momentum. The corpus of theMaulana Azad Education Foundation (MAEF) hasbeen enhanced from ` 100 crore in 2005-06 to` 550 crore in 2010-11 to expand its activities forimplementation of educational schemes for
321Human Development, Equity and Environemnt
Website: http://indiabudget.nic.in
educationally backward minorities. The authorizedshare capital of the National Minorities Developmentand Finance Corporation (NMDFC) has been raisedfrom ` 650 crore in 2006-07 to ` 1500 crore in2010-11 for expanding its loan and micro-financeoperations to promote self-employment and othereconomic ventures among backward sections ofthe minority communities. The progress of the PrimeMinister's New 15 Point Programme for Welfare ofMinorities is being reviewed once in six months bythe Government. The programme has been enlargedby covering more schemes and its monitoringmechanism has been strengthened by includingelected representatives of State Assemblies andParliament. Two schemes, namely the (i) MaulanaAzad National Fellowship for Minority Students withan allocation of ` 30 crore in 2010-11 and (ii)'Computerization of Records of State Wakf Boards'with an allocation of ` 13 crore in 2010-11, hasbeen under implementation since 2009-10. Anotherscheme, namely 'Leadership Development of MinorityWomen' launched in 2009-10 is also beingimplemented with an allocation of `15 crore for2010-11. National Level Monitors have been deputedto monitor the progress of the schemes of theMinistry. Efforts are being made to improve themanagement of wakf properties and a scheme forthe computerization of records of the Wakf Board isa step in this direction. The Wakf Amendment Bill2010 was passed by the Lok Sabha on 7 May 2010.The Bill was referred to the Rajya Sabha on 18 May2010. The Rajya Sabha has referred the matter tothe Select Committee on 31 August 2010 to examinethe Bill.
Other Backward Classes (OBCs)
12.59 The Government provides Central Assistanceto State Governments /UT Administrations foreducational development of OBCs. During 2010-11,the Scheme of Pre-Matric Scholarships for OBC,proposes to provide scholarships to 14 lakh OBCstudents. An amount of ̀ 38.17 crore was releasedagainst an allocation of ` 50 crore to StateGovernments/UT Administrations up to December,2010 during the year 2010-11. Under the Scheme ofPost-Matric Scholarships for OBCs, it is proposedto provide scholarships to 15 lakh OBC students.An amount of ̀ 238.78 crore was released to StateGovernments/UT Administrations up to December2010 against an allocation of ̀ 350 crore during thefinancial year 2010-11. In order to provide hostelfacilities to OBC students studying in middle andsecondary schools, colleges, and universities to
enable them to pursue higher studies, an amount of` 7.83 crore was released up to December 2010against an allocation of ̀ 45 crore for 5000 additionalhostel seats. During 2010-11, the National BackwardClass Finance and Development Corporation(NBCFDC) has given concessional loans amountingto ` 106 crore to 80,660 beneficiaries as on 31December 2010.
12.60 The Central lists of backward classes havebeen amended vide Gazette Notification dated 18August 2010:
No lists had so far been notified for the States ofChhattisgarh and Jharkhand, which have beencreated in the year 2000. Lists have been notifiedfor these two States for the first time, comprising64 and 119 entries respectively.
Twenty-six new entries have been added in theexisting lists of Himachal Pradesh (2 entries) andDaman and Diu (24 entries), and
Modifications/corrections in 26 existing entriespertaining to four States (Haryana, HimachalPradesh, Karnataka, and Rajasthan) and one UT(Daman and Diu).
Persons with Disabilities
12.61 A large number of programmes areimplemented through national and apex institutesdealing with various categories of disabilities. Theseinstitutes conduct short- and long-term courses forvarious categories of personnel for providingrehabilitation services to those needing them. Underthe Scheme of Assistance to the Disabled forPurchase/Fitting of Aids and Appliances (ADIP),approximately 2 lakh persons with disabilities areprovided assistive devices every year. During 2010-11, ` 27.71 crore was released to implementingagencies up to December 2010 against a revisedallocation of ̀ 90 crore under the scheme. The targetis to cover 2 lakh persons with disabilities. Underthe Deen Dayal Disabled Rehabilitation Scheme(DDRS), ` 37.64 crore has been released up toDecember 2010 against a revised allocation of` 90 crore during 2010-11 to voluntary organizationsfor running special schools for children with hearing,visual, and mental disability and vocationalrehabilitation centres for persons with variousdisabilities and for manpower development in the fieldof mental retardation and cerebral palsy. The targetednumber of beneficiaries is 76,000. During 2010-11, the National Handicapped Finance andDevelopment Corporation (NHFDC), has given
322 Economic Survey 2010-11
Website: http://indiabudget.nic.in
Box : 12.9 Why Environment Matters to Achieve Sustainable Development in the Specific Contextof India.Our environmental standards are set through Government policies aimed at a development process that is environmentallysustainable and foregrounds well-being of the people. The broad objectives of our environmental policies and programmesare: Conservation of flora, fauna, forests, and wildlife; Prevention and control of pollution; Afforestation and regeneration of degraded areas; Protection of the environment.
As a country, India has been in the forefront of preserving biodiversity, sustainable management of forests, reducingemissions intensity of the economy, and following sustainable consumption and production patterns. Specifically, Indiahas been following a development path that takes into consideration the needs of the present generation without compromisingthe ability of future generations to meet their needs. Suitable attention has been given to protecting and conserving criticalecological systems and resources and invaluable natural and man-made heritage, which are essential for life-support,livelihoods, economic growth, and a broad conception of human well-being. Moreover, the effort has been to ensureequitable access to environmental resources and quality for all sections of society, in particular to ensure that poorcommunities which are most dependent on environmental resources for their livelihoods are assured secure access to theseresources.
concessional loans amounting to ̀ 19.86 crore to 4511 beneficiaries as on 31December 2010.
12.62 The Scheme of Incentives to Employers inthe Private Sector for Providing Employment toPersons with Disabilities was launched with effectfrom 1 April 2008. Under the Scheme, theGovernment will bear as an incentive the employer'scontribution to the Employees Provident Fund andEmployees State Insurance for the first three yearsfor every employee with disabilities appointed on orafter 1 April 2008 with monthly emoluments up to` 25,000.
Social Defence Sector
12.63 Under the Integrated Programme for OlderPersons (IPOP) scheme, grants-in-aid are given toNGOs for running old age homes (OAH), day carecentres (DCCs), and mobile medical units (MMUs.The Scheme has been revised with effect from 1April 2008. Besides an increase in the amount offinancial assistance for existing projects, several newprojects have been made eligible for financialassistance under the scheme. During 2010-11,` 10.18 crore was released up to December 2010against the revised allocation of ` 30 crore. Thescheme targets support to 0.45 lakh beneficiariesduring the year. The Maintenance and Welfare ofParents and Senior Citizens Act 2007 was enactedin order to ensure need-based maintenance forparents and welfare measures for senior citizens.The Act has been notified by 22 States and all theUTs so far.
12.64 Grants-in-aid are provided to NGOs forrunning Integrated Rehabilitation Centres for Addicts,
Regional Resource and Training Centres, and otherprojects. During 2010-11, ` 13.50 crore has beenreleased up to December 2010 against a revisedallocation of ̀ 31 crore. The scheme aims to benefit1.2 lakh persons. For effective implementation ofsocial defence schemes, personnel engaged indelivery of services in this area are being trainedunder various programmes being organized by theNational Institute of Social Defence (NISD). During2010-11, an amount of ̀ 5 crore was released up toDecember 2010 to the NISD against a revisedallocation of ̀ 7.50 crore.
Environment and Climate change
12.65 Economic Development withoutenvironmental considerations can cause seriousenvironmental damage, in turn impairing the qualityof life of present and future generations. Suchenvironmental degradation imposes a cost on thesociety and needs to be explicitly factored intoeconomic planning, with necessary remedialmeasures incorporated. The challenge of sustainabledevelopment thus requires integration of the country'squest for economic development with itsenvironmental concerns. Environment managementin India has, over the years, recognized thesesustainable development concerns. The NationalEnvironment Policy 2006 has attempted tomainstream environmental concerns in all ourdevelopmental activities. It underlines that 'whileconservation of environmental resources isnecessary to secure livelihoods and well being ofall, the most secure basis for conservation is toensure that people dependant on particular resourcesobtain better livelihoods from the fact of conservation,than from degradation of the resource'. The
323Human Development, Equity and Environemnt
Website: http://indiabudget.nic.in
Government of India, through its various policies, hasbeen factoring ecological concerns into thedevelopment process so that economic developmentcan be achieved without critically damaging theenvironment. The strong sustainable developmentagenda followed by India incorporates rigorousenvironmental safeguards for infrastructure projects,strengthening of the environmental governancesystem, revitalizing of regulatory institutions, focusingon river conservation, and efforts for improvementsin air and water quality, on a continuous basis (Box12.9).
A few recent initiatives
12.66 The Ministry of Environment and Forests hasnotified the Wetlands (Conservation andManagement) Rules 2010 in order to ensure thatthere is no further degradation of wetlands. The rulesspecify activities which are harmful to wetlands suchas industrialization, construction, dumping ofuntreated waste and reclamation and prohibit theseactivities in the wetlands. Other activities such asharvesting and dredging may be carried out in thewetlands but only with prior permission from theconcerned authorities. The National Green Tribunal(NGT) Act, 2010 came into force on 18th October,2010. As per the provisions of the NGT Act 2010,the National Environment Appellate Authority(NEAA), established under the NEAA Act, 1997stands dissolved and the cases pending before NEAAstand transferred to the NGT. The Act provides forthe establishment of a NGT for the effective andexpenditious disposal of cases relating toenvironmental protection and conservation of forestsand other natural resources including enforcementof any legal right relating to environment and givingrelief and compensation for damages to persons andproperty and for matters connected therewith orincidental thereto. Coastal ecosystems are a criticalreservoir of our biodiversity and provide protectionfrom natural disasters such as floods and tsunamisand are a source of livelihood to hundreds of millionsof families. Hence, as a major national initiative inthis direction, the Coastal Regulation ZoneNotification has been published in the gazette of Indiaon 6th January, 2011. The Government of India andWorld Bank have signed a loan agreement for theimplementation of an Integrated Coastal ZoneManagement Project, which will be implemented ata total cost of ` 1156 crore. The World Bank willcontribute an amount of ̀ 897 crore (77.7 per cent),the Government of India ̀ 177 Crore (15.4 per cent),and the States ̀ 80 Crore (6.9 per cent). This project
is for a period of five years and it is estimated that itwill benefit 3.56 crore people directly 6.30 croreindirectly. India has always maintained that economicand social development is its prime objective. At thesame time, it has promoted clean energy solutionswhich include activities aimed at promotion of energyefficiency in industrial, residential and commercialuse, solar power and projects that build fuel efficienttransport infrastructure, clean energy hydro powerplants, and efficient water supply and waste watersystems. India also has programmes aimed atbuilding a climate-resilient economy especially forhelping farmers, fishing communities, and othervulnerable communities safeguard their livelihoodsagainst the vagaries of a changing climate.
Climate Change
12.67 Climate Change, as a global environmentalproblem has been receiving intense political attentionat domestic and international levels. 'Climate change'means a change of climate which is attributeddirectly or indirectly to human activity that alters thecomposition of the global atmosphere and which isin addition to natural climate variability observed overcomparable time periods. Increasing levels of fossilfuel burning and land use changes have emitted,and are continuing to emit, greenhouse gases (mainlycarbon dioxide [CO2], methane, and nitrous oxide)into the earth's atmosphere. This increasing level ofemissions of greenhouse gases has caused a risein the amount of heat from the sun trapped in theearth's atmosphere, heat that would normally beradiated back into space. This has led to thegreenhouse effect, resulting in climate change. Themajor characteristics of climate change are rise inaverage global temperature, ice cap melting,changes in precipitation, and increase in oceantemperature. The efforts needed to address theclimate change problem include mitigation ofgreenhouse gas emissions on the one hand andbuilding of capacities to cope with the adverseimpacts of climate change on various sectors of thesociety and economy on the other.
Assessing the scale of the problem
12.68 According to the Fourth Assessment Reportof the Intergovernmental Panel on Climate Change(IPCC 2007), over the century, atmosphericconcentrations of carbon dioxide increased from apre-industrial value of 278 parts per million to 379parts per million in 2005, and the average globaltemperature rose by 0.740C. Projections indicatethat global warming will continue and accelerate.
324 Economic Survey 2010-11
Website: http://indiabudget.nic.in
0
4
8
12
16
20
1992
Figure 12.1
2007
2
6
10
14
18
Met
ric
tons
per
cap
ita
CO2 emissions
Unite
d St
ates
Aust
ralia
Cana
da
Finl
and
Russ
ian
Fede
ratio
n
The
Neth
erla
nds
Japa
n
Germ
any
Denm
ark
Norw
ay
Spai
n
Chin
a
Braz
il
Indi
a
and sector (Box 12.10). Total global emissions grewby 12.7 per cent between 2000 and 2005, an annualaverage of 2.4 per cent. CO2 is the predominantgas accounting for 77 per cent of world GHGemissions in 2005 followed by methane (15 percent) and nitrous oxide (7 per cent). North Americaaccounted for 18 per cent of world GHG emissions,China for 16 per cent, and the EU for 12 per centin 2005. India's share stood at 4 per cent in 2005.Per capita CO2 emissions of major countries areillustrated in Figure 12.1.
International Response
12.70 The issue of climate change is now placedfirmly on national and international agendas, subjectto scrutiny by public and media, and is even shapingthe strategies of a number of businesses.Internationally, the United Nations FrameworkConvention on Climate Change (the Convention) wasset up in 1992 and entered into force in 1994. Thiswas a crucial step in putting in place the institutionsand processes for the world's Governments to takecoordinated and effective action. The Conventionenjoins near universal membership. As on date, 194countries are Parties to the Convention. The ultimateobjective of the Convention is to stabilize theconcentrations of GHGs in the atmosphere at a levelthat would prevent dangerous anthropogenicinterference with the climate system. Such a levelshould be achieved within a time frame sufficient toallow ecosystems to adapt naturally to climatechange to ensure that food production is notthreatened and to enable economic development toproceed in a sustainable manner. Although globalin scope, it differentiated the commitments/
Thus climate change represents additional stresson ecological and socio-economic systems that arealready facing tremendous pressure due to rapideconomic development. With climate change, thetype, frequency, and intensity of extreme events,floods, and droughts are expected to increase.Hence addressing climate change is a majorchallenge in terms of policies and resources neededto address it at domestic and international levels.
Global Greenhouse Gas Emissions Trends
12.69 Global Greenhouse Gas (GHG) emissionshave risen sharply since 1945. As per a workingpaper published by the World Resources Institute,total GHGs were estimated at 44,153 MtCo2equivalents (million metric tons) in 2005. This is themost recent year for which comprehensiveemissions data are available for every major gas
Box 12.10 : World Greenhouse Gas Emissions
While the worldwide emissions of GHGs have increasedsince 1945, with the largest increases taking place in carbondioxide (CO2) emissions, scientists attribute the globalproblem of climate change not to the current GHG emissionsbut to the stock of historical GHG emissions.
Most of the countries, particularly the industrializedcountries, having large current emissions, are also the largesthistoric emitters and the principal contributors to climatechange.
A relatively small number of such countries are responsiblefor the largest chunk of the stock of global GHG emissions.
The industrialized countries with the largest total emissionsalso rank among those with the highest per capitaemissions. Per capita emissions are generally higher inwealthier countries.
325Human Development, Equity and Environemnt
Website: http://indiabudget.nic.in
responsibilities of Parties on the basis of respectivecapabilities, economic structures, and resourcebases and on the basis of the principle of 'equity'which is at the core of the climate change debate.Hence, any discussion on stabilization of theconcentrations of GHGs in the atmosphere shouldbe preceded by a paradigm for equitable access toglobal atmospheric resources that determines thedevelopment space of nations. The Convention laysdown legally binding commitments for the developedcountries, taking into account their historicalresponsibilities. These commitments are to beimplemented in the form of reduction of GHGemissions by the developed countries with referenceto 1990 levels and provision of support to developingcountries in terms of finance and technology so asto enable them to take voluntary mitigation andadaptation measures. The Convention recognizesthat economic and social development and povertyeradiation are the 'first and overriding priorities' ofthe developing countries.
12.71 The Convention laid the groundwork forconcerted international action, which in 1997 led tothe adoption of the Kyoto Protocol containing alegally binding quantitative time-bound target fordeveloped countries. The Kyoto Protocol set a targetfor developed countries (individually or jointly) toreduce overall emissions by at least 5 per cent below1990 levels in the first commitment period, 2008 to2012. Recognizing that relying on domesticmeasures alone to meet the target could be onerous,the Kyoto Protocol offers considerable flexibilitythrough three mechanisms: Clean DevelopmentMechanism (CDM), Joint Implementation (JI), andEmissions Trading (ET). Through the CDM,industrial countries can finance mitigation projectsin developing countries contributing to theirsustainable development. Credits received from suchprojects can be used to meet commitments underthe Kyoto Protocol. Through JI, industrializedcountries acquire emissions credit by financiallysupporting projects in other industrialized countries.ET allows countries that expect their emissions tobe above target to buy unused quotas from othercountries. All major countries except the USA haveratified the Kyoto Protocol.
12.72 The Conference of Parties (CoP), which isthe supreme body of the Convention, meetsannually. During the 13th CoP held at Bali,Indonesia, in December 2007, a comprehensiveprocess called the Bali Action Plan to enable thefull, effective, and sustained implementation of theConvention through Long Term Cooperative Action,
now, up to, and beyond 2012 was launched.Currently, international actions for addressing climatechange are being pursued under the Bali Action Planand the mandate of the Kyoto Protocol. The 15thCoP held at Copenhagen in December 2009 madesome advance in the form of the 'CopenhagenAccord', which reflects the political understanding
Box 12.11 : Elements of the Cancun Agreements(i) Industrialized country targets are officially
recognized under the multilateral process and thesecountries are to develop low-carbon developmentplans and strategies and assess how best to meetthem, including through market mechanisms, andto report their inventories annually.
(ii) Developing country actions to reduce emissions areofficially recognized under the multilateral process.A registry is to be set up to record and matchdeveloping country mitigation actions to financeand technology support from by industrializedcountries. Developing countries are to publishprogress reports every two years.
(iii) Parties meeting under the Kyoto Protocol agree tocontinue negotiations with the aim of completingtheir work and ensuring there is no gap between thefirst and second commitment periods of the treaty.
(iv) The Kyoto Protocol's CDM has been strengthenedto drive more major investments and technologyinto environmentally sound and sustainable emissionreduction projects in the developing world.
(v) Parties launched a set of initiatives and institutionsto protect the vulnerable from climate change andto deploy the money and technology that developingcountries need to plan and build their ownsustainable futures.
(vi) A total of $30 billion in fast start finance fromindustrialized countries to support climate actionin the developing world up to 2012 and the intentionto raise $100 billion in long-term funds by 2020 areincluded in the decisions.
(vii) In the field of climate finance, a process to design a'Green Climate Fund' under the Conference of theParties, with a Board with equal representation fromdeveloped and developing countries, is established.
(viii)A new Cancun Adaptation Framework is establishedto allow better planning and implementation ofadaptation projects in developing countries throughincreased financial and technical support, includinga clear process for continuing work on loss anddamage.
(ix) Governments agree to boost action to curb emissionsfrom deforestation and forest degradation indeveloping countries with technological and financialsupport.
(x) Parties have established a technology mechanismwith a Technology Executive Committee and ClimateTechnology Centre and Network to increasetechnology cooperation to support action onadaptation and mitigation.
326 Economic Survey 2010-11
Website: http://indiabudget.nic.in
reached by a select group of countries. However,this was only 'noted' and not adopted by the Partiesto the Convention. The recent negotiations held atCancun during 29 November - 11 December 2010have resulted in a set of decisions that cover variousareas of action, for example mitigation, adaptation,technology and finance as outlined in the Bali ActionPlan, while agreeing to work towards an ambitioustarget of emissions reduction under the KyotoProtocol. The Cancun Agreements include decisionsunder both the Convention and Kyoto protocolnegotiating tracks (Box 12.11). They are widelyperceived as a modest, small step forward and areaffirmation of faith in the multilateral process. Asper the Cancun Agreements, all Parties to theConvention (including the developed and developingcountries) have agreed to report their voluntarymitigation goals for implementation. These will besubject to measurement and verification orinternational consultation, as appropriate, inaccordance with agreed international guidelines.Decisions were taken at Cancun to set up a GreenClimate Fund, a Technology Mechanism, and anAdaptation Committee at global level to supportdeveloping country actions for adaptation andmitigation. These decisions are significant becausethey reflect, to a large degree, the politicalunderstanding that was reached by a select groupof countries in the form of the Copenhagen Accordin December 2009.
India's Greenhouse Emissions
12.73 Although India ranks in the top five in termsof GHG emissions, the per capita emissions aremuch lower compared to those of the developedcountries, even if the historical emissions areexcluded. Its high level of emissions is due to largepopulace, geographical size and large economy.The most recent data available for India are theassessment carried out by the Indian Network forClimate Change Assessment (INCCA) in May 2010.The key results of the assessment are that the totalnet GHG emissions from India in 2007 were 1727.71million tons of CO2 equivalent (eq.), of which carbondioxide emissions were 1221.76 million tons;methane 20.56 million tons; and nitrous oxide 0.24million tons. In 1994, the total net GHG emissionsfor India were 1228.54 million tons of CO2 eq. Thisrepresents a compounded annual growth rate of2.9 per cent during the period 1994 to 2007(Table 12.14).GHG emissions from the energy,industry, agriculture, and waste sectors in 2007constituted 58 per cent, 22 per cent, 17 per cent,and 3 per cent of the net CO2 eq. emissionsrespectively. India's per capita CO2 eq. emissionsincluding land use, land use change, and forestry(LULUCF) were 1.5 tons per capita in 2007.
Impacts of Climate Change in India12.74 Climate change has enormous implicationsfor the natural resources and livelihoods of thepeople. It will have wide-ranging effects on theenvironmental and socio-economic and relatedsectors. Various studies indicate that the key sectors
Box 12.12 : Why India is concerned aboutclimate change.
India is a country which will be severely impacted byclimate change. This puts additional hurdles in itsdevelopmental path in addition to the challenges ofpoverty eradication and growing population. Theprojected impacts of climate change cut across varioussectors, natural systems such as coastal areas, waterresources, forests, agriculture, and health. With a largeagrarian population, India is vulnerable to changes inweather parameters. Further, rainfall, variability andmelting of glaciers will impact replenishment of rivers,thereby affecting availability of water in river basinsand watersheds. In India, most of the rivers flowing inthe northern regions are dependent on snow and glacialmelt, thus climate change threatens the perennial natureof these rivers. This has huge implications for agricultureand allied activities and resultant livelihoods. This is aserious concern for an economy that is tied to its naturalresource base along its developmental path.
Table 12.14 : A Comparison of GHG Emissionsby Sector between 1994 and 2007
(in million tons of CO2 equivalent)
1994 2007 CAGR(per
cent)
Electricity 355.03 (28.4) 719.30 (37.8) 5.6
Transport 80.28 (6.4) 142.04 (7.5) 4.5
Residential 78.89 (6.3) 137.84 (7.2) 4.4
Other Energy 78.93 (6.3) 100.87 (5.3) 1.9
Cement 60.87 (4.9) 129.92 (6.8) 6.0
Iron & Steel 90.53 (7.2) 117.32 (6.2) 2.0
Other Industry 125.41 (10.0) 165.31 (8.7) 2.2
Agriculture 344.48 (27.6) 334.41 (17.6) -0.2
Waste 23.23 (1.9) 57.73 (3.0) 7.3
Total without LULUCF 1251.95 1904.73 3.3
LULUCF 14.29 -177.03
Total with LULUCF 1228.54 1727.71 2.9
Note: Figures in brackets indicate percentageemissions from each sector with respect tototal GHG emissions without LULUCF in 1994and 2007 respectively.
327Human Development, Equity and Environemnt
Website: http://indiabudget.nic.in
2022, doubling the present share of 3 per cent ofnuclear power in the energy mix over the nextdecade, putting in place a major market-basedprogramme to stimulate energy efficiency, imposingclean energy cess on coal for funding research anddevelopment (R&D) of clean energy technologieseven though coal will continue to play a key role inour future energy strategy, and aggressivelyexpanding the use of natural gas in powerproduction. Third, India has been pursuingaggressive strategies for forestry and coastalmanagement to increase the quality and quantity offorest cover and has launched a major newprogramme on coastal zone management to addressthe adaptation challenges facing over 300 millionpeople in our country who live in vulnerable areasnear our coast.
12.76 As part of its international obligations underthe United Nations Framework Convention on ClimateChange (UNFCCC) India periodically prepares theNational Communication (NATCOM) that gives aninventory of the GHG emissions in India, assessesthe vulnerability and impacts, and makes appropriaterecommendations regarding social, economic andtechnological measures for addressing climatechange. The First NATCOM was presented to theUNFCCC in 2004. The Government is now engagedin preparing NATCOM II, which will be presented tothe UNFCCC in 2011. Preparation of NATCOM is anexercise of high scientific rigour based on anextensive network of research and scientificinstitutions in India and draws upon expertise andexcellence from different institutions. India has setup an elaborate Indian Network for ComprehensiveClimate Change Assessment of some 250 scientistsand 120 research institutions to assist in this work.This Network has already published India's GHGinventory for the year 2007 and a 4x4 assessmentof climate change impacts on four key sectors andfour key regions of the country for the 2030s, a timeframe for which decisive interventions can be madenow. This network is expected to put in place aprogramme for measuring, monitoring, and modelingthe impact of black carbon which could have climatechange and public health impacts.
12.77 India's strategy for enhancing its adaptivecapacity to climate variability is reflected in many ofits social and economic development programmes.For developing countries like India, adaptationultimately boils down to assisting the vulnerablepopulation during exigencies and empowering themto build their lives and cope with uncertainties in thelong run. Several of India's social-sector schemes,
in India such as the agriculture, water, naturalecosystem, biodiversity, and health are vulnerableto climate change (Box 12.12). This is happeningprecisely at a time when it is confronted with hugedevelopment imperatives. The Indian Network forClimate Change Assessment (INCCA) released areport in November 2010 on assessment of theimpact of climate change on key sectors and regionsof India in the 2030s. The assessment covers fourkey sectors of the Indian economy, namelyagriculture, water, natural ecosystems andbiodiversity, and health in four climate sensitiveregions, namely the Himalayan region, the WesternGhats, the Coastal Area, and the North-east region.The report warns of impacts such as sea-level rise,increase in cyclonic intensity, reduced crop yieldin rainfed crops, stress on livestock, reduction inmilk productivity, increased flooding, and spread ofmalaria. This calls for urgency of action in reducingvulnerability to adverse impacts of climate changeand enhancing adaptive capacity through sector-specific interventions and efforts.
India's Strategies
12.75 India's total CO2 emissions are about 4 percent of total global CO2 emissions and the energyintensity of India's output has been falling withimprovements in energy efficiency, autonomoustechnological changes, and economical use ofenergy. India's climate modeling studies show thateven with 8-9 per cent gross domestic product (GDP)growth every year for the next decade or two, its percapita emissions will be around 3-3.5 tonnes ofCO2eq. by 2030, as compared to the present 1-1.2tonnes. These are well below developed countryaverages by any estimation. India's determination inaddressing climate change is evident from the factthat an indicative target of increasing energyefficiency by 20 per cent by 2016-17 is alreadyincluded in the Eleventh Five Year Plan. This hasnow been supplemented with the domestic mitigationgoal of reducing emissions intensity of the GDP by20-25 per cent of the 2005 level by 2020 throughproactive policies. The resources for the measuresrequired to achieve this objective will need to bemobilized from various sources including the nationalplanning process. Studies in respect of a low carbonstrategy for development aimed at ensuring inclusivegrowth are being conducted with the aim of includingthis as one of the key pillars in the Twelfth Five YearPlan. Second, India is taking conscious steps todiversify the energy fuel mix such as setting up of20,000 MW of solar power-generating capacity by
328 Economic Survey 2010-11
Website: http://indiabudget.nic.in
Table 12.15 : Total Expenditure on Adaptation-oriented Schemes
Year GDP Grand Total of Expenditure on Expenditure on Expenditure on(Rs. crore) Expenditure Adaptation- Adaptation Adaptation
(Rs. Crore) as per cent as per centof total of GDP
ExpenditureBudget
2000-01 1,864,301 335,523 27,028 8.06 1.45
2003-04 2,222,758 474,254 39,792 8.39 1.79
2005-06 3,254,216 508,705 62,071 12.20 1.91
2008-09 4,162,509 900,953 106,463 11.82 2.56
2009-10 4,493,743 1,021,546 126,028 12.34 2.84
0
2
4
6
8
10
12
14
Per
cent
Expenditureas per centof total govtexpenditure
Total expenditure on adaptation oriented schemesFigure 12.2
Expenditureas per cent
of GDP
2000
-01
2003
-04
2005
-06
2008
-09
2009
-10
Year
with their emphases on livelihood security and welfareof the weaker sections, aim to do just that. Indiaimplements a series of Central sector and centrallysponsored schemes under different Ministries/Departments aimed at achieving social andeconomic development. Many of these schemescontain elements (objectives and targets) that aredecidedly geared to adaptation. In other words, thereis substantial adaptation orientation in many of thesectoral schemes currently under operation. Anexercise has been carried out to measure theexpenditure on adaptation-related programmes withcritical adaptation components: (a) crop improvementand research, (b) poverty alleviation and livelihoodpreservation, (c) drought proofing and flood control,(d) risk financing, (e) forest conservation, (f) health,and (g) rural education and infrastructure. It has beenfound that India's expenditure on these adaptation-oriented schemes has increased from 1.45 per centof GDP in the year 2000-01 to 2.84 per cent during2009-10 (Figure12.2). This is a fairly impressive levelof spending and is an obvious reflection of themultiplicity of economic and social welfare
programmes under implementation in India (Table12.15).
12.78 India has announced a National ActionPlan on Climate Change (NAPCC) in June, 2008which incorporates its vision of sustainabledevelopment and the steps it must take to realize it.The NAPCC is coordinated by the Ministry ofEnvironment and Forests and implemented throughthe nodal Ministries and is aimed at advancingrelevant actions in specific sectors/areas. Eightnational missions in the areas of solar energy,enhanced energy efficiency, sustainable agriculture,sustainable habitat, water, Himalayan ecosystem,increasing the forest cover, and strategic knowledgefor climate change form the core of NAPCC (Box12.13). State Governments are also preparing, underthe advice of the Central Government, State ActionPlans aimed at creating institutional and programme-oriented capacities to address climate change.These, together with the National Missions, willenhance climate change-related actions in the publicand private domains.
329Human Development, Equity and Environemnt
Website: http://indiabudget.nic.in
Box 12.13 : Eight National MissionsJawaharlal Nehru National Solar Mission (JNNSM)The government has launched the JNNSM in January 2010 with a target of 20,000 MW grid solar power (based on solarthermal power- generating systems and solar photovoltaic [SPV] technologies), 2000 MW of off-grid capacity by 2022.The Mission will be implemented in three phases. The first phase will last three years (up to March 2013), the second tillMarch 2017, and the third till March 2022. The Government has also approved the implementation of the first phase of theMission (up to March 2013) and the target to set up 1100 MW grid-connected solar plants including 100 MW of rooftopand small solar plants and 200 MW capacity-equivalent off-grid solar applications and a 7 million sq.m solar thermalcollector area in the first phase of the Mission, till 2012-13.
Energy Conservation and EfficiencyThe objective of the National Mission for Enhanced Energy Efficiency (NMEEE) is to achieve growth with ecologicalsustainability by devising cost-effective strategies for end- use demand-side management. The Ministry of Power andBureau of Energy Efficiency have been entrusted with the task of preparing the implementation plan for the NMEEE andupscaling the efforts to create and sustain market for energy efficiency to unlock investment of around Rs 74,000 crore.The Mission is likely to achieve about 23 million tons oil-equivalent of fuel savings--in coal, gas, and petroleum products--by 2014-15, along with an expected avoided capacity addition of over 19,000 MW. The carbon dioxide emissionreduction is estimated to be 98.55 million tons annually.
National Mission on Strategic Knowledge for Climate Change (NMSKCC)The NMSKCC has been launched with the broad objectives of mapping of the knowledge and data resources relevant toclimate change and positioning of a data-sharing policy framework for building strategic knowledge among the variousarms of the Government, identification of knowledge gaps, networking of knowledge institutions after investing criticalmass of physical, intellectual, and policy infrastructure resources, creation of new dedicated centres within the existinginstitutional framework, building of international cooperation on science and technology for climate change agendathrough strategic alliances and assistance for the formulation of policies for a sustained developmental agenda.
National Mission for Sustaining Himalayan Ecosystem (NMSHE)The broad objectives of the NMSHE include: understanding the complex processes affecting the Himalayan ecosystemand evolving suitable management and policy measures for sustaining and safeguarding it, creating and buildingcapacities in different domains, networking of knowledge institutions engaged in research and development of a coherentdata base on the Himalayan ecosystem, detecting and decoupling natural and anthropogenic-induced signals of globalenvironmental changes in mountain ecosystems, studying traditional knowledge systems for community participation inadaptation, mitigation, and coping mechanisms inclusive of farming and traditional health care systems, and developingregional cooperation with neighbouring countries, to generate a strong data base through monitoring and analysis so asto eventually create a knowledge base for policy interventions.
National Water MissionThe objectives of the National Water Mission are 'conservation of water, minimizing wastage and ensuring its moreequitable distribution both across and within States through integrated water resources management'. The goals of theMission are a comprehensive water data base in the public domain, assessment of the impact of climate change on waterresources, promotion of citizen and State actions for water conservation, augmentation and preservation, focusedattention to overexploited areas, increasing water use efficiency by 20 per cent, and promotion of basin-level integratedwater resources management.
Green India MissionThe Mission aims at responding to climate change through a combination of adaptation and mitigation measures. Thesemeasures include enhancing carbon sinks in sustainably managed forests and other ecosystems, adaption of vulnerablespecies/ecosystems to the changing climate, and adaptation of forest-dependent communities. The objectives of theMission are increased forest/tree cover on 5 million ha of forest/non-forest lands and improved quality of forest cover onanother 5 million ha (a total of 10 million ha), improved ecosystem services including biodiversity, hydrological services,carbon sequestration as a result of treatment of 10 million ha), increased forest-based livelihood income for about 3million households living in and around the forest, and enhanced annual CO2 sequestration by 55 million tonnes in theyear 2020.
National Mission on Sustainable Habitat (NMSH)The NMSH seeks to promote sustainability of habitats through improvements in energy efficiency in building and urbanplanning, improved management of solid and liquid waste including recycling and power generation, modal shifttowards public transport, and conservation. It also seeks to improve ability of habitats to adapt to climate change byimproving resilience of infrastructure, community- based disaster management, and measures for improving advancewarning systems for extreme weather events.
National Mission for Sustainable AgricultureThe National Mission for Sustainable Agriculture (NMSA) seeks to address issues regarding 'sustainable agriculture' inthe context of risks associated with climate change by devising appropriate adaptation and mitigation strategies forensuring food security, enhancing livelihood opportunities, and contributing to economic stability at national level. Underthis Mission, the adaptation and mitigation measures would be mainstreamed in research and development activities,absorption of improved technology and best practices, creation of physical and financial infrastructure and institutionalframework, facilitating access to information and promoting capacity building. While promotion of dryland agriculturewould receive prime importance by way of developing suitable drought- and pest-resistant crop varieties and ensuringadequacy of institutional support, the Mission would also expand its coverage to rainfed areas for integrating farmingsystems with livestock and fisheries so that agriculture continues to grow in a sustainable manner.
330 Economic Survey 2010-11
Website: http://indiabudget.nic.in
Climate Change Financing
12.79 Climate change is a complex policy issuewith major implications in terms of finances foraddressing mitigation of GHG emissions on the onehand and coping with the adverse impacts of climatechange on the community and population,ecosystem, economy and livelihood on the other.All actions to address climate change ultimatelyinvolve costs. Funding is vital in order for countrieslike India to design and implement adaptation andmitigation plans and projects. The problem is moresevere for developing countries like India, whichwould be one of the hardest hit by climate changeand with very little capacity to adapt. Most countriesdo indeed treat climate change as a real threat andare striving to address it in a more comprehensiveand integrated manner with the limited resources attheir disposal. But financial ways and means mustbe found to enable developing countries to enhancetheir efforts to address climate change, especiallyenhancing their adaptive capacity. Thus climatechange is both an environmental issue and aneconomic costs and development issue.
12.80 Lack of funding is a large impediment toimplementing adaptation plans. Article 4 of theConvention states that developed countries shallprovide financial resources to assist developingcountry Parties in addressing climate change. Thefunds that are currently available under theConvention and the Kyoto Protocol are smallcompared to the magnitude of the need assessedby many studies. The UNFCCC has estimated arequirement of US$ 200-210 billion in additionalinvestment in 2030 to return GHG emissions tocurrent level. Further, additional investment neededworldwide for adaptation is estimated to be US$ 60-182 billion in 2030 by UNFCCC, inclusive of anexpenditure of US$ 28-67 billion in developingcountries. As various estimates point to the enormityof funds to address climate change, developingcountries including India have been arguing that aglobal mechanism for generating and accounting foradditional resources, mainly from public sources, isessential for meeting the long-term financerequirements for adaptation and mitigation. Thereshould be a multilateral financial mechanism underthe Convention that should be set up with resourcesprovided by developed countries on the basis ofassessed contributions.
12.81 One of the important outcomes of the CancunAgreements from the finance point of view is thedecisions on 'fast start finance, long-term finance,and Green Climate Fund'. At Cancun, it was decided
to set up a 'Green Climate Fund', to be designatedas an operating entity of the Financial Mechanismof the Convention under Article 11. The Green ClimateFund is accountable to and functions under theguidance of the CoP. The Fund will be governed by aBoard of 24 members chosen evenly from developedand developing nations. The Fund will supportenvironment-related projects, programmes, policies,and other activities in developing countries. Theconcerns of different regions of the world need to beaddressed by the Board having balancedrepresentation from different UN regional groups. TheGreen Climate Fund will have a 'trustee' accountableto the Board for the performance of its fiduciaryresponsibilities. The World Bank has been invited toserve as the 'interim' trustee subject to a review threeyears after operationalization of the Fund. Theoperation of the Fund will be supported by anindependent Secretariat and designed by aTransitional Committee with 40 members--15 fromdeveloped countries and 25 from developingcountries. Further, a Standing Committee under theCoP was established for improving coherence andcoordination in the delivery of climate changefinancing. In addition, the Cancun Agreement calledupon developed countries to submit information onthe resources provided to fulfil the commitment to'fast start finance' approaching US$30 billion for theperiod 2010-12. It also recognized the goal of jointlymobilizing US$ 100 billion per year by 2020 as 'long-term finance' to address the needs of developingcountries. The goal of US$100 billion falls short ofdeveloping countries' call for assessed contributionsof 1.5 per cent of developed countries' GDP. Further,developing countries had been insisting on publicfunds as the major source, whereas, the CancunAgreement does not specify how the finances wouldbe mobilized by the developed countries.
12.82 India's initiatives will succeed if the globalframework of actions is effective and supportive.While the outcomes in Cancun on Climate Fund,Technology Mechanism, and Adaptation Frameworkand Forestry (REDD+) are welcome, further workis needed on strengthening of weak mitigationpledges by developed countries, preventing unilateraltrade actions in the name of climate change, andcontinuing a dialogue on intellectual property rightsas part of technology development and transferefforts. Moreover, a successful global effort foraddressing climate change must be built on soundprinciples of equity and common but differentiatedresponsibilities. Equity in terms of equitable accessto global atmospheric resources should define thepathway to attainment of a long-term goal in line
331Human Development, Equity and Environemnt
Website: http://indiabudget.nic.in
with the broad findings of science. In futurenegotiations, developing countries need to ensure aspace for them for equitable access to atmosphericresources. The continuation of the Kyoto Protocolin its second commitment period and adoption ofrobust mitigation commitments by developedcountry Parties in accordance with the principle of'common but differentiated responsibilities' will beessential for maintaining the credibility of themultilateral process and for a science-based andadequate response of the global community toclimate change. In other words, any solution toclimate change, as a global problem, must be basedon the participation of all countries, withreorganization of ‘common but differentiatedresponsibilities’ and the principle of 'equity'.
OUTLOOK AND CHALLENGES
12.83 Post global crisis of 2008, the Indianeconomy has continued to recover robustly helpedby the Government policies to counter the adverseimpact of the crisis. On the employment front also,the Country has been able to withstand the adverseimpact of the global crisis and generate employmentsince July 2009, as reported in the quarterly surveysconducted by the Labour Bureau. Unlike otherdeveloped countries, where the measures to counterjob losses were ad hoc and contained elements ofprotectionism, in the Indian case, the programmesof employment generation were planned with a long-term outlook free of any elements of protectionism.The employment generation programmes of theGovernment like the MGNREGS have beeninstrumental in creating employment opportunitiesand placing additional income in the hands of thepoor and the disadvantaged sections of society.Further improvements in the scheme like shifting topermanent asset building and infrastructuredevelopment activities, reducing transaction costs,better monitoring, and extension of the MGNREGSto urban areas can yield better results. It also needsto be ensured that implementation of the programmedoesn't result in shortage of labour during the peakagricultural season. Since a number of programmesare being run concurrently by the Government toaddress the twin issues of unemployment and povertyalleviation, there is need for better convergence ofthe schemes to avoid duplication and leakages andto ensure that the fruits of the schemes reach thetargeted beneficiaries. While the Government hasconsciously undertaken a large increase inbudgetary allocations for anti-poverty programmes
and employment- generation schemes, policystructures need to be firmed up to facilitate effectiveimplementation of these programmes and to ensurethat allocation results in outputs and outputs inoutcomes. Initiatives like the outcome budget andthe setting up of the Unique Identification Authorityof India by the Government are some steps in thisdirection.
12.84 Given the advantage of a young population,the realization of the democratic dividend is anotherfactor that calls for some more reforms in theeducation system and health sector. While a skilled,trained and healthy young population with the righttype of education is an asset, an uneducated or illeducated, unskilled, less healthy, and unemployedpopulation could lead to a demographic disaster.Reaping the demographic dividend needs a vision, along-term plan, and bold decisions. While theNational Skill Development Mission is a step in theright direction, much more is required both in termsof achievements and speed. The RTE Act must faceno implementation deficit for it to work towardsrealizing the demographic dividend. Similar reformsare needed in university and higher education andthe demand-supply mismatch in the job marketneeds to be corrected. Mobilization of funds for highereducation is indeed a challenge for the Government.The gap in available resources could possibly bemet by a tailor-made Public-Private Partnership (PPP)mode of funding without diluting the regulatoryoversight of the Government. Private-sectorparticipation in social sectors, such as health andeducation, sometimes referred to as public-social-private partnership (PSPP), could be one of thepossible alternatives for supplementing the ongoingefforts of the Government. However, in order to put inplace such mechanisms, crucial issues such asrisks and returns associated with such high costprojects need to be suitably addressed to ensurethat there are enough takers for such PSPP projectsin the market on a self-sustainable basis. Whilethe potential of the demographic dividend is high,the effort to realize it also has to be in similarproportions.
12.85 Another challenge for the Government isproper balancing of the climate challenge and thegrowth challenge. The increasing importance ofclimate-related issues should not shake thefoundations of our inclusive growth strategy. Carefulplanning and customized policies are needed toensure that the green growth strategies do not resultin a slow growth strategy.