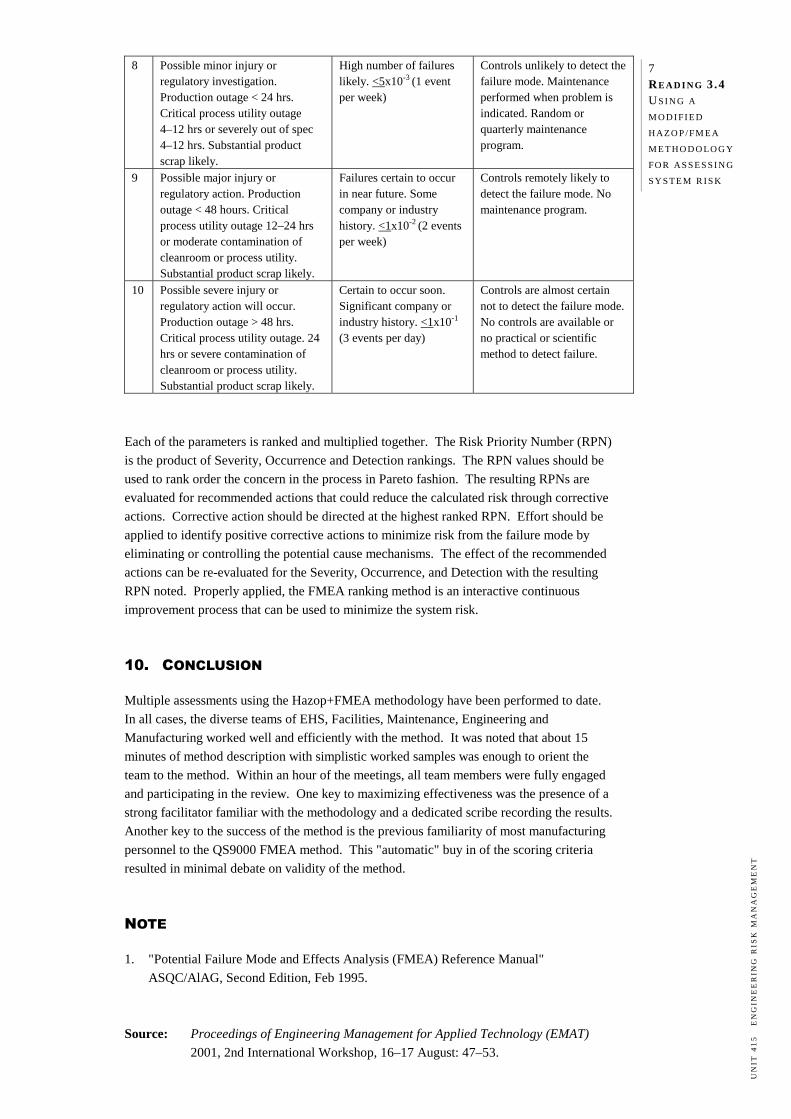
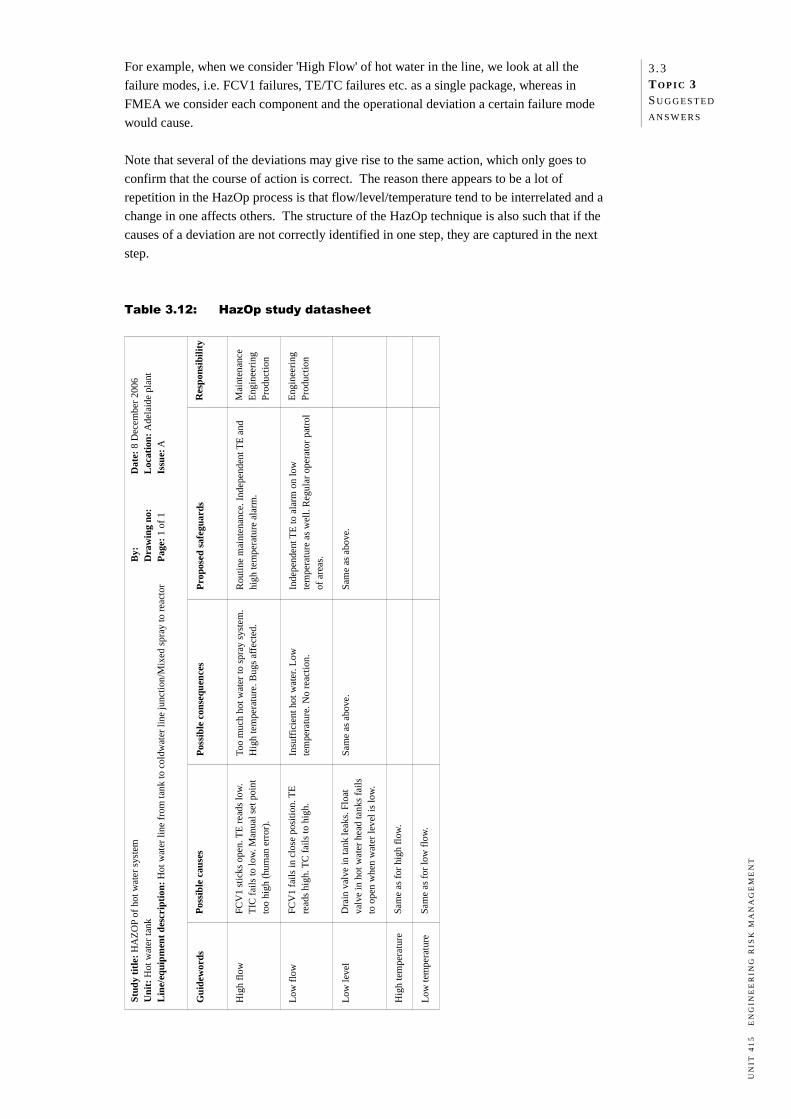
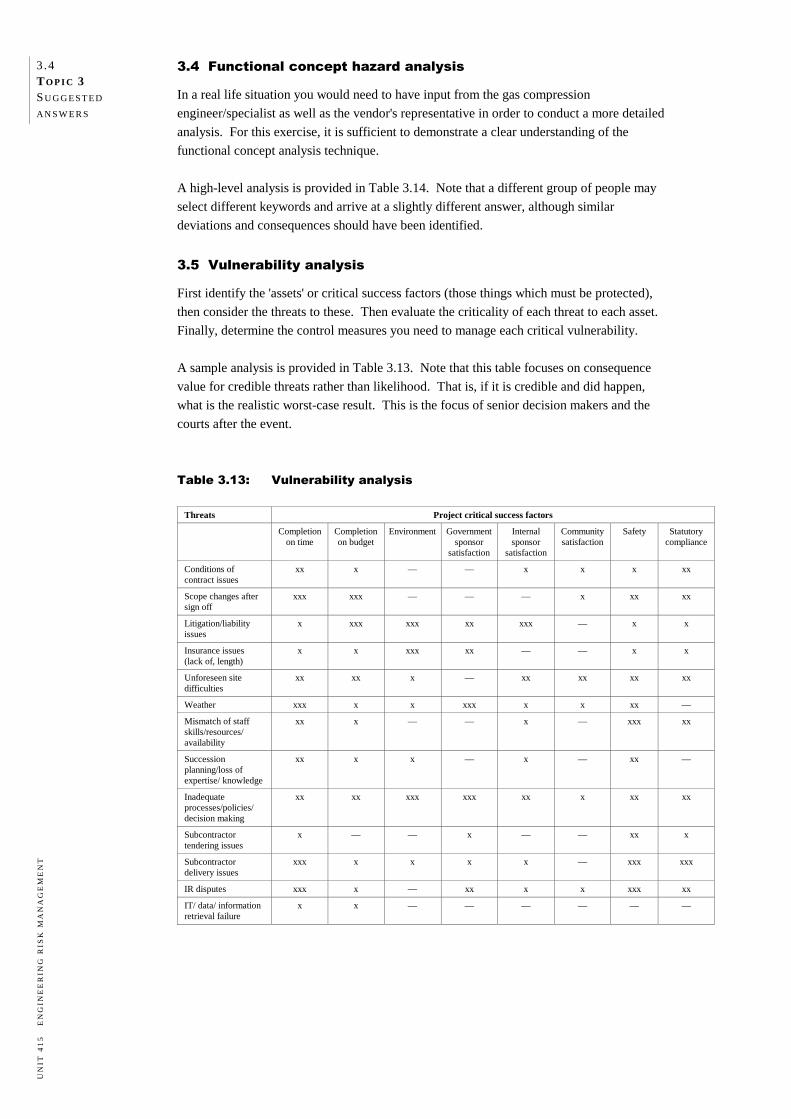
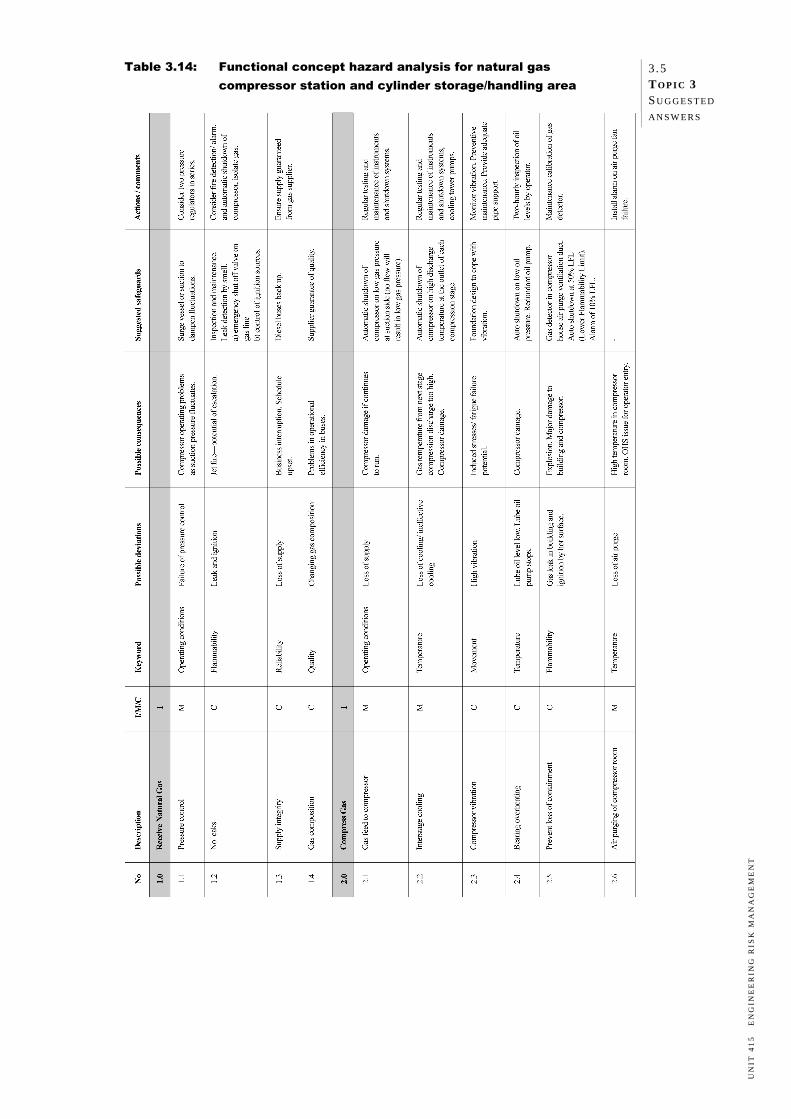
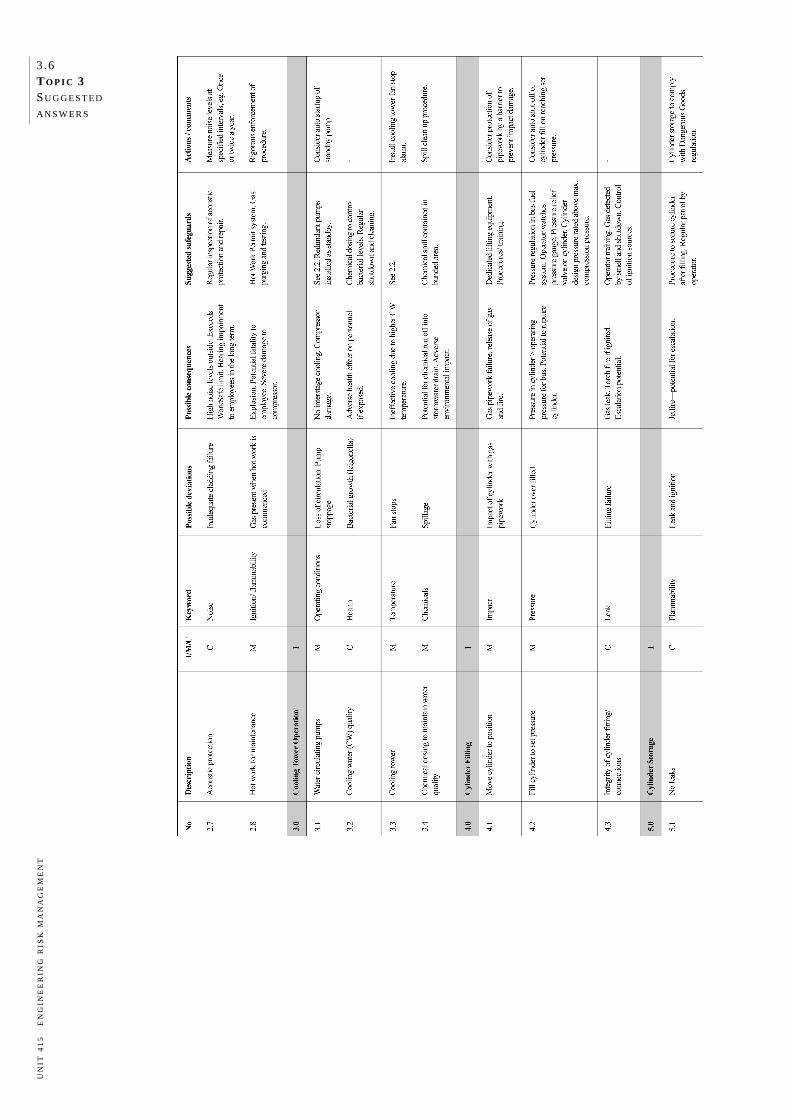
T OPIC 1 THE CONCEPT OF RISK Preview 1.1 Introduction 1.1 Objectives 1.1 Required reading 1.1 Nature of risk 1.1 Loss and the two dimensions of risk 1.2 Subjective nature of risk 1.3 Hazard vs risk 1.3 Types of engineering risks 1.5 People risks 1.6 Asset risks 1.7 Environmental risks 1.9 Liability risks 1.10 Business interruption risks 1.11 Project risks 1.12 Summary 1.13 Exercises 1.13 References and further reading 1.14 Suggested answers
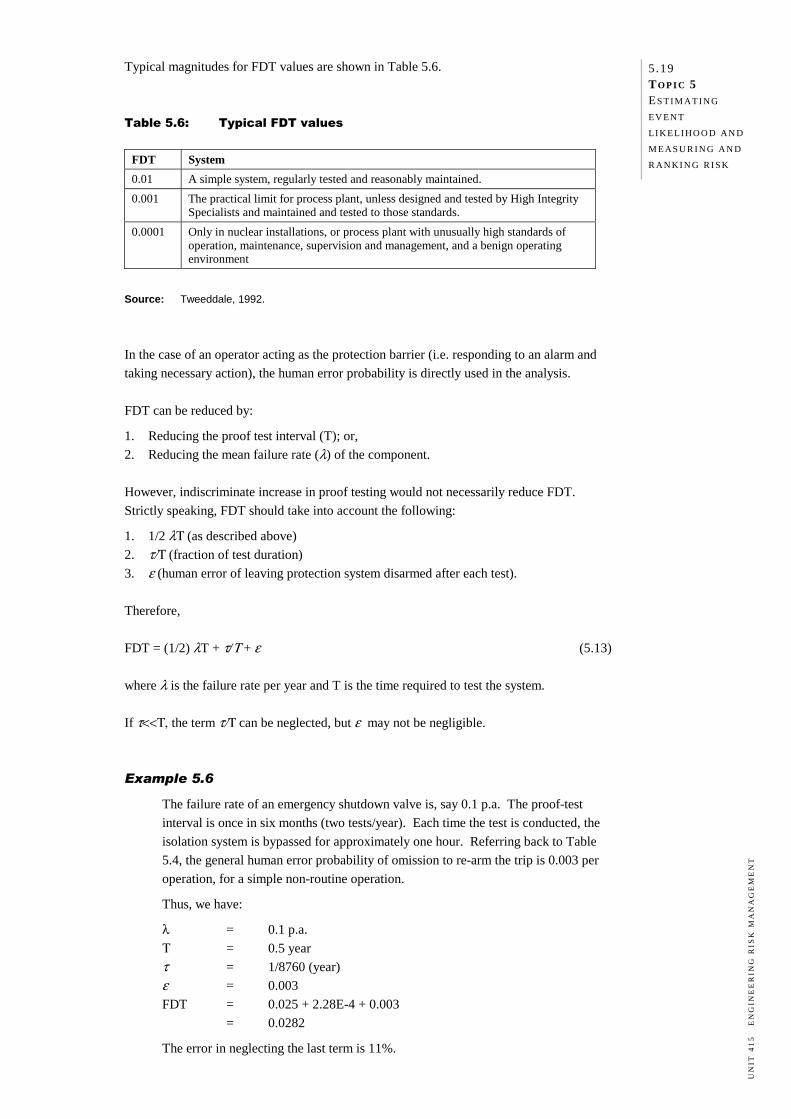
Transcript
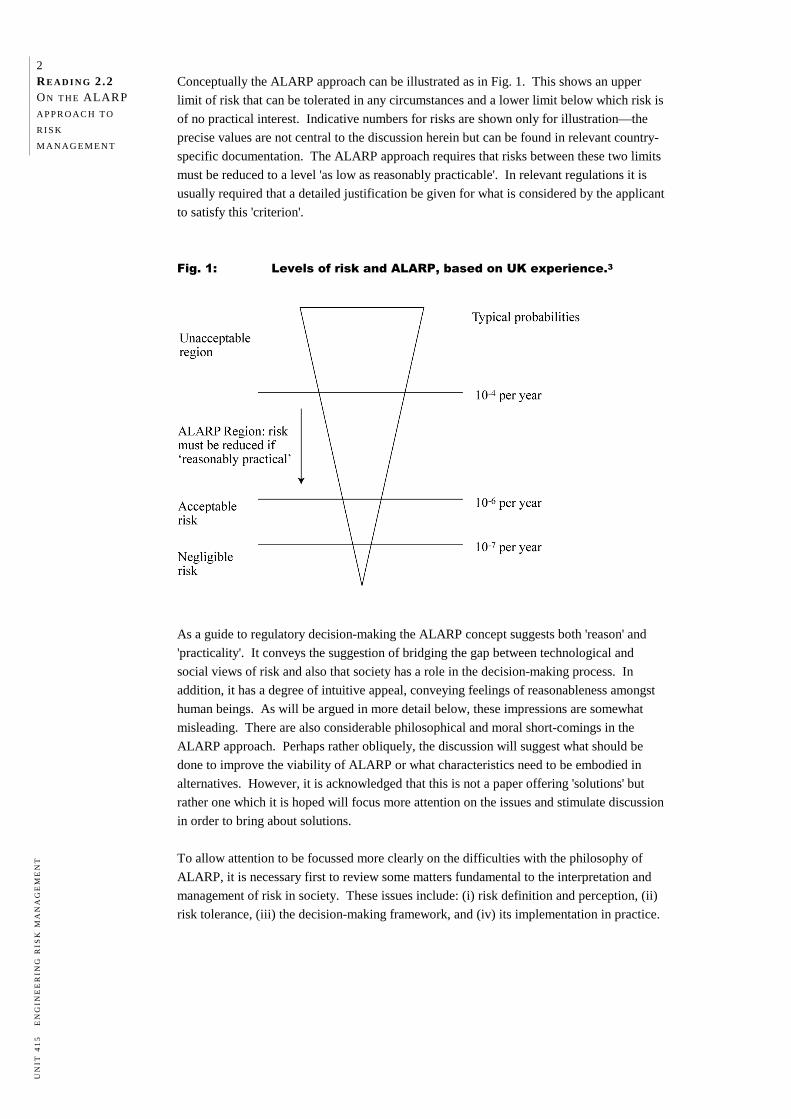
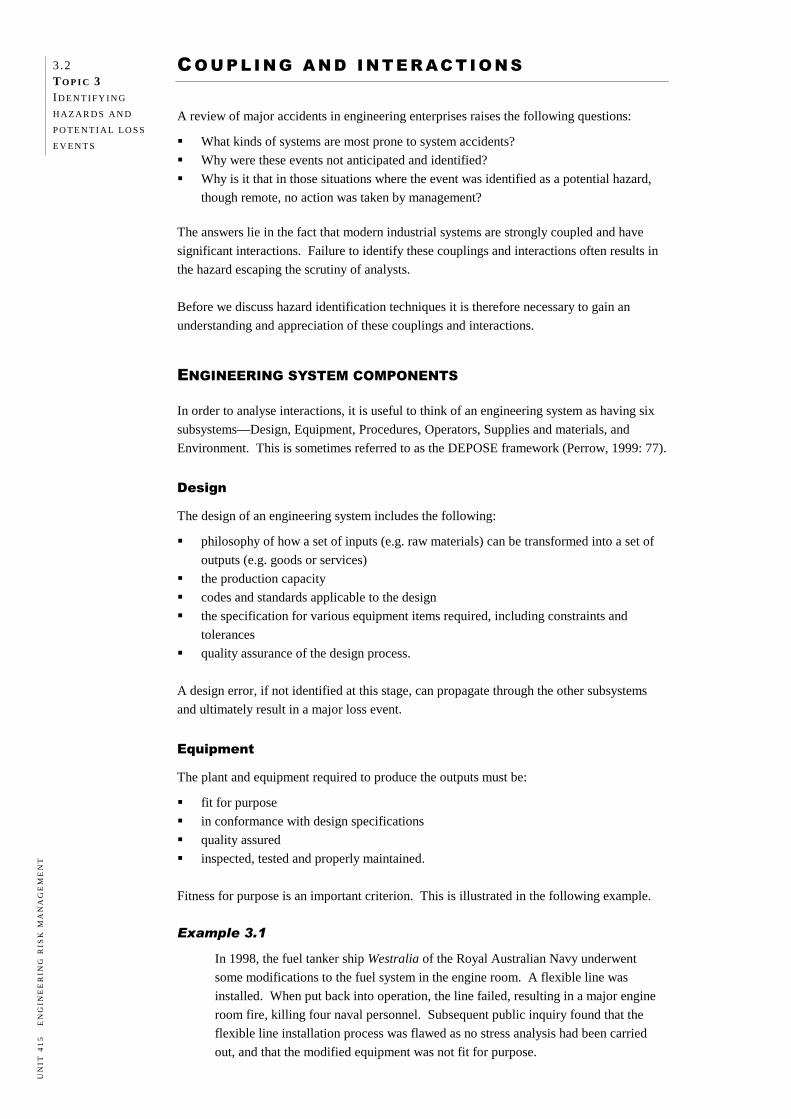
TO P I C 1
THE CONCEPT OF RISK
Preview 1.1 Introduction 1.1 Objectives 1.1 Required reading 1.1 Nature of risk 1.1 Loss and the two dimensions of risk 1.2 Subjective nature of risk 1.3 Hazard vs risk 1.3 Types of engineering risks 1.5 People risks 1.6 Asset risks 1.7 Environmental risks 1.9 Liability risks 1.10 Business interruption risks 1.11 Project risks 1.12 Summary 1.13 Exercises 1.13 References and further reading 1.14 Suggested answers
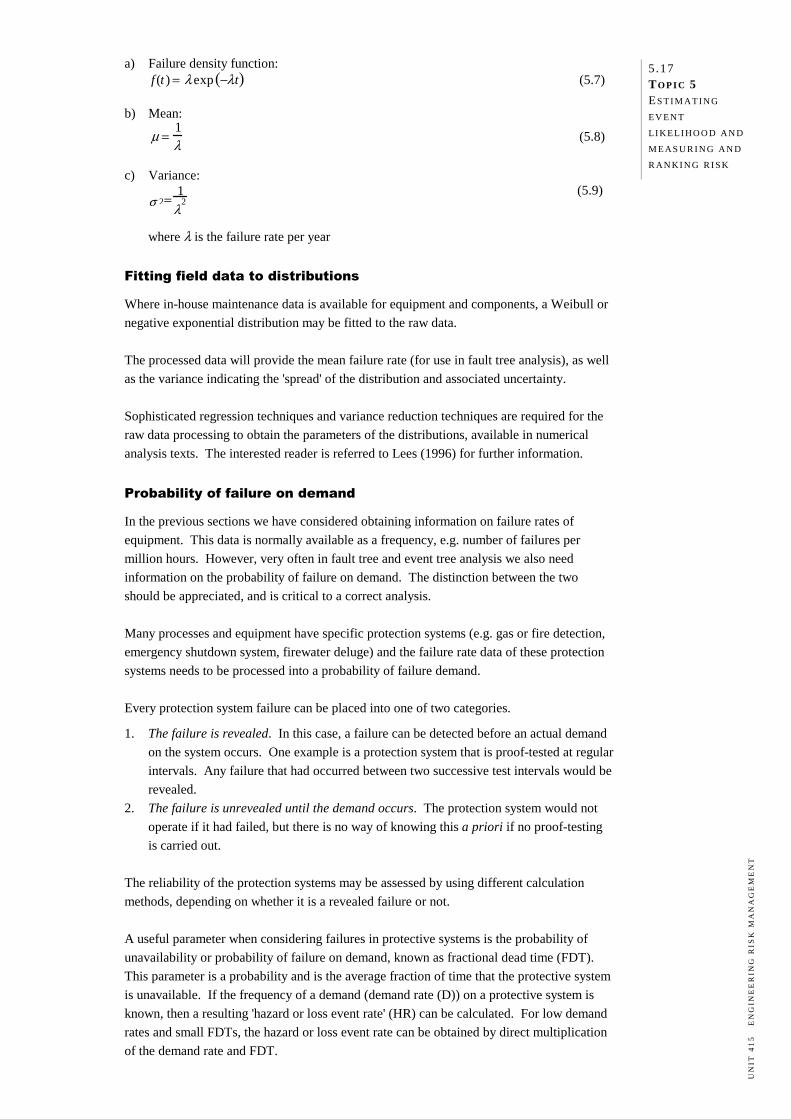
1.1 TO P I C 1 THE C O N C E P T O F
R I S K
UN
IT 4
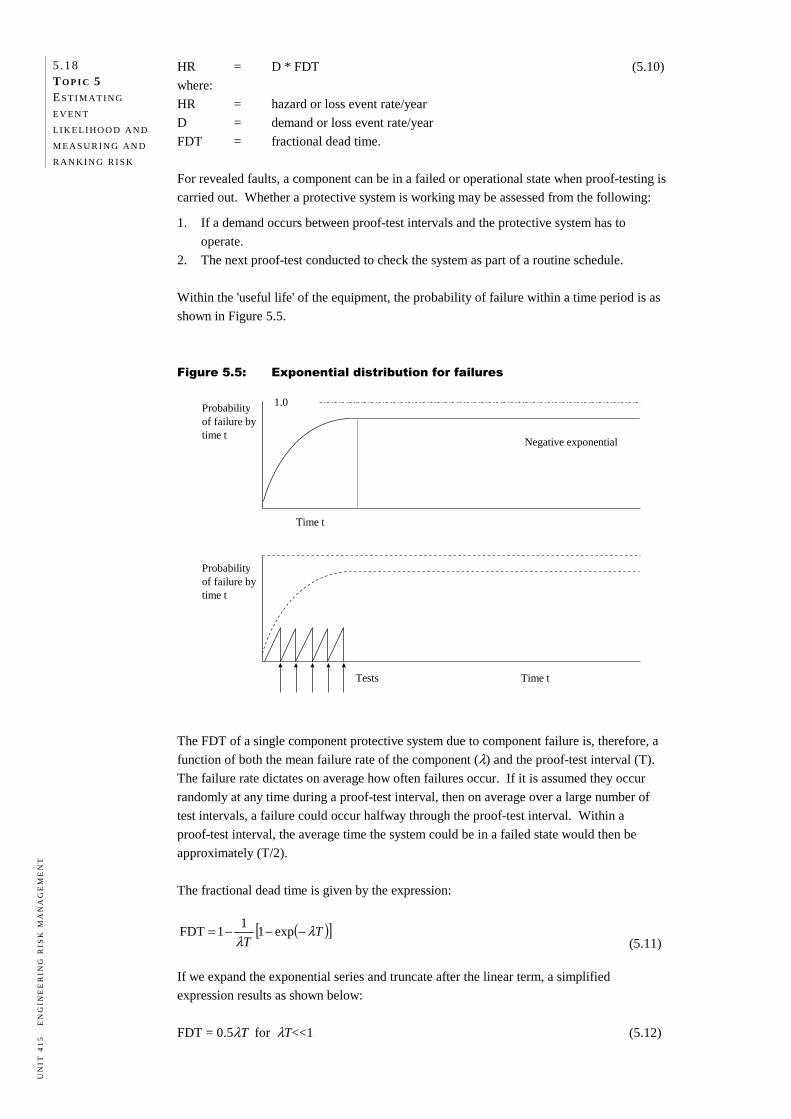
15
E
NG
INE
ER
ING
RIS
K M
AN
AG
EM
EN
T
PR E V I E W
INTRODUCTION
This topic examines the concept of risk. The emphasis is on engineering risks associated
with industrial activities, and not on the commercial risks of financing and money
management (which are dealt with in Unit 406 Corporate Finance), the risks associated
with insurance or a detailed legal appreciation of negligence and liability (which is dealt
with in Unit 202 Legal Studies).
We will begin by discussing the nature of risk and explaining how a risk differs from a
hazard. We will then discuss the various types of engineering risks including people risks,
asset risks, environmental risks, liability risks, business continuity risks and project risks.
This will lead us logically to Topic 2, where an overview of the issues related to managing
engineering risks is outlined.
OBJECTIVES
After studying this topic you should be able to:
define the terms 'risk' and 'hazard' and explain how they differ
recognise that there is no such thing as 'zero' risk
describe the different types of engineering risks
identify hazards, potential loss events and types of risks in a given scenario.
REQUIRED READING
There is no additional reading required for this topic.
NAT U R E O F R I S K
Risk is a very broad concept and means different things to different people. Here are three
examples.
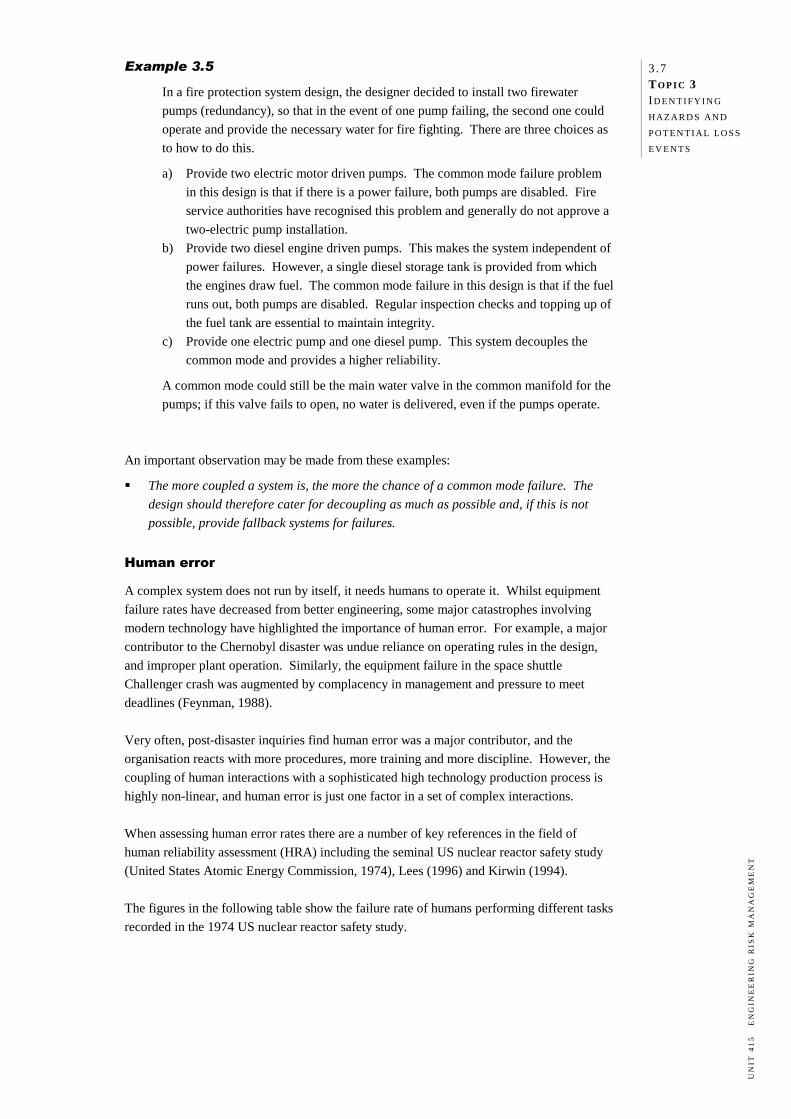
a) Risk as perceived by a safety professional
A safety professional may interpret risk in a given industrial facility as the likelihood
that a major fire or explosion, structural failure, machine malfunction or human error
will occur with possible consequent injury or fatality.
b) Risk as perceived by a production manager
A manager in charge of production operations may see risk as the likelihood that a
major business interruption will occur, resulting in loss of production, because of an
accident, equipment breakdown, or industrial dispute.
c) Risk as perceived by a fund manager
A fund manager may interpret risk as fluctuations in the market (a combination of both
positive and negative outcomes), bond rate and interest rate variations, and volatility in
foreign exchange rates that could undermine the value of the investment, or affect
overseas borrowing, against which hedging is necessary.
1 .2 TO P I C 1 THE C O N C E P T O F
R I S K
UN
IT 4
15
E
NG
INE
ER
ING
RIS
K M
AN
AG
EM
EN
T
Whilst perceptions and interpretations of risk may vary, the above examples illustrate three
facets of the nature of risk:
risk is associated with some form of 'loss'
risk involves two different dimensions—severity (of consequence) and likelihood
risk is often subjective. We will now explore these points in more detail. LOSS AND THE TWO DIMENSIONS OF RISK
Historically risk has been associated with some form of harmful loss such as:
loss of life or quality of life
loss of physical assets or infrastructure
loss of money
loss of environment. Regardless of the type of loss, risk involves two separate dimensions:
the severity or magnitude of the adverse consequences of the loss event
the likelihood or chance of the loss event occurring. It is essential that the technologist or risk manager appreciate both of these dimensions
because this leads to a two-pronged approach to managing risks—namely minimising the
severity or magnitude of a loss event, and minimising or eliminating the likelihood of the
event. The following definition of risk incorporates both the concept of loss and the
two-dimensional nature of risk.
Definition—Risk Risk is the chance of something happening that will have an impact upon objectives. Risk
is measured in terms of a combination of the consequences of an event and their likelihood.
(AS/NZS 4360:2004).
Let's apply this definition to some engineering examples.
a) Large oil tankers transport crude oil from production fields to the oil refineries in many
parts of the world. If there is an accidental release of oil, there is potential for major
environmental damage as was seen in the Exxon Valdez incident in Alaska, and the
incident involving a Spanish tanker in the Shetlands, off the coast of Scotland. In this
context, the risk in large tankers carrying oil could be characterised in terms of the
value of the oil lost, the damage it causes (severity of consequences), and the likelihood
of such an event occurring in a given time period.
b) Hundreds of people work in underground mines every day across the world.
Underground mining is associated with certain risks: for instance, the potential for
serious injury or fatality by roof fall. The mining company might use the following
criteria to measure such risks:
Likelihood of an accident resulting in serious injury to an employee in a given time
period (e.g. one year).
Likelihood of an accident resulting in the death of an employee in a given time
period (e.g. one year).
1.3 TO P I C 1 THE C O N C E P T O F
R I S K
UN
IT 4
15
E
NG
INE
ER
ING
RIS
K M
AN
AG
EM
EN
T
c) A mineral processing company has a production target to be met for the year. One of
the important steps in the operations is the crushing of raw material ore to size for
further processing. A large rotating ball mill is used to crush the ore. If a major failure
occurs in this section of the plant, the downstream processing will have to shut down
and considerable loss of production could occur. The following criteria might be used
to measure the risk.
Likelihood of 10% loss of production for one week.
Likelihood of total loss of production for one month.
d) A construction company has a contract to complete a railway overpass that can carry
heavy vehicle traffic. The project is to be completed by an agreed date and a cost
penalty applies for delays. The integrity of the installation is critical as the
consequential costs of a structural failure are very high. The construction company can
adopt a number of risk measures such as the following:
Likelihood of project completion being delayed by a specified period (one or two
months).
Likelihood of budget overrun by 15%.
Likelihood of a structural failure during the operational life of the overpass. SUBJECTIVE NATURE OF RISK
Risk is an abstract concept; it does not exist the way a thing or a physical attribute such as
size does. We often talk of 'estimating' the risk of a given situation by using information
from the past to predict the future, but in reality there is rarely sufficient, applicable data for
such estimates to be accurate. This means that risk analysis essentially involves estimating
uncertainty using the concept of likelihood. So risk is almost always an assigned quantity
that acquires credibility only by consensus. The consensus is most often professional and
managerial, but community and legal consensus usually underpins these opinions.
The subjective nature of risk raises many questions about the reliability of risk analysis. For
risk analysis to be meaningful, the assessment of a given risk must be considered relative to
that of other risks. HAZARD VS RISK
The terms 'hazard' and 'risk' are often wrongly used interchangeably. It is essential to
understand the difference between these two terms because both are used in risk
management.
Definition—Hazard Hazard may be defined as a source of potential harm or a situation with a potential to
cause loss. (AS 3931:1998 and AS/NZS 4360:2004).
1 .4 TO P I C 1 THE C O N C E P T O F
R I S K
UN
IT 4
15
E
NG
INE
ER
ING
RIS
K M
AN
AG
EM
EN
T
Some examples of hazards include:
Smoking in bed in domestic dwellings and hotel rooms. This has the potential to cause
a fire and toxic smoke which can result in fatalities. In 1974, this was the cause of a
major hotel fire in Seoul, South Korea, which resulted in 88 fatalities.
Storage of large quantities of LP gas in a depot. A leak and ignition has the potential to
cause a major explosion and loss of life. In 1984, such an explosion in Mexico City
caused more than 450 fatalities and 7 000 injuries.
Storage of toxic gas in a chemical factory. A leak and dispersion downwind could
cause serious injury and possibly death among the exposed population. The leak of
methyl isocyanate gas from the Union Carbide pesticide manufacturing plant in Bhopal,
India, in 1984, resulted in at least 15 000 fatalities and 150 000 injuries.
An object falling from a height; e.g. a tool on a construction site. This can injure or kill
a person below.
Two aircraft on the same runway in an airport. Each plane represents a hazard to the
other. This could result in a collision with multiple fatalities and the loss of both
planes, as happened in the Canary Islands in 1977 when a KLM jet collided with a
PanAm jet in dense fog. There were 583 fatalities and 61 people injured.
Derailment of a commuter train. In 2003 a train travelling at excessive speed at
Waterfall on the outskirts of Sydney resulted in 7 deaths with 42 people injured (out of
a total of 49 people on board).
Production and storage of chemicals. On November 13, 2005 there was a series of
explosions at the No.101 Petrochemical Plant in Jilin City, Jilin Province, China. The
explosions killed five people, injured dozens, and caused the evacuation of tens of
thousands of residents. The blasts created an 80 km long toxic slick in the Songhua
River, a tributary of the Amur. The slick passed into the Amur River and into Russia
over subsequent weeks. Water supplies to millions of people in Harbin and other cities
were disrupted.
The essential point to note here is that a hazard is a potential and is not an actuality. In
other words, a hazard may not be realised if it is managed and kept under control.
You will also note that in all the examples of hazard above, there is no mention of
likelihood. This comes under the purview of risk.
The difference between a hazard and a risk can be seen clearly by thinking of a situation
and asking the following questions:
What can cause harm? (Hazard)
What are the adverse consequences if the hazard were realised? (Loss event)
How serious would these consequences be? (Severity, one dimension of risk)
How likely is it that the hazard could be realised? (Likelihood, the second dimension
of risk)
Have sufficient measures been adopted to reduce the likelihood of the hazard being
realised and/or to mitigate the severity of its adverse consequences? (Risk control)
1.5 TO P I C 1 THE C O N C E P T O F
R I S K
UN
IT 4
15
E
NG
INE
ER
ING
RIS
K M
AN
AG
EM
EN
T
TY P E S O F E N G I N E E R I N G R I S K S
All industrial activities involve risks. While the risks can be kept under control and
minimised, they cannot be totally eliminated without abandoning the activity altogether.
For instance, underground mining or offshore oil and gas production have certain intrinsic
risks due to the nature of the environment in which the activities are carried out. The only
way to achieve zero risk in these activities is not to carry out the activities at all.
There are many different types of risks which reflect various facets of an organisation's
operations. It is important to identify which risk types are applicable before undertaking a
risk analysis.
The main types of engineering risks are risks affecting:
people
assets
the environment
liability
business continuity
projects.
This is not an all-encompassing list and could be extended to include things like reputation,
competitive edge and information.
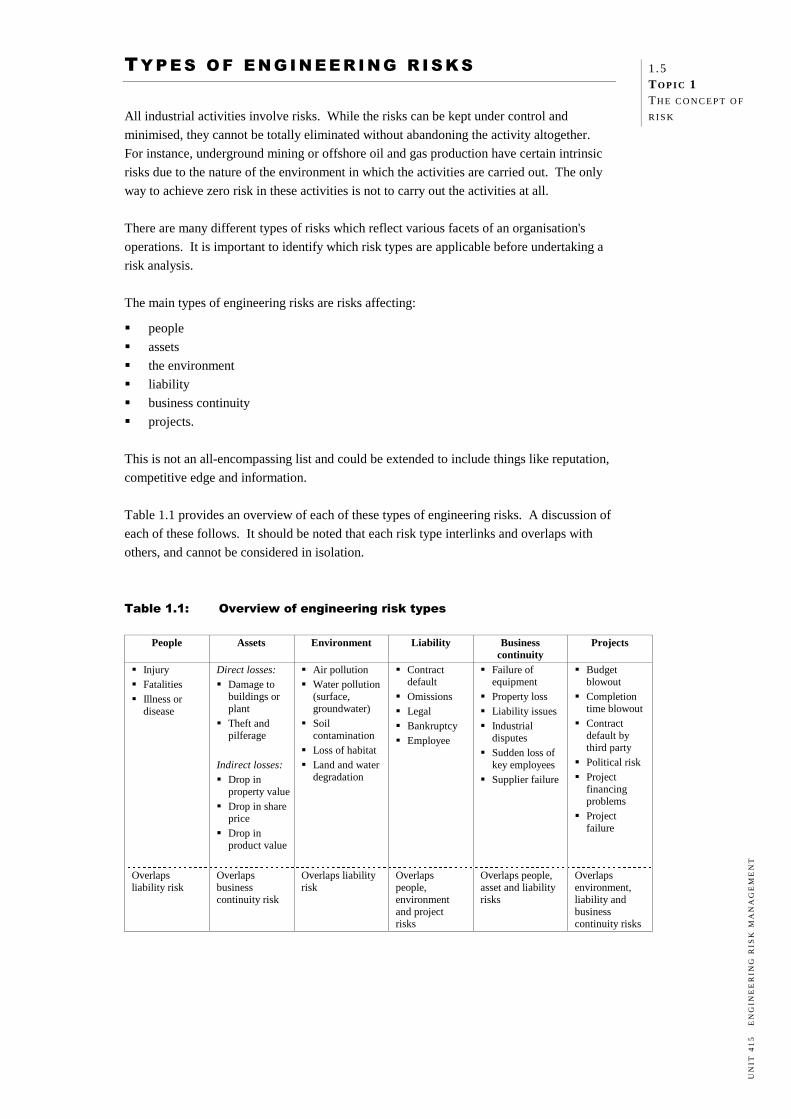
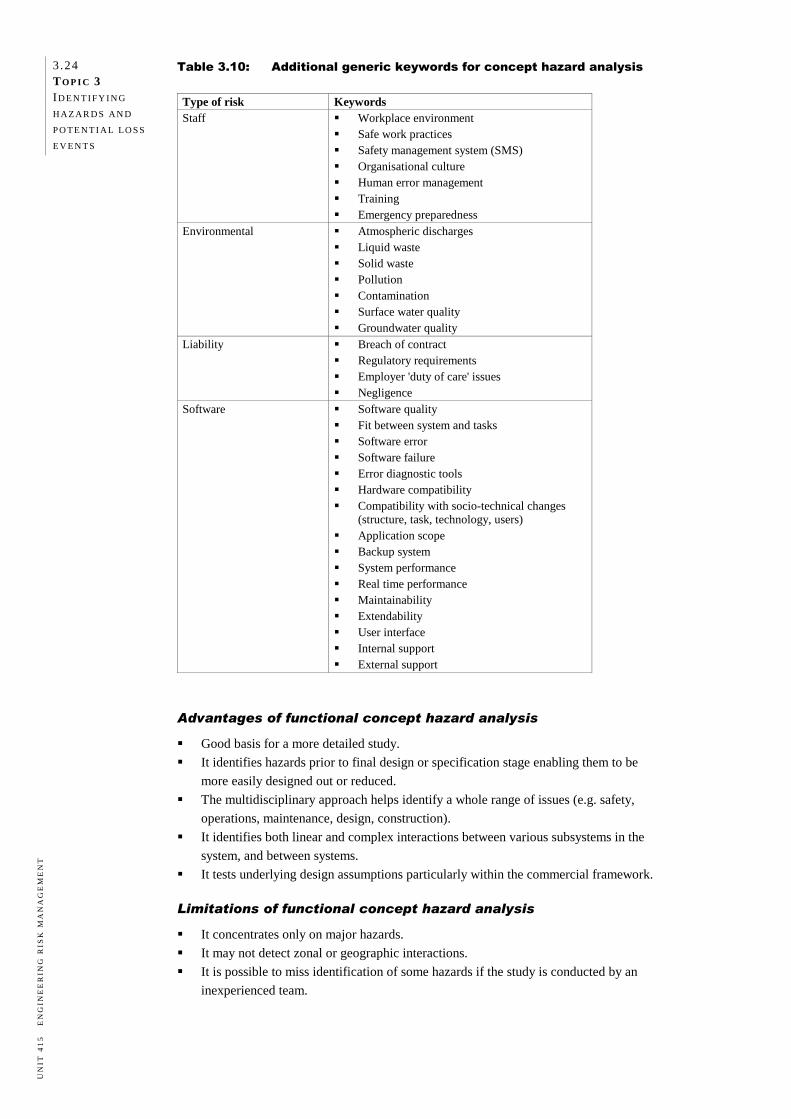
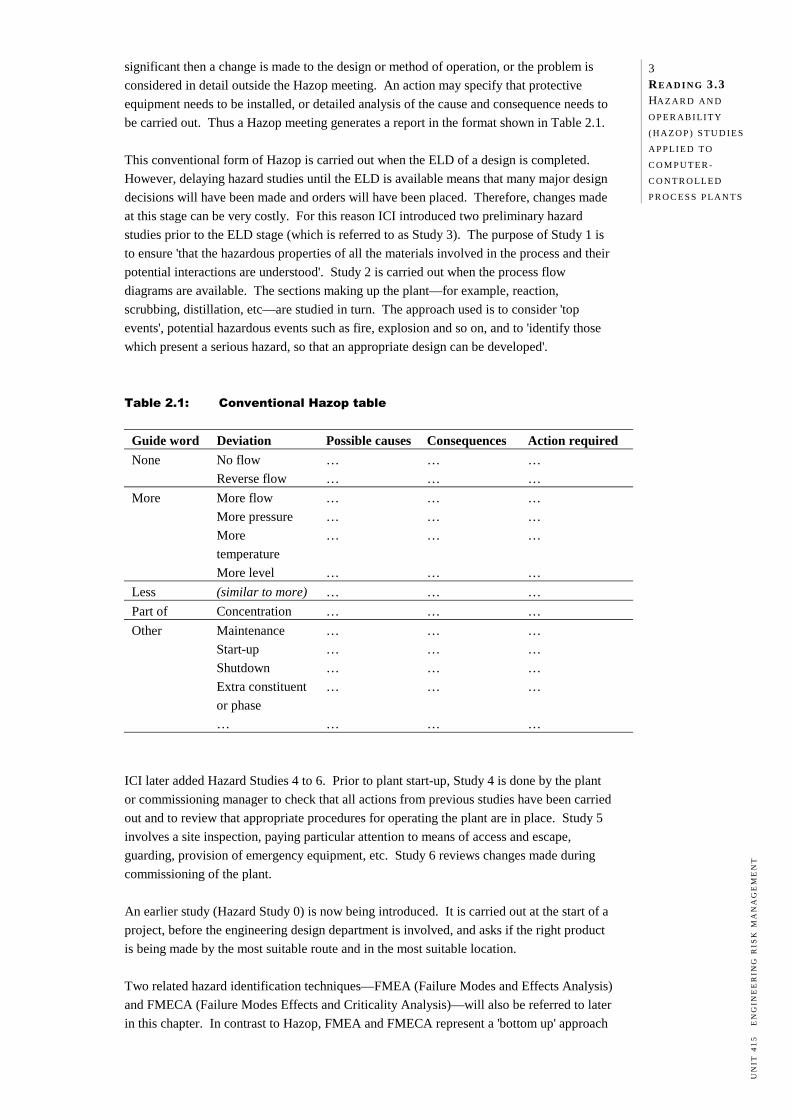
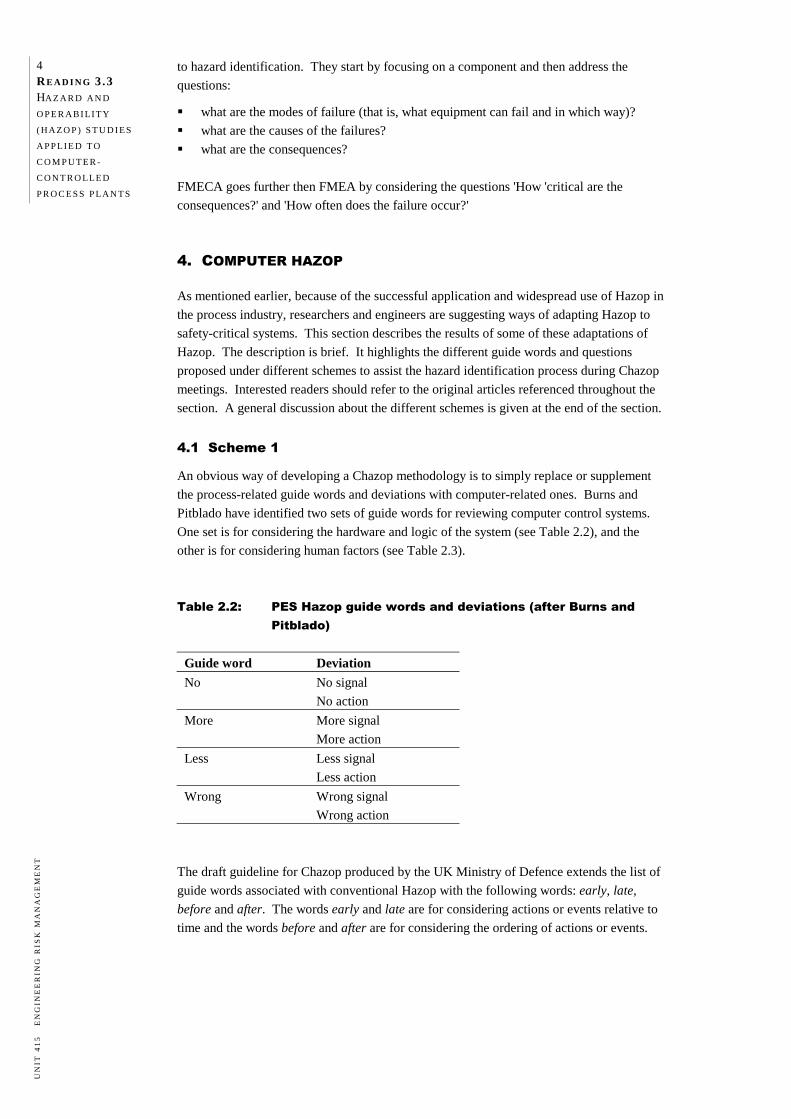
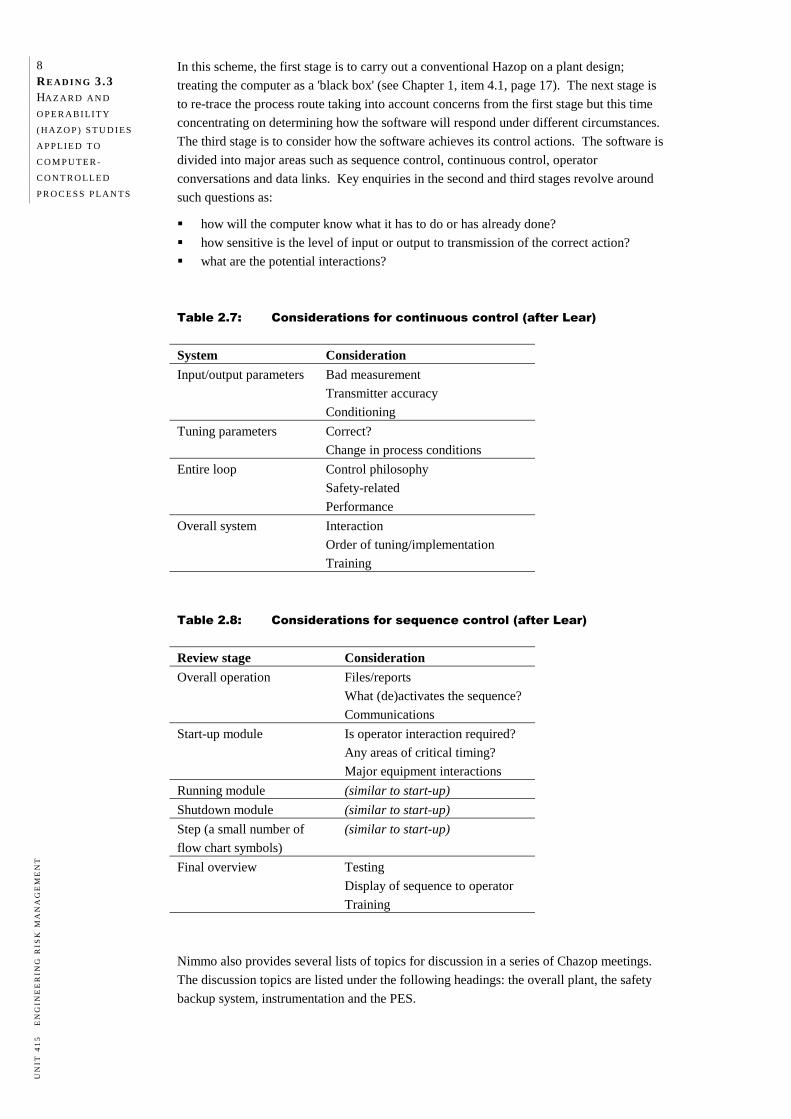
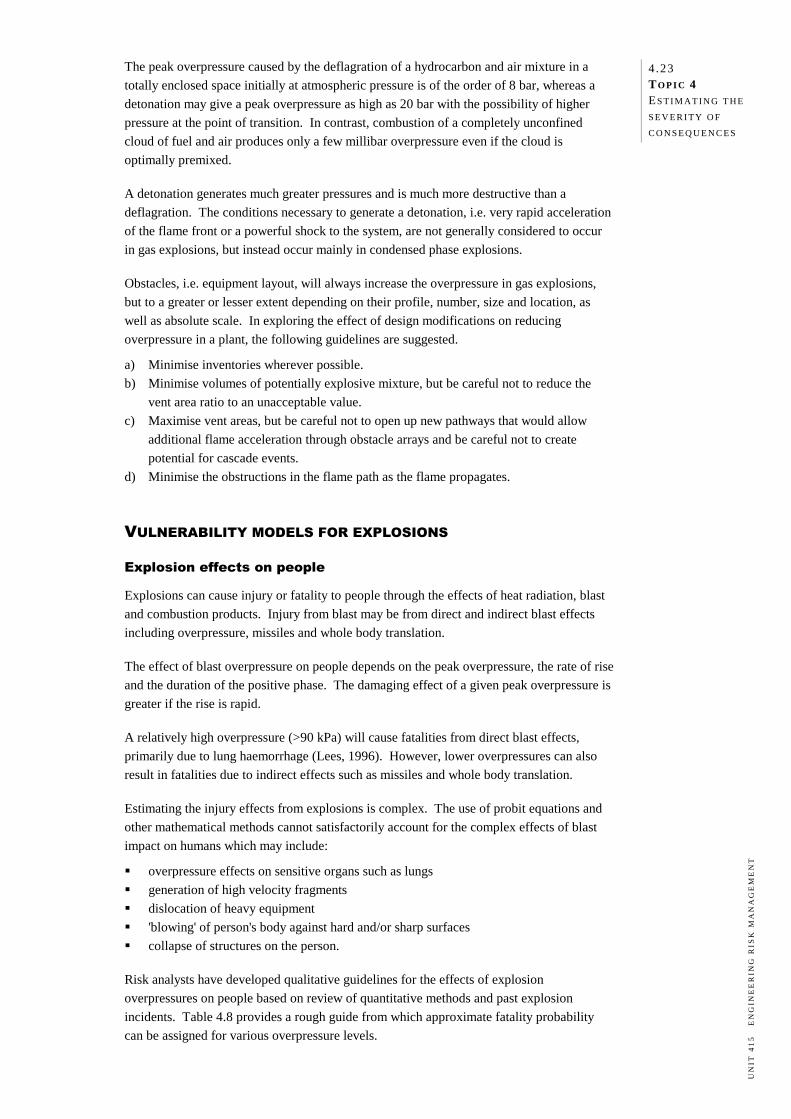
Table 1.1 provides an overview of each of these types of engineering risks. A discussion of
each of these follows. It should be noted that each risk type interlinks and overlaps with
others, and cannot be considered in isolation.
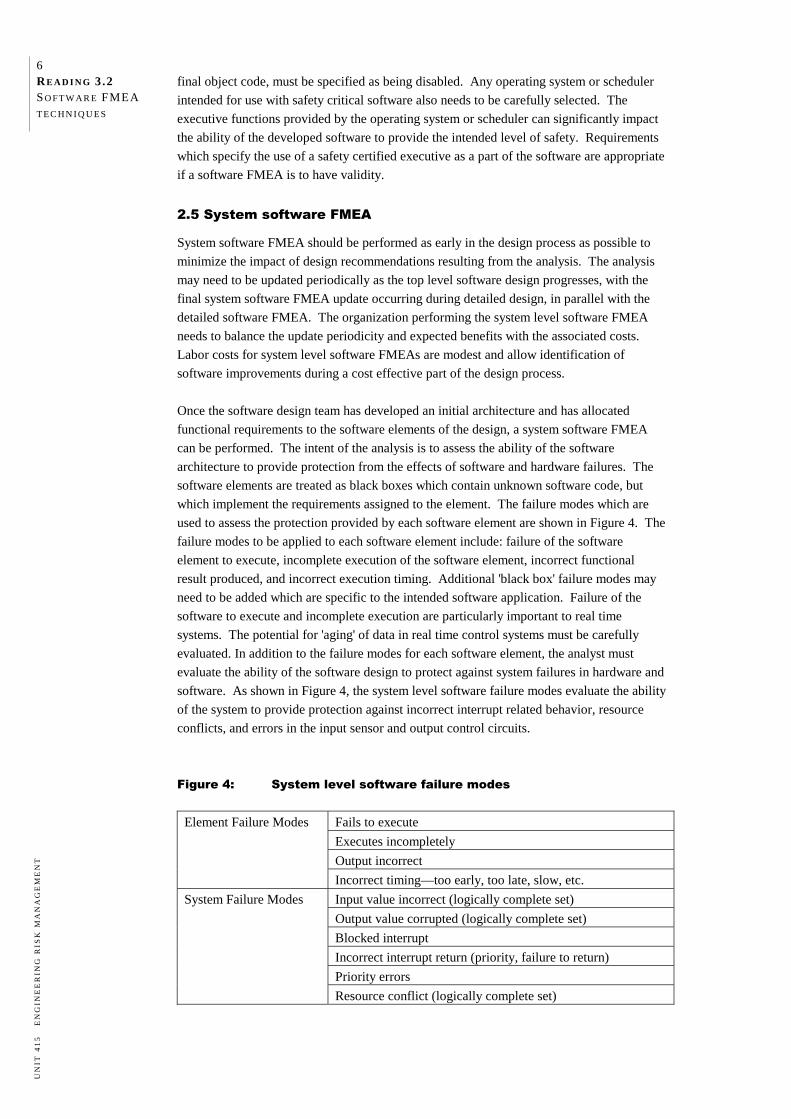
Table 1.1: Overview of engineering risk types
People Assets Environment Liability Business continuity
Failure of equipment Property loss Liability issues Industrial
disputes Sudden loss of
key employees Supplier failure
Budget blowout Completion
time blowout Contract
default by third party Political risk Project
financing problems Project
failure
Overlaps liability risk
Overlaps business continuity risk
Overlaps liability risk
Overlaps people, environment and project risks
Overlaps people, asset and liability risks
Overlaps environment, liability and business continuity risks
1 .6 TO P I C 1 THE C O N C E P T O F
R I S K
UN
IT 4
15
E
NG
INE
ER
ING
RIS
K M
AN
AG
EM
EN
T
PEOPLE RISKS
People risks affect employees, contractors, other persons in the workplace (e.g. visitors) and
members of the public. They arise from unsafe environments, unsafe systems of work and
unsafe equipment and/or materials. People risks are generally described in terms of the
following adverse consequences of exposure to hazards:
the so-called 'near miss' i.e. the null outcome
workplace injury
workplace fatality
occupational illness or disease.
Most exposures to hazards result in a near miss and no damage. For example, a person
tripping over a small object may stumble but not actually fall or sustain an injury.
Injury
When a workplace injury occurs from an exposure to a hazard it is usually described in
terms of the type of injury, the extent of the injury, the part of the body affected and the
level of medical intervention required: for example, a minor facial cut requiring first aid or
a serious leg crush injury requiring medical intervention and amputation. Other terms used
may include lost time injury, temporary disability and permanent disability.
The tangible costs to an organisation from workplace injuries are generally reflected in the
premium paid for worker's compensation insurance. This covers the salary for time lost and
medical treatment as well as rehabilitation and related expenses. Note that it has been
estimated that the true cost of an injury is at least ten times the compensation costs due to
such things as lost production, investigation time, reporting time and training time to train a
replacement employee.
Fatalities
A workplace fatality negatively affects the morale of other employees and generates adverse
publicity for the organisation. If there are multiple fatalities, the ramifications for the
organisation can be devastating.
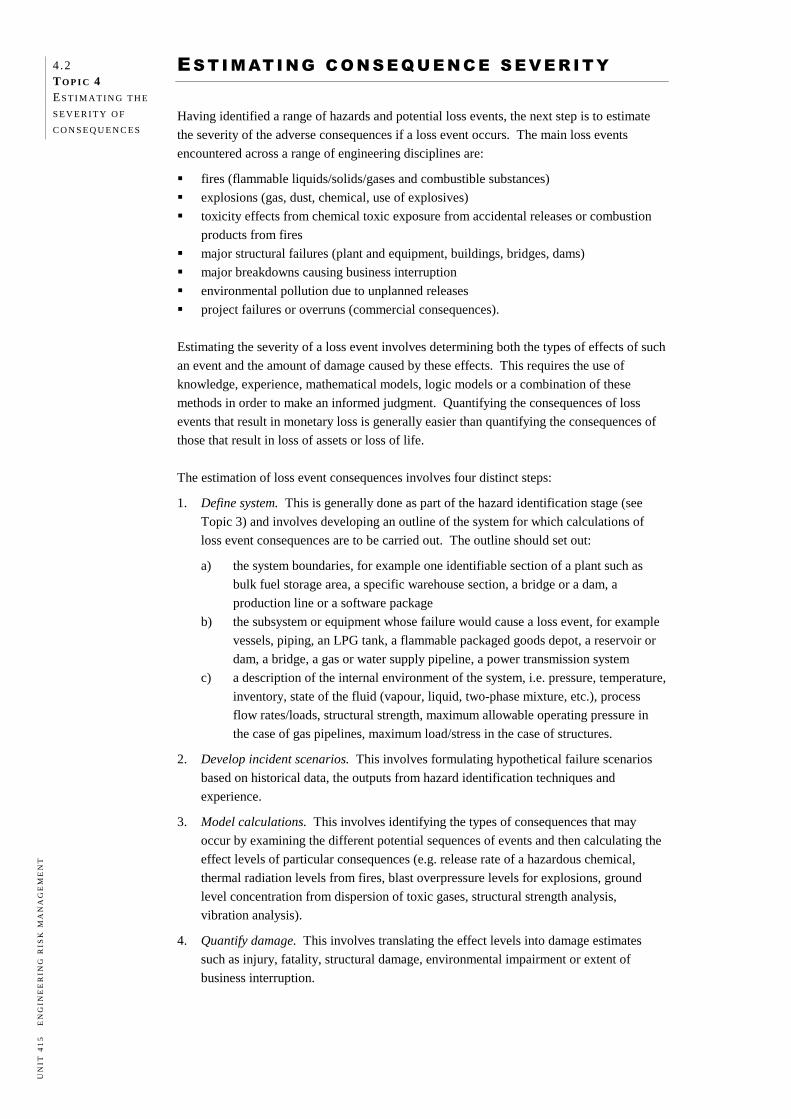
Example 1.1
In 2004 an explosion at BHP Boodarie Iron in Western Australia killed one worker
and seriously burned three others. The regulatory authorities immediately issued
BHP with a notice requiring they demonstrate that they could operate the plant safely
before they would be allowed to restart production. Production never re-started. In
2006 BHP commenced demolition of the $2.6 billion plant.
Illness or disease
Illness or disease can result from a number of hazards:
use of chemicals in the workplace and potential for worker exposure
exposure to substances that cause long-term effects such as lead, silica and asbestos
exposure to excessive noise from rotating machinery or construction equipment which
can result in permanent hearing loss
exposure to blood-borne pathogens or micro-organisms that can cause human infection
such as Legionnaire's disease.
1.7 TO P I C 1 THE C O N C E P T O F
R I S K
UN
IT 4
15
E
NG
INE
ER
ING
RIS
K M
AN
AG
EM
EN
T
In order to determine whether long-term exposure to a substance presents a risk to health,
the actual exposure usually needs to be quantified. Measuring worker exposures is the
domain of the occupational/industrial hygienist.
If an incident impacts on the health and safety of members of the public it can have major
ramifications for the organisation. The reputation of the company can suffer, affecting its
ability to stay in business.
Example 1.2
In 1986, a meltdown in one of the nuclear reactors at Chernobyl in the Ukraine
resulted in high levels of radioactive fallout over a very large area surrounding the
plant. There was an immediate loss of 28 lives due to acute radiation sickness
amongst workers involved in the emergency response. The airborne radioactive
fallout extended to many European countries, contaminating crops, animals and
water supplies. Even reindeer herders in the arctic regions of Scandinavia had their
livelihood threatened by radioactive contamination of lichens on which the animals
graze. Over 4 000 cases of thyroid cancer, mainly in children, have been attributed
to exposure to radioactive iodine following the accident. The plant ceased
operations and there is still an ongoing international effort to make the plant safe for
the future.
Example 1.3 In 2000, there were 101 cases of Legionnaire's disease among individuals who were
at or near the new Melbourne Aquarium between 11 and 25 April, making this
Australia's largest Legionnaire's outbreak. The disease claimed the lives of two
women aged 79 and 83. Two men aged 77 and 83 also died of the disease, but
health authorities could not confirm that their illnesses were associated with a visit to
the aquarium. The outbreak was caused by high levels of legionellae in the
aquarium's cooling towers. The Melbourne Aquarium replaced the water-cooled
air-conditioning system with an air-cooled system after the outbreak.
ASSET RISKS
Most organisations face the risk of loss of assets, although an industry with large sources of
hazardous materials or potentially damaging energy will generally have a higher exposure to
asset risk than an office-based organisation, unless the business of the latter is dealing with
property. Asset losses can be divided into two major sub-categories: direct losses and
indirect losses.
Direct losses
Direct losses of assets mainly take the form of:
damage to buildings or plant
theft and pilferage.
Damage to buildings or plant mainly arises from either industrial accidents such as fires in
warehouses and explosions in industrial plants, or from natural disasters such as storms,
floods and earthquakes. Theft and pilferage mainly arise from a breach of physical security
or a breach of 'intellectual security', i.e. industrial espionage.
For many engineering organisations, direct losses arising from damage to buildings or plant
tend to be greater than direct losses arising from theft and pilferage. However, if a breach
1 .8 TO P I C 1 THE C O N C E P T O F
R I S K
UN
IT 4
15
E
NG
INE
ER
ING
RIS
K M
AN
AG
EM
EN
T
of security results in sabotage or arson, the magnitude of loss could be much higher.
Equally, the cost of breach of intellectual security in an information technology (IT)
company can be very high.
Example 1.4
In 2003 at a BP refinery in Texas City, a series of explosions occurred during the
restarting of a hydrocarbon isomerization unit. Fifteen workers were killed and
about 170 others were injured. The explosions occurred when a distillation tower
flooded with hydrocarbons and was over-pressurised, causing a geyser-like release
from the vent stack.
Indirect losses
Indirect losses generally occur as a secondary effect and can be associated with a
non-property type of risk. The causes of the indirect losses may be internal or external to
the organisation. Indirect losses mainly take the form of:
drop in property value
drop in share price
drop in product value.
A drop in property value may occur for a number of reasons. Rapid changes in technology
can cause an organisation's assets in plant and equipment to become worthless if the
technology is completely superseded.
Example 1.5
In the 1950s and early 1960s, Gestetner of Germany invested significant capital in
the manufacture and distribution of stencil reproduction machines. Manuscript typed
from a typewriter on special stencil papers could be passed through a printing
process to make copies of the typed manuscript. The advent of photocopiers made
this technology obsolete almost immediately.
The value of land purchased for development will drop significantly if it is subsequently
discovered that the soil and possibly the groundwater table underneath has been
contaminated with chemicals during previous use. Land and physical assets can also be
rendered worthless by industrial accidents.
Example 1.6
Following the toxic gas leak from the Union Carbide pesticide manufacturing plant
in Bhopal, India, the plant was forcibly closed. Physical assets such as plant and
equipment had to be written off.
A drop in a company's share price most commonly occurs as a consequence of poor profit
performance, but it may also occur as a consequence of an industrial accident that damages
a company's reputation and results in subsequent legal and financial liabilities.
Example 1.7
Following the chemical accident at Bhopal, the share price of Union Carbide fell on
the New York stock exchange, mainly from speculation on the amount of liability
compensation that the company might have to pay. The share price recovery took
quite a few years.
1.9 TO P I C 1 THE C O N C E P T O F
R I S K
UN
IT 4
15
E
NG
INE
ER
ING
RIS
K M
AN
AG
EM
EN
T
A drop in the market value of an organisation's products can occur for many reasons. For
example:
If an automobile manufacturer or food manufacturer is seen to be regularly issuing
recall notices on defective products, consumer confidence in the company's products
will fall, along with the value of the products.
New products of next generation technology will cause the value of old products to fall.
Increased competition in the marketplace may permanently lower the sales price and
thus the value of products.
Food contamination scares, whether real, imagined or hoax, can lead to a loss of
consumer confidence and hence lost sales.
Example 1.8
The Australian beef industry lost a huge share of its main market when Japanese
consumers turned away from beef due to the emergence of 'mad cow' (Creutzfeldt-
Jakob) disease in a number of Japanese cattle.
ENVIRONMENTAL RISKS
Since the 1980s, organisations such as Greenpeace and Friends of the Earth have been
successful in raising public awareness of environmental risks and have encouraged many
companies to make environmental issues part of the decision-making and risk management
processes. In most developed countries today there are laws to protect the environment
from industrial processes and industrial accidents.
Risks to the environment mainly arise from land and water degradation, loss of habitat, air
pollution, water pollution and soil contamination. The longer-term consequences of these
types of risks present a major challenge for organisations. Unlike loss of assets, which can
be quickly replaced, damage to the environment almost invariably takes a long time to
repair. This means that clean-up, restoration and monitoring costs can be extremely high.
Example 1.9
In 2000, a breach in the tailings dam of a gold mine in Romania, operated by the
Romanian Government and the Esmeralda Company, released some 100 000 m3 of
cyanide-rich tailings waste into the Somes River. The cyanide found its way into the
Danube River, affecting aquatic life in Romania, Hungary and Yugoslavia.
Example 1.10
Leaks from underground storage of tanks for petroleum products and chemicals can
result in soil contamination. In some cases, there has been migration of polluted
rainwater to the groundwater aquifer.
Example 1.11
In 2006 in Indonesia a mishap at an exploratory oil well resulted in sulphurous hot
mud inundating a large area with over one million cubic metres of mud. Over 8 000
people were displaced and there was major disruption to business and commerce.
The Indonesian government declared that the company responsible would have to
pay all costs associated with the environmental and economic damage.
1 .10 TO P I C 1 THE C O N C E P T O F
R I S K
UN
IT 4
15
E
NG
INE
ER
ING
RIS
K M
AN
AG
EM
EN
T
LIABILITY RISKS
Some level of overlap exists between liability risks, people risks and environmental risks.
For example, environmental damage or an injury to a member of the public from an incident
carries a liability for the organisation under statute law (acts and regulations) and/or
common law.
Contract default
In many engineering enterprises, part of or all project work is contracted to external firms.
Whilst the contractor carries a liability risk for contract default on requirements such as
deadlines or quality of deliverables, the organisation also carries a liability risk because
contract default can cause things like increased interest payment on borrowing, depreciation
on non-performing assets, or loss of market share due to delays, all of which may not be
recovered through liability claims alone.
With more and more public and private organisations outsourcing goods and services, the
risk of contract default is becoming a serious issue.
Omissions
Omissions on the part of a goods or services provider carry liability risks. The omission
could be intentional or through negligence. If an organisation designs a bridge, and there
are design faults in the project resulting in a failure of the structure, a whole range of
liabilities arises. These include financial liability in rebuilding to a correct design,
compensation for the injured, and legal costs and possible penalties or damages associated
with criminal and/or negligence charges.
Legal
Legal liability may arise from the following:
common law claims on the company by a third party
industrial accident that requires coronial inquiry or inquest
prosecution by a government agency for breach of Occupational Health and Safety
(OHS) legislation
product defects that threaten the safety of the consumer (for example defective toys that
could affect child safety)
third-party damages arising from a firm's industrial activity; these may arise from
injury, environmental impairment, loss of amenities etc.
The major consequences of legal liability are legal costs, cost of complying with injunctions
and court orders for specific performance, money for settlements, fines and compensatory
damages. Legal costs include not only the cost of legal representation but also the cost of
the time of company staff in assisting legal counsel to prepare the case. The latter usually
far exceeds the former.
Bankruptcy
An organisation's inability to meet its liabilities would place it under receivership, and
ultimately result in bankruptcy. For the purposes of this unit we are not concerned with
bankruptcy arising from an organisation's poor commercial performance, but rather with
bankruptcy arising from the cost of liability risks.
1 .11 TO P I C 1 THE C O N C E P T O F
R I S K
UN
IT 4
15
E
NG
INE
ER
ING
RIS
K M
AN
AG
EM
EN
T
Employee liability
In certain cases employees, as individuals, can be held liable. For example, there have been
a number of instances where managers or supervisors have been prosecuted for breach of
OHS law. Senior managers are increasingly being targeted by law enforcement agencies.
Example 1.12
The Enschede fireworks disaster in 2000 in the Netherlands was caused by a fire. In
the series of explosions that followed, 22 people were killed, 947 were injured and
about 2 000 homes were destroyed. The two managers of the company were later
sentenced to 15 months imprisonment for violation of environmental safety
regulations and dealing in illegal fireworks.
BUSINESS CONTINUITY RISKS
There is considerable overlap between business continuity risk and the other risks
previously discussed, as each of those could bring about an interruption to business.
Business continuity risks include:
Failure of critical equipment. If the facility does not carry the spare parts to carry out
repairs, or if the entire equipment item needs to be replaced, there may be considerable
lead time for delivery/installation.
Property loss caused by fires or explosions. Significant delays are likely to occur
before production can recommence due to investigations, insurance loss adjustment and
claims processing, as well as the lead time for replacing equipment.
Liability issues causing a temporary halt in operations. If a product defect is identified,
production may have to be suspended until the cause is identified and corrected.
Liability issues causing the permanent closure of the business. This is part of the
bankruptcy risk.
Industrial disputes.
In smaller organisations, the sudden loss of a few key employees (e.g. by resignation).
This may seriously upset operations until suitable replacements can be found. In large
organisations this risk is often less severe because staff may be able to be redeployed
from other areas of the organisation.
Failure of a supplier, particularly a sole supplier.
Example 1.13
In 1999, an explosion at the Esso Longford gas plant left the whole of Victoria
without gas for over two weeks as well as killing two workers. Parts of the facility
remained closed for some time due to investigations and the time taken to repair and
replace the plant. It also resulted in major interruptions for restaurants and other
businesses across Victoria. Subsequently, Esso was convicted of breaches of OHS
legislation and fined $2 million. The company also faced a huge class action under
common law by affected businesses which resulted in Esso having to pay damages of
$32.5 million. Loss to industry during the crisis was estimated at $1.3 billion.
Example 1.14
In 1998 after four power cable failures, Mercury Energy Limited, the major
distributor of electrical power to the City of Auckland in New Zealand, announced it
could no longer supply power to the central business district (CBD) of Auckland.
The disruption to supply and consequently to business in the CBD lasted several
months.
1 .12 TO P I C 1 THE C O N C E P T O F
R I S K
UN
IT 4
15
E
NG
INE
ER
ING
RIS
K M
AN
AG
EM
EN
T
PROJECT RISKS
At the outset of a project it is essential to clearly understand and plan for the associated
risks. Some of the risks discussed above would be present as part of overall project risk.
Key project risks include:
Project budget blowout. If the project is in its early stages, this may cause the project
to be abandoned as the projected return on investment may be lowered significantly.
Project completion time blowout. This can result in financial loss due to interest
payment on non-performing capital, and any cost penalties for delivery delays in the
contract.
Contract default by third-party services. While this can be partially covered by liability
clauses in the contract, it would cause a blowout in both the cost and completion time
of the project.
Political risk. External interest groups with political influence may raise environmental
or other concerns that cause delays, expensive design modifications or the
abandonment of a project that is otherwise economically sound.
Project financing problems. If sources of finance collapse or fail to materialise, the
delay or abandonment of the project is inevitable.
Example 1.15
In the late 1980s Associated Pulp and Paper Mill (APPM) planned to build a pulp
plant at Wesley Vale in Tasmania. The Greens political movement generated
significant public controversy over effluent discharges to the ocean, especially
organo-chlorines from a chlorine bleach process, and after lengthy debates the
company abandoned its plan for the paper pulp plant.
Example 1.16
In 1986 Bayer Australia proposed to build an agricultural and veterinary chemicals
formulation facility on the Kurnell Peninsula in Sydney. Local residents expressed
considerable concern about the concentration of chemical, oil and gas facilities on
the peninsula, and the potential for toxic chemicals from the Bayer facility to reach
Botany Bay and threaten the local oyster industry. The environmental controls
subsequently imposed on the company were so severe that it decided the project was
not economically viable and abandoned the Kurnell site for the project.
A C T I V I T Y 1 . 1
List the major activities of your organisation and identify the hazards, potential loss
events and types of risks associated with each activity. Summarise your findings in a
table such as the one shown below.
Activity Hazards Potential loss events Risk types
Retain your list for Activity 2.1 in the next topic.
1 .13 TO P I C 1 THE C O N C E P T O F
R I S K
UN
IT 4
15
E
NG
INE
ER
ING
RIS
K M
AN
AG
EM
EN
T
SUMMA RY
In this topic we discussed the nature of risk and noted three critical points:
risk is associated with some form of 'loss'
risk involves two different dimensions—severity and likelihood
risk is often subjective.
We then discussed the difference between a hazard (a source of potential harm) and a risk
(the chance of something happening that will have an impact upon objectives). We
concluded the topic with an examination of the most common types of risks that can affect
engineering organisations, including some real life examples. EX E RC I S E S
1.1 Hazard, loss event and risk identification
Identify the hazards, potential loss events and types of risks arising from the following
activities. State any assumptions you make.
a) Storage of chlorine gas for public swimming pool disinfection.
b) Delivery of LP gas from bulk tanker to suburban automotive retail outlet.
c) Handling heavy items by crane for construction of a high-rise building.
d) Movement of large oil tankers carrying crude oil supply to a marine terminal.
e) Outsourcing equipment testing and maintenance.
f) Operating a suburban bus transport company.
g) Development of a cross-country high-pressure natural gas pipeline.
h) Provision of catering services to an airline.
i) Project management of bridge construction to a specified load bearing capacity.
j) Transportation of petrol using a bulk road tanker with a leaking valve.
k) Road transport of explosives from armament factory to army magazines.
l) Project management for the construction of an Olympic Aquatic Centre.
m) Development of combat software for computer control in a warship.
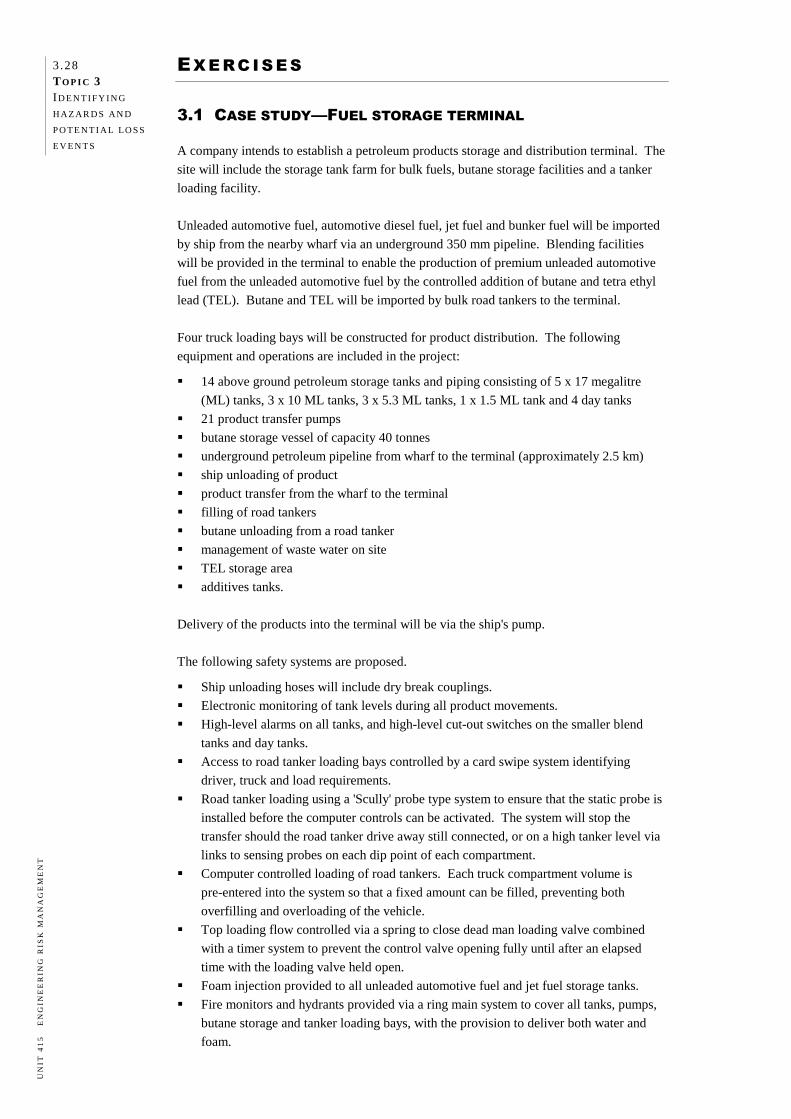
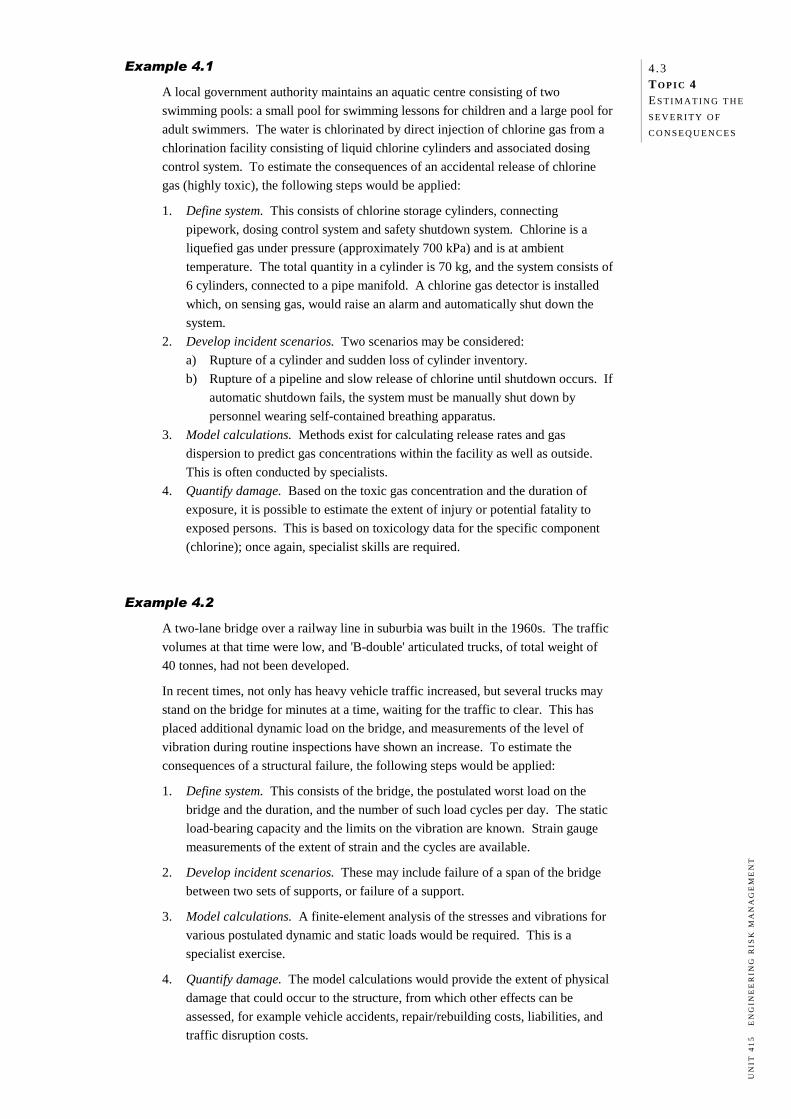
1.2 Case study—Tanker spill
A bulk road tanker carrying petrol was travelling along a road that had been partly closed
for road works. Due to inadequate lighting, sign posting and safeguarding, the driver of the
road tanker did not initially notice the road closure. This caused him to manoeuvre too
quickly and his truck overturned, rupturing the tank. The spilled petrol contaminated the
soil around the roadway. The soil was porous and some of the contaminants leached into groundwater used as the
sole source of drinking water for the surrounding community. As a result, the local
residents could not use the groundwater and feared adverse health effects, loss of amenities
and drop in property values. The tanker was owned and operated by separate businesses with separate insurers. There
were delays in sorting out who was to manage and pay for the clean-up costs.
a) Identify all the parties involved in this case.
b) Categorise the types of risks faced by each of the parties using the risk types described
in this topic (people, asset, environment, liability, business interruption and project).
c) Describe the adverse consequences to each party from each type of risk.
1 .14 TO P I C 1 THE C O N C E P T O F
R I S K
UN
IT 4
15
E
NG
INE
ER
ING
RIS
K M
AN
AG
EM
EN
T
RE F E R E N C E S A N D F U RT H E R R E A D I N G
Bahr, Nicholas J. (1997) System Safety Engineering and Risk Assessment: A Practical
Approach, Taylor & Francis, Washington D.C.
Bernstein, Peter L. (1996) Against the Gods: The Remarkable Story of Risk, John Wiley &
Sons, New York.
Chapman, Chris & Ward, Stephen (2003) Project Risk Management: Processes,
Techniques and Insights, John Wiley & Sons, Chichester.
Gigerenzer, Gerd (2003) Reckoning with Risk: Learning to Live with Uncertainty, Penguin
Press, London.
Perrow, Charles (1999) Normal Accidents: Living with High Risk Technologies, Princeton
University Press, Princeton, New Jersey.
Smith, David J. & Simpson, Kenneth G.L. (2001) Functional Safety. A Straightforward
Guide to IEC 61508 and Related Guidance, Butterworth-Heinemann, Oxford.
Standards Australia (1998) AS/NZS 3931:1998 Risk Analysis of Technological Systems—
Application Guide, Standards Australia/Standards New Zealand, Sydney.
Standards Australia (2004) AS/NZS 4360:2004 Risk Management, Standards Australia/
Standards New Zealand, Sydney.
Standards Australia (2004) HB 436:2004 Risk Management Guidelines: Companion to
AS/NZS 4360:2004, Standards Australia/Standards New Zealand, Sydney.
Storey, Neil (1996) Safety-Critical Computer Systems, Addison-Wesley, Reading,
Massachusetts.
SU G G E S T E D A N S W E R S
EXERCISES
1.1 Hazard, loss event and risk identification
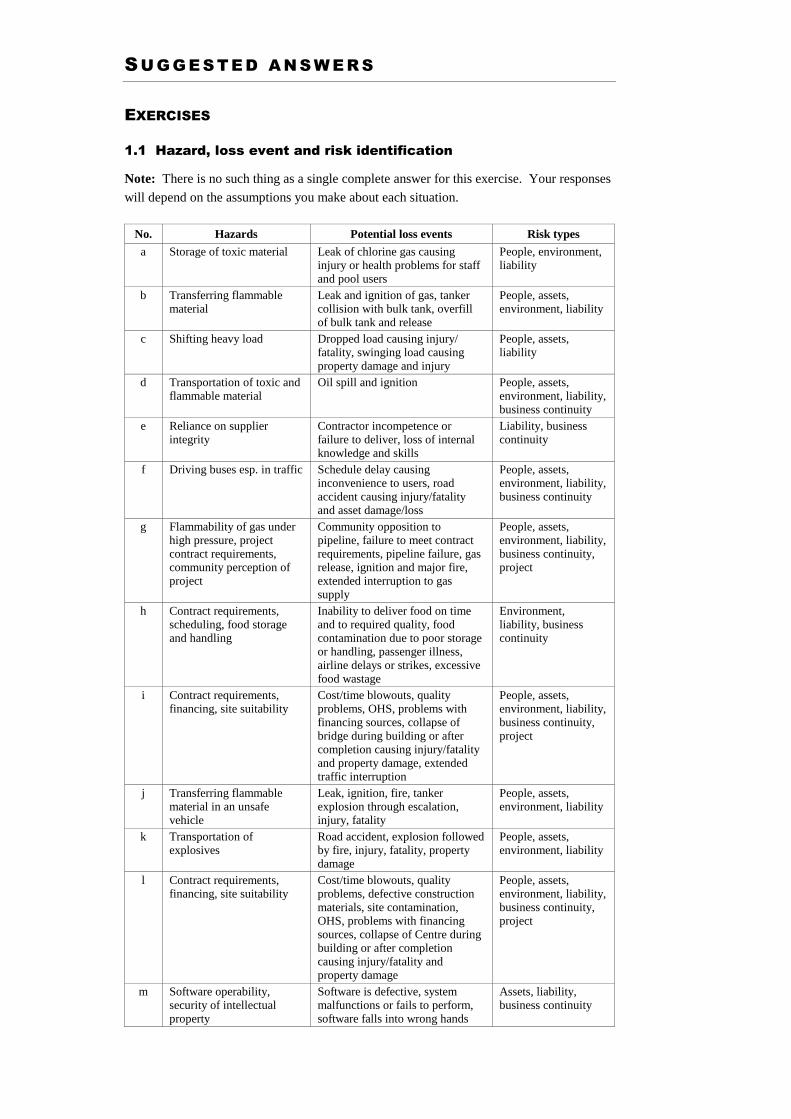
Note: There is no such thing as a single complete answer for this exercise. Your responses
will depend on the assumptions you make about each situation.
No. Hazards Potential loss events Risk types
a Storage of toxic material Leak of chlorine gas causing injury or health problems for staff and pool users
People, environment, liability
b Transferring flammable material
Leak and ignition of gas, tanker collision with bulk tank, overfill of bulk tank and release
People, assets, environment, liability
c Shifting heavy load Dropped load causing injury/ fatality, swinging load causing property damage and injury
People, assets, liability
d Transportation of toxic and flammable material
Oil spill and ignition People, assets, environment, liability, business continuity
e Reliance on supplier integrity
Contractor incompetence or failure to deliver, loss of internal knowledge and skills
Liability, business continuity
f Driving buses esp. in traffic Schedule delay causing inconvenience to users, road accident causing injury/fatality and asset damage/loss
People, assets, environment, liability, business continuity
g Flammability of gas under high pressure, project contract requirements, community perception of project
Community opposition to pipeline, failure to meet contract requirements, pipeline failure, gas release, ignition and major fire, extended interruption to gas supply
People, assets, environment, liability, business continuity, project
h Contract requirements, scheduling, food storage and handling
Inability to deliver food on time and to required quality, food contamination due to poor storage or handling, passenger illness, airline delays or strikes, excessive food wastage
Environment, liability, business continuity
i Contract requirements, financing, site suitability
Cost/time blowouts, quality problems, OHS, problems with financing sources, collapse of bridge during building or after completion causing injury/fatality and property damage, extended traffic interruption
People, assets, environment, liability, business continuity, project
j Transferring flammable material in an unsafe vehicle
Leak, ignition, fire, tanker explosion through escalation, injury, fatality
People, assets, environment, liability
k Transportation of explosives
Road accident, explosion followed by fire, injury, fatality, property damage
People, assets, environment, liability
l Contract requirements, financing, site suitability
Cost/time blowouts, quality problems, defective construction materials, site contamination, OHS, problems with financing sources, collapse of Centre during building or after completion causing injury/fatality and property damage
People, assets, environment, liability, business continuity, project
m Software operability, security of intellectual property
Software is defective, system malfunctions or fails to perform, software falls into wrong hands
Assets, liability, business continuity
1 .2 TO P I C 1 SU G G E S T E D
AN S W E R S
UN
IT 4
15
E
NG
INE
ER
ING
RIS
K M
AN
AG
EM
EN
T
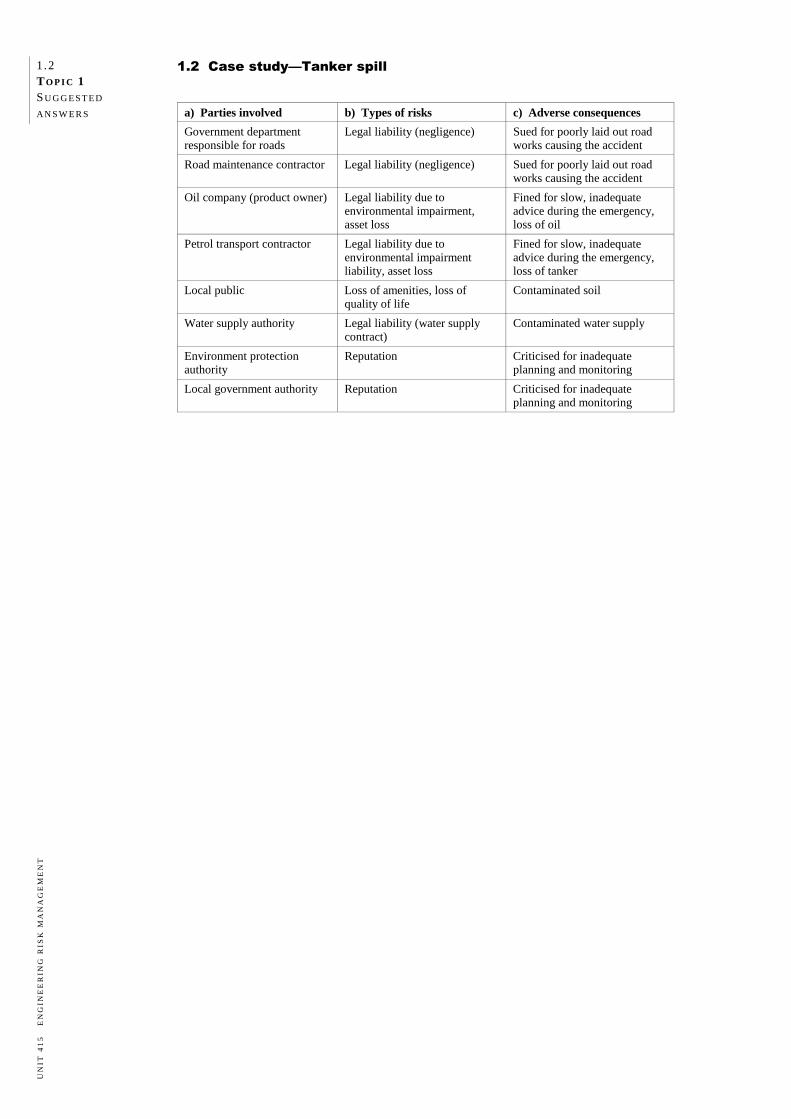
1.2 Case study—Tanker spill
a) Parties involved b) Types of risks c) Adverse consequences
Government department responsible for roads
Legal liability (negligence) Sued for poorly laid out road works causing the accident
Road maintenance contractor Legal liability (negligence) Sued for poorly laid out road works causing the accident
Oil company (product owner) Legal liability due to environmental impairment, asset loss
Fined for slow, inadequate advice during the emergency, loss of oil
Petrol transport contractor Legal liability due to environmental impairment liability, asset loss
Fined for slow, inadequate advice during the emergency, loss of tanker
Local public Loss of amenities, loss of quality of life
Contaminated soil
Water supply authority Legal liability (water supply contract)
Contaminated water supply
Environment protection authority
Reputation Criticised for inadequate planning and monitoring
Local government authority Reputation Criticised for inadequate planning and monitoring
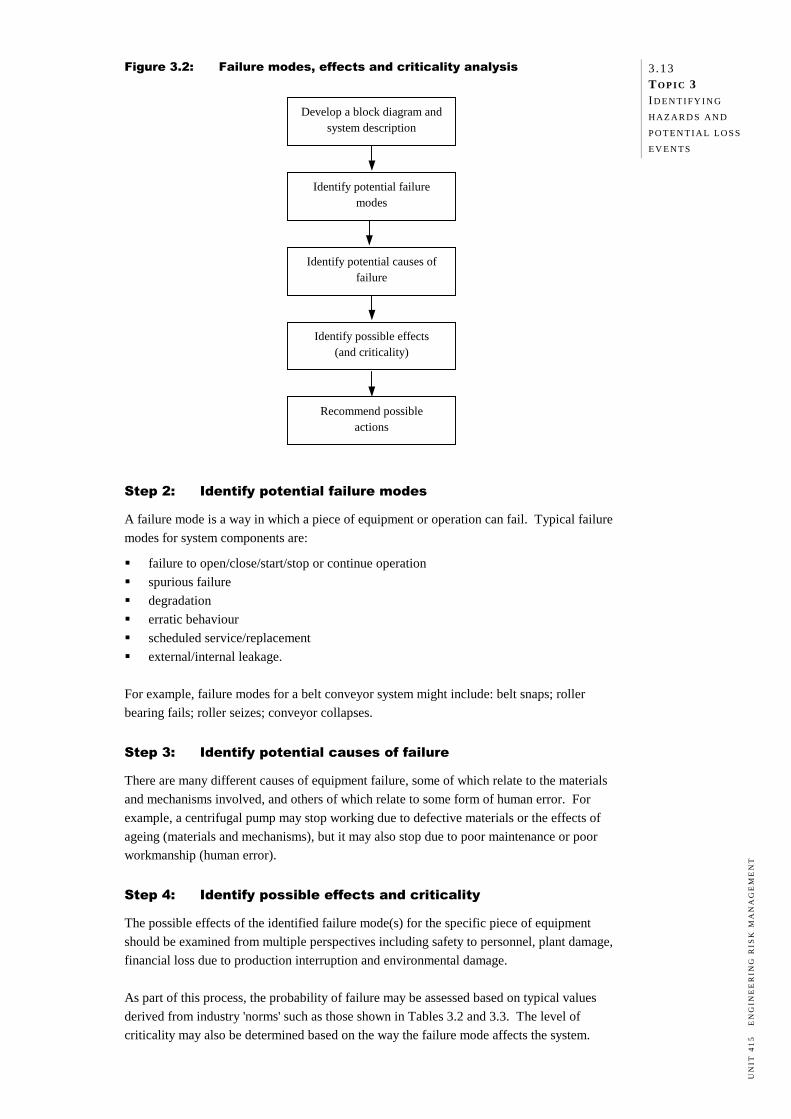
TO P I C 2
RISK MANAGEMENT OVERVIEW
Preview 2.1 Introduction 2.1 Objectives 2.1 Required reading 2.1 Approaches to managing risk 2.1 One-dimensional severity control approach 2.2 Two-dimensional severity and likelihood control approach 2.2 Three-dimensional severity, likelihood and cost control approach 2.2 Reasons for managing risk 2.3 Legislative and regulatory requirements 2.3 Common law duty of care 2.5 Commercial reasons 2.6 Evaluating alternative options 2.6 Risk management framework 2.7 Other risk management models 2.10 Risk acceptability 2.11 The ALARP principle 2.11 Rational and emotive issues in risk management 2.12 Summary 2.13 Exercise 2.13 References and further reading 2.15 Readings Suggested answers
2.1 TO P I C 2 RI S K
M AN AG E M E N T
O V E R V I E W
UN
IT 4
15
E
NG
INE
ER
ING
RIS
K M
AN
AG
EM
EN
T
PR E V I E W
INTRODUCTION
In the previous topic we distinguished between 'hazard' and 'risk' and provided definitions
of both appropriate to specific situations. We now move on to providing an overview of the
general framework in which risk management takes place. We will begin with a discussion
of different approaches to risk management and the reasons why organisations are
increasingly employing a proactive systems approach. We will then examine a framework
for risk management before concluding the topic with a brief discussion of risk acceptability
principles and issues.
OBJECTIVES
After studying this topic you should be able to:
discuss different approaches to managing risk
outline the legal and commercial reasons that organisations use a systematic approach
to managing risk
outline the steps involved in a typical risk management framework
explain the ALARP principle
develop an awareness of the significance and validity of different perceptions of risk
acceptability.
REQUIRED READING
Reading 2.1 'Reducing risks, protecting people'
Reading 2.2 'On the ALARP approach to risk management'
Reading 2.3 'Getting to maybe: some communications aspects of siting hazardous
waste facilities'
AP P ROAC H E S TO M A NAG I N G R I S K
Traditionally, a reactive approach was used to manage risk. For each loss event that
occurred, management reacted by developing countermeasures to prevent a recurrence. The
action was after the event. No attempt was made to systematically identify hazards and
estimate the risks associated with them before an event.
Over time, business and community attitudes have changed and the reactive approach has
ceased to be acceptable. Most large organisations have had to change their approach in
order to survive. However the reactive approach is still not uncommon in small business.
The traditional approach has been replaced by the proactive systems approach which is
undertaken before any loss event has occurred. The objective is to prevent the occurrence
of unwanted events by all reasonably practicable means.
2 .2 TO P I C 2 RI S K
M AN AG E M E N T
O V E R V I E W
UN
IT 4
15
E
NG
INE
ER
ING
RIS
K M
AN
AG
EM
EN
T
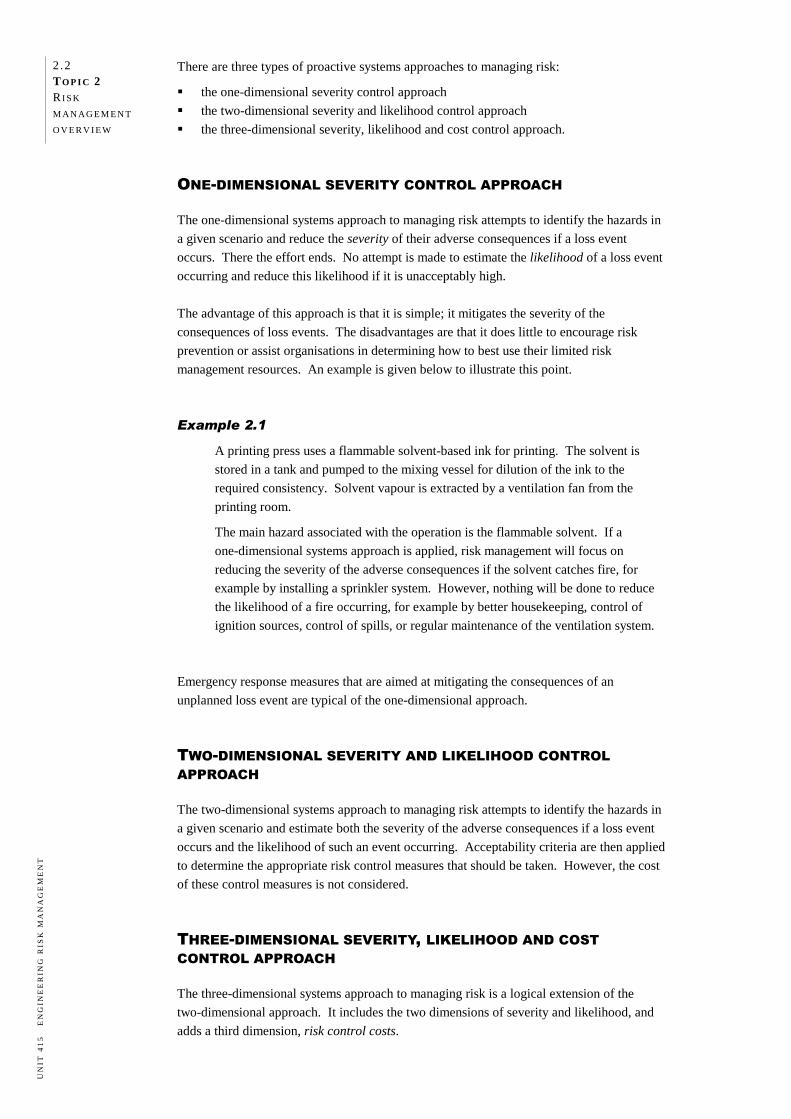
There are three types of proactive systems approaches to managing risk:
the one-dimensional severity control approach
the two-dimensional severity and likelihood control approach
the three-dimensional severity, likelihood and cost control approach.
ONE-DIMENSIONAL SEVERITY CONTROL APPROACH
The one-dimensional systems approach to managing risk attempts to identify the hazards in
a given scenario and reduce the severity of their adverse consequences if a loss event
occurs. There the effort ends. No attempt is made to estimate the likelihood of a loss event
occurring and reduce this likelihood if it is unacceptably high.
The advantage of this approach is that it is simple; it mitigates the severity of the
consequences of loss events. The disadvantages are that it does little to encourage risk
prevention or assist organisations in determining how to best use their limited risk
management resources. An example is given below to illustrate this point.
Example 2.1
A printing press uses a flammable solvent-based ink for printing. The solvent is
stored in a tank and pumped to the mixing vessel for dilution of the ink to the
required consistency. Solvent vapour is extracted by a ventilation fan from the
printing room.
The main hazard associated with the operation is the flammable solvent. If a
one-dimensional systems approach is applied, risk management will focus on
reducing the severity of the adverse consequences if the solvent catches fire, for
example by installing a sprinkler system. However, nothing will be done to reduce
the likelihood of a fire occurring, for example by better housekeeping, control of
ignition sources, control of spills, or regular maintenance of the ventilation system.
Emergency response measures that are aimed at mitigating the consequences of an
unplanned loss event are typical of the one-dimensional approach.
TWO-DIMENSIONAL SEVERITY AND LIKELIHOOD CONTROL APPROACH
The two-dimensional systems approach to managing risk attempts to identify the hazards in
a given scenario and estimate both the severity of the adverse consequences if a loss event
occurs and the likelihood of such an event occurring. Acceptability criteria are then applied
to determine the appropriate risk control measures that should be taken. However, the cost
of these control measures is not considered.
THREE-DIMENSIONAL SEVERITY, LIKELIHOOD AND COST CONTROL APPROACH
The three-dimensional systems approach to managing risk is a logical extension of the
two-dimensional approach. It includes the two dimensions of severity and likelihood, and
adds a third dimension, risk control costs.
2.3 TO P I C 2 RI S K
M AN AG E M E N T
O V E R V I E W
UN
IT 4
15
E
NG
INE
ER
ING
RIS
K M
AN
AG
EM
EN
T
All risk control measures involve a cost penalty, but the return on this investment is
loss-free operation of the business. However, a curve of risk versus cost of risk control
would be asymptotic, meaning that beyond a certain point there are diminishing returns as
expenditure increases.
The three-dimensional approach to managing risks involves conducting a cost-benefit
analysis of different control measures for a given risk and selecting the optimum option
based on the best return for the 'risk' dollar. This enables organisations to use their risk
dollars to control the maximum number of risks to the best effect rather than needlessly
using them to control only one or two risks. This is an important element of risk
management decision-making and will be discussed further in Topic 6.
RE A S O N S F O R M A NAG I N G R I S K
In the previous section we discussed how organisations have moved to a systems approach
to managing risk in order to survive in a changing world. Let's now examine some of the
reasons why this shift has occurred.
LEGISLATIVE AND REGULATORY REQUIREMENTS
In all industrialised countries and most developing countries there is some form of
legislation that governs various aspects of risks from industrial operations and requires
organisations to protect the health and safety of employees, the public and the environment.
Failure to comply with such legislation can lead to the prosecution of the company and, in
some cases, its directors and employees.
In Australia, legislative and regulatory requirements vary from State to State and may be
broadly divided into three groups.
Group 1: Protection of people in workplaces
Occupational health and safety Acts and Regulations
Exposure levels for airborne contaminants in the workplace
Risk management of major hazard facilities
Storage and handling of dangerous goods and hazardous substances
Fire protection and building regulations
Acts and Regulations regarding electrical safety, gas safety and radiation safety.
Group 2: Protection of the public and public health
Planning/zoning regulations
Design codes and standards
Siting of hazardous industries in relation to land use safety
'Safety case' requirements for major hazard facility operators addressing public safety
issues
Health risk regulations for contaminated land and contaminants in surface/groundwater
Drinking water quality standards
Surface water quality standards
Regulations covering cooling towers, public amusement equipment and fireworks.
2 .4 TO P I C 2 RI S K
M AN AG E M E N T
O V E R V I E W
UN
IT 4
15
E
NG
INE
ER
ING
RIS
K M
AN
AG
EM
EN
T
Group 3: Protection of the environment
Air, water and noise control regulations
Environmentally hazardous chemicals control
Contaminated land management
Waste generation and disposal
Various other pollution control regulations.
The number of regulations is vast and it is beyond the scope of this unit to provide specific
references for every country or state. Some of the more important examples are given
below and selected websites are provided at the end of the topic.
In Australia, the National Occupational Health and Safety Commission has published a
National Standard and Code of Practice for the Control of Major Hazard Facilities
(NOHSC Australia, 1996), but it is not mandatory. Many jurisdictions have adopted, or are
in the process of adopting, safety case legislation for major hazards and specific areas such
as gas, rail and offshore petroleum.
The European Commission has developed legislation for the EU Community that includes
the environment, consumer and health protection. Member countries have developed
regulations to address these issues. The main framework for control of major hazards is the
Seveso II Directive [96/082/EC] December 1996.
In the United Kingdom, major hazards are controlled by the COMAH (Control of Major
Accident Hazards) Regulations (1999) administered by the UK Health and Safety
Executive. This is in response to the Seveso II Directive of the EC. The Health and Safety
at Work Act and its associated Statutory Instruments cover a very wide range of activities.
Major hazard regulations require facility operators to identify the hazards posed by their
facility, the potential effects of these hazards, both on-site and off-site, including the
severity and likely duration, and the control measures the operator has in place to prevent
major incidents and limit their consequence to persons and environment. They also require
operators to prepare on-site emergency plans and to collaborate with the local authorities in
the preparation of off-site emergency plans.
In the USA, there is no federal equivalent of the COMAH Regulations in the UK and the
control of major hazard facilities is dealt with by individual state regulations. The
Occupational Safety and Health Act of 1970 (with amendments), and associated regulations
and standards govern health and safety at work, and are administered by the Occupational
Safety and Health Administration (OSHA). Public health and land uses are protected by a
set of environmental acts and regulations administered by the US Environment Protection
Agency (US EPA), of which the following are relevant:
Emergency Planning and Community Right-to-know Act
Toxic Substances Control Act
Resource Conservation and Recovery Act (Hazardous Waste Regulation).
A C T I V I T Y 2 . 1
Using the list of organisational activities that you prepared in Activity 1.1, list the
safety and environmental acts and regulations applicable to your organisation's
operations. Focus on the specific site you are involved in, or if you work at
corporate level, choose one of the operating sites. Wherever possible, identify the
specific legislation applicable.
2.5 TO P I C 2 RI S K
M AN AG E M E N T
O V E R V I E W
UN
IT 4
15
E
NG
INE
ER
ING
RIS
K M
AN
AG
EM
EN
T
Set up this list as a file to which you can add information as you proceed through this
unit, and check your list with relevant staff in your organisation (e.g. legal staff,
safety staff, colleagues). Producing a complete and accurate list is a difficult task (as
is keeping it up-to-date), but one well worth starting, even if you are not able to
complete it on your own.
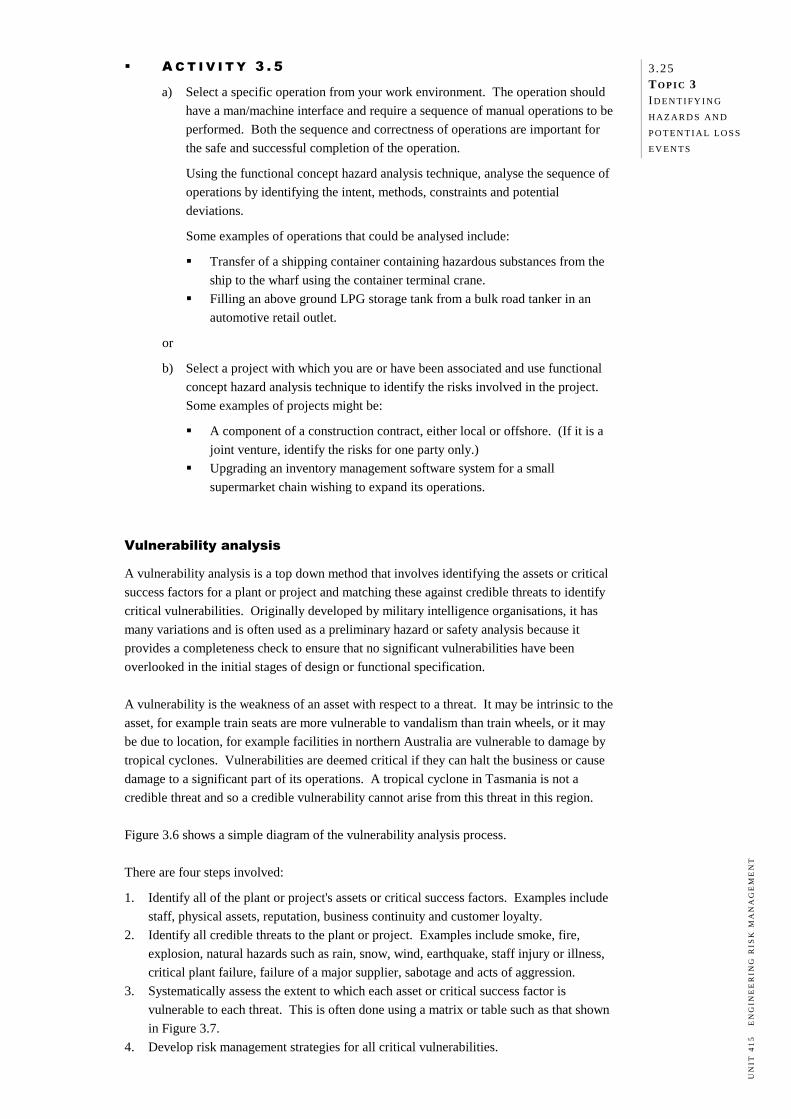
COMMON LAW DUTY OF CARE
In those countries with an English common law heritage (especially the UK, US, Canada
and Australia), in addition to complying with legislation there is an all-embracing common
law 'duty of care'. Common law actions arise when one party who has suffered harm sues
another party whom they believe caused the harm in order to recover damages. In the event
of an accidental event, an organisation must be able to demonstrate that all reasonable care
has been taken in identifying the hazards and risks associated with the facility and its
operations, and that, on the balance of probability, adequate hazard control measures have
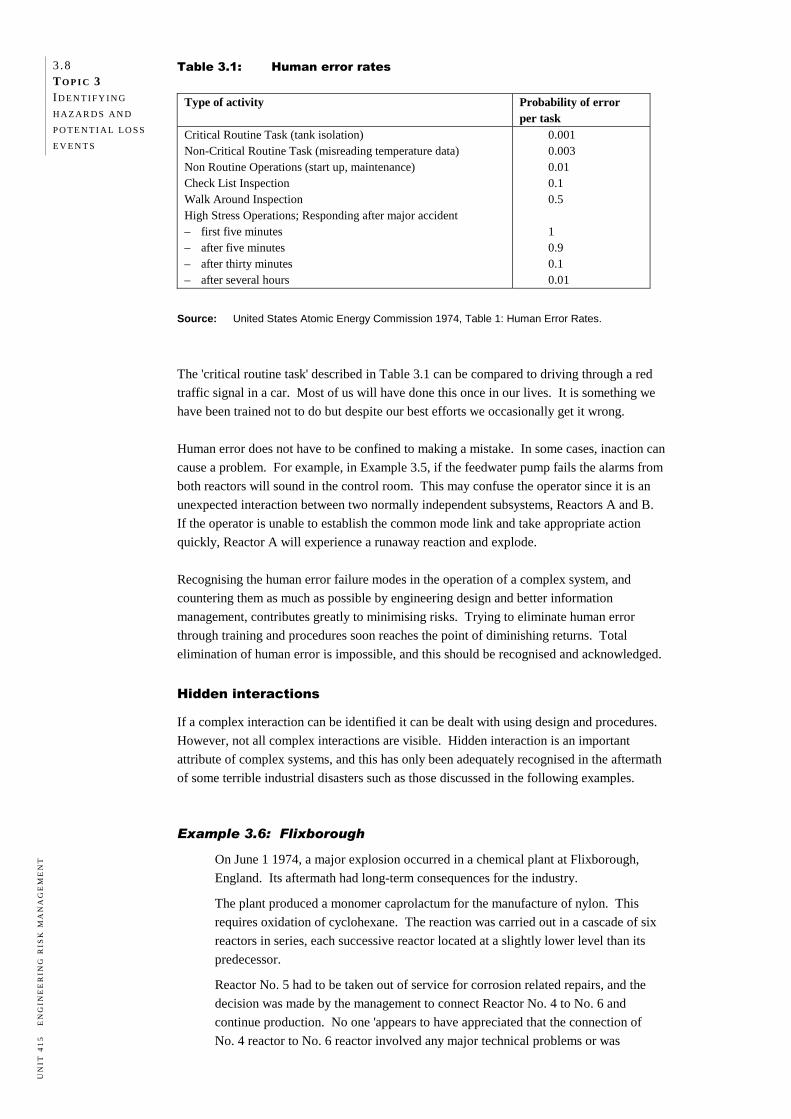
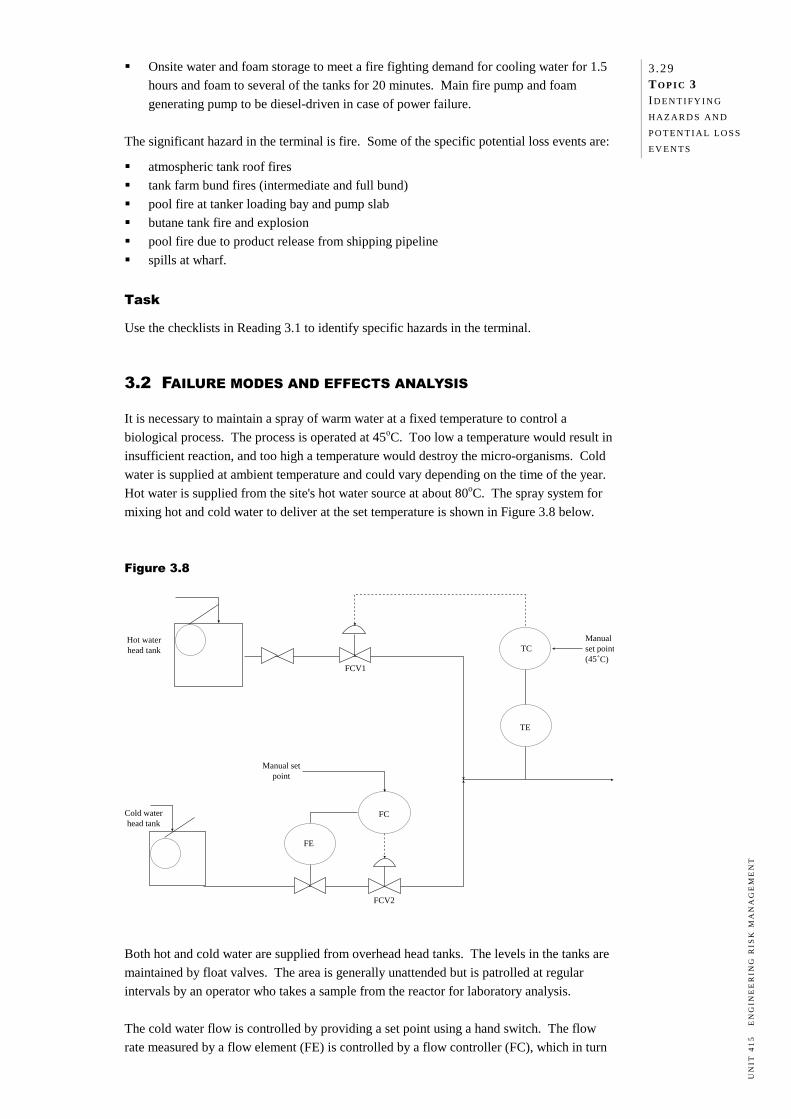
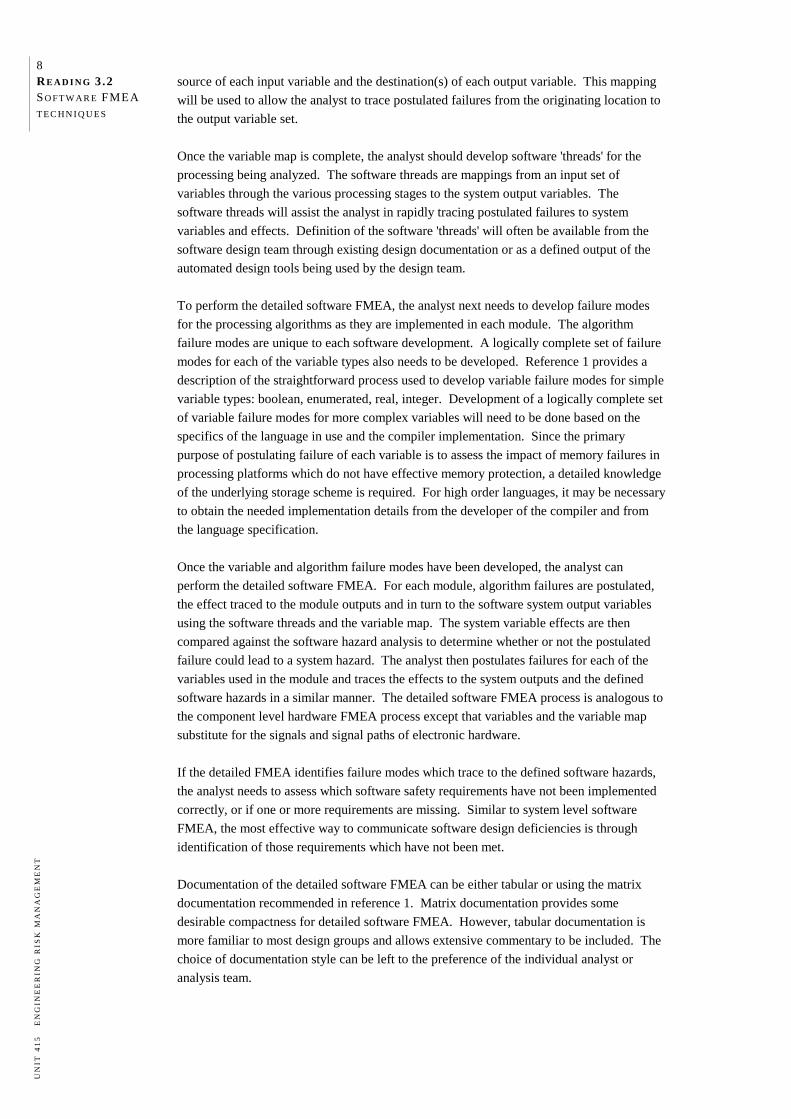
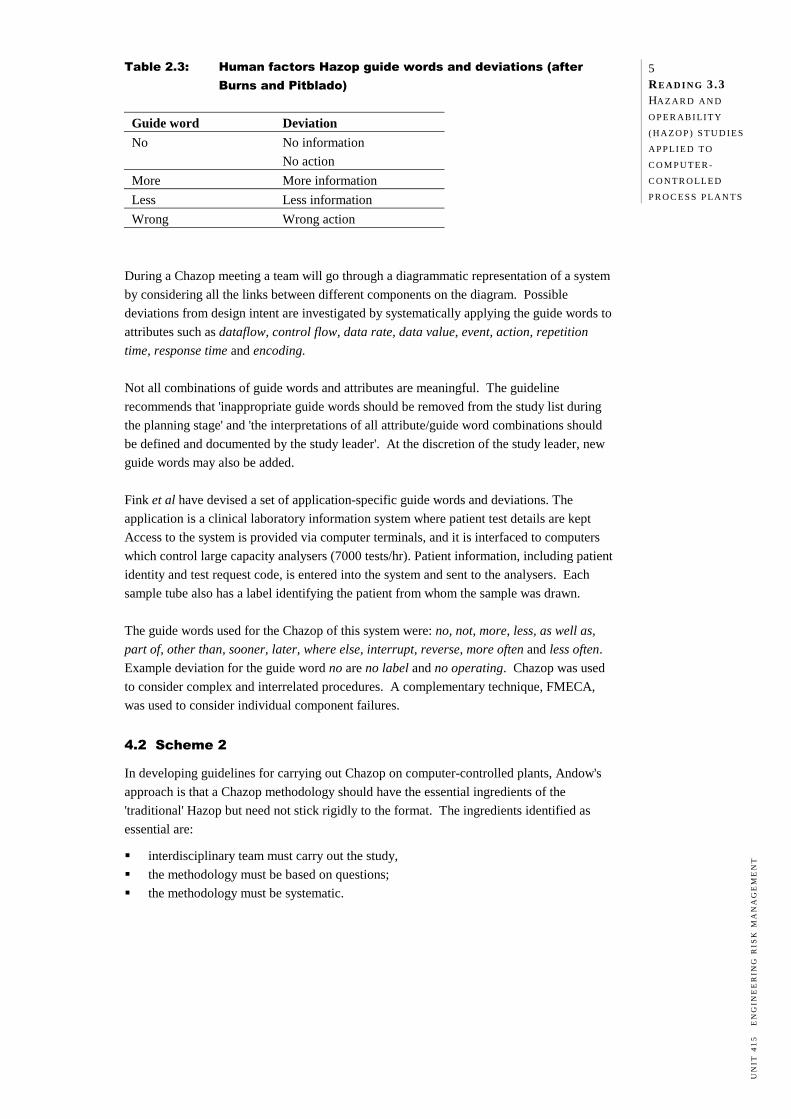
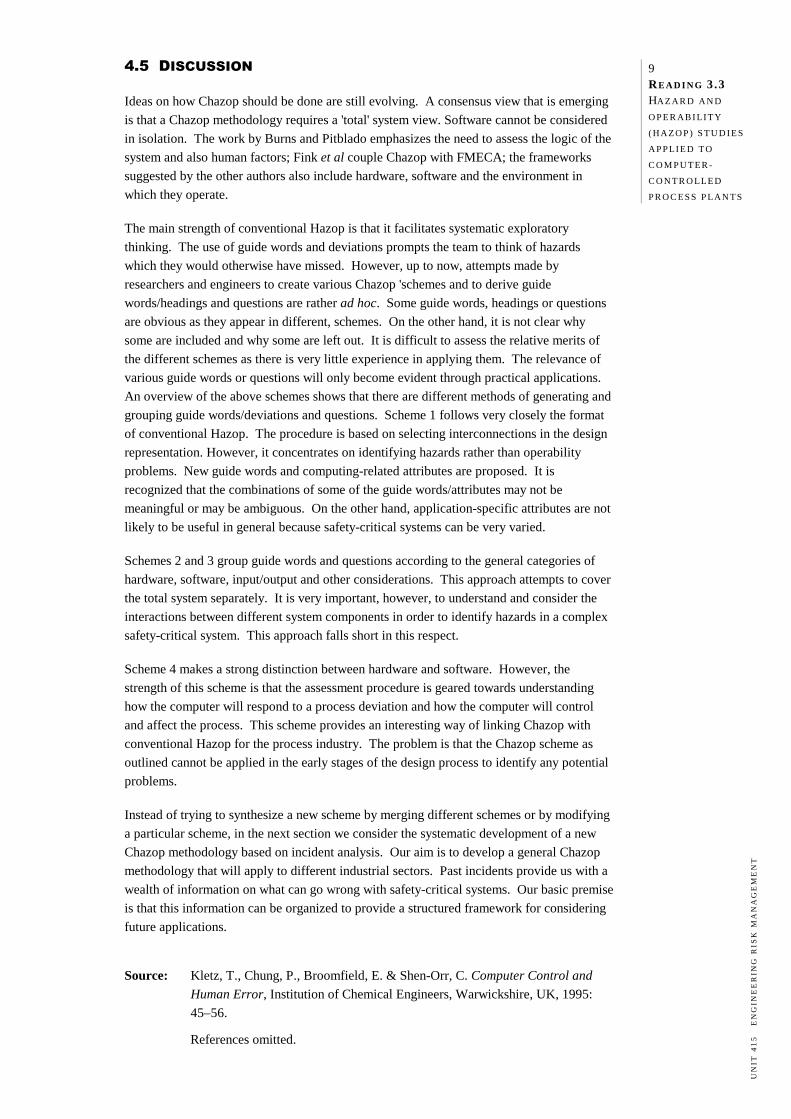
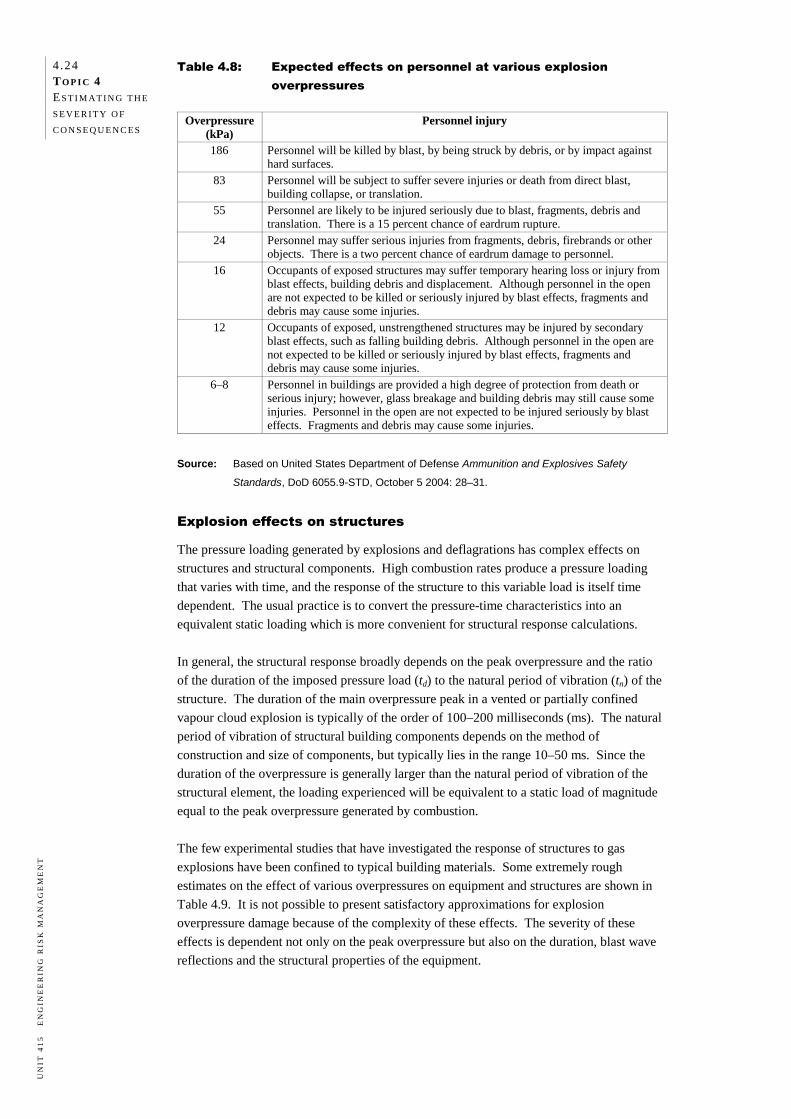
been put in place. This principle is illustrated in Figure 2.1.
Figure 2.1: How would a reasonable defendant or utility respond to the foreseeable risk?
Source: Sappideen & Stillman, 1995: 22.
Where the duty of care has not been visibly demonstrated, a company may be found
negligent, and therefore liable for damages, should an incident occur from its commercial
activities resulting in serious harm to people, property, business or the environment.
The overall situation is perhaps best summarised by Chief Justice Gibbs of the High Court
of Australia:
Where it is possible to guard against a foreseeable risk which, though perhaps not great, nevertheless cannot be called remote or fanciful, by adopting a means which involves little difficulty or expense, the failure to adopt such means will in general be negligent.
Turner v. The State of South Australia (1982) (High Court of Australia before Gibbs CJ, Murphy, Brennan, Deane and Dawson JJ).
In later topics we will see how duty of care is reflected in managing safety and
environmental risks in particular.
Magnitude of risk Probability of occurrence
Severity of harm
Expense
Difficulty and inconvenience
Utility of conduct
2 .6 TO P I C 2 RI S K
M AN AG E M E N T
O V E R V I E W
UN
IT 4
15
E
NG
INE
ER
ING
RIS
K M
AN
AG
EM
EN
T
COMMERCIAL REASONS
There are strong commercial reasons for maximising business continuity and minimising
equipment and property damage. A systematic risk assessment not only identifies the
hazards, but also helps to rank the allocation of resources in a cost- and time- effective
manner. Such an approach also assists in minimising the organisation's insurance costs.
Example 2.2
A gas producer has been contracted to supply natural gas to a power generation
utility. The contract is to supply gas to meet the consumer demand for at least 98%
of the time. This is an onerous task, as downtime in gas supply can occur from time
to time due to breakdown of gas well control equipment or gas processing plant
equipment.
Minimising downtime requires an assessment of the reliability of the gas supply
system design, the level of redundancies built into the design to cope with
breakdowns, the spare parts management, and maintenance planning. Without a
systematic reliability study, it would be difficult to develop a design to meet the
contractual obligations.
The study would also provide input into the optimum level and type of redundancy
required and the type of maintenance philosophy that should be adopted. These
decisions would have a significant impact on the overall capital cost of the project. EVALUATING ALTERNATIVE OPTIONS
In project feasibility studies, several alternative options are often initially considered. For
facility-related engineering projects, the options may be related to the site for the facility,
the process technology to be adopted, logistics of raw material supply and product
distribution, availability of skill base, etc. The final shortlist of options is generally based
on location and commercial considerations.
An assessment of the risks associated with each of the options provides an additional
dimension of input to decision-making process. It is possible that the options initially
arrived at may have to be reconsidered, based on risk.
Example 2.3
A producer of animal health and veterinary chemicals decided to construct a new
formulation plant near a major metropolitan area. Three possible locations were
selected. All the locations were suitable in terms of area of land, land prices and
proximity to markets.
Before making a final decision on purchasing a specific piece of land, the company
decided to undertake a preliminary risk assessment study of the impact of the
proposed plant on the surrounding areas. For near identical operations, each of the
sites revealed quite different aspects of risk related to environmental issues
(proximity to sensitive waterways) and transportation issues (movement of chemicals
along highly populated thoroughfares). It also became apparent that the costs of
mitigating the risks in the three sites were so different that, when these costs were
included in the cost–benefit analysis of the project, there was only one clear winner.
If a risk management survey had not been undertaken, and a piece of land had been
purchased without this additional dimension allowed for, the project might have
become financially non-viable and it could have been difficult to obtain the
necessary planning and environmental approvals from statutory authorities.
2.7 TO P I C 2 RI S K
M AN AG E M E N T
O V E R V I E W
UN
IT 4
15
E
NG
INE
ER
ING
RIS
K M
AN
AG
EM
EN
T
In infrastructure projects there may also be a number of options. For example, in order to
eliminate a railway level crossing, consideration may be given to building a rail bridge over
an existing road, building a rail tunnel under an existing road, building a road bridge over
an existing rail or building a road tunnel under an existing rail. Each of these solutions may
result in differing levels of risk for trains, vehicles and pedestrians.
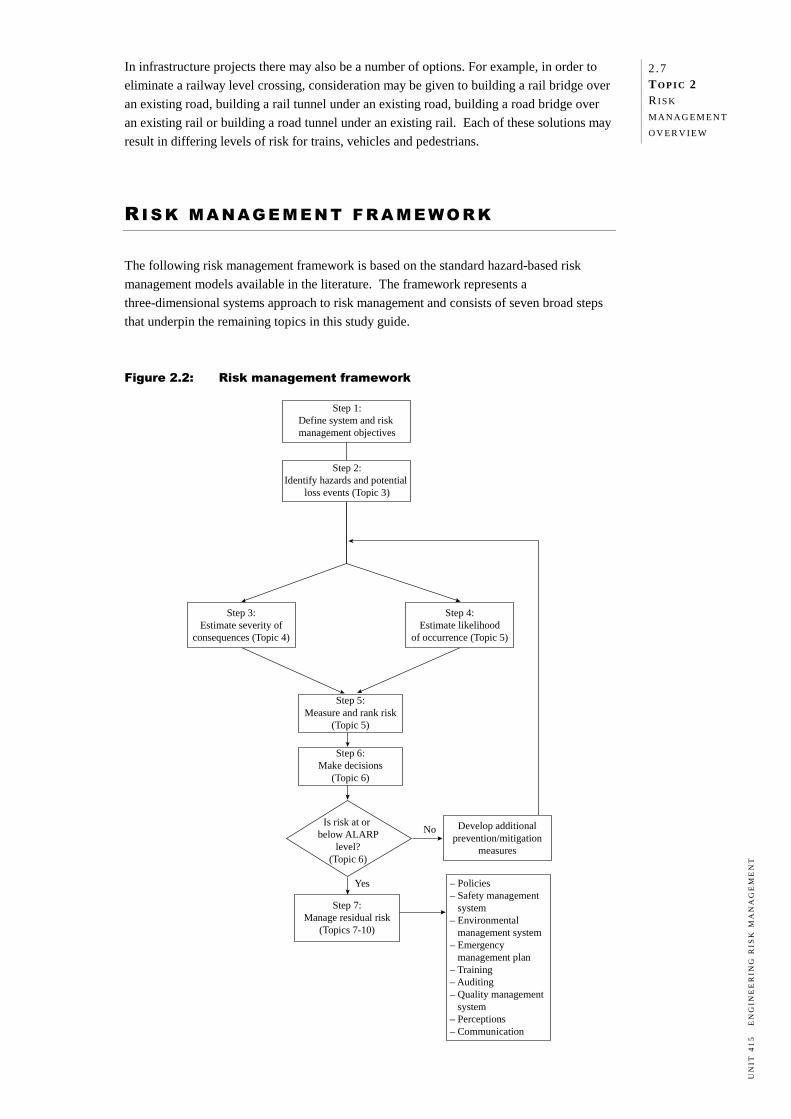
RI S K M A NAG E M E N T F R A ME WO R K
The following risk management framework is based on the standard hazard-based risk
management models available in the literature. The framework represents a
three-dimensional systems approach to risk management and consists of seven broad steps
that underpin the remaining topics in this study guide.
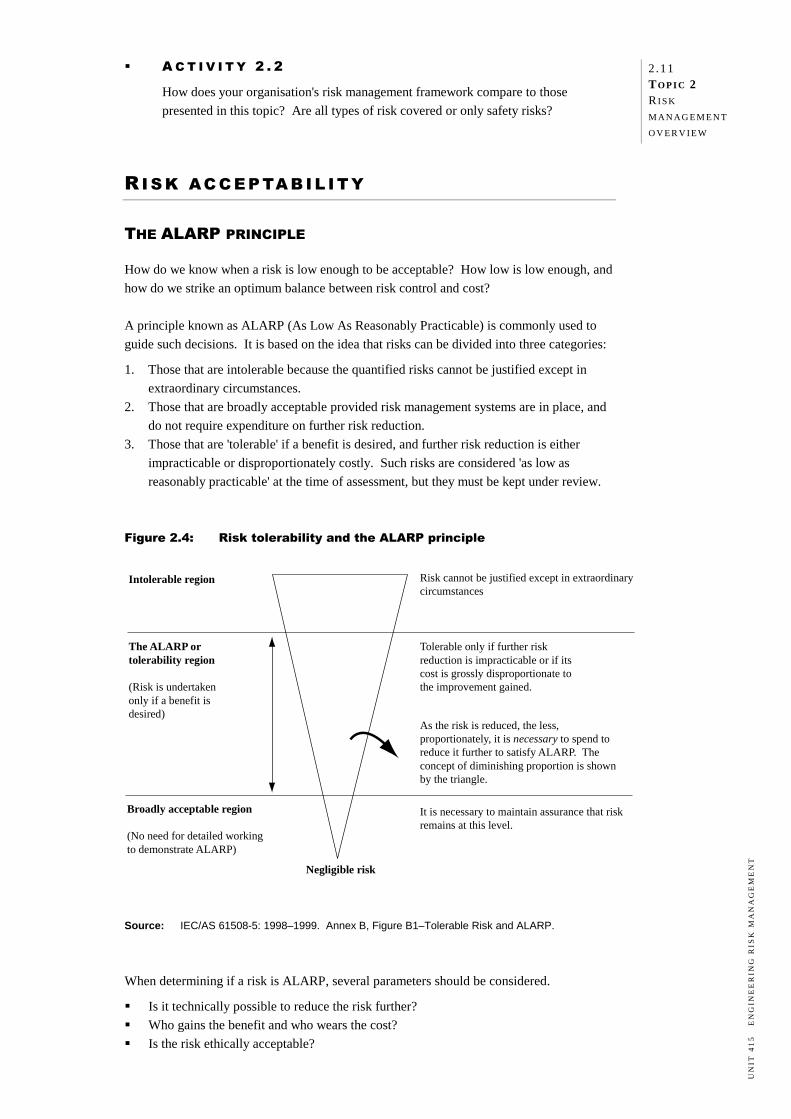
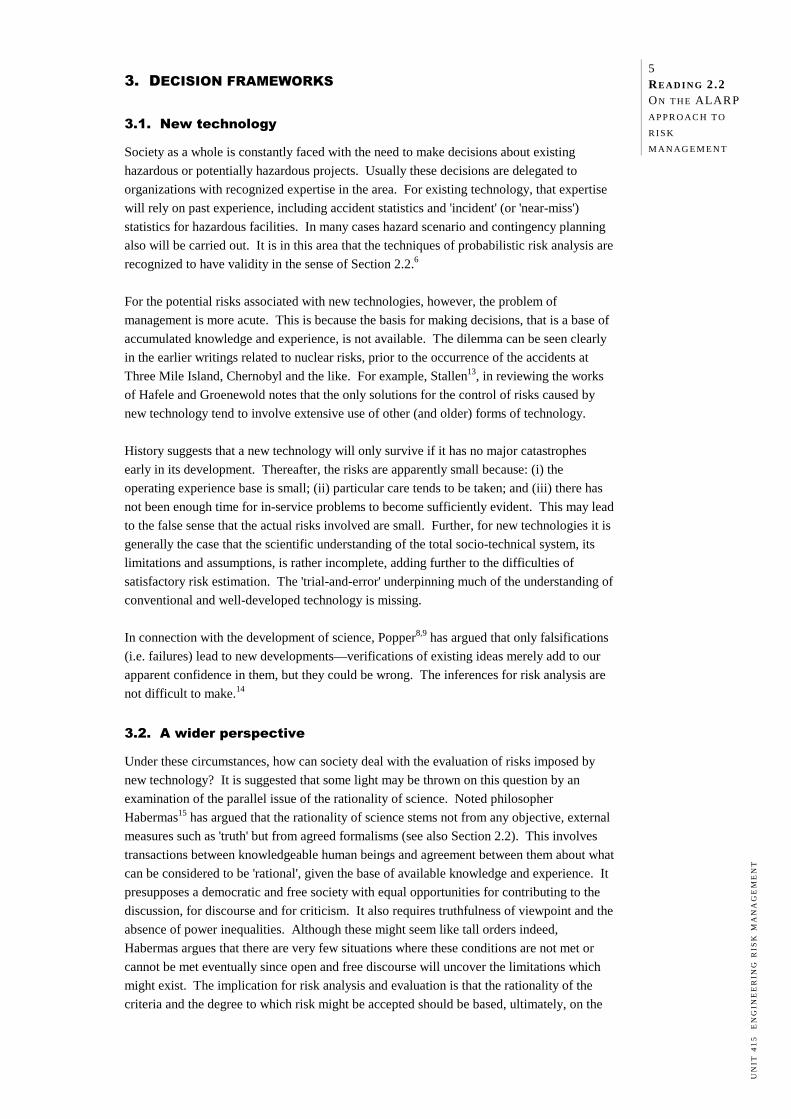
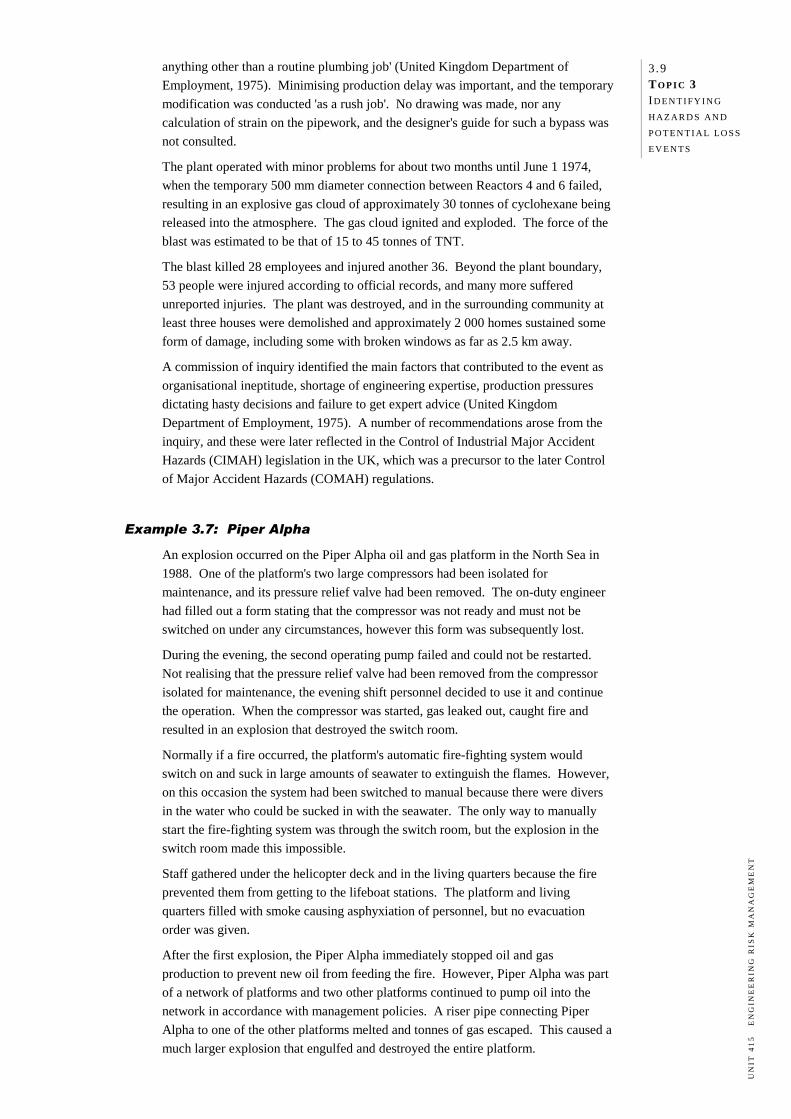
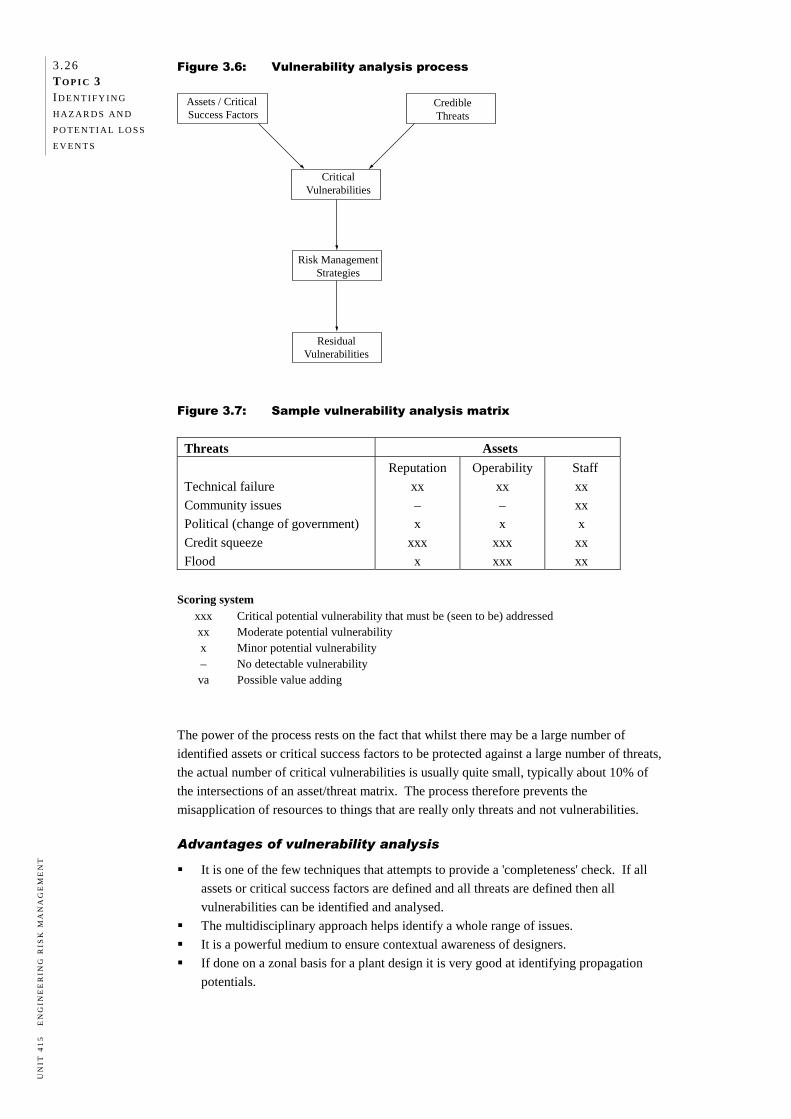
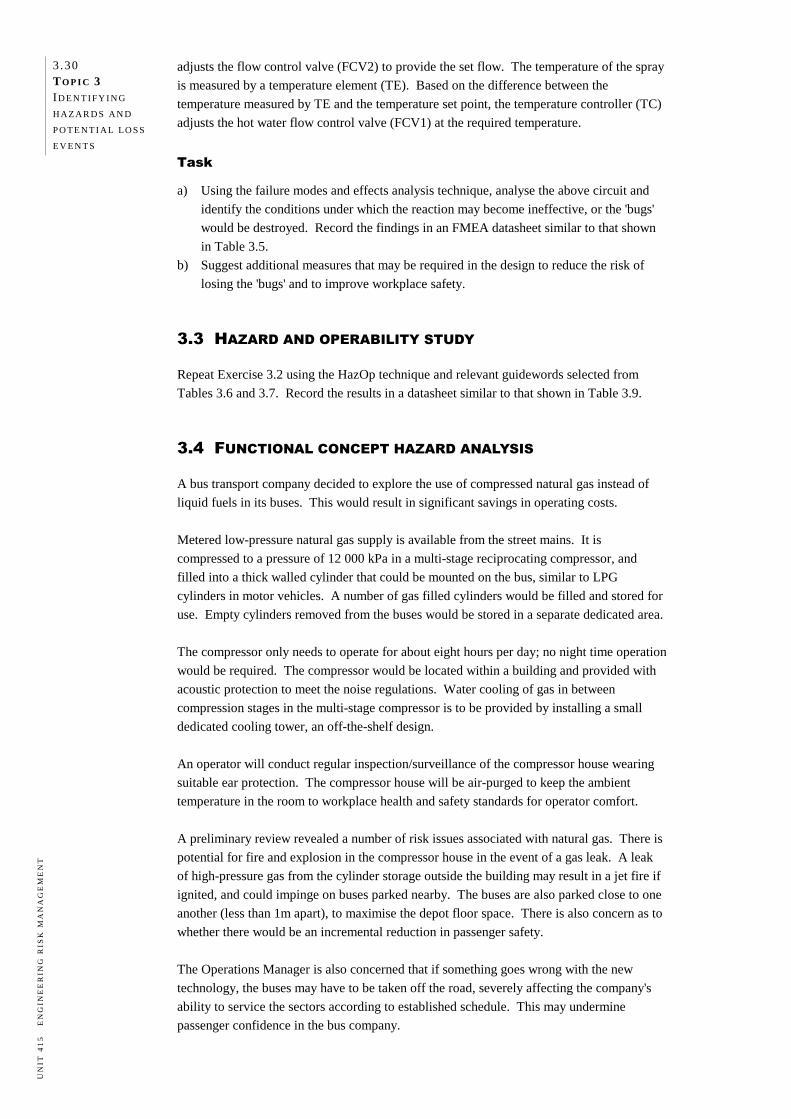
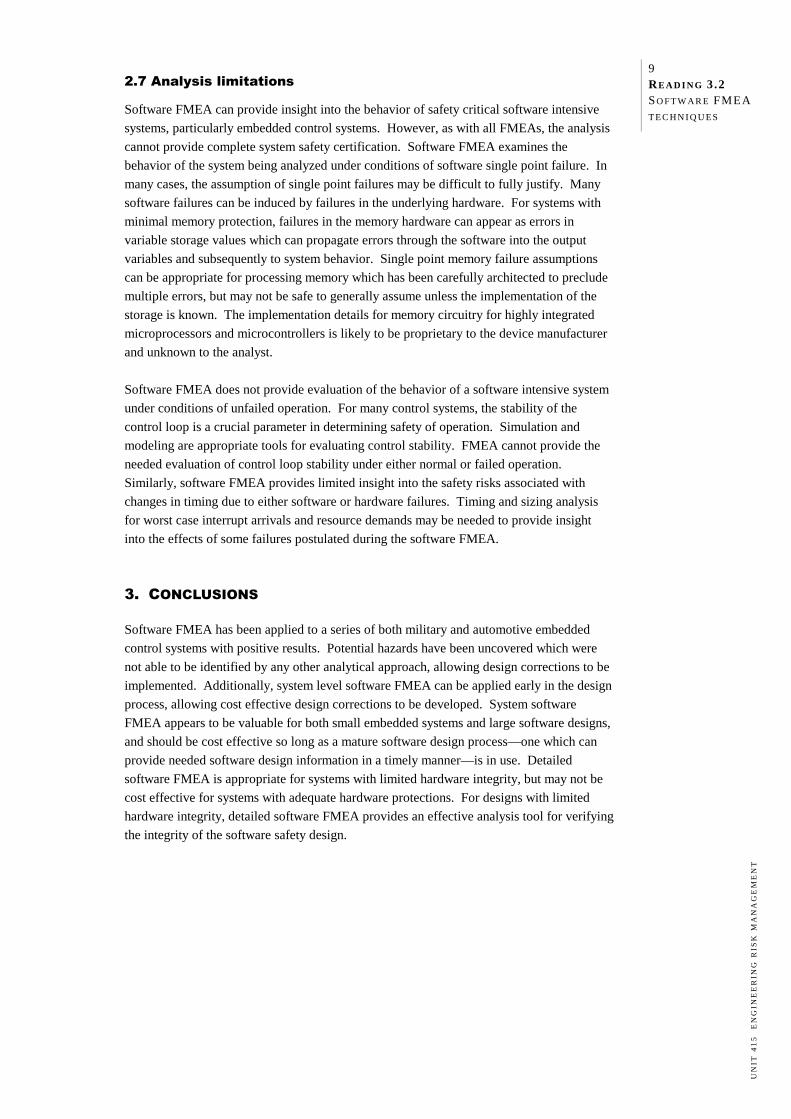
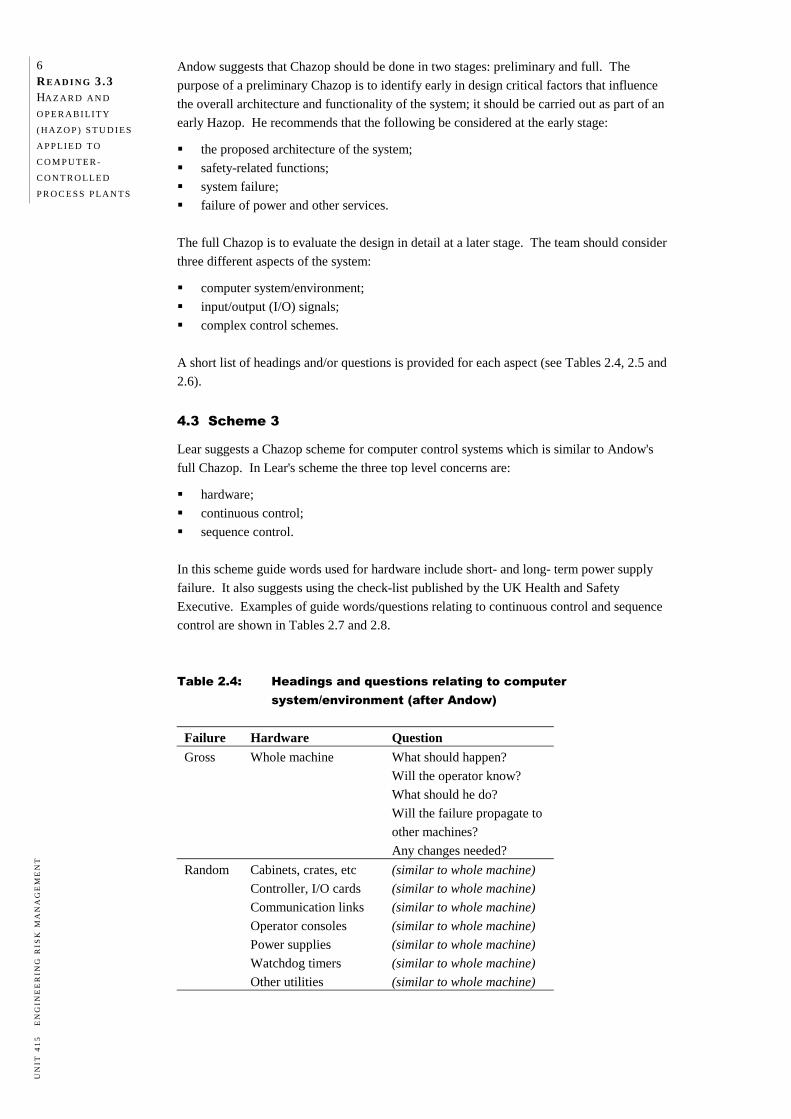
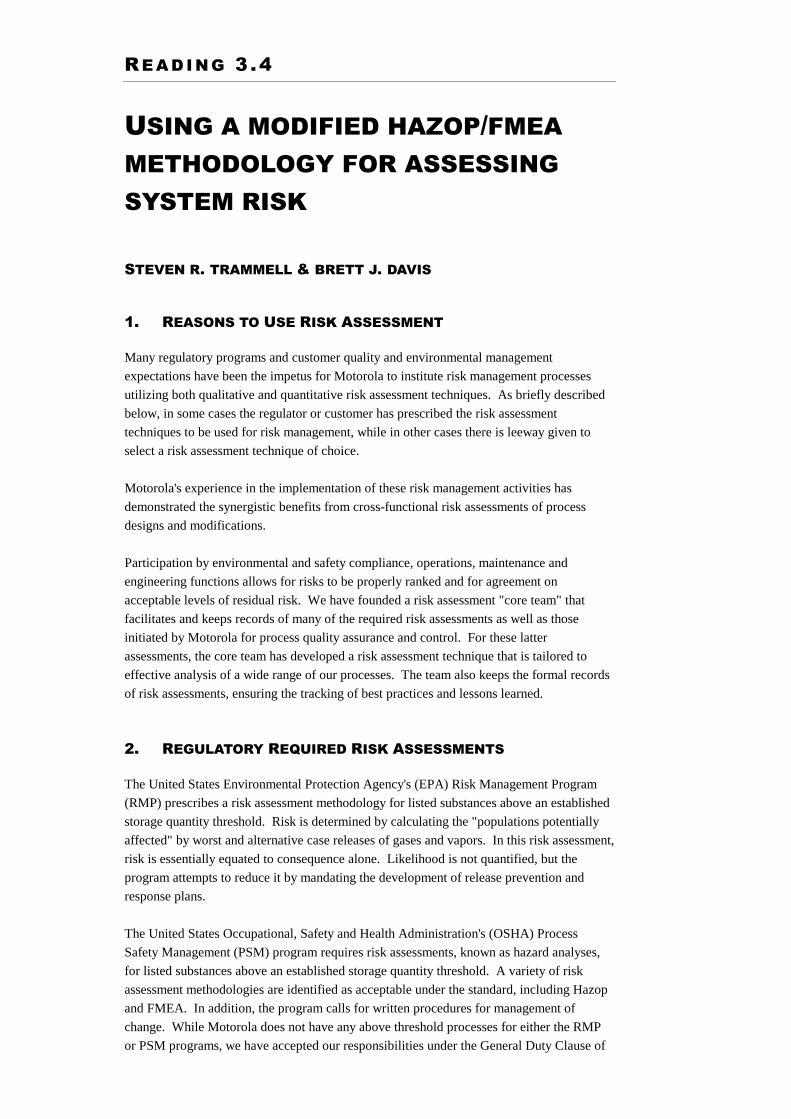
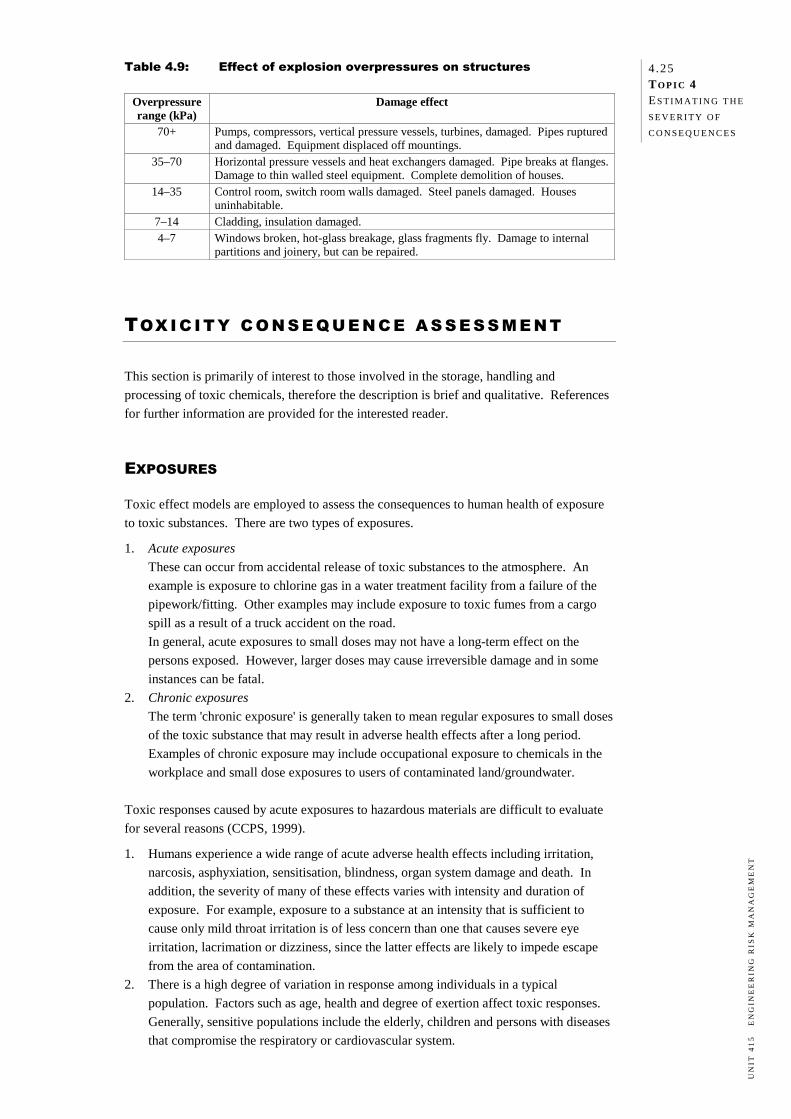
When determining if a risk is ALARP, several parameters should be considered.
Is it technically possible to reduce the risk further?
Who gains the benefit and who wears the cost?
Is the risk ethically acceptable?
Intolerable region
The ALARP ortolerability region
(Risk is undertakenonly if a benefit isdesired)
Broadly acceptable region
(No need for detailed workingto demonstrate ALARP)
Negligible risk
Risk cannot be justified except in extraordinarycircumstances
Tolerable only if further riskreduction is impracticable or if itscost is grossly disproportionate tothe improvement gained.
As the risk is reduced, the less,proportionately, it is necessary to spend toreduce it further to satisfy ALARP. Theconcept of diminishing proportion is shownby the triangle.
It is necessary to maintain assurance that riskremains at this level.
2 .12 TO P I C 2 RI S K
M AN AG E M E N T
O V E R V I E W
UN
IT 4
15
E
NG
INE
ER
ING
RIS
K M
AN
AG
EM
EN
T
Do we have enough information to make the decision ('the precautionary principle')?
What happens if we do nothing to reduce the risk?
What happens if we do not proceed (e.g. with a project or a proposed change)? In OHS legislation, 'practicable' is defined as having regard to the severity and likelihood of
the outcome, the state of knowledge about the hazard and the means and availability of
controlling the risk as well as the cost of controlling it. In general, the final decision is made by either management, a management committee or a
regulatory body. However, it must be remembered that risk is an assigned quantity and only
gains acceptance by consensus. Some guidelines on ALARP decision-making are suggested in Topic 6. You should now download Reading 2.1 'Reducing risks, protecting people' from the UK
Health & Safety Executive website http://www.hse.gov.uk/risk/theory/r2p2.pdf and read
pages 5–20. We will return to this reading in Topic 6. RATIONAL AND EMOTIVE ISSUES IN RISK MANAGEMENT
Risk assessment and risk management specialists generally agree that the principal standard
for judging and regulating risks should be based on the relative seriousness of the risk, i.e.
the severity of the consequences and the likelihood of occurrence. In recent years, more lay people in the community have become involved in risk
decision-making and have made very different judgments to the experts as to which risks
most merit public concern and regulatory attention. Whilst the experts sometimes dub the
lay people's arguments as emotional rather than rational, this response ignores the power of
perception and the validity of non-scientific views. It can lead to major problems for
organisations as the following example shows. Example 2.3
In 1990 the Australian Federal Airports Corporation undertook an environmental
impact assessment study for construction of a third runway at Sydney's Kingsford
Smith Airport. Aircraft noise at residential areas was identified as a potential
environmental risk.
Scientific calculations were carried out and noise contours were drawn up for the
various flight options. An extensive public consultation process was held, but
opposition to the proposal steadily increased from local residents and local
government agencies who had input into the decision-making process.
The environmental impact assessment identified only limited areas that would be
affected by the noise, and recommended soundproofing the residential dwellings in
these areas. Strong objections were raised by the public on the following grounds.
The scientific study was flawed and did not include a sensitivity analysis on the
assumptions made.
The noise contour could only represent a diffused and uncertain boundary on
either side of the 'scientific' contour and could not be used as a demarcation line
between a high noise and a low noise area.
Quality of life and amenity was being irreparably damaged, and soundproofing
was only a limited mitigation measure given that a resident spends a
considerable amount of time outside the house (for example in the garden).
2 .13 TO P I C 2 RI S K
M AN AG E M E N T
O V E R V I E W
UN
IT 4
15
E
NG
INE
ER
ING
RIS
K M
AN
AG
EM
EN
T
Such opposition was dismissed as being emotional rather than rational and a decision
was made to proceed with the third runway.
Within a short time of the runway being completed and put into operation, it became
clear that the residents' fears were not unfounded, and that the noise levels were
much higher than originally thought by experts. As a result, the cost of
soundproofing exceeded all budget expectations and a passenger levy for use of
Sydney airport had to be imposed to cover the costs. The issues are still not fully
resolved.
This example shows that it is imperative that organisations recognise the significance and
validity of different perceptions of risk acceptability and attempt to manage both the social
and commercial aspects of risk. Topics 9 and 10 will be devoted to this subject area, but it
is important that you are aware of it as you examine the techniques that can be used to
identify, analyse and respond to risks presented in the following topics.
You should now read Reading 2.2 'On the ALARP approach to risk management'. This
article provides a good summary of many of the concepts we will deal with in this unit.
You should then read Reading 2.3 ‘Getting to maybe: some communications aspects of
siting hazardous waste facilities'.
SUMMA RY
In this topic we examined different approaches to risk management and discussed why most
organisations now use a proactive systems approach rather than the traditional reactive
approach. We then introduced a risk management framework that consists of seven broad
steps and underpins the remaining topics in this study guide. We concluded the topic with a
brief discussion of the ALARP principle of risk acceptability and the significance and
validity of both scientific and non-scientific perceptions of risk acceptability.
EX E RC I S E
2.1 APPLYING THE SYSTEMS APPROACH TO MANAGING RISK
Most large corporations have a formal risk management strategy in place. While there are
variations in the details, the general approach appears to be the same. However, many
small businesses involved in engineering do not have a formal risk management strategy
and sometimes come to grief in the event of an incident. (A small business may be taken as
an organisation employing less than 50 people.)
Select one of the following small engineering organisations and complete the following
tasks.
a) Discuss the reasons the organisation should adopt a three-dimensional systems
approach to risk management.
2 .14 TO P I C 2 RI S K
M AN AG E M E N T
O V E R V I E W
UN
IT 4
15
E
NG
INE
ER
ING
RIS
K M
AN
AG
EM
EN
T
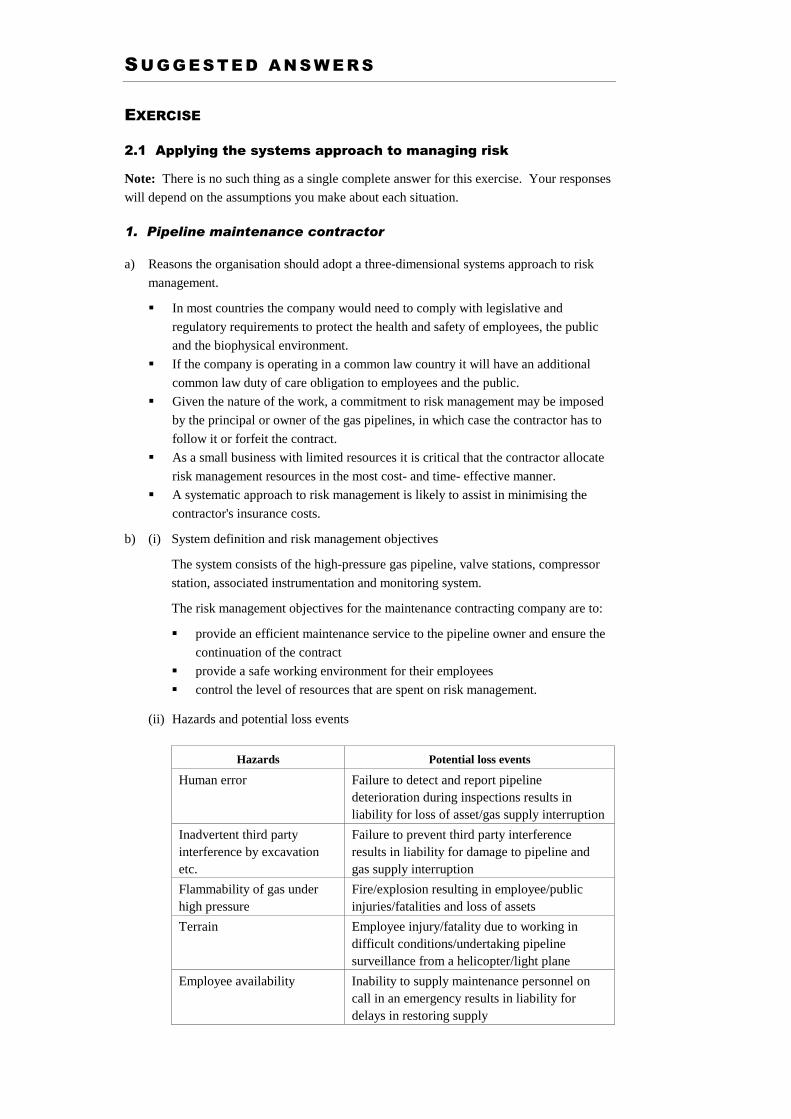
b) Using the risk management framework in Figure 2.2:
(i) define the system and risk management objectives
(ii) identify the hazards and potential loss events
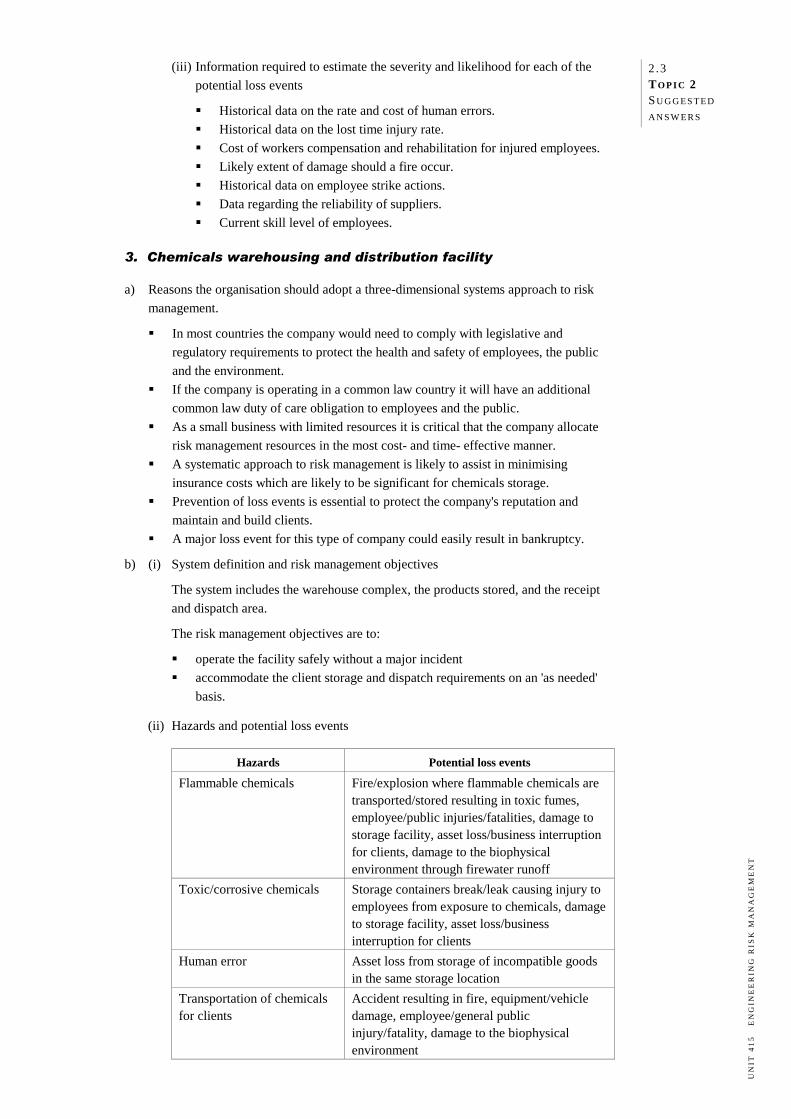
(iii) identify the information you would need to gather to estimate the severity of
consequences and likelihood of occurrence for each of the potential loss events.
1. Pipeline maintenance contractor
This company has the maintenance contract for inspection and maintenance of high-
pressure gas pipelines, owned and operated by a large organisation. The gas pressure may
be up to 100–120 bar, and runs cross-country in rugged terrain for several hundred
kilometres. The contract covers maintenance to the compressor station, intermediate valve
stations, and the pipeline corridor. The most common cause of a pipeline failure is
inadvertent third party interference such as excavation.
The company's responsibility includes monitoring the integrity of the pipeline, regular
inspections (external and internal), and carrying out of emergency maintenance work, as
required by the owner.
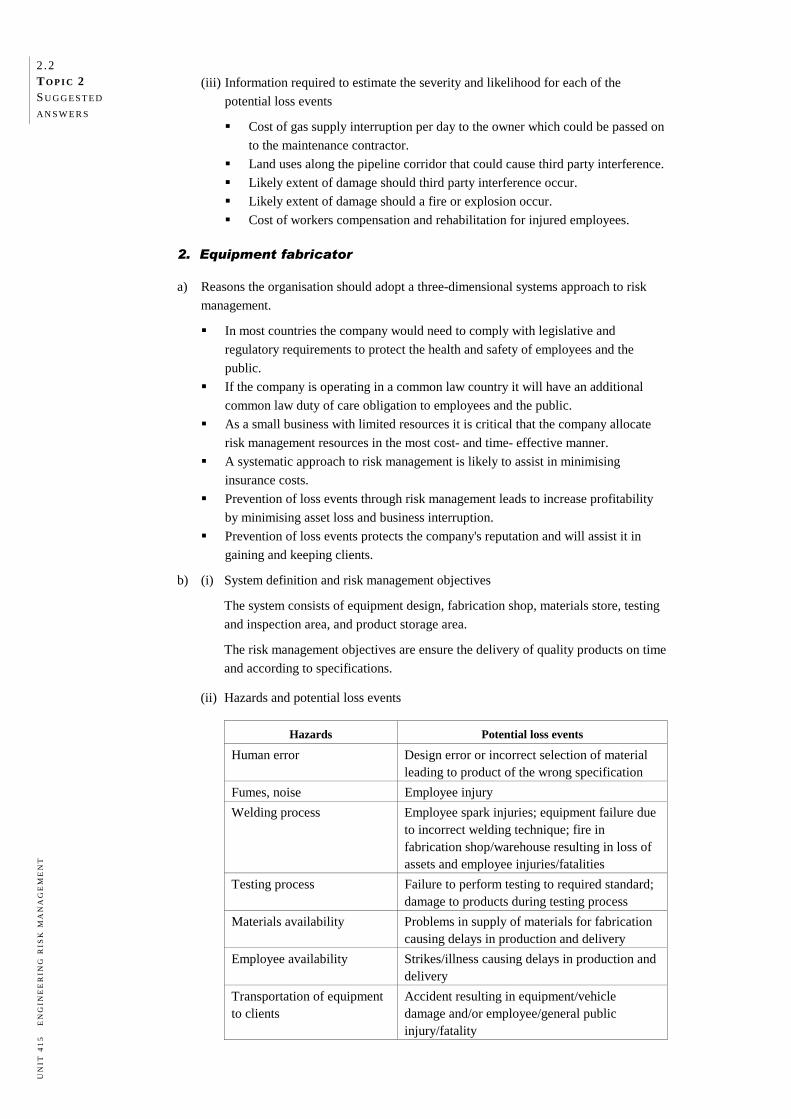
2. Equipment fabricator
This company fabricates equipment to engineering specifications for large corporations.
Equipment generally consists of vessels for storing bulk solids or liquids, including pressure
vessels.
The company's range of work can involve undertaking design, fabrication (including
welding of alloy steels), inspection, radiographic and magnetic particle testing of welds,
hydrostatic pressure testing, obtaining statutory registration where required, and delivery to
client. Strict adherence to fabrication design codes and quality assurance is essential as the
clients expect high standards of delivery.
3. Chemicals warehousing and distribution facility
This company stores a range of hazardous chemicals for distribution to clients. The
chemicals are owned by the clients, and the company's responsibility is restricted to contract
storage. This includes managing receipt of delivery, storage, and distribution according to
demand by the client. The warehouse buildings and on-site facilities are owned by the
company.
The types of chemicals stored include flammable liquids, flammable solids, oxidising agents
(e.g. pool chlorine), toxic liquids (e.g. pesticides) and corrosive liquids (acids and alkalis).
Apart from flammable liquids that are stored in bulk storage tanks, in filled drums or as
packaged products, all other substances are stored in packages. These packages are not
opened on the premises, and no other processing occurs on the site.
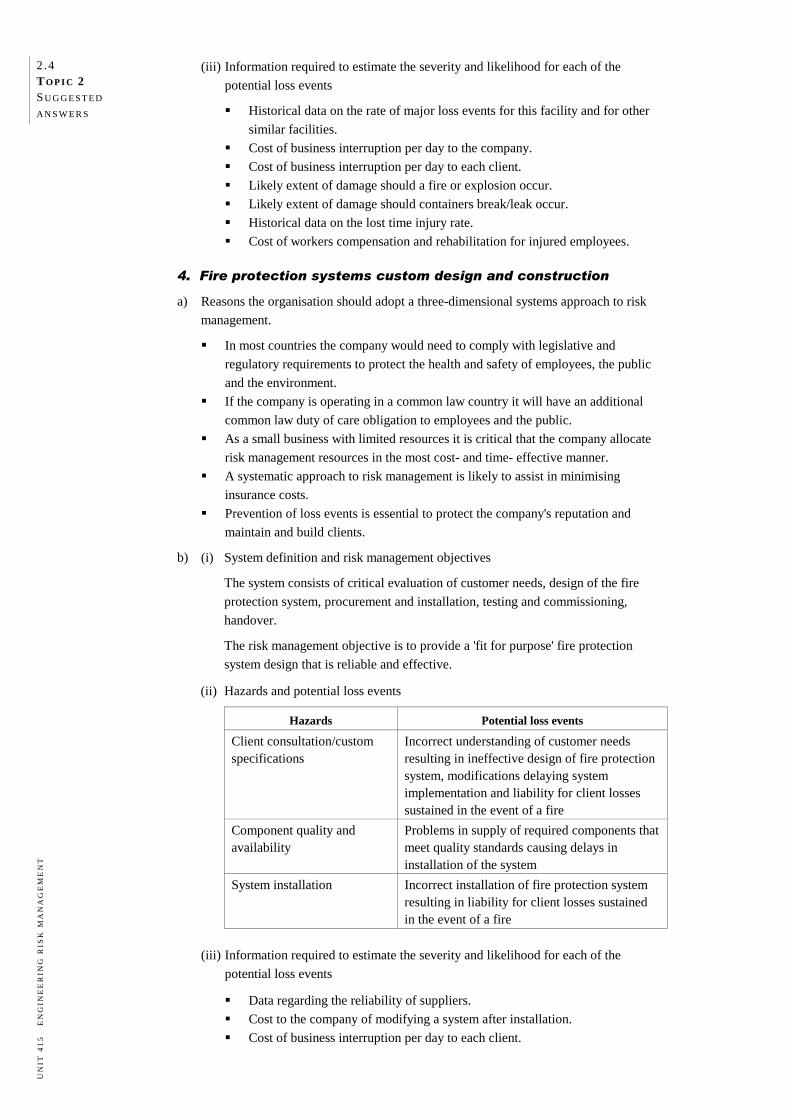
4. Fire protection systems custom design and construction
This small organisation undertakes custom design of fire protection systems (e.g. firewater
ring main, hydrants, firewater pumps, fire detectors, sprinkler systems, drainage systems)
and installs the systems at the clients' premises for a variety of industries. National
standards and relevant international standards are used in the design. Verification of the
design and quality assurance is critical, as is the performance guarantee of the installed
system. The adequacy of the design must be approved by the fire authority. Quality
assurance during procurement of the various components for construction is also crucial to
the delivery of goods and services.
2 .15 TO P I C 2 RI S K
M AN AG E M E N T
O V E R V I E W
UN
IT 4
15
E
NG
INE
ER
ING
RIS
K M
AN
AG
EM
EN
T
RE F E R E N C E S A N D F U RT H E R R E A D I N G
Publications
Department of Premier & Cabinet WA (1996) Guidelines for Managing Risks in the
Western Australian Public Sector. The Government of Western Australia, Perth.
Haldar, Achintya (2006) Recent Development in Reliability-based Civil Engineering,
World Scientific Publishing Co.
Health and Safety Executive (HSE) (1989) Risk Criteria for Land-Use Planning in the
Vicinity of Major Industrial Hazards, HSE Books, UK.
Health and Safety Executive (HSE) (2001) Reducing Risks, Protecting People: HSE's
IEC/Standards Australia (1998–1999) IEC/AS 61508-5 Functional Safety of
Electrical/Electronic/Programmable Electronic Safety Related Systems—Part 5:
Examples of Methods for the Determination of Safety Integrity Levels, International
Electrotechnical Commission/Standards Australia.
McManus, J. (2004) Risk Management in Software Development Projects, Elsevier
Butterworth-Heinemann, Burlington, Massachusetts.
Melchers, R.E. (2001) 'On the ALARP approach to risk management', Reliability
Engineering and System Safety, 71(2), February: 201–208.
National Occupational Health & Safety Commission Australia (1996) National Standard
[NOHSC:104 (1996)] and National Code of Practice [NOHSC:2016 (1996)] for the
Control of Major Hazard Facilities, AGPS, Canberra.
Royal Society (1992) Risk: Analysis, Perception and Management, Royal Society
Publishing, London.
Sandman, P.M. (1986) 'Getting to maybe: some communications aspects of siting hazardous
waste facilities', Seton Hall Legislative Journal, Spring: 437–465,
http://www.psandman.com/articles/seton.htm (accessed 4 September 2006).
Sappideen, C. & Stillman, R.H. (1995) Liability for Electrical Accidents: Risk, Negligence
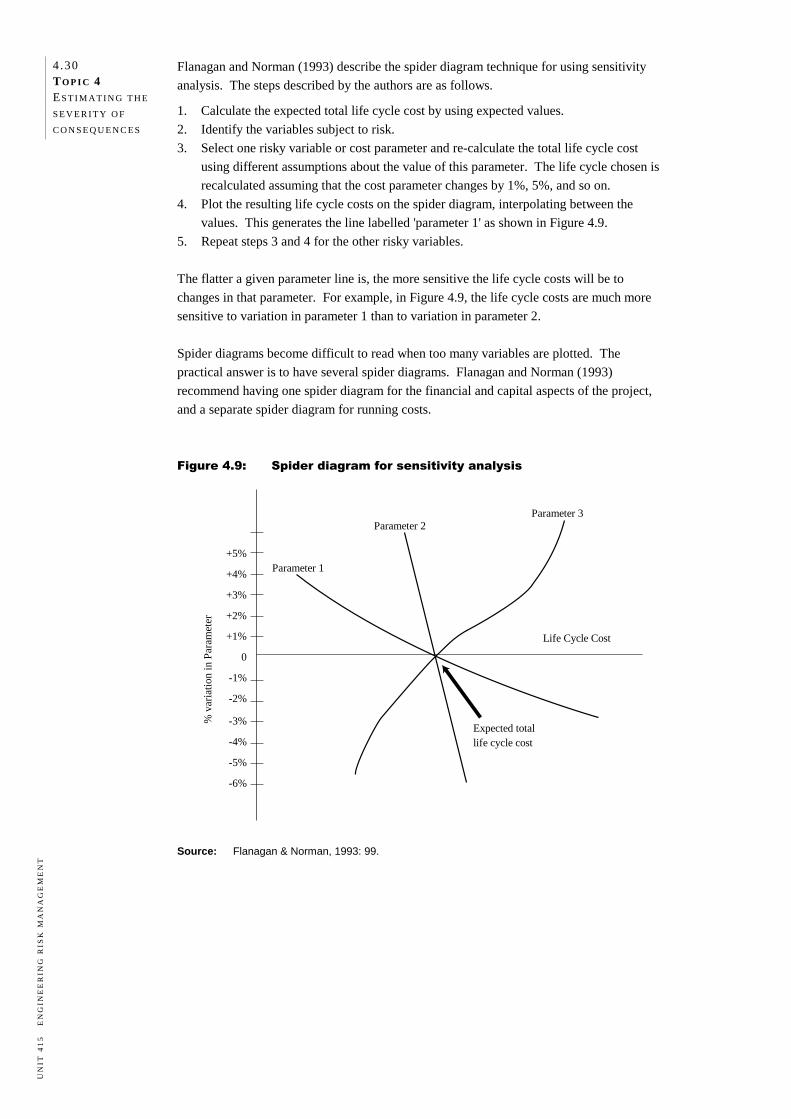
and Tort, Engineers Australia, Crows Nest, Sydney.
Standards Australia (1998) AS/NZS 3931:1998 Risk Analysis of Technological Systems—
Application Guide, Standards Australia/Standards New Zealand, Sydney.
Standards Australia (2004) AS/NZS 4360:2004 Risk Management, Standards Australia/
Standards New Zealand, Sydney.
Standards Australia (2004) HB 436:2004 Risk Management Guidelines: Companion to
AS/NZS 4360:2004, Standards Australia/Standards New Zealand, Sydney.
2 .16 TO P I C 2 RI S K
M AN AG E M E N T
O V E R V I E W
UN
IT 4
15
E
NG
INE
ER
ING
RIS
K M
AN
AG
EM
EN
T
Websites
Standards Australia http://www.standards.com.au
http://www.riskmanagement.com.au
Australian Safety & Compensation Council http://www.ascc.gov.au
BSI British Standards http://www.bsi-global.com
Engineers Media http://www.engaust.com.au
European Commission for the Environment http://ec.europa.eu/environment/index_en.htm
International Standards Organization http://www.iso.org/iso/en/ISOOnline.frontpage
Legislation in Australasia http://www.austlii.edu.au
UK Health and Safety Executive http://www.hse.gov.uk
US Environmental Protection Authority http://www.epa.gov
US Occupational Safety & Health Administration http://www.osha.gov
RE A D I N G 2 .2
ON THE ALARP APPROACH TO RISK MANAGEMENT
R. E. MELCHERS
1. INTRODUCTION
The management of risks associated with potential hazardous activities in society remains a
matter of profound public and technical interest. There has been and continues to be
considerable development in the range and extent of regulatory activity. Many new
regulatory frameworks have been established. Except for public input to risk assessments
for very specific and contentious projects, there appears to have been remarkably little
public debate (and perhaps even understanding) of the more general and philosophical
issues involved. This is despite the rather spectacular failure in recent years of electricity,
gas and other services over large regional areas and the occurrence of several major
industrial accidents.
One issue which might have been expected to have received some public discussion is how
decisions about hazardous facilities and activities are to be regulated. Should it be through
regulatory or consent authorities, and if so, what form and allegiances should such bodies
have? Alternatively, should it be through 'self-regulation', or should there be some other
mechanism(s)? These options have been explored in an interesting discussion paper.1
However, it appears largely to have been ignored in practice. Perhaps by default, the
regulatory approach is the most common route in attempting to exert control over
potentially hazardous activities. This trend is being followed in a number of countries. It is
appropriate, therefore, to review some aspects of these directions. In particular, the present
paper will focus on the use of the so-called as low as reasonably practicable (ALARP)
approach [also sometimes known as the as low as reasonably attainable/achievable
(ALARA) approach]. It will be viewed primarily from the perspective of so-called
'Common Law' countries, that is those with a legal system parallel to that of the USA or the
UK. For countries such as Norway, where ALARP is also very extensively used, some of
the comments to follow may not be completely applicable. However, it is considered that
the bulk of the discussion is sufficiently general.
The ALARP approach grew out of the so-called safety case concept first developed
formally in the UK. 2 It was a major innovation in the management of risks for potentially
hazardous industries. It requires operators and intending operators of a potentially
hazardous facility to demonstrate that (i) the facility is fit for its intended purposes, (ii) the
risks associated with its functioning are sufficiently low and (iii) sufficient safety and
emergency measures have been instituted (or are proposed). Since in practice there are
economic and practical limits to which these actions can be applied, the actual
implementation has relied on the concept of 'goal setting' regulations. The ALARP
approach is the most well known of these. It is claimed by some as being a more
'fundamental' approach to the setting of tolerable risk levels.3,4
2 RE A D I N G 2 .2 ON T HE ALARP
AP P R O AC H T O
R I S K
M AN AG E M E N T
UN
IT 4
15
E
NG
INE
ER
ING
RIS
K M
AN
AG
EM
EN
T
Conceptually the ALARP approach can be illustrated as in Fig. 1. This shows an upper
limit of risk that can be tolerated in any circumstances and a lower limit below which risk is
of no practical interest. Indicative numbers for risks are shown only for illustration—the
precise values are not central to the discussion herein but can be found in relevant country-
specific documentation. The ALARP approach requires that risks between these two limits
must be reduced to a level 'as low as reasonably practicable'. In relevant regulations it is
usually required that a detailed justification be given for what is considered by the applicant
to satisfy this 'criterion'.
Fig. 1: Levels of risk and ALARP, based on UK experience.3
As a guide to regulatory decision-making the ALARP concept suggests both 'reason' and
'practicality'. It conveys the suggestion of bridging the gap between technological and
social views of risk and also that society has a role in the decision-making process. In
addition, it has a degree of intuitive appeal, conveying feelings of reasonableness amongst
human beings. As will be argued in more detail below, these impressions are somewhat
misleading. There are also considerable philosophical and moral short-comings in the
ALARP approach. Perhaps rather obliquely, the discussion will suggest what should be
done to improve the viability of ALARP or what characteristics need to be embodied in
alternatives. However, it is acknowledged that this is not a paper offering 'solutions' but
rather one which it is hoped will focus more attention on the issues and stimulate discussion
in order to bring about solutions.
To allow attention to be focussed more clearly on the difficulties with the philosophy of
ALARP, it is necessary first to review some matters fundamental to the interpretation and
management of risk in society. These issues include: (i) risk definition and perception, (ii)
risk tolerance, (iii) the decision-making framework, and (iv) its implementation in practice.
3 RE A D I N G 2 .2 ON T HE ALARP
AP P R O AC H T O
R I S K
M AN AG E M E N T
UN
IT 4
15
E
NG
INE
ER
ING
RIS
K M
AN
AG
EM
EN
T
2. RISK PERCEPTION
2.1. Risk understanding and definition
Increased levels of education, awareness of environmental and development issues and
greater political maturity on the part of society generally has led to a much keener interest in
industrial risk management practices, policies and effectiveness. Apart from hazardous
industries, public interest derives also from notable public policy conflicts over the siting of
facilities perceived to be hazardous or environmentally unfriendly. Despite this, 'risk' as a
concept perceived by the general public appears to be rather poorly defined, with confusion
between probability, something involving both probability and consequences and something
implying monetary or other loss.
Vlek and Stallen5 gave some ten different definitions of 'risk' or riskiness, using various
ways of 'mixing' all or parts of the two main component ideas. Traditional decision
analysis, of course, simply multiplies the chance estimate by the consequence estimate.
This is only a 'first-order' approach, with both the chance estimate and the consequence
estimate being mean values. It is possible, at the expense of greater complexity in analysis,
but perhaps reflecting more accurately personal and societal perception, to invoke measures
of uncertainty, such as the standard deviation of each estimate.6 Nevertheless, there is likely
to remain some disagreement over a core definition of risk (as there appears to be in most
sociological and psychological works about any term) depending on ones view-point and
stake in the eventual outcome.1
In the mathematical/statistical literature and in most engineering oriented probability
discussions, risk is simply taken as another word for probability of occurrence or 'chance',
with consequences, however they might be measured, kept quite separate. Herein the
approach will be adopted to use 'risk' as a generic term, implying both probabilities and
consequences without specifying how these are to be combined.
2.2. Risk as an objective matter
It has become increasingly clear that 'risk' is not an objective matter. Thus all risk
assessment involves both 'objective' and 'subjective' information. Matters generally
considered to be capable of 'objective' representation, such as physical consequences, are
seldom completely so, since in their formulation certain (subjective, even if well accepted)
decisions have had to be made regarding data categorization, its representation, etc. This
also applies to areas of science once considered to be 'objective', a matter which is now
considered briefly.
In the development of mathematical and numerical models in science, model 'verification' is
the proof that the model is a true representation. It may be possible to do this for so-called
'closed' systems. These are completely defined systems for which all the components of the
system are established independently and are known to be correct. But this is not the
general case or the case for natural systems. For these 'verification' is considered to be
impossible.7
Model 'validation', on the other hand, is the establishment of legitimacy of a model,
typically achieved through contracts, arguments and methods. Thus models can be
confirmed by the demonstration of agreement between observation and prediction, but this
is inherently partial. "Complete confirmation is logically precluded by the fallacy of
affirming the consequent … and by incomplete access to natural phenomena … Models can
4 RE A D I N G 2 .2 ON T HE ALARP
AP P R O AC H T O
R I S K
M AN AG E M E N T
UN
IT 4
15
E
NG
INE
ER
ING
RIS
K M
AN
AG
EM
EN
T
only be evaluated in relative terms."7 Philosophical arguments also point to the
impossibility of proving that a theory is correct—it is only possible to disprove it.8,9
Moreover, in developing scientific work, models are routinely modified to fit new or
recalcitrant data. This suggests that models can never be 'perfect'.10 It follows that for
theories and models to be accepted, there is necessarily a high degree of consensus-forming
and personal inter-play in their development and the scientific understanding underpinning
them.11 Some of this can be brought about by 'peer' reviews of risk assessments and
procedures, such as widely practiced in the nuclear industry.
These concepts carry-over directly to risk estimation since risk estimates are nothing but
models of expectation of outcomes of uncertain systems (i.e. 'open' systems), couched in
term of the theory of probability. Thus, in the context of PSA, "… often the probabilities
are seen as physical properties of the installation and how it is operated …" and while this
view is useful for making comparative statements about riskiness or for comparison to
standards, this interpretation is inconsistent with "all standard philosophical theories of
probability …"12
2.3. Factors in risk perception
There are many factors involved in risk perception.1 These include:
(i) the likely consequences should an accident occur;
(ii) the uncertainty in that consequence estimate;
(iii) the perceived possibilities of obviating the consequences or reducing the probability of
the consequences occurring, or both;
(iv) familiarity with the 'risk';
(v) level of knowledge and understanding of the 'risk' or consequences or both; and
(vi) the interplay between political, social and personal influences in forming perceptions.
The last two items in particular deserve some comment. Knowledge and understanding of
risk issues on the part of individuals and society generally implies that (risk) communication
exists, that it is utilized to convey meaningful information and that the capacity exists to
understand the information being conveyed and to question it. Perhaps the most critical
issue is the actual availability of relevant and accurate information. For a variety of
reasons, there has been an increasing requirement placed on governments and industry to
inform society about the hazards to which its members might be exposed. There has
developed also greater possibility for access to government and government agency files
under 'Freedom of information'-type legislation. Whether these developments have been
helpful in creating a better informed public is not entirely clear, as it involves also issues
such as truthfulness in communications and the trust which society is willing to place in the
available information.
That there will be an interplay between individual and societal perceptions of risk follows
from individuals being social beings. Their very existence is socially and psychologically
intertwined with that of others. Formal and informal relationships and institutions "set
constraints and obligations upon people's behavior, provide broad frameworks for the
shaping of their attitudes and beliefs, and are also closely tied to questions both of morality
and of what is to be valued and what is not. There is no reason to suppose that beliefs and
values relating to hazards are any different from other more general beliefs and values …"1
5 RE A D I N G 2 .2 ON T HE ALARP
AP P R O AC H T O
R I S K
M AN AG E M E N T
UN
IT 4
15
E
NG
INE
ER
ING
RIS
K M
AN
AG
EM
EN
T
3. DECISION FRAMEWORKS
3.1. New technology
Society as a whole is constantly faced with the need to make decisions about existing
hazardous or potentially hazardous projects. Usually these decisions are delegated to
organizations with recognized expertise in the area. For existing technology, that expertise
will rely on past experience, including accident statistics and 'incident' (or 'near-miss')
statistics for hazardous facilities. In many cases hazard scenario and contingency planning
also will be carried out. It is in this area that the techniques of probabilistic risk analysis are
recognized to have validity in the sense of Section 2.2.6
For the potential risks associated with new technologies, however, the problem of
management is more acute. This is because the basis for making decisions, that is a base of
accumulated knowledge and experience, is not available. The dilemma can be seen clearly
in the earlier writings related to nuclear risks, prior to the occurrence of the accidents at
Three Mile Island, Chernobyl and the like. For example, Stallen13, in reviewing the works
of Hafele and Groenewold notes that the only solutions for the control of risks caused by
new technology tend to involve extensive use of other (and older) forms of technology.
History suggests that a new technology will only survive if it has no major catastrophes
early in its development. Thereafter, the risks are apparently small because: (i) the
operating experience base is small; (ii) particular care tends to be taken; and (iii) there has
not been enough time for in-service problems to become sufficiently evident. This may lead
to the false sense that the actual risks involved are small. Further, for new technologies it is
generally the case that the scientific understanding of the total socio-technical system, its
limitations and assumptions, is rather incomplete, adding further to the difficulties of
satisfactory risk estimation. The 'trial-and-error' underpinning much of the understanding of
conventional and well-developed technology is missing.
In connection with the development of science, Popper8,9 has argued that only falsifications
(i.e. failures) lead to new developments—verifications of existing ideas merely add to our
apparent confidence in them, but they could be wrong. The inferences for risk analysis are
not difficult to make.14
3.2. A wider perspective
Under these circumstances, how can society deal with the evaluation of risks imposed by
new technology? It is suggested that some light may be thrown on this question by an
examination of the parallel issue of the rationality of science. Noted philosopher
Habermas15 has argued that the rationality of science stems not from any objective, external
measures such as 'truth' but from agreed formalisms (see also Section 2.2). This involves
transactions between knowledgeable human beings and agreement between them about what
can be considered to be 'rational', given the base of available knowledge and experience. It
presupposes a democratic and free society with equal opportunities for contributing to the
discussion, for discourse and for criticism. It also requires truthfulness of viewpoint and the
absence of power inequalities. Although these might seem like tall orders indeed,
Habermas argues that there are very few situations where these conditions are not met or
cannot be met eventually since open and free discourse will uncover the limitations which
might exist. The implication for risk analysis and evaluation is that the rationality of the
criteria and the degree to which risk might be accepted should be based, ultimately, on the
6 RE A D I N G 2 .2 ON T HE ALARP
AP P R O AC H T O
R I S K
M AN AG E M E N T
UN
IT 4
15
E
NG
INE
ER
ING
RIS
K M
AN
AG
EM
EN
T
agreed position of society obtained through internal and open transactions between
knowledgeable and free human beings.
Such a position has been put in different, but essentially analogous ways by others.1 The
importance of giving consideration to public opinion underlies much writing on risk criteria.
However, the practical difficulties of "arriving at consensus decisions over the question of
acceptable risk in society " are considerable. According to Layfield16 in commenting on
Britain's Sizewell B reactor … "The opinions of the public should underlie the evaluation of
risk. There appears to be no method at present for ascertaining the opinions of the public in
such a way that they can be reliably used as the basis for risk evaluation. More research on
the subject is needed."
Moreover, society is a complex mix of sub-groups with differing aims, ambitions, views,
opinions and allegiances. It is not surprising then that when faced with most matters about
which profound decisions need to be made society responds with a variety of view-points
and courses of action. Although there are always inter-plays between short-term and
longer-term self-interests and morally 'high-ground' views, it appears in many cases that the
diversity of views and the convictions with which they are held is inversely related to the
knowledge sub-groups of society have about the matter being considered.
Layfield16 noted …"As in other complex aspects of public policy where there are benefits
and detriments to different groups, Parliament is best placed to represent the public's
attitude to risks." In practice, of course, such a course of action might be taken only for
major policy decisions, such as whether the nation should have nuclear power or not, etc.
However, Wynne17 and others have argued that Parliament is ill-equipped both in time and
expertise to fully appreciate the implications and changes likely to be brought about by the
introduction or further development of new technologies. In his view, particularly for major
new technology issues, the political process can only be considered to be defective.
A historical review of the introduction of any really new technology shows, however, just
how ill-informed and ill-equipped parliaments tend to be, mostly being even unaware of the
changes taking place around them. For most major technological innovations (irrespective
of their hazard potential) parliamentary interest tends to follow well after the technologies
have been introduced. There are many examples of this in the developing Industrial
Revolution18 and more recent examples include IVF technology, gene technology, internet
technology, etc.
Moreover, even within society more generally there is seldom much awareness of potential
problems and hence little or no debate or detailed consideration of it. Usually only after the
technology has been established and some of its problems have become evident does public
perception become active. This suggests that risk assessment in general, and approaches
such as ALARP, can deal only with the control of the further development of already
established technology.
3.3. Practical decisions
Whatever the idealized situation ought to be, the need to make day-to-day decisions about
lesser hazards in society has invariably led to regulatory approaches as more convenient
substitutes for public or parliamentary debate. One reason sometimes given for leaving the
decisions to public servants is that the public is uneducated, ill-informed and irrational in
dealing with complex issues; arguments which can hardly be sustained as essential in a
7 RE A D I N G 2 .2 ON T HE ALARP
AP P R O AC H T O
R I S K
M AN AG E M E N T
UN
IT 4
15
E
NG
INE
ER
ING
RIS
K M
AN
AG
EM
EN
T
modern society. However, to invoke public debate and discussion ideally requires time and,
for many individuals, much back-ground education when the discussion is about complex
issues. None of these conditions tends to be met in practice, for a variety of reasons (see
also Section 2.3). Often regulators will facilitate some form of public participation, such as
through making available documents and through providing back-ground briefings.
Unfortunately, in advancing along this line, there is a danger that there may no longer be
much left of Habermas's vision of transactions between knowledgeable and free individuals
in coming to a consensus.
The methods which have evolved for the solution of acceptable or tolerable risk problems in
a bureaucratic setting may be categorized broadly to include: 1
1. professional judgement as embodied in institutionally agreed standards (such as
engineering codes of practice) or as in commonly accepted professional skills;
2. formal analysis tools such as cost-benefit analysis or decision analysis, with or without
public discussion opportunities; and
3. so-called 'boot-strapping' approaches employing techniques such as 'revealed
preferences' as used in social–psychology, or using extrapolations from available
statistical data about risks currently accepted in other areas of endeavor.
Aspects of all three are commonly in use. As will be seen, the ALARP approach falls
essentially in the third category.
4. RISK TOLERABILITY
The levels of risk associated with a given facility or project that might be acceptable to, or
tolerated by, an individual or society or sub-groups is an extremely complex issue, about
which much has been written. It is not possible to deal with this matter here, but see Reid19
for a useful summary and critique.
Of course, 'tolerability' and 'acceptability' are not necessarily the same, although it has been
common in risk analysis to loosely interchange the words. According to the HSE3,
" 'tolerability'… refers to the willingness to live with a risk to secure certain benefits and in
the confidence that it is being properly controlled. To tolerate a risk means that we do not
regard it as negligible or something we might ignore, but rather as something we need to
keep under review and reduce still further if and when we can." Acceptability, on the other
hand, implies a more relaxed attitude to risk and hence a lower level of the associated risk
criterion. According to Layfield16, in terms of the nuclear power debate, the term
'acceptable' fails to convey the reluctance that individuals commonly show towards being
exposed to certain hazardous activities.
Although the distinction between the terminology 'acceptability' and 'tolerability' is
important, it is also the case that the term 'acceptable' has been used in relation to consent or
acceptance of a proposed risk situation on the part of regulatory authorities. This suggests
by implication that the decisions of the regulatory authorities in some manner reflect
'tolerability' on the part of society.
8 RE A D I N G 2 .2 ON T HE ALARP
AP P R O AC H T O
R I S K
M AN AG E M E N T
UN
IT 4
15
E
NG
INE
ER
ING
RIS
K M
AN
AG
EM
EN
T
5. ALARP
5.1. Definition of terms
As noted, the ALARP approach has been advocated as a more fundamental approach to the
setting of tolerable risk levels, particularly suitable for regulatory purposes.20 Fig. 1
summarizes the approach, in which the region of real interest lies between the upper and
lower limits. This is the region in which risks must be reduced to a level ALARP. Since
this objective is central to the approach a very careful discussion and explanation of terms
might be expected. However, apart from appeals to sensible discussion and reasonableness
and the suggestion that there are legal interpretations, there is little in print which really
attempts to come to terms with the critical issues and which can help industry focus on what
might be acceptable.3 The critical words in ALARP are 'low', 'reasonably' and 'practicable'. Unfortunately, these
are all relative terms—standards are not defined. 'Reasonably' is also an emotive word,
implying goodness, care, consideration etc. However, as will be discussed below, what may
be reasonable in some situations can be seen as inappropriate in others. Regarding 'practicable', the Oxford Dictionary refers to 'that can be done, feasible…', i.e.
what can be put into practice. Of course, many actions can be implemented, provided the
financial rewards and resources are sufficient. Thus there are a very clear
financial/economic implications—" 'reasonable practicability' is not defined in legislation
but has been interpreted in legal cases to mean that the degree of risk can be balanced
against time, trouble, cost and physical difficulty of its risk reduction measures. Risks have
to be reduced to the level at which the benefits arising from further risk reduction are
disproportionate to the time, trouble, cost and physical difficulty of implementing further
risk reduction measures."3 It is therefore clear that financial implications are recognized—"in pursuing any safety
improvement to demonstrate ALARP, account can be taken of cost. It is possible, in
principle, to apply formal cost-benefit techniques to assist in making judgement(s) of this
kind."3 This assumes that all factors involved can be converted to monetary values.
Unfortunately, it is well-known that there are not inconsiderable difficulties and hence
implied value judgements in evaluating or imputing monetary values for both benefits and
costs. This problem is particularly acute for the analysis of hazardous facilities where the
value of human life and the (imputed) cost of suffering and deterioration of the quality of
life may play a major role in the analysis. Further, an approach based on cost analysis implicitly assumes equal weighting for each
monetary unit, a proposition known to cause difficulties with cost benefit analysis when
applied to issues with social implications. It is considered that the selection of tolerable risk
is of this type. Value judgements which society might make are subsumed in the valuations
required for cost analysis. In addition, there is also the problem that the optimum obtained in cost benefit analyses is
seldom very sensitive to the variables involved. This means that cost benefit analysis alone
is unlikely to provide a clear guide to the selection of appropriate policy. Finally, it is unclear how value judgements such as 'low', 'reasonably' and 'practicable'
correlate with a minimum total cost outcome. The value judgements required involve issues
well beyond conventional cost benefit analysis, a matter well recognized in dealing with
environmental issues.21
9 RE A D I N G 2 .2 ON T HE ALARP
AP P R O AC H T O
R I S K
M AN AG E M E N T
UN
IT 4
15
E
NG
INE
ER
ING
RIS
K M
AN
AG
EM
EN
T
5.2. Openness
In the expositions of the ALARP approach it appears that the specific tolerable probability
levels which would qualify for acceptance by a regulatory authority are not always in the
public domain. The tolerable risk criterion may not be known to the applicant and some
process of negotiation between the regulatory authority and the applicant is needed.
Societal groups concerned about openness in government might well view this type of
approach with concern.
A related problem with implementation of the ALARP approach can arise in the evaluation
of two similar projects assessed at different times, possibly involving different personnel
within the regulatory body and different proponents. How is consistency between the
'approvals' or 'consents' to be attained? Irrespective of the care and effort expended by the
regulatory authority, there is a real danger that an applicant with a proposal which needs to
be further refined or which is rejected, will cry 'foul'. Without openness and without
explicit criteria, such dangers are not easily avoided. Is there not also a danger of
corruption?
5.3. Morality and economics
The issue of morality and how this is addressed by the ALARP approach can be brought
most clearly into focus by a discussion based around the nuclear power industry. That
industry took a major blow in the USA with the Three Mile Island and other incidents.
Currently there are no new facilities planned or under construction. This is possible in the
USA because there are alternative sources of electric power with perhaps lower perceived
risks, including political risks. Opposition to nuclear power and the potential consequences
associated with it are clearly in evidence. Such an open opposition may not always be
tolerated in some other countries, nor may there be viable alternative power sources. Thus
there may be pressures for public opposition to be ignored and to be discredited and for
access to information to be less easy to obtain. For example, there have been claims of
'cover-ups', such as over UK nuclear accidents. Whatever the precise reasons, it is clear
that in some countries the nuclear industry remains viable. Comparison to the US situation
suggests that what might be considered 'reasonable and practical' in some countries is not so
considered in the US, even though the technology, the human stock and intellect and the
fear of nuclear power appear to be much the same. The only matters which appear to be
different are: (i) the economic and political necessities of provision of electrical power; and
perhaps (ii) acquiescence to a cultural system as reflected in the political authority and legal
systems and which preclude or curtail the possibility of protracted legal battles apparently
only possible on Common Law countries. Do these matters then ultimately drive what is
'reasonable and practical'? And if they do, is the value of human life the same?
The dichotomy between socio-economic matters and morality issues has other implications
also. It is known that in some countries the nuclear power system is of variable quality,
with some installations known to have a considerable degree of radiation leakage—far in
excess of levels permitted under international standards. Even if, as is likely, the costs to
bring the facilities to acceptable standards are too high, there will be economic pressures to
keep the facilities in operation, despite the possibility that some plant workers would be
exposed to excessive radiation. It is known that in some case maintenance problems in high
radiation areas have been carried out through hiring, on a daily basis, members of the lowest
socio-economic classes to do the work. Because the remuneration was good by local
standards there was no shortage of willing workers, even though it has come to be known
that many develop radiation sickness and serious tumors within weeks of being exposed.
10 RE A D I N G 2 .2 ON T HE ALARP
AP P R O AC H T O
R I S K
M AN AG E M E N T
UN
IT 4
15
E
NG
INE
ER
ING
RIS
K M
AN
AG
EM
EN
T
Although somewhat starkly, this illustrates that the criteria of 'reasonableness' and
'practicability' so essential in the ALARP approach are ultimately issues of morality. While
for projects having the potential for only minor or rather limited individual or social
consequences there is probably no need to be concerned, for other, more significant projects
the question must be asked whether it is acceptable for decisions about such issues to be left
for private discussion between a regulatory authority and project proposers.
5.4. Public participation
As noted earlier, for many systems in common usage there is a long and established base of
experience (both good and bad) upon which to draw. This is not necessarily the case for all
facilities and projects, particularly those subject to risk assessment requirements. It would
seem to be precisely these projects for which risk analysis should be open to public scrutiny
and debate so that the issue of their rationality in respect to society can be considered. As
noted, the ALARP approach would appear to permit a small group of people making
decisions about a potentially hazardous project, away from public scrutiny, and in
consultation with the proponents of the project. According to the Royal Society report1,
"The (ALARP) approach has …been criticised on the grounds that it does not relate
benefits clearly enough to tolerability. More importantly, however, it does not address the
critical issue of how public input to tolerability decisions might be achieved, beyond an
implicit appeal to the restricted, and now much criticised … revealed-preferences
criterion"…and…"The question of how future public input to tolerability decisions might
be best achieved is also closely related to recent work on risk communication…" It is acknowledged that public debate and participation at a level leading to worthwhile input
is not always practical. As noted earlier, only some participants will have the time, energy
and capability to become fully acquainted with the technical intricacies involved in significant
projects. There are the dangers also of politicizing the debate and perhaps trivializing it
through excessive emotional input. Nevertheless, there are strong grounds for not ignoring
non-superficial public participation and involvement in risk-based decisions.1
5.5. Political reality
Risk tolerability cannot be divorced from wider issues in the community. It is intertwined
in matters such as risk perception, fear of consequences and their uncertainty etc. as well as
various other factors which influence and change society with time. Societal risk
tolerability would be expected to change also. Change can occur very quickly when there is
a discontinuity in the normal pattern of events in society—a major industrial accident is one
such event. The implication for the ALARP approach might well be as follows. What
would have been considered sufficiently 'low' for a particular type of facility prior to an
'accident' might not be considered sufficient for other generally similar facilities after an
accident. Yet there will be very considerable societal and political pressures for changing
the acceptance criteria. Is it appropriate to do so? Following an accident, there is, usually, a call for an investigation, better safety measures,
more conservative design approaches, better emergency procedures etc. However, some
accidents must be expected. The fact that it is admitted at the consent, approval or design
stage of a project that there is a finite probability of failure associated with the project
implies that an accident is likely to occur sooner or later. The fact that the probability might
have been shown to be extremely low does not alter this fact. Perhaps unfortunately,
probability theory cannot suggest, usually, when an event might occur. Rationality demands
that 'knee-jerk' political and regulatory responses might well be inappropriate—yet this is
implicit in the 'reasonable' and 'practical' aspect of ALARP.
11 RE A D I N G 2 .2 ON T HE ALARP
AP P R O AC H T O
R I S K
M AN AG E M E N T
UN
IT 4
15
E
NG
INE
ER
ING
RIS
K M
AN
AG
EM
EN
T
6. DISCUSSION AND POSSIBILITIES
In science, it is recognized that progress comes in relatively slow steps, learning by trial-
and-error and modifying the body of theory and understanding in the light of apparent
contradictions. Similarly, in the more practical arts such as engineering, progress comes
about through a slow progression, carefully learning from past mistakes. Major problems in
engineering are likely when past observations and understanding appear to have been
forgotten or ignored.22,23 It may be that an appropriate strategy for risk management lies
along these lines also. Moreover, it is increasingly being recognized that such matters are
best treated using risk analysis and that risk analysis is best performed using probabilistic
methods.24 Even then, the issues dealt with in probability-based risk management have, however, an
added problem when it has to deal with low probability—high consequence events. These,
morally and practically, do not allow the luxury of a trial and error learning process. There
may be just too much at stake—hence advocates of the 'precautionary principle'.
Nevertheless, it is generally the case that the technology involved is not totally new but
rather is a development of existing technology for which there is already some, or perhaps
already extensive, experience. Associated with that existing technology are degrees of risk
acceptance or tolerance reflected in the behavior of society towards them. It is then
possible, in principle, to 'back-calculate'25,26 the associated, underlying, tolerance levels,
even if the analysis used for this purpose is recognized to be imperfect. The new
technology should now be assessed employing, as much as possible, the information used to
analyze the existing technology and using a risk analysis methodology, as much as possible,
similar in style and simplifications to that used to determine the previous tolerance levels. The process sketched above is one which elsewhere has been termed 'calibration'25,26, i.e.
the assessment of one project against another, minimizing as much as possible the
differences in risk analysis and data bases and not necessarily attempting to closely anchor
the assessment in societal tolerable risk levels. The risk levels employed are derived from
previously accepted technology only, using admittedly simplified models, and are of a
nominal nature, having no strong validity outside the framework in which they have been
employed. A somewhat similar approach is already implicit in the nuclear industry, with professionally
agreed or accepted models being used for probability and other representations and with a
strong culture of independent ('peer') reviews of risk analyses. The resulting probability
estimates are likely to be internally consistent, and to have a high degree of professional
acceptance, even though they may not relate very closely to underlying (but perhaps
unknowable) probabilities of occurrence. 7. CONCLUSIONS
Risk management should embody fundamental principles such as societal participation in
decision-making. It is recognized that this may be difficult for a variety of reasons and that
alternative decision-making procedures are required. The current trend appears to be one of
increasing involvement of regulatory authorities, with acceptance criteria not always open
to the public or the applicants and in some cases settled by negotiation. This is also the case
with the ALARP approach. It is suggested that there are a number of areas of concern
about the validity of this approach. These include representativeness, morality, philosophy,
political reality and practicality. It is suggested that risk assessments recognize peer review
and the incremental nature of technological risks.
12 RE A D I N G 2 .2 ON T HE ALARP
AP P R O AC H T O
R I S K
M AN AG E M E N T
UN
IT 4
15
E
NG
INE
ER
ING
RIS
K M
AN
AG
EM
EN
T
ACKNOWLEDGEMENTS
The support of the Australian Research Council under grant A89918007 is gratefully
acknowledged. Some parts of this paper appeared in an earlier conference contribution.
The author appreciates the valuable comments on a number of issues made by the
reviewers. Where possible their comments have been addressed.
REFERENCES
1. Royal Society Study Group. Risk: analysis, perception and management, Royal
Society, London (1992).
2. Cullen The Hon. Lord. The public inquiry into the Piper Alpha disaster, HMSO,
London (1990).
3. HSE. The tolerability of risk from nuclear power stations, Health and Safety Executive,
London (1992).
4. Kam JCP, Birkinshaw M, Sharp JV. Review of the applications of structural reliability
technologies in offshore structural safety. Proceedings of the 1993 OMAE, vol. 2,
1993. p. 289–96.
5. C.J.H. Vlek and P.J.M. Stallen, Rational and personal aspects of risk. Acta
Psychologica (1980), vol. 45, pp. 273–300.
6. M.G. Stewart and R.E. Melchers. Probabilistic risk assessment of engineering systems,
Chapman and Hall, London (1997).
7. N. Oreskes, K. Shrader-Frechette and K. Belitz, Verification, valididty, and
confirmation of numerical models in the earth sciences. Science. (1994), 263:4 pp.
641–646.
8. K. Popper The logic of scientific discovery. Basic Books: New York.
9. K. Popper. The growth of scientifc knowledge, Basic Books, New York (1963) (see
also Magee B., Popper. Fontana Modern Masters, 1987).
10. T.S. Kuhn. The structure of scientific revolution, University of Chicago Press, Chicago,
IL (1970).
11. J.R. Ravetz. Scientific knowledge and its social problems, Clarendon Press, Oxford
(1971).
12. S.R. Watson, The meaning of probability in probabilistic safety analysis. Reliability
Engineering and System Safety (1994), vol. 45, pp. 261–269.
13. P.J.M. Stallen. In: J. Conrad, Editor, Risk of science or science of risk? Society,
technology and risk assessment, Academic Press, London (1980), pp. 131–148.
14. D.I. Blockley, Editor, Engineering safety, McGraw-Hill, London (1990).
15. M. Pusey. Jurgen Habermas, Ellis Horwood/Tavistock, Chichester, UK (1987).
16. F. Layfield. Sizewell B public inquiry: summary of conclusions and recommendations,
HMSO, London (1987).
17. B. Wynne. In: J. Conrad, Editor, Society and risk assessment—an attempt at
interpretation, Society, technology and risk assessment. Academic Press, London
(1980), pp. 281–287.
13 RE A D I N G 2 .2 ON T HE ALARP
AP P R O AC H T O
R I S K
M AN AG E M E N T
UN
IT 4
15
E
NG
INE
ER
ING
RIS
K M
AN
AG
EM
EN
T
18. J.R. Lischka. Ludwig Mond and the British alkali industry, Garland, New York (1985).
11. N.J. Stat. Ann. 13:1E–59.d. (West Supp. 1985); see also N.J. Stat. Ann. 13:1E–60.c.(4)
(West Supp. 1985).
12. See Starr supra note 9.
13. Slovic, Fischoff, Layman & Coombs, "Judged Frequency of Lethal Events," 4 Journal
of Experimental Psychology: Human Learning and Memory 551–578 (1978).
14. D. Morell & C. Magorian, "Siting Hazardous Waste Facilities: Local Opposition and
the Myth of Preemption," at 74 (1982).
15. Id.
16. Goldensohn, "Opponents, Officials Charge Politicizing of Waste Site Debate," Star-
Ledger (Newark, NJ), Dec. 12, 1984, at 12.
17. M. Karlins & H. Abelson, Persuasion, at 62–67 (2d ed. 1970).
18. See Dodd, "The New Jersey Hazardous Waste Facilities Siting Process: Keeping the
Debate Open" in this issue.
19. See supra note 11.
20. See Response to Comments on "Draft" Hazardous Waste Facilities Plan Issued
September 1984 (Mar. 26, 1985) (copies available from the Siting Commission, CN–
406, Trenton, NJ 08625).
21. S. Arnstein, "A Ladder of Citizen Participation," in The Politics of Technology,
at 240–43 (1977).
22. Id.
23. Id.
24. Id.
25. See Duffy, 11 B.C. Env. Affairs L. Rev. 755, 755–804 (1984).
26. Id.
27. Id.
28. D. Morell & C. Magorian, supra note 14, at 102.
29. N.J. Stat. Ann. 13:1E–80.b. (West Supp. 1985).
30. N.J. Stat. Ann. 13:1E–62 (West Supp. 1985) ("Joint and several strict liability of
owners and operators").
Source: Seton Hall Legislative Journal, Spring 1986: 437–465,
http://www.psandman.com/articles/seton.htm
(accessed 4 September 2006).
SU G G E S T E D A N S W E R S
EXERCISE
2.1 Applying the systems approach to managing risk
Note: There is no such thing as a single complete answer for this exercise. Your responses
will depend on the assumptions you make about each situation.
1. Pipeline maintenance contractor
a) Reasons the organisation should adopt a three-dimensional systems approach to risk
management.
In most countries the company would need to comply with legislative and
regulatory requirements to protect the health and safety of employees, the public
and the biophysical environment.
If the company is operating in a common law country it will have an additional
common law duty of care obligation to employees and the public.
Given the nature of the work, a commitment to risk management may be imposed
by the principal or owner of the gas pipelines, in which case the contractor has to
follow it or forfeit the contract.
As a small business with limited resources it is critical that the contractor allocate
risk management resources in the most cost- and time- effective manner.
A systematic approach to risk management is likely to assist in minimising the
contractor's insurance costs.
b) (i) System definition and risk management objectives
The system consists of the high-pressure gas pipeline, valve stations, compressor
station, associated instrumentation and monitoring system.
The risk management objectives for the maintenance contracting company are to:
provide an efficient maintenance service to the pipeline owner and ensure the
continuation of the contract
provide a safe working environment for their employees
control the level of resources that are spent on risk management.
(ii) Hazards and potential loss events
Hazards Potential loss events
Human error Failure to detect and report pipeline deterioration during inspections results in liability for loss of asset/gas supply interruption
Inadvertent third party interference by excavation etc.
Failure to prevent third party interference results in liability for damage to pipeline and gas supply interruption
Flammability of gas under high pressure
Fire/explosion resulting in employee/public injuries/fatalities and loss of assets
Terrain Employee injury/fatality due to working in difficult conditions/undertaking pipeline surveillance from a helicopter/light plane
Employee availability Inability to supply maintenance personnel on call in an emergency results in liability for delays in restoring supply
2 .2 TO P I C 2 SU G G E S T E D
AN S W E R S
UN
IT 4
15
E
NG
INE
ER
ING
RIS
K M
AN
AG
EM
EN
T
(iii) Information required to estimate the severity and likelihood for each of the
potential loss events
Cost of gas supply interruption per day to the owner which could be passed on
to the maintenance contractor.
Land uses along the pipeline corridor that could cause third party interference.
Likely extent of damage should third party interference occur.
Likely extent of damage should a fire or explosion occur.
Cost of workers compensation and rehabilitation for injured employees.
2. Equipment fabricator
a) Reasons the organisation should adopt a three-dimensional systems approach to risk
management.
In most countries the company would need to comply with legislative and
regulatory requirements to protect the health and safety of employees and the
public.
If the company is operating in a common law country it will have an additional
common law duty of care obligation to employees and the public.
As a small business with limited resources it is critical that the company allocate
risk management resources in the most cost- and time- effective manner.
A systematic approach to risk management is likely to assist in minimising
insurance costs.
Prevention of loss events through risk management leads to increase profitability
by minimising asset loss and business interruption.
Prevention of loss events protects the company's reputation and will assist it in
gaining and keeping clients.
b) (i) System definition and risk management objectives
The system consists of equipment design, fabrication shop, materials store, testing
and inspection area, and product storage area.
The risk management objectives are ensure the delivery of quality products on time
and according to specifications.
(ii) Hazards and potential loss events
Hazards Potential loss events
Human error Design error or incorrect selection of material leading to product of the wrong specification
Fumes, noise Employee injury
Welding process Employee spark injuries; equipment failure due to incorrect welding technique; fire in fabrication shop/warehouse resulting in loss of assets and employee injuries/fatalities
Testing process Failure to perform testing to required standard; damage to products during testing process
Materials availability Problems in supply of materials for fabrication causing delays in production and delivery
Employee availability Strikes/illness causing delays in production and delivery
Transportation of equipment to clients
Accident resulting in equipment/vehicle damage and/or employee/general public injury/fatality
2.3 TO P I C 2 SU G G E S T E D
AN S W E R S
UN
IT 4
15
E
NG
INE
ER
ING
RIS
K M
AN
AG
EM
EN
T
(iii) Information required to estimate the severity and likelihood for each of the
potential loss events
Historical data on the rate and cost of human errors.
Historical data on the lost time injury rate.
Cost of workers compensation and rehabilitation for injured employees.
Likely extent of damage should a fire occur.
Historical data on employee strike actions.
Data regarding the reliability of suppliers.
Current skill level of employees.
3. Chemicals warehousing and distribution facility
a) Reasons the organisation should adopt a three-dimensional systems approach to risk
management.
In most countries the company would need to comply with legislative and
regulatory requirements to protect the health and safety of employees, the public
and the environment.
If the company is operating in a common law country it will have an additional
common law duty of care obligation to employees and the public.
As a small business with limited resources it is critical that the company allocate
risk management resources in the most cost- and time- effective manner.
A systematic approach to risk management is likely to assist in minimising
insurance costs which are likely to be significant for chemicals storage.
Prevention of loss events is essential to protect the company's reputation and
maintain and build clients.
A major loss event for this type of company could easily result in bankruptcy.
b) (i) System definition and risk management objectives
The system includes the warehouse complex, the products stored, and the receipt
and dispatch area.
The risk management objectives are to:
operate the facility safely without a major incident
accommodate the client storage and dispatch requirements on an 'as needed'
basis.
(ii) Hazards and potential loss events
Hazards Potential loss events
Flammable chemicals Fire/explosion where flammable chemicals are transported/stored resulting in toxic fumes, employee/public injuries/fatalities, damage to storage facility, asset loss/business interruption for clients, damage to the biophysical environment through firewater runoff
Toxic/corrosive chemicals Storage containers break/leak causing injury to employees from exposure to chemicals, damage to storage facility, asset loss/business interruption for clients
Human error Asset loss from storage of incompatible goods in the same storage location
Transportation of chemicals for clients
Accident resulting in fire, equipment/vehicle damage, employee/general public injury/fatality, damage to the biophysical environment
2 .4 TO P I C 2 SU G G E S T E D
AN S W E R S
UN
IT 4
15
E
NG
INE
ER
ING
RIS
K M
AN
AG
EM
EN
T
(iii) Information required to estimate the severity and likelihood for each of the
potential loss events
Historical data on the rate of major loss events for this facility and for other
similar facilities.
Cost of business interruption per day to the company.
Cost of business interruption per day to each client.
Likely extent of damage should a fire or explosion occur.
Likely extent of damage should containers break/leak occur.
Historical data on the lost time injury rate.
Cost of workers compensation and rehabilitation for injured employees.
4. Fire protection systems custom design and construction
a) Reasons the organisation should adopt a three-dimensional systems approach to risk
management.
In most countries the company would need to comply with legislative and
regulatory requirements to protect the health and safety of employees, the public
and the environment.
If the company is operating in a common law country it will have an additional
common law duty of care obligation to employees and the public.
As a small business with limited resources it is critical that the company allocate
risk management resources in the most cost- and time- effective manner.
A systematic approach to risk management is likely to assist in minimising
insurance costs.
Prevention of loss events is essential to protect the company's reputation and
maintain and build clients.
b) (i) System definition and risk management objectives
The system consists of critical evaluation of customer needs, design of the fire
protection system, procurement and installation, testing and commissioning,
handover.
The risk management objective is to provide a 'fit for purpose' fire protection
system design that is reliable and effective.
(ii) Hazards and potential loss events
Hazards Potential loss events
Client consultation/custom specifications
Incorrect understanding of customer needs resulting in ineffective design of fire protection system, modifications delaying system implementation and liability for client losses sustained in the event of a fire
Component quality and availability
Problems in supply of required components that meet quality standards causing delays in installation of the system
System installation Incorrect installation of fire protection system resulting in liability for client losses sustained in the event of a fire
(iii) Information required to estimate the severity and likelihood for each of the
potential loss events
Data regarding the reliability of suppliers.
Cost to the company of modifying a system after installation.
Cost of business interruption per day to each client.
TO P I C 3
IDENTIFYING HAZARDS AND POTENTIAL LOSS EVENTS
Preview 3.1 Introduction 3.1 Objectives 3.1 Required reading 3.1 Coupling and interactions 3.2 Engineering system components 3.2 Linear interactions 3.4 Complex interactions 3.5 Hazard identification techniques 3.10 Past experience 3.10 Checklist reviews 3.11 Failure modes and effects analysis (FMEA) and failure modes, effects and criticality analysis (FMECA) 3.12 Hazard and operability study (HazOp) 3.16 Preliminary hazard or safety analysis 3.22 Scenario-based hazard identification 3.27 Summary 3.27 Exercises 3.28 References and further reading 3.31 Readings Suggested answers
3.1 TO P I C 3 ID E N T I FY I N G
HAZ AR D S AN D
P O T E N T I AL LO S S
E V E N T S
UN
IT 4
15
E
NG
INE
ER
ING
RIS
K M
AN
AG
EM
EN
T
PR E V I E W
INTRODUCTION
In the risk management framework described in Topic 2, the first two steps are:
1. Define system and risk management objectives.
2. Identify hazards and potential loss events.
Systematic identification of hazards and potential loss events is one of the crucial steps in
risk management. It can yield a wealth of information for the risk management team and
form the basis on which the risk management plan is developed.
In this topic we will explore how to define a system and its risk management requirements,
and how to select and apply appropriate techniques for identifying hazards and potential
loss events. The techniques we will examine can be applied across a range of industries,
once their philosophy is understood.
For the purposes of this topic, the meaning of the word 'hazard' has been stretched to its
limit to encompass anything that has the potential to cause some form of loss, regardless of
the specific nature of that loss. For example, in project risk management, anything that
might cause a project to fail to meet its performance objectives is a hazard because the
outcome is likely to be a financial loss or project delays. Note that textbooks on project risk
management may not necessarily use the term hazard in this way. Another term commonly
used is 'threat', which is broader and not specific to safety.
OBJECTIVES
After studying this topic you should be able to:
define an engineering system and its risk management objectives
understand both linear and complex interactions in engineering systems
outline the various structured techniques available for hazard identification
outline the advantages and limitations of each technique, and select and use the
appropriate technique for a given engineering context
identify contributors to hazards so that prevention and/or mitigation measures may be
developed for managing the risk.
REQUIRED READING
Reading 3.1 'Hazard identification checklists'
Reading 3.2 'Software FMEA Techniques'
Reading 3.3 'Hazard and operability (HAZOP) studies applied to computer-controlled
process plants'
Reading 3.4 'Using a modified Hazop/FMEA methodology for assessing system risk'
Reading 3.5 'Preliminary safety analysis'
3 .2 TO P I C 3 ID E N T I FY I N G
HAZ AR D S AN D
P O T E N T I AL LO S S
E V E N T S
UN
IT 4
15
E
NG
INE
ER
ING
RIS
K M
AN
AG
EM
EN
T
CO U P L I N G A N D I N T E R AC T I O N S
A review of major accidents in engineering enterprises raises the following questions:
What kinds of systems are most prone to system accidents?
Why were these events not anticipated and identified?
Why is it that in those situations where the event was identified as a potential hazard,
though remote, no action was taken by management? The answers lie in the fact that modern industrial systems are strongly coupled and have
significant interactions. Failure to identify these couplings and interactions often results in
the hazard escaping the scrutiny of analysts.
Before we discuss hazard identification techniques it is therefore necessary to gain an
understanding and appreciation of these couplings and interactions. ENGINEERING SYSTEM COMPONENTS
In order to analyse interactions, it is useful to think of an engineering system as having six
subsystems—Design, Equipment, Procedures, Operators, Supplies and materials, and
Environment. This is sometimes referred to as the DEPOSE framework (Perrow, 1999: 77).
Design
The design of an engineering system includes the following:
philosophy of how a set of inputs (e.g. raw materials) can be transformed into a set of
outputs (e.g. goods or services)
the production capacity
codes and standards applicable to the design
the specification for various equipment items required, including constraints and
tolerances
quality assurance of the design process.
A design error, if not identified at this stage, can propagate through the other subsystems
and ultimately result in a major loss event.
Equipment
The plant and equipment required to produce the outputs must be:
fit for purpose
in conformance with design specifications
quality assured
inspected, tested and properly maintained.
Fitness for purpose is an important criterion. This is illustrated in the following example.
Example 3.1
In 1998, the fuel tanker ship Westralia of the Royal Australian Navy underwent
some modifications to the fuel system in the engine room. A flexible line was
installed. When put back into operation, the line failed, resulting in a major engine
room fire, killing four naval personnel. Subsequent public inquiry found that the
flexible line installation process was flawed as no stress analysis had been carried
out, and that the modified equipment was not fit for purpose.
3.3 TO P I C 3 ID E N T I FY I N G
HAZ AR D S AN D
P O T E N T I AL LO S S
E V E N T S
UN
IT 4
15
E
NG
INE
ER
ING
RIS
K M
AN
AG
EM
EN
T
Procedures
Once the equipment is installed, a set of procedures is required for operation and
maintenance of the equipment. These include:
operating procedures and work instructions
maintenance procedures including preventive maintenance schedules
manufacturer-recommended practices
emergency procedures in the event of an operational deviation. The operating procedures not only ensure that production proceeds routinely, but also
establish that the system can be started up and shut down safely. Similarly, the maintenance
procedures are designed to ensure that, at the end of the maintenance and handover to
production, the equipment is fit for purpose.
Operators
Next in the chain of subsystems are the human resources required to operate the production
process and maintain the plant and equipment. It is critical that all personnel are:
qualified for the duties required of them
trained in the operating and maintenance procedures
trained to identify potential operational deviations, and respond correctly to alarms, etc.
involved in regular emergency drills and exercises to reinforce the response plan. Human errors have contributed to many industrial accidents. There should be
reinforcement of the operating limits of the plant, i.e. a plant should not be operated outside
its design parameters.
Supplies and materials
Once the plant is built to a certain design, and the operators are trained, a supply of
materials is required to perform production. These include:
raw materials and storage
other accessories to production
material testing facilities (e.g. laboratory)
finished goods and storage
equipment spare parts
quality control of materials. Many production problems may be attributed to changes in the material supplied for which
the plant was not designed.
Environment
The operating environment forms the final important subsystem. It includes both the
workplace environment and the external environment.
Workplace environment
The workplace environment is important in influencing the attitudes and aptitudes of
operators. The major parameters are:
workplace aesthetics and ergonomics—an unpleasant, uncomfortable or poorly
designed working environment can lead to lower productivity, lower levels of
employee commitment and increased workplace injuries and illnesses
3 .4 TO P I C 3 ID E N T I FY I N G
HAZ AR D S AN D
P O T E N T I AL LO S S
E V E N T S
UN
IT 4
15
E
NG
INE
ER
ING
RIS
K M
AN
AG
EM
EN
T
management commitment—if the top management of an organisation does not
sincerely believe that safety and loss prevention are 'good business', the message is
unlikely to pass down to the workforce, despite the best efforts of middle management
quality systems and procedures—a well developed quality system with supporting
procedures and training improves the workplace environment and provides operational
efficiency
organisational culture and workplace climate—people will tend to respond to situations
in accordance with cultural and workplace norms, for example, Australians tend to be
individualistic and perceive a relatively flat power gradient between manager and
subordinate, so if they are given a directive they believe to be either impractical or
unsafe they will tend to assess the situation and do it their own way.
External environment
A number of elements in the external environment affect the overall operating environment
of an organisation. These include:
legislative and regulatory requirements—as we discussed in Topic 2, all industrialised
countries and most developing countries require organisations to protect the health and
safety of their employees, the public and the environment
changes in the marketplace—these may include new players entering the market and
new technology threatening loss of market share, however, as these are business risks
rather than engineering risks, they will not be discussed in detail in this topic
public perception and the political environment—as we mentioned in Topic 2, these
can significantly affect an organisation by preventing projects from proceeding or
leading to changes in legislative requirements which may increase operating costs.
LINEAR INTERACTIONS
All the subsystems in our DEPOSE framework interact with one another. Since one is
dependent on the other in a more or less linear chain—i.e. design leading to equipment
specification, development of procedures, selection and training of operators, ordering of
supplies, and operating in a given environment—Perrow (1999: 78) terms these 'linear
interactions' and defines them as follows:
'Linear interactions are those in expected and familiar production or maintenance sequence, and those that are quite visible even if unplanned'.
It is essential to note that the notion of a linear system in this context does not mean the
physical layout of the plant or production processes, nor does it mean an assembly line.
The main import of a linear system is that a subsystem tends to interact mainly with one
other subsystem in a visible manner.
Linear interactions predominate in all systems, and the first step in hazard identification for
engineering risk management is the recognition of all linear interactions, and the provision
of adequate decoupling to minimise these interactions. Example 3.2
Let us consider a factory that manufactures detergents and operates continuously 24
hours a day. The factory has three major production units:
1. A manufacturing unit that produces the detergent base.
2. A processing unit that mixes the detergent base with additives to create liquid or
powder detergents.
3. A packaging, warehousing and dispatch unit.
3.5 TO P I C 3 ID E N T I FY I N G
HAZ AR D S AN D
P O T E N T I AL LO S S
E V E N T S
UN
IT 4
15
E
NG
INE
ER
ING
RIS
K M
AN
AG
EM
EN
T
The three units are linearly coupled because the output of one unit becomes the input
of the next. This means that if the manufacturing unit has to shut down production
due to operating or maintenance problems, the other two units will also have to shut
down as they will have no inputs to work with. This is a business interruption risk.
The interaction can, however, be decoupled by providing intermediate buffer storage
for the detergent base so that if Unit 1 is shut down for a period, there would be
sufficient buffer inventory of the product to feed Unit 2. This storage capacity could
also be used to keep Unit 1 operating in the event that Unit 2 was shut down for a
period and could not immediately use the detergent base. The decoupling of Units 1
and 2 via the intermediate buffer storage thus becomes critical in minimising
business interruption risk, and good risk management would consider possible shut
down reasons and durations and ensure that the buffer storage capacity is designed to
cope with this contingency.
A C T I V I T Y 3 . 1
Look up the US Chemical Safety and Investigation Board website at
http://www.csb.gov and go to their Video Room. Download and view the video
titled 'Dangers of Flammable Gas Accumulation: Acetylene Explosion at ASCO,
Perth Amboy, New Jersey'. Consider this event in terms of the DEPOSE
components presented earlier. Is this event an example of linear interactions causing
an explosion?
COMPLEX INTERACTIONS
Whilst 99% of the interactions in most operations are linear, 1% are complex, and it is these
that pose the greatest risk. Many major industrial accidents have occurred, and many lives
have been lost, because the 1% of complex interactions escaped scrutiny.
Complex interactions are those in which one component can interact with one or more
components outside of the normal production sequence, sometimes by design but often
unintentionally. Perrow (1999: 78) defines these as follows:
'Complex interactions are those of unfamiliar sequences, or unplanned and unexpected sequences, and either not visible or not immediately comprehensible.'
The main problems that can arise from complex interactions are common mode failures,
human error and hidden interactions.
Common mode failures
Common mode failures, or dependent failures, refer to the simultaneous failure of multiple
components or systems due to a single, normally external, cause. They can be distinguished
from discrete single mode failures of individual components or systems that are caused by a
defect arising locally within that component or system.
Recognition of common mode failure at the design and operational stages, and provision of
an inherently robust design backed up with error diagnostics and operator training, is
critical in managing engineering risks. However, the increasing complexity of modern
technology makes this recognition difficult unless significant effort is directed towards it.
Because of the importance of common mode failures, some examples are provided to
illustrate the concept.
3 .6 TO P I C 3 ID E N T I FY I N G
HAZ AR D S AN D
P O T E N T I AL LO S S
E V E N T S
UN
IT 4
15
E
NG
INE
ER
ING
RIS
K M
AN
AG
EM
EN
T
Example 3.3
In the early days of motor vehicle design, there was a single master cylinder for
hydraulic brakes. A single failure in the hydraulic line from the cylinder would
disable all the brakes at the same time. This is a common mode failure.
To overcome this problem, Volvo designed a brake system with dual master
cylinders, but with each cylinder supplying fluid to one front brake and its diagonally
opposite rear brake. This way, if a failure occurs in one cylinder, at least one brake
at both the front and rear remain operational.
Example 3.4
There are two chemical reactors in a facility. In Reactor A, heat is created by the
reaction and has to be removed to maintain the reactor operation within a small
temperature range. A heat exchanger (cooling coil) is installed to remove the heat,
and at the same time raise steam. This is quite common in process plants.
However, if this steam is utilised somewhere else in the process, there is significant
energy saving, reducing production costs. In this facility the steam is used to drive a
steam turbine pump that pumps one of the raw materials to Reactor B, at some
distance away. The system is schematically shown in Figure 3.1.
Figure 3.1: Reactor heat removal system schematic
If the feedwater pump to the heat exchanger fails, this results in two problems at the
same time.
1. Heat is no longer removed from Reactor A, so if the reactor is not shut down
immediately, there could be a runaway reaction, resulting in an explosion.
2. There is no steam to drive the turbine pump, and one type of raw material is no
longer added to Reactor B, creating a separate set of problems.
The system design is energy efficient, but the coupling between units means the
interactions are now complex rather than linear and could cause common mode
failures.
Reactor A raw material feed
Reactor A
Cooling coil
Feedwater tank
Feedwater pump Steam separator
Steam trap
Steam turbine and pump
Reactor B
Reactor B raw material feed
Reactor Braw material
tank
3.7 TO P I C 3 ID E N T I FY I N G
HAZ AR D S AN D
P O T E N T I AL LO S S
E V E N T S
UN
IT 4
15
E
NG
INE
ER
ING
RIS
K M
AN
AG
EM
EN
T
Example 3.5
In a fire protection system design, the designer decided to install two firewater
pumps (redundancy), so that in the event of one pump failing, the second one could
operate and provide the necessary water for fire fighting. There are three choices as
to how to do this.
a) Provide two electric motor driven pumps. The common mode failure problem
in this design is that if there is a power failure, both pumps are disabled. Fire
service authorities have recognised this problem and generally do not approve a
two-electric pump installation.
b) Provide two diesel engine driven pumps. This makes the system independent of
power failures. However, a single diesel storage tank is provided from which
the engines draw fuel. The common mode failure in this design is that if the fuel
runs out, both pumps are disabled. Regular inspection checks and topping up of
the fuel tank are essential to maintain integrity.
c) Provide one electric pump and one diesel pump. This system decouples the
common mode and provides a higher reliability.
A common mode could still be the main water valve in the common manifold for the
pumps; if this valve fails to open, no water is delivered, even if the pumps operate.
An important observation may be made from these examples:
The more coupled a system is, the more the chance of a common mode failure. The
design should therefore cater for decoupling as much as possible and, if this is not
possible, provide fallback systems for failures.
Human error
A complex system does not run by itself, it needs humans to operate it. Whilst equipment
failure rates have decreased from better engineering, some major catastrophes involving
modern technology have highlighted the importance of human error. For example, a major
contributor to the Chernobyl disaster was undue reliance on operating rules in the design,
and improper plant operation. Similarly, the equipment failure in the space shuttle
Challenger crash was augmented by complacency in management and pressure to meet
deadlines (Feynman, 1988).
Very often, post-disaster inquiries find human error was a major contributor, and the
organisation reacts with more procedures, more training and more discipline. However, the
coupling of human interactions with a sophisticated high technology production process is
highly non-linear, and human error is just one factor in a set of complex interactions.
When assessing human error rates there are a number of key references in the field of
human reliability assessment (HRA) including the seminal US nuclear reactor safety study
(United States Atomic Energy Commission, 1974), Lees (1996) and Kirwin (1994).
The figures in the following table show the failure rate of humans performing different tasks
recorded in the 1974 US nuclear reactor safety study.
3 .8 TO P I C 3 ID E N T I FY I N G
HAZ AR D S AN D
P O T E N T I AL LO S S
E V E N T S
UN
IT 4
15
E
NG
INE
ER
ING
RIS
K M
AN
AG
EM
EN
T
Table 3.1: Human error rates
Type of activity Probability of error per task
Critical Routine Task (tank isolation) Non-Critical Routine Task (misreading temperature data) Non Routine Operations (start up, maintenance) Check List Inspection Walk Around Inspection High Stress Operations; Responding after major accident – first five minutes – after five minutes – after thirty minutes – after several hours
0.001 0.003 0.01 0.1 0.5 1 0.9 0.1 0.01
Source: United States Atomic Energy Commission 1974, Table 1: Human Error Rates.
The 'critical routine task' described in Table 3.1 can be compared to driving through a red
traffic signal in a car. Most of us will have done this once in our lives. It is something we
have been trained not to do but despite our best efforts we occasionally get it wrong.
Human error does not have to be confined to making a mistake. In some cases, inaction can
cause a problem. For example, in Example 3.5, if the feedwater pump fails the alarms from
both reactors will sound in the control room. This may confuse the operator since it is an
unexpected interaction between two normally independent subsystems, Reactors A and B.
If the operator is unable to establish the common mode link and take appropriate action
quickly, Reactor A will experience a runaway reaction and explode.
Recognising the human error failure modes in the operation of a complex system, and
countering them as much as possible by engineering design and better information
management, contributes greatly to minimising risks. Trying to eliminate human error
through training and procedures soon reaches the point of diminishing returns. Total
elimination of human error is impossible, and this should be recognised and acknowledged.
Hidden interactions
If a complex interaction can be identified it can be dealt with using design and procedures.
However, not all complex interactions are visible. Hidden interaction is an important
attribute of complex systems, and this has only been adequately recognised in the aftermath
of some terrible industrial disasters such as those discussed in the following examples.
Example 3.6: Flixborough
On June 1 1974, a major explosion occurred in a chemical plant at Flixborough,
England. Its aftermath had long-term consequences for the industry.
The plant produced a monomer caprolactum for the manufacture of nylon. This
requires oxidation of cyclohexane. The reaction was carried out in a cascade of six
reactors in series, each successive reactor located at a slightly lower level than its
predecessor.
Reactor No. 5 had to be taken out of service for corrosion related repairs, and the
decision was made by the management to connect Reactor No. 4 to No. 6 and
continue production. No one 'appears to have appreciated that the connection of
No. 4 reactor to No. 6 reactor involved any major technical problems or was
3.9 TO P I C 3 ID E N T I FY I N G
HAZ AR D S AN D
P O T E N T I AL LO S S
E V E N T S
UN
IT 4
15
E
NG
INE
ER
ING
RIS
K M
AN
AG
EM
EN
T
anything other than a routine plumbing job' (United Kingdom Department of
Employment, 1975). Minimising production delay was important, and the temporary
modification was conducted 'as a rush job'. No drawing was made, nor any
calculation of strain on the pipework, and the designer's guide for such a bypass was
not consulted.
The plant operated with minor problems for about two months until June 1 1974,
when the temporary 500 mm diameter connection between Reactors 4 and 6 failed,
resulting in an explosive gas cloud of approximately 30 tonnes of cyclohexane being
released into the atmosphere. The gas cloud ignited and exploded. The force of the
blast was estimated to be that of 15 to 45 tonnes of TNT.
The blast killed 28 employees and injured another 36. Beyond the plant boundary,
53 people were injured according to official records, and many more suffered
unreported injuries. The plant was destroyed, and in the surrounding community at
least three houses were demolished and approximately 2 000 homes sustained some
form of damage, including some with broken windows as far as 2.5 km away.
A commission of inquiry identified the main factors that contributed to the event as
organisational ineptitude, shortage of engineering expertise, production pressures
dictating hasty decisions and failure to get expert advice (United Kingdom
Department of Employment, 1975). A number of recommendations arose from the
inquiry, and these were later reflected in the Control of Industrial Major Accident
Hazards (CIMAH) legislation in the UK, which was a precursor to the later Control
of Major Accident Hazards (COMAH) regulations. Example 3.7: Piper Alpha
An explosion occurred on the Piper Alpha oil and gas platform in the North Sea in
1988. One of the platform's two large compressors had been isolated for
maintenance, and its pressure relief valve had been removed. The on-duty engineer
had filled out a form stating that the compressor was not ready and must not be
switched on under any circumstances, however this form was subsequently lost.
During the evening, the second operating pump failed and could not be restarted.
Not realising that the pressure relief valve had been removed from the compressor
isolated for maintenance, the evening shift personnel decided to use it and continue
the operation. When the compressor was started, gas leaked out, caught fire and
resulted in an explosion that destroyed the switch room.
Normally if a fire occurred, the platform's automatic fire-fighting system would
switch on and suck in large amounts of seawater to extinguish the flames. However,
on this occasion the system had been switched to manual because there were divers
in the water who could be sucked in with the seawater. The only way to manually
start the fire-fighting system was through the switch room, but the explosion in the
switch room made this impossible.
Staff gathered under the helicopter deck and in the living quarters because the fire
prevented them from getting to the lifeboat stations. The platform and living
quarters filled with smoke causing asphyxiation of personnel, but no evacuation
order was given.
After the first explosion, the Piper Alpha immediately stopped oil and gas
production to prevent new oil from feeding the fire. However, Piper Alpha was part
of a network of platforms and two other platforms continued to pump oil into the
network in accordance with management policies. A riser pipe connecting Piper
Alpha to one of the other platforms melted and tonnes of gas escaped. This caused a
much larger explosion that engulfed and destroyed the entire platform.
3 .10 TO P I C 3 ID E N T I FY I N G
HAZ AR D S AN D
P O T E N T I AL LO S S
E V E N T S
UN
IT 4
15
E
NG
INE
ER
ING
RIS
K M
AN
AG
EM
EN
T
Of the 229 crewmen on board, 167 were killed. A whole community was shattered
and a nation and the entire oil and gas industry were shaken.
Numerous interactions and factors contributed to this event. These included:
shift handover communication problems
equipment that was not fit for purpose
inadequate training for senior personnel on emergency management
management policies that failed to appropriately balance safety and productivity
facility design problems, including unrecognised (and unnecessary) couplings
and insufficient redundancies in safety systems. (Paté-Cornell, 1993)
A C T I V I T Y 3 . 2
Return to the Video Room in the CSB website and look at the video titled 'Explosion
at BP Refinery, Texas City, Texas'. This shows an example of complex interactions
involing procedural failures, component failures and human error.
A C T I V I T Y 3 . 3
Consider a work process with which you are familiar that involves complex
interactions. Using either your own sketch of the process or any available schematic
diagrams, try to identify any potential common mode failures, human errors or
hidden interactions that could occur. How does your organisation try to identify and
manage such problems?
HA Z A R D I D E N T I F I C AT I O N T E C H N I Q U E S
Hazard identification is a requirement of OHS legislation in most western countries. In this
section we will discuss each of the hazard identification techniques mentioned in Topic 2.
Remember that no single technique is capable of identifying the hazards and potential loss
events for all situations, so in every instance a combination of two or more techniques
should be used.
PAST EXPERIENCE
Past experience can be useful for identifying hazards and potential loss events, but it has
significant limitations and cannot be used in isolation, even when the system's interactions
are linear rather than complex.
The limitations associated with relying on past experience include:
a) Not all previous incidents may have been reported, and for those that were, the level of
detail recorded will depend on the organisational culture and systems in place.
b) It is unlikely that all credible threat scenarios for a plant or organisation have occurred
in the past.
c) The causes of past loss events are often complex and may not have been fully
established, particularly if evidence was destroyed in the incidents. Thus, past
experience may yield a list of incidents but no information about the sequence of events
that led to each incident, which is needed to identify possible preventive measures.
3 .11 TO P I C 3 ID E N T I FY I N G
HAZ AR D S AN D
P O T E N T I AL LO S S
E V E N T S
UN
IT 4
15
E
NG
INE
ER
ING
RIS
K M
AN
AG
EM
EN
T
d) Most organisations to do not publish information on incidents or things that go wrong
so there is limited information in the public domain. Generally, major incidents are
only fully analysed and publicly reported by those charged with responsibility for
investigation and enforcement. Useful information may be found in alerts and bulletins
issued by public authorities or in the transcripts of court cases.
CHECKLIST REVIEWS
A checklist is a list of questions about plant organisation, operation, maintenance, and other areas of concern. Historically, the main purpose for creating checklists has been to improve human reliability and performance during various stages of a project or to ensure compliance with various regulations and engineering standards. Each item can be physically examined or verified while the appropriate status is noted on the checklist. Checklists represent the simplest method used for hazard identification. (Hessian & Rubin, 1991)
Checklists are useful to ensure that various requirements have not been overlooked or
neglected both before and after activities such as concept design or construction are
complete. Such requirements may include those set out in engineering codes of practice
and statutory regulations.
There are nine steps involved in developing and carrying out checklist reviews.
1. Define the objectives of each checklist. What is its purpose, where will it be applied
and what is the expected outcome?
2. Identify the areas of content that each checklist must cover.
3. Identify any specialist areas of content where expert input may be needed. For
example, a design completion checklist might require expert input regarding
mechanical, electrical, civil, structural and process requirements.
3. Select and consult with expert personnel in each specialist area of content.
4. Develop a first draft of each checklist. Each checklist should begin with a statement of
objectives and contain a logical and systematic list of questions or requirements that is
divided into subsections as required. Tailor the level of detail in the checklist to the
complexity of the system—the test of whether to include an item is the extent to which
it contributes to achieving the checklist's objectives.
5. Organise for the draft checklists to be reviewed by people not involved in the drafting
process but who are familiar with the intended content. This will help to identify any
items that are missing, unclear, unnecessary or illogically ordered.
6. Revise the checklists to address issues raised by the reviewers.
7. Undertake a final 'walk through' of the checklists (i.e. physically check against each
checklist subject) to ascertain there are no gross omissions.
8. Finalise the checklists and put them into use.
9. Periodically review and revise the checklists as part of an ongoing cycle of continuous
improvement.
Examples of checklists are given in Reading 3.1. Whilst the details of their content relate
to the chemical process industry, the concepts they illustrate are relevant across other
engineering industries.
Advantages of checklist reviews
Checklists are rule-based and can be implemented by people with minimal training
once they have been developed by knowledgeable and experienced personnel.
Checklists provide a valuable audit tool for checking design items, construction items,
project handover, etc.
3 .12 TO P I C 3 ID E N T I FY I N G
HAZ AR D S AN D
P O T E N T I AL LO S S
E V E N T S
UN
IT 4
15
E
NG
INE
ER
ING
RIS
K M
AN
AG
EM
EN
T
Limitations of checklist reviews
Checklist items tend to depend largely on the existence of applicable codes and
standards and/or the knowledge and expertise of the preparer and the reviewers.
If checklists are prepared by inexperienced persons and/or are not independently
verified, any omitted items may go undetected.
Even where applicable codes and standards exist, these often cover 'minimum
requirements' and may be inadequate for the situation or activity. For example, the
separation distances specified in some codes for storage of flammable liquids are more
for protecting the facility from activities outside its site boundary than for protecting
the environment surrounding the facility from its hazardous activities.
Checklists focus on a single item at a time; they do not provide any insight into system
interactions or interdependencies.
Checklists merely provide the status of the item in question, but not the reasons for this
status. For example, if a checklist attribute is 'Compressor Running?' and the answer is
'No', this does not provide any insight into the reason for its failure.
Checklists do not rank the items in order of priority.
Checklists have to be very detailed and specific if they are to be used by 'non-experts'.
A C T I V I T Y 3 . 4
Using the methodology provided in this section, compile a checklist for identifying
hazards in a small section of your workplace. You may be able to find a checklist on
the internet which you can modify to suit your industry.
FAILURE MODES AND EFFECTS ANALYSIS (FMEA) AND FAILURE MODES, EFFECTS AND CRITICALITY ANALYSIS (FMECA)
The failure modes and effects analysis (FMEA) methodology is designed to identify
potential single failure modes that could cause an accident or loss event. The analysis
focuses on equipment failures and does not usually specifically consider human error,
except as a cause of an equipment failure mode. An extension of the FMEA methodology is
the failure modes, effects and criticality analysis (FMECA) in which the criticality of a
failure mode is assessed and used as a ranking tool.
A FMEA/FMECA is conducted by a small team of experienced people who are familiar
with the operation and plant equipment under investigation. The process is led by a team
leader and consists of the five key steps shown in Figure 3.2 and discussed in detail below.
The outcome is usually documented in the form of a datasheet such as the one shown in
Table 3.5 at the end of this discussion. Further examples of FMEA and FMECA datasheets
can be found at http://www.fmeainfocentre.com/examples.htm.
Step 1: Develop a block diagram system description
A block diagram or flow chart is used to identify and visually illustrate the system
components, limits and dependencies. The level of detail included in this diagram will
depend on the size and complexity of the system and the extent of analysis desired. As a
general rule it is not necessary to document the system sub-components (e.g. the individual
elements that make up a centrifugal pump) unless the sensitivity of application means there
is a specific need for it (e.g. nuclear or aerospace industry).
3 .13 TO P I C 3 ID E N T I FY I N G
HAZ AR D S AN D
P O T E N T I AL LO S S
E V E N T S
UN
IT 4
15
E
NG
INE
ER
ING
RIS
K M
AN
AG
EM
EN
T
Figure 3.2: Failure modes, effects and criticality analysis
Step 2: Identify potential failure modes
A failure mode is a way in which a piece of equipment or operation can fail. Typical failure
modes for system components are:
failure to open/close/start/stop or continue operation
spurious failure
degradation
erratic behaviour
scheduled service/replacement
external/internal leakage.
For example, failure modes for a belt conveyor system might include: belt snaps; roller
bearing fails; roller seizes; conveyor collapses.
Step 3: Identify potential causes of failure
There are many different causes of equipment failure, some of which relate to the materials
and mechanisms involved, and others of which relate to some form of human error. For
example, a centrifugal pump may stop working due to defective materials or the effects of
ageing (materials and mechanisms), but it may also stop due to poor maintenance or poor
workmanship (human error).
Step 4: Identify possible effects and criticality
The possible effects of the identified failure mode(s) for the specific piece of equipment
should be examined from multiple perspectives including safety to personnel, plant damage,
financial loss due to production interruption and environmental damage.
As part of this process, the probability of failure may be assessed based on typical values
derived from industry 'norms' such as those shown in Tables 3.2 and 3.3. The level of
criticality may also be determined based on the way the failure mode affects the system.
Develop a block diagram and system description
Identify potential failure modes
Identify potential causes of failure
Identify possible effects (and criticality)
Recommend possible actions
3 .14 TO P I C 3 ID E N T I FY I N G
HAZ AR D S AN D
P O T E N T I AL LO S S
E V E N T S
UN
IT 4
15
E
NG
INE
ER
ING
RIS
K M
AN
AG
EM
EN
T
Table 3.4 shows an example of a criticality ranking system based on that used by the US
Department of Defense.
Table 3.2: Qualitative measures of frequency (components) Rating of frequency Failures/hour of operation Probable 1 in 104 Reasonably probable 1 in 104 – 105 Remote 1 in 105 – 107 Extremely remote 1 in > 107
Table 3.3: Qualitative measures of frequency (human error) Rating of frequency/ performance
Situation Probability of error/operation
Low Routine 0.0001 – 0.001 High Emergency 0.1 – 0.9
Table 3.4: Qualitative measures of criticality Criticality classification Description of effects
Category 1: Catastrophic A failure which may cause death or [major property or system] loss.
Category 2: Critical A failure which may cause severe injury, major property damage, or major system damage that will result in major downtime or production loss.
Category 3: Marginal A failure which may cause minor injury, minor property damage, or minor system damage which will result in delay or loss of system availability or degradation.
Category 4: Minor A failure not serious enough to cause injury, property damage, or system damage, but which will result in unscheduled maintenance or repair.
Source: Based on United States Department of Defense, MIL-STD-1629A, 1980: 9–10.
The estimation of probability and criticality, which is covered in Topics 4 and 5, is not
essential to the process as the objective of the analysis is to scrutinize possible failure
modes and recommend actions to prevent them.
Step 5: Recommend possible actions
For each of the system components analysed a decision must be made as to the acceptability
of the potential failure modes and effects based on any existing controls in place. Existing
controls may include automatic system shutdown mechanisms or the ability of an operator
to respond in time. If the current situation is unacceptable then you will need to recommend
possible actions to reduce the probability of occurrence or severity of effects. Such actions
might include hardware changes or the introduction or modification of procedures.
3 .15 TO P I C 3 ID E N T I FY I N G
HAZ AR D S AN D
P O T E N T I AL LO S S
E V E N T S
UN
IT 4
15
E
NG
INE
ER
ING
RIS
K M
AN
AG
EM
EN
T
Table 3.5: Typical FMEA datasheet
Failure Modes & System Name: Precipitation Protector FMEA Number: ___________
Effects Analysis Major Function: Protect user from Rainfall Page: ____________________
Prepared By: Precipitation Protection Team Date: ____________________
Item Potential Failure Modes
Potential Causes of Failure
Possible Effects
Detection Method/ Design Controls
Additional Actions Recommended
Responsibility & Target Completion Date
Fabric Tear in protective fabric
Foreign sharp object damages material
User gets wet; fabric flaps and contacts user
Fabric must have high toughness and must withstand 5 N/mm^2 of pressure
Use material at least as strong as current umbrellas
Excessive tension on fabric when in use
Limit tension to 5 lb/f
Fabric separates from arm
Stitching breaks
User gets wet; fabric flaps and contacts user
Key life testing for operation (10 hr*300day*8yr=2 4000 hours)
Arms Arm of device breaks
User abuse during operation
User gets wet; fabric flaps and contacts user; arm swings and contacts user
Key life testing for opening and closing (8x*300day*8yr=19000 cycles
Evaluate possibility of thicker arms, or high strength materials
High winds Must withstand steady 30mph wind
Folding Mechanism
Folding mechanism jams
User improperly operates device
User can't fold or unfold device
Clarify instructions Poke Yoke process for operation Control clearance between cap and arms
Improper assembly of arm pivots and chassis
Revise assembly procedure
Tolerances of arm joints not correct
Re-tolerance arm joints
Insert falls out
Press fit of insert fails
Device falls apart
Re-tolerance insert-to-chassis joint
Advantages of FMEA/FMECA
FMEA/FMECA enables critical failures to be identified quickly and easily.
It is the most useful hazard identification technique for machinery and material
handling systems, for systems with predominantly linear or sequential interactions, and
for man/machine interactions.
FMEA/FMECA provides valuable information on the failure modes which can be used
in more sophisticated techniques such as fault tree analysis for quantification of system
failure frequency. This is described in Topic 5.
3 .16 TO P I C 3 ID E N T I FY I N G
HAZ AR D S AN D
P O T E N T I AL LO S S
E V E N T S
UN
IT 4
15
E
NG
INE
ER
ING
RIS
K M
AN
AG
EM
EN
T
Limitations of FMEA/FMECA
It addresses only one component at a time, and may not reveal the complex and hidden
interactions in the subsystem and between subsystems in the system that lead to
accidents. In some cases, this coupling can be identified by asking: 'What is the effect
of failure on the system? What other system/component is affected?'
It does not provide sufficient detail for quantification of system consequences.
You should now read Reading 3.2 'Software FMEA Techniques' which examines the
application of FMEA to software.
HAZARD AND OPERABILITY STUDY (HAZOP)
The purpose of a Hazard and Operability Study (HazOp) is to systematically identify actual
or potential deficiencies in the design, layout or operating procedures of a proposed or
existing installation. A HazOp is generally undertaken before beginning construction or
major modifications, provided the relevant engineering diagrams are completed. This is
because the earlier a potential problem is found, the less expensive and easier it is to rectify,
and the more likely it is that the solution will be implemented.
The HazOp technique was originally pioneered in the chemical industry (Tweeddale, 1992)
and has since been adapted in a wide range of industries. It can be applied to almost any
operational situation, whether simple or complex. If the HazOp is being conducted on a
major or complex installation it may be necessary to sub-divide the study into sections.
The essential features of a HazOp study are as follows.
It is a systematic examination of the design and/or operation of the selected system.
It concentrates on exploring the causes and consequences of deviations from the usual
operating conditions.
A team who know most about the project or facility, typically those who designed and
operate it, participate in the process.
A series of guidewords are used repeatedly to ensure consistency and repeatability.
The success of the method depends heavily on the skills, experience and commitment of
those taking part. The team should comprise approximately ten people, including a team
leader who is responsible for facilitating the HazOp and a documenter responsible for
recording the process and outcomes. It is desirable to have at least one person with
expertise in each of the main technical disciplines relevant to the installation or component
that is being examined. The assembled team must have the authority to make on-the-spot
decisions when required.
Where a HazOp study identifies serious deficiencies, a detailed examination of the
likelihood and severity of potential loss events will need to be undertaken, along with a
cost-benefit analysis of any major design or procedural changes that are suggested.
However, it is important that the HazOp does not degenerate into a redesign session.
A HazOp study could form the basis of a submission to a statutory authority requesting
approval for a new installation or significant modifications to an existing installation. In
jurisdictions where Major Hazard Facilities regulations exist, HazOp studies are expected to
form part of the submission to gain a licence to operate a facility.
3 .17 TO P I C 3 ID E N T I FY I N G
HAZ AR D S AN D
P O T E N T I AL LO S S
E V E N T S
UN
IT 4
15
E
NG
INE
ER
ING
RIS
K M
AN
AG
EM
EN
T
Methodology
The study begins with a discussion of the broad function of the relevant installation or
procedure. Each of its elements is then systematically examined using a checklist of
guidewords designed to focus attention on deviations from the normal operating conditions.
Guidewords are developed by combining a primary word that describes the process or
design intentions with a secondary word that suggests a possible deviation.
Some examples of primary guidewords are as follows: flow composition absorb load shut down
movement concentration drain reduce start up
pressure density purge react signal
temperature viscosity separate maintain inert
heat transfer quality mix monitor trip
position size filter test action
level energy isolate inspect protection
amount timing vent control containment
Some examples of secondary deviation guidewords are as follows: no part small wide failure
none multi-phase large narrow change
loss high thick imbalance vibration
more low thin uneven friction
less fast weak misaligned slip
inadequate slow strong reverse obstacles
excessive early short incorrect vacuum
contaminated late long poor other
Typical HazOp guidewords for fluid and non-fluid systems are shown in Tables 3.6 and 3.7. Table 3.6: Sample HazOp guidewords for fluid systems Primary guidewords Secondary deviation guidewords
Flow: High, low, no, reverse, uneven, loss, multi-phase
Level/Pressure/Temperature: High, low, no, loss, uneven
Once the set of guidewords have been determined, each element of the design or procedure
is examined systematically by following the process shown in Figure 3.3.
Figure 3.3: HazOp study process
NoYes
Yes
No
No
No
Yes
Yes
Select an element to examine
Select deviation guideword(e.g. no pressure)
Identify and list all possible causes andconsequences
Record outcome and move on tonext guideword or element
Accept risk
Are any of theseconsequences of concern?
Are thesesafeguards adequate?
Is the cost ofthe proposed
actions justifiable?
Identify actions to improvesystem and/or safeguards
List existing/proposed safeguards toprevent incident or reduce consequences
Can thedeviation occur?
3 .19 TO P I C 3 ID E N T I FY I N G
HAZ AR D S AN D
P O T E N T I AL LO S S
E V E N T S
UN
IT 4
15
E
NG
INE
ER
ING
RIS
K M
AN
AG
EM
EN
T
You will notice that this process involves answering four key questions: 1. Can the deviation occur?
For physical and other reasons, not all deviations are feasible. For example, in a line
where flow is from a high-pressure system to a low-pressure system, 'reverse flow' is
not possible. If the deviation cannot occur, proceed to the next guideword or element. 2. Are any of the consequences of concern?
Even if a deviation is possible, its consequences may not cause enough concern to
warrant any action. If this is the case, proceed to the next guideword or element.
However, if the consequences are of any level of concern, continue to the next step in
the process. If the team is unsure about the answer to this question, a detailed analysis
should be undertaken of the severity of the consequences if the deviation occurs. 3. Are the existing/proposed safeguards adequate?
Existing or proposed safeguards may include alarms, automated response systems or
manual detection by the operator. It is critical to consider whether these allow enough
time for corrective action before an incident escalates. Questions to ask include:
What if an automated response system fails? Is there sufficient time for an
operator to detect the error and make a manual correction?
Can an operator detect, understand and respond to a deviation quickly enough if he
or she has other responsibilities and may not be immediately available?
What if the operator responds incorrectly? Is there sufficient time to detect the
error and make a correction?
It is important not to over-estimate the reliability of automated response systems or the
quick diagnostic ability and response speed of operators. 4. Is the cost of the additional actions justified?
If the team is unsure about the answer to this question, a cost-benefit analysis should be
completed. If the cost of the additional actions is prohibitive and there are no
alternatives, you must accept the risk and move on to the next guideword or element. When all elements have been completed, the design or procedure as a whole is examined
against a set of overview guidewords. Typical overview guidewords are given in Table 3.8. Table 3.8: Overview guidewords for HazOp Overall primary guidewords Overall secondary guidewords
OH&S: Noise (sources, statutory limits, control measures), safety equipment (personal protection, breathing apparatus), access/egress, training, location of safety showers
Fire protection: Fire/explosion detection systems, separation distances, blast proofing, passive and active fire protection, access
Quality: Output and efficiency (reliability, conversion, product testing)
3 .20 TO P I C 3 ID E N T I FY I N G
HAZ AR D S AN D
P O T E N T I AL LO S S
E V E N T S
UN
IT 4
15
E
NG
INE
ER
ING
RIS
K M
AN
AG
EM
EN
T
HazOp study documentation
For each of the subsystems considered in a HazOp study, a datasheet is usually completed
consisting of the following elements.
A header showing the name of the subsystem and system, relevant drawings, study
team, date and location of study.
Primary and secondary guidewords used in the review. Sometimes these are combined
in a single column (e.g. reverse flow).
Possible causes that could give rise to the deviation in question. It is essential to list
both equipment failures and secondary causes from linear or complex interactions.
Possible consequences caused by the deviation. Immediate consequences as well as
escalation potential in other areas through complex interactions are listed here.
Existing/proposed safeguards to either prevent the deviation occurring or enable its
detection and reduce its consequences. If none exist, this should also be recorded.
Any additional agreed actions. If a decision is made to accept a risk and do nothing
further, this should also be recorded.
The person or department responsible for implementation of any agreed actions. Example 3.8: HazOp study
A company plans to manufacture electrical components for industrial applications.
To ensure product quality, the components must be free of oil and grease. This will
be achieved by cleaning the components in a tank containing trichloroethylene
solvent. The solvent is required to be maintained at 70oC for effective degreasing.
Figure 3.4 shows a schematic diagram of the degreasing system.
Figure 3.4: Schematic diagram for degreasing system
Solventtank
Pump
Vent
Cleaning tank(batch)
Solvent recovery
H
L
TITE
Power supply
Heating element
The solvent tank will be maintained at between 65oC and 75oC by electrical heating
coils immersed in the solvent. A temperature element (TE) and a temperature
indicator (TI) will be installed. The TI has high and low settings to control the
temperature. When the temperature reaches a high of 75oC, a relay will open the
circuit breaker to cut off the power supply to the heating coils. When it reaches a
low of 65oC, the relay will close the circuit breaker to begin heating again.
Once the solvent is at the required temperature, it will be pumped to a cleaning tank
(batch process), where the electrical components are immersed for a specified
duration. The 'dirty solvent' will then be pumped to a solvent recovery still and
recycled back to the solvent tank. The solvent recovery still will be periodically
cleaned and the residue/sludge removed.
A HazOp study datasheet for this system is shown in Table 3.9.
3 .21 TO P I C 3 ID E N T I FY I N G
HAZ AR D S AN D
P O T E N T I AL LO S S
E V E N T S
UN
IT 4
15
E
NG
INE
ER
ING
RIS
K M
AN
AG
EM
EN
T
Table 3.9: HazOp study datasheet for degreasing system
A final report is then prepared containing the following information.
Study purpose and scope
Team members
Installation elements/procedures addressed by the study
Study procedure adopted including documentation examined and guidewords used
Completed HazOp study datasheets
Summary of outcomes and recommendations including a list of any unresolved issues.
From the above lists you can see that a lot more information is required for the HazOp study
than for the FMEA study because the HazOp study tries to unravel the full effects of an
unplanned deviation on couplings and interactions.
Pro
pose
d sa
fegu
ards
Ope
rato
r to
be
pres
ent d
urin
g fi
lling
of
clea
ning
tank
. Rem
ote
switc
h to
turn
off
pum
p to
be
prov
ided
at c
lean
ing
tank
.
Ope
rato
r in
vest
igat
es w
hen
clea
ning
tank
isno
t bei
ng f
ille
d at
exp
ecte
d ra
te.
Pro
vide
mea
sure
s fo
r re
cove
ring
pro
duct
from
the
bund
, e.g
. air
dri
ven
pum
p.P
erso
nal p
rote
ctio
n eq
uipm
ent m
ust b
ew
orn.
Pro
vide
an
inde
pend
entT
E a
nd h
igh
tem
pera
ture
ala
rm, t
o cu
t off
pow
er s
uppl
yto
hea
ter.
Dev
elop
em
erge
ncy
resp
onse
pla
n fo
r a
pote
ntia
l vap
our
rele
ase
even
t.
The
inde
pend
entT
E to
ala
rm if
the
tem
pera
ture
dro
ps b
elow
65
C.
Ens
ure
that
the
vent
siz
ing
is a
dequ
ate.
Cle
ar a
ny b
uild
up in
the
vent
line
at r
egul
arin
terv
als.
As
for
high
pre
ssur
e.
The
inde
pend
ent h
igh
and
low
tem
pera
ture
alar
ms,
and
hig
h te
mpe
ratu
re c
utou
t sho
uld
be te
sted
at l
east
at q
uart
erly
inte
rval
s.
Pos
sibl
e co
nseq
uenc
es
Cle
anin
g ta
nk f
illed
too
quic
kly.
Ove
rflo
w p
oten
tial.
Del
ays
in f
illin
g cl
eani
ng ta
nk. N
otse
riou
s.
Los
s of
pro
duct
, but
con
tain
ed w
ithin
bund
. Env
iron
men
t pro
blem
s.
Sol
vent
boi
ls a
nd v
apou
r re
leas
esth
roug
h ta
nk v
ent.
If ig
nite
d, a
tank
fire
is p
ossi
ble.
Toxi
c va
pour
toat
mos
pher
e.To
xic
com
bust
ion
prod
uct i
n a
fire
.
Deg
reas
ing
not e
ffec
tive
in c
lean
ing
tank
. Pro
duct
qua
lity
prob
lem
s.
Pote
ntia
l for
tank
fai
lure
and
loss
of
cont
ents
. Ser
ious
saf
ety/
envi
ronm
enta
l iss
ue.
Tank
'suc
ked
in'.
Maj
or s
truc
tura
lfa
ilur
e.
Pos
sibl
e ca
uses
Pum
p ra
cing
Pum
p ca
vita
ting,
pum
p st
oppe
d
Dra
in v
alve
in ta
nk le
aks
TE
rea
ding
low
, and
hea
ting
cont
inue
s.C
ircu
it br
eake
r fa
ils to
ope
n on
high
tem
pera
ture
.
TE
rea
ding
hig
h, n
o he
atin
g. C
ircu
itbr
eake
r fa
ils in
ope
n po
sitio
n.
Tank
con
tent
boi
ls a
nd v
ent i
sre
stri
cted
.
Ven
t is
bloc
ked.
Vac
uum
in ta
nkw
hen
prod
uct i
s w
ithdr
awn.
Gui
dew
ords
Hig
h fl
ow
Low
flo
w
Low
leve
l
Hig
h te
mpe
ratu
re
Low
tem
pera
ture
Hig
h pr
essu
re
Low
pre
ssur
e
Test
ing—
trip
s an
dal
arm
s
Res
pons
ibili
ty
Eng
inee
ring
Prod
uctio
n
Prod
uctio
n
Prod
uctio
n
Eng
inee
ring
Prod
uctio
n
Eng
inee
ring
Eng
inee
ring
Mai
nten
ance
Eng
inee
ring
Mai
nten
ance
Mai
nten
ance
Stud
y ti
tle:
HA
ZO
P of
deg
reas
er s
yste
mU
nit:
Deg
reas
ing
tank
Lin
e/eq
uipm
ent
desc
ript
ion:
Sol
vent
line
fro
m ta
nk to
cle
anin
g ta
nk
By:
Dra
win
g no
:3.4
Pag
e: 1
of
1
Dat
e: 8
Dec
embe
r 20
06L
ocat
ion:
Bri
sban
e pl
ant
Issu
e: A
3 .22 TO P I C 3 ID E N T I FY I N G
HAZ AR D S AN D
P O T E N T I AL LO S S
E V E N T S
UN
IT 4
15
E
NG
INE
ER
ING
RIS
K M
AN
AG
EM
EN
T
Advantages of HazOp
The multidisciplinary approach helps identify a whole range of issues (safety,
operations, maintenance, design, construction etc.).
It is a powerful medium for communicating the designer's intent to the operations
personnel.
It identifies both linear and complex interactions between various subsystems in the
system, and between systems.
It highlights hazardous events that could occur from a combination of causes, both
visible and hidden, and provides input for detailed hazard analysis.
For new projects and extensions to existing operations, the review is conducted on
paper before the design is complete and offers the flexibility to identify operability
issues and make the necessary design changes before commissioning, thus avoiding
costly shutdowns and modifications at a later stage.
When conducted on an existing operation following an incident, it reveals not only the
appropriate action to be taken to prevent a recurrence, but also a whole range of other
actions to prevent potential incidents that may not yet have occurred.
Limitations of HazOp
It is a highly time-consuming exercise and requires the participation of a number of key
personnel for significant periods (depending on the project size).
If it is conducted on an existing plant, there is a limit to which hardware changes can be
implemented due to design and installation constraints.
The effectiveness of the HazOp is very dependent on the composition and experience
of the participating team members and the experience of the team leader; if the team is
inexperienced, it is possible to miss identifying some of the hazards.
Like all schematic analyses, it may not detect zonal or geographic interactions.
You should now read Reading 3.3 ‘Hazard and operability (HAZOP) studies applied to
computer-controlled process plants'. Then read Reading 3.4 'Using a modified
Hazop/FMEA methodology for assessing system risk' which demonstrates how the two key
techniques we have just studied can be combined.
PRELIMINARY HAZARD OR SAFETY ANALYSIS
A preliminary hazard or safety analysis is conducted during the early stages of a project
before the design is complete. The aim is to identify all the hazardous characteristics of the
plant, process or project prior to final design or specification stage so that they can be more
easily designed out or reduced.
A number of different methods can be used to carry out a preliminary hazard or safety
analysis. These include:
concept safety review
concept hazard analysis
critical examination of system safety
preliminary consequence analysis
preliminary hazard analysis
functional concept hazard analysis
threat and vulnerability analysis.
You should now read Reading 3.5 'Preliminary safety analysis' for an overview of the first
five of these methods. We will then discuss the final two methods separately below.
3 .23 TO P I C 3 ID E N T I FY I N G
HAZ AR D S AN D
P O T E N T I AL LO S S
E V E N T S
UN
IT 4
15
E
NG
INE
ER
ING
RIS
K M
AN
AG
EM
EN
T
Functional concept hazard analysis
Rasmussen and Whetton (1993) developed a variation on the concept hazard analysis
method that can be used for identifying adverse variances in outcome in any operation. In this method, a plant, process or project is divided into functional subsystems that each
comprises the three elements shown in Figure 3.5:
An intent which describes the functional goal of the specific plant activities in question
Methods which describe the items (personnel, procedures, hardware, software, codes,
etc.) that are used to carry out the intent or operations
Constraints which describe the items (physical laws, organisational context, control
systems, contractual requirements, regulatory requirements, production requirements,
etc.) that exist to supervise or restrict the intent. Figure 3.5: Functional concept hazard analysis model
For example, a subsystem of a construction project might be:
Construct a bridge [intent] using prestressed concrete [method] as set out in a specified
building code [method] without accident or incident [safety constraint] and within a
given timeframe [time constraint] and budget [cost constraint]. Alternatively, a subsystem of a plant might be:
Run a production unit [intent] using specified staff, equipment, materials and
procedures [methods] without interruptions between scheduled shutdowns [production
constraints]. Each method and constraint may itself be treated as a separate subsystem or a component of
a subsystem with its own intent, methods and constraints.
To carry out a functional concept hazard analysis, complete the following steps.
1. Define the overall intent of the system.
2. Subdivide the system into subsystems (and components if necessary).
3. For each subsystem, identify the intent, methods and constraints.
4. Decide on a set of keywords. These are similar to the primary guidewords used in a
HazOp study and are best generated from the intent, methods and constraints of the
specific system/subsystems. Examples are shown in Table 2 of Reading 3.3 and in
Table 3.10 on the next page, and also in our previous discussion of primary guidewords
for HazOp studies.
5. For each method and constraint associated with a given intent, systematically apply the
keywords to identify:
possible deviations (dangerous disturbances or undesired events)
possible consequences of the deviation (including complex interactions)
suggested safeguards/prevention measures required
actions and comments.
6. Summarise the findings and prioritise key areas for further in-depth study (e.g.
HazOp, FMEA).
Using WithIntent Methods Constraints
3 .24 TO P I C 3 ID E N T I FY I N G
HAZ AR D S AN D
P O T E N T I AL LO S S
E V E N T S
UN
IT 4
15
E
NG
INE
ER
ING
RIS
K M
AN
AG
EM
EN
T
Table 3.10: Additional generic keywords for concept hazard analysis Type of risk Keywords Staff Workplace environment
Safe work practices Safety management system (SMS) Organisational culture Human error management Training Emergency preparedness
Liability Breach of contract Regulatory requirements Employer 'duty of care' issues Negligence
Software Software quality Fit between system and tasks Software error Software failure Error diagnostic tools Hardware compatibility Compatibility with socio-technical changes
(structure, task, technology, users) Application scope Backup system System performance Real time performance Maintainability Extendability User interface Internal support External support
Advantages of functional concept hazard analysis
Good basis for a more detailed study.
It identifies hazards prior to final design or specification stage enabling them to be
more easily designed out or reduced.
The multidisciplinary approach helps identify a whole range of issues (e.g. safety,
operations, maintenance, design, construction).
It identifies both linear and complex interactions between various subsystems in the
system, and between systems.
It tests underlying design assumptions particularly within the commercial framework.
Limitations of functional concept hazard analysis
It concentrates only on major hazards.
It may not detect zonal or geographic interactions.
It is possible to miss identification of some hazards if the study is conducted by an
inexperienced team.
3 .25 TO P I C 3 ID E N T I FY I N G
HAZ AR D S AN D
P O T E N T I AL LO S S
E V E N T S
UN
IT 4
15
E
NG
INE
ER
ING
RIS
K M
AN
AG
EM
EN
T
A C T I V I T Y 3 . 5
a) Select a specific operation from your work environment. The operation should
have a man/machine interface and require a sequence of manual operations to be
performed. Both the sequence and correctness of operations are important for
the safe and successful completion of the operation.
Using the functional concept hazard analysis technique, analyse the sequence of
operations by identifying the intent, methods, constraints and potential
deviations.
Some examples of operations that could be analysed include:
Transfer of a shipping container containing hazardous substances from the
ship to the wharf using the container terminal crane.
Filling an above ground LPG storage tank from a bulk road tanker in an
automotive retail outlet.
or
b) Select a project with which you are or have been associated and use functional
concept hazard analysis technique to identify the risks involved in the project.
Some examples of projects might be:
A component of a construction contract, either local or offshore. (If it is a
joint venture, identify the risks for one party only.)
Upgrading an inventory management software system for a small
supermarket chain wishing to expand its operations.
Vulnerability analysis
A vulnerability analysis is a top down method that involves identifying the assets or critical
success factors for a plant or project and matching these against credible threats to identify
critical vulnerabilities. Originally developed by military intelligence organisations, it has
many variations and is often used as a preliminary hazard or safety analysis because it
provides a completeness check to ensure that no significant vulnerabilities have been
overlooked in the initial stages of design or functional specification.
A vulnerability is the weakness of an asset with respect to a threat. It may be intrinsic to the
asset, for example train seats are more vulnerable to vandalism than train wheels, or it may
be due to location, for example facilities in northern Australia are vulnerable to damage by
tropical cyclones. Vulnerabilities are deemed critical if they can halt the business or cause
damage to a significant part of its operations. A tropical cyclone in Tasmania is not a
credible threat and so a credible vulnerability cannot arise from this threat in this region.
Figure 3.6 shows a simple diagram of the vulnerability analysis process.
There are four steps involved:
1. Identify all of the plant or project's assets or critical success factors. Examples include
staff, physical assets, reputation, business continuity and customer loyalty.
2. Identify all credible threats to the plant or project. Examples include smoke, fire,
explosion, natural hazards such as rain, snow, wind, earthquake, staff injury or illness,
critical plant failure, failure of a major supplier, sabotage and acts of aggression.
3. Systematically assess the extent to which each asset or critical success factor is
vulnerable to each threat. This is often done using a matrix or table such as that shown
in Figure 3.7.
4. Develop risk management strategies for all critical vulnerabilities.
3 .26 TO P I C 3 ID E N T I FY I N G
HAZ AR D S AN D
P O T E N T I AL LO S S
E V E N T S
UN
IT 4
15
E
NG
INE
ER
ING
RIS
K M
AN
AG
EM
EN
T
Figure 3.6: Vulnerability analysis process
Figure 3.7: Sample vulnerability analysis matrix
Threats Assets
Technical failure
Community issues
Political (change of government)
Credit squeeze
Flood
Reputation
xx
–
x
xxx
x
Operability
xx
–
x
xxx
xxx
Staff
xx
xx
x
xx
xx
Scoring system xxx xx x – va
Critical potential vulnerability that must be (seen to be) addressed Moderate potential vulnerability Minor potential vulnerability No detectable vulnerability Possible value adding
The power of the process rests on the fact that whilst there may be a large number of
identified assets or critical success factors to be protected against a large number of threats,
the actual number of critical vulnerabilities is usually quite small, typically about 10% of
the intersections of an asset/threat matrix. The process therefore prevents the
misapplication of resources to things that are really only threats and not vulnerabilities.
Advantages of vulnerability analysis
It is one of the few techniques that attempts to provide a 'completeness' check. If all
assets or critical success factors are defined and all threats are defined then all
vulnerabilities can be identified and analysed.
The multidisciplinary approach helps identify a whole range of issues.
It is a powerful medium to ensure contextual awareness of designers.
If done on a zonal basis for a plant design it is very good at identifying propagation
potentials.
Assets / CriticalSuccess Factors
CredibleThreats
CriticalVulnerabilities
Risk ManagementStrategies
ResidualVulnerabilities
3 .27 TO P I C 3 ID E N T I FY I N G
HAZ AR D S AN D
P O T E N T I AL LO S S
E V E N T S
UN
IT 4
15
E
NG
INE
ER
ING
RIS
K M
AN
AG
EM
EN
T
Limitations of vulnerability analysis
If an asset that requires protection is not identified then unwanted surprises may occur.
If too many overlapping assets are identified then it becomes unwieldy.
As a top down technique, it can become sidetracked by small issues if insufficient
high-level analysts are present.
The vulnerability technique is very useful for project risk management at the concept stage.
However, care must be taken to differentiate between assessing overall project risk as
opposed to assessing the risk of several project options. An overall project risk assessment
is concerned with minimising impacts during the life of the project so that it is completed on
time and on budget. However, during the concept stage it may also be appropriate to assess
the risks associated with several different design options or possible locations, as we
discussed in Topic 2 with regard to the elimination of a level crossing. These are two
distinctly different risk assessments.
SCENARIO-BASED HAZARD IDENTIFICATION
Application of many of the hazard identification techniques described in this topic results in
a tabulation of deviation/causes/consequences that can be used to construct risk scenarios.
Scenario creation is important because most of the techniques we have discussed are
bottom-up, that is they examine individual components or process deviations. Scenario
creation requires postulating multiple failures or deviations concurrently or sequentially.
An example would be what happens if two seemingly independent systems fail at the same
time—such as compressed air supply and cooling water. Is there a hidden common failure
mode? Whilst failures of each may be manageable if they occur at different times, can
failure of one mask failure of the other and can a dual failure have serious consequences?
SUMMA RY
In this topic we discussed the first two steps of the risk management framework: defining
the system and identifying hazards and potential loss events. We started with a discussion
of the significance of couplings and interactions in engineering systems and then discussed
each of the following hazard identification techniques:
Past experience
Checklist reviews
Hazard and operability study (HazOp)
Failure modes and effects analysis (FMEA)
Failure modes, effects and criticality analysis (FMECA)
Preliminary hazard or safety analysis
Scenario-based hazard identification.
Selecting the appropriate techniques for a given situation is a skill that you will develop
with experience. If a technique is not giving you the results you're looking for, try another
one, and remember that no single technique is capable of identifying the hazards and
potential loss events for all situations.
3 .28 TO P I C 3 ID E N T I FY I N G
HAZ AR D S AN D
P O T E N T I AL LO S S
E V E N T S
UN
IT 4
15
E
NG
INE
ER
ING
RIS
K M
AN
AG
EM
EN
T
EX E RC I S E S
3.1 CASE STUDY—FUEL STORAGE TERMINAL
A company intends to establish a petroleum products storage and distribution terminal. The
site will include the storage tank farm for bulk fuels, butane storage facilities and a tanker
loading facility.
Unleaded automotive fuel, automotive diesel fuel, jet fuel and bunker fuel will be imported
by ship from the nearby wharf via an underground 350 mm pipeline. Blending facilities
will be provided in the terminal to enable the production of premium unleaded automotive
fuel from the unleaded automotive fuel by the controlled addition of butane and tetra ethyl
lead (TEL). Butane and TEL will be imported by bulk road tankers to the terminal.
Four truck loading bays will be constructed for product distribution. The following
equipment and operations are included in the project:
14 above ground petroleum storage tanks and piping consisting of 5 x 17 megalitre
(ML) tanks, 3 x 10 ML tanks, 3 x 5.3 ML tanks, 1 x 1.5 ML tank and 4 day tanks
21 product transfer pumps
butane storage vessel of capacity 40 tonnes
underground petroleum pipeline from wharf to the terminal (approximately 2.5 km)
ship unloading of product
product transfer from the wharf to the terminal
filling of road tankers
butane unloading from a road tanker
management of waste water on site
TEL storage area
additives tanks.
Delivery of the products into the terminal will be via the ship's pump.
The following safety systems are proposed.
Ship unloading hoses will include dry break couplings.
Electronic monitoring of tank levels during all product movements.
High-level alarms on all tanks, and high-level cut-out switches on the smaller blend
tanks and day tanks.
Access to road tanker loading bays controlled by a card swipe system identifying
driver, truck and load requirements.
Road tanker loading using a 'Scully' probe type system to ensure that the static probe is
installed before the computer controls can be activated. The system will stop the
transfer should the road tanker drive away still connected, or on a high tanker level via
links to sensing probes on each dip point of each compartment.
Computer controlled loading of road tankers. Each truck compartment volume is
pre-entered into the system so that a fixed amount can be filled, preventing both
overfilling and overloading of the vehicle.
Top loading flow controlled via a spring to close dead man loading valve combined
with a timer system to prevent the control valve opening fully until after an elapsed
time with the loading valve held open.
Foam injection provided to all unleaded automotive fuel and jet fuel storage tanks.
Fire monitors and hydrants provided via a ring main system to cover all tanks, pumps,
butane storage and tanker loading bays, with the provision to deliver both water and
foam.
3 .29 TO P I C 3 ID E N T I FY I N G
HAZ AR D S AN D
P O T E N T I AL LO S S
E V E N T S
UN
IT 4
15
E
NG
INE
ER
ING
RIS
K M
AN
AG
EM
EN
T
Onsite water and foam storage to meet a fire fighting demand for cooling water for 1.5
hours and foam to several of the tanks for 20 minutes. Main fire pump and foam
generating pump to be diesel-driven in case of power failure.
The significant hazard in the terminal is fire. Some of the specific potential loss events are:
atmospheric tank roof fires
tank farm bund fires (intermediate and full bund)
pool fire at tanker loading bay and pump slab
butane tank fire and explosion
pool fire due to product release from shipping pipeline
spills at wharf.
Task
Use the checklists in Reading 3.1 to identify specific hazards in the terminal.
3.2 FAILURE MODES AND EFFECTS ANALYSIS
It is necessary to maintain a spray of warm water at a fixed temperature to control a
biological process. The process is operated at 45oC. Too low a temperature would result in
insufficient reaction, and too high a temperature would destroy the micro-organisms. Cold
water is supplied at ambient temperature and could vary depending on the time of the year.
Hot water is supplied from the site's hot water source at about 80oC. The spray system for
mixing hot and cold water to deliver at the set temperature is shown in Figure 3.8 below.
Figure 3.8
Both hot and cold water are supplied from overhead head tanks. The levels in the tanks are
maintained by float valves. The area is generally unattended but is patrolled at regular
intervals by an operator who takes a sample from the reactor for laboratory analysis.
The cold water flow is controlled by providing a set point using a hand switch. The flow
rate measured by a flow element (FE) is controlled by a flow controller (FC), which in turn
Hot waterhead tank
Cold waterhead tank
Manual setpoint
FCV1
FCV2
FC
TE
TC
FE
Manualset point(45 C)
3 .30 TO P I C 3 ID E N T I FY I N G
HAZ AR D S AN D
P O T E N T I AL LO S S
E V E N T S
UN
IT 4
15
E
NG
INE
ER
ING
RIS
K M
AN
AG
EM
EN
T
adjusts the flow control valve (FCV2) to provide the set flow. The temperature of the spray
is measured by a temperature element (TE). Based on the difference between the
temperature measured by TE and the temperature set point, the temperature controller (TC)
adjusts the hot water flow control valve (FCV1) at the required temperature.
Task
a) Using the failure modes and effects analysis technique, analyse the above circuit and
identify the conditions under which the reaction may become ineffective, or the 'bugs'
would be destroyed. Record the findings in an FMEA datasheet similar to that shown
in Table 3.5.
b) Suggest additional measures that may be required in the design to reduce the risk of
losing the 'bugs' and to improve workplace safety.
3.3 HAZARD AND OPERABILITY STUDY
Repeat Exercise 3.2 using the HazOp technique and relevant guidewords selected from
Tables 3.6 and 3.7. Record the results in a datasheet similar to that shown in Table 3.9.
3.4 FUNCTIONAL CONCEPT HAZARD ANALYSIS
A bus transport company decided to explore the use of compressed natural gas instead of
liquid fuels in its buses. This would result in significant savings in operating costs.
Metered low-pressure natural gas supply is available from the street mains. It is
compressed to a pressure of 12 000 kPa in a multi-stage reciprocating compressor, and
filled into a thick walled cylinder that could be mounted on the bus, similar to LPG
cylinders in motor vehicles. A number of gas filled cylinders would be filled and stored for
use. Empty cylinders removed from the buses would be stored in a separate dedicated area.
The compressor only needs to operate for about eight hours per day; no night time operation
would be required. The compressor would be located within a building and provided with
acoustic protection to meet the noise regulations. Water cooling of gas in between
compression stages in the multi-stage compressor is to be provided by installing a small
dedicated cooling tower, an off-the-shelf design.
An operator will conduct regular inspection/surveillance of the compressor house wearing
suitable ear protection. The compressor house will be air-purged to keep the ambient
temperature in the room to workplace health and safety standards for operator comfort.
A preliminary review revealed a number of risk issues associated with natural gas. There is
potential for fire and explosion in the compressor house in the event of a gas leak. A leak
of high-pressure gas from the cylinder storage outside the building may result in a jet fire if
ignited, and could impinge on buses parked nearby. The buses are also parked close to one
another (less than 1m apart), to maximise the depot floor space. There is also concern as to
whether there would be an incremental reduction in passenger safety.
The Operations Manager is also concerned that if something goes wrong with the new
technology, the buses may have to be taken off the road, severely affecting the company's
ability to service the sectors according to established schedule. This may undermine
passenger confidence in the bus company.
3 .31 TO P I C 3 ID E N T I FY I N G
HAZ AR D S AN D
P O T E N T I AL LO S S
E V E N T S
UN
IT 4
15
E
NG
INE
ER
ING
RIS
K M
AN
AG
EM
EN
T
The company wants to ensure that all risks are identified and that adequate prevention and
mitigation measures are developed for protection of assets and employee/passenger safety,
before making the capital expenditure decision.
Task
Carry out a functional concept hazard analysis for the natural gas compressor station and
cylinder storage/handling area. Make relevant assumptions where appropriate. Note that
since students of this unit are from different engineering disciplines, only a simple analysis
is required for this exercise.
3.5 VULNERABILITY ANALYSIS
Your company has won a government tender to complete a major freeway upgrade to a
regional centre, and you have been appointed as project manager. Undertake a vulnerability
analysis for this project by adapting the vulnerability matrix and scoring system shown in
Figure 3.6.
RE F E R E N C E S A N D F U RT H E R R E A D I N G
Bowles, J.B. & Wan, C. (2001) 'Software failure modes and effects analysis for a small
embedded control system', 2001 Proceedings Annual Reliability and Maintainability
Symposium, IEEE: 1–6.
Chapman, Chris & Ward, Stephen (2003) Project Risk Management: Processes,
Techniques and Insights, 2nd edn, John Wiley & Sons, Chichester.
Charoenngam, C. & Yeh, C-Y. (1999) 'Contractual risk and liability sharing in hydropower
construction', International Journal of Project Management, 17(1): 29–37.
Chung, P. & Broomfield, E. (1995) 'Hazard and operability (HAZOP) studies applied to
computer-controlled process plants', Computer Control and Human Error, Institution
of Chemical Engineers, Warwickshire, UK.
Cooper, Dale et al. (2004) Project Risk Management Guidelines: Managing Risk in Large
Projects and Complex Procurements, John Wiley & Sons, West Sussex, England.
Department of Planning, NSW (1995) Hazardous Industry Planning Advisory Paper No. 8:
HazOp Guidelines, NSW Department of Planning, Sydney.
Edwards, Peter J. & Bowen, Paul (2005) Risk Management in Project Organisations,
UNSW Press, Sydney.
Energy Institute (UK) (2005) Top Ten Human Factors Issues Facing Major Hazards
Sites—Definition, Consequences, and Resources, available at:
http://www.energyinst.org.uk/content/files/hftopten.doc, accessed 11 December 2006.
Feynman, R.P. (1988) What Do YOU Care What Other People Think? Further Adventures
of a Curious Character, (as told to Ralph Leighton), Norton, New York.
Goddard P.L. (1993) 'Validating the safety of embedded real-time control systems using
FMEA', 1993 Proceedings Annual Reliability and Maintainability Symposium, IEEE:
control values, validate output hardware condition, enable hardware outputs if output
hardware correct, output control to actuators if all checks pass else return to safe state. The
technique of continually validating the correctness of the supporting hardware, along with
checks to ensure that software has executed the expected routines in the correct order is the
minimum necessary for embedded safety critical control systems. Additionally, functional
redundancy, implemented in the software through the use of diverse control calculation
algorithms and variables is sometimes needed.
4 RE A D I N G 3 .2 SO FT W AR E FMEA
T E C HN I Q U E S
UN
IT 4
15
E
NG
INE
ER
ING
RIS
K M
AN
AG
EM
EN
T
Figure 2: Control system software architecture
Program Control
begin
sys_valid: = test_all_control_hw();
initialize;
done: = false;
while ((not done) and sys_valid)
begin
read_sensors();
sys_valid: = sys_valid and validate_sensor_values();
calculate_control_values();
sys_valid: = sys_valid and validate_control_values();
sys_valid: = sys_valid and validate_output_hardware();
if(sys_valid)
enable_output_hardware();
output_control_signals();
sys_valid: = sys_valid and test_critical_hardware();
end;
set_system_to_safe_state();
end.
2.3 Software hazard analysis
Unlike hardware and system FMEAs, a software FMEA cannot easily be used to identify
system level hazards. Since software is a logical construct, instead of a physical entity,
hazards must be identified and translated into software terms prior to the analysis. Prior to
beginning the development of a software FMEA, a system preliminary hazard analysis
(PHA) for the system should exist. The PHA needs to include all the hazards which can
have software as a potential cause. The first step in developing a software FMEA is to
translate potential system hazards with possible software causes into an equivalent set of
system and software states through the process of software hazard analysis. To perform a
software hazard analysis, the analyst begins with each hazard identified in the PHA and
performs a fault tree analysis of the potential causes of the hazard. For each potential
hazard and potential hazard cause which could be the result of software failures, the analyst
must extend the fault trees through the system hardware and software until a sensible set of
software input and output variable values is identified. The value set associated with each
hazard cause is then identified as a software hazard. Figure 3 shows the form of the output
table which results from the software hazard analysis and which is used to determine the
criticality of the result of any software failures.
5 RE A D I N G 3 .2 SO FT W AR E FMEA
T E C HN I Q U E S
UN
IT 4
15
E
NG
INE
ER
ING
RIS
K M
AN
AG
EM
EN
T
Figure 3: Software hazard analysis results
Critical software variables
Variable 1 Variable 2 — Variable n
Hazard 1 Cause 1 Value Value — Value
Cause 2 Value Value — Value ●
● ●
● ● ●
● ● ●
—
● ● ●
Cause n Value Value — Value
Hazard 2 Cause 1 Value Value — Value
Cause 2 Value Value — Value ●
● ●
● ● ●
● ● ●
—
● ● ●
Cause n Value Value — Value ● ● ●
● ● ●
● ● ●
● ● ●
—
● ● ●
Hazard n Cause 1 Value Value — Value
Cause 2 Value Value — Value ●
● ●
● ● ●
● ● ●
—
● ● ●
Cause n Value Value — Value
2.4 Software safety requirements
One of the crucial elements of any safety program for a software intensive system is the
development of software requirements to guide the design team in the creation of the
software architecture and implementation which includes all the features needed to support
safety critical processing. The existence and understanding of these requirements by both
the safety and software design groups is crucial to achieving a system design which is
adequate for the intended application, and allows the software design group to understand
the results of and recommendations from the software FMEA. Safety requirements,
appropriate for critical software, can be found in several published sources (references 3–8).
A compendium of requirements selected from these sources and tailored for the specific
application should be released early in the software design process, ideally prior to the start
of top level software design. Discussions of FMEA findings can then be organized to relate
to achievement of the previously identified requirements, significantly simplifying the
communications process between safety and software engineering.
In addition to requirements imposed directly on the software design, safety requirements
will need to be imposed on the software development and execution environments and on
development tools. The safety analyst needs to ensure that requirements are imposed which
ensure that the behavior of the software is consistent with that expected by the software
developer and the analyst. One of the critical elements of the software design which needs
to be controlled is the language which is used for software development and the compiler
for that language. Compilers which have been carefully tested to the language specification
and certified for accuracy of the compiled code must be used in the development of safety
critical software if analysis based on the high order language listings for the compiled code
is to have validity. Use of the language itself also needs to be limited to those features
which are fully defined by the language specifications. Elements of a language whose
behavior has been left to the compiler designer to decide should be avoided. A good
discussion of the needed controls for the language 'C' can be found in reference 9. The
software safety requirements. must also specify that indeterminate behavior of the compiler
be avoided. Features such as optimization, which can produce indeterminate results in the
6 RE A D I N G 3 .2 SO FT W AR E FMEA
T E C HN I Q U E S
UN
IT 4
15
E
NG
INE
ER
ING
RIS
K M
AN
AG
EM
EN
T
final object code, must be specified as being disabled. Any operating system or scheduler
intended for use with safety critical software also needs to be carefully selected. The
executive functions provided by the operating system or scheduler can significantly impact
the ability of the developed software to provide the intended level of safety. Requirements
which specify the use of a safety certified executive as a part of the software are appropriate
if a software FMEA is to have validity.
2.5 System software FMEA
System software FMEA should be performed as early in the design process as possible to
minimize the impact of design recommendations resulting from the analysis. The analysis
may need to be updated periodically as the top level software design progresses, with the
final system software FMEA update occurring during detailed design, in parallel with the
detailed software FMEA. The organization performing the system level software FMEA
needs to balance the update periodicity and expected benefits with the associated costs.
Labor costs for system level software FMEAs are modest and allow identification of
software improvements during a cost effective part of the design process.
Once the software design team has developed an initial architecture and has allocated
functional requirements to the software elements of the design, a system software FMEA
can be performed. The intent of the analysis is to assess the ability of the software
architecture to provide protection from the effects of software and hardware failures. The
software elements are treated as black boxes which contain unknown software code, but
which implement the requirements assigned to the element. The failure modes which are
used to assess the protection provided by each software element are shown in Figure 4. The
failure modes to be applied to each software element include: failure of the software
element to execute, incomplete execution of the software element, incorrect functional
result produced, and incorrect execution timing. Additional 'black box' failure modes may
need to be added which are specific to the intended software application. Failure of the
software to execute and incomplete execution are particularly important to real time
systems. The potential for 'aging' of data in real time control systems must be carefully
evaluated. In addition to the failure modes for each software element, the analyst must
evaluate the ability of the software design to protect against system failures in hardware and
software. As shown in Figure 4, the system level software failure modes evaluate the ability
of the system to provide protection against incorrect interrupt related behavior, resource
conflicts, and errors in the input sensor and output control circuits.
Figure 4: System level software failure modes
Fails to execute
Executes incompletely
Output incorrect
Element Failure Modes
Incorrect timing—too early, too late, slow, etc.
Input value incorrect (logically complete set)
Output value corrupted (logically complete set)
Blocked interrupt
Incorrect interrupt return (priority, failure to return)
Priority errors
System Failure Modes
Resource conflict (logically complete set)
7 RE A D I N G 3 .2 SO FT W AR E FMEA
T E C HN I Q U E S
UN
IT 4
15
E
NG
INE
ER
ING
RIS
K M
AN
AG
EM
EN
T
To perform the system level software analysis, the analyst assesses the effect of the four
primary and any appropriate additional failure modes for each element on the software. The
effect on the software outputs of the failure mode is then compared to the previously
performed software hazard analysis to identify potentially hazardous outcomes. If
hazardous software failure events are identified, the analyst then needs to identify the
previously defined software safety requirement which has not be adequately implemented in
the design. If the potentially hazardous failure mode cannot be traced to an existing
requirement, the analyst needs to develop additional software requirements which mandate
the needed protection. In addition to the failure modes for each software element, the
analyst assesses the effect of each of the system level software failure modes on the
software outputs and compares the effects against the software hazards and software safety
requirements.
The system level software FMEA should be documented in a tabular format similar to that
used for hardware FMEAs. Tabular FMEA documentation techniques are well developed
in most organizations and familiar to the design engineering staff. Tabular documentation
techniques also allow extensive, free form, commentary to be provided as a part of the
failure effect documentation. The ability to provide extended commentary on the software
design and design requirements is crucial to allowing software engineers to understand the
FMEA results and the needed design changes. In many organizations, software engineers
can only respond effectively to requirements based presentation of results.
2.6 Detailed software FMEA
Detailed software FMEA is used to validate that the implemented software design does
achieve the safety requirements which have been specified for the design, providing all
needed system protection. Detailed software FMEA is similar to component level hardware
FMEA. The analysis is lengthy and labor intensive. The results are not available until late
in the design process. Thus, detailed software FMEAs are mostly appropriate for critical
systems with minimal or no hardware protection of memory, processing results, or
communications. For large systems with hardware provided protection against memory,
bus, and processing errors, detailed software FMEA may be difficult to economically
justify.
Detailed software FMEA requires that a software design and an expression of that design in
at least pseudo code exist. Implicit in this requirement is the existence of software
requirements documentation, top level design descriptions, and detailed design descriptions.
Final implemented code may not be necessary if the software elements are described in
pseudo code and the software development process provides adequate assurance that the
implemented design matches the pseudo code description of the detailed design
documentation. To perform the analysis, the analyst postulates failure modes for each
variable and each algorithm implemented in each software element. The analyst then traces
the effect of the postulated failure through the code and to the output signals. The resultant
software state is then compared to the defined software hazards to allow identification of
potentially hazardous failures.
If the software hazard analysis has previously been completed to support system level
software FMEA, the first step in the detailed software FMEA is development of a variable
mapping. The analyst will need to develop, or have produced by automated software
development tools, a mapping which shows which variables are used by each software
module and whether the variable is an input variable, an output variable, a local variable, or
a global variable. As a part of the variable mapping, the analyst needs to clearly identify the
8 RE A D I N G 3 .2 SO FT W AR E FMEA
T E C HN I Q U E S
UN
IT 4
15
E
NG
INE
ER
ING
RIS
K M
AN
AG
EM
EN
T
source of each input variable and the destination(s) of each output variable. This mapping
will be used to allow the analyst to trace postulated failures from the originating location to
the output variable set.
Once the variable map is complete, the analyst should develop software 'threads' for the
processing being analyzed. The software threads are mappings from an input set of
variables through the various processing stages to the system output variables. The
software threads will assist the analyst in rapidly tracing postulated failures to system
variables and effects. Definition of the software 'threads' will often be available from the
software design team through existing design documentation or as a defined output of the
automated design tools being used by the design team.
To perform the detailed software FMEA, the analyst next needs to develop failure modes
for the processing algorithms as they are implemented in each module. The algorithm
failure modes are unique to each software development. A logically complete set of failure
modes for each of the variable types also needs to be developed. Reference 1 provides a
description of the straightforward process used to develop variable failure modes for simple
variable types: boolean, enumerated, real, integer. Development of a logically complete set
of variable failure modes for more complex variables will need to be done based on the
specifics of the language in use and the compiler implementation. Since the primary
purpose of postulating failure of each variable is to assess the impact of memory failures in
processing platforms which do not have effective memory protection, a detailed knowledge
of the underlying storage scheme is required. For high order languages, it may be necessary
to obtain the needed implementation details from the developer of the compiler and from
the language specification.
Once the variable and algorithm failure modes have been developed, the analyst can
perform the detailed software FMEA. For each module, algorithm failures are postulated,
the effect traced to the module outputs and in turn to the software system output variables
using the software threads and the variable map. The system variable effects are then
compared against the software hazard analysis to determine whether or not the postulated
failure could lead to a system hazard. The analyst then postulates failures for each of the
variables used in the module and traces the effects to the system outputs and the defined
software hazards in a similar manner. The detailed software FMEA process is analogous to
the component level hardware FMEA process except that variables and the variable map
substitute for the signals and signal paths of electronic hardware.
If the detailed FMEA identifies failure modes which trace to the defined software hazards,
the analyst needs to assess which software safety requirements have not been implemented
correctly, or if one or more requirements are missing. Similar to system level software
FMEA, the most effective way to communicate software design deficiencies is through
identification of those requirements which have not been met.
Documentation of the detailed software FMEA can be either tabular or using the matrix
documentation recommended in reference 1. Matrix documentation provides some
desirable compactness for detailed software FMEA. However, tabular documentation is
more familiar to most design groups and allows extensive commentary to be included. The
choice of documentation style can be left to the preference of the individual analyst or
analysis team.
9 RE A D I N G 3 .2 SO FT W AR E FMEA
T E C HN I Q U E S
UN
IT 4
15
E
NG
INE
ER
ING
RIS
K M
AN
AG
EM
EN
T
2.7 Analysis limitations
Software FMEA can provide insight into the behavior of safety critical software intensive
systems, particularly embedded control systems. However, as with all FMEAs, the analysis
cannot provide complete system safety certification. Software FMEA examines the
behavior of the system being analyzed under conditions of software single point failure. In
many cases, the assumption of single point failures may be difficult to fully justify. Many
software failures can be induced by failures in the underlying hardware. For systems with
minimal memory protection, failures in the memory hardware can appear as errors in
variable storage values which can propagate errors through the software into the output
variables and subsequently to system behavior. Single point memory failure assumptions
can be appropriate for processing memory which has been carefully architected to preclude
multiple errors, but may not be safe to generally assume unless the implementation of the
storage is known. The implementation details for memory circuitry for highly integrated
microprocessors and microcontrollers is likely to be proprietary to the device manufacturer
and unknown to the analyst.
Software FMEA does not provide evaluation of the behavior of a software intensive system
under conditions of unfailed operation. For many control systems, the stability of the
control loop is a crucial parameter in determining safety of operation. Simulation and
modeling are appropriate tools for evaluating control stability. FMEA cannot provide the
needed evaluation of control loop stability under either normal or failed operation.
Similarly, software FMEA provides limited insight into the safety risks associated with
changes in timing due to either software or hardware failures. Timing and sizing analysis
for worst case interrupt arrivals and resource demands may be needed to provide insight
into the effects of some failures postulated during the software FMEA.
3. CONCLUSIONS
Software FMEA has been applied to a series of both military and automotive embedded
control systems with positive results. Potential hazards have been uncovered which were
not able to be identified by any other analytical approach, allowing design corrections to be
implemented. Additionally, system level software FMEA can be applied early in the design
process, allowing cost effective design corrections to be developed. System software
FMEA appears to be valuable for both small embedded systems and large software designs,
and should be cost effective so long as a mature software design process—one which can
provide needed software design information in a timely manner—is in use. Detailed
software FMEA is appropriate for systems with limited hardware integrity, but may not be
cost effective for systems with adequate hardware protections. For designs with limited
hardware integrity, detailed software FMEA provides an effective analysis tool for verifying
the integrity of the software safety design.
10 RE A D I N G 3 .2 SO FT W AR E FMEA
T E C HN I Q U E S
UN
IT 4
15
E
NG
INE
ER
ING
RIS
K M
AN
AG
EM
EN
T
4. REFERENCES
1. Goddard, P. L., "Validating The Safety Of Real Time Control Systems Using FMEA',
Proceedings of the Annual Reliability and Maintainability Symposium, January 1993.
2. SAE Aerospace Recommended Practice ARP-5580, Recommended Practices For
FMEA, Draft Version, June 1999.
3. Underwriters Laboratory Standard UL-1998, Standard For Safety: Safety Related
Software, First Edition, January 1994.
4. NATO Standardization Agreement STANAG 4404, Safety Design Requirements And
Guidelines For Munition Related Safety Critical Computing Systems, Edition 1.
5. United States Air Force System Safety Handbook SSH1-1, Software System Safety,
5 September 1985.
6. Electronic Industries Association Bulletin SEB6-A, System Safety Engineering In
Software Development, April 1990.
7. Leveson, N. G., Safeware: System Safety And Computers, ISBN 0-201-11972-2, 1995.
8. Deutsch, M. and Willis, R., Software Quality Engineering, ISBN 0-13-823204-0,
1988.
9. Hatton, L., Safer C, ISBN 0-07-707640-0, 1994.
5. BIOGRAPHY
Pete Goddard is currently employed as a Senior Principal Engineer with the Raytheon
Consulting Group in Troy, Michigan. He holds a bachelors degree in Mathematics from
the University of Laverne, and a masters degree in Computer Science from West Coast
University. Mr. Goddard has published papers in the proceedings of the Annual
International Logistics Symposium, the RAMS Symposium, the AIAA Computers in
Aerospace Symposium, and the INCOSE Symposium. He was the principal investigator for
the 1984 Rome Labs sponsored "Automated FMEA Techniques" research study and was
program manager and part of the research team for the 1991 Rome Labs sponsored
"Reliability Techniques For Combined Hardware And Software Systems" research study.
He is a co-author of "Reliability Techniques for Software Intensive Systems". Mr. Goddard
is an active member of the SAE G-11 Division and is part of the subcommittee on FMEA in
the G-11. He is a member of IEEE and an ASQ member and CRE.
Source: 2000 Proceedings Annual Reliability and Maintainability Symposium, IEEE:
118–123.
RE A D I N G 3 .3
HAZARD AND OPERABILITY (HAZOP) STUDIES APPLIED TO COMPUTER-CONTROLLED PROCESS PLANTS
PAUL CHUNG & EAMON BROOMFIELD
'There is a strong family resemblance about misdeeds, and if you have all the details of a
thousand at your finger ends, it is odd if you can't unravel the thousand and first.'
Sherlock Holmes in A Study in Scarlet by Arthur Conan Doyle
1. INTRODUCTION
Due to the speed and flexibility of computers, there is an increasing use of software in
industry to control or manage systems that are safety-critical. In some cases, as systems
become more and more complex, and faster and faster response time is required, the use of
computer and application software is the only feasible approach. In this chapter a safety-
critical system refers to a system which, if it malfunctions, may cause injury to people, loss
of life or serious damage to property. To ensure the quality of safety-critical systems with
software components, standards and guidelines have been, or are being, produced by
government and professional organizations.
The guidance generally given is that software quality is achieved through rigorous
management of the software life cycle which involves requirement analysis, specification,
design, implementation, testing, verification and validation. Safety assessment is a new
dimension which needs to be added to the life cycle of safety-critical software. For
example, the draft Defence Standard 00–56: Safety Management Requirements for Defence
Systems Containing Programmable Electronics states that, 'The contractor shall identify
hazards and their associated accident sequences, calculate safety targets for each hazard and
assess the system to determine whether the safety targets have been met'. Although safety
assessment has been accepted as an important part of the software life cycle, little help is
given to engineers about when and how to do it. Safety assessment involves two different
activities: hazard identification and hazard analysis. The aim of the former is to identify the
potential hazards that may arise from the use of a particular safety-critical system, and their
possible causes. The aim of the latter is to quantify the risks that are associated with the
identified hazards and to assess whether the risks are acceptable. The focus of this chapter
is on hazard identification.
In the process industry, Hazop (hazard and operability studies) is a long-established
methodology used for identifying hazards in chemical plant design. Some attempts have
been made to modify conventional Hazop for computer-related systems. Modified versions
of Hazop are generally referred to as Chazop (computer Hazop) or PES (programmable
electronic systems) Hazop in the literature.
2 RE A D I N G 3 .3 HAZ AR D AN D
O P E R AB I LI T Y
( HAZ O P ) S T U D I E S
AP P LI E D T O
C O M P U T E R -
C O N T R O LLE D
P R O C E S S P LAN T S
UN
IT 4
15
E
NG
INE
ER
ING
RIS
K M
AN
AG
EM
EN
T
In this chapter we provide a brief description of the conventional Hazop as used in the
process industry and an overview of the different Chazop frameworks/guidelines suggested
by engineers and researchers over the past few years. The overview shows that there is as
yet no agreed format on how Chazop should be done and that the different approaches were
made ad hoc. The main emphasis of the rest of the chapter is on a new Chazop
methodology which we have systematically developed and which is based on incident
analysis. We discuss the strategy used to develop the methodology and illustrate the
application of the methodology using examples.
2. COMPUTER-RELATED HAZARDS
Hazards are sometimes caused by system failures, or by systems deviating from their
intended behaviour. System failures can be categorized into two classes:
random failures typically result from normal breakdown mechanisms in hardware; the
reliability based on failure rate can often be predicted in a quantified statistical manner
with reasonable accuracy;
systematic failures are all those failures which cause a system to fail, and which are not
due to random failures.
McDermid has pointed out that, 'software is quite different to hardware in that its only
"failure mode" is through design or implementation faults, rather than any form of physical
mechanism such as ageing'. Therefore, all software-induced system failures are systematic
failures. 'There is some evidence that as the level of complexity [of a system] increases the
proportion of systematic failures increases'.
However, a piece of software in itself is not hazardous. It is hazardous only when it
interacts with equipment that can cause injury to people, loss of life or damage to property.
Therefore safety-critical software should, as far as possible, be:
able to respond to external failures, hardware or human, in an appropriate manner.
This means that the design specification should have no omissions, and every
conceivable problem should be considered and dealt with accordingly;
free from error, so that it will not make any wrong decisions and cause wrong actions to
be taken.
An ideal hazard identification methodology, therefore, should be able to deal with system
design/specification, software implementation and maintenance.
3. HAZOP
Hazop is a methodology developed by ICI in the 1960s for reviewing chemical plant
designs. A Hazop team should consist of a leader who controls the discussion and members
from the production, technical and engineering departments. This is to ensure that the
required expertise for reviewing a particular design is present at the meeting. The team has
an engineering line diagram (ELD) in front of them and the general intention of the system
is explained. To help the team go through the design in a systematic manner, members
review the design section by section, or line by line. Guide words are used as prompts to
help them explore possible causes and consequences of deviations from design intent. For
example, the guide words include: none, more of and less of. The deviations associated
with the guide word none are no flow and reverse flow. The team then consider questions
such as What will cause no flow along this line? and What will cause low level in this tank?
If the cause of a particular deviation is credible and the consequence is believed to be
3 RE A D I N G 3 .3 HAZ AR D AN D
O P E R AB I LI T Y
( HAZ O P ) S T U D I E S
AP P LI E D T O
C O M P U T E R -
C O N T R O LLE D
P R O C E S S P LAN T S
UN
IT 4
15
E
NG
INE
ER
ING
RIS
K M
AN
AG
EM
EN
T
significant then a change is made to the design or method of operation, or the problem is
considered in detail outside the Hazop meeting. An action may specify that protective
equipment needs to be installed, or detailed analysis of the cause and consequence needs to
be carried out. Thus a Hazop meeting generates a report in the format shown in Table 2.1.
This conventional form of Hazop is carried out when the ELD of a design is completed.
However, delaying hazard studies until the ELD is available means that many major design
decisions will have been made and orders will have been placed. Therefore, changes made
at this stage can be very costly. For this reason ICI introduced two preliminary hazard
studies prior to the ELD stage (which is referred to as Study 3). The purpose of Study 1 is
to ensure 'that the hazardous properties of all the materials involved in the process and their
potential interactions are understood'. Study 2 is carried out when the process flow
diagrams are available. The sections making up the plant—for example, reaction,
scrubbing, distillation, etc—are studied in turn. The approach used is to consider 'top
events', potential hazardous events such as fire, explosion and so on, and to 'identify those
which present a serious hazard, so that an appropriate design can be developed'.
Table 2.1: Conventional Hazop table
Guide word Deviation Possible causes Consequences Action required
None No flow … … …
Reverse flow … … …
More More flow … … …
More pressure … … …
More
temperature
… … …
More level … … …
Less (similar to more) … … …
Part of Concentration … … …
Other Maintenance … … …
Start-up … … …
Shutdown … … …
Extra constituent
or phase
… … …
… … … …
ICI later added Hazard Studies 4 to 6. Prior to plant start-up, Study 4 is done by the plant
or commissioning manager to check that all actions from previous studies have been carried
out and to review that appropriate procedures for operating the plant are in place. Study 5
involves a site inspection, paying particular attention to means of access and escape,
guarding, provision of emergency equipment, etc. Study 6 reviews changes made during
commissioning of the plant.
An earlier study (Hazard Study 0) is now being introduced. It is carried out at the start of a
project, before the engineering design department is involved, and asks if the right product
is being made by the most suitable route and in the most suitable location.
Two related hazard identification techniques—FMEA (Failure Modes and Effects Analysis)
and FMECA (Failure Modes Effects and Criticality Analysis)—will also be referred to later
in this chapter. In contrast to Hazop, FMEA and FMECA represent a 'bottom up' approach
4 RE A D I N G 3 .3 HAZ AR D AN D
O P E R AB I LI T Y
( HAZ O P ) S T U D I E S
AP P LI E D T O
C O M P U T E R -
C O N T R O LLE D
P R O C E S S P LAN T S
UN
IT 4
15
E
NG
INE
ER
ING
RIS
K M
AN
AG
EM
EN
T
to hazard identification. They start by focusing on a component and then address the
questions:
what are the modes of failure (that is, what equipment can fail and in which way)?
what are the causes of the failures?
what are the consequences?
FMECA goes further then FMEA by considering the questions 'How 'critical are the
consequences?' and 'How often does the failure occur?'
4. COMPUTER HAZOP
As mentioned earlier, because of the successful application and widespread use of Hazop in
the process industry, researchers and engineers are suggesting ways of adapting Hazop to
safety-critical systems. This section describes the results of some of these adaptations of
Hazop. The description is brief. It highlights the different guide words and questions
proposed under different schemes to assist the hazard identification process during Chazop
meetings. Interested readers should refer to the original articles referenced throughout the
section. A general discussion about the different schemes is given at the end of the section.
4.1 Scheme 1
An obvious way of developing a Chazop methodology is to simply replace or supplement
the process-related guide words and deviations with computer-related ones. Burns and
Pitblado have identified two sets of guide words for reviewing computer control systems.
One set is for considering the hardware and logic of the system (see Table 2.2), and the
other is for considering human factors (see Table 2.3).
Table 2.2: PES Hazop guide words and deviations (after Burns and Pitblado)
Guide word Deviation
No No signal
No action
More More signal
More action
Less Less signal
Less action
Wrong Wrong signal
Wrong action
The draft guideline for Chazop produced by the UK Ministry of Defence extends the list of
guide words associated with conventional Hazop with the following words: early, late,
before and after. The words early and late are for considering actions or events relative to
time and the words before and after are for considering the ordering of actions or events.
5 RE A D I N G 3 .3 HAZ AR D AN D
O P E R AB I LI T Y
( HAZ O P ) S T U D I E S
AP P LI E D T O
C O M P U T E R -
C O N T R O LLE D
P R O C E S S P LAN T S
UN
IT 4
15
E
NG
INE
ER
ING
RIS
K M
AN
AG
EM
EN
T
Table 2.3: Human factors Hazop guide words and deviations (after Burns and Pitblado)
Guide word Deviation
No No information
No action
More More information
Less Less information
Wrong Wrong action
During a Chazop meeting a team will go through a diagrammatic representation of a system
by considering all the links between different components on the diagram. Possible
deviations from design intent are investigated by systematically applying the guide words to
attributes such as dataflow, control flow, data rate, data value, event, action, repetition
time, response time and encoding.
Not all combinations of guide words and attributes are meaningful. The guideline
recommends that 'inappropriate guide words should be removed from the study list during
the planning stage' and 'the interpretations of all attribute/guide word combinations should
be defined and documented by the study leader'. At the discretion of the study leader, new
guide words may also be added.
Fink et al have devised a set of application-specific guide words and deviations. The
application is a clinical laboratory information system where patient test details are kept
Access to the system is provided via computer terminals, and it is interfaced to computers
which control large capacity analysers (7000 tests/hr). Patient information, including patient
identity and test request code, is entered into the system and sent to the analysers. Each
sample tube also has a label identifying the patient from whom the sample was drawn.
The guide words used for the Chazop of this system were: no, not, more, less, as well as,
part of, other than, sooner, later, where else, interrupt, reverse, more often and less often.
Example deviation for the guide word no are no label and no operating. Chazop was used
to consider complex and interrelated procedures. A complementary technique, FMECA,
was used to consider individual component failures.
4.2 Scheme 2
In developing guidelines for carrying out Chazop on computer-controlled plants, Andow's
approach is that a Chazop methodology should have the essential ingredients of the
'traditional' Hazop but need not stick rigidly to the format. The ingredients identified as
essential are:
interdisciplinary team must carry out the study,
the methodology must be based on questions;
the methodology must be systematic.
6 RE A D I N G 3 .3 HAZ AR D AN D
O P E R AB I LI T Y
( HAZ O P ) S T U D I E S
AP P LI E D T O
C O M P U T E R -
C O N T R O LLE D
P R O C E S S P LAN T S
UN
IT 4
15
E
NG
INE
ER
ING
RIS
K M
AN
AG
EM
EN
T
Andow suggests that Chazop should be done in two stages: preliminary and full. The
purpose of a preliminary Chazop is to identify early in design critical factors that influence
the overall architecture and functionality of the system; it should be carried out as part of an
early Hazop. He recommends that the following be considered at the early stage:
the proposed architecture of the system;
safety-related functions;
system failure;
failure of power and other services.
The full Chazop is to evaluate the design in detail at a later stage. The team should consider
three different aspects of the system:
computer system/environment;
input/output (I/O) signals;
complex control schemes.
A short list of headings and/or questions is provided for each aspect (see Tables 2.4, 2.5 and
2.6).
4.3 Scheme 3
Lear suggests a Chazop scheme for computer control systems which is similar to Andow's
full Chazop. In Lear's scheme the three top level concerns are:
hardware;
continuous control;
sequence control.
In this scheme guide words used for hardware include short- and long- term power supply
failure. It also suggests using the check-list published by the UK Health and Safety
Executive. Examples of guide words/questions relating to continuous control and sequence
control are shown in Tables 2.7 and 2.8.
Table 2.4: Headings and questions relating to computer system/environment (after Andow)
Failure Hardware Question
Gross Whole machine What should happen?
Will the operator know?
What should he do?
Will the failure propagate to
other machines?
Any changes needed?
Random Cabinets, crates, etc (similar to whole machine)
Controller, I/O cards (similar to whole machine)
Communication links (similar to whole machine)
Operator consoles (similar to whole machine)
Power supplies (similar to whole machine)
Watchdog timers (similar to whole machine)
Other utilities (similar to whole machine)
7 RE A D I N G 3 .3 HAZ AR D AN D
O P E R AB I LI T Y
( HAZ O P ) S T U D I E S
AP P LI E D T O
C O M P U T E R -
C O N T R O LLE D
P R O C E S S P LAN T S
UN
IT 4
15
E
NG
INE
ER
ING
RIS
K M
AN
AG
EM
EN
T
Table 2.5: Headings and questions relating to input/output signals (after Andow)
Signal/actuator Deviation Question
Signal Low Does it matter?
Will the operator know?
Any action required by the
operator or other systems?
Any changes needed?
High (similar to deviation low)
Invariant (similar to deviation low)
Drifting (similar to deviation low)
Bad (similar to deviation low)
Actuator Driven/failure high (similar to signal deviation low)
Driven/failure low (similar to signal deviation low)
Stuck (similar to signal deviation low)
Drifting (similar to signal deviation low)
Table 2.6: Considerations relating to complex control schemes (after Andow)
Scheme consideration Aspects to be considered
Purpose and method of operation Safety-related functions
I/O signals used
Points of operator access Set-points, cascades that may be
made or broken, etc
Limits applied Careful use of limits gives a good
safeguard and/or early warning
Interaction with other schemes Start-up, normal operation, shutdown.
Synchronization and timing issues.
Expected or required operator
actions.
Controller tuning Initialization and wind-up
Relationships with trips and alarms
Action in the event of major plant
upsets
Loss of utilities. Spurious or correct
operation of emergency shutdown
valves.
Protection against unauthorized
modifications
Other Spreading a large scheme over more
than one controller file
4.4 Scheme 4
The Chazop framework used by Nimmo et al for reviewing process plant design also
highlighted three aspects for consideration:
hardware;
software interactions;
the effect software has on the process.
8 RE A D I N G 3 .3 HAZ AR D AN D
O P E R AB I LI T Y
( HAZ O P ) S T U D I E S
AP P LI E D T O
C O M P U T E R -
C O N T R O LLE D
P R O C E S S P LAN T S
UN
IT 4
15
E
NG
INE
ER
ING
RIS
K M
AN
AG
EM
EN
T
In this scheme, the first stage is to carry out a conventional Hazop on a plant design;
treating the computer as a 'black box' (see Chapter 1, item 4.1, page 17). The next stage is
to re-trace the process route taking into account concerns from the first stage but this time
concentrating on determining how the software will respond under different circumstances.
The third stage is to consider how the software achieves its control actions. The software is
divided into major areas such as sequence control, continuous control, operator
conversations and data links. Key enquiries in the second and third stages revolve around
such questions as:
how will the computer know what it has to do or has already done?
how sensitive is the level of input or output to transmission of the correct action?
what are the potential interactions?
Table 2.7: Considerations for continuous control (after Lear)
System Consideration
Input/output parameters Bad measurement
Transmitter accuracy
Conditioning
Tuning parameters Correct?
Change in process conditions
Entire loop Control philosophy
Safety-related
Performance
Overall system Interaction
Order of tuning/implementation
Training
Table 2.8: Considerations for sequence control (after Lear)
Review stage Consideration
Overall operation Files/reports
What (de)activates the sequence?
Communications
Start-up module Is operator interaction required?
Any areas of critical timing?
Major equipment interactions
Running module (similar to start-up)
Shutdown module (similar to start-up)
Step (a small number of
flow chart symbols)
(similar to start-up)
Final overview Testing
Display of sequence to operator
Training
Nimmo also provides several lists of topics for discussion in a series of Chazop meetings.
The discussion topics are listed under the following headings: the overall plant, the safety
backup system, instrumentation and the PES.
9 RE A D I N G 3 .3 HAZ AR D AN D
O P E R AB I LI T Y
( HAZ O P ) S T U D I E S
AP P LI E D T O
C O M P U T E R -
C O N T R O LLE D
P R O C E S S P LAN T S
UN
IT 4
15
E
NG
INE
ER
ING
RIS
K M
AN
AG
EM
EN
T
4.5 DISCUSSION
Ideas on how Chazop should be done are still evolving. A consensus view that is emerging
is that a Chazop methodology requires a 'total' system view. Software cannot be considered
in isolation. The work by Burns and Pitblado emphasizes the need to assess the logic of the
system and also human factors; Fink et al couple Chazop with FMECA; the frameworks
suggested by the other authors also include hardware, software and the environment in
which they operate. The main strength of conventional Hazop is that it facilitates systematic exploratory
thinking. The use of guide words and deviations prompts the team to think of hazards
which they would otherwise have missed. However, up to now, attempts made by
researchers and engineers to create various Chazop 'schemes and to derive guide
words/headings and questions are rather ad hoc. Some guide words, headings or questions
are obvious as they appear in different, schemes. On the other hand, it is not clear why
some are included and why some are left out. It is difficult to assess the relative merits of
the different schemes as there is very little experience in applying them. The relevance of
various guide words or questions will only become evident through practical applications.
An overview of the above schemes shows that there are different methods of generating and
grouping guide words/deviations and questions. Scheme 1 follows very closely the format
of conventional Hazop. The procedure is based on selecting interconnections in the design
representation. However, it concentrates on identifying hazards rather than operability
problems. New guide words and computing-related attributes are proposed. It is
recognized that the combinations of some of the guide words/attributes may not be
meaningful or may be ambiguous. On the other hand, application-specific attributes are not
likely to be useful in general because safety-critical systems can be very varied. Schemes 2 and 3 group guide words and questions according to the general categories of
hardware, software, input/output and other considerations. This approach attempts to cover
the total system separately. It is very important, however, to understand and consider the
interactions between different system components in order to identify hazards in a complex
safety-critical system. This approach falls short in this respect. Scheme 4 makes a strong distinction between hardware and software. However, the
strength of this scheme is that the assessment procedure is geared towards understanding
how the computer will respond to a process deviation and how the computer will control
and affect the process. This scheme provides an interesting way of linking Chazop with
conventional Hazop for the process industry. The problem is that the Chazop scheme as
outlined cannot be applied in the early stages of the design process to identify any potential
problems. Instead of trying to synthesize a new scheme by merging different schemes or by modifying
a particular scheme, in the next section we consider the systematic development of a new
Chazop methodology based on incident analysis. Our aim is to develop a general Chazop
methodology that will apply to different industrial sectors. Past incidents provide us with a
wealth of information on what can go wrong with safety-critical systems. Our basic premise
is that this information can be organized to provide a structured framework for considering
future applications. Source: Kletz, T., Chung, P., Broomfield, E. & Shen-Orr, C. Computer Control and
Human Error, Institution of Chemical Engineers, Warwickshire, UK, 1995:
45–56.
References omitted.
RE A D I N G 3 .4
USING A MODIFIED HAZOP/FMEA METHODOLOGY FOR ASSESSING SYSTEM RISK
STEVEN R. TRAMMELL & BRETT J. DAVIS
1. REASONS TO USE RISK ASSESSMENT
Many regulatory programs and customer quality and environmental management
expectations have been the impetus for Motorola to institute risk management processes
utilizing both qualitative and quantitative risk assessment techniques. As briefly described
below, in some cases the regulator or customer has prescribed the risk assessment
techniques to be used for risk management, while in other cases there is leeway given to
select a risk assessment technique of choice.
Motorola's experience in the implementation of these risk management activities has
demonstrated the synergistic benefits from cross-functional risk assessments of process
designs and modifications.
Participation by environmental and safety compliance, operations, maintenance and
engineering functions allows for risks to be properly ranked and for agreement on
acceptable levels of residual risk. We have founded a risk assessment "core team" that
facilitates and keeps records of many of the required risk assessments as well as those
initiated by Motorola for process quality assurance and control. For these latter
assessments, the core team has developed a risk assessment technique that is tailored to
effective analysis of a wide range of our processes. The team also keeps the formal records
of risk assessments, ensuring the tracking of best practices and lessons learned.
2. REGULATORY REQUIRED RISK ASSESSMENTS
The United States Environmental Protection Agency's (EPA) Risk Management Program
(RMP) prescribes a risk assessment methodology for listed substances above an established
storage quantity threshold. Risk is determined by calculating the "populations potentially
affected" by worst and alternative case releases of gases and vapors. In this risk assessment,
risk is essentially equated to consequence alone. Likelihood is not quantified, but the
program attempts to reduce it by mandating the development of release prevention and
response plans.
The United States Occupational, Safety and Health Administration's (OSHA) Process
Safety Management (PSM) program requires risk assessments, known as hazard analyses,
for listed substances above an established storage quantity threshold. A variety of risk
assessment methodologies are identified as acceptable under the standard, including Hazop
and FMEA. In addition, the program calls for written procedures for management of
change. While Motorola does not have any above threshold processes for either the RMP
or PSM programs, we have accepted our responsibilities under the General Duty Clause of
2 RE A D I N G 3 .4 US I N G A
M O D I FI E D
HAZ O P / FM E A
M E T HO D O LO G Y
FO R AS S E S S I N G
S Y S T E M R I S K
UN
IT 4
15
E
NG
INE
ER
ING
RIS
K M
AN
AG
EM
EN
T
the RMP program to perfonn risk assessments on a variety of hazardous chemicals and
wastes, stored in quantities below the RMP and PSM thresholds. OSHA's Voluntary
Protection Program requires Job Safety Analyses (JSA) be performed to ensure that safety
is considered in the development of operational procedures. At Motorola we perform JSAs
to identify hazards and develop procedures or physical system changes required to perform
tasks safely. JSAs are also used to comply with OSHA regulations (29 CFR 1910.132)
requiring employers to base selection of personal protective equipment on a hazard
assessment of the subject work process.
The Uniform Fire Code (UFC) allows the chief to authorize "alternate materials and
methods" that comply with the "intent of the code" (1997 UFC 103.1.2). The Austin Fire
Department (AFD) encourages the use of quantitative risk to compare the level of risk
provided by code compliant design and an alternative. Motorola has used Fault Tree
Analyses (FTA) to accomplish this comparison and successfully demonstrate that an
alternative design is safer than that prescribed by the UFC. AFD has recently implemented
a "distinct hazard" policy prohibiting bulk chemical storage operations that represent a risk
exceeding 1.4 x 10⁻⁶ exposed persons per year. This risk equates to the generally accepted
risk from underground storage at a gasoline station. The risk calculation is a function of
consequence determined using a gas dispersion model and population density, and
probability of component failure and fire, using established component failure rates and fire
rates based upon AFD experience. Motorola has developed a spreadsheet that allows an
assessment of whether or not any proposed bulk chemical system will be designated as a
distinct hazard, in which case risk reduction strategies are employed typically to reduce the
likelihood ofrelease.
3. CUSTOMER REQUIRED RISK ASSESSMENTS
ANSI/ISO 14001-1996 requires an annual analysis of potential impacts from
"environmental aspects" of an operation for the determination of environmental objectives.
At Motorola, ranking the impacts using a quantitative risk assessment methodology
prescribed in a Management Systems (MS) document enhances this analysis. Action items
are assigned to environmental staff to reduce the severity and/or likelihood of any impacts
above an acceptability threshold established in the MS document. In addition, formal and
informal processes are in place to identify pending process changes requiring risk
management.
Motorola's semiconductor manufacturing operations are required to be QS9000 certified by
our automotive industry customers. The QS system mandates management of change to
minimize impact to product quality. At Motorola, this objective is accomplished by
performing an FMEA risk assessment on all new or modified processes, including
environmental and safety systems.
4. MOTOROLA REQUIRED RISK ASSESSMENTS
Motorola requires that all semiconductor manufacturing equipment that it purchases be
compliant with Semiconductor Equipment and Materials International (SEMI) Safety
Guideline S2, Environmental, Health and Safety Guideline for Semiconductor
Manufacturing Equipment which establishes a risk assessment requirement for a variety of
hazards posed by such equipment. The technique to be used for these risk assessments, in
which hazards are ranked to determine which are acceptable and which require further
mitigation, is prescribed in SEMI S1O, Safety Guideline for Risk Assessment.
3 RE A D I N G 3 .4 US I N G A
M O D I FI E D
HAZ O P / FM E A
M E T HO D O LO G Y
FO R AS S E S S I N G
S Y S T E M R I S K
UN
IT 4
15
E
NG
INE
ER
ING
RIS
K M
AN
AG
EM
EN
T
And finally, for quality assurance of new processes and quality control of process
modifications, Motorola has developed a hybridized Hazop and FMEA technique that is the
primary focus of this paper. The risk prioritization method developed for this technique
allows separate consideration of risks to human safety, the environment, facility or product
damage and business interruption. Because of this multiple functionality, this hybrid
Hazop/FMEA technique has been well accepted by the Environmental, Health and Safety,
Facilities Operations, Maintenance and Engineering, and Manufacturing Operations
functions. Process designs are no longer considered complete until a thorough
Hazop/FMEA has been performed.
5. DEVELOPMENT OF THE HAZOP + FMEA METHODOLOGY
The purpose of developing a risk assessment methodology is to provide a systematic
method to thoroughly review failure modes of complex, interacting system components, and
the effects of failures on the overall system. Required within the methodology is the
requirement and ability to review effects on safety of personnel, the facility and/or
infrastructure, and on the manufacturing process (ability to manufacture good product).
The addition of the business interruption review element was a logical evolution of the
methodology. Although the analysis method could be applied to individual EHS and
system reliability evaluation efforts, it is clearly evident that much commonality exists, both
in review team members and solution development when reviewing overall effects of failure
events. Accordingly, we realize significant efficiencies when combining EHS and
reliability assessments with regard to utilization of personnel resources.
6. METHODOLOGIES
Several risk assessment methodologies are used within Motorola. The Hazop and the
FMEA are most common, although Fault Tree Analysis has been used for specific
assessment efforts involving fire and building code alternative method submittals. Hazop
has historically been used as a general risk assessment technique on systems to evaluate
potential hazards mainly to personnel and the environment. This method is favored by
many of our design consultants because of its relative ease of use, ability to draw on diverse
expertise and proven track record in the chemical processing industry. Many of the risk
assessments performed by third party evaluators on purchased equipment or packaged
chemical delivery systems are of the Hazop type. The FMEA is the method of choice for
the Reliability and Quality Assurance (R&QA) organizations within Motorola. Although
used mainly for evaluations in the product design phase, process systems and some support
systems within the manufacturing envelope have also been subject to FMEA. The primary
driver for use of this methodology within R&QA is the requirements set by QS9000. All of
our automotive customers require Motorola to comply with the methods within QS9000,
including the requirement to systematically review a system for failure modes.1 Although
FMEA is not mandated, it is the method most preferred by the customer.
7. STRENGTHS AND WEAKNESSES
Hazop is a mature methodology, with system failure mode identification as its strength. By
dividing complex systems into smaller more manageable "nodes" for study, and the
systematic identification of process parameter deviations, makes for a thorough
identification of system failure modes. However, a typical Hazop is not strong or
necessarily effective in prioritization of effects of the failures. Also, a Hazop usually does
not study the relative effectiveness of identified corrective actions. On the other hand, the
4 RE A D I N G 3 .4 US I N G A
M O D I FI E D
HAZ O P / FM E A
M E T HO D O LO G Y
FO R AS S E S S I N G
S Y S T E M R I S K
UN
IT 4
15
E
NG
INE
ER
ING
RIS
K M
AN
AG
EM
EN
T
QS9000 based FMEA method contains a thorough, semi-quantitative evaluation of effects
of failure modes. By studying and scoring based on severity, occurrence and detection
attributes, the team gains a thorough understanding of the failure mechanism, and more
importantly, insight on determining truly effective corrective actions. The FMEA method
also assists in prioritizing failure mode effects such that resources can be applied more
effectively. Conversely, the FMEA is relatively weak in failure mode identification, as it
does not provide a systematic method of evaluating system deviations (other than reviewing
every individual component and subcomponent of a system). This "bolt-by-bolt" approach
is extremely laborious and can become an extreme challenge to the long-term efficiency of
the study team.
8. HAZOP+FMEA
Historically, certain groups within Motorola's Environmental Health and Safety (EHS) and
Facilities organizations have used both Hazop and FMEA methods with varying degrees of
success. As EHS moved towards a risk-based approach for decision making and as the
importance of facility support systems' reliability grew, both organizations were looking for
techniques that would improve the quality of these studies. It was also observed during a
number of FMEA studies, that the review team struggled with the basic concept of failure
mode identification. The typical component-by-component review was taking a
considerable amount of time, and the teams were becoming frustrated with the fact that the
majority of components assessed had minimal if any impact on the system. Soon the teams
were skipping review of sometimes potentially critical components based solely on the
perception that no potential hazard existed. This led to a "shotgun" type approach to failure
mode identification as the team members picked system components to review based on
personal history or experience. It was clear that a structured approach to system evaluation
was needed. Our experience with Hazop led to the idea that if the failure mode
identification method utilizing the concept of deviations from known or expected process
parameters could be married to the strong scoring mechanism of the FMEA, the overall
methodology could be improved. Documentation of typical Hazop and FMEA studies was
reviewed, and with slight modification of our QS9000 based FMEA spreadsheet, we were
able to develop a documentation scheme which captured results from our Hazop-type
failure mode identification method, while keeping the risk scoring and prioritization method
used in the FMEA.
9. HAZOP AND FMEA METHODOLOGY
The starting point for the Hazop/FMEA process is to obtain a complete set of the piping and
instrumentation diagrams. If the design is still in progress, the FMEA should be delayed
until the design is complete, because the process review will be a better product if the
design package is fairly complete. A key point in the process is for the facilitator to keep
the team focused on evaluation of the failure modes and to avoid the tendency to try to
"engineer" the corrective actions. Determining improvements to the design has a place in
the FMEA process; however, this should take place in an orderly fashion. The FMEA
process is more efficient if the role of facilitator and scribe are kept seperate.
The challenge of evaluating a complex piping diagram is overcome by breaking the system
into manageable sections. These are typically called nodes for the purposes of the study.
Nodes are sections of the design with definite boundaries, such as line sections between
major pieces of equipment, tanks, pumps, etc. The power of the Hazop lies in identifying
the failure modes through the Hazop deviation. The Hazop utilizes process parameters and
5 RE A D I N G 3 .4 US I N G A
M O D I FI E D
HAZ O P / FM E A
M E T HO D O LO G Y
FO R AS S E S S I N G
S Y S T E M R I S K
UN
IT 4
15
E
NG
INE
ER
ING
RIS
K M
AN
AG
EM
EN
T
guidewords to systematically identify deviations to the system or failure modes. An
example of a guidewords and process parameters chart is shown in the following:
Hazop Guidewords Process Parameters
No Flow Voltage
Less Level Addition
More pH Temp.
Part of Time Speed
As Well As Viscosity
Reverse Pressure
Other Than Information Deviations to be evaluated would be "no flow", "less flow", "more flow", "reverse flow",
etc. As these deviations are identified, the Hazop node and the deviation are logged on the
worksheet. Hazop deviations are noted on the FMEA worksheet as potential failure modes.
Each of these deviations are reviewed to determine the consequences and logged onto the
FMEA worksheet as potential Effects failure. The Hazop causes are logged onto the FMEA
form as Potential Cause Mechanisms. Note the worksheet in Figure 1. Figure 1: Hazop/FMEA Methodology Worksheet
FMEA WORKSHEET Issue: 0 Project Title: Control Number/Issue: FMEA Type: Design System Company/Group Site/Business Unit: Prepared By: (Rev.) Core Team: Process Function/ Requirements (Hazop Node/Item)
Potential Failure Mode (Hazop Deviation)
Potential Effect(s) of Failure (Hazop)
SEV
Potential Cause(s)/ Mechanisms (Hazop Causes)
OCC
Current Design/ Process Controls
DEF
RPN
Recommended Action(s)
SEV
OCC
DET
RPN
The next step in the FMEA evaluation is the rating of the severity, occurrence and detection
of the failure modes and effects. The following definitions are used: Severity: A rating corresponding to the seriousness of an effect of the potential failure
mode. Occurrence: An evaluation of the rate at which a first level cause and the failure mode will
occur. Detection: A rating of the likelihood that the current controls will detect/contain the failure
mode before it affects persons, process or the facility. Each of the nodes of the diagram are
evaluated and then rated using the FMEA method. The severity of the "Potential Effect of
Failure", the occurrence of the "Potential Cause Mechanisms" and the detection of the
"Current Design/Process Controls" are ranked by the cross-functional FMEA team. A
6 RE A D I N G 3 .4 US I N G A
M O D I FI E D
HAZ O P / FM E A
M E T HO D O LO G Y
FO R AS S E S S I N G
S Y S T E M R I S K
UN
IT 4
15
E
NG
INE
ER
ING
RIS
K M
AN
AG
EM
EN
T
typical ranking scale is integer values from 1 to 10. A standardized scoring chart should be
used to maintain consistency. A typical scoring chart is shown in Figure 2. Figure 2: Hazop and FMEA Scoring Chart
Severity Severity is a rating corresponding to the seriousness of an effect of the potential failure mode.
Occurrence Occurrence is an evaluation of the rate at which a first level cause and the failure mode will occur.
Detection Detection is a rating of the likelihood that the current control will detect/contain the failure mode before it affects persons, process or facility.
1 No effect on people. No production impact. Process utility in spec. System or equipment or operations failures can be corrected after an extended period.
Failure unlikely in similar processes or products. No Motorola or industry history of failure. <1x10⁻⁶
(1 event in 114 years)
Reliable detection controls are known with similar processes or products. Online instrumentation with automated controls to prevent failure. Example: UPW return divert system automatically activated by low resistivity.
2 People will probably not notice the failure. Nuisance effects. No production impact. Process utility in spec. System or equipment or operations failure can be corrected at next scheduled maintenance.
Remote chance of failures. <5x10⁻⁶ (1 event in 23 years)
History with similar processes or products is available. Online instrumentation with trend data indicating potential failure with no automatic controls. Example: Online resistivity with automated data acquisition.
3 Slight effects. No injury to people. No production impact. Process utility in spec. Equipment or operations failures to be corrected ASAP.
Very few failures likely. <1x10⁻⁵ (1 event in 11 years)
Controls highly likely to detect the failure mode. Online instrumentation with no trend data or controls to potentially prevent failure.
4 Minor effects. No injury to people. No production impact. Process utility in spec. Equipment or operation failure to be corrected immediately.
Few failures likely. <5x10⁻⁵ (1 event in 2.3 years)
Controls likely to detect the failure mode. Advanced predictive maintenance program utilizing SPC to predict failure, or monitoring performed several times daily. Example: vibration analysis, operator rounds.
5 No injury to people. No production impact. Process utility out of spec. No tool impact. No product scrap.
Occasional failures. <1x10⁻⁴ (1 event per year)
Controls might detect the failure mode. Preventative maintenance based on daily monitoring and performed less than the average failure frequency.
6 No injury to people. Production impact confirmed or likely. Critical process utility out of spec. One or more production tools impacted. Possible product scrap.
Moderate number of failures. <5x10⁻⁴ (1 event every 3 months)
Low likelihood that controls will detect the failure mode. (Highest reliable human-only based control method). Preventative maintenance program. Example: scheduled lubrication, operator observations or walk by.
7 No injury to people. Production outage < 8 hrs. Critical process utility outage < 4 hrs, or severely out of spec < 4 hrs. Product scrap likely.
Frequent failures likely. <1x10⁻³ (1 event every 1.5 months)
Slight likelihood that controls will detect failure mode. (Typical human-only based control). Once weekly observation by operators or laboratory testing.
7 RE A D I N G 3 .4 US I N G A
M O D I FI E D
HAZ O P / FM E A
M E T HO D O LO G Y
FO R AS S E S S I N G
S Y S T E M R I S K
UN
IT 4
15
E
NG
INE
ER
ING
RIS
K M
AN
AG
EM
EN
T
8 Possible minor injury or regulatory investigation. Production outage < 24 hrs. Critical process utility outage 4–12 hrs or severely out of spec 4–12 hrs. Substantial product scrap likely.
High number of failures likely. <5x10⁻³ (1 event per week)
Controls unlikely to detect the failure mode. Maintenance performed when problem is indicated. Random or quarterly maintenance program.
9 Possible major injury or regulatory action. Production outage < 48 hours. Critical process utility outage 12–24 hrs or moderate contamination of cleanroom or process utility. Substantial product scrap likely.
Failures certain to occur in near future. Some company or industry history. <1x10⁻² (2 events per week)
Controls remotely likely to detect the failure mode. No maintenance program.
10 Possible severe injury or regulatory action will occur. Production outage > 48 hrs. Critical process utility outage. 24 hrs or severe contamination of cleanroom or process utility. Substantial product scrap likely.
Certain to occur soon. Significant company or industry history. <1x10⁻¹
(3 events per day)
Controls are almost certain not to detect the failure mode. No controls are available or no practical or scientific method to detect failure.
Each of the parameters is ranked and multiplied together. The Risk Priority Number (RPN)
is the product of Severity, Occurrence and Detection rankings. The RPN values should be
used to rank order the concern in the process in Pareto fashion. The resulting RPNs are
evaluated for recommended actions that could reduce the calculated risk through corrective
actions. Corrective action should be directed at the highest ranked RPN. Effort should be
applied to identify positive corrective actions to minimize risk from the failure mode by
eliminating or controlling the potential cause mechanisms. The effect of the recommended
actions can be re-evaluated for the Severity, Occurrence, and Detection with the resulting
RPN noted. Properly applied, the FMEA ranking method is an interactive continuous
improvement process that can be used to minimize the system risk.
10. CONCLUSION
Multiple assessments using the Hazop+FMEA methodology have been performed to date.
In all cases, the diverse teams of EHS, Facilities, Maintenance, Engineering and
Manufacturing worked well and efficiently with the method. It was noted that about 15
minutes of method description with simplistic worked samples was enough to orient the
team to the method. Within an hour of the meetings, all team members were fully engaged
and participating in the review. One key to maximizing effectiveness was the presence of a
strong facilitator familiar with the methodology and a dedicated scribe recording the results.
Another key to the success of the method is the previous familiarity of most manufacturing
personnel to the QS9000 FMEA method. This "automatic" buy in of the scoring criteria
resulted in minimal debate on validity of the method.
NOTE
1. "Potential Failure Mode and Effects Analysis (FMEA) Reference Manual"
ASQC/AlAG, Second Edition, Feb 1995.
Source: Proceedings of Engineering Management for Applied Technology (EMAT)
2001, 2nd International Workshop, 16–17 August: 47–53.
RE A D I N G 3 .5
PRELIMINARY SAFETY ANALYSIS
GEOFF WELLS, MIKE WARDMAN & CRIS WHETTON
Various major safety studies are carried out at appropriate stages during a project. Many
companies do some form of preliminary analysis at points between initial project concept
and when the process design is completed. These studies aim to ensure that the decisions
on process design and site selection take full account of process safety requirements and
related risk and environmental constraints. Methods have been incorporated and developed during this work to take account of best
industrial practice for such safety studies. These are listed under the general heading of
preliminary safety analysis (PSA) and are carried out from the time of the concept safety
review until such time as reasonably firm process flow diagrams or early P & I diagrams
are available. The methods included are as follows:
concept safety review (CSR)
critical examination of system safety (CE)
concept hazard analysis (CHA)
preliminary consequence analysis (PCA)
preliminary hazard analysis (PHA). These have been developed from a model of the plant and its interpretation as part of an
incident scenario. The emphasis throughout is on utilizing the best points to start the
search to identify undesired events contributing to the development of accidents. For the main method described, preliminary hazard analysis, this search has as its starting
point and fulcrum the 'dangerous disturbances of plant' which arise at a point in the
incident scenario just after emergency control measures have failed to control the
situation. The study should be conducted using risk evaluation sheets which model each
stage of the incident scenario and allow for a short-cut assessment of risk when this is
desired. The above methods are demonstrated by part of a simplified case study. The methods
function well and provide not only a good model of incident scenarios but are readily
developed into fault and event trees and operating procedures. They are invaluable for the
development of safety reports for regulatory authorities. Furthermore, by not imitating
HAZOP methods they strengthen the effectiveness of the search process. THE PURPOSE OF PRELIMINARY SAFETY ANALYSIS
Preliminary safety analysis is a systematic approach to the identification of potential
hazards and hazardous conditions which is carried out at an early stage of the design of the
plant, before the commencement of detailed engineering (except for specially selected
items). It aims to make safety objectives more readily tenable by subsequent design,
engineering, realization commissioning and productive methods. It suggests ways to
challenge the design and encourages an understanding of the consequences of failures as
well as identifying the principle incident scenarios stemming from deviations from normal
or expected behaviour.
2 RE A D I N G 3 .5 P R E LI M I N AR Y
S AFE T Y AN ALY S I S
UN
IT 4
15
E
NG
INE
ER
ING
RIS
K M
AN
AG
EM
EN
T
The objective of a preliminary safety analysis is not to identify all possible scenarios and
initiators of incidents.1 It is to consider any impact (either safety, health or environmental)
which the project may have either on-site or off-site and identify significant hazards.
Special attention is paid to loss of containment leading to a significant release of material
which can have major consequences, usually resulting in harm or damage to the system and
its total environment. The preliminary safety analysis should also identify those changes to
process conditions which could lead to an adverse discharge leading to the consent levels
for gaseous, liquid or solid effluents being exceeded. Where the project can create
significant on-site or off-site impacts, then the risk of such consequences should be
evaluated and compared with appropriate criteria in order to determine whether further
action must be taken to reduce the risk or abandon the project in its present form. In some
cases a quantified risk analysis should be completed.
Concept safety review follows or is incorporated in the review of the scope of the project
and the means for an early assessment of safety, health and environmental hazards. It links
in with other project work beginning at this time and contributes to key policy decisions
such as siting and preferred route.
A concept hazard analysis is used for the identification of hazard characteristics to identify
areas which are recognized as being particularly dangerous from previous incidents. It also
identifies the need to explore any difficulties which might be experienced with unwanted
reactions. As well as identifying environmental damage, the analysis may also consider
whether the proposal fulfils the 'green' policies of the company.
A critical examination of system safety is used either to eliminate or to reduce the possible
consequences of a hazardous event by an early study of the design intent of a particular
processing section. This should be carried out at an early stage and well before the process
design is completed.
A preliminary consequence analysis can be used to identify likely major events. Such
studies assist in the selection of the site if this is a required project objective. This is an
abbreviated form of preliminary hazard analysis in which gross assumptions are made for
the frequency of events. It enables the major events which may result from the process to
be identified. The event tree section of the HAZCHECK knowledge base provides the
necessary information on the development of incident scenarios.
A review of health hazards should consider measures proposed to prevent employees being
exposed to either chronic or acute health hazards and should be carried out considering
periodic emissions and fugitive emissions.
A preliminary hazard analysis is undertaken to identify applicable hazards and their
possible consequences with the aim of risk reduction, i.e. to reduce the frequency of
significant consequences to an extent that is comparable with project and manufacturing
objectives and which meets the constraints imposed by regulatory and local authorities. It
should be carried out at a stage when change in the design is still possible.
The methods listed above are a compilation of techniques used in industry. Several of these
have been described by Turney 19902 and James 19923. This work has modified the way
they are carried out and has modified the documentation procedure. The technique
developed for preliminary hazard analysis is, as far as we are aware, original.
3 RE A D I N G 3 .5 P R E LI M I N AR Y
S AFE T Y AN ALY S I S
UN
IT 4
15
E
NG
INE
ER
ING
RIS
K M
AN
GE
ME
NT
CONCEPT SAFETY REVIEW (CSR)
At the start of a preliminary safety analysis the analyst and others should carry out a
preliminary concept review. This is carried out as early as possible, sometimes during
process development.
The objectives and scope of the project should be previewed and defined. This should
include general information about the development plan and the plant or object being
analysed. It is particularly important to ascertain the need for a range of options including
process development, available processes and whether these will be licensed, the
availability of alternative sites and modes of transport of raw materials and products, the
availability of experience within the company and site etc. It may be that a particular
project does not require study of all these items and it is as well to make such matters clear
at the start. Subsequently the concept safety review should determine the need for safety
reviews and their timing.
Information should be obtained on the safety, health and environmental hazards of all
chemicals and materials involved in the new process. This should take account of both
individual and collective properties of materials. Helpful information is contained in
regulations such as COSHH and CIMAH in the UK. General appreciation should also be
generated of the main hazards presented by the plant such as fire, explosion and release of
harmful substances such as toxic gases and liquids, effluent, radioactive and corrosive
materials etc.
The study should review information on previous incidents on the plant using both
information available on incidents within the company and its affiliates and information
available from global sources. For a project under development the latter information
should be augmented by studies of the route and incidents affecting plants using related
reactions.
At each site under consideration it is necessary to consider on-site and off-site transport of
raw materials, products and wastes including loading, off-loading, type of transport and
route. The requirements for facilities and services, emergency planning, interaction with
other plants etc. must be examined.
The study should consider all organizational factors affecting the project including the
availability of experienced staff both within the company and at the site. This experience
should be reviewed in terms of general experience, experience of related plants and specific
experience of the plant. Means to overcome any problems should be discussed. The impact
of the plant on the general health and safety management policy of the site should be
identified. Criteria should be established for all safety, health and environmental factors
with which the plant must comply together with relevant company standards, national
legislation and other regulatory approvals and consents. Any effect on the position of the
site with respect to effluents and emissions and status under CIMAH regulations must be
reviewed. General project criteria should be defined including the codes of practice to be
followed and the extent and timing of all safety reviews.
The preliminary concept safety review should be a means by which improvements in design
procedures are made known to the designers and by which it is ensured that current thinking
on ways of improving the design practice is implemented.
4 RE A D I N G 3 .5 P R E LI M I N AR Y
S AFE T Y AN ALY S I S
UN
IT 4
15
E
NG
INE
ER
ING
RIS
K M
AN
AG
EM
EN
T
CONCEPT HAZARD ANALYSIS (CHA)
The concept hazard analysis must identify the hazardous characteristics of the project. A
hazard has the potential to cause harm, including: ill-health and injury; damage to property,
plant, products or the environment; production losses; business harm and increased
liabilities. Ill-health includes acute and chronic ill-health caused by physical, chemical or
biological agents, as well as adverse effects on mental health. Hazards are system
independent. They can be split into the categories: chemical, thermodynamic, electrical and
electromagnetic and mechanical. Chemicals can be further subdivided into toxics,
flammables, pollutants and reactants. Further lists can be used to identify health hazards. A
hazard is any potential source of threat or potential danger. There is a need to identify
external threats to the system and these include unplanned changes in the plant or its use.
It is important to distinguish between a hazard and a hazardous condition. A hazard is
solely a qualitative term but a hazardous condition includes a quantitative element in its
description of a hazardous state, e.g. the amount of hazardous material used. It is not an
undesired event in itself, but has the potential to induce one or more undesired or dangerous
events. Hazardous characteristics embrace both hazards and hazardous conditions. Hence
when reference is made to hazard identification, it is more often than not the identification
of hazardous characteristics which is of concern. After all a hazard can be identified with
relative ease. It is the impact of a hazard and the frequency of occurrence which is difficult
to estimate.
The structure of a concept hazard analysis
The methodology of a concept hazard analysis is shown in Table 1.
Table 1: Methodology of a concept hazard analysis
Assemble a study team
Define the objectives and scope of the study
Agree a set of keywords
Partition each process flow diagram or block diagram into reasonably-sized sections
Identify the dangerous disturbances and consequences generated by each keyword
Determine if the hazard can be designed out or the hazard characteristics reduced
Determine any protections and safeguards
Determine comments and actions
Report using proforma
A concept hazard analysis may be commenced at a stage when the block diagrams or a
preliminary process flow diagram are available. It aims to identify the main hazards which
the proposed plant will generate or face. The approach used can vary considerably from a
general identification of hazards to a thorough look at each section of plant. Usually each
section of the plant is evaluated at a preliminary meeting considering the items given in
Tables 2 and 3.
A list of streams and substance characteristics should be prepared beforehand by process
engineering. A brief review of each stream is generally helpful and describes the process.
The report should be updated as actions are taken or resolved with respect to safeguards and
the assembly of further information. As fresh hazardous conditions are identified these can
be incorporated within the record for appropriate action.
The keywords in Tables 2 and 3 are related to specific hazardous events. The perceived
dangers are noted together with suggestions for safeguards (the latter denoting a general aim
rather than an actuality). Appropriate comments are added for action. As well as
identifying general hazards the opportunity is taken to add any specific hazards for which
the equipment has previously given problems. Various companies use different keywords
and additional ones include off-specification, fire, effluents, loss of services etc.
An example of a concept hazard analysis is applied to the methanator section of a hydrogen
plant in Table 4. An early P&I diagram of this plant is given in Figure 1. The process
involves removing small quantities of oxides of carbon from a hydrogen product by reaction
with hydrogen at 400°C and 20 bar. Some companies may prefer at this point to use
HAZOP keywords to highlight further problem areas. Such actions are more likely to be
taken if this study is carried out as a form of preliminary hazard analysis. Such action is not
recommended as it is important to use alternative search procedures at different stages in
project development.
The documentation shown here is more extensive than that independently developed at
BNFL.3 These simply document keywords, discussion and action/recommendations. This
approach has the advantage of speed and is particularly recommended when the initial
information is scanty and one objective is to give advice to the designer team.
The study undertaken at this stage will vary considerably according to the knowledge which
the participants have about the process. Many projects considered by industry are
modifications to process plant, costing up to £1 million (1992 values). For these
considerable information will be available. In other projects the study can be used to
transfer information from process licensers etc. In the case of a development project the
study can highlight key safety areas requiring further study. This is important to determine
whether both a concept hazard analysis and a preliminary safety analysis are required.
CRITICAL EXAMINATION OF SYSTEM SAFETY
At some stage it is important to review the design seeking radical change to improve safety.
A critical examination of system safety is one such means of tackling the problem.
Method study became widely used in the 1960s. Numerous courses were run to give
information on how to conduct the critical examination of any problem. The initial
questions aimed to resolve 'what, when, how and where?' relating to a particular activity or
operation. The answer to each of these questions was further probed by asking 'why, why
then, why that way, why there?' etc. There was also emphasis on the use of brainstorming
to generate alternatives.
Critical examination arises to reveal any problem and its formulation. The argument is
made that only when designers understand the reason why they are being asked to produce a
solution are they really likely to solve the problem. Here a revised approach is suggested
for critical examination, which differs from that used by Elliott and Owen4 in its aims and
rigour. The emphasis is on process safety, if possible, without the need for add-on safety.
The need for rigour is reduced as criteria are subsequently evaluated by other safety studies.
The only deviations considered under how the task might be accomplished are major
disturbances affecting plant safety.
8 RE A D I N G 3 .5 P R E LI M I N AR Y
S AFE T Y AN ALY S I S
UN
IT 4
15
E
NG
INE
ER
ING
RIS
K M
AN
AG
EM
EN
T
Table 4: Concept hazard analysis
9 RE A D I N G 3 .5 P R E LI M I N AR Y
S AFE T Y AN ALY S I S
UN
IT 4
15
E
NG
INE
ER
ING
RIS
K M
AN
GE
ME
NT
Table 4: Concept hazard analysis (continued)
10 RE A D I N G 3 .5 P R E LI M I N AR Y
S AFE T Y AN ALY S I S
UN
IT 4
15
E
NG
INE
ER
ING
RIS
K M
AN
AG
EM
EN
T
Figure 1: A P&I diagram of the methanator section of a hydrogen plant, to which concept hazard analysis was applied
11 RE A D I N G 3 .5 P R E LI M I N AR Y
S AFE T Y AN ALY S I S
UN
IT 4
15
E
NG
INE
ER
ING
RIS
K M
AN
GE
ME
NT
The method
Examples of the method are given in Table 5 and these should be consulted to ascertain the
format to be used. The first feature of the method is to write down a statement of the design
intent describing clearly what is to be done or achieved and how this is to be accomplished.
Individual statements may be necessary for some processes or task activities covering all the
what, when, how, where and who questions of the proposal. If the plant is not in normal
operation for the purpose of the study then this must be stated, identifying in minimum
detail the change of state achieved by an operation reaction or activity. This usually
indicates the operating conditions and equipment involved but not the full details. These
are made available to the analyst in other documents. A similar statement is subsequently
added indicating any dangerous condition, here defined as one leading to a dangerous
disturbance of plant.
Each significant aspect of the achievement is then probed by querying the proposal or
existing facts and its purpose. The aim is to expose the strengths and weaknesses of the
present situation. The emphasis is on how to avoid the dangerous conditions noted and not
on how to improve the process economics etc. Such conditions should be those which are
essentially a function of the process and its structure rather than a list of standard features
which are automatically checked (for example, the loss of lubricating oil to a compressor).
Alternatives are then generated. Some keywords with which to systematically associate
each significant part of the achievement are given in Table 6. Doubtless other effects than
those noted can be generated. However, the important matter is that a structure is given to
aid the generation of possible improvements.
For a safety study it is important to examine how the proposal is achieved, paying particular
attention to the following:
materials: change the quantities or qualities/use extra or different materials
method: change the operating conditions or activities/change the route and method of
processing/change the sequence, frequency, absolute time or duration
equipment: use different equipment.
The impetus for change should be to make the frequency of a major incident less likely and
to lessen the consequences of such an incident.
The technique, when applied in this manner, ensures that an attempt has been made to
improve the inherent safety of the proposed system by using a formal procedure rather than
leaving it as a matter for consideration by individuals.
It is also essential to study any dangerous condition and its cause. These should be readily
identifiable from an equipment knowledge base or the knowledge of the process engineer.
Then the keywords are used to effect analysis. Alternatives or modifications can be
suggested. The analyst should try to avoid only recommending measures to control the
situation or shutdown plant. These should be a back-up only to other protective barriers.
There is no reason to complete the study of both sections independently. The dangerous
condition affects the decisions made on how the process should be achieved and vice versa.
12 RE A D I N G 3 .5 P R E LI M I N AR Y
S AFE T Y AN ALY S I S
UN
IT 4
15
E
NG
INE
ER
ING
RIS
K M
AN
AG
EM
EN
T
Table 5: Critical examination of methanator section
13 RE A D I N G 3 .5 P R E LI M I N AR Y
S AFE T Y AN ALY S I S
UN
IT 4
15
E
NG
INE
ER
ING
RIS
K M
AN
GE
ME
NT
Table 6: Critical examination: keyword dictionary
Keyword Examples of use
Eliminate Eliminate by a completely different method or part of a methodEliminate certain chemicals, change the route, use a lean technologyEliminate additives, solvents, heat exchange mediums, additivesChange the equipment or processing methodEliminate leakage points; use a weld not a bolted fitting, etc.Eliminate a prime mover or heat exchange or agitatorEliminate a separation stage or stepEliminate intermediate storageEliminate an installed spareEliminate manual handlingEliminate sneak paths, openings to atmosphereEliminate wasteEliminate entry into vessels or disconnectionEliminate products that are harmful in useEliminate an ignition source, particularly permanent flame
Avoid Avoid extremes of operating conditionsAvoid operating in a flammable atmosphereAvoid possible layering of materials, inadequate mixingAvoid flashing liquids, particularly in extensive heat exchanger networksAvoid production of large quantities of dangerous intermediatesAvoid unwanted reactions in and outside reactorsAvoid operating near extremes of materials of constructionAvoid operating conditions leading to rapid deterioration of plantAvoid maintenance on demand and in short time periodsAvoid items of plant readily toppled by explosionsAvoid stage, step or activity by doing something as well as or instead of
Modify Modify any topics aboveModify batch operation to continuous operation or vice versa
Alter Alter the composition of waste, emission and effluentsAlter the sequence, method of workingAlter the time or duration of an activity (faster/slower, earlier, later?)Alter the frequency of an activity (more/less, why then?)Alter quality, quantity, rate, ratio, speed of any part of an operation or activityAlter who does an activity (why them? more/less people)
Prevent Prevent emissions and exposure by totally enclosed processes and handling systemsPrevent exposure by use of remote control
Increase Increase heat transfer and separation efficiency or capacityIncrease conversion in reactions
Reduce Reduce inventory; less storage, hold-up, smaller size of equipment, less pipingReduce amount of energy in systemReduce pressure and temperature above ambientReduce emissions and exposure by improved containment, piped vapour return,covers, condensation of return, use of reactive liquids, wetting dustReduce frequency of opening, improve ventilation, change dilution or mixingReduce size of possible openings to atmosphere
Segregate Segregate by distance, barriers, duration and time of daySegregate plant items to avoid certain common-mode failuresSegregate fragile items from roads, etc.
Isolate Isolate plant by shutdown systems, emergency isolation valves
Improve Improve plant integrity, reliability and availabilityImprove control or computer control. Use user-friendly controlsImprove responseImprove quality of engineering, construction, manufacture and assembly
14 RE A D I N G 3 .5 P R E LI M I N AR Y
S AFE T Y AN ALY S I S
UN
IT 4
15
E
NG
INE
ER
ING
RIS
K M
AN
AG
EM
EN
T
PRELIMINARY CONSEQUENCE ANALYSIS
A preliminary consequence analysis of major incidents examines the impact of what might
occur on a particular process plant. It is usually carried out as soon as a description of the
process flow diagram is available. If the site is to be selected it may be done very early.
Such a study may well only consider pipe breaks and common leaks. The analysis can be
carried out following critical examination before a decision is made to proceed with more
extensive design. Although here the emphasis is on plant, it is necessary to do similar
studies on the transport of raw materials and products.
Process information
In order to ascertain the problems, it is necessary to identify the proposed site and
approximate layout of the plant. The basic information required is listed below and some of
this information is subsequently transmitted to regulatory and planning authorities when
required.
Information should be obtained on the nature and scale of the use of dangerous substances
at a site and how the proposed activity fits in with the existing requirements of regulatory
bodies, local authorities, river authorities, etc. (See the preliminary concept safety review.)
This information is also required on every dangerous substance involved in the activity.
This should indicate the concentrations of those materials likely to be present and the names
of the main impurities. Inventory levels of vessels are required and the analyst requires
information on the possible impact of any hazardous chemicals on people and the
environment.
Information normally noted about a major hazard installation is given in the CIMAH
regulations5 and includes the following items:
A map of the site and its surroundings, to a scale large enough to show any features that
may be significant in the assessment of the hazard or risk associated with the site. If the
environment is at risk then it may be necessary to show the site and surrounding area on
a scale that is large enough (1:100 000) to show all the significant features of the natural
and built environment.
A scale plan of the site identifying the location and quantities of all significant
inventories of the dangerous substances.
A description of the process or storage involving the dangerous substance, its inventory
and an indication of the conditions under which it is normally held.
The maximum number of persons likely to be present on site.
Information about the nature of the land use and the size and distribution of the
population in the vicinity of the industrial activity to which the report relates.
The general information should be sufficient to enable any external threats to the plant to be
identified including adjacent plants, major hazard sites in the locality, roads etc.
Information on effluents, noise, risk etc., should be assembled. This data should be
supplemented by information on the arrangements for safe operation of the site and the new
activity, the emergency planning requirements and the requirements for additional expertise
for the operation of the plant. A safety audit of the management and organization should be
carried out, if not carried out earlier for other projects.
15 RE A D I N G 3 .5 P R E LI M I N AR Y
S AFE T Y AN ALY S I S
UN
IT 4
15
E
NG
INE
ER
ING
RIS
K M
AN
GE
ME
NT
Preliminary consequence analysis of major hazards
The preliminary consequence analysis of major hazards will not give an accurate
assessment of the frequency of any incident or the measures used to control or avoid the
release. It should, however, consider ways of dealing with the resulting emergency and
instigating the emergency response.
The report should at this stage concentrate on the response to the emergency rather than
countermeasures to a specific release. However, due attention must be given to the possible
escalation of the incident, including escalation as a result of mitigating efforts, such as
fighting fires. The main factors to be considered in the modelling of the behaviour and
impact of a substances on release are:
release size, phase and properties
duration of release
weather and terrain
probability of ignition and explosion
probability of escape
probability of persons evacuated
duration of exposure
population density
proportion of persons indoors
building ventilation rates.
For preliminary studies it is often necessary only to consider general values should no
danger arise outside the plant boundaries.
Hazardous events and their impact
The main hazardous events that should be considered are as follows:
fire: flash fire, pool fire, torch fire
explosion: confined chemical explosion, dust explosion, physical explosion, BLEVE
TC assumes the temperature is low and opens FCV1 more Effect same as Ref. No.2
Regular calibration of temperature element Redundant independent TE and high temperature alarm
3.3 Hazard and operability study
Partial results for this exercise are provided in Table 3.12. The cold water line has not been
considered and you should complete this as part of the exercise.
Note that the findings and actions are similar to FMEA, but the focus is on operation rather
than individual components. For instance, more than one failure mode can result in the
operational deviation being considered. When a guideword is selected for a specific line,
for causes of that deviation, we once again look at all the components in that line, and the
possible failure modes of those components that could result in the given deviation.
3.3 TO P I C 3 SU G G E S T E D
AN S W E R S
UN
IT 4
15
E
NG
INE
ER
ING
RIS
K M
AN
AG
EM
EN
T
For example, when we consider 'High Flow' of hot water in the line, we look at all the
failure modes, i.e. FCV1 failures, TE/TC failures etc. as a single package, whereas in
FMEA we consider each component and the operational deviation a certain failure mode
would cause.
Note that several of the deviations may give rise to the same action, which only goes to
confirm that the course of action is correct. The reason there appears to be a lot of
repetition in the HazOp process is that flow/level/temperature tend to be interrelated and a
change in one affects others. The structure of the HazOp technique is also such that if the
causes of a deviation are not correctly identified in one step, they are captured in the next
step.
Table 3.12: HazOp study datasheet
Pro
pose
d sa
fegu
ards
Rou
tine
mai
nten
ance
. Ind
epen
dent
TE
and
high
tem
pera
ture
ala
rm.
Inde
pend
entT
E to
ala
rm o
n lo
wte
mpe
ratu
re a
s w
ell.
Reg
ular
ope
rato
r pa
trol
of a
reas
.
Sam
e as
abo
ve.
Pos
sibl
e co
nseq
uenc
es
Too
muc
h ho
t wat
er to
spr
ay s
yste
m.
Hig
h te
mpe
ratu
re. B
ugs
affe
cted
.
Insu
ffic
ient
hot
wat
er. L
owte
mpe
ratu
re. N
o re
acti
on.
Sam
e as
abo
ve.
Pos
sibl
e ca
uses
FCV
1 st
icks
ope
n.T
E r
eads
low
.T
IC f
ails
to lo
w. M
anua
l set
poi
ntto
o hi
gh (
hum
an e
rror
).
FCV
1 fa
ils
in c
lose
pos
ition
.TE
read
s hi
gh.T
C f
ails
to h
igh.
Dra
in v
alve
in ta
nk le
aks.
Flo
atva
lve
in h
ot w
ater
hea
d ta
nks
fail
sto
ope
n w
hen
wat
er le
vel i
s lo
w.
Sam
e as
for
hig
h fl
ow.
Sam
e as
for
low
flo
w.
Gui
dew
ords
Hig
h fl
ow
Low
flo
w
Low
leve
l
Hig
h te
mpe
ratu
re
Low
tem
pera
ture
Res
pons
ibili
ty
Mai
nten
ance
Eng
inee
ring
Pro
duct
ion
Eng
inee
ring
Pro
duct
ion
Stud
y ti
tle:
HA
ZO
P of
hot
wat
er s
yste
mU
nit:
Hot
wat
er ta
nkL
ine/
equi
pmen
t de
scri
ptio
n: H
ot w
ater
line
fro
m ta
nk to
col
dwat
er li
ne ju
ncti
on/M
ixed
spr
ay to
rea
ctor
By:
Dra
win
g no
:P
age:
1 o
f 1
Dat
e: 8
Dec
embe
r 20
06L
ocat
ion:
Ade
laid
e pl
ant
Issu
e: A
3 .4 TO P I C 3 SU G G E S T E D
AN S W E R S
UN
IT 4
15
E
NG
INE
ER
ING
RIS
K M
AN
AG
EM
EN
T
3.4 Functional concept hazard analysis
In a real life situation you would need to have input from the gas compression
engineer/specialist as well as the vendor's representative in order to conduct a more detailed
analysis. For this exercise, it is sufficient to demonstrate a clear understanding of the
functional concept analysis technique.
A high-level analysis is provided in Table 3.14. Note that a different group of people may
select different keywords and arrive at a slightly different answer, although similar
deviations and consequences should have been identified.
3.5 Vulnerability analysis
First identify the 'assets' or critical success factors (those things which must be protected),
then consider the threats to these. Then evaluate the criticality of each threat to each asset.
Finally, determine the control measures you need to manage each critical vulnerability.
A sample analysis is provided in Table 3.13. Note that this table focuses on consequence
value for credible threats rather than likelihood. That is, if it is credible and did happen,
what is the realistic worst-case result. This is the focus of senior decision makers and the
courts after the event.
Table 3.13: Vulnerability analysis
Threats Project critical success factors
Completion on time
Completion on budget
Environment Government sponsor
satisfaction
Internal sponsor
satisfaction
Community satisfaction
Safety Statutory compliance
Conditions of contract issues
xx x — — x x x xx
Scope changes after sign off
xxx xxx — — — x xx xx
Litigation/liability issues
x xxx xxx xx xxx — x x
Insurance issues (lack of, length)
x x xxx xx — — x x
Unforeseen site difficulties
xx xx x — xx xx xx xx
Weather xxx x x xxx x x xx —
Mismatch of staff skills/resources/ availability
xx x — — x — xxx xx
Succession planning/loss of expertise/ knowledge
xx x x — x — xx —
Inadequate processes/policies/ decision making
xx xx xxx xxx xx x xx xx
Subcontractor tendering issues
x — — x — — xx x
Subcontractor delivery issues
xxx x x x x — xxx xxx
IR disputes xxx x — xx x x xxx xx
IT/ data/ information retrieval failure
x x — — — — — —
3.5 TO P I C 3 SU G G E S T E D
AN S W E R S
UN
IT 4
15
E
NG
INE
ER
ING
RIS
K M
AN
AG
EM
EN
T
Table 3.14: Functional concept hazard analysis for natural gas compressor station and cylinder storage/handling area
3 .6 TO P I C 3 SU G G E S T E D
AN S W E R S
UN
IT 4
15
E
NG
INE
ER
ING
RIS
K M
AN
AG
EM
EN
T
3.7 TO P I C 3 SU G G E S T E D
AN S W E R S
UN
IT 4
15
E
NG
INE
ER
ING
RIS
K M
AN
AG
EM
EN
T
TO P I C 4
ESTIMATING THE SEVERITY OF CONSEQUENCES
Preview 4.1 Introduction 4.1 Objectives 4.1 Required reading 4.1 Estimating consequence severity 4.2 Effect and vulnerability models 4.4 Root causes of system failures 4.5 Technical and organisational factors 4.5 Accounting for event dependency consequences 4.5 Qualitative estimation of severity 4.9 Consequence assessment of release of hazardous chemicals 4.10 Release of liquid from atmospheric storage 4.11 Release of liquid stored under pressure above boiling point 4.12 Release of gas 4.14 Calculations for leak rates 4.16 Fire consequence assessment 4.17 Types of fires 4.17 Vulnerability models for fires 4.20 Explosion consequence assessment 4.22 Vulnerability models for explosions 4.23 Toxicity consequence assessment 4.25 Exposures 4.25 Effect models for toxic releases 4.26 Vulnerability models for toxic release 4.27 Structural failure consequence assessment 4.28 Project risk impact assessment 4.29 Sensitivity analysis 4.29 Summary 4.31
Exercises 4.32 References and further reading 4.33 Suggested answers
4.1 TO P I C 4 ES T I M AT I N G T HE
S E V E R I T Y O F
C O N S E Q U E N C E S
UN
IT 4
15
E
NG
INE
ER
ING
RIS
K M
AN
AG
EM
EN
T
PR E V I E W
INTRODUCTION
In the last topic we explored how to define an engineering system's components, couplings
and interactions and identify hazards and potential loss events. Once a hazard list is
generated, the next step is to estimate the magnitude or severity of the adverse
consequences should a loss event occur. This is important as an aid to both inherently safer
design and pre-incident planning. It involves carrying out appropriate calculations, which
will vary according to the industry and the nature of the hazard. In the processing industries, such calculations are designed to assess:
the physical effects of unplanned releases of hazardous chemicals
the damage consequences of the releases. In the utilities area they are designed to assess:
loss of water supply for specified periods
loss of power or gas supply with associated consequences. In the area of civil infrastructure they may relate to structural failure of a dam or bridge and
associated consequences such as flooding or accidents. Many of these calculations are routinely done using commercial software. However,
sometimes in the initial stages of a risk analysis it may be useful to perform simple manual
calculations to obtain a feel for the numbers and their corresponding physical realities. Consequence calculations are specific to each industry type and take us into the realm of
hazard analysis. Since the focus in this topic is on risk management issues, the discussion
of analysis and calculation has been kept to a minimum. For those interested in the details
of analysis relating to their industry, relevant references are provided.
OBJECTIVES
After studying this topic you should be able to:
identify the type and depth of analysis required to estimate consequence severity
identify the type of specialist assistance required
specify the output requirement of the investigation
make judgments on the scale of the loss event
identify actions that will eliminate or mitigate the loss event.
REQUIRED READING
There is no additional reading required for this topic. However, it would be useful to
become familiar with hazard analysis techniques in the industry of your discipline, using the
references listed at the end of this topic. In particular, the US EPA website provides substantial downloadable information on Risk
Management Program Guidance for Offsite Consequence Analysis. This can be obtained
by visiting http://www.epa.gov/ceppo. It includes methods, references and relevant
properties of chemicals. A number of Australian regulators refer to these guidelines.
4 .2 TO P I C 4 ES T I M AT I N G T HE
S E V E R I T Y O F
C O N S E Q U E N C E S
UN
IT 4
15
E
NG
INE
ER
ING
RIS
K M
AN
AG
EM
EN
T
ES T I M AT I N G C O N S E Q U E N C E S E V E R I T Y
Having identified a range of hazards and potential loss events, the next step is to estimate
the severity of the adverse consequences if a loss event occurs. The main loss events
encountered across a range of engineering disciplines are:
fires (flammable liquids/solids/gases and combustible substances)
explosions (gas, dust, chemical, use of explosives)
toxicity effects from chemical toxic exposure from accidental releases or combustion
products from fires
major structural failures (plant and equipment, buildings, bridges, dams)
major breakdowns causing business interruption
environmental pollution due to unplanned releases
project failures or overruns (commercial consequences).
Estimating the severity of a loss event involves determining both the types of effects of such
an event and the amount of damage caused by these effects. This requires the use of
knowledge, experience, mathematical models, logic models or a combination of these
methods in order to make an informed judgment. Quantifying the consequences of loss
events that result in monetary loss is generally easier than quantifying the consequences of
those that result in loss of assets or loss of life.
The estimation of loss event consequences involves four distinct steps:
1. Define system. This is generally done as part of the hazard identification stage (see
Topic 3) and involves developing an outline of the system for which calculations of
loss event consequences are to be carried out. The outline should set out:
a) the system boundaries, for example one identifiable section of a plant such as
bulk fuel storage area, a specific warehouse section, a bridge or a dam, a
production line or a software package
b) the subsystem or equipment whose failure would cause a loss event, for example
vessels, piping, an LPG tank, a flammable packaged goods depot, a reservoir or
dam, a bridge, a gas or water supply pipeline, a power transmission system
c) a description of the internal environment of the system, i.e. pressure, temperature,
inventory, state of the fluid (vapour, liquid, two-phase mixture, etc.), process
flow rates/loads, structural strength, maximum allowable operating pressure in
the case of gas pipelines, maximum load/stress in the case of structures.
2. Develop incident scenarios. This involves formulating hypothetical failure scenarios
based on historical data, the outputs from hazard identification techniques and
experience.
3. Model calculations. This involves identifying the types of consequences that may
occur by examining the different potential sequences of events and then calculating the
effect levels of particular consequences (e.g. release rate of a hazardous chemical,
thermal radiation levels from fires, blast overpressure levels for explosions, ground
level concentration from dispersion of toxic gases, structural strength analysis,
vibration analysis).
4. Quantify damage. This involves translating the effect levels into damage estimates
such as injury, fatality, structural damage, environmental impairment or extent of
business interruption.
4.3 TO P I C 4 ES T I M AT I N G T HE
S E V E R I T Y O F
C O N S E Q U E N C E S
UN
IT 4
15
E
NG
INE
ER
ING
RIS
K M
AN
AG
EM
EN
T
Example 4.1
A local government authority maintains an aquatic centre consisting of two
swimming pools: a small pool for swimming lessons for children and a large pool for
adult swimmers. The water is chlorinated by direct injection of chlorine gas from a
chlorination facility consisting of liquid chlorine cylinders and associated dosing
control system. To estimate the consequences of an accidental release of chlorine
gas (highly toxic), the following steps would be applied:
1. Define system. This consists of chlorine storage cylinders, connecting
pipework, dosing control system and safety shutdown system. Chlorine is a
liquefied gas under pressure (approximately 700 kPa) and is at ambient
temperature. The total quantity in a cylinder is 70 kg, and the system consists of
6 cylinders, connected to a pipe manifold. A chlorine gas detector is installed
which, on sensing gas, would raise an alarm and automatically shut down the
system.
2. Develop incident scenarios. Two scenarios may be considered:
a) Rupture of a cylinder and sudden loss of cylinder inventory.
b) Rupture of a pipeline and slow release of chlorine until shutdown occurs. If
automatic shutdown fails, the system must be manually shut down by
3. Model calculations. Methods exist for calculating release rates and gas
dispersion to predict gas concentrations within the facility as well as outside.
This is often conducted by specialists.
4. Quantify damage. Based on the toxic gas concentration and the duration of
exposure, it is possible to estimate the extent of injury or potential fatality to
exposed persons. This is based on toxicology data for the specific component
(chlorine); once again, specialist skills are required.
Example 4.2
A two-lane bridge over a railway line in suburbia was built in the 1960s. The traffic
volumes at that time were low, and 'B-double' articulated trucks, of total weight of
40 tonnes, had not been developed.
In recent times, not only has heavy vehicle traffic increased, but several trucks may
stand on the bridge for minutes at a time, waiting for the traffic to clear. This has
placed additional dynamic load on the bridge, and measurements of the level of
vibration during routine inspections have shown an increase. To estimate the
consequences of a structural failure, the following steps would be applied:
1. Define system. This consists of the bridge, the postulated worst load on the
bridge and the duration, and the number of such load cycles per day. The static
load-bearing capacity and the limits on the vibration are known. Strain gauge
measurements of the extent of strain and the cycles are available.
2. Develop incident scenarios. These may include failure of a span of the bridge
between two sets of supports, or failure of a support.
3. Model calculations. A finite-element analysis of the stresses and vibrations for
various postulated dynamic and static loads would be required. This is a
specialist exercise.
4. Quantify damage. The model calculations would provide the extent of physical
damage that could occur to the structure, from which other effects can be
assessed, for example vehicle accidents, repair/rebuilding costs, liabilities, and
traffic disruption costs.
4 .4 TO P I C 4 ES T I M AT I N G T HE
S E V E R I T Y O F
C O N S E Q U E N C E S
UN
IT 4
15
E
NG
INE
ER
ING
RIS
K M
AN
AG
EM
EN
T
EF F E C T A N D V U L N E R A B I L I T Y MO D E L S
There are two types of models used to estimate the consequences of a loss event:
effect models which are usually mathematical and are used to quantify the effects
vulnerability models which are usually empirical and are used to quantify damage. Effect models calculate the effect levels that will result from particular loss event
consequences. For instance, assessment of the effect of a fire may consider the levels of
thermal radiation intensity (or heat flux) at various distances from the source of the fire. A
toxicity effect model may calculate the ground level concentration of a toxic gas at various
downwind/crosswind distances from the emission source. Vulnerability models take the output of an effect model and assess the resources that will be
affected (e.g. people, structures, biophysical environment) and the extent of damage to these
resources. A brief summary of effect and vulnerability models is given in Table 4.1. Table 4.1: Effect and vulnerability models Loss event Effect Resources affected Damage (vulnerability) Flash fire Thermal radiation People Burn injury/fatality Burning pool of liquid Thermal radiation People Burn injury/fatality Structures Failure Explosion Blast, flying fragments People Injury/fatality Structures Structural damage Glass breakage Gas jet/torch fire Thermal radiation People Burn injury/fatality Flame impingement Structures Failure Toxic release Toxic vapour People Irritation/distress Injury/fatality Toxic dose Environment Environmental damage Collision Mechanical impact People Injury/fatality Structures Mechanical damage Radioactive leak Nuclear radiation People Injury/fatality Earthquake Structural failure People Injury Structures Mechanical damage Food contamination Poisoning, sickness People Illness/fatality Structural overload, excessive vibration
Structural failure People Structures
Injury/fatality Mechanical damage/loss
Both effect and vulnerability models have a number of limitations that need to be
recognised. Some of these limitations are listed below.
Effect models are generally based on idealised systems and can only approximate real
situations.
Many of the models are empirical/semi-empirical, based on limited data.
Most models have been verified only in small-scale tests.
The influence of the environment (terrain, buildings, etc.) is generally not considered in
gas dispersion models, except in highly sophisticated ones. Sometimes combined effect/vulnerability models are referred to as vulnerability models
(VM) or population vulnerability models (PVM). In this representation the consequences
of a loss event are split into physical effects (effect) and damage effects (vulnerability).
4.5 TO P I C 4 ES T I M AT I N G T HE
S E V E R I T Y O F
C O N S E Q U E N C E S
UN
IT 4
15
E
NG
INE
ER
ING
RIS
K M
AN
AG
EM
EN
T
RO OT C AU S E S O F S YS T E M FA I LU R E S
TECHNICAL AND ORGANISATIONAL FACTORS
Very often in assessing vulnerability models, the mitigation effects for non-hardware
systems (i.e. management factors, procedures, training etc.) are not addressed. This can
lead to an incomplete representation of the consequences and a pessimistic assessment of
risk. However, in most instances the reverse is true. So-called 'human factors' generally
contribute to or cause major loss events.
For example, the outcomes of the investigation into the explosion that ultimately resulted in
the loss of the Piper Alpha oil and gas platform in the North Sea concluded that the
following factors all contributed to the event:
complacent organisational culture
unrecognised (and unnecessary) couplings in design
insufficient redundancies in safety systems
difficulties in managing the trade-off between productivity and safety
a tendency to stretch maintenance operations when production pressures increase.
(Paté-Cornell, 1993)
The above factors, if present in an organisation, should be recognised. The modelling will
initially consist of effects calculations of postulated failure events. In the next step, when
vulnerability assessment is made from the effects calculations, the organisational and human
deficiencies should be accounted for.
ACCOUNTING FOR EVENT DEPENDENCY CONSEQUENCES
In the consequence analysis of major loss events, it is essential that all couplings,
interactions and event dependencies be modelled wherever possible to provide a full picture
of the risk. Generally, a small initiating event triggers a progressive series of other events
and escalates into a major event because of the inadequacy or failure of safeguard systems
and the absence of, or deficiencies in, the management system.
An analysis of the aftermath of the destruction of the Piper Alpha oil and gas platform in the
North Sea in 1988 by Paté-Cornell (1993) led to the development of a model for event
dependency consequence analysis. Figure 4.1 shows a simplification of this model.
Each step in Figure 4.1 is quite complex and consists of a number of interacting and
sequential components. A simplified description follows. A schematic layout diagram of
the Piper Alpha modules is shown in Figure 4.2 to help you follow the discussion.
4 .6 TO P I C 4 ES T I M AT I N G T HE
S E V E R I T Y O F
C O N S E Q U E N C E S
UN
IT 4
15
E
NG
INE
ER
ING
RIS
K M
AN
AG
EM
EN
T
Figure 4.1: Event dependency consequence analysis model for Piper Alpha
Causalfactors
Losses LAPrimary initiating
events (A)Subsystemstates EA
Losses LBSecondary initiating
events (B)Subsystemstates EB
Tertiary initiatingevents (C)
Subsystemstates EC
Losses LC
A: Primary initiating event—first explosion
Process disturbance
Two redundant pumps inoperative in module C; Hydrocarbon condensate pump 'B'
trips; the redundant pump 'A' was shutdown for maintenance
Failure of a flange assembly at the site of a pressure safety valve in module 'C'
Release of condensate vapours in module 'C'
First ignition and explosion
Failure of firewall leading to damage of emergency systems in adjacent module.
EA Subsystem states after primary initiating event
Immediate loss of electric power
Failure of emergency lighting
Control room failure
Failure of public address/general alarm system
Failure of radio telecommunication room
Some people escape from 68' level to 20' level, others jump into the sea.
LA Losses after primary initiating event
Loss of emergency systems (deluge, communication)
Loss of helipad operation for rescue due to smoke
Casualties in modules A, B and C.
B Secondary initiating event—second explosion
Rupture of B/C firewall
Rupture of a pipe in module B due to projectiles from B/C firewall
Large crude oil leak in module B
Fireball and deflagration in module B
Fire spreads to module C through failed B/C firewall.
4.7 TO P I C 4 ES T I M AT I N G T HE
S E V E R I T Y O F
C O N S E Q U E N C E S
UN
IT 4
15
E
NG
INE
ER
ING
RIS
K M
AN
AG
EM
EN
T
Figure 4.2: Piper Alpha module layout
Source: Paté-Cornell 1993: 217.
EB Subsystem states after secondary initiating event
Fire in modules B and C spread to various containers (lube oil drums,
industrial gas bottles)
Pipes and tanks rupture in modules B and C
Smoke engulfs many parts of the platform preventing escape from deck to
living quarters
Smoke ingress into living quarters
Some survivors jump into sea from 68' and 20' levels
Failure of firewater pumps; automatic start had been turned off; manual start
pumps damaged by C/D firewall breach.
4 .8 TO P I C 4 ES T I M AT I N G T HE
S E V E R I T Y O F
C O N S E Q U E N C E S
UN
IT 4
15
E
NG
INE
ER
ING
RIS
K M
AN
AG
EM
EN
T
LB Losses after secondary initiating event
Some fatalities in living quarters due to smoke ingress and asphyxiation
Escalating damage to structures due to spread of fire
Some people unable to be rescued from the sea.
C Tertiary initiating event—jet fire from process riser
Rupture of riser (Tartan to Piper Alpha) caused by flame impingement from fires
Third violent explosion and large fire and smoke engulf the platform
Intense impingement of large jet fire on platform support structural members.
EC Subsystem states after tertiary initiating event
Most people trapped in living quarters
Some survivors jump from the helideck into the sea (175' level)
Collapse of platform at 68' level below module B
Fourth violent explosion and rupture of Claymore gas riser
Major structural collapse in various sections of platform
Accommodation module overturned into the sea
Rescue of survivors at sea (throughout the accident) by onsite vessels.
LC Losses after tertiary initiating event
Human casualties: 167
Total loss of the platform
Damage in excess of US$3 billion.
If these events were fully depicted there would be interactions between EA and LA, EA and
EB, EB and LB, EB and LC, and so on, making it extremely complex. However, Figure 4.1
does provide a simple framework for describing the initiation of a loss event and accident
progression.
A C T I V I T Y 4 . 1
Consider a loss event that has occurred in your workplace, e.g. a fire or spill, then
conduct a dependency consequence analysis of it using the model in Figure 4.1. If
you have not had such an event in your workplace, use a major incident that has been
well documented. For example, you may wish to consider:
the collapse of the World Trade Center buildings in New York
one of the many bridge collapses caused by ship impact, flood or structural
failure
the Exxon Valdez oil spill
the Esso Longford gas explosion.
Follow through to final resolution of the crisis in each case—do not just stop after
the initiating event. Document your model in a serious of dot points as in the Piper
Alpha example above.
Keep your results for use in Topic 5.
4.9 TO P I C 4 ES T I M AT I N G T HE
S E V E R I T Y O F
C O N S E Q U E N C E S
UN
IT 4
15
E
NG
INE
ER
ING
RIS
K M
AN
AG
EM
EN
T
QUA L I TAT I V E E S T I M AT I O N O F S E V E R I T Y
Since most quantitative assessments of consequence severity require specialist assistance, it
is necessary to conduct an initial qualitative assessment in order to determine the extent of
quantification required. The basic steps in a qualitative assessment are:
1. Identify the hazards and potential loss events (Topic 3).
2. Identify the affected parties (the organisation, public, industrial neighbours, customers,
stakeholders, regulators, financiers).
3. Identify the potential adverse consequences for each affected party.
4. Assess the severity level of the adverse consequences to each affected party.
5. If the consequences must be estimated in financial loss terms, the loss is the sum total
of the following:
direct costs of the event (injury, fatality, asset damage, environmental damage etc.)
5. Storage facility fires (flammable and combustible materials)
6. Building and other fires.
Pool fires
A leak of flammable or combustible liquid from equipment or pipework will result in the
formation of a liquid pool on the floor. If this pool ignites before it can effectively drain, a
pool fire will result. Such fires can emit high heat radiation intensities which pose a risk to
people and may result in the failure of equipment and structures, if engulfed by fire.
A distinction must be made between the heat intensity experienced by an object outside the
pool fire and one that is engulfed in the fire. An object located at a distance from the pool
fire would experience mainly the heat radiation emanating from the flame surface. This
flame surface radiation flux (intensity) varies according to the fuel type and the amount of
soot and smoke generation. For low molecular weight fuels (e.g. LPG), the surface heat
flux is high because of cleaner flames, and is generally of the order of 100–120 kW/m2.
Experiments for crude oil fires have recorded flame surface radiation intensity of
approximately 20–40 kW/m2 (Considine, 1984), depending on the pool diameter. This low
figure is due mainly to the presence of appreciable soot and smoke in crude oil fires and the
surface heat flux is reported to drop rapidly with increasing pool diameter.
Objects engulfed in pool fires experience heat intensities from flame surface radiation flux,
flame impingement and heat convection. Tests on crude oil fires have recorded flame
temperatures of 920K (Husted and Sonju, 1985). A heat flux of 100 kW/m2 is generally
used for objects engulfed in a hydrocarbon pool fire.
Jet fires
If a flammable gas, under pressure, escapes through an orifice and ignites, the result may be
a 'jet' or 'torch' fire. Typical sources include flanges, holes in pipes and pipe fractures.
Such a fire can rapidly damage equipment because of the flame's intensity (high flame
temperatures due to turbulent mixing with air, high radiation efficiency) and its length.
Jet fires can cause significant damage with direct flame impingement on objects due to the
high heat fluxes involved. Although surface heat fluxes for jet fires are of the order of
200 kW/m2, heat fluxes up to 300 kW/m2 can be generated in direct flame engulfment.
In general, a jet flame impinging on a steel structure can raise its temperature to above
500ºC in less than 10 minutes, when the structure would lose its load bearing capacity.
Flash fires
If a flammable vapour cloud ignites but fails to explode because the rate of combustion is
too low to generate a percussive pressure wave, a flash fire of extremely short duration (2 to
5 seconds) will result.
4 .18 TO P I C 4 ES T I M AT I N G T HE
S E V E R I T Y O F
C O N S E Q U E N C E S
UN
IT 4
15
E
NG
INE
ER
ING
RIS
K M
AN
AG
EM
EN
T
Because the radiation from a flash fire is very high, it is a serious risk to those personnel
enveloped within the flammable cloud and to those very close to the flame. Flash fires do
not affect structures and equipment as the duration of exposure is too small.
Modelling flash fires involves estimating the dimensions of the flammable cloud using gas
dispersion models.
BLEVE
A BLEVE (Boiling Liquid Expanding Vapour Explosion) is defined as the sudden rupture
of a vessel/system containing liquefied flammable gas under pressure due to flame
impingement from an external fire. The vessel will usually rupture into a number of large
pieces which rocket considerable distances. This is accompanied by a large fireball and
some explosive pressure effects produced from the liquid expanding rapidly during the
propagation of fracture as the vessel ruptures. The pressure effects are generally minor
compared with the heat radiation from the fireball.
The surface heat flux in a BLEVE would be in the range of 250–350 kW/m2. It is modelled
as a rising fireball, approximated by a spherical geometry.
Whilst BLEVEs are associated with explosive effects causing structural failures, the thermal
radiation impact of a BLEVE is far more significant for exposed people because radiation
distances can be much larger than explosion effect distances. A 100 tonne LPG vessel in a
storage depot, if subjected to a BLEVE, can cause injury to personnel 1200 m away. The
LPG industry has constantly improved design and installation standards over the last decade
to minimise significantly the chance of such an event.
Storage facility fires
These fires are more common because storage facilities carry significant amounts of
combustible materials and some store hazardous chemicals. The major hazards associated
with the storage of flammable or combustible materials are fire and toxic products formed
by combustion or decomposition.
The main parameters of interest are the activation time and effectiveness of sprinkler
systems, distances from the storage facility at which critical radiation intensities occur, and
the dispersion of toxic gases downwind from the storage.
To quantify these dangers, it is necessary to study the growth of the fire and the
effectiveness of the installed sprinkler system. Once the fire has passed a point called
'flashover', where all fuel surfaces are burning, it will be virtually impossible to control the
fire. Flashover is a phenomenon when the temperature of the hot gas layer at the roof
exceeds the structural failure temperature of load bearing members.
As the stored materials burn, toxic gases form and rise in the fire plume due to buoyancy
effects. The dispersion of toxic gases can be modelled using a Gaussian model corrected
for release from the area source rather than a point source. This is necessary since the fire
covers the area of the storage facility and toxic gases are released from this burning area
(i.e. release is not from a point source).
A simplified flowchart for fast fire growth in storage facilities is shown in Figure 4.5.
4 .19 TO P I C 4 ES T I M AT I N G T HE
S E V E R I T Y O F
C O N S E Q U E N C E S
UN
IT 4
15
E
NG
INE
ER
ING
RIS
K M
AN
AG
EM
EN
T
Figure 4.5: Simplified flowchart for fast fire growth in storage facilities
A number of software packages are available for assessing the effects of fires, including:
EFFECTS and DAMAGE—Calculation of physical effects of release of hazardous
materials and the damage effects. Developed by TNO in the Netherlands.
PHAST—Hazard consequence models for release of hazardous materials. Developed
by Det Norske Veritas (DNV) in Norway.
FRED (Fire Radiation Explosion Dispersion)—Developed by Shell Global Solutions in
the UK.
Firewind—Developed by Dr Victor Shestopal (who was formerly with CSIRO and has
since formed his own consultancy Fire Modelling and Computing).
CFAST—Developed by the Building and Fire Research Laboratory (BFRL) in the US
for modelling fires in large warehouse type of buildings.
Building and other fires
Building fires can also generate toxic smoke but the main issue is the ability of occupants to
escape safely. Fires in commercial buildings do not usually cause fatalities unless there are
inadequate exit routes and/or overcrowding, such as can occur in nightclubs. Even
non-enclosed buildings can result in fatalities if escape is impeded. The Bradford football
stadium fire in the UK in 1985 resulted in 52 deaths and 265 injuries. Fire spread rapidly in
the timber structure and many were unable to escape the intense heat in time. Those who
headed towards the exits rather than onto the ground were trapped because after the start of
the match the gates were kept locked to prevent gatecrashers. Tunnel fires can be catastrophic. In Austria in 2000, 155 people died in a fire onboard a
funicular railway as it passed through a 3 km tunnel. The fire was caused by a faulty heater
at the rear of the train. Those that escaped to the rear of the train survived as the tunnel
created a chimney effect for the toxic smoke.
Istime to activate
sprinklersless than time to
flashover?
Fast fire growth
Aresprinklersinstalled?
Yes
Yes
Yes
No
No
No
Flashover
Aresprinklerseffective?
Fully developed fire
Fire extinguished Fire effectsCombustion products
effects
4 .20 TO P I C 4 ES T I M AT I N G T HE
S E V E R I T Y O F
C O N S E Q U E N C E S
UN
IT 4
15
E
NG
INE
ER
ING
RIS
K M
AN
AG
EM
EN
T
VULNERABILITY MODELS FOR FIRES
The effects of thermal radiation from fires are summarised in Table 4.6.
Table 4.6: Effects of thermal radiation
Heat flux
(kW/m2)
Effect
1.2 Received from the sun at noon in summer. 2.1 Minimum to cause pain after 1 minute. 4.7 Will cause pain in 15–20 seconds and injury after 30 seconds exposure (at least second
degree burns will result) 12.5 Significant chance of fatality for extended exposure. High chance of injury.
After long exposure, causes the temperature of wood to rise to a point where it can be readily ignited by a naked flame.
Thin steel with insulation on the side away from the fire may reach a thermal stress level high enough to cause structural failure.
23 Likely fatality for extended exposure and chance of fatality for instantaneous exposure. Spontaneous ignition of wood after long exposure. Unprotected steel will reach thermal stress temperatures which can cause failures. Pressure vessel needs to be relieved or failure will occur.
35 Cellulosic material will pilot ignite within one minute's exposure. Significant chance of fatality for people exposed instantaneously.
Source: Department of Planning, NSW, 1997b.
Fire effects on people
Exposure to radiation intensities from a large fire may result in either severe burns or
fatalities, as was the case in the Bradford stadium fire. The effect is a function of both the
intensity of radiation and the duration of exposure. Some results are shown in Table 4.7.
Table 4.7: Effects of thermal radiation on people A Thermal radiation intensity
(kW/m2) Effect Reference
1.5 Threshold of pain Atallah and Allan (1971) 2.1 Level at which pain is felt after 1 minute
1 Level just tolerable to a clothed man HSE (1978) 8 Level which causes death within minutes
4.7 Threshold of pain. Average time to experience pain, 14.5s Crocker and Napier (1986)
B Thermal dose
(kJ/m2) Effect Reference
40 Second degree burns Williamson and Mann 125 Third degree burns (1981)a
65 Threshold of pain Rijnmond Public 125 First degree burns Authority (1982) 250 Second degree burns 375 Third degree burns
65 Threshold of pain, no reddening or blistering of skin BS 5908: 1990 125 First degree burns 200 Onset of serious injury 250 Second degree burns 375 Third degree burns
Source: Lees, 1996: 16/249. a For thermal radiation from a fireball
4 .21 TO P I C 4 ES T I M AT I N G T HE
S E V E R I T Y O F
C O N S E Q U E N C E S
UN
IT 4
15
E
NG
INE
ER
ING
RIS
K M
AN
AG
EM
EN
T
Fire effects on structures and materials
The strength and stiffness properties of metals decrease as the temperature rises. Both the
yield stress and modulus of elasticity decrease with increasing temperatures. The intensity
of stress in a steel member influences the load carrying capacity. The higher the load stress,
the more quickly a member will fail at elevated temperatures. A temperature of 500ºC is
normally considered the critical temperature for unprotected steel. At this temperature the
yield stress in the steel decreases to about one half of the value at ambient temperature.
This is the approximate level normally used as the design working stress.
Experimental research has been undertaken on the effects of fires on offshore equipment
and structures. Shell Research conducted experiments on pipe sections (540 mm diameter
and 13 mm wall thickness) exposed to large-scale propane jet fires (Bennett et al., 1990).
For unprotected structures, it was found that a temperature of 900–1000ºC was reached
within ten minutes from the time of ignition. For structures protected by fire proofing e.g.
mandolite, the temperature did not exceed 100ºC even after 40 minutes exposure.
For exposure to hydrocarbon pool fires, temperature rise with time may be approximately
estimated using Figure 4.6. The time for failure in a jet fire is considerably shorter, less
than 50% of the time required for pool fire engulfment.
Figure 4.6: Average rate of heating of steel plates exposed to open gasoline fire on one side
Source: API, 2000.
4 .22 TO P I C 4 ES T I M AT I N G T HE
S E V E R I T Y O F
C O N S E Q U E N C E S
UN
IT 4
15
E
NG
INE
ER
ING
RIS
K M
AN
AG
EM
EN
T
EX P LO S I O N C O N S E Q U E N C E A S S E S S M E N T
Explosions can be of several types. In the case of explosives such as TNT, there is
condensed phase explosion or detonation, generating a blast wave. In gas explosions the
mechanism is quite different, and the percussive pressure wave is generated by acceleration
of the flame front, which is increased by obstacles. Finally, in the case of explosions within
enclosures (gas, dust), the blast effect is due to rapid pressure rise from both volume and
temperature increase resulting from combustion.
Since the mechanisms of blast generation are vastly different, the same methodology cannot
be applied for all types of explosions. Some concepts relating to explosions and the effects
of explosions on people and structures are discussed below. No calculation methods are
provided. The interested reader is referred to Lees (1996) and IChemE (1994).
Detonation is defined as the sudden and violent release of mechanical, chemical or nuclear
energy from a confined space which creates a shockwave that travels at supersonic speeds.
It is sometimes used interchangeably with the word explosion.
The term condensed phase explosions covers the direct use of explosives such as in the
mining industry and military applications, and to some extent, explosions involving
oxidising agents such as ammonium nitrate.
The TNT equivalence model is used extensively for effects modelling. In the past, this
model was also used for gas explosions, but it was abandoned by practitioners when it was
recognised that the mechanism of gas explosion is vastly different to TNT explosions.
The result of an explosion is the generation of a pressure wave higher than atmospheric for
a short duration. The pressure wave above atmospheric pressure is referred to as
'overpressure', and the highest overpressure reached in the deflagration process is referred
to as 'peak overpressure'. The duration of this overpressure until it reduces back to
atmospheric pressure is referred to as the 'positive phase duration' (see Figure 4.7).
Deflagration is defined as the extremely rapid burning of a material. This is much faster
than normal combustion, but slower than detonation.
Figure 4.7: Typical overpressure time curve
4 .23 TO P I C 4 ES T I M AT I N G T HE
S E V E R I T Y O F
C O N S E Q U E N C E S
UN
IT 4
15
E
NG
INE
ER
ING
RIS
K M
AN
AG
EM
EN
T
The peak overpressure caused by the deflagration of a hydrocarbon and air mixture in a
totally enclosed space initially at atmospheric pressure is of the order of 8 bar, whereas a
detonation may give a peak overpressure as high as 20 bar with the possibility of higher
pressure at the point of transition. In contrast, combustion of a completely unconfined
cloud of fuel and air produces only a few millibar overpressure even if the cloud is
optimally premixed. A detonation generates much greater pressures and is much more destructive than a
deflagration. The conditions necessary to generate a detonation, i.e. very rapid acceleration
of the flame front or a powerful shock to the system, are not generally considered to occur
in gas explosions, but instead occur mainly in condensed phase explosions. Obstacles, i.e. equipment layout, will always increase the overpressure in gas explosions,
but to a greater or lesser extent depending on their profile, number, size and location, as
well as absolute scale. In exploring the effect of design modifications on reducing
overpressure in a plant, the following guidelines are suggested.
a) Minimise inventories wherever possible.
b) Minimise volumes of potentially explosive mixture, but be careful not to reduce the
vent area ratio to an unacceptable value.
c) Maximise vent areas, but be careful not to open up new pathways that would allow
additional flame acceleration through obstacle arrays and be careful not to create
potential for cascade events.
d) Minimise the obstructions in the flame path as the flame propagates.
VULNERABILITY MODELS FOR EXPLOSIONS
Explosion effects on people
Explosions can cause injury or fatality to people through the effects of heat radiation, blast
and combustion products. Injury from blast may be from direct and indirect blast effects
including overpressure, missiles and whole body translation. The effect of blast overpressure on people depends on the peak overpressure, the rate of rise
and the duration of the positive phase. The damaging effect of a given peak overpressure is
greater if the rise is rapid. A relatively high overpressure (>90 kPa) will cause fatalities from direct blast effects,
primarily due to lung haemorrhage (Lees, 1996). However, lower overpressures can also
result in fatalities due to indirect effects such as missiles and whole body translation. Estimating the injury effects from explosions is complex. The use of probit equations and
other mathematical methods cannot satisfactorily account for the complex effects of blast
impact on humans which may include:
overpressure effects on sensitive organs such as lungs
generation of high velocity fragments
dislocation of heavy equipment
'blowing' of person's body against hard and/or sharp surfaces
collapse of structures on the person. Risk analysts have developed qualitative guidelines for the effects of explosion
overpressures on people based on review of quantitative methods and past explosion
incidents. Table 4.8 provides a rough guide from which approximate fatality probability
can be assigned for various overpressure levels.
4 .24 TO P I C 4 ES T I M AT I N G T HE
S E V E R I T Y O F
C O N S E Q U E N C E S
UN
IT 4
15
E
NG
INE
ER
ING
RIS
K M
AN
AG
EM
EN
T
Table 4.8: Expected effects on personnel at various explosion overpressures
Overpressure
(kPa) Personnel injury
186 Personnel will be killed by blast, by being struck by debris, or by impact against hard surfaces.
83 Personnel will be subject to suffer severe injuries or death from direct blast, building collapse, or translation.
55 Personnel are likely to be injured seriously due to blast, fragments, debris and translation. There is a 15 percent chance of eardrum rupture.
24 Personnel may suffer serious injuries from fragments, debris, firebrands or other objects. There is a two percent chance of eardrum damage to personnel.
16 Occupants of exposed structures may suffer temporary hearing loss or injury from blast effects, building debris and displacement. Although personnel in the open are not expected to be killed or seriously injured by blast effects, fragments and debris may cause some injuries.
12 Occupants of exposed, unstrengthened structures may be injured by secondary blast effects, such as falling building debris. Although personnel in the open are not expected to be killed or seriously injured by blast effects, fragments and debris may cause some injuries.
6–8 Personnel in buildings are provided a high degree of protection from death or serious injury; however, glass breakage and building debris may still cause some injuries. Personnel in the open are not expected to be injured seriously by blast effects. Fragments and debris may cause some injuries.
Source: Based on United States Department of Defense Ammunition and Explosives Safety
Standards, DoD 6055.9-STD, October 5 2004: 28–31.
Explosion effects on structures
The pressure loading generated by explosions and deflagrations has complex effects on
structures and structural components. High combustion rates produce a pressure loading
that varies with time, and the response of the structure to this variable load is itself time
dependent. The usual practice is to convert the pressure-time characteristics into an
equivalent static loading which is more convenient for structural response calculations.
In general, the structural response broadly depends on the peak overpressure and the ratio
of the duration of the imposed pressure load (td) to the natural period of vibration (tn) of the
structure. The duration of the main overpressure peak in a vented or partially confined
vapour cloud explosion is typically of the order of 100–200 milliseconds (ms). The natural
period of vibration of structural building components depends on the method of
construction and size of components, but typically lies in the range 10–50 ms. Since the
duration of the overpressure is generally larger than the natural period of vibration of the
structural element, the loading experienced will be equivalent to a static load of magnitude
equal to the peak overpressure generated by combustion.
The few experimental studies that have investigated the response of structures to gas
explosions have been confined to typical building materials. Some extremely rough
estimates on the effect of various overpressures on equipment and structures are shown in
Table 4.9. It is not possible to present satisfactory approximations for explosion
overpressure damage because of the complexity of these effects. The severity of these
effects is dependent not only on the peak overpressure but also on the duration, blast wave
reflections and the structural properties of the equipment.
4 .25 TO P I C 4 ES T I M AT I N G T HE
S E V E R I T Y O F
C O N S E Q U E N C E S
UN
IT 4
15
E
NG
INE
ER
ING
RIS
K M
AN
AG
EM
EN
T
Table 4.9: Effect of explosion overpressures on structures
Overpressure range (kPa)
Damage effect
70+ Pumps, compressors, vertical pressure vessels, turbines, damaged. Pipes ruptured and damaged. Equipment displaced off mountings.
35–70 Horizontal pressure vessels and heat exchangers damaged. Pipe breaks at flanges. Damage to thin walled steel equipment. Complete demolition of houses.
Fire Modelling & Computing—FireWind http://members.optusnet.com.au/~firecomp
International Standards Organization http://www.iso.org/iso/en/ISOOnline.frontpage
Shell Global Solutions—FRED software http://www.shell.com/static/globalsolutions-en/downloads/services_and_technologies/business_consultancy/hse/cts_bc_hse_fred.pdf
TNO—EFFECTS and DAMAGE software http://www.tno.nl/bouw_en_ondergrond/ producten_en_diensten/software/industriele_veiligheid/index.xml
UK Health and Safety Executive http://www.hse.gov.uk
US Defense Technical Information Centre http://www.dtic.mil
US Environmental Protection Authority http://www.epa.gov
SU G G E S T E D A N S W E R S
EXERCISES
4.1 Qualitative severity level assessment
a) The impact level is described as producing coughing, distress. Since children are
present, if they are exposed, there is potential for serious injury, not simply distress.
Therefore, the severity level from Table 4.3 is Level 3.
b) Thanks to the timely action of the driver in stopping all traffic, there is unlikely to be a
fatality. If the BLEVE had occurred without this action, the driver and other motorists
nearby would have been fatally injured. From Table 4.3, this is a Level 5 incident.
c) It is difficult to rank this incident without having some information on the extent of
revenue loss that may occur if expected passenger volumes are not achieved. If it is of
the order of Level 4 or 5 per year (losses in the millions of dollars), the viability of the
operation is threatened.
d) Uncontrolled flow of water from a large dam not only causes environmental damage
downstream due to flooding, but also results in loss of water supply from the dam.
Alternative supplies have to be found and the cost of transportation is very high. The
cost of this event would be in tens of millions of dollars, and hence it is a Level 5
incident.
e) From Table 4.8, the impact of a 10 kPa explosion overpressure would not result in
serious injury, unless hit by flying debris. Since there is insufficient information
available, we can conservatively assess this to be a Level 3 lost time injury rather than a
Level 2 medically treated injury.
4.2 Identification of information requirements
a) Quantity of chlorine, method of storage, location of storage, ventilation rate of storage
room, size of connections from the storage to chlorination point, location of chlorine
detector, whether chlorine alarm can be heard at all locations in the facility, response
procedures to an alarm, and the pressure of chlorine in storage and physical properties
of chlorine.
b) The amount of LPG carried by the tanker, the fittings and connections in the tanker, the
size of hose, the emergency isolation valves on the tanker and how they are operated,
ignition sources near the unloading area, the pressure of LPG in the tanker and physical
properties of LPG.
c) Size and capacity of the crane, height of lift, operating load as a percentage of total
load capacity of the crane, operating envelope with respect to the operating load, type
of rigging, method of securing to load during lifting, communication procedures
between crane driver and dogman, area to be cleared of people during lift, potential for
the load to swing, wind conditions.
d) Volume of crude oil carried by tankers, physical properties of crude oil, tanker speed,
whether or not it is being piloted, other users of the waterway, weather conditions, leak
detection method, spill response procedures.
e) Diameter of pipeline, wall thickness, maximum allowable operating pressure of
pipeline, physical properties of natural gas, length of pipeline, operating pressure in the
Estimation of likelihood using statistical data 5.3 Failure rates 5.4 Sources of failure rate data 5.4 Typical failure rate data 5.6 Adjusting for the effects of safety and maintenance management systems 5.8 Human reliability analysis (HRA) 5.9 Calculating event frequency from historical data 5.12 Probability distributions 5.14 Reliability and availability 5.21 Screening reliability data 5.25
Estimation of likelihood using analytical techniques 5.28 Fault tree analysis 5.28 Event tree analysis 5.29 Cause–consequence analysis 5.31
Risk measurement and ranking 5.32 Qualitative risk matrix approach 5.33 Approaches for risk to people 5.34 Approaches for risk to projects 5.39
Summary 5.42
Exercises 5.42
References and further reading 5.44
Appendix 5.1 5.48
Readings
Suggested answers
5.1 TO P I C 5 ES T I M AT I N G
E V E N T
LI KE LI HO O D AN D
M E AS U R I N G AN D
R AN KI N G R I S K
UN
IT 4
15
E
NG
INE
ER
ING
RIS
K M
AN
AG
EM
EN
T
PR E V I E W
INTRODUCTION
In this topic we examine the fourth and fifth steps of the risk management framework:
estimating the likelihood of a loss event occurring and measuring and ranking the overall
level of risk.
There are two dimensions that need to be taken into account in likelihood estimates: event
probability and event frequency. We therefore begin this topic with a discussion of the
distinction between these dimensions.
We then discuss three basic approaches to estimating the likelihood of loss events:
1. A simple qualitative approach that can be used before undertaking a detailed estimation
to help decide which of the two quantitative approaches is most appropriate to a given
scenario.
2. A quantitative approach using statistical data to estimate the likelihood of loss events
caused by single failures. This is sometimes called the 'historical approach' or the
'actuarial method' and is often used in the insurance industry. It is also used by
organisations to estimate the likelihood of low consequence/high frequency and
medium consequence/medium frequency loss events such as workplace injuries, short
production interruptions caused by equipment breakdowns and non-conformance in a
quality assurance system.
3. A quantitative approach using analytical techniques such as a fault tree analysis, an
event tree analysis or a cause–consequence analysis to estimate the likelihood of loss
events caused by multiple failures, by breaking them down into their contributing
causes. This approach is commonly used for high consequence/low frequency loss
events such as major fires or explosions, structural collapses or dam failures because
the infrequency of such events means that limited statistical data is available and
circumstances and contributing factors are generally complex and change between
event occurrences (e.g. new designs, management systems and operations and
maintenance philosophies).
Once the likelihood of a loss event has been estimated, the overall level of risk can be
measured by combining the consequence severity estimate with the likelihood estimate.
The results can then be ranked according to magnitude of risk. We will therefore conclude
the topic by discussing a range of techniques for measuring and ranking risk. OBJECTIVES
After studying this topic you should be able to:
distinguish between probability and frequency
conduct simple qualitative assessments of likelihood for initial screening
estimate event frequency using statistical data
estimate event probability and assess the level of uncertainty in the result
construct simple fault trees and event trees
measure and rank risks to people and projects using appropriate methods. REQUIRED READING
Reading 5.1 'Fault trees'
5 .2 TO P I C 5 ES T I M AT I N G
E V E N T
LI KE LI HO O D AN D
M E AS U R I N G AN D
R AN KI N G R I S K
UN
IT 4
15
E
NG
INE
ER
ING
RIS
K M
AN
AG
EM
EN
T
PRO BA B I L I T Y A N D F R E Q U E N C Y
The estimation of event likelihood involves consideration of event probability and event
frequency. The terms probability and frequency are often used interchangeably in risk
management. This is technically incorrect, as the following definitions show.
Definition—Probability 'A measure of the chance of occurrence expressed as a number between 0 and 1'
(AS/NZS 4360:2004).
Probabilities are generally used to measure the reliability of protection systems, or the
reliability of the barriers against realisation of a hazard.
Example 5.1
The probability of a firewater pump failing to start on demand is 0.005. This means
that out of 1000 such demands on the fire pump to start, it could fail on 5 occasions.
Definition—Frequency 'A measure of the number of occurrences per unit of time' (AS/NZS 4360:2004).
Frequency has a time element associated with it. In risk assessments of facilities that have
several years of operating life, the timeframe is usually taken as one year, therefore the
frequency may be expressed as the number of occurrences per year.
Example 5.2
The frequency of a minor fire in a goods storage facility is 0.01 per year.
This may be interpreted in two different ways. Insurance companies will generally
interpret it to mean that out of every 100 similar facilities operating under similar
conditions around the world, a minor fire could occur in one of them in a given year.
However, a manager of a specific facility will generally interpret it to mean that there
is a 1% chance of a fire in that facility in a given year.
In risk management, both frequency and probability are important parameters. For instance:
Frequency of a major loss event =
Frequency of an initiating minor loss event x Probability the event was not contained.
Example 5.3
A facility is equipped with a fire protection system, and a firewater pump is installed
to supply the sprinkler system. The frequency of a minor fire is 0.01 per year (p.a.)
and the probability of the firewater pump failing to start on demand is 0.005.
If a fire occurs and the firewater pump fails, there would be delay in mobilising other
fire fighting measures and the minor fire could escalate to a major fire. Thus:
Frequency of a major fire = Frequency of a minor fire x Probability of firewater pump failing to start on demand
= 0.01 p.a. x 0.005 = 5 x 10⁻⁵ p.a.
5.3 TO P I C 5 ES T I M AT I N G
E V E N T
LI KE LI HO O D AN D
M E AS U R I N G AN D
R AN KI N G R I S K
UN
IT 4
15
E
NG
INE
ER
ING
RIS
K M
AN
AG
EM
EN
T
Note that the frequency value has a unit attached to it (p.a.) whilst the probability
value is dimensionless. It is good practice to always label the unit of the frequency
value to prevent confusing the two parameters in numerical manipulations.
QUA L I TAT I V E E S T I M AT I O N O F L I K E L I H O O D
Before undertaking a detailed quantification of the likelihood of a loss event occurring, it is
helpful to carry out a quick qualitative assessment to give you a feel for whether you should
consider using a statistical quantitative approach or an analytical quantitative approach.
A useful qualitative grading system for event likelihood is shown in Table 5.1.
Table 5.1: Qualitative measures of likelihood Level Descriptor Explanation
A Almost certain Chance of the event occurring multiple times in a year, say weekly to monthly.
B Likely Chance of the event occurring once in a year.
C Possible Chance of the event occurring once in 10 years.
D Unlikely Very low chance of the event occurring, say once in 100 years.
E Rare Possible, but improbable event, say once in 1000 years.
If you assess that a particular loss event is either almost certain, likely or possible, there is a
reasonable chance that reliable statistical data may be available that will assist you in
quantifying the likelihood in more detail. However, if you assess that a loss event is
unlikely or rare, there is little chance that reliable statistical data will be available which
means an analytical quantitative approach may be required.
Remember, a qualitative assessment should only be used for screening purposes and is not a
substitute for a detailed quantitative estimation of likelihood.
ES T I M AT I O N O F L I K E L I H O O D U S I N G S TAT I S T I C A L DATA
A quantitative approach using statistical data is commonly employed to estimate the
likelihood of low consequence/high frequency and medium consequence/medium frequency
loss events caused by single failures. Since an operational system typically consists of
hardware, software and human operators, two different types of statistical data need to be
considered: statistical failure rates for hardware and software, and data on the probability of
human error.
In this section we examine how failure rate data and human reliability analysis are used to
calculate the likelihood of loss events. We also examine probability distributions in detail.
5 .4 TO P I C 5 ES T I M AT I N G
E V E N T
LI KE LI HO O D AN D
M E AS U R I N G AN D
R AN KI N G R I S K
UN
IT 4
15
E
NG
INE
ER
ING
RIS
K M
AN
AG
EM
EN
T
FAILURE RATES
The failure rate of an equipment item or component is defined as the number of failures per
unit of time. A failure rate is therefore a frequency value. The failure rate of an equipment item or component is not constant. In the early 'run in'
stages of installation and operation, the failure rate could be higher due to installation errors
and commissioning problems. Once these are solved, the failure rate reduces and remains
relatively constant for the 'useful' operating life of the equipment, when it is subject to the
manufacturer's recommended maintenance routine. Finally, the equipment reaches the 'wear
out' stage when the failure rate increases due to wear and tear and the sheer age of the
equipment. A much higher level of repair and maintenance is required and eventually the
equipment must be replaced. In general, failure rates reported in generic statistical databases refer to the useful operating
life period. These are 'mean' failure rates and are treated as the mean of a statistical
distribution. In some instances, a lower bound and an upper bound value of the distribution
may also be provided. Failure rates are normally expressed as number of failures per million hours. The hours can
be calendar hours or operating hours. Since risk is often expressed on a 'per year' basis for
decision making purposes, the failure rate per million hours can be converted to a per year
basis for calculation purposes.
Example 5.4
The failure rate for critical failures of a compressor is 190 per million hours. The
compressor operates around the clock, except for scheduled maintenance periods.
The mean failure rate per annum is calculated as follows.
Failure rate = 190/106 hours = 1.9 x 10⁻⁴/h
Hours/year (continuous operation) = 8760
Failure rate/year = 1.9 x 10–4 x 8760 = 1.66 p.a.
SOURCES OF FAILURE RATE DATA
Failure data can be obtained from two principal sources:
in-house records
generic statistical databases.
In-house records
Data from a company's own operations records about a particular process or facility is the
most accurate data available. Data from other similar facilities within the same company is
not quite as accurate but is still better than data from generic sources because it reflects the
design, construction, operations and maintenance philosophies and practices of the
company. Such data is particularly valuable for reliably estimating the likelihood of high
consequence events such as fires and major equipment breakdown.
5.5 TO P I C 5 ES T I M AT I N G
E V E N T
LI KE LI HO O D AN D
M E AS U R I N G AN D
R AN KI N G R I S K
UN
IT 4
15
E
NG
INE
ER
ING
RIS
K M
AN
AG
EM
EN
T
The difficulty with compiling in-house data is that long periods of operating time are
required to obtain statistically significant probability data for low frequency events, and for
the failure rate of reliable but infrequently used equipment. The collection of data must also
be stringently managed to ensure all incidents are recorded. This means that accurate
first-hand data is rarely available, so it is generally necessary to draw upon generic
databases.
Generic statistical databases
A list of generic statistical data sources is provided in Appendix 5.1. The Norwegian
University of Science and Technology ROSS website http://www.ntnu.no/ross/info/data.php
is also a useful source of information.
For most populations of equipment items upon which generic estimates are based, the
number of failures is insufficient to determine the variation of failure rate with time. Given
the accuracy limits of the basic data, it is usually assumed that the failure rate (λ) is
constant. Under this assumption, an item operating at time t will fail in a subsequent
interval δτ with probability λδτ that is independent of t.
The failure rates quoted in generic databases generally include an upper and lower bound
on the failure rate. In most cases this estimate interval is due to the statistical sampling
uncertainty and is calculated assuming a constant failure rate. The more failures observed,
the narrower this uncertainty.
These estimate intervals usually do not indicate the likely spread of failure rates within one
industry, let alone between different industries. Thus it can be expected that different
estimate intervals for the 'same' item of equipment may not always overlap, and experience
at a particular site need not fall within the quoted interval. The uncertainty interval does not
indicate the possible range of expected failure rates for a component in a particular
application. A better indication of this is given by the range of failure rates for similar
components from a number of sources. However, because of the varying operating
conditions of components from different populations, some judgment of the suitability of
each source is required.
Various United States military references quote base failure rate values for most electronic
equipment, together with scaling factors to take account of the most significant factors
affecting these rates (e.g. operating temperature). The same level of precision is not
possible for engineering equipment, and scaling factors for particular operating conditions
are not readily available. However, usage patterns and operating environment affect the
reliability of engineering equipment more than they affect that of electronic equipment.
The following points are the major factors to consider when selecting an estimate for a
specific item of engineering equipment.
Equipment failure rates are specific to the mode of failure. For example, the rate at
which a valve fails to open may be substantially different to the rate at which the same
valve fails to close. The definition of the failure mode should therefore be identified
wherever possible.
Many generic estimates are based on all modes of failure, which in practice means all
failures reported in the maintenance history. However, in a particular application only
one mode may be relevant. For example, failure rates for a compressor that includes
the drive unit, gearbox, compression unit, lubrication system and cooling system
obviously differ from those that include only the compression unit. Thus the estimates
may be re-scaled by an assessed ratio of the mode of concern to the all-mode estimate.
5 .6 TO P I C 5 ES T I M AT I N G
E V E N T
LI KE LI HO O D AN D
M E AS U R I N G AN D
R AN KI N G R I S K
UN
IT 4
15
E
NG
INE
ER
ING
RIS
K M
AN
AG
EM
EN
T
Within a given class of equipment, different equipment types will have different failure
rates. For example, a gear pump, a centrifugal pump and a positive displacement pump
will all have different failure rates. It is therefore essential to find the specific failure
rate for a particular type of equipment.
Site knowledge should be taken into account, particularly where there is an interest in
the relative reliability of items of equipment that have been in use for some time. For
example, even though generic data would indicate that equipment type A is more
reliable than equipment type B, it may happen that on a particular site type B performs
better than A because of the way it is used.
The internal and external environment can have a significant effect on equipment
reliability. For example, electric motor burn-out is mainly due to excessive
temperature of the windings. Winding temperature is influenced by the ambient
temperature, motor load, dust and use of protective sensors. It is therefore necessary to
consider to extent to which a specific environment differs to that of the generic data
source. When selecting estimates to use, consider factors such as:
the nature of substances handled (e.g. acids will cause corrosion)
The level of operation significantly influences equipment reliability. Equipment lightly
loaded can be expected to fail less often than equipment heavily loaded, and continuous
operation under uniform conditions is usually less arduous than repeated stops and
starts. Equipment operated on standby or only in an emergency will generally have
poorer reliability than similar equipment operated more regularly. It may be more
useful to quote failure rates of such equipment on a per cycle basis or as a fail-to-start
percentage.
TYPICAL FAILURE RATE DATA
Indicative failure rates for a range of equipment items are presented in Table 5.2 on the
following page. This data is provided for illustrative purposes to demonstrate the
differences in failure rate between different equipment items and to provide an approximate
guide to their magnitude.
A typical data sheet of reliability data is shown in Figure 5.1.
5.7 TO P I C 5 ES T I M AT I N G
E V E N T
LI KE LI HO O D AN D
M E AS U R I N G AN D
R AN KI N G R I S K
UN
IT 4
15
E
NG
INE
ER
ING
RIS
K M
AN
AG
EM
EN
T
Table 5.2: Typical generic failure rate data
1. Piping Leaks/m/yr (Cox et al., 1990) Diameter Rupture (A) Major (0.1A) Minor (0.01A)
25 1 x 10⁻⁶ 1 x 10⁻⁵ 1 x 10⁻⁴ 50 1 x 10⁻⁶ 1 x 10⁻⁵ 1 x 10⁻⁴ 100 3 x 10⁻⁷ 6 x 10⁻⁷ 3 x 10⁻⁵ 300 1 x 10⁻⁷ 3 x 10⁻⁶ 1 x 10⁻⁵ A = Cross-sectional area of pipe
2. Pumps Leaks/m/yr (Cox et al., 1990) Rupture (A) Major (0.1A) Minor (0.01A)
3 x 10⁻⁵ 3 x 10⁻⁴ 3 x 10⁻³ A = Cross-sectional area of pump connection
3. Flanges Major failure (Blything & Reeves, 1988) 5 x 10⁻⁶ pa/ flange connection
4. Non-return valves Failure rate (Blything & Reeves, 1988) 3 x 10⁻⁷/h to 4.2 x 10⁻⁵/h
5. Excess flow valves Failure probability on demand (Blything & Reeves, 1988) 0.13
6. Remote shutdown valves Failure probability on demand (Blything & Reeves, 1988) 0.001 to 0.005
7. Pressure vessels (Pape & Nussey, 1985)
Instantaneous 25–50 6–13
Failure frequency per yr 1 x 10⁻⁶ to 3 x 10⁻⁶ 6 x 10⁻⁶ 30 x 10–6
8. Pneumatic Transmitters (CCPS, 1989a)
Level Flow Pressure Differential pressure Temperature
Failure frequency per 106 hrs 2.32—141.0 1.93—109.0 0.159—91.3 1.01—218.0 1.68—97.0
9. Electric switches (CCPS, 1989a)
Flow Level Pressure Temperature
Failure frequency per 106 hrs 0.917—26.8 0.737—1.74 0.525—49.6 0.102—2.28
10. Pneumatic switches (CCPS, 1989a)
Level Pressure Temperature
Failure frequency per 106 hrs 0.0972—0.62 2.18—5.20 1.09—5.00
11. Flame detector Failure frequency per 106 hrs (CCPS, 1989a) 0.053—1760.0
12. Annunciators Failure frequency per 106 hrs (CCPS, 1989a) 0.0272—0.77
5 .8 TO P I C 5 ES T I M AT I N G
E V E N T
LI KE LI HO O D AN D
M E AS U R I N G AN D
R AN KI N G R I S K
UN
IT 4
15
E
NG
INE
ER
ING
RIS
K M
AN
AG
EM
EN
T
Figure 5.1: Typical data sheet of reliability data
Data on selected process systems and equipment
Taxonomy No. 2.1.5
Operating Mode:
Population Samples Aggregated time in service (106 hrs)
a. Functional without Signalb. Failed to Function when signalled
DEGRADEDa. Functioned at Improper Signal Levelb. Intermittent Operation
INCIPIENTa. In-service Problems
Equipment Boundary
Power supply
Sensor Computationalunit
Indicator/alarm
Output
Boundary
Date Reference No. (Table 5.1): 1,4
Source: CCPS, 1989a.
ADJUSTING FOR THE EFFECTS OF SAFETY AND MAINTENANCE MANAGEMENT SYSTEMS
Generic industry data is normally based on statistical data of equipment failures in similar
or allied industries. Therefore, in using generic data the analyst assumes (or implies) that
the facility's equipment and systems are maintained at standards equivalent to the industry
average. This may not be the case. If a facility's safety and maintenance management
systems are significantly inferior or superior to the industry's average, the failure rate of
equipment may be up to orders of magnitude lower or higher than the generic rate. Any
5.9 TO P I C 5 ES T I M AT I N G
E V E N T
LI KE LI HO O D AN D
M E AS U R I N G AN D
R AN KI N G R I S K
UN
IT 4
15
E
NG
INE
ER
ING
RIS
K M
AN
AG
EM
EN
T
assessment of the risks at a facility must therefore include an assessment of how processes
and equipment are operated and maintained at that facility. There has been much discussion amongst regulatory authorities about whether it is possible
to apply some numerical factor to the 'average' data to allow for non-average quality of
safety management. The Health and Safety Executive in the UK (HSE, 1990) argues that if
such an approach is used, it should be done only within narrow limits. A large adjustment
to reduce the generic failure rate for an above-average safety management system could
well be optimistic given the possibility of changes over the years; conversely, a large
adjustment to increase the generic failure rates for a below-average safety management
system would seem to imply that a below-average level of safety is tolerable, which is not
the case. An attempt has been made to develop a method that accounts for the influence of safety
management systems on the frequency of loss events (Murphy and Paté-Cornell, 1996).
The approach entails undertaking a safety management audit of a facility and using the
results to derive a numerical factor to be used for the adjustment of failure frequencies. As
a guide, generic frequencies could be reduced by a factor of up to three for superior safety
management (best practice situation) or increased by a factor of ten for poor safety
management. The validity of this method is yet to be proven and standard practice is to use
industry average failure rate data from the generic databases. Many industries undertake a reliability centred maintenance (RCM) program to optimise the
maintenance requirements. This is a powerful risk management tool and is discussed in
Topic 7.
HUMAN RELIABILITY ANALYSIS (HRA)
An operational system typically consists of hardware, software and human operators.
Analysing the failure rates of hardware and software therefore tells us only part of what we
need to know to estimate loss event likelihood: to complete the picture we also need to
analyse the probability of human error. A human error is an action that fails to meet some of the limits of acceptability as defined
for a system. The action may be physical (e.g. closing a valve) or cognitive (e.g. fault
diagnosis or decision making). Human errors have been classified into the following
categories (HSC, 1991).
a) Skill-based errors that arise during the execution of a well-learned, fairly routine task
such as calibration, testing, or responding to an alarm.
b) Rule-based errors that occur when a set of operating instructions or rules to guide a
sequence of actions are either not followed, misunderstood, or a wrong sequence is
used, for example not following the startup/shutdown procedures.
c) Knowledge-based errors that arise when a decision has to be made between alternative
plans of action, for example deciding in an emergency whether to shutdown or continue
to operate, and whether to evacuate or try to fight a fire. Human reliability analysis (HRA) is concerned with the qualitative and quantitative analysis
of human error to facilitate the design of systems with greater error-tolerance. However,
predicting human error is complex and the accuracy and validity of HRA methods has often
been criticised from both theoretical and practical viewpoints (HSC, 1991). To date, there
has been limited application of HRA beyond the nuclear industry, the aerospace industry
and the defence forces.
5 .10 TO P I C 5 ES T I M AT I N G
E V E N T
LI KE LI HO O D AN D
M E AS U R I N G AN D
R AN KI N G R I S K
UN
IT 4
15
E
NG
INE
ER
ING
RIS
K M
AN
AG
EM
EN
T
The most common HRA methods are shown in Table 5.3.
Table 5.3: Human reliability analysis methods
Method Feature Reference THERP Technique for Human Error Rate Prediction
Contains tables of task/probabilities as a generic database
Swain & Guttmann (1983)
HCR Human Cognitive Reliability Model
Time-related analysis Moieni et al. (1994)
HEART Human Error Analysis and Reliability Technique
Based on performance shaping factors (PSF)
Williams (1986)
INTENT Based on performance shaping factors (PSF)
Gertman et al. (1992)
In addition to these methods, Yu et al. (1999) have suggested a complementary method
called Human Error Criticality Analysis (HECA). HECA is similar to the FMECA on
hardware systems, and is used to identify critical human tasks that have a high error
probability or severe consequences. It is important to remember that not all human errors
will result in severe consequences because recovery is possible in some instances. HECA
enables attention to be focused on critical tasks only.
When assessing the contribution of human error to a potential loss event, two distinct stages
in the event sequence should be considered: pre-event and post-event. During both stages,
the probability that a human error will result in a loss event is dependent on various factors
that affect performance in the operators' environment. These are commonly referred to as
performance shaping factors (PSF) (Swain and Guttman, 1983) and the most important of
these are:
critical equipment control design
training of operators
communication and procedures
instrumentation feedback and design
preparedness (expected frequency of situation)
stress.
A set of general guidelines for estimating the probability of operator error for various
situations, both pre-event and post-event, is listed in Table 5.4.
Once a loss event sequence has started, the most important variable is the time the operators
have to detect and correct errors before a serious condition results. The more time they
have, the more likely they are to be able to detect and diagnose the problem, decide on a
course of action, and implement the desired response. Figure 5.2 provides a general guide
to the probability of operator error as a function of time available for action (CCPS, 1989b).
5 .11 TO P I C 5 ES T I M AT I N G
E V E N T
LI KE LI HO O D AN D
M E AS U R I N G AN D
R AN KI N G R I S K
UN
IT 4
15
E
NG
INE
ER
ING
RIS
K M
AN
AG
EM
EN
T
Table 5.4: General estimates of probability of human error
Estimated error
probability
Activity
0.001 Selection of a switch dissimilar in shape or location to the desired switch, assuming no decision error, e.g. operator actuates large-handled switch rather than small switch.
0.003 General human error or commission, e.g. misreading label and therefore selecting wrong switch.
0.01 General human error of omission where there is no display in the control room of the status of the item omitted, e.g. failure to return manually-operated test valve to proper configuration after maintenance.
0.003 Errors of omission, where the items being omitted are embedded in a procedure rather than at the end as above.
1.0 If an operator fails to operate correctly one of two close coupled valves or switches in a procedural step, he also fails to correctly operate the other valve.
0.1 Personnel on different work shift fail to check condition of hardware unless required by checklist or written directive.
0.5 Monitor fails to detect undesired position of valves etc. during general walk-around inspections, assuming no checklist is used.
0.2—0.3 General error rate given very high stress levels where dangerous activities are occurring rapidly.
2(n–1). x Given severe time stress, as in trying to compensate for an error made in an emergency situation, the initial error rate x for an activity doubles for each attempt n after a previous incorrect attempt, until the limiting condition of an error rate of 1.0 is reached or until time runs out.
1.0 Operator fails to act correctly in the first 60 seconds after the onset of an extremely high stress condition, e.g. loss of coolant in a nuclear reactor.
0.9 Operator fails to act correctly after the first five minutes after the onset of an extremely high stress condition.
0.1 Operator fails to act correctly after the first 30 minutes after the onset of an extremely high stress condition.
0.01 Operator fails to act correctly after the first several hours in a high stress condition.
Source: Health and Safety Commission (HSC), 1991: 88–89.
Figure 5.2 Probability of failure by control room personnel to correctly diagnose an abnormal event
1E + 0
1E – 1
1E – 2
1E – 3
1E – 4
1E – 5
1 10 100 1000 10000
Time available (in minutes) for diagnosis of anabnormal event after control room annunciation.
Source: CCPS, 1989b: 242.
5 .12 TO P I C 5 ES T I M AT I N G
E V E N T
LI KE LI HO O D AN D
M E AS U R I N G AN D
R AN KI N G R I S K
UN
IT 4
15
E
NG
INE
ER
ING
RIS
K M
AN
AG
EM
EN
T
CALCULATING EVENT FREQUENCY FROM HISTORICAL DATA
According to the CCPS Guidelines for Chemical Process Quantitative Risk Analysis
(2000), there are five steps required to calculate event frequency from historical data:
1. Define context.
2. Review source data.
3. Check data applicability.
4. Calculate event frequency.
5. Validate frequency.
These steps are described below using extracts from the CCPS Guidelines (CCPS, 2000:
300–301).
Step 1 Define context. The historical approach may be applied at any stage of a
design—conceptual, preliminary, or detailed development—or to an existing
facility. System description and hazard identification should be completed to
provide the details necessary to define the loss event list. These steps are
potentially iterative as the historical record is an important input to hazard
identification. The output of this step is a clear specification of the loss events
for which frequency estimates are sought.
Step 2 Review source data. The relevant source data should be reviewed for
completeness and independence. Lists of loss events will almost certainly be
incomplete and some judgment will have to be used. The historical period must
be of sufficient length to provide a statistically significant sample size.
Loss event frequencies derived from lists containing only one or two events of a
particular type will have large uncertainties. When multiple data sources are
used, duplicate events must be eliminated. Sometimes the data source will
provide details of the total plant or item exposure (plant-years, etc.). Where the
exposure is not available, it will have to be estimated from the total number and
age of plants in operations, the total number of vehicle-miles driven, etc.
Step 3 Check data applicability. The historical record may include data over long
periods of time (5 or more years). As the technology and scale of plant may
have changed in the period, careful review of the source data to confirm
applicability is important. It is a common mistake for designers to be
overconfident that relatively small design changes will greatly reduce failure
frequencies. In addition, larger-scale plants (those that employ new technology)
or special local environmental factors may introduce new hazards not apparent
in the historical record. It is commonly necessary to review event descriptions
and discard those failures not relevant to the plant and scenario under review.
Step 4 Calculate event frequency. When the data are confirmed as applicable and the
loss events and exposure are consistent, the historical frequency can be obtained
by dividing the number of incidents by the exposed population. For example, if
there have been five major leaks from pressurised ammonia tanks from a
population of 2500 vessel-years, the leak frequency can be estimated at 2 x 10⁻³
per vessel-year.
Where the historical data and the plant under review are not totally consistent, it
is necessary to exercise judgment to increase or decrease the event frequency.
Where the data are not appropriate, an alternative method, such as fault tree
analysis, must be employed.
5 .13 TO P I C 5 ES T I M AT I N G
E V E N T
LI KE LI HO O D AN D
M E AS U R I N G AN D
R AN KI N G R I S K
UN
IT 4
15
E
NG
INE
ER
ING
RIS
K M
AN
AG
EM
EN
T
Step 5 Validate frequency. It is often possible to compare the calculated event
frequency with a known population of plant or equipment not used for data
generation. This is a useful check as it can highlight an obvious mistake or
indicate that some special feature has not received adequate treatment.
Example 5.5
The following example is taken from the CCPS Guidelines for Chemical Process
Quantitative Risk Analysis (CCPS, 2000: 300–303) and illustrates the estimation of
leakage frequencies for a gas pipeline. Note that values have been metricated.
Step 1 Define context. The objective is to determine the leakage frequency of a
proposed 200 mm diameter, 16 km long, high-pressure ethane pipe, to be
laid in a semi-urban area. The proposed pipeline will be seamless, coated,
and cathodically protected, and will incorporate current good design and
construction practices.
Step 2 Review source data. Three sources of data are available:
British Gas;
European Gas Pipelines Association; and
US Department of Transportation.
The database found to be the most complete and applicable is the gas
transmission leak report data collected by the US Department of
Transportation for the years 1970–1980. It is based on 400 000 pipe-km
of data, making it the largest such database. It contains details of failure
mode and design/construction information. Conveniently, it contains both
incident data and pipeline exposure information.
Step 3 Check data applicability. The database includes all major pipelines, of
mixed design specifications and ages. Thus, inappropriate pipelines and
certain non-relevant incidents must be rejected. The remaining,
population exposure data are still extensive and statistically valid. Those
data rejected are:
Pipelines:
– pipelines that are not steel;
– pipelines that are installed before 1950; and
– pipelines that are not coated, not wrapped, or not cathodically
protected.
Incidents:
– incidents arising at a longitudinal weld;
– incidents where construction defects and materials failures
occurred in pipelines that were not hydrostatically tested.
Step 4 Calculate likelihood. The pipeline leakage frequencies are derived from
the remaining Department of Transportation data using the following
procedure:
1. Estimate the base failure rate for each failure mode (i.e. corrosion,
third party impact, etc.).
2. Modify the base failure rate, as described above, where necessary to
allow for other conditions specific to this pipeline. In particular, the
Department of Transportation failure frequency attributable to
external impact is found to be diameter dependent, and data
appropriate for a 200 mm pipeline should be used. As the pipeline is
to be built in a semi-urban area, the failure frequency for external
impact is judged to increase by a factor of 2 to reflect higher
frequency digging activities. Conversely, the semi-urban location is
5 .14 TO P I C 5 ES T I M AT I N G
E V E N T
LI KE LI HO O D AN D
M E AS U R I N G AN D
R AN KI N G R I S K
UN
IT 4
15
E
NG
INE
ER
ING
RIS
K M
AN
AG
EM
EN
T
expected to reduce the frequency of failure due to natural hazards,
because of the absence of river crossings, etc. The frequency of this
failure mode is judged to be reduced by a factor of 2.
Table 5.5 shows the application of Steps 3 and 4 to the raw frequency
data. The approximate distribution of leak size (full bore, 10% of
diameter, pinhole) by failure mode is then obtained from the database.
This distribution is used to predict the frequency of hole sizes likely from
the pipeline. Thus, if this distribution were 1, 10, and 89%, respectively,
the full bore leakage frequency for the 16 km pipeline would be:
0.01 x (0.413 leaks/1000 pipe km-years) x 16 km = 6.6 x 10⁻⁵ per year.
Table 5.5: Contribution of failure mechanisms to pipeline example
Failure Frequency (per 1000 pipe km-years)* Failure mode Raw DOT
data Modified data (inappropriate data removed)
Modification factor
(judgment)
Final values
Material defect 0.131 0.044 1.0 0.044
Corrosion 0.20 0.031 1.0 0.031
External impact 0.313 0.15 2.0 0.300
Natural hazard 0.219 0.013 0.5 0.006
Other causes 0.038 0.031 1.0 0.031
Total failure frequency 0.90 0.27 — 0.413
* This value is appropriate for a 200 mm pipe.
Step 5 Validate likelihood. In the United Kingdom, the British Gas Corporation
repeatedly had 75 leaks on their transmission pipelines between 1969 and
1977, on a pipeline exposure of 134 400 km-years. This gives a final
leakage frequency of 0.556 per 1000 km-years, which is consistent with
the value given in Table 5.5.
PROBABILITY DISTRIBUTIONS
Until the mid 1970s items were seen as exhibiting a standard failure profile consisting of
three separate characteristics:
an infant mortality period due to quality of product failures
a useful life period with only random stress-related failures
a wear-out period due to increasingly rapid conditional deterioration resulting from
use or environmental degradation.
This was referred to as the 'bathtub curve' and is shown in Figure 5.3.
The consequence of such beliefs was that equipment was taken out of service and
maintained at particular intervals, regardless of whether it was exhibiting signs of wear.
5 .15 TO P I C 5 ES T I M AT I N G
E V E N T
LI KE LI HO O D AN D
M E AS U R I N G AN D
R AN KI N G R I S K
UN
IT 4
15
E
NG
INE
ER
ING
RIS
K M
AN
AG
EM
EN
T
Figure 5.3: Bathtub failure curve
FailureRate
InfantMortality
Useful Life Wear-Out
Time
However, actuarial studies of aircraft equipment failure data conducted in the early 1970s
identified a more complex relationship between age and the probability of failure (Smith,
1993). This is illustrated in Figure 5.4.
Figure 5.4 Failure rate curves
89%
Wear-In then Random
Random over Measurable Life
Increasing during Wear-In and then Random
Steadily Increasing
Random then Wear-Out
Wear-in to Random Wear-Out
2%
5%
7%
14%
68%
The bathtub curve was discovered to be one of the least common failure modes, and
periodic maintenance was shown to increase the likelihood of failure. This led to the idea
that the maintenance regime ought to be based on the reliability of the components and the
required level of availability of the system as a whole.
5 .16 TO P I C 5 ES T I M AT I N G
E V E N T
LI KE LI HO O D AN D
M E AS U R I N G AN D
R AN KI N G R I S K
UN
IT 4
15
E
NG
INE
ER
ING
RIS
K M
AN
AG
EM
EN
T
Weibull distribution
The three regions in any failure curve may be described by the Weibull distribution, which
has two parameters: η and β.
a) Failure density function:
f (t) =
βη
tη
⎛ ⎝ ⎜
⎞ ⎠ ⎟
β −1
exp −tη⎛ ⎝ ⎜
⎞ ⎠ ⎟
β⎡
⎣ ⎢ ⎢
⎤
⎦ ⎥ ⎥
(5.1)
b) Mean:
μ = ηΓ 1+
1β
⎛ ⎝ ⎜
⎞ ⎠ ⎟ (5.2)
where Γ represents the Gamma function. c) Variance:
σ 2 = η2 Γ 1+2β
⎛ ⎝ ⎜
⎞ ⎠ ⎟ − Γ 1+
1β
⎛ ⎝ ⎜
⎞ ⎠ ⎟
⎡
⎣ ⎢
⎤
⎦ ⎥
2⎧ ⎨ ⎪
⎩ ⎪
⎫ ⎬ ⎪
⎭ ⎪ (5.3)
A three-parameter Weibull distribution is also available and is more flexible, to fit wide
ranging data.
Gamma distribution
The Gamma distribution also has two parameters, is similar to Weibull and simpler to use.
a) Failure density function:
f (t) =
1bΓ(a)
tb
⎛ ⎝ ⎜ ⎞
⎠ ⎟
a− 1
exp −tb
⎛ ⎝ ⎜ ⎞
⎠ ⎟ (5.4)
b) Mean:
μ = ba (5.5)
c) Variance:
σ 2 = b 2 a (5.6)
Negative exponential distribution
A risk assessment mainly concentrates on the 'useful life' region of the bathtub curve in
Figure 5.3, since a piece of equipment is likely to be replaced by the time it reaches the
'wear-out' region. Where this is not the case for an existing operation, the safety
management systems of the organisation should be improved with increased emphasis on
preventive maintenance.
During the 'useful life' period, the failure rate is constant. In other words, a failure could
occur randomly regardless of when a previous failure occurred (i.e. no previous memory).
This results in a negative exponential distribution for the failure frequency. Therefore, the
failure rates used in fault tree analysis are the means of negative exponential distributions
(Wells, 1991; Lees, 1996). Note that this treatment is simplistic in the sense that the data
sources for the failure rates may also contain failures from the 'infant mortality' region and
the 'wear-out' region.
5 .17 TO P I C 5 ES T I M AT I N G
E V E N T
LI KE LI HO O D AN D
M E AS U R I N G AN D
R AN KI N G R I S K
UN
IT 4
15
E
NG
INE
ER
ING
RIS
K M
AN
AG
EM
EN
T
a) Failure density function: f (t) = λ exp −λt( ) (5.7)
b) Mean:
μ =
1λ
(5.8)
c) Variance:
(5.9)
where λ is the failure rate per year
Fitting field data to distributions
Where in-house maintenance data is available for equipment and components, a Weibull or
negative exponential distribution may be fitted to the raw data.
The processed data will provide the mean failure rate (for use in fault tree analysis), as well
as the variance indicating the 'spread' of the distribution and associated uncertainty.
Sophisticated regression techniques and variance reduction techniques are required for the
raw data processing to obtain the parameters of the distributions, available in numerical
analysis texts. The interested reader is referred to Lees (1996) for further information.
Probability of failure on demand
In the previous sections we have considered obtaining information on failure rates of
equipment. This data is normally available as a frequency, e.g. number of failures per
million hours. However, very often in fault tree and event tree analysis we also need
information on the probability of failure on demand. The distinction between the two
should be appreciated, and is critical to a correct analysis.
Many processes and equipment have specific protection systems (e.g. gas or fire detection,
emergency shutdown system, firewater deluge) and the failure rate data of these protection
systems needs to be processed into a probability of failure demand.
Every protection system failure can be placed into one of two categories.
1. The failure is revealed. In this case, a failure can be detected before an actual demand
on the system occurs. One example is a protection system that is proof-tested at regular
intervals. Any failure that had occurred between two successive test intervals would be
revealed.
2. The failure is unrevealed until the demand occurs. The protection system would not
operate if it had failed, but there is no way of knowing this a priori if no proof-testing
is carried out.
The reliability of the protection systems may be assessed by using different calculation
methods, depending on whether it is a revealed failure or not.
A useful parameter when considering failures in protective systems is the probability of
unavailability or probability of failure on demand, known as fractional dead time (FDT).
This parameter is a probability and is the average fraction of time that the protective system
is unavailable. If the frequency of a demand (demand rate (D)) on a protective system is
known, then a resulting 'hazard or loss event rate' (HR) can be calculated. For low demand
rates and small FDTs, the hazard or loss event rate can be obtained by direct multiplication
of the demand rate and FDT.
=
1
λ 2 σ 2
5 .18 TO P I C 5 ES T I M AT I N G
E V E N T
LI KE LI HO O D AN D
M E AS U R I N G AN D
R AN KI N G R I S K
UN
IT 4
15
E
NG
INE
ER
ING
RIS
K M
AN
AG
EM
EN
T
HR = D * FDT (5.10)
where:
HR = hazard or loss event rate/year
D = demand or loss event rate/year
FDT = fractional dead time.
For revealed faults, a component can be in a failed or operational state when proof-testing is
carried out. Whether a protective system is working may be assessed from the following:
1. If a demand occurs between proof-test intervals and the protective system has to
operate.
2. The next proof-test conducted to check the system as part of a routine schedule.
Within the 'useful life' of the equipment, the probability of failure within a time period is as
shown in Figure 5.5.
Figure 5.5: Exponential distribution for failures
Time tTests
Time t
Negative exponential
Probabilityof failure bytime t
Probabilityof failure bytime t
1.0
The FDT of a single component protective system due to component failure is, therefore, a
function of both the mean failure rate of the component (λ) and the proof-test interval (T).
The failure rate dictates on average how often failures occur. If it is assumed they occur
randomly at any time during a proof-test interval, then on average over a large number of
test intervals, a failure could occur halfway through the proof-test interval. Within a
proof-test interval, the average time the system could be in a failed state would then be
approximately (T/2).
The fractional dead time is given by the expression:
( )[ ]TT
λλ
−−−= exp11
1FDT (5.11)
If we expand the exponential series and truncate after the linear term, a simplified
expression results as shown below:
FDT = 0.5λT for λT<<1 (5.12)
5 .19 TO P I C 5 ES T I M AT I N G
E V E N T
LI KE LI HO O D AN D
M E AS U R I N G AN D
R AN KI N G R I S K
UN
IT 4
15
E
NG
INE
ER
ING
RIS
K M
AN
AG
EM
EN
T
Typical magnitudes for FDT values are shown in Table 5.6.
Table 5.6: Typical FDT values
FDT System
0.01 A simple system, regularly tested and reasonably maintained.
0.001 The practical limit for process plant, unless designed and tested by High Integrity Specialists and maintained and tested to those standards.
0.0001 Only in nuclear installations, or process plant with unusually high standards of operation, maintenance, supervision and management, and a benign operating environment
Source: Tweeddale, 1992.
In the case of an operator acting as the protection barrier (i.e. responding to an alarm and
taking necessary action), the human error probability is directly used in the analysis.
FDT can be reduced by:
1. Reducing the proof test interval (T); or,
2. Reducing the mean failure rate (λ) of the component.
However, indiscriminate increase in proof testing would not necessarily reduce FDT.
Strictly speaking, FDT should take into account the following:
1. 1/2 λΤ (as described above)
2. τ/Τ (fraction of test duration)
3. ε (human error of leaving protection system disarmed after each test).
Therefore,
FDT = (1/2) λT + τ/Τ + ε (5.13)
where λ is the failure rate per year and T is the time required to test the system.
If τ<<Τ, the term τ/Τ can be neglected, but ε may not be negligible.
Example 5.6
The failure rate of an emergency shutdown valve is, say 0.1 p.a. The proof-test
interval is once in six months (two tests/year). Each time the test is conducted, the
isolation system is bypassed for approximately one hour. Referring back to Table
5.4, the general human error probability of omission to re-arm the trip is 0.003 per
operation, for a simple non-routine operation.
Thus, we have:
λ = 0.1 p.a.
Τ = 0.5 year
τ = 1/8760 (year)
ε = 0.003
FDT = 0.025 + 2.28E-4 + 0.003
= 0.0282
The error in neglecting the last term is 11%.
5 .20 TO P I C 5 ES T I M AT I N G
E V E N T
LI KE LI HO O D AN D
M E AS U R I N G AN D
R AN KI N G R I S K
UN
IT 4
15
E
NG
INE
ER
ING
RIS
K M
AN
AG
EM
EN
T
It is commonly believed that if the system was proof-tested more frequently, the
reliability would improve. Let us assume monthly testing with T = 1/12 year.
Therefore,
FDT = 0.0042 + 0.0014 + 0.003
= 0.0085
The reliability turns out to be only three times better than half-yearly testing because
human error begins to dominate.
In general, a three-to-six monthly interval is considered reasonable for emergency shutdown
systems.
If a protective system is never proof tested, the system will continue to degrade until it fails.
The probability of failure on demand will increase as a function of time. An approximate
formula for calculating the hazard frequency for a system comprising a component which
can generate a demand for protection and an untested protection system is:
HR =
DλD + λ
(5.14)
where:
D = demand rate per year.
λ = protection system failure rate (failures/year).
Example 5.7: Hazard rate for revealed vs unrevealed failures
Equipment Item A has a failure frequency of λ = 0.5 p.a. (i.e. it will fail on average
once every two years, at any time in that two year period).
Demand Event B has a frequency of occurrence of D = 0.1 p.a. (i.e. the demand
event will occur on average once every ten years).
Revealed failure:
HR = D . FDT
where:
FDT = 1/2 λT
= 1/2 x 0.5 x (1/4) for quarterly testing
= 0.0625
Therefore,
HR = 0.1 x 0.0625
= 0.00625 p.a.
Unrevealed failure:
From equation (5.14)
0.1 x 0.50.1 + 0.5
= 0.083 p.a.
The quarterly testing produces an order of magnitude difference in the hazard rate
for the event, clearly indicating the importance of regular function testing of
protection systems as part of the overall safety management system.
5 .21 TO P I C 5 ES T I M AT I N G
E V E N T
LI KE LI HO O D AN D
M E AS U R I N G AN D
R AN KI N G R I S K
UN
IT 4
15
E
NG
INE
ER
ING
RIS
K M
AN
AG
EM
EN
T
RELIABILITY AND AVAILABILITY
Reliability is defined as the probability that a device will satisfactorily perform a specified
function for a specified period of time under given operating conditions (Smith, 1993: 28).
This may also be stated as the probability that an item will perform a required function for a
stated period of time (Lees, 1996).
For the negative exponential distribution, the failure rate of the component is constant,
hence the reliability:
R = exp(–λt) (5.15)
The mean life of a component is expressed as the mean time between failures (MTBF),
given by:
MTBF =
1λ
(5.16)
For systems with repair, a repair time distribution can be developed. Assuming a negative
exponential distribution for repair times (in reality it is likely to be Weibull), with a mean
repair rate of μ, the mean time to repair (MTTR) is given by:
MTTR =
1μ
(5.17)
The failure time and repair time distributions can be used to obtain a system availability. In
general, the availability A(t) is a function of time. It is expressed as:
A(t) =
u(t)u(t) + d(t)
(5.18)
where:
u(t) = uptime (i.e. system running) d(t) = downtime (i.e. system under repair).
For long time periods, t →∞ , u(t) = MTBF and d(t) = MTTR. Therefore:
A(∞ ) = MTBF
MTBF + MTTR (5.19)
From equations (5.16) to (5.19), the system availability can also be written as:
A(∞ ) =
μλ + μ
(5.20)
The unavailability of the system (U) is given by:
U(∞ ) = 1—A(∞ ) (5.21)
5 .22 TO P I C 5 ES T I M AT I N G
E V E N T
LI KE LI HO O D AN D
M E AS U R I N G AN D
R AN KI N G R I S K
UN
IT 4
15
E
NG
INE
ER
ING
RIS
K M
AN
AG
EM
EN
T
Example 5.8
In Example 5.4, we calculated the failure rate for a compressor to be 1.66 p.a.
Assuming that the mean time to repair a breakdown is approximately 72 hours, the
availability of the compressor can be calculated as follows.
Failure rate = 1.66 p.a.
Number of hours/year = 8760
Mean time between failures (MTBF) = 8760/1.66
= 5277 hours
Mean time to repair (MTTR) = 72 hours
Availability (A) = 5277/(5277 + 72)
= 0.987
By carrying critical spare parts and arranging additional manpower, let us say that
the repair time can be halved to 36 hours. The new availability becomes:
A = 5277/(5277 + 36)
= 0.993
The increased availability of 0.6% may contribute to improved productivity. A
cost–benefit analysis may be used to review the gains obtained against the additional
costs incurred in deciding to carry the spare (inventory cost) and additional
maintenance resources (labour cost).
Availability analysis is an extremely valuable tool in making decisions about capital
investment or inventory management and in planning maintenance strategy. The
methodology can be extended to complete systems in series, complete systems in parallel
and series-parallel systems.
Sometimes a system may have a number of components connected in series (a linear
system). Each component may have its own λ and μ values. In such a case (O'Connor,
1991), the global availability is given by:
As =
μi
λi + μ i
⎛
⎝ ⎜
⎞
⎠ ⎟
i =1
n
∏ (5.22)
=
Aii =1
n
∏ (5.23)
where:
As = availability of series system. n = number of components.
If the system is arranged in parallel as shown in Figure 5.6, and all components are
operating, the availability becomes:
AP = 1−
λ i
λi + μi
⎛
⎝ ⎜
⎞
⎠ ⎟
i =1
n
∏ (5.24)
Equation (5.24) assumes series repair, i.e. single repair team. For a complete system
consisting of series/parallel units, the system is broken down into simpler blocks and each
block availability is calculated before the system availability is obtained.
5 .23 TO P I C 5 ES T I M AT I N G
E V E N T
LI KE LI HO O D AN D
M E AS U R I N G AN D
R AN KI N G R I S K
UN
IT 4
15
E
NG
INE
ER
ING
RIS
K M
AN
AG
EM
EN
T
Figure 5.6: Configurations for series/parallel systems
Series
Parallel
Series-parallel
Example 5.9
A telemetry system for monitoring automatically controlled unmanned operations at
a remote location consists of the following components at both the transmission end
and the receiving end:
Radio modem
Radio switch
Data link switch.
The full system is duplicated (active redundancy). Assume the MTBF and MTTR
values are as given in Table 5.7.
Table 5.7: Failure/repair time data
Component MTBF (Hours) MTTR (Hours) Control room
MTTR (Hours) Remote location1
Radio modem 30 000 24 96 Radio switch 250 000 16 88 Data link switch 300 000 24 96
Note 1: Assumes access time of 72 hours
Calculate the system availability.
The availability block diagram configuration is shown in Figure 5.7.
5 .24 TO P I C 5 ES T I M AT I N G
E V E N T
LI KE LI HO O D AN D
M E AS U R I N G AN D
R AN KI N G R I S K
UN
IT 4
15
E
NG
INE
ER
ING
RIS
K M
AN
AG
EM
EN
T
Figure 5.7: Availability diagram
Radiomodem
Radioswitch
Radioswitch
Radioswitch
Radioswitch
Radiomodem
Radiomodem
Radiomodem
Data linkswitch
Data linkswitch
Data linkswitch
Data linkswitch
(Transmission) (Receiver)
This is a series parallel system. The decomposition may be made as follows:
Radio modem: A1 = 30 000
30 000 + 24 = 0.99920
Radio switch: A2 = 250 000
250 000 + 16 = 0.99994
Data link switch: A3 = 300 000
300 000 + 24 = 0.99992
Availability of control room (ACR1):
A1 . A2 . A3 = 0.99906
Availability of 2 units in parallel in control room:
ACR = 1—(1—ACR1)2 = 1.0
Similarly, availability at remote locations are:
Radio modem: A4 = 30 000
30 000 + 96 = 0.99681
Radio switch: A5 = 250 000
250 000 + 88 = 0.99965
Data link switch: A6 = 300 000
300 000 + 96 = 0.99968
Availability of one unit in field (AF1):
A4 . A5 . A6 = 0.99614
Availability of two units in parallel in field:
AF = 1—(1—AF1)2 ≈ 1.0
Therefore, system availability:
AS = ACR . AF ≈ 1.0
If the active redundancy were not provided:
AS = ACR1 . AF1 ≈ 0.9952
An availability of 0.5% is gained by providing the redundancy. While this may
appear small, the cost penalties of losing the telemetry may be very high, hence the
redundant system offers a near 100% availability.
5 .25 TO P I C 5 ES T I M AT I N G
E V E N T
LI KE LI HO O D AN D
M E AS U R I N G AN D
R AN KI N G R I S K
UN
IT 4
15
E
NG
INE
ER
ING
RIS
K M
AN
AG
EM
EN
T
SCREENING RELIABILITY DATA
A reliability database consists of component failure rates distributed across various failure
modes. For example, pump failure modes could be:
seal failure
significant external leak
loss of performance (loss of discharge head)
fails to run
electrical failure of drive motor.
If we are assessing health and safety risks where loss of containment becomes a major
factor (say the pump is pumping acid), the only failure modes of significance are seal
failures and external leaks. However, if we are assessing production continuity risks where
the on-line time and performance of the pump becomes critical, then all the above failure
modes need to be included. Therefore, the data required for frequency analysis depends on
the nature of risk being assessed and the failure modes that are relevant to that risk.
Where a single global failure rate value is given without identifying the failure rates, use of
this value in safety assessment would produce a pessimistic estimate of risk.
Health and safety assessment
Failure rate data for health and safety assessment generally would include the following
failure modes:
Failure rates of detection systems (gas, fire).
Failure rates of protection systems (isolation, fire protection).
Probability of failure of protection systems on demand.
Frequency of initiating events (fire, spill, loss of containment).
Example 5.10
The failure rate data for an oil gas well emergency shutdown valve on an off-shore
production platform is given in Figure 5.8. The list of information relevant for a
safety assessment and the reasons for their selection are provided in Table 5.8.
Figure 5.8: Failure rate data for oil/gas ESD valve
Taxonomy number and item
1.2.1.3
Process Systems Valves ESD (Emergency Shut-Down).
Description
Gate valves, ball valves and glove valves. Electric, pneumatic or hydraulic actuator. Size
2"–34", typically 2"–4" or greater than 8".
Application
Used to shut off part of or the entire process during emergency. Normally held open,
fail-safe construction. When the valve has closed, it must be opened manually.
Operational mode
Normally open (fail-safe-close). Tested regularly.
Internal environment
Crude oil, gas or water.
External environment
Enclosed, partially enclosed, outdoor.
5 .26 TO P I C 5 ES T I M AT I N G
E V E N T
LI KE LI HO O D AN D
M E AS U R I N G AN D
R AN KI N G R I S K
UN
IT 4
15
E
NG
INE
ER
ING
RIS
K M
AN
AG
EM
EN
T
Maintenance
The Emergency Shutdown System (including ESD valves) shall be designed so that it can
be tested when the installation is in operation.
Item boundary specification
Only failures within the boundary indicated by the dashed line in the figure below are
included in the reliability data source.
Control unit
Including contact breaker formotor actuation, pilot valvefor hydraulic.
Powersupply
Remoteinstrumentation
Boundary
Actuator
Valve
Monitoring UnitPower supply
Remoteinstrumentation
Taxonomy no. 1.2.1.3
Item Process systems valves ESD
Population Installations Aggregated time in service (106 hours) No. of demands
322 12 Calendar time* 6.4065 Operational time •
Failure mode No. of
failures Failure rate (per 106 hours) Active
repairs Repair (manhours)
Lower Mean Upper (hours) Min Mean Max Critical 64 6.46 9.17 12.29 12.3 1.0 20.5 245.0 External leakage 2 0.09 0.28 0.85 5.5 6.0 8.5 11.0
All modes 151 17.23 22.03 27.26 9.7 0.5 15.9 245.0
Source: OREDA, 1992.
5 .27 TO P I C 5 ES T I M AT I N G
E V E N T
LI KE LI HO O D AN D
M E AS U R I N G AN D
R AN KI N G R I S K
UN
IT 4
15
E
NG
INE
ER
ING
RIS
K M
AN
AG
EM
EN
T
Table 5.8: Oil well isolation valve failure data relevant for safety assessment
Failure mode Reasons for selection Failure rate x 106
hours (mean)
Critical external leakage
Includes external leakage and significant external leakage. An ignition has serious downstream safety consequences.
0.42
Fail to close Unable to isolate a downstream leak. Potentially serious.
3.81
Critical internal leakage
Includes seepage, internal leakage and significant internal leakage. If a leak occurs downstream of valve, isolation may not be effective.
1.4
Unknown Since it is listed as a critical failure and failure mode not known, it is better to include for conservative assessment.
0.14
Total 5.77
Source: Calculated from Figure 5.8.
Spurious operation is listed as a failure mode. Since the valve is normally open, a
spurious operation would refer to an unwanted closure. Whilst this would be a
production continuity risk, it is not a safety risk as being closed is the 'fail-safe'
position for the valve.
Degraded failures include external leakage, but this would only be very small
(otherwise it gets into the critical list) and can be handled safely by a planned
shutdown for maintenance.
Out of the 9.17 failures per 106 hours, only 5.77 in 106 hours (63%) contribute to a
safety risk.
Production continuity assessment
For production continuity, it is not sufficient to look at the failure modes associated with
safety risks. Business continuity risk requires identification of all failures that will require a
system shutdown for maintenance, resulting in production loss. Example 5.11
Using the information in Figure 5.8, the failure modes required for inclusion in the
assessment of production continuity are as follows.
Table 5.9: Oil well isolation valve failure rate relevant for production continuity assessment
Failure mode Reasons for inclusion Failure rate x 106 hours (mean)
All safety related failures
As in Table 5.8. 5.77
Other critical failures
Fail to open, overhaul, spurious operation, faulty indication.
3.39
Incipient Will require a shutdown for planned maintenance. 7.69 Degraded/
unknown Effect on system not known. Include to maintain
conservatism. 2.95
Total 19.80
Nearly 90% of the total failures could result in production interruption from that well
because maintenance repairs would require a shutdown of it.
5 .28 TO P I C 5 ES T I M AT I N G
E V E N T
LI KE LI HO O D AN D
M E AS U R I N G AN D
R AN KI N G R I S K
UN
IT 4
15
E
NG
INE
ER
ING
RIS
K M
AN
AG
EM
EN
T
ES T I M AT I O N O F L I K E L I H O O D U S I N G A NA LY T I C A L T E C H N I Q U E S
In the previous section we discussed how to use statistical data to estimate the likelihood of
low consequence/high frequency and medium consequence/medium frequency loss events.
However, a different approach is required to estimate the likelihood of high consequence/
low frequency loss events such as major fires or explosions, structural collapses or dam
failures, because reliable statistical data is rarely available and these type of loss events are
usually caused by a complex combination of failures rather than a single failure alone.
In this section we will examine three analytical techniques that can be used to estimate the
likelihood of high consequence/low frequency loss events:
1. Fault tree analysis
2. Event tree analysis
3. Cause–consequence analysis.
FAULT TREE ANALYSIS
Fault tree analysis (FTA) is a widely used tool for the systematic analysis of combinations
of events that can lead to a loss event. A fault tree is a logic diagram showing the different
ways that a system can fail in terms of a defined final failure event.
You should now read Reading 5.1 'Fault trees' which provides an overview of the
construction and use of fault trees.
Reading 5.1 refers to the terms 'demand' and 'protection action or device' in relation to fault
tree construction. These terms are commonly used in FTA and need to be clearly
understood.
In general, the failure of an item of equipment or the development of an undesirable
situation (e.g. high level in tank) will create a 'demand' on the protection device to operate,
e.g. level switch to close feed valve. The undesirable top event occurs when there is a
demand and the protective device fails.
A 'demand' on the protective device to be brought into operation is generally expressed as a
frequency (e.g. number of times/year). The chance that the protective device will fail when
the demand occurs is expressed as a probability (no time units).
For example, the presence of gas in the vicinity of an LPG installation is a demand on the
gas detector (protective device) to shut off the isolation valves. If the detection system fails
when called upon to act, or the isolation valve fails to close, then there is the chance of a
fire or gas explosion, if the leak finds an ignition source. A simplified fault tree for such an
event is shown in Figure 5.9.
5 .29 TO P I C 5 ES T I M AT I N G
E V E N T
LI KE LI HO O D AN D
M E AS U R I N G AN D
R AN KI N G R I S K
UN
IT 4
15
E
NG
INE
ER
ING
RIS
K M
AN
AG
EM
EN
T
Figure 5.9: Example of a fault tree for an LPG fire
LPG fireoccurs
LPG leaknot isolated
7.09 x 10 /yr-6
2.36 x 10 /yr-5
3.3 x 10 /yr-4
7.17 x 10⁻²
5 x 10 -36.7 x 10-2
0.3
Gasdetector
fails
SDVfails toclose
Ignitionoccurs
LPG leakoccurs Leak not isolated
A C T I V I T Y 5 . 1
1. Develop a fault tree for the loss event you analysed in Activity 4.1.
2. Attempt to quantify the fault tree. Base failure rates can be from experience
(e.g. obtained by talking to production/maintenance staff.)
3. Compare the top event frequency calculated against experience.
4. Conduct a sensitivity analysis on the failure rates to confirm any discrepancy
between calculated values and actual experience.
EVENT TREE ANALYSIS
Event tree analysis (ETA) is applied when a single hazardous event can result in a variety of
consequences. The analysis identifies and evaluates potential event outcomes that might
result following a failure or upset, normally called an initiating event. Demand frequencies
and component failure probabilities are applied to calculate the frequency of outcome
events. The analysis is presented in the form of an event tree logic diagram. Event trees are primarily safety-oriented and are particularly suitable for the analysis of
systems where time is a significant factor, for example, when manual intervention can avoid
the escalation of an event if applied within a specified timeframe. Working forward in time
from the failure event, the operation of each safety failure or contingency plan is
considered. If these fail to achieve the desired result, the consequence is established and the
frequency is determined.
Generally, each node in an event tree has two branches, although several branches from the
same node are possible (similar to a decision tree). The two branches in each node
represent success (yes) or failure (no) of the protective device or system and can lead to a
5 .30 TO P I C 5 ES T I M AT I N G
E V E N T
LI KE LI HO O D AN D
M E AS U R I N G AN D
R AN KI N G R I S K
UN
IT 4
15
E
NG
INE
ER
ING
RIS
K M
AN
AG
EM
EN
T
different outcome, depending on the path. The protective devices or systems can include
hardware items (e.g. firewater pump) or procedural items (e.g. emergency response), or
both. Each protective device or system is treated as a separate node, and the outcome of its
success or failure is analysed through the two branches.
The estimation of failure probabilities in each node of the event tree or each base event of
the fault tree requires information from historical equipment failure rate data and/or human
error assessment.
Example 5.12
Figure 5.10 shows a typical event tree. Starting with the initiating event (motor
burnout), the tree branches into various fire damage scenarios with five possible final
outcomes. For each branch, a corresponding probability value is ascribed. The
probability of a given final outcome is obtained by multiplying the individual
probabilities along the route leading to that final outcome. The sum of the
probabilities (or frequencies if the initiating event is given as a frequency) of all the
final outcomes should equal the initiating probability (or frequency).
Figure 5.10: Example of event tree
P1
P2
1–P2
P3
1–P3
P4
1–P4
P0
1–P1
1 yr delay,10 killed+ $2 million damageP0 P1 P2 P3 P4
This program performs the same function as @Risk, and is an alternative tool. Further
information can be found on the developers' website: http://www.decisioneering.com/.
Further software for project risk analysis is available at the Vose Consulting website:
http://www.risk-modelling.com/.
A project risk analysis is primarily concerned with the general uncertainty for the problem.
For instance, we may construct a model to estimate how long it will take to design,
construct and commission a gas turbine power generation facility. The model would be
broken down into key tasks and probabilistic estimates made for the duration of each task.
We would then run a simulation to find the total effect of all these uncertainties.
One question that arises is: Should we include rare events (high severity/low frequency) in
the risk analysis model? For instance, should we include the risk of a gas explosion and
major damage to the power station in the project risk analysis? According to Vose (2000),
one should not include rare events, as it tends to increase the standard deviation of the
simulation results significantly so that the expected value cannot be predicted within
reasonable confidence limits. Techniques such as fault tree and event tree analysis,
discussed earlier in this topic, are the appropriate tools for these rare events.
The final question is: Why go to the length of complex Monte Carlo simulations when most
of the time people stop with a deterministic analysis using single-point estimates for each
task duration and cost? Vose (2000) has compared the results of the deterministic versus
5 .42 TO P I C 5 ES T I M AT I N G
E V E N T
LI KE LI HO O D AN D
M E AS U R I N G AN D
R AN KI N G R I S K
UN
IT 4
15
E
NG
INE
ER
ING
RIS
K M
AN
AG
EM
EN
T
stochastic analysis in a number of cases and reports that the latter provides a mode and
mean that are nearly always greater than the deterministic model, and that sometimes the
output from a distribution does not even include the deterministic result. This indicates that
the risk is often underestimated in single-point deterministic methods, and that a Monte
Carlo simulation is a more reliable guide to the project risks.
SUMMA RY
In this topic we examined the fourth and fifth steps of the risk management framework:
estimating the likelihood of a loss event occurring and measuring and ranking the overall
risk.
We began by discussing the distinction between the two dimensions that need to be taken
into account in likelihood estimates: event probability and event frequency. We then
discussed three basic approaches to estimating the likelihood of loss events:
1. A simple qualitative approach that can be used before to help decide which of the two
quantitative approaches is most appropriate to a given scenario.
2. A quantitative approach using reliable statistical data to estimate the likelihood of loss
events caused by single failures.
3. A quantitative approach using analytical techniques such as a fault tree analysis, an
event tree analysis or a cause–consequence analysis to estimate the likelihood of loss
events caused by multiple failures, by breaking them down into their contributing
causes.
We concluded the topic with a discussion of a range of techniques that can be used to
measure and rank risks.
EX E RC I S E S
5.1 FAILURE RATES
A factory bottles petroleum spirit using a bottling machine. There are eight independent
flexible lines/connections in the machine. The failure rate of a flexible line may be taken as
3.6 per million hours of operation. The bottling line operates six hours a day, five days a
week for 45 weeks a year. The rest of the time is spent on cleaning and equipment
maintenance.
Calculate the release frequency of petroleum spirit.
5.2 FRACTIONAL DEAD TIME
Following a fire in the bottling machine described in 5.1 above, the company decides to
install a remote operated shutdown valve in the product supply line to the machine. The
manufacturer assures the company that the valve is reliable and has a low failure rate, of the
order of 0.02 per year, based on past experience.
5 .43 TO P I C 5 ES T I M AT I N G
E V E N T
LI KE LI HO O D AN D
M E AS U R I N G AN D
R AN KI N G R I S K
UN
IT 4
15
E
NG
INE
ER
ING
RIS
K M
AN
AG
EM
EN
T
The company installs the valve and tests its operation once every six months in a
maintenance schedule. After a few years, people take the valve operation for granted and
discontinue the critical function test.
a) Calculate the release frequency of petroleum spirit, assuming the same failure rate for
flexible line failure as in Exercise 5.1, but with the emergency isolation valve operating
and tested.
b) Repeat the calculation in (a), but this time assuming that the valve function test has
been discontinued.
5.3 FAULT TREE ANALYSIS
A switch room has two light globes in a parallel circuit as shown in the wiring schematic
below. There are no windows in the room and the lights are left on all the time. If both
lights fail there will be total darkness in the room. Should such a failure occur, maintenance
access would be delayed, with corresponding plant downtime. The switch room is routinely
visited by maintenance personnel once a week, unless there is a need for a special visit.
a) Develop a fault tree for the situation of no light in the switch room (top event).
b) Calculate the frequency of the top event, given the following base data.
Power failure = 0.2 per year
Fuse failure from overload = 0.2 per year
Circuit breaker (switch) fails open = 0.01 per year
Light globe failure = 0.0001 per hour of operation
Figure 5.19
Powersource
Fuse
Switch
Lights
Room boundary
5.4 EVENT TREE ANALYSIS
In a printing press for specialised printing, a solvent-based ink is used. A flammable
solvent is pumped from storage to an ink mixing tank. The frequency of pump motor
overheating is estimated to be 10–3 per year. In such an event, in 1 out of 10 situations, an
electrical fire could result. In such situations, the following sequence of events can occur
(Wells, 1984).
If no fire occurred, the loss would be about $2500 and there would be a five-hour
production delay until a new motor was installed.
5 .44 TO P I C 5 ES T I M AT I N G
E V E N T
LI KE LI HO O D AN D
M E AS U R I N G AN D
R AN KI N G R I S K
UN
IT 4
15
E
NG
INE
ER
ING
RIS
K M
AN
AG
EM
EN
T
If a fire did occur, it is likely it would be extinguished quickly as there are generally people
present in the area. The loss would be about $5000 and there would be a ten-hour
production delay until a new motor was installed. However, there is a 1% chance that the fire may not be extinguished immediately. In such
case, by the time the fire is brought under control and the plant is started up, there would be
a 15-hour delay, but the cost of damage would be much higher, $25 000. In the event of a prolonged fire, depending on the orientation of the flame, there is a 10%
chance that a solvent line connection could rupture. This would result in a major fire
causing a loss estimated at $250 000 and a delay of three months to allow for investigation,
redesign to reduce risk, lead time for new equipment delivery, and so on. There is also a 1% chance that solvent vapours could accumulate in congested areas and
result in an explosion. This is a major loss event, with losses up to $2.5 million and delays
of up to one year. There could also be fatalities on site.
a) Construct an event tree to describe the above sequence of events.
b) Quantify the event tree and calculate the probabilities of the various outcomes. RE F E R E N C E S A N D F U RT H E R R E A D I N G
Publications
Bedford, T. & Cooke, R. (2001) Probabilistic Risk Analysis: Foundations and Methods,
Cambridge University Press, Cambridge, UK.
Blything, K.W. & Reeves, A.B. (1988) An Initial Prediction of BLEVE Frequency of a 100
Tonne Butane Storage Vessel, UKAEA/SRD.
Center for Chemical Process Safety (CCPS) (1989a) Guidelines for Process Equipment
Reliability Data: With Data Tables, CCPS, American Institute of Chemical Engineers,
New York.
Center for Chemical Process Safety (CCPS) (1989b) Guidelines for Chemical Process
Quantitative Risk Analysis, CCPS, American Institute of Chemical Engineers, New
York.
Center for Chemical Process Safety (CCPS) (2000) Guidelines for Chemical Process
Quantitative Risk Analysis, CCPS, American Institute of Chemical Engineers, New
York.
Center for Chemical Process Safety (CCPS) (2003) Guidelines for Analyzing and
Managing the Security Vulnerabilities of Fixed Chemical Sites, CCPS, American
A fault tree is used to develop the causes of an event. It starts with the event of interest, the
top event, such as a hazardous event or equipment failure, and is developed from the top
down.
Accounts of fault trees are given in Reliability and Fault Tree Analysis (Barlow, Fussell and
Singpurwalla, 1975), Fault Tree Handbook (Vesely et al., 1981), Engineering Reliability
(Dhillon and Singh, 1981), Reliability Engineering and Risk Assessment (Henley and
Kumamoto, 1981), Designing for Reliability and Safety Control (Henley and Kumamoto,
1985) and Probabilistic Risk Assessment, Reliability Engineering, Design and Analysis
(Henley and Kumamoto, 1992), and by Vesely (1969, 1970a,b), Vesely and Narum (1970),
Fussell and Powers (1977a, 1979), Vesely and Goldberg (1977b) and Kletz and Lawley
(1982).
The fault tree is both a qualitative and a quantitative technique. Qualitatively it is used to
identify the individual paths which led to the top event, while quantitatively it is used to
estimate the frequency or probability of that event.
The identification of hazards is usually carried out using a method such as a hazard and
operability (hazop) study. This may then throw up cases, generally small in number, where
a more detailed study is required, and fault tree analysis is one of the methods which may
then be used.
Fault tree analysis is also used for large systems where high reliability is required and where
the design is to incorporate many layers of protection, such as in nuclear reactor systems.
With regard to the estimation of the frequency of events, the first choice is generally to base
an estimate on historical data, and to turn to fault tree analysis only where data are lacking
and an estimate has to be obtained synthetically.
Fault tree analysis
The original concept of fault tree analysis was developed at the Bell Telephone
Laboratories in work on the safety evaluation of the Minuteman Launch Control System in
the early 1960s, and wider interest in the technique is usually dated from a symposium in
1965 in which workers from that company (e.g. Mearns) and from the Boeing Company
(e.g. Haasl, Feutz, Waldeck) described their work on fault trees (Boeing Company, 1965).
Developments in the methodology have been in the synthesis of the tree, the analysis of the
tree to produce minimum cut sets for the top event, and in the evaluation of the frequency or
probability of the top event. There have also been developments related to trees with
special features, including repair, secondary failures, time features, etc.
2 RE A D I N G 5 .1 FAU LT T R E E S
UN
IT 4
15
E
NG
INE
ER
ING
RIS
K M
AN
AG
EM
EN
T
A general account of fault tree methods has been given by Fussell (1976). He sees fault tree
analysis as being of major value in
1. directing the analyst to ferret out failures deductively,
2. pointing out the aspects of the system important in respect of the failure of interest,
3. providing a graphical aid giving visibility to those in system management who are
removed from system design changes,
4. providing options for qualitative or quantitative system reliability analysis,
5. allowing the analyst to concentrate on one particular system failure at a time,
6. providing the analyst with genuine insight into system behaviour.
He also draws attention to some of the difficulties in fault tree work. Fault tree analysis is a
sophisticated form of reliability assessment and it requires considerable time and effort by
skilled analysts. Although it is the best tool available for a comprehensive analysis, it is not
foolproof and, in particular, it does not of itself assure detection of all failures, especially
common cause failures.
Basic fault tree concepts
A logic tree for system behaviour may be oriented to success or failure. A fault tree is of
the latter type, being a tree in which an undesired or fault event is considered and its causes
are developed. A distinction is made between a failure of and a fault in a component. A
fault is an incorrect state which may be due to a failure of that component or may be
induced by some outside influence. Thus fault is a wider concept than failure. All failures
are faults, but not all faults are failures.
A component of a fault tree has one of two binary states: essentially it is either in the correct
state or in a fault state. In other words, the continuous spectrum of states from total
integrity to total failure is reduced to just two states. The component state which constitutes
a fault is essentially that state which induces the fault that is being developed.
As a logic tree, a fault tree is a representation of the sets of states of the system which are
consistent with the top event at a particular point in time. In practice, a fault tree is
generally used to represent a system state which has developed over a finite period of time,
however short. This point is relevant to the application of Boolean algebra. Strictly, the
implication of the use of Boolean algebra is that the states of the system are
contemporaneous.
Faults may be classed as primary faults, secondary faults or command faults. A primary
fault is one which occurs when the component is experiencing conditions for which it is
designed, or qualified. A secondary fault is one which occurs when the component is
experiencing conditions for which it is unqualified. A command fault involves the proper
operation of the component at the wrong time or in the wrong place.
A distinction is made between failure mechanism, failure mode and failure effect. The
failure mechanism is the cause of the failure in a particular mode and the failure effect is the
effect of such failure. For example, failure of a light switch may occur as follows:
Failure mode—high contact resistance
Failure mechanism—corrosion
Failure effect—switch fails to make contact
3 RE A D I N G 5 .1 FAU LT T R E E S
UN
IT 4
15
E
NG
INE
ER
ING
RIS
K M
AN
AG
EM
EN
T
Some components are passive and others active. Items such as vessels and pipes are
passive, whilst those such as valves and pumps are active. A passive component is a
transmitter or recipient in the fault propagation process, an active one can be an initiator. In
broad terms, the failure rate of a passive component is commonly two or three orders of
magnitude less than that of an active component.
There is a distinction to be made between the occurrence of a fault and the existence of a
fault. Interest may centre on the frequency with which, or probability that a fault occurs, i.e.
on the unreliability, or on the probability that at any given moment the system is in a fault
state, i.e. on the unavailability.
The simplest case is the determination of the reliability of a non-repairable system. This is
sometimes known as the 'mission problem': the system is sent on a mission in which
components that fail are not repaired. The obvious example is space missions, but there are
cases in the process industries which may approximate to this, such as remote pumping
stations or offshore subsea modules. The availability of a non-repairable system may also
be determined, but the long-term availability, which is usually the quantity of interest, tends
to zero.
Generally, however, process systems are repairable systems, and for these both reliability
and availability may be of interest. If concern centres on the frequency of realization of a
hazard, it is the reliability which is relevant. If, on the other hand, the concern is with the
fractional downtime of some equipment, it is the availability which is required.
A fault tree may be analysed to obtain the minimum cut sets, or minimum sets of events
which can cause the top event to occur. Discussion of minimum cut sets occurs later but it
is necessary to mention them at this point since some reference to them in relation to fault
tree construction is unavoidable.
Fault tree elements and symbols
The basic elements of a fault tree may be classed as (1) the top event, (2) primary events,
(3) intermediate events and (4) logic gates.
The symbols most widely used in process industry fault trees are shown in Table 9.5. The
British Standard symbols are given in BS 5760 Reliability of Systems, Equipment and
Components, Part 7: 1991 Guide to Fault Tree Analysis. For the most part the symbols
shown in Table 9.5 correspond to those in the standard, but in several cases the symbols in
the table are the Standard's alternative rather than preferred symbols.
4 RE A D I N G 5 .1 FAU LT T R E E S
UN
IT 4
15
E
NG
INE
ER
ING
RIS
K M
AN
AG
EM
EN
T
Table 9.5: Fault tree event and logic symbols
A Events
Symbol
Primary, or base, event—basic fault event requiring no
further development
Undeveloped, or diamond event—fault event which has
not been further developed
Intermediate event—fault event which occurs due to
antecedent causes acting through a logic gate
Conditioning event—specific condition which applies
to a logic gate (used mainly with PRIORITY AND and
INHIBIT gates)
External, or house, event—event which is normally
expected to occura
B Logic gates, etc.
Symbol Alternative Symbol
AND gate—output exists only if all inputs exist
OR gate—output exists if one or more inputs exists
INHIBIT gate—output exists if input occurs in
presence of the specific enabling condition (specified
by conditioning event to right of gate)
PRIORITY AND gate—output exists if all inputs
occur in a specific sequence (specified by
conditioning event to right of gate)
5 RE A D I N G 5 .1 FAU LT T R E E S
UN
IT 4
15
E
NG
INE
ER
ING
RIS
K M
AN
AG
EM
EN
T
Table 9.5: Continued
EXCLUSIVE OR gate—output exists if one, and only
one, input exists
VOTING gate—output exists if there exist r-out-of-n
inputs
TRANSFER IN—symbol indicating that the tree is
developed further at the corresponding TRANSFER
OUT symbol
TRANSFER OUT—symbol indicating that the portion
of the tree below the symbol is to be attached to the
main tree at the corresponding TRANSFER IN symbol
a This the definition given by Vesely et al. (1981). Other authors such as Henley and
Kumamoto (1981) use this symbol for an event which is expected to occur or not to
occur.
The top event is normally some undesired event. Typical top events are flammable or toxic
releases, fires, explosion and failures of various kinds.
Primary events are events which are not developed further. One type of primary event is a
basic event, which is an event that requires no further development. Another is an
undeveloped event, which is an event that could be developed, but has not been. One
common reason for not developing an event is that its causes lie outside the system
boundary. The symbol for such an undeveloped event is a diamond and this type is
therefore often called a 'diamond event'. A third type of primary event is a conditioning
event, which specifies conditions applicable to a logic gate. A fourth type of event is an
external event, which is an event that is normally expected to occur.
Intermediate events are the events in the tree between the top event and the primary events
at the bottom of the tree.
Logic gates define the logic relating the inputs to the outputs. The two principal gates are
the AND gate and the OR gate. The output of an AND gate exists only if all the inputs
exist. The output of an OR gate exists provided at least one of the inputs exists. The
probability relations associated with these two gates are shown in Table 9.6, Section A.
Other gates are the EXCLUSIVE OR gate, the PRIORITY AND gate and the INHIBIT
gate. The output of an EXCLUSIVE OR gate exists if one, and only one, input exists. The
output of a PRIORITY AND gate exists if the inputs occur in the sequence specified by the
associated conditioning event. The output of an INHIBIT gate exists if the (single) input
exists in the presence of the associated conditioning event. There are also symbols for
TRANSFER IN and TRANSFER OUT, which allow a large fault tree to be drawn as a set
of smaller trees.
r
n inputs
6 RE A D I N G 5 .1 FAU LT T R E E S
UN
IT 4
15
E
NG
INE
ER
ING
RIS
K M
AN
AG
EM
EN
T
Table 9.6: Probability and frequency relations for fault tree logic gates (output A; inputs B and C)
A Basic probability relationsa
Logic symbol Reliability graph Boolean algebra
relation
Probability relations
A=BC P(A)=P(B)P(C)
A=B+C
P(A)=P(C)–P(B)P(C)
B Relations involving frequencies and/or probabilitiesa
Gate Inputs Outputs
OR PB OR PC PA=PB+PC–PBPC≈PB+PC
FB OR FC FA=FB+FC
FB OR PC Not permitted
AND PB AND PC PA=PBPC
FB AND FC Not permitted; reformulate
FB AND PC FA=FBPC a F, frequency; P, probability
AND gates
One of the two principal logic gates in a fault tree is the AND gate. AND gates are used to
represent a number of different situations and therefore require further explanation. The
following typical situations can be distinguished:
1. output exists given an input and fault on a protective action;
2. output exists given an input and fault on a protective device;
3. output exists given faults on two devices operating in parallel;
4. output exists given faults on two devices, one operating and one on stand-by.
In constructing the fault tree the differences between these systems present no problem, but
difficulties arise at the evaluation stage.
As already described, the probability Po that the output of a two-input AND gate exists,
given that the probabilities of the inputs are p1, and p2, is
p0= p 1 p 2
The occurrence of events may be expressed quantitatively in terms of frequency or of
probability. Failure of equipment is normally expressed as a frequency and failure of a
protective action or device as a probability.
A
B C
A
B C
7 RE A D I N G 5 .1 FAU LT T R E E S
UN
IT 4
15
E
NG
INE
ER
ING
RIS
K M
AN
AG
EM
EN
T
A protective device is normally subject to unrevealed failure and needs therefore to be
given a periodic proof test. Data for the failure of such a device may be available either as
probability of failure on demand, or as frequency of failure. It can be shown that, subject to
certain assumptions, the relationship between the two is
p = λ τ p / 2
where p is the probability of failure, λ is the failure rate, and τp is the proof test interval.
Then for a Type 1 situation the frequency λ0 of a fault is
λ0 = λ p
where p is the probability of failure of the protective action, λ is the frequency of the input
event, and λ0 is the frequency of the output event.
For a Type 2 situation, Equation 9.5.3 is again applicable, with the probability p of failure
of protective action in this case being obtained from Equation 9.5.2.
The evaluation of a Type 3 situation is less straightforward. For this, use may be made of
the appropriate parallel system model derived from either the Markov or joint density
function methods, described earlier. These give the probability of the output event given
the frequency of the input events. Where applicable, the rare event approximation may be
used to convert from probability to frequency:
λ = p / t
Similarly, for a Type 4 situation use may be made of the appropriate stand-by system model.
Fault tree construction
The construction of a fault tree appears a relatively simple exercise, but it is not always as
straightforward as it seems and there are a number of pitfalls. Guidance on good practice in
fault tree construction is given in the Fault Tree Handbook. Other accounts include that in
the CCPS QRA Guidelines, and those by Lawley (1974b, 1980), Fussell (1976) and Doelp
et al. (1984).
An essential preliminary to construction of the fault tree is definition and understanding of
the system. Both the system itself and its bounds need to be clearly defined. Information
on the system is generally available in the form of functional diagrams such as piping and
instrument diagrams and more detailed instrumentation and electrical diagrams. There will
also be other information required on the equipment and its operation, and on the
environment. The quality of the final tree depends crucially on a good understanding of the
system, and time spent on this stage is well repaid.
It is emphasized by Fussell (1976) that the system boundary conditions should not be
confused with the physical bounds of the system. The system boundary conditions define
the situation for which the fault tree is to be constructed. An important system boundary
condition is the top event. The initial system configuration constitutes additional boundary
conditions. This configuration should represent the system in the unfailed state. Where a
component has more than one operational state, an initial condition needs to be specified for
that component. Furthermore, there may be fault events declared to exist and other fault
events not to be considered, these being termed by Fussell the 'existing system boundary
conditions' and the 'not-allowed system boundary conditions', respectively.
Fault trees for process plants fall into two main groups, distinguished by the top event
considered. The first group comprises those trees where the top event is a fault within the
8 RE A D I N G 5 .1 FAU LT T R E E S
UN
IT 4
15
E
NG
INE
ER
ING
RIS
K M
AN
AG
EM
EN
T
plant, including faults which can result in a release or an internal explosion. In the second
group the top event is a hazardous event outside the plant, essentially fires and explosions.
If the top event of the fault tree is an equipment failure, it is necessary to decide whether it is
the reliability, availability, or both, which is of interest. Closely related to this is the extent to
which the components in the system are to be treated as non-repairable or repairable.
As already described, the principal elements in fault trees are the top event, primary events
and intermediate events, and the AND and OR gates. The Handbook gives five basic rules
for fault tree construction:
Ground Rule 1 : Write the statements that are entered in the event boxes as faults; state
precisely what the fault is and when it occurs.
Ground Rule 2: If the answer to the question, 'Can this fault consist of a component
failure?' is 'Yes', classify the event as a 'state-of-component fault'. If the answer is 'No',
classify the event as a 'state-of-system fault'.
No Miracles Rule: If the normal functioning of a component propagates a fault sequence,
then it is assumed that the component functions normally.
Complete-the-Gate Rule: All inputs to a particular gate should be completely defined before
further analysis of any one of them is undertaken.
No Gate-to-Gate Rule: Gate inputs should be properly defined fault events, and gates
should not be directly connected to other gates.
Each event in the tree, whether a top, intermediate or primary event, should be carefully
defined. Failure to observe a proper discipline in the definition of events can lead to
confusion and an incorrect tree.
The identifiers assigned to events are also important. If a single event is given two
identifiers, the fault tree itself may be correct, if slightly confusing, but in the minimum cut
sets the event will appear as two separate events, which is incorrect.
For a process system, the top event will normally be a failure mode of an equipment. The
immediate causes will be the failure mechanisms for that particular failure. These in turn
constitute the failure modes of the contributing subsystems, and so on.
The procedure followed in constructing the fault tree needs to ensure that the tree is
consistent. Two types of consistency may be distinguished: series consistency within one
branch and parallel consistency between two or more branches. Account needs also to be
taken of events which are certain to occur and those which are impossible.
The development of a fault tree is a creative process. It involves identification of failure
effects, modes and mechanisms. Although it is often regarded primarily as a means of
quantifying hazardous events, which it is, the fault tree is of equal importance as a means of
hazard identification. It follows also that fault trees created by different analysts will tend
to differ. The differences may be due to style, judgement and/or omissions and errors.
It is generally desirable that a fault tree have a well-defined structure. In many cases such a
structure arises naturally. It is common to create a 'demand tree', which shows the
propagation of the faults in the absence of protective systems, and then to add branches,
representing protection by instrumentation and by the process operator, which are
connected by AND gates at points in the demand tree. An example of a fault tree
constructed in this way has been given in Figure 2.2. Essentially the same fault tree may be
drawn in several different ways, depending particularly on the location of certain events
which appear under AND gates.
9 RE A D I N G 5 .1 FAU LT T R E E S
UN
IT 4
15
E
NG
INE
ER
ING
RIS
K M
AN
AG
EM
EN
T
Dependence
A fundamental assumption in work on reliability generally, and on fault trees in particular,
is that the events considered are independent, unless stated otherwise. Formally, the events
are assumed to be statistically independent, or 's-independent'. In practice, there are many
types of situation where events are not completely independent. In fault tree work this
problem was originally known as 'common mode failure', then as 'common cause failure',
and now more usually as 'dependent failure'.
The problem is particularly acute in systems, such as nuclear reactor systems, where a very
high degree of reliability is sought. The method of achieving this is through the use of
protective systems incorporating a high degree of redundancy. On paper, the assessed
reliabilities of such systems are very high. But there has been a nagging worry that this
protection may be defeated by the phenomenon of dependent failure, which may take many
and subtle forms. Concern with dependent failure is therefore high in work on fault trees
for nuclear reactors.
Dependent failure takes various forms. In most cases it requires that there be a common
susceptibility in the component concerned. Some situations which can cause dependent
failure include: (1) a common utility; (2) a common defect in manufacture; (3) a common
defect in application; common exposure to (4) a degrading factor, (5) an external influence,
or (6) a hazardous event; (7) inappropriate operation; and (8) inappropriate maintenance.
Perhaps the most obvious dependency is supply from a common utility such as electric
power or instrument air. Equipment may suffer common defects either due to manufacture
or to specification and application. Common degrading factors are vibration, corrosion,
dust, humidity, and extremes of weather and temperature. External influences include such
events as vehicle impacts or earthquakes. An event such as a fire or explosion may disable
a number of equipments. Equipment may suffer abuse from operators or may be maintained
incorrectly. It will be clear that in such cases redundancy may be an inadequate defence.
Generally, a common location is a factor in dependent failure, interpreting this fairly broadly.
But it is by no means essential. In particular, incorrect actions by a maintenance fitter can
disable similar equipments even though the separation between the items is appreciable.
A type of dependent failure that is important in the present context is that resulting from a
process accident. A large proportion of equipments, including protective and fire fighting
systems, may be susceptible to a major fire or explosion, just at the time when they are
required.
There is some evidence that dependent failure is associated particularly with components
where the fault is unrevealed. Thus a study of nuclear reactor accident reports by I.R.
Taylor (1978b) showed that of the dependent failures considered only one was not
associated with a stand-by or intermittently operated system.
Not all dependent failure involves redundant equipment. Another significant type of
dependent failure is the overload which can occur when one equipment fails and throws a
higher load on another operating equipment. Failures caused by domino effects, and
escalation faults generally, may also be regarded as dependent failures.
Dependent failure, then, is a crucial problem in high reliability systems. A more detailed
account is therefore given later. Here further discussion is confined to fault tree aspects.
Dependent failure can be taken into account in a fault tree only if the potential for it is first
recognized. Given that this potential has been identified, there are two ways of representing it
in the tree. One is to continue to enter each fault separately as it occurs in the tree, but
10 RE A D I N G 5 .1 FAU LT T R E E S
UN
IT 4
15
E
NG
INE
ER
ING
RIS
K M
AN
AG
EM
EN
T
ensuring that each such entry is assigned the same identifier, so that the minimum cut sets are
determined correctly. The other approach is to enter the effect as a single fault under an AND
gate higher up the tree. A further measure which may be taken to identify dependent failure is
to examine the minimum cut sets for common susceptibilities or common locations.
Illustrative example: instrument air receiver system. As an illustration of fault tree analysis,
consider the system shown in Figure 9.3(a). The vessel is an air receiver for an instrument
air supply system. Air is let down from the receiver to the supply through a pressure
reducing valve. The pressure in the receiver is controlled by a pneumatic control loop
which starts up an air compressor when the receiver pressure falls below a certain value.
The instrument air supply to the control loop is taken from the instrument air supply
described, and if the pressure in the supply system falls below a certain value this too causes
the control loop to start up the compressor. There is a pressure relief valve on the receiver.
There is also a pressure relief valve (not shown) on the instrument air supply system. The
design intent is that the pressure relief valve on the air receiver is sized to discharge the full
throughput of the compressor and is set to open at a pressure below the danger level and
that the pressure reducing valve is sized to pass the full throughput of the compressor if the
instrument air pressure downstream falls to a very low value. One of the main causes of
failure in the system is likely to be dirt.
The top event considered is the explosion of the air receiver due to overpressure. A fault
tree for the top event of 'Receiver explosion' is shown in Figure 9.3(b).
One fault event occurs in two places—'Pressure reducing valve partially or completely
seized shut or blocked'. This is drawn as a subtree. One primary failure event appears at
several points in the tree—'Dirt'. As shown, this is treated in the tree as separate primary
failures for the pressure reducing valve and the pressure relief valve.
Two of the events in the tree are mutually exclusive. These are 'Instrument air system
pressure abnormally high' and 'Instrument air pressure abnormally low'. These events are
denoted by B and B*, respectively.
The analysis of this fault tree to obtain the minimum cut sets and the probability of
occurrence of the top event is described below.
Minimum cut sets
A fault tree may be analysed to obtain the minimum cut sets. A cut set is a set of primary
events, that is of basic or undeveloped faults, which can give rise to the top event. A
minimum cut set is one which does not contain within itself another cut set. The complete
set of minimum cut sets is the set of principal fault modes for the top event.
The minimum cut sets may be determined by the application of Boolean algebra. The
procedure may be illustrated by reference to the fault tree shown in Figure 9.3(b). This may
be represented in Boolean form as:
T = (A + B + C + D) (B* + F) (G + H + I)
Then substituting
B* = C + D + E
and noting that:
BB* = 0
CC = C; DD = D
AC, CD, CE, CF ⊂ C
11 RE A D I N G 5 .1 FAU LT T R E E S
UN
IT 4
15
E
NG
INE
ER
ING
RIS
K M
AN
AG
EM
EN
T
AD, DC, DE, DF ⊂ D
gives
T = (AE + AF + BF + C + D) · (G + H + I) Equation 9.5.6a
= [A· (E + F) + BF + C + D] · (G + H + I) Equation 9.5.6b
and thus the minimum cut sets are:
AEG AEH AEI
AFG AFH AFI
BFG BFH BFI
CG CH CI
DG DH DI
A simplified fault tree which corresponds to Equation 9.5.6b is shown in Figure 9.3(c).
Figure 9.3: Instrument air receiver system: flow diagram and fault trees for the explosion of an air receiver: (a) instrument air receiver system; (b) fault tree for top event 'Receiver explodes' (see over); (c) equivalent but simplified fault tree for top event 'Receiver explodes'
Air compressor
Air receiver
Non-returnvalve
PC
Pressurereducing valve
Pressurerelief valve
Instrumentair system
(a)
(c)
Receiverexplodes
C
A B F
FE
D G H I
12 RE A D I N G 5 .1 FAU LT T R E E S
UN
IT 4
15
E
NG
INE
ER
ING
RIS
K M
AN
AG
EM
EN
T
Figure 9.3: continued
Since fault trees for industrial systems are often large, it is necessary to have systematic
methods of determining the minimum cut sets. Such a method is that described by Fussell
(1976). As an illustration method, consider the motor system which is described by this
author and which is shown in Figure 9.4(a). The top event considered is the overheating of
the motor. The fault tree for this event is shown in Figure 9.4(b). The structure of the tree
is:
Gate Gate type No. of input Input code No.
A OR 2 1 B
B AND 2 C 2
C OR 2 4 3
Receiverexplodes
Pressure relief valve failsto give adeauate dischargeat pressure danger level
Incorrectdesign Dirt
Othercauses
SUBTREE
Pressure reducing valvepartially or completelyseized shut or blocked
DirtOthercauses
C D
G H I
Air flow into receiverexceeds flow out atpressure danger level
Air flow outof air system(demand + leakage)abnormal and exceedspressure reducingvalve capacity
Air flow out of airsystem normal butflow in abnormally low
See Subtree
(b)
T
13 RE A D I N G 5 .1 FAU LT T R E E S
UN
IT 4
15
E
NG
INE
ER
ING
RIS
K M
AN
AG
EM
EN
T
The procedure is based on successive elimination of the gates. The analysis starts with a
matrix containing the first gate, gate A, in the top left-hand corner:
A
A is an OR gate and is replaced by its inputs listed vertically:
1
B
B is an AND gate and is replaced by its inputs listed horizontally:
1
C
2
C is an OR gate and is replaced by its inputs listed vertically:
1
4
2
3
2
It should be noted that when C is replaced by 4 and 3, the event 2, which is linked to C by
an AND gate, is listed with both events 4 and 3. The minimum cut sets are then:
(1); (4, 2); (3, 2)
There are now a large number of methods available for the determination of the minimum
cut sets of a fault tree. Methods include those described by Vesely (1969, 1970b),
Gangadharan, Rao and Sundararajan (1977), Zipf (1984) and Camarinopoulos and Yllera
(1985).
There are also a number of computer codes for minimum cut set determination. One of the
most commonly used is the code set PREP and KIIT. Another widely used minimum cut
set code is FTAP.
14 RE A D I N G 5 .1 FAU LT T R E E S
UN
IT 4
15
E
NG
INE
ER
ING
RIS
K M
AN
AG
EM
EN
T
Figure 9.4: Motor system: system diagram and fault tree for overheating of the motor (Fussell, 1976): (a) motor system; and (b) fault tree for top event 'Motor overheats'
Source: Sijthoff and Noordhoff International Publishing Company.
REFERENCES
Barlow, R.E., Fussell, J.B. and Singpurwalla, N.D. (eds) (1975). Reliability and Fault Tree
Analysis (Philadelphia, PA: Soc. for Ind. and Appl. Maths)
Boeing Company (1965). Systems Safety Symp. (Seattle, WA)
Camarinopoulos, L. and Yllerra, J. (1985). An improved top-down algorithm combined with
modularization as a highly efficient method for fault tree analysis. Reliab. Engng, 11, 93
Dhillon, B.S. and SINGH, C. (1981). Engineering Reliability. New Techniques and
Applications (New York: Wiley-Interscience)
Doelp, L.C., LEE, G.K., Linney, R.E and Ormsby, R.M. (1984). Quantitative fault tree
If there is only a single light globe in the room, this value would become
0.2 + 0.2 + 0.01 + 0.876 = 1.29 per year.
5.3 TO P I C 5 SU G G E S T E D
AN S W E R S
UN
IT 4
15
E
NG
INE
ER
ING
RIS
K M
AN
AG
EM
EN
T
The dual light globe system reduces this frequency by three-fold, but failures of other
components become dominant contributors.
5.4 Event tree analysis
The event tree is shown in the following Figure 5.21 and the outcome is summarised below
in Table 5.12.
Table 5.12
Event No.
Description Frequency per year
Loss from event ($)
1 Explosion. Major damage. Fatality. 1.0 x 10⁻⁹ 2.5M 2 Solvent line fails. Major fire. 9.9 x 10⁻⁸ 250 000 3 Delayed fire suppression. Solvent line intact. 9.0 x 10⁻⁷ 25 000 4 Fire occurs. Controlled quickly. 9.9 x 10⁻⁵ 5000 5 No fire. Motor damage. 9.0 x 10⁻⁴ 2500