47
Energy in Texas: Insights from the UT Austin Energy Poll March 6, 2015 Sheril Kirshenbaum Director of The Energy Poll
| Date post: | 07-Aug-2015 |
| Category: |
Business |
| Upload: | utmccombsalumni |
| View: | 35 times |
| Download: | 0 times |

Energy in Texas: Insights from the UT
Austin Energy Poll
March 6, 2015
Sheril Kirshenbaum Director of The Energy Poll
Impartial and authoritative source of public
perspectives on energy to inform and guide
discussion, business planning and policy development

General Topics
• Energy prices and availability
• Energy concerns
• Satisfaction
• Consumer behaviors and voting preferences
“Hot Topics”
Spring 2012: Hydraulic Fracturing
Fall 2012: Energy, Voting Behavior, and the 2012 Election
Spring 2013: Consumer Attitudes on Energy
Fall 2013: The Energy-Water Nexus
Spring 2014: Energy Efficiency
Fall 2014: Energy, Voting Behavior, and the 2014 Election
Spring 2015: KeystoneXL and Gas Prices

Background
• First questionnaire developed in 2010 (Inaugural launch Oct. 2011)
• Collaborative effort with representatives from academic institutions, polling
companies, non-governmental organizations, energy producers and energy
consumers
Fall 2014 – Seventh Release
• Online survey conducted September 4-16, 2014
• 2,105 respondents, weighted to reflect U.S. Census demographics

A Look At All Respondents: Fall 2014
Male 49% Female
51% 18-24 13%
25-34 18%
35-44 18%
45-54 18%
55-64 16%
65+ 17%
Less than $50K 49%
$50K+ 47%
No answer
4%
Democrat 37%
Independent 17%
Libertarian 5%
Republican 31%
Prefer not to answer/othe
r 10%
Age
Party affiliation
Total family income
Gender

A Look At Respondents in Texas: Fall 2014
Age
Party affiliation
Total family income
Gender
18-24 17%
25-34 27%
35-44 12%
45-54 18%
55-64 10%
65+ 16%
Men 46%
Women 54%
Democrat 43%
Independent 14%
Libertarian 3%
Republican 28%
Other 2% Prefer not to
answer 10%
<$50K 55%
$50K+ 45%

Engagement

Engagement

Engagement
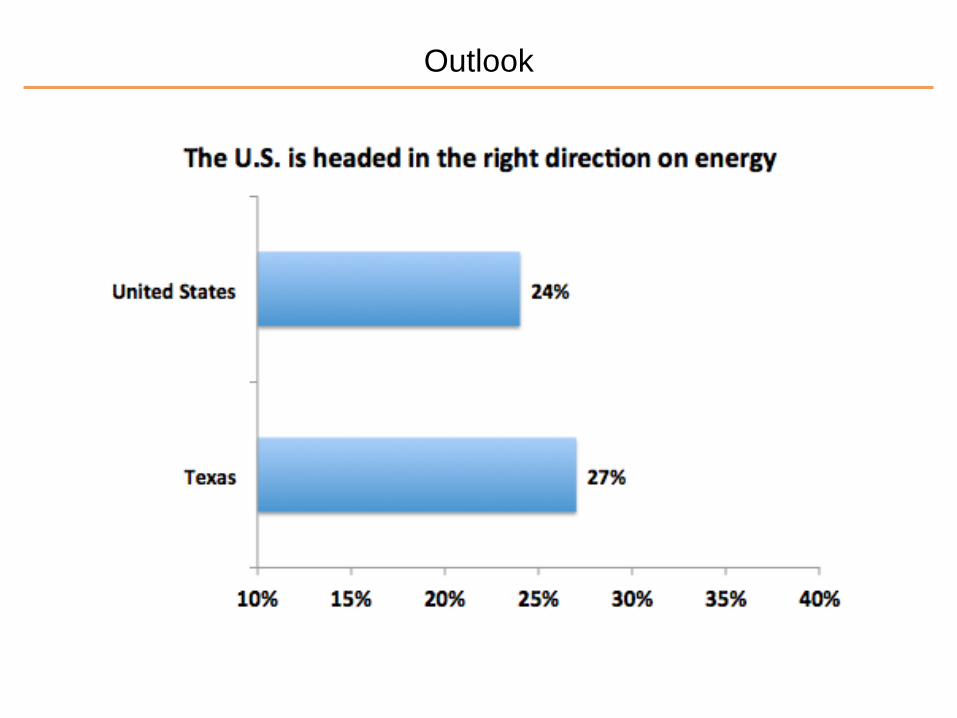
Outlook

Outlook

Outlook

Voting Behavior
High Influence 46%
Some Influence 36%
No Influence 18%
United States: To what extent do energy issues influence the candidates that you vote for?

Voting Behavior

Hydraulic Fracturing

Hydraulic Fracturing

Hydraulic Fracturing

Hydraulic Fracturing

Hydraulic Fracturing

Hydraulic Fracturing

Hydraulic Fracturing

“Hydraulic fracturing” or “Fracking”

“Hydraulic fracturing” or “Fracking”
* among those familiar with “hydraulic fracturing” or “fracking”

“Hydraulic fracturing” or “Fracking”
* among those familiar with “hydraulic fracturing” or “fracking”

Trust to provide information to conserve energy

Trust to provide information to conserve energy

Trust to provide information to conserve energy
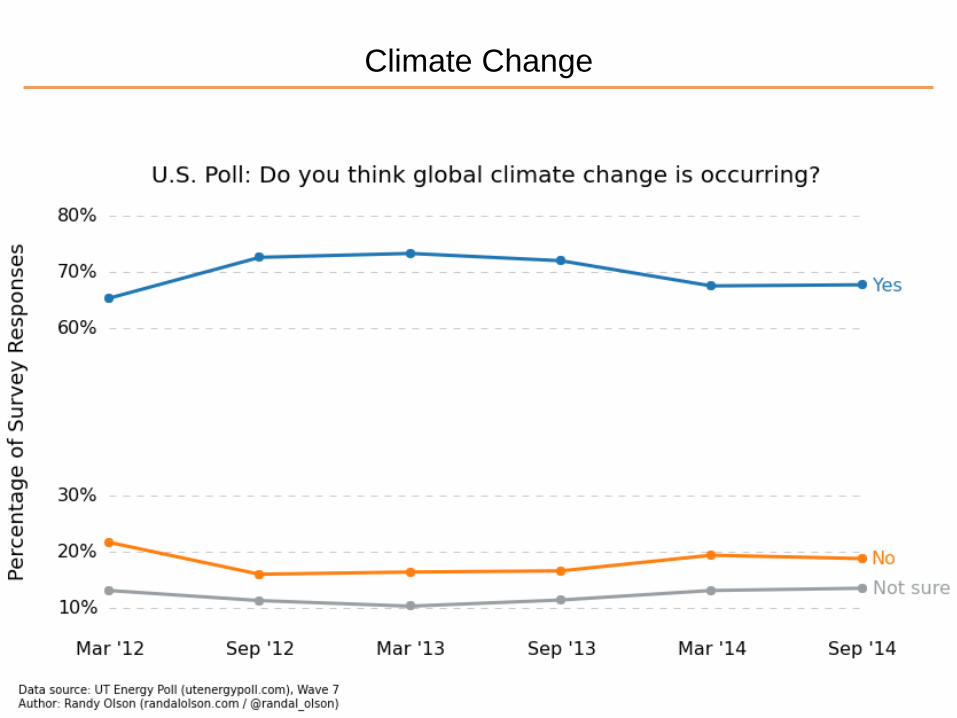
Climate Change

Climate Change

Climate Change

Federal Spending

Federal Spending

job creation 24%
military and defense
17%
social security 20%
education 13%
health care 13%
infrastructure/maintenance
4%
environment 3%
energy 3%
other 3%
Texas: Where is it most important for the U.S. government to spend
your tax dollars?

Environmental Protection

Environmental Protection

Environmental Protection

Environmental Protection
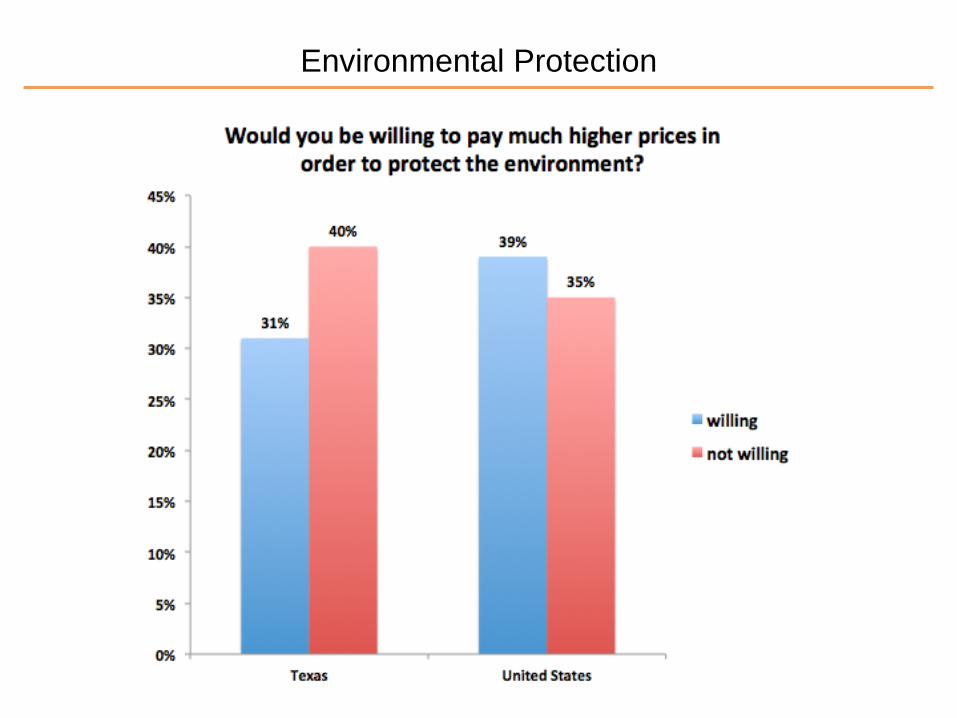
Environmental Protection

Natural Gas Export

Natural Gas Export

Natural Gas Export

Natural Gas Export

Natural Gas Export

Natural Gas Export

Oil and Gas in the U.S.

Oil and Gas in the U.S.

www.utenergypoll.com
For more information:


