+ All Categories
Home > Documents > 11-1151-0292 Rpt Mar12 Kawartha Biogas ESDM

11-1151-0292 Rpt Mar12 Kawartha Biogas ESDM

Date post: 08-Dec-2021
Category:
Upload: others
View: 3 times
Download: 0 times
Share this document with a friend
60
March 2012 EMISSION SUMMARY AND DISPERSION MODELLING REPORT purEnergy Inc. Kawartha Biogas Facility (FIT-FPZXS2N) REPORT Report Number: 11-1151-0292 Distribution: 2 Copies - purEnergy Inc. 2 Copies - Golder Associates Ltd., Mississauga, Ontario Submitted to: purEnergy Inc.
Transcript

March 2012

EMISSION SUMMARY AND DISPERSION MODELLING REPORT

purEnergy Inc. Kawartha Biogas Facility (FIT-FPZXS2N)

REPO

RT

Report Number: 11-1151-0292

Distribution:

2 Copies - purEnergy Inc. 2 Copies - Golder Associates Ltd., Mississauga, Ontario

Submitted to: purEnergy Inc.

EMISSION SUMMARY AND DISPERSION MODELLING REPORT

March 2012 Report No. 11-1151-0292 i

Executive Summary

This Emission Summary and Dispersion Modelling (ESDM) Report was prepared to support an application for a Renewable Energy Approval and was prepared in accordance with s.26 of Ontario Regulation 419/05 (O. Reg. 419/05). In addition, guidance in the Ontario Ministry of the Environment (MOE) publication “Guideline A-10: Procedure for Preparing an Emission Summary and Dispersion Modelling (ESDM) Report, Version 3.0”, dated March 2009 (ESDM Procedure Document) PIBS 3614e03 was followed.

purEnergy Inc. (purEnergy) proposes to construct and operate the Kawartha Biogas Facility (the Facility) at 6830 Highway 7, in Havelock, Ontario. The Facility will produce biogas using an anaerobic digestion system. The biogas will be combusted in generators for the creation of electricity and heat. The electricity will be sold under a Feed-In-Tariff (FIT) contract (reference number FIT-FPZXS2N) awarded by the Ontario Power Authority.

In accordance with O. Reg. 359/09, the Facility is classified as a Class 3, non-farm based, anaerobic digestion facility producing biogas for the purpose of creating green energy. O. Reg. 359/09 also indicates that a Class 3 biogas facility (if the generating unit of the facility is located anywhere other than at a farm operation), requires a Emission Summary and Dispersion Modelling (EDSM) Report prepared in accordance with s.26 of O. Reg. 419/05.

The Facility will consist of four anaerobic Triton ® digesters producing biogas to fuel five combined heat and power (CHP) engines with a maximum electricity generation capacity of 9.8 MW. The Facility also has supporting equipment, including:

one emergency flare;

chemical storage tanks;

an ammonia recovery system;

a desulphurization unit; and

a plant exhaust system.

The North American Industry Classification System (NAICS) code that best applies to the Facility is 221119 (other electric power generation), which is not listed in either Schedule 4 or 5 of O. Reg. 419/05. The Facility is thus subject to s.19 of O. Reg. 419/05; therefore the modelled impact of emissions can be assessed as half-hour maximum point of impingement (POI) concentrations. However, to provide a more accurate estimate, compliance was assessed using the U.S. EPA AERMOD dispersion model, which is an approved dispersion model under O.Reg. 419/05. Therefore, the MOE form “Request Under s.20(4) to have Schedule 3 Standards Apply in Advance of the Date Required by Regulation 419/05” has been provided.

The Facility is expected to emit products of biogas combustion during normal operations and products of natural gas combustion during commissioning operations. The maximum emission rates for each significant contaminant emitted from the significant sources were calculated in accordance with s.11 of O. Reg. 419/05 and the data quality assessment follows the classification system outlined in the ESDM Procedure Document.

EMISSION SUMMARY AND DISPERSION MODELLING REPORT

March 2012 Report No. 11-1151-0292 ii

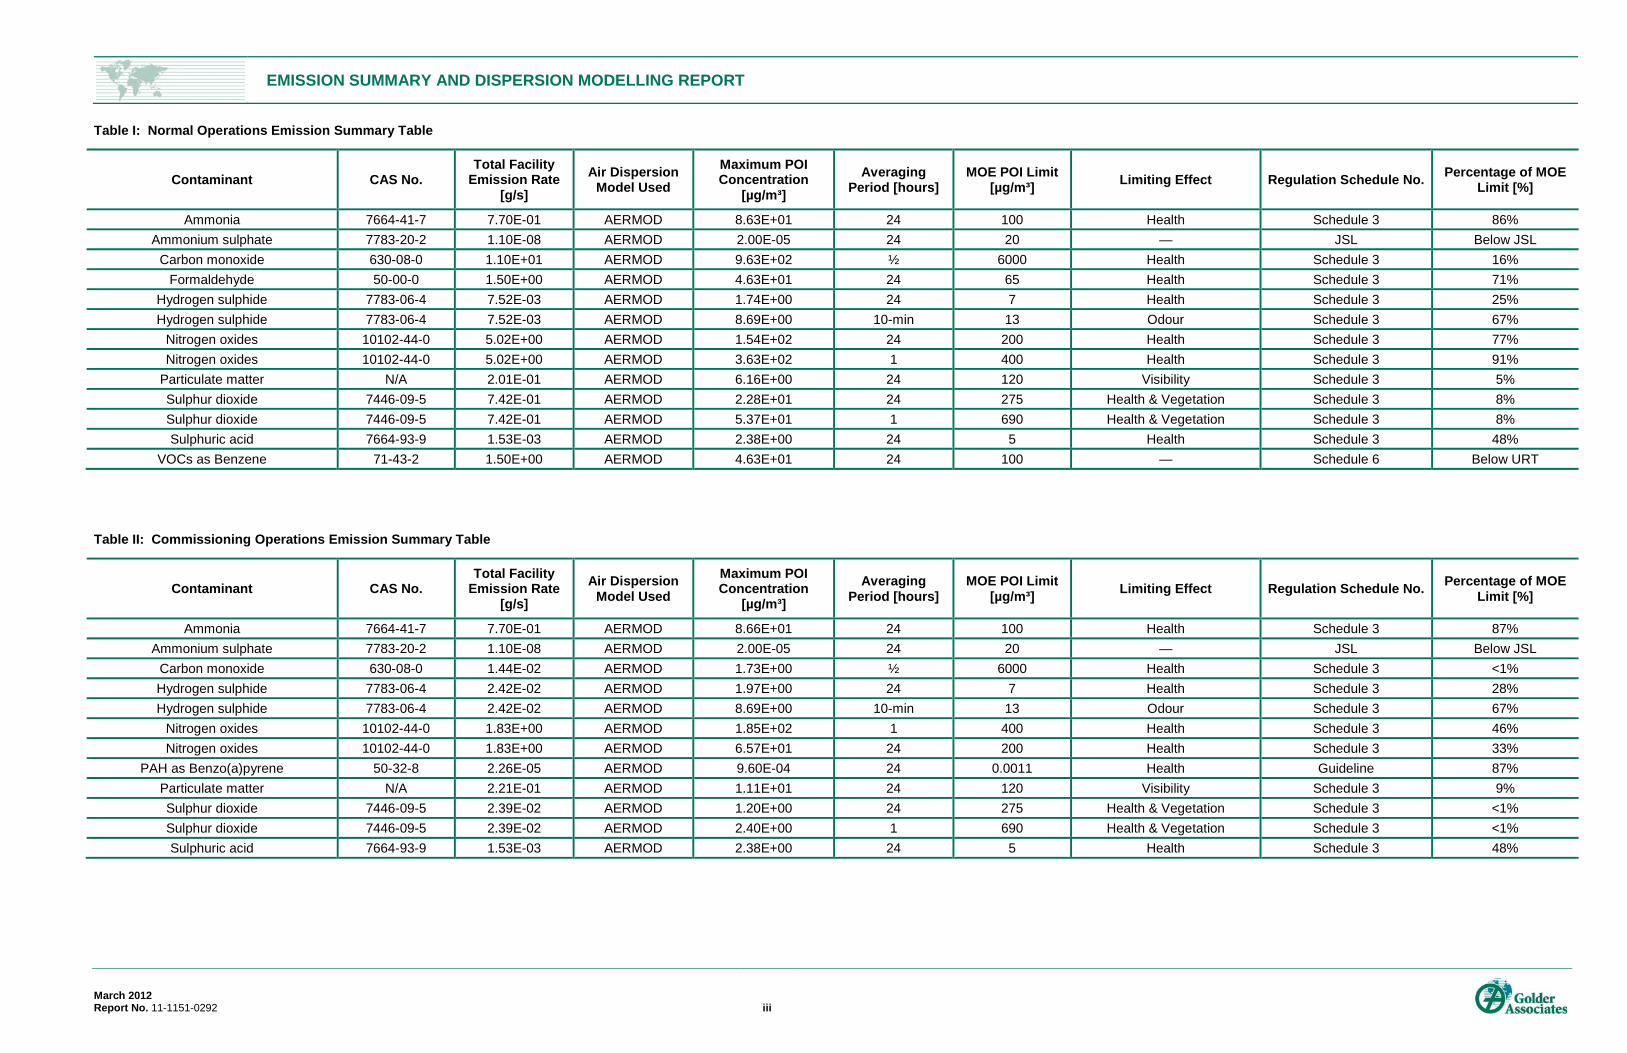
Facility operating scenarios, which generated the highest point of impingement (POI) for each relevant time averaging period, were used. The results are presented in the following Emission Summary Table.

The POI concentrations listed in the Emission Summary Table were compared against published MOE POI Limits as described in the ESDM Procedure Document. At 91%, nitrogen oxides has the highest concentration relative to its MOE POI Limit for the normal operations scenario (Table I). For the commissioning operations scenario, polycyclic aromatic hydrocarbons (PAHs) as benzo(a)pyrene has the highest concentration at 87% of its MOE POI Limit (Table II).

Further details on potential odour emissions from the Facility are documented in “Odour Impact Assessment purEnergy Inc. Kawartha Biogas Facility“ dated January 2012, Report No. 11-1151-0292, Golder Associates Ltd.

This ESDM Report demonstrates that the Facility can operate in compliance with s.20 of O. Reg. 419/05.

EMISSION SUMMARY AND DISPERSION MODELLING REPORT

March 2012 Report No. 11-1151-0292 iii

Table I: Normal Operations Emission Summary Table

Contaminant CAS No. Total Facility

Emission Rate [g/s]

Air Dispersion Model Used

Maximum POI Concentration

[µg/m³] Averaging

Period [hours] MOE POI Limit

[µg/m³] Limiting Effect Regulation Schedule No. Percentage of MOE Limit [%]

Ammonia 7664-41-7 7.70E-01 AERMOD 8.63E+01 24 100 Health Schedule 3 86% Ammonium sulphate 7783-20-2 1.10E-08 AERMOD 2.00E-05 24 20 — JSL Below JSL

Carbon monoxide 630-08-0 1.10E+01 AERMOD 9.63E+02 ½ 6000 Health Schedule 3 16% Formaldehyde 50-00-0 1.50E+00 AERMOD 4.63E+01 24 65 Health Schedule 3 71%

Hydrogen sulphide 7783-06-4 7.52E-03 AERMOD 1.74E+00 24 7 Health Schedule 3 25% Hydrogen sulphide 7783-06-4 7.52E-03 AERMOD 8.69E+00 10-min 13 Odour Schedule 3 67%

Nitrogen oxides 10102-44-0 5.02E+00 AERMOD 1.54E+02 24 200 Health Schedule 3 77% Nitrogen oxides 10102-44-0 5.02E+00 AERMOD 3.63E+02 1 400 Health Schedule 3 91%

Particulate matter N/A 2.01E-01 AERMOD 6.16E+00 24 120 Visibility Schedule 3 5% Sulphur dioxide 7446-09-5 7.42E-01 AERMOD 2.28E+01 24 275 Health & Vegetation Schedule 3 8% Sulphur dioxide 7446-09-5 7.42E-01 AERMOD 5.37E+01 1 690 Health & Vegetation Schedule 3 8% Sulphuric acid 7664-93-9 1.53E-03 AERMOD 2.38E+00 24 5 Health Schedule 3 48%

VOCs as Benzene 71-43-2 1.50E+00 AERMOD 4.63E+01 24 100 — Schedule 6 Below URT

Table II: Commissioning Operations Emission Summary Table

Contaminant CAS No. Total Facility

Emission Rate [g/s]

Air Dispersion Model Used

Maximum POI Concentration

[µg/m³] Averaging

Period [hours] MOE POI Limit

[µg/m³] Limiting Effect Regulation Schedule No. Percentage of MOE Limit [%]

Ammonia 7664-41-7 7.70E-01 AERMOD 8.66E+01 24 100 Health Schedule 3 87% Ammonium sulphate 7783-20-2 1.10E-08 AERMOD 2.00E-05 24 20 — JSL Below JSL

Carbon monoxide 630-08-0 1.44E-02 AERMOD 1.73E+00 ½ 6000 Health Schedule 3 <1% Hydrogen sulphide 7783-06-4 2.42E-02 AERMOD 1.97E+00 24 7 Health Schedule 3 28% Hydrogen sulphide 7783-06-4 2.42E-02 AERMOD 8.69E+00 10-min 13 Odour Schedule 3 67%

Nitrogen oxides 10102-44-0 1.83E+00 AERMOD 1.85E+02 1 400 Health Schedule 3 46% Nitrogen oxides 10102-44-0 1.83E+00 AERMOD 6.57E+01 24 200 Health Schedule 3 33%

PAH as Benzo(a)pyrene 50-32-8 2.26E-05 AERMOD 9.60E-04 24 0.0011 Health Guideline 87% Particulate matter N/A 2.21E-01 AERMOD 1.11E+01 24 120 Visibility Schedule 3 9% Sulphur dioxide 7446-09-5 2.39E-02 AERMOD 1.20E+00 24 275 Health & Vegetation Schedule 3 <1% Sulphur dioxide 7446-09-5 2.39E-02 AERMOD 2.40E+00 1 690 Health & Vegetation Schedule 3 <1% Sulphuric acid 7664-93-9 1.53E-03 AERMOD 2.38E+00 24 5 Health Schedule 3 48%

EMISSION SUMMARY AND DISPERSION MODELLING REPORT

March 2012 Report No. 11-1151-0292 iv

Table of Contents

1.0 INTRODUCTION ............................................................................................................................................................... 1

1.1 Purpose and Scope ............................................................................................................................................. 1

2.0 FACILITY AND PROCESS DESCRIPTION ..................................................................................................................... 2

2.1 Raw Materials ...................................................................................................................................................... 2

2.2 Anaerobic Digestion ............................................................................................................................................. 3

2.3 Biogas Pre-Treatment .......................................................................................................................................... 3

2.4 Combined Heat and Power System ..................................................................................................................... 3

2.5 Digestate Treatment ............................................................................................................................................ 4

2.6 Emergency Flare ................................................................................................................................................. 4

2.7 Supporting Operations ......................................................................................................................................... 5

2.7.1 Comfort Heating Equipment ........................................................................................................................... 5

2.7.2 Chemical Storage........................................................................................................................................... 5

2.8 NAICS Code ........................................................................................................................................................ 5

2.9 Operating Schedule ............................................................................................................................................. 6

2.10 Facility Production Limit ....................................................................................................................................... 6

3.0 INITIAL IDENTIFICATION OF SOURCES AND CONTAMINANTS ................................................................................. 7

3.1 Sources and Contaminants Identification Table................................................................................................... 7

3.2 Potential Odour Emissions .................................................................................................................................. 7

3.3 Potential Dust Emissions ..................................................................................................................................... 7

4.0 ASSESSMENT OF THE SIGNIFICANCE OF CONTAMINANTS AND SOURCES ......................................................... 8

4.1 Identification of Negligible Contaminants and Sources ........................................................................................ 8

4.2 Rationale for Assessment .................................................................................................................................... 8

5.0 OPERATING CONDITIONS, EMISSION ESTIMATING AND DATA QUALITY ............................................................... 9

5.1 Description of Operation Conditions .................................................................................................................... 9

5.1.1 Normal Operations ......................................................................................................................................... 9

5.1.2 Commissioning Operations ............................................................................................................................ 9

5.2 Explanation of the Methods Used to Calculate Emission Rates ........................................................................ 10

5.3 Sample Calculations .......................................................................................................................................... 10

EMISSION SUMMARY AND DISPERSION MODELLING REPORT

March 2012 Report No. 11-1151-0292 v

5.3.1 Biogas Engine Emissions ............................................................................................................................. 10

5.3.2 Emergency Flare Emissions ........................................................................................................................ 10

5.3.3 Chemical Storage Tanks .............................................................................................................................. 11

5.3.4 Ammonia Scrubbers ..................................................................................................................................... 11

5.3.5 Common Plant Exhaust ............................................................................................................................... 11

5.4 Assessment of Data Quality............................................................................................................................... 11

5.5 Conservatism of Emission Estimates and Operating Condition ......................................................................... 11

6.0 SOURCE SUMMARY TABLE AND SITE PLAN ............................................................................................................ 12

6.1 Source Summary Table ..................................................................................................................................... 12

6.2 Site Plan ............................................................................................................................................................ 12

7.0 DISPERSION MODELLING ............................................................................................................................................ 13

7.1 Meteorology and Land Use Data ....................................................................................................................... 13

7.2 Terrain ............................................................................................................................................................... 13

7.3 Receptors .......................................................................................................................................................... 14

7.4 Building Downwash ........................................................................................................................................... 14

7.5 Deposition .......................................................................................................................................................... 14

7.6 Averaging Time and Conversions ...................................................................................................................... 15

7.7 Dispersion Modelling Options ............................................................................................................................ 15

7.8 Coordinate System ............................................................................................................................................ 15

7.9 Dispersion Modelling Input Summary Table ...................................................................................................... 16

7.10 Dispersion Modelling Runs ................................................................................................................................ 16

7.11 Dispersion Modelling Input and Output Files ..................................................................................................... 16

8.0 EMISSION SUMMARY TABLE ...................................................................................................................................... 17

8.1 Emission Summary Table .................................................................................................................................. 17

8.2 Assessment of Contaminants with no MOE POI Limits ..................................................................................... 17

9.0 CONCLUSIONS .............................................................................................................................................................. 18

TABLES

No table of figures entries found.

EMISSION SUMMARY AND DISPERSION MODELLING REPORT

March 2012 Report No. 11-1151-0292 vi

TABLES

Table 1: Sources and Contaminants Identification Table

Table 2a: Normal Operations Source Summary Table

Table 2b: Normal Operations Source Summary Table

Table 3: Dispersion Modelling Input Summary Table

Table 4a: Normal Operations Dispersion Modelling Source Summary Table

Table 4b: Normal Operations Dispersion Modelling Source Summary Table

Table 5a: Emission Summary Table – Normal Operations

Table 5b: Emission Summary Table – Commissioning Operations

FIGURES

Figure 1: Site Location Plan

Figure 2: Process Flow Diagram

Figure 3: Roof Layout

Figure 4: Land Use Zoning Designation Plan

Figure 5: Terrain Elevations

Figure 6: Dispersion Modelling Receptors

Figure 7: Building Downwash Plan

APPENDICES APPENDIX A Emission Rate Calculations

APPENDIX B Supporting Information for Emission Rate Calculations

APPENDIX C Dispersion Modelling Files (on CD)

EMISSION SUMMARY AND DISPERSION MODELLING REPORT

March 2012 Report No. 11-1151-0292 1

1.0 INTRODUCTION

1.1 Purpose and Scope purEnergy Inc. (purEnergy) proposes to construct and operate the Kawartha Biogas Facility at 6830 Highway 7, in Havelock, Ontario (the Facility). The Facility will produce biogas using an anaerobic digestion system. The biogas will be combusted in generators for the creation of electricity and heat. The Facility will have a maximum electricity generation capacity of 9.8 MW. The electricity will be sold under a Feed-In-Tariff (FIT) contract (reference number FIT-FPZXS2N) awarded by the Ontario Power Authority.

On September 24, 2009, Ontario Regulation 359/09 (O. Reg. 359/09) of the Environmental Protection Act received Royal Assent and on October 1, 2009 was filed and came into force. O. Reg. 359/09 contains the current requirements for approval of renewable energy projects under the Renewable Energy Approval (REA) process. This documentation consists of seven parts, including interpretation; classes of renewable energy generation facilities; application of the act of renewable energy project; renewable energy approval, etc.

In accordance with O. Reg. 359/09, the Facility is classified as a Class 3, non-farm based, anaerobic digestion facility producing biogas for the purpose of creating green energy. O. Reg. 359/09 also indicates that a Class 3 biogas facility (if the generating unit of the facility is located anywhere other than at a farm operation), requires a Emission Summary and Dispersion Modelling (EDSM) Report prepared in accordance with s.26 of O. Reg. 419/05.

This ESDM Report is, therefore, intended to support a Renewable Energy Approval Application for the Facility. In addition, guidance in the Ontario Ministry of the Environment (MOE) publication “Guideline A-10: Procedure for Preparing an Emission Summary and Dispersion Modelling (ESDM) Report, Version 3.0”, dated March 2009 (ESDM Procedure Document) PIBS 3614e03 was followed.

EMISSION SUMMARY AND DISPERSION MODELLING REPORT

March 2012 Report No. 11-1151-0292 2

2.0 FACILITY AND PROCESS DESCRIPTION purEnergy proposes to construct and operate the Kawartha Biogas facility at 6830 Highway 7, in Havelock, Ontario (refer to Figure 1 – Site Location Plan). The Facility will use an anaerobic digestion system to produce biogas that will be combusted in generators for the creation of electricity and heat.

The Facility will consist of four anaerobic Triton ® digesters producing biogas to fuel five combined heat and power (CHP) engines with a maximum electricity generation capacity of 9.8 MW. The electricity will be sold under a Feed-In-Tariff (FIT) contract (reference number FIT-FPZXS2N) awarded by the Ontario Power Authority.

Product usages and process information are provided in greater detail in Appendix A – Emission Rate Calculations. Refer to Table 1 – Sources and Contaminants Identification Table, which tabulates the individual sources of emissions at the Facility.

Refer to Figure 2 – Process Flow Diagram for a graphical representation of the processes occurring at the Facility.

2.1 Raw Materials The Facility will continuously receive organic materials (feedstock) in both liquid and solid form. Both types of feedstock will be delivered to the site by truck. Liquid materials are those that are pumpable without any additional particle size reduction or dilution; solid materials are those that may require further particle size reduction or dilution in order to render them pumpable.

Feedstock will be delivered by trucks at scheduled times throughout the year. In the solids reception building, the trucks will empty the loads of solid feedstock into a below-ground reception pit which is outfitted with a mixer and a chopper pump. The solid feedstock will be pre-treated before entering the reception tank. The trucks delivering liquid feedstock will stop at the liquid reception area and empty their load through the appropriate hose. The liquid organic reception pump will be activated to pump the liquid feedstock to the reception tank.

There will be three reception tanks located on the site used for receiving organic materials.

Tank 1: Low energy substrates (e.g., manure);

Tank 2: Medium energy substrates (e.g., food waste, distillers wet grain); and

Tank 3: High energy substrates (e.g., syrup, grease, whey).

The reception tanks will be insulated and equipped with hydraulic mixers. Hot water piping will be installed around the interior circumference of each tank to heat the feedstock. Dilution water will be mixed with the feedstock in order to achieve its optimum liquid content for the digestion.

EMISSION SUMMARY AND DISPERSION MODELLING REPORT

March 2012 Report No. 11-1151-0292 3

2.2 Anaerobic Digestion The diluted feed substrates will be pumped to four anaerobic Triton® digesters. Their main characteristic is the ring-in-ring construction, which consists of an outer ring used as fermenter and an inner ring used as a secondary fermenter. Both the inner and the outer ring will be mixed by hydraulic submersible mixers. The inner ring of the digester will have a dual layer flexible membrane that is used for biogas storage.

The digestate feedstock exiting the four anaerobic digesters will enter a buffer storage tank. This tank allows additional residence time for the organic materials to be digested completely. As a result, the production of methane gas from the organic substrate will be optimized. It is expected that the odour level of the digestate will be reduced to undetectable levels. The buffer storage tank also acts as a digestate storage and volume buffering tank. At the same time, low solids digestate can be returned to the anaerobic digesters in order to maintain the optimal total solids content. The buffer storage tank also provides storage for biogas in its double-membrane gas holder roof.

2.3 Biogas Pre-Treatment The biogas produced in the digesters and the buffer tank will contain hydrogen sulphide (H2S) that needs to be partly removed before the biogas is fed to the engines. Higher concentrations of H2S reduce the lubrication function of the engine oil, leading to reduced life time of the engines and expensive breakdowns, repairs and oil changes. The H2S content in the biogas needs to be reduced to less than 200 ppm before being fed to the engines.

An external bio-scrubber will be used to reduce the H2S concentration. Bio-scrubbing involves a two stage process: absorption of H2S via a liquid medium followed by the biological oxidation of H2S in the liquid. The sulphate is discharged in the scrubber effluent as diluted sulphuric acid. The sulphuric acid will be pumped in the day tank and will entirely be used in ammonia removal/scrubbing process (for digestate) along with fresh commercial sulphuric acid.

Once the H2S has been removed, the biogas enters a gas drying unit where a chiller cools the biogas to allow moisture to condense. The biogas will then be heated again so that the relative humidity will have decreased to acceptable values for the engines. A blower station will be installed to provide the biogas with the required pressure to enter the CHP engines.

2.4 Combined Heat and Power System Five CHP engines will use the produced biogas as fuel to generate 9.8 MW of electrical power. Approximately 10 MW of thermal energy will also be produced in the form of hot water and exhaust gases from the engines. The hot water will be used to heat the reception tanks, the digesters, the buffer tank, and also to provide the required heat for the ammonia recovery system. Five steam boilers will use heat from the exhaust gas to produce steam.

EMISSION SUMMARY AND DISPERSION MODELLING REPORT

March 2012 Report No. 11-1151-0292 4

2.5 Digestate Treatment The digestate will be separated into a liquid and solid form with three screw presses in the dewatered solid loading area. Dewatered sludge will be loaded into trucks to be transported to the end user for application as soil conditioner. If the truck transport is interrupted by unforeseeable circumstances (e.g., strike, poor weather), the dewatered sludge will be temporarily stored in the dewatered storage solid building.

The digestate produced by the Facility is expected to have a high ammonia content. Ammonia will be removed from the digestate (filtrate) by a two stage continuous process: ammonia stripping and ammonia chemical scrubbing. In the first stage, the filtrate is pumped to the top of the stripper tower and flows downward through an air stream. Ammonia is stripped from the filtrate into the air stream. The air stream is then directed to the scrubbers where the air stream is put in contact with sulphuric acid scrubbing solution to produce an ammonium sulphate solution. The ammonium sulphate solution will have a concentration of approximately 35 weight percent and will be sold to third parties as a commodity. The system is designed to consistently meet an ammonia reduction of approximately 85 to 90% with the denitrified effluent used for diluting the fresh substrates so that no fresh water is needed.

The balance of the denitrified effluent that has not been used for diluting the feedstock will be treated in a Sequencing Batch Reactor (SBR) plant before being discharged into the adjacent quarry. The SBR operates in sequential fill and draw mode. The system incorporates a surge/anoxic mix tank as part of the SBR to optimally control the process and provide rapid and complete treatment. This surge tank provides flow and nutrient equalization to ensure treatment at the full range of flows and loadings. Odour control and scum skimming will be achieved in the process. There will be two SBR tanks that can operate independently and in true batch mode as flow accumulates in the tank during settling and decanting.

The solid portion of the digestate (dewatered sludge) is sold to end users for application as soil conditioner and will be directly loaded into trucks to be transported offsite. In the rare event that the solids cannot be immediately transported offsite and the buffer storage capacity has been exceeded (three days), the solids will be transferred to the dewatered storage solid building through an enclosed conveyor and loaded onto transport trucks by a loader at a later time.

2.6 Emergency Flare An emergency flare will burn off biogas produced by the Facility during the commissioning operations until the biogas quantity and quality is sufficient to feed the engines. Commissioning operations are expected to last for two months. In the unlikely situation where one or more biogas engines are not operational and the Facility’s biogas storage volume is exceeded, the emergency flare will burn off the excess biogas as a means of relieving the pressure within the digesters. A side benefit of burning off the excess biogas may be to mitigate potential odour emissions. During normal operations, the emergency flare will not be in use.

EMISSION SUMMARY AND DISPERSION MODELLING REPORT

March 2012 Report No. 11-1151-0292 5

2.7 Supporting Operations In addition to the main operations described above, other operations and/or equipment at the Facility include:

comfort heating equipment; and

chemical storage.

The emissions for these supporting operations are described in the subsequent sections.

2.7.1 Comfort Heating Equipment The Facility will operate two 121,331 kJ (115,000 BTU) natural gas comfort heating units for heating the office space and scale house. As the total thermal heat input of these units is less than 1.58 million kJ, they are exempt from the permitting assessment in accordance with O.Reg. 524/98 Environmental Compliance Approvals – Exemptions from Section 9 of the Act.

2.7.2 Chemical Storage Chemical usage at the Facility is summarized in the following table:

Chemical Usage Storage Emissions

Polymer Used as flocculant Totes Non-volatile, no emissions expected

Acid Small amounts used to adjust pH of feedstock

Totes Acid is consumed in reaction, no emissions expected

Base Small amounts used to adjust pH of feedstock

Totes Base is consumed in reaction, no emissions expected

Ferric chloride Used for the SBR Indoor storage tank Non-volatile, no emissions expected

Ammonium sulphate

Product from ammonia scrubber

Above-ground storage tank

Tank filling emissions

Sulphuric acid Used in ammonia scrubber

Above-ground storage tank

Tank filling emissions

2.8 NAICS Code The North American Industry Classification System (NAICS) code that best applies to the Facility is 221119 (other electric power generation).

EMISSION SUMMARY AND DISPERSION MODELLING REPORT

March 2012 Report No. 11-1151-0292 6

2.9 Operating Schedule The Facility will operate 24 hours per day, seven days per week. Deliveries and shipping offsite will primarily occur during daytime hours.

2.10 Facility Production Limit The Facility has the capacity to generate 9.8 MW of electrical power and approximately 10 MW of thermal energy.

EMISSION SUMMARY AND DISPERSION MODELLING REPORT

March 2012 Report No. 11-1151-0292 7

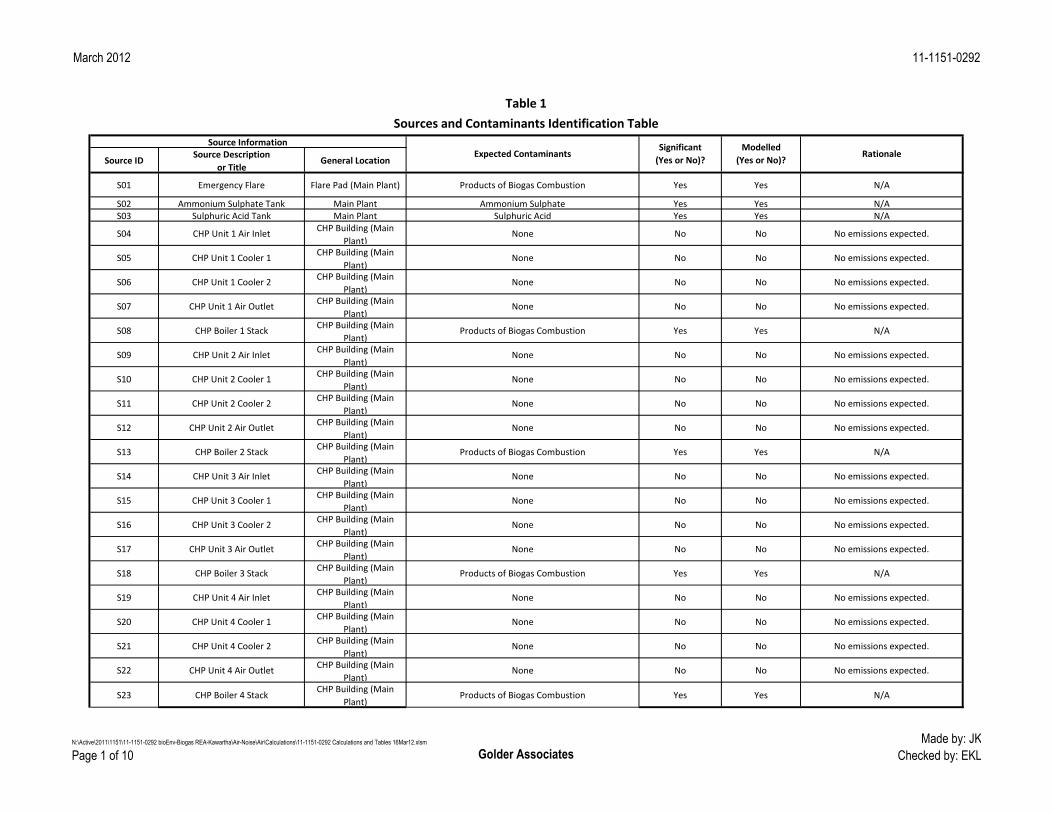
3.0 INITIAL IDENTIFICATION OF SOURCES AND CONTAMINANTS This section provides an initial identification of all of the sources and contaminants emitted at the Facility, as required by subparagraphs 2 to 4 of s.26(1) of O. Reg. 419/05.

3.1 Sources and Contaminants Identification Table Table 1 – Sources and Contaminants Identification Table tabulates all the emission sources at the Facility and the expected contaminants emitted from each source.

3.2 Potential Odour Emissions The Facility’s ventilation system has been designed to minimize odourous emissions.

The solid feedstock offloading area will be equipped with an air lock and all solid handling conveyers will be covered, so that odorous air cannot escape to the atmosphere. In addition, the Solids Reception building and Reception Tanks will be kept under slight negative pressure at all times to prevent any odours from being emitted to the atmosphere.

Negative pressure will be maintained in buildings by controlling the flow of incoming and outgoing air. By keeping the flow of building make‐up air slightly lower than the exhaust air, negative pressure will be established.

Air from the Solids Reception building will be drawn into the CHP building at a rate of 10,203 m³/hr for use as combustion air in the biogas engines. As the five CHP engines require 40,000 to 60,000 m³/hr of combustion air, this ensures that the potentially odourous air is not released to the atmosphere.

The Solids Reception building, below-ground reception pit, Reception tanks and CHP buildings will be sealed so that negative pressure is not lost by air infiltrating through exterior walls, windows and doors.

The Digestate Management Building and Dewatered Solids Loading Building will be maintained at negative pressure. The materials handled in these areas have gone through the digestion process and have minimal odours. The exhaust ventilation air from the Digestate Management Building and Dewatered Solids Loading Building will be conducted through an air duct to a common plant exhaust air stack for monitoring purposes.

Further details on potential odour emissions from the Facility are documented in “Odour Impact Assessment purEnergy Inc. Kawartha Biogas Facility“ dated March 2012, Report No. 11-1151-0292, Golder Associates Ltd.

3.3 Potential Dust Emissions Fugitive dust emissions with metal content from the Facility are expected to be negligible. The procedure for the identification of negligible sources is detailed in Section 4 of this report.

EMISSION SUMMARY AND DISPERSION MODELLING REPORT

March 2012 Report No. 11-1151-0292 8

4.0 ASSESSMENT OF THE SIGNIFICANCE OF CONTAMINANTS AND SOURCES

4.1 Identification of Negligible Contaminants and Sources Some of the sources listed in Table 1 – Sources and Contaminants Identification Table have been identified as negligible. The remaining sources are significant and are included in the dispersion modelling for the Facility.

Similarly, some contaminants from the sources that are considered significant have been deemed to be negligible.

4.2 Rationale for Assessment For each source or contaminant that has been deemed negligible, the technical information required to substantiate the argument that each of the identified sources is negligible is presented in Table 1.

In accordance with s.8 of O. Reg. 419/05, emission rate calculations and dispersion modelling is not required for emissions from negligible sources.

The following is a summary of the assessment for each source.

Solids Storage Building Ventilation (S31 and S32) – The materials handled in the Solids Storage Building have gone through the digestion process and have minimal odours.

Waste Water Tank Vent (S33 and S34) – The waste water treated in this area has gone through the digestion process as well as the ammonia recovery system and no odours or other emissions are expected.

Chemical Storage (S36) – Chemical additives are stored on-site in totes or indoor storage tanks. Table B-3 in Appendix B.2 of the ESDM Procedure Document states that emissions from “low temperature handling of compound with a vapour pressure less than 1 kPa” are considered negligible. Therefore, emissions from the chemical storage area considered negligible.

Comfort Heating Equipment (S37) – The Facility will operate two 121,331 kJ (115,000 BTU) natural gas comfort heating units for heating the office space and scale house. As the total thermal heat input of these units is less than 1.58 million kJ, they are considered negligible.

Desulphurization Unit (S40) – The desulphurization unit is a closed system and has no external exhaust points.

Several contaminants were also determined to be negligible using the dispersion factor method provided in Table B-1 of the ESDM Procedure Document. For the purpose of this screening level assessment, it was conservatively assumed that contaminants would be emitted from the stack closest to the property line (16 m).

The resulting POI concentrations were then compared against half the value of the corresponding MOE POI limit. No further assessment is required if the POI concentration is less than half the value of the MOE POI limit. The screening level assessment is provided in Appendix D – Negligible Contaminants.

EMISSION SUMMARY AND DISPERSION MODELLING REPORT

March 2012 Report No. 11-1151-0292 9

5.0 OPERATING CONDITIONS, EMISSION ESTIMATING AND DATA QUALITY

This section provides a description of the operating conditions used in the calculation of the emission estimates and an assessment of the data quality of the emission estimates for each significant contaminant from the Facility, as required by sub paragraphs 6 and 7 of s.26(1) of O. Reg. 419/05.

5.1 Description of Operation Conditions Section 10 of O.Reg.419/05 states that an acceptable operating condition is a scenario in which operating conditions for the Facility would result, for the relevant contaminant, in the highest concentration of the contaminant possible at the point of impingement (POI). The operating condition(s) described in this ESDM Report meets this requirement.

The MOE has established standards and guidelines for over 300 contaminants, as documented in the publication “Summary of Standards and Guidelines to support Ontario Regulation 419: Air Pollution - Local Air Quality (including Schedule 6 of O. Reg. 419 on Upper Risk Thresholds)”, dated February 2008 (MOE POI Limit[s]). The averaging time for the operating condition is dependent on the averaging time for the MOE POI Limit. The operating conditions used for the Facility that result in the maximum concentration at a POI are the scenarios where all significant sources are operating simultaneously at their individual maximum rates of production for the appropriate averaging time, as described in Appendix A of this ESDM Report. The individual maximum rates of production for each significant source of emissions correspond to the maximum emission rate for the averaging time. Two different operational scenarios were modelled for the facility, each of these scenarios is defined below:

5.1.1 Normal Operations During maximum normal operations, all five CHP engines will be in operation at 100% load, generating 9.8 MW of electrical power. All five boilers will be operating to generate approximately 4.8 MW of thermal energy in the form of steam. All other sources are also expected to be in operation except the emergency flare.

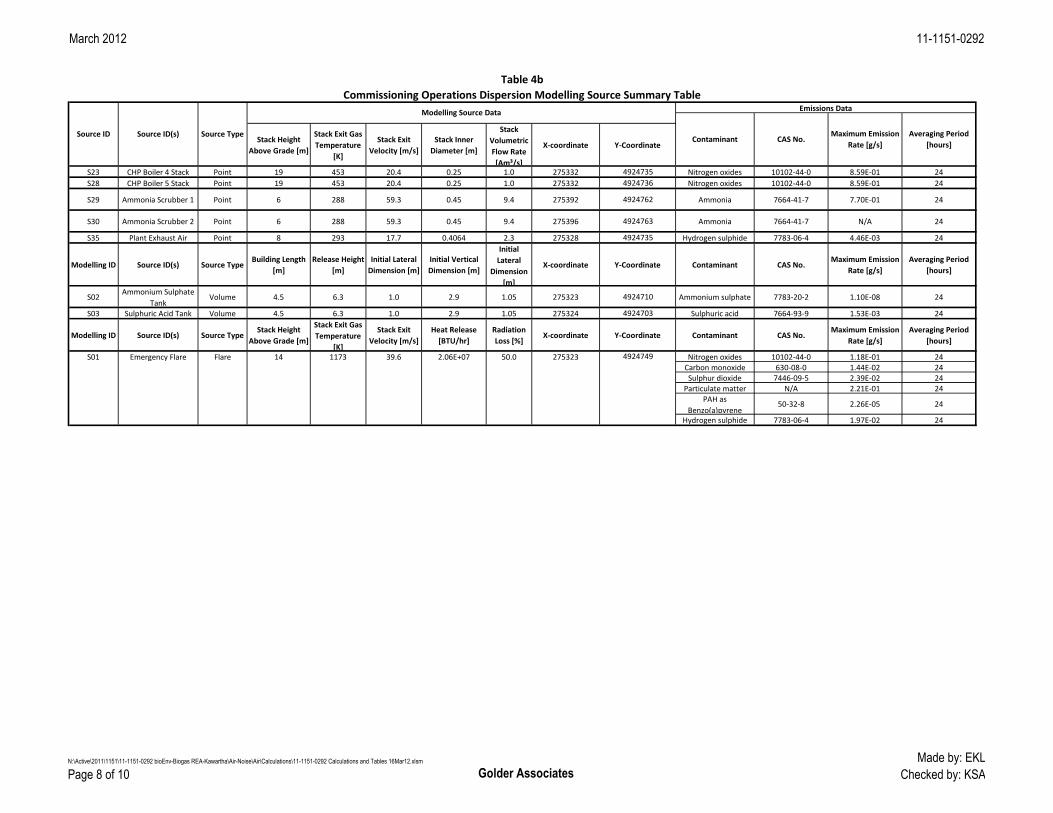
5.1.2 Commissioning Operations During the Facility’s commissioning operations (approximately 2 months), the biogas produced will be combusted by the flare until the biogas quantity and quality is enough to feed the engines. Up to 25% of the Facility’s biogas production capacity, estimated to be 935 m³/hr, will be burned in the flare. During this time, two biogas engines will also be in operation at half load using natural gas as fuel.

EMISSION SUMMARY AND DISPERSION MODELLING REPORT

March 2012 Report No. 11-1151-0292 10

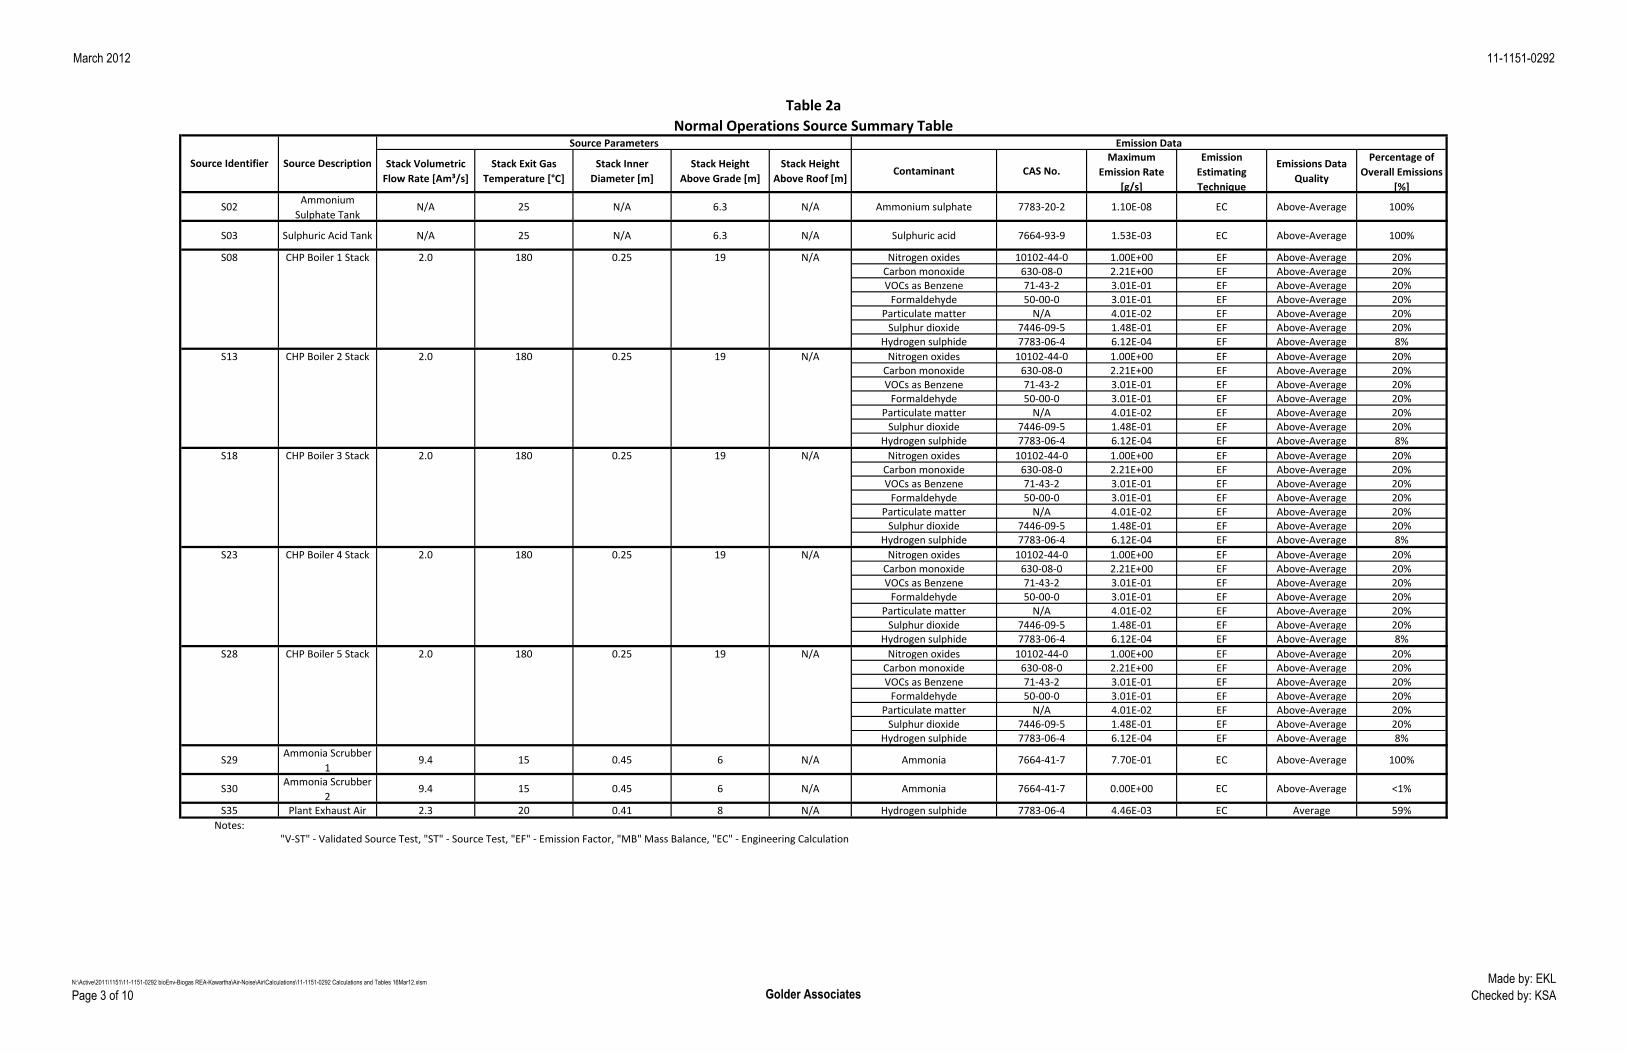
5.2 Explanation of the Methods Used to Calculate Emission Rates The maximum emission rates for each significant contaminant emitted from the significant sources were estimated and the methodology for the calculation are documented in Tables 2a and 2b, the Source Summary Tables for normal and commissioning operations. All emission rates were calculated in accordance with requirements of the ESDM Procedure Document.

5.3 Sample Calculations The technical rationale, including sample calculations, required to substantiate the emission rates presented in Tables 2a and 2b are documented in Appendix A – Emission Rate Calculations. Emission factors for natural gas combustion are publicly available. Emission data for the biogas engines and emergency flare are provided in Appendix B – Supporting Information for Emission Rate Calculations.

5.3.1 Biogas Engine Emissions Emissions from the combustion of biogas in the CHP engines were estimated using emission factors (units of mg/m³) provided by the CHP engine manufacturer. The emission factors were multiplied by the engine exhaust flow rate to provide a g/s emission rate. Emissions include products of combustion, particulate matter, hydrogen sulphide, VOCs as benzene and formaldehyde.

The CHP engines have a hydrogen sulphide oxidation/destruction efficiency of greater than 99%. Emission rates were estimated assuming 1% of the hydrogen sulphide in biogas would be emitted to the atmosphere.

During commissioning operations, two biogas engines will operate using natural gas as fuel. Nitrogen oxides emissions were estimated using an emission factor obtained from the US EPA AP-42 Chapter 3.2: Natural Gas Fired Reciprocating Engines.

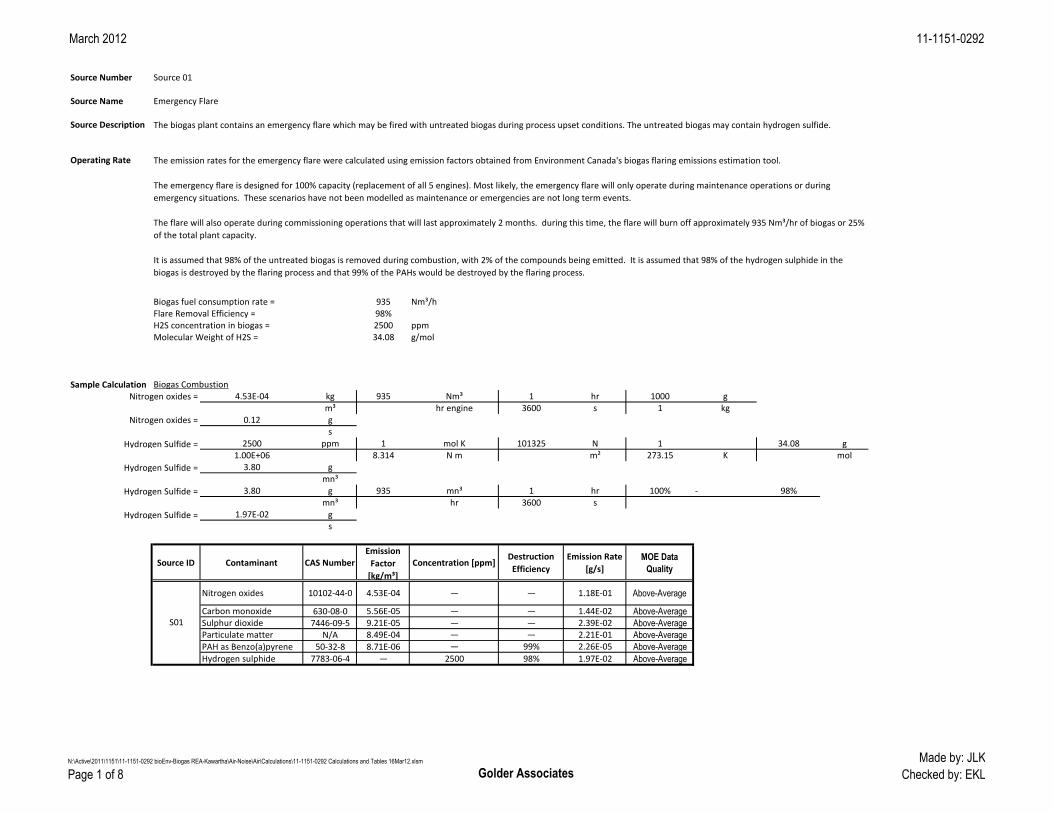
5.3.2 Emergency Flare Emissions Emissions from the emergency flare were calculated using emission factors obtained from Environment Canada's biogas flaring emissions estimation tool. The emission factors were multiplied by the emergency flare biogas consumption rate to provide a g/s emission rate. Emissions include products of combustion, particulate matter, hydrogen sulphide and PAHs.

The emergency flare has a hydrogen sulphide oxidation/destruction efficiency of greater than 98%. Emission rates were estimated assuming 2% of the hydrogen sulphide in biogas would be emitted to the atmosphere.

The emergency flare was also assumed to destroy 99% of polyaromatic hydrocarbon compounds (PAHs). All PAHs were assumed to be benzo(a)pyrene.

EMISSION SUMMARY AND DISPERSION MODELLING REPORT

March 2012 Report No. 11-1151-0292 11

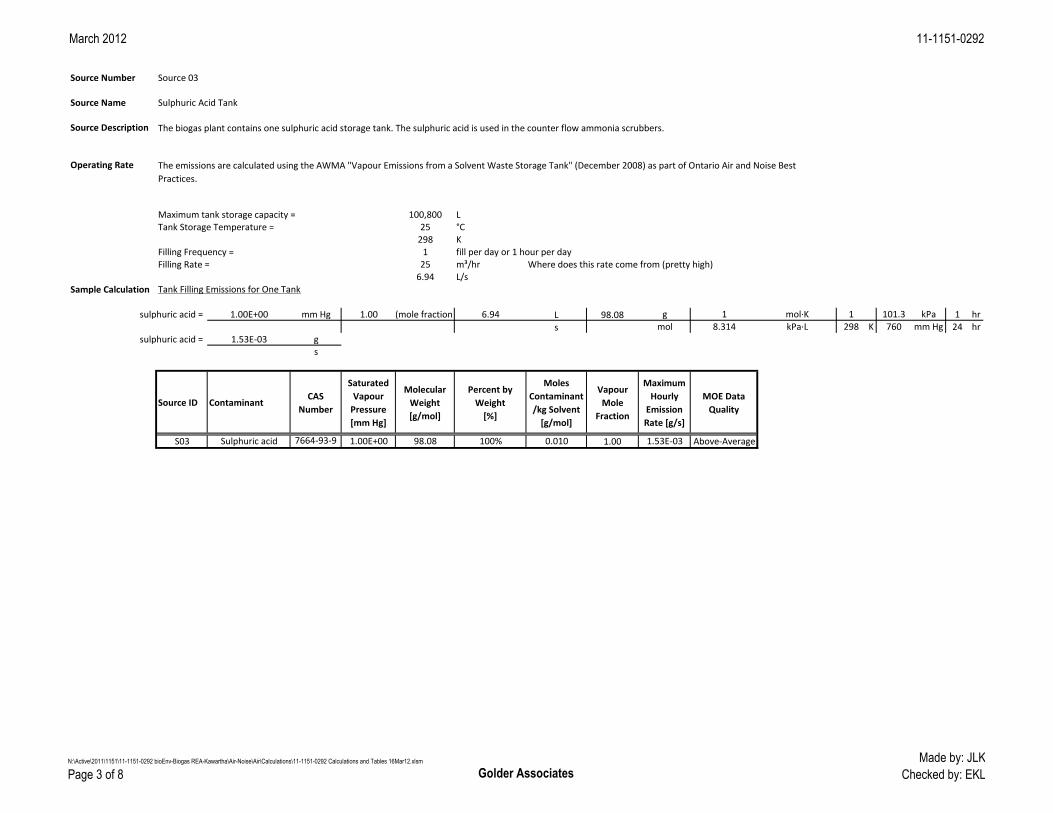
5.3.3 Chemical Storage Tanks Tank filling emissions from the ammonium sulphate and sulphuric acid storage tanks were calculated using the Air & Waste Management Association document, "Vapour Emissions from a Solvent Waste Storage Tank" (December 2008), as part of Ontario Air and Noise Best Practices.

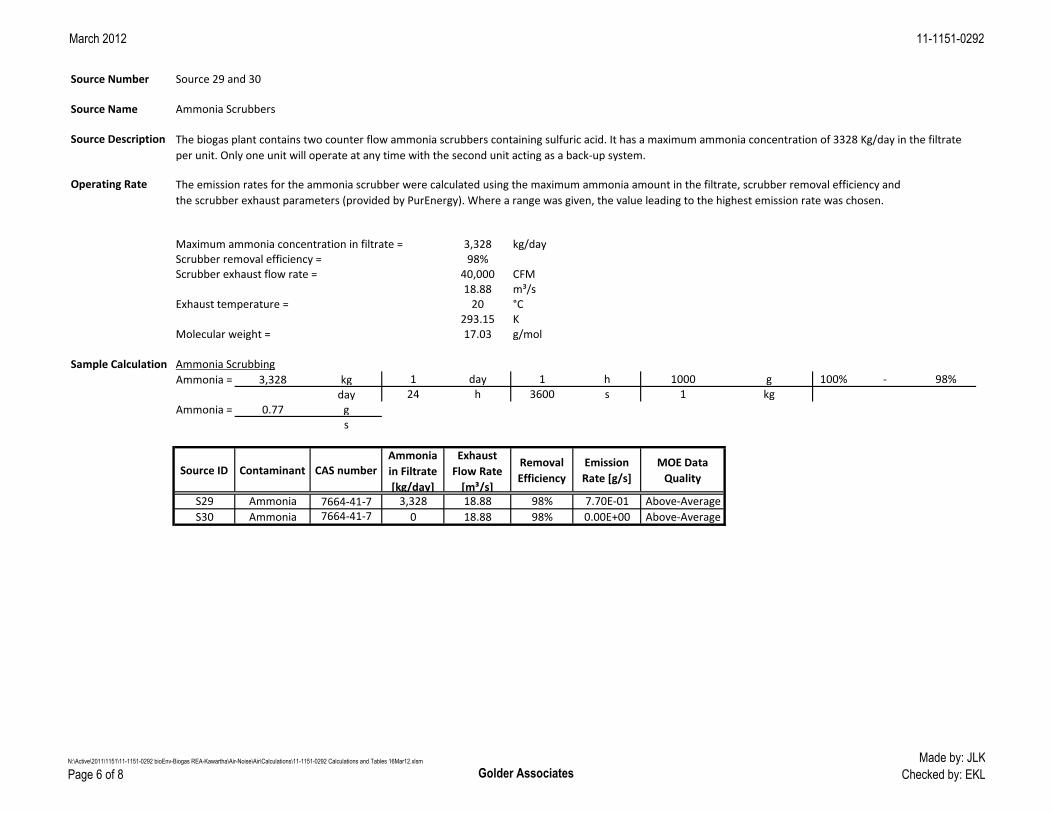
5.3.4 Ammonia Scrubbers Emissions from the ammonia scrubbers were estimated using the maximum ammonia inlet concentration and the guaranteed ammonia removal efficiency of 98%.

5.3.5 Common Plant Exhaust Air from the Digestate Management building and Dewatered Solids Storage and Loading building is exhausted through the Common Plant Exhaust. Emissions from this exhaust were based on source testing data obtained from a similar facility.

Odour emissions are the main concern from this exhaust, therefore, all emissions were conservatively assumed to be hydrogen sulphide.

5.4 Assessment of Data Quality The assessment of data quality for each source listed in Tables 2a and 2b are documented in Appendix A – Emission Rate Calculations.

5.5 Conservatism of Emission Estimates and Operating Condition The following assumptions were included in the development of the emission estimates and operating condition for the Facility:

The highest emission rate that each source is capable of (i.e., maximum usage rates or throughputs) was used to characterize the emissions.

All sources are assumed to be operating simultaneously at the corresponding maximum emission rate for the averaging period for each operational scenario.

Based on the conservative assumptions summarized above and detailed in Appendix A – Emission Rate Calculations, the emission rates listed in Tables 2a and 2b are likely to be an overestimate of the actual emission rates.

EMISSION SUMMARY AND DISPERSION MODELLING REPORT

March 2012 Report No. 11-1151-0292 12

6.0 SOURCE SUMMARY TABLE AND SITE PLAN

6.1 Source Summary Table The emission rates for each source of significant contaminants are documented in Tables 2a and 2b in accordance with requirements of sub paragraph 8 of s.26(1) of O. Reg. 419/05.

6.2 Site Plan The Facility property line is illustrated on Figure 1 – Site Location Plan. Scaled site information is provided in Figure 3 – Roof Layout. This includes:

each significant source of significant contaminants; and

the location of buildings on the property.

EMISSION SUMMARY AND DISPERSION MODELLING REPORT

March 2012 Report No. 11-1151-0292 13

7.0 DISPERSION MODELLING The dispersion modelling was conducted in accordance with the MOE publication “Guideline A-11: Air Dispersion Modelling Guideline for Ontario, Version, 2.0”, dated March 2009 (ADMGO) PIBS 5165e02.

The Facility is currently subject to s.19 of O. Reg. 419/05; therefore, the modelled impact of contaminant emissions can be assessed as half-hour maximum point of impingement (POI) concentrations. However, the AERMOD model is being used for this ESDM Report to allow for the improved dispersion from plume rise due to high temperature and high velocity exhaust characteristics from Facility’s exhaust stacks. The MOE form “Request Under s.20(4) to have the Schedule 3 Standards Apply in Advance of the Date Required by Regulation 419/05” has been provided.

The AERMOD modelling system consists of the AERMOD dispersion model, the AERMET meteorological pre-processor, the AERMAP terrain pre-processor, and the BPIP-Prime building downwash pre-processor.

The following approved dispersion model and pre-processors were used in the assessment:

AERMOD dispersion model (v. 09292);

AERMAP surface pre-processor (v. 11103); and

BPIP-Prime building downwash pre-processor (v. 04274).

7.1 Meteorology and Land Use Data The AERMOD model was run using a five-year (1996 to 2000) crops meteorological data set obtained from the MOE’s “Ontario Regional Meteorological Data” website for the Eastern Region – Ottawa, Peterborough, Belleville.

A zoning map including local land uses is provided as Figure 4 – Land Use Zoning Designation Plan.

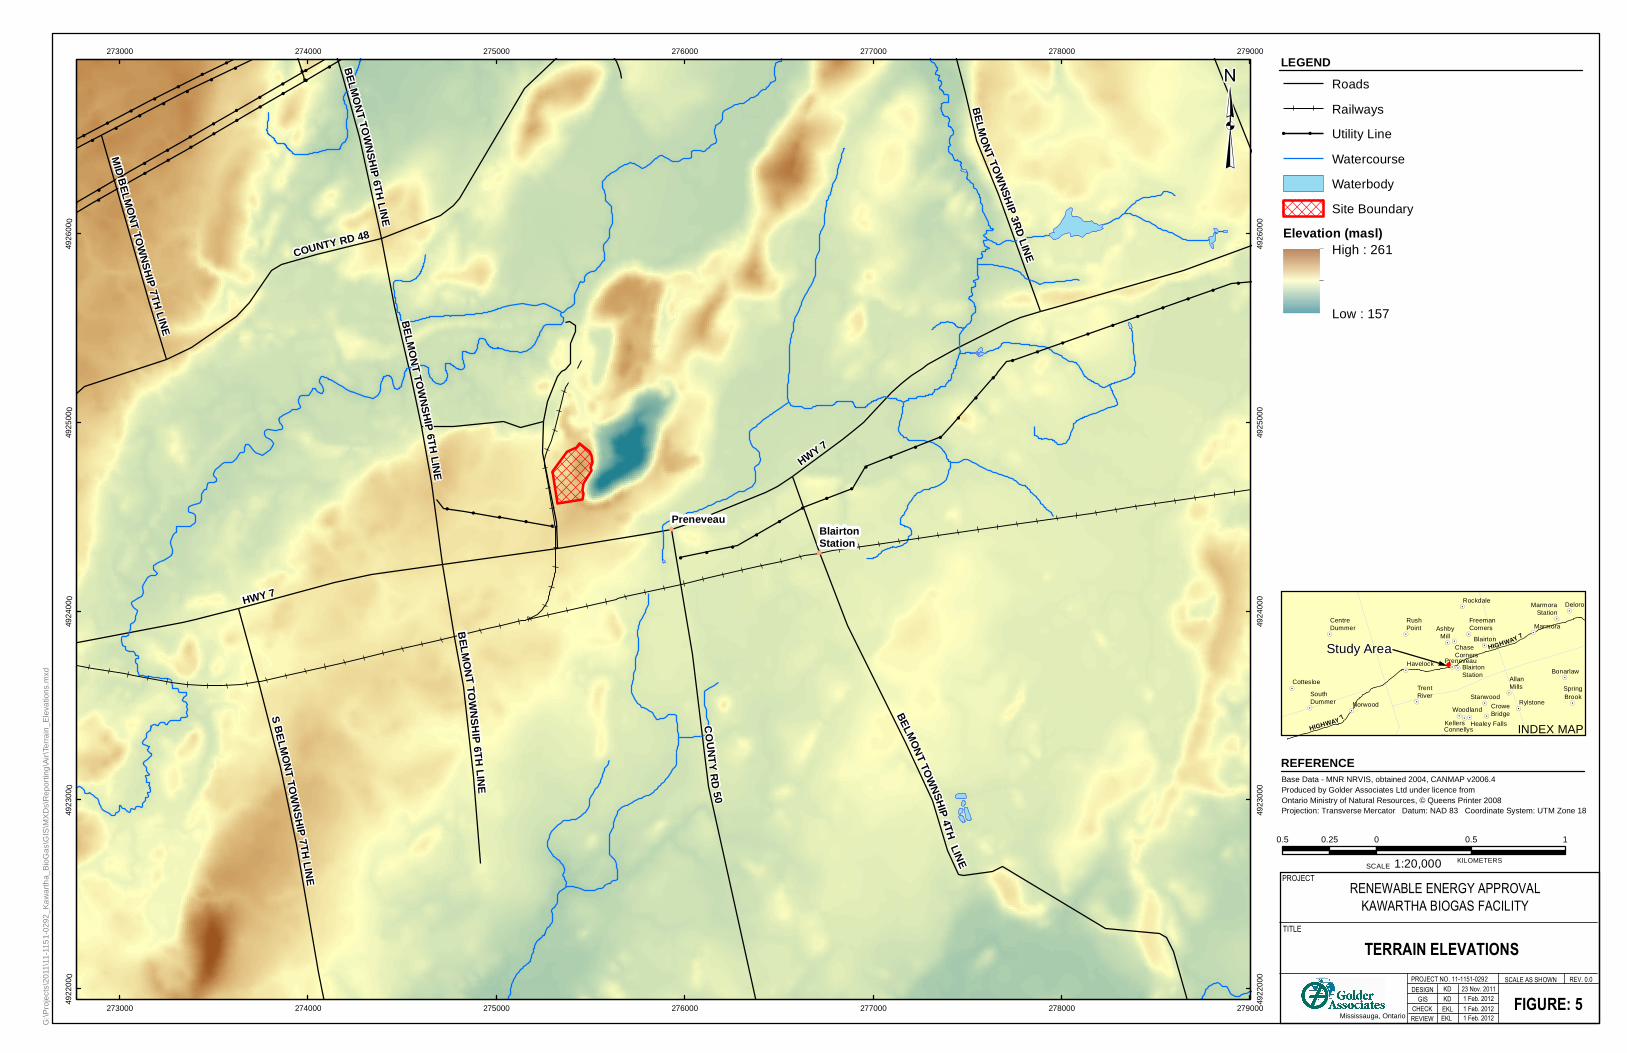
7.2 Terrain Terrain data used in this assessment was obtained from MOE (7.5 minute format) and is illustrated in Figure 5 –Terrain Elevation. DEM files used in this assessment include the following:

1006_3.DEM; and

1007_3.DEM.

EMISSION SUMMARY AND DISPERSION MODELLING REPORT

March 2012 Report No. 11-1151-0292 14

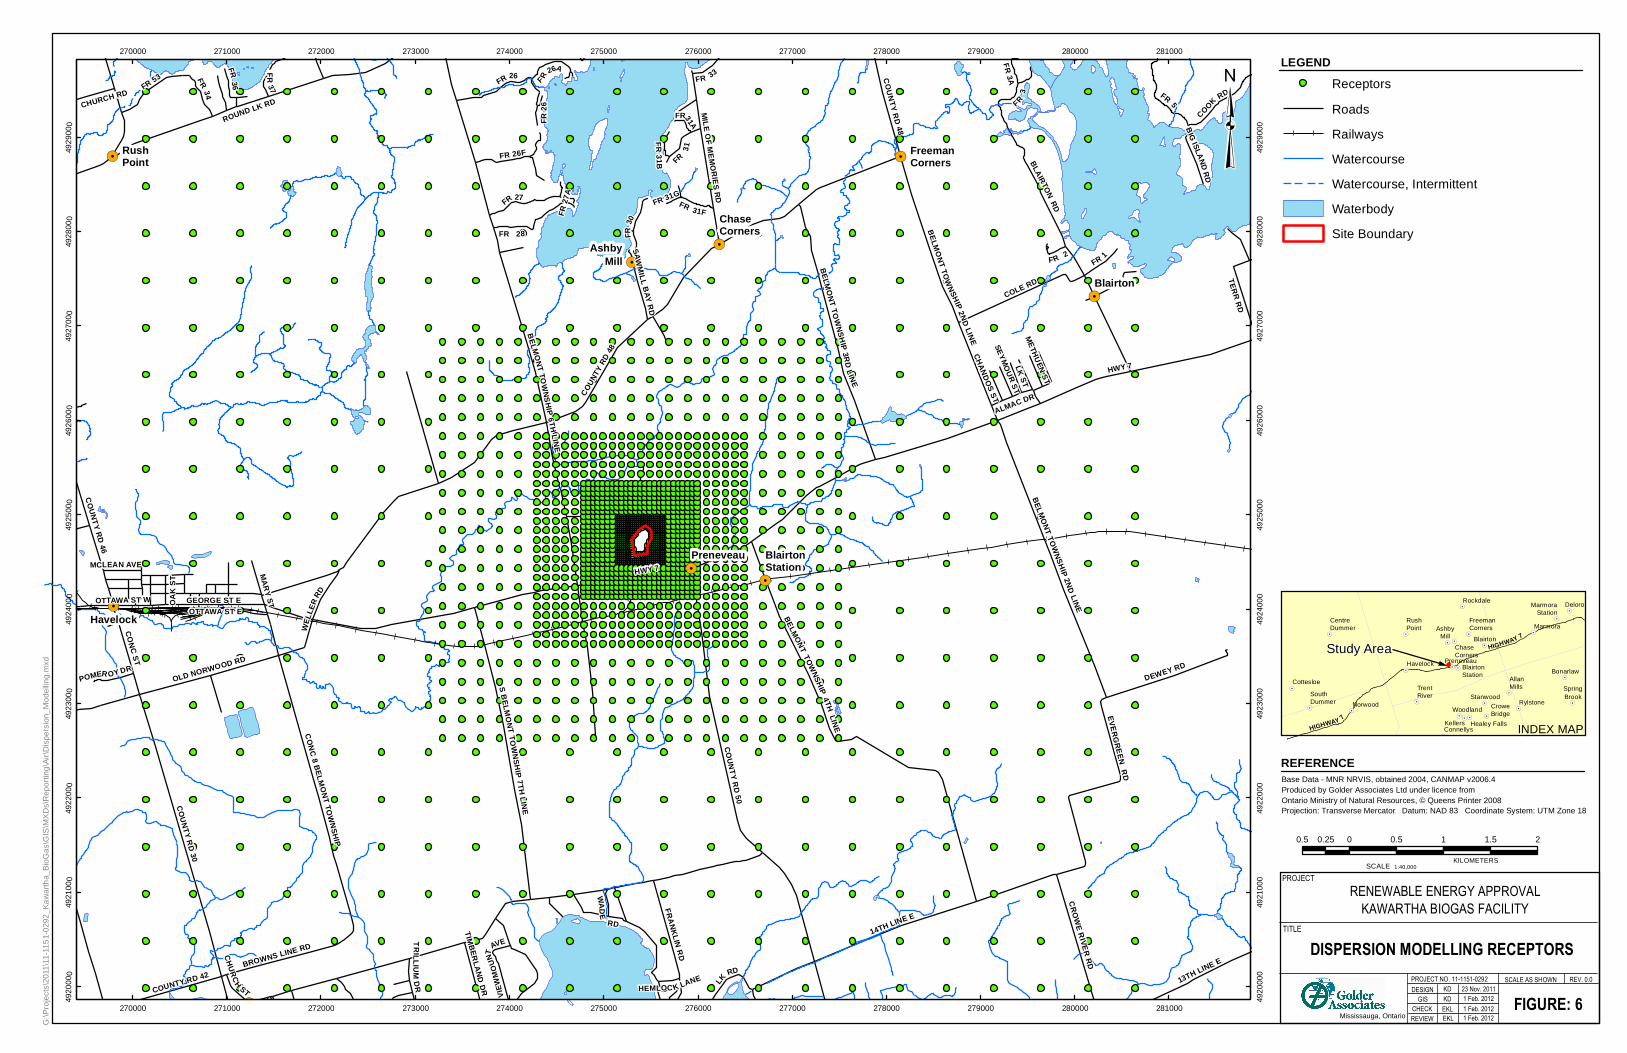
7.3 Receptors Receptors were chosen based on recommendations provided in section 7.1 of the ADMGO, which is in accordance with section 14 of O. Reg. 419/05. Specifically, a nested receptor grid, centered around the outer edges of all the sources, was placed as follows:

a) 20 m spacing, within an area of 200 m by 200 m;

b) 50 m spacing, within an area surrounding the area described in (a) with a boundary at 300 m by 300 m outside the boundary of the area described in (a);

c) 100 m spacing, within an area surrounding the area described in (b) with a boundary at 800 m by 800 m outside the boundary of the area described in (a);

d) 200 m spacing, within an area surrounding the area described in (c) with a boundary at 1,800 m by 1,800 m outside the boundary of the area described in (a); and

e) 500 m spacing, within an area surrounding the area described in (d) with a boundary at 4,800 m by 4,800 m outside the boundary of the area described in (a).

In addition to using the nested receptor grid, receptors were also placed every 10 m along the property line.

The area of modeling coverage is illustrated on Figure 6 – Dispersion Modelling Receptors.

7.4 Building Downwash Building wake effects were considered in this modelling study using the U.S. EPA’s Building Profile Input Program (BPIP-PRIME), a pre-processor to AERMOD. The inputs into this pre-processor include the coordinates and heights of the buildings and stacks. The BPIP output is used in the AERMOD building wake effect calculation.

The PRIME plume rise algorithms include vertical wind shear calculations (important for buoyant releases from short stacks [i.e., stacks at release heights within the recirculation zones of buildings]). The PRIME algorithm also allows for the wind speed deficit induced by the building to change with respect to the distance from the building. These factors improve the accuracy of predicted concentrations within building wake zones that form in the lee of buildings.

The building obstacles as used in the BPIP program are shown in Figure 7 – Building Downwash Plan.

7.5 Deposition AERMOD has the capability to account for wet and dry deposition of substances that would reduce ground level concentrations at POIs. However, the deposition algorithm has not been implemented as only regulatory defaults have been used.

EMISSION SUMMARY AND DISPERSION MODELLING REPORT

March 2012 Report No. 11-1151-0292 15

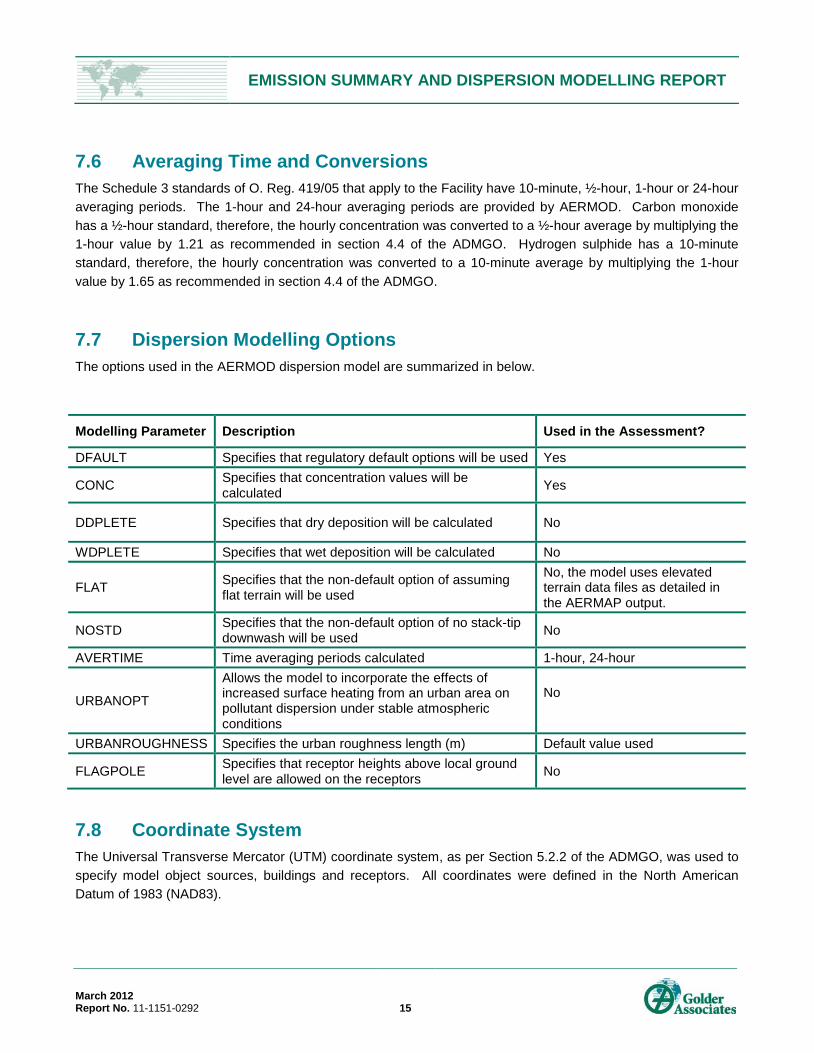
7.6 Averaging Time and Conversions The Schedule 3 standards of O. Reg. 419/05 that apply to the Facility have 10-minute, ½-hour, 1-hour or 24-hour averaging periods. The 1-hour and 24-hour averaging periods are provided by AERMOD. Carbon monoxide has a ½-hour standard, therefore, the hourly concentration was converted to a ½-hour average by multiplying the 1-hour value by 1.21 as recommended in section 4.4 of the ADMGO. Hydrogen sulphide has a 10-minute standard, therefore, the hourly concentration was converted to a 10-minute average by multiplying the 1-hour value by 1.65 as recommended in section 4.4 of the ADMGO.

7.7 Dispersion Modelling Options The options used in the AERMOD dispersion model are summarized in below.

Modelling Parameter Description Used in the Assessment?

DFAULT Specifies that regulatory default options will be used Yes

CONC Specifies that concentration values will be calculated Yes

DDPLETE Specifies that dry deposition will be calculated No

WDPLETE Specifies that wet deposition will be calculated No

FLAT Specifies that the non-default option of assuming flat terrain will be used

No, the model uses elevated terrain data files as detailed in the AERMAP output.

NOSTD Specifies that the non-default option of no stack-tip downwash will be used No

AVERTIME Time averaging periods calculated 1-hour, 24-hour

URBANOPT

Allows the model to incorporate the effects of increased surface heating from an urban area on pollutant dispersion under stable atmospheric conditions

No

URBANROUGHNESS Specifies the urban roughness length (m) Default value used

FLAGPOLE Specifies that receptor heights above local ground level are allowed on the receptors No

7.8 Coordinate System The Universal Transverse Mercator (UTM) coordinate system, as per Section 5.2.2 of the ADMGO, was used to specify model object sources, buildings and receptors. All coordinates were defined in the North American Datum of 1983 (NAD83).

EMISSION SUMMARY AND DISPERSION MODELLING REPORT

March 2012 Report No. 11-1151-0292 16

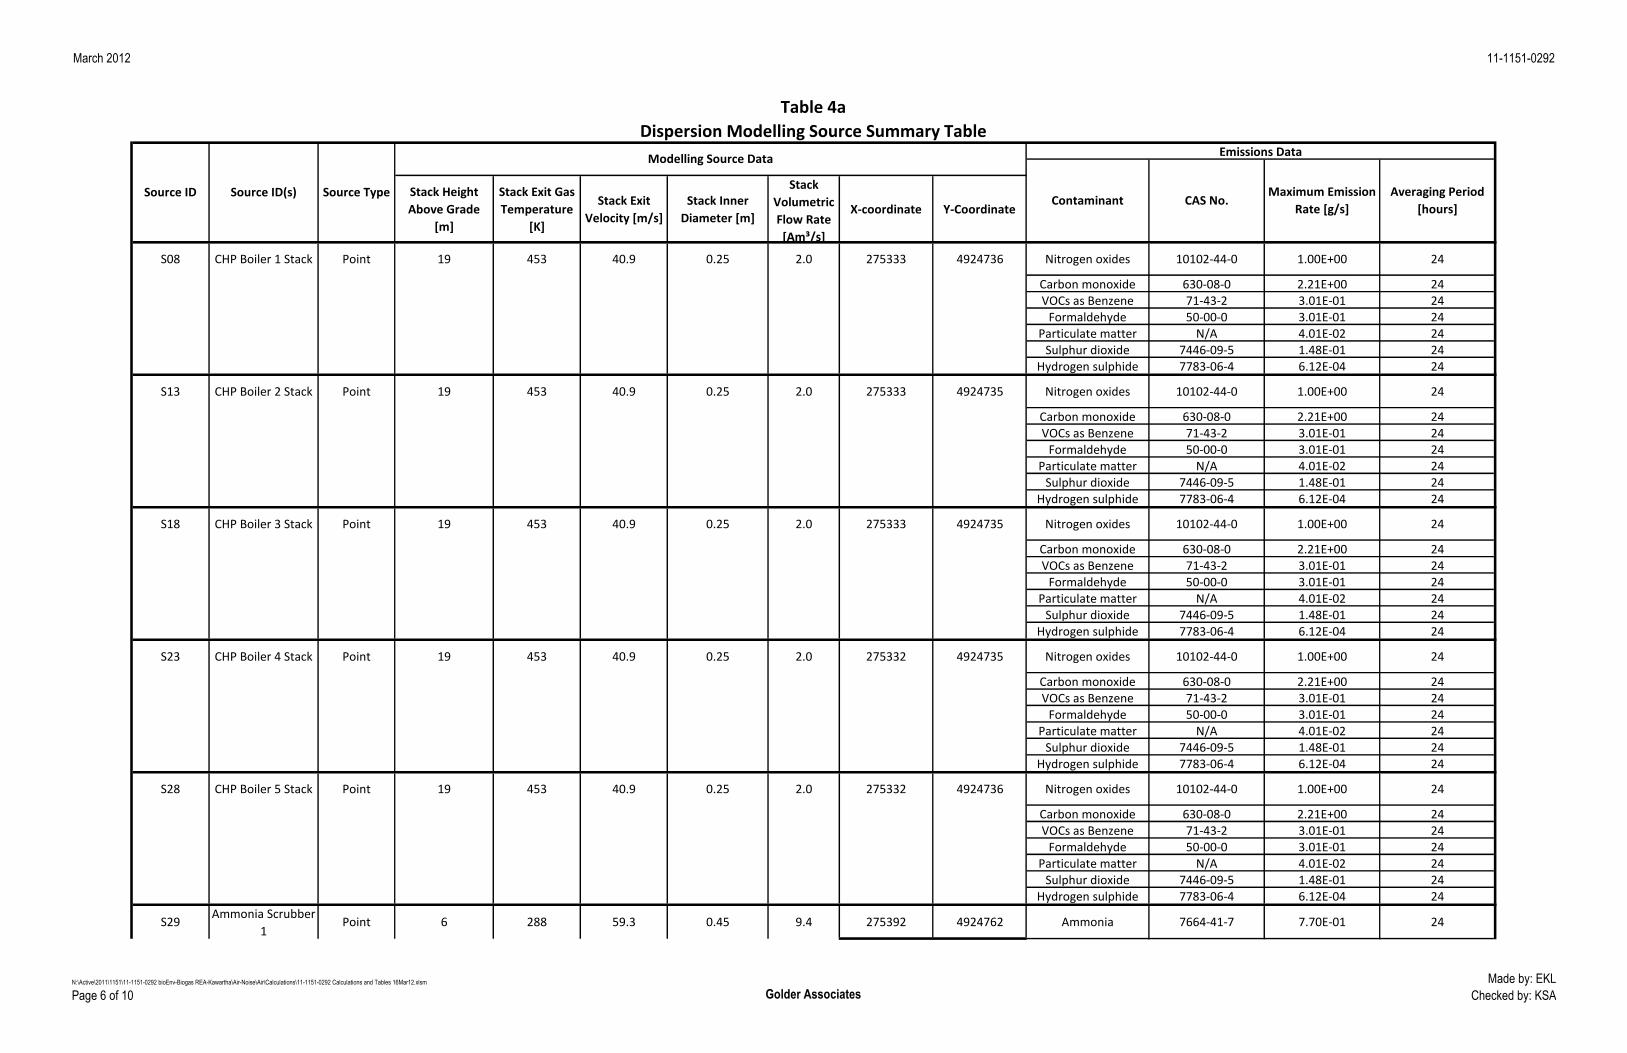
7.9 Dispersion Modelling Input Summary Table A description of the way in which the approved dispersion model was performed is included as Table 3 – Dispersion Modelling Input Summary Table. This table meets both the requirements of paragraph 26(1)(11) and sections 8 to 17 of O. Reg. 419/05 and follows the format provided in the ESDM Procedure Document. Furthermore, the dispersion modelling input parameters are summarized in Tables 4a and 4b, the Dispersion Modelling Source Summary Tables for normal and commissioning operations. Although not required by section 26 of O. Reg. 419/05, these tables simplify the data presentation.

7.10 Dispersion Modelling Runs Modelling runs were completed for each significant contaminant in the two operating scenarios.

7.11 Dispersion Modelling Input and Output Files Electronic copies of all input and output files are also provided in Appendix C on compact disc (CD).

EMISSION SUMMARY AND DISPERSION MODELLING REPORT

March 2012 Report No. 11-1151-0292 17

8.0 EMISSION SUMMARY TABLE This section provides the table required by sub paragraph 14 of s.26(1) of O. Reg. 419/05 and provides an interpretation of the results, as required by the ESDM Procedure Document.

8.1 Emission Summary Table A POI concentration for each significant contaminant emitted from the Facility was calculated based on the emission rates listed in Tables 2a and 2b and the output from the approved dispersion model presented in Appendix E. The results are presented in Tables 5a and 5b, the Emission Summary Tables for normal and commissioning operations. This table follows the format provided in the ESDM Procedure Document.

The POI concentrations listed in Tables 5a and 5b were compared against the MOE POI Limits. At 91%, nitrogen oxides has the highest concentration relative to its MOE POI Limit for the normal operations scenario. For the commissioning operations scenario, PAH as benzo(a)pyrene has the highest concentration at 87% of its MOE POI Limit.

8.2 Assessment of Contaminants with no MOE POI Limits Sub paragraph 14 subsection viii of s.26(1) O. Reg. 419/05 requires an indication of the likelihood, nature and location of any adverse effect if the contaminant is not listed in any of Schedules 1, 2 and 3.

Contaminants at the Facility that do not have MOE POI Limits were screened against the Jurisdictional Screening Limits (JSLs) listed in the MOE publication “Jurisdictional Screening Level (JSL) List a Screening Tool for Ontario Regulation 419: Air Pollution – Local Air Quality” dated February 2008.

EMISSION SUMMARY AND DISPERSION MODELLING REPORT

March 2012 Report No. 11-1151-0292 18

9.0 CONCLUSIONS This ESDM Report was prepared in accordance with s.26 of O. Reg. 419/05. In addition, guidance in the ESDM Procedure Document was followed, as appropriate.

Contaminant emissions are assessed using the AERMOD dispersion model and the maximum POI concentrations were compared to Schedule 3 standards of O. Reg. 419/05.

All the emission rates listed in Tables 2a and 2b correspond to the operating scenario where all significant sources are operating simultaneously at their individual maximum rates of production. Therefore, the emission rates listed in Tables 2a and 2b are conservative and overestimate the actual emissions.

A POI concentration for each significant contaminant emitted from the Facility was estimated based on the calculated emission rates and the output from the AERMOD dispersion model. The results are presented in Tables 5a and 5b and were compared against the respective MOE POI Limits.

Contaminants that do not have MOE POI Limits were screened against the JSL limits.

All the predicted POI concentrations are below the corresponding limits. At 91%, nitrogen oxides has the highest concentration relative to its MOE POI Limit for the normal operations scenario. For the commissioning operations scenario, PAH as benzo(a)pyrene has the highest concentration at 87% of its MOE POI Limit.

It is assumed that the conservative emission rates, when combined with the conservative operating conditions and conservative dispersion modelling assumptions, are not likely to under predict the concentrations at a receptor. Therefore, this assessment conservatively demonstrates that the Facility can operate in compliance with s.20 of O. Reg. 419/05.

EMISSION SUMMARY AND DISPERSION MODELLING REPORT

March 2012 Report No. 11-1151-0292

Report Signature Page

GOLDER ASSOCIATES LTD.

Emily Lau, B.A.Sc., P.Eng. Anthony Ciccone, Ph.D., P.Eng. Air Quality Engineer Principal

EKL/ADC/ng

Golder, Golder Associates and the GA globe design are trademarks of Golder Associates Corporation.

n:\active\2011\1151\11-1151-0292 bioenv-biogas rea-kawartha\air-noise\air\report\esdm\final\11-1151-0292 rpt mar12 kawartha biogas esdm.docx

Original signed by Original signed by

EMISSION SUMMARY AND DISPERSION MODELLING REPORT

March 2012 Report No. 11-1151-0292

TABLES

March 2012 11-1151-0292

Source IDSource Description

or TitleGeneral Location

S01 Emergency Flare Flare Pad (Main Plant) Products of Biogas Combustion Yes Yes N/A

S02 Ammonium Sulphate Tank Main Plant Ammonium Sulphate Yes Yes N/AS03 Sulphuric Acid Tank Main Plant Sulphuric Acid Yes Yes N/A

S04 CHP Unit 1 Air InletCHP Building (Main

Plant)None No No No emissions expected.

S05 CHP Unit 1 Cooler 1CHP Building (Main

Plant)None No No No emissions expected.

S06 CHP Unit 1 Cooler 2CHP Building (Main

Plant)None No No No emissions expected.

S07 CHP Unit 1 Air OutletCHP Building (Main

Plant)None No No No emissions expected.

S08 CHP Boiler 1 StackCHP Building (Main

Plant)Products of Biogas Combustion Yes Yes N/A

S09 CHP Unit 2 Air InletCHP Building (Main

Plant)None No No No emissions expected.

S10 CHP Unit 2 Cooler 1CHP Building (Main

Plant)None No No No emissions expected.

S11 CHP Unit 2 Cooler 2CHP Building (Main

Plant)None No No No emissions expected.

S12 CHP Unit 2 Air OutletCHP Building (Main

Plant)None No No No emissions expected.

S13 CHP Boiler 2 StackCHP Building (Main

Plant)Products of Biogas Combustion Yes Yes N/A

S14 CHP Unit 3 Air InletCHP Building (Main

Plant)None No No No emissions expected.

S15 CHP Unit 3 Cooler 1CHP Building (Main

Plant)None No No No emissions expected.

S16 CHP Unit 3 Cooler 2CHP Building (Main

Plant)None No No No emissions expected.

S17 CHP Unit 3 Air OutletCHP Building (Main

Plant)None No No No emissions expected.

S18 CHP Boiler 3 StackCHP Building (Main

Plant)Products of Biogas Combustion Yes Yes N/A

S19 CHP Unit 4 Air InletCHP Building (Main

Plant)None No No No emissions expected.

S20 CHP Unit 4 Cooler 1CHP Building (Main

Plant)None No No No emissions expected.

S21 CHP Unit 4 Cooler 2CHP Building (Main

Plant)None No No No emissions expected.

S22 CHP Unit 4 Air OutletCHP Building (Main

Plant)None No No No emissions expected.

S23 CHP Boiler 4 StackCHP Building (Main

Plant)Products of Biogas Combustion Yes Yes N/A

Table 1

Sources and Contaminants Identification Table

Source InformationExpected Contaminants

Significant

(Yes or No)?

Modelled

(Yes or No)?Rationale

Made by: JK

Checked by: EKLN:\Active\2011\1151\11-1151-0292 bioEnv-Biogas REA-Kawartha\Air-Noise\Air\Calculations\11-1151-0292 Calculations and Tables 16Mar12.xlsm

Page 1 of 10 Golder Associates

March 2012 11-1151-0292

Source IDSource Description

or TitleGeneral Location

Table 1

Sources and Contaminants Identification Table

Source InformationExpected Contaminants

Significant

(Yes or No)?

Modelled

(Yes or No)?Rationale

S24 CHP Unit 5 Air InletCHP Building (Main

Plant)None No No No emissions expected.

S25 CHP Unit 5 Cooler 1CHP Building (Main

Plant)None No No No emissions expected.

S26 CHP Unit 5 Cooler 2CHP Building (Main

Plant)None No No No emissions expected.

S27 CHP Unit 5 Air OutletCHP Building (Main

Plant)None No No No emissions expected.

S28 CHP Boiler 5 StackCHP Building (Main

Plant)Products of Biogas Combustion Yes Yes N/A

S29 Ammonia Scrubber 1 Main Plant Ammonia Yes Yes N/AS30 Ammonia Scrubber 2 Main Plant Ammonia Yes Yes N/A

S31Solids Storage Building Ventilation

1Solids Storage Building None No No

No emissions expected. Material is

saturated.

S32Solids Storage Building Ventilation

2Solids Storage Building None No No

No emissions expected. Material is

saturated.

S33 Waste Water Tank Vent 1 Water Treatment Tanks None No No No emissions expected.

S34 Waste Water Tank Vent 2 Water Treatment Tanks None No No No emissions expected.

S35 Plant Exhaust Air Main Plant Hydrogen sulphide Yes Yes N/A

S36 Chemical StorageChemical Containment

(Main Plant)None No No

Contaminants emitted in negligible

amounts as per section 7.2.1 of the

ESDM Procedure Document.

S37 HVAC EquipmentOffice and Maintenance

Building (Main Plant)Products of combustion No No

Negligible source used for comfort

heating only with a total thermal input

of less than 1.58 million kJ/hr (O.Reg.

524/98)

S38Fugitive Odours from Raw

Materials Delivery

Solids

Reception/Loading

(Main Plant)

Odour Yes NoVentilation systems in place to control

odour.

S39Fugitive Odours from Raw

Materials Storage and Pre-

Treatment

Main Plant Odour Yes NoVentilation systems in place to control

odour.

S40 Desulphurization Unit Main Plant None No NoUnit is enclosed and contains no

external exhaust.

Made by: JK

Checked by: EKLN:\Active\2011\1151\11-1151-0292 bioEnv-Biogas REA-Kawartha\Air-Noise\Air\Calculations\11-1151-0292 Calculations and Tables 16Mar12.xlsm

Page 2 of 10 Golder Associates

March 2012 11-1151-0292

Stack Volumetric

Flow Rate [Am³/s]

Stack Exit Gas

Temperature [°C]

Stack Inner

Diameter [m]

Stack Height

Above Grade [m]

Stack Height

Above Roof [m]Contaminant CAS No.

Maximum

Emission Rate

[g/s]

Emission

Estimating

Technique

Emissions Data

Quality

Percentage of

Overall Emissions

[%]

S02Ammonium

Sulphate TankN/A 25 N/A 6.3 N/A Ammonium sulphate 7783-20-2 1.10E-08 EC Above-Average 100%

S03 Sulphuric Acid Tank N/A 25 N/A 6.3 N/A Sulphuric acid 7664-93-9 1.53E-03 EC Above-Average 100%

S08 CHP Boiler 1 Stack 2.0 180 0.25 19 N/A Nitrogen oxides 10102-44-0 1.00E+00 EF Above-Average 20%Carbon monoxide 630-08-0 2.21E+00 EF Above-Average 20%VOCs as Benzene 71-43-2 3.01E-01 EF Above-Average 20%

Formaldehyde 50-00-0 3.01E-01 EF Above-Average 20%Particulate matter N/A 4.01E-02 EF Above-Average 20%

Sulphur dioxide 7446-09-5 1.48E-01 EF Above-Average 20%Hydrogen sulphide 7783-06-4 6.12E-04 EF Above-Average 8%

S13 CHP Boiler 2 Stack 2.0 180 0.25 19 N/A Nitrogen oxides 10102-44-0 1.00E+00 EF Above-Average 20%Carbon monoxide 630-08-0 2.21E+00 EF Above-Average 20%VOCs as Benzene 71-43-2 3.01E-01 EF Above-Average 20%

Formaldehyde 50-00-0 3.01E-01 EF Above-Average 20%Particulate matter N/A 4.01E-02 EF Above-Average 20%

Sulphur dioxide 7446-09-5 1.48E-01 EF Above-Average 20%Hydrogen sulphide 7783-06-4 6.12E-04 EF Above-Average 8%

S18 CHP Boiler 3 Stack 2.0 180 0.25 19 N/A Nitrogen oxides 10102-44-0 1.00E+00 EF Above-Average 20%Carbon monoxide 630-08-0 2.21E+00 EF Above-Average 20%VOCs as Benzene 71-43-2 3.01E-01 EF Above-Average 20%

Formaldehyde 50-00-0 3.01E-01 EF Above-Average 20%Particulate matter N/A 4.01E-02 EF Above-Average 20%

Sulphur dioxide 7446-09-5 1.48E-01 EF Above-Average 20%Hydrogen sulphide 7783-06-4 6.12E-04 EF Above-Average 8%

S23 CHP Boiler 4 Stack 2.0 180 0.25 19 N/A Nitrogen oxides 10102-44-0 1.00E+00 EF Above-Average 20%Carbon monoxide 630-08-0 2.21E+00 EF Above-Average 20%VOCs as Benzene 71-43-2 3.01E-01 EF Above-Average 20%

Formaldehyde 50-00-0 3.01E-01 EF Above-Average 20%Particulate matter N/A 4.01E-02 EF Above-Average 20%

Sulphur dioxide 7446-09-5 1.48E-01 EF Above-Average 20%Hydrogen sulphide 7783-06-4 6.12E-04 EF Above-Average 8%

S28 CHP Boiler 5 Stack 2.0 180 0.25 19 N/A Nitrogen oxides 10102-44-0 1.00E+00 EF Above-Average 20%Carbon monoxide 630-08-0 2.21E+00 EF Above-Average 20%VOCs as Benzene 71-43-2 3.01E-01 EF Above-Average 20%

Formaldehyde 50-00-0 3.01E-01 EF Above-Average 20%Particulate matter N/A 4.01E-02 EF Above-Average 20%

Sulphur dioxide 7446-09-5 1.48E-01 EF Above-Average 20%Hydrogen sulphide 7783-06-4 6.12E-04 EF Above-Average 8%

S29Ammonia Scrubber

19.4 15 0.45 6 N/A Ammonia 7664-41-7 7.70E-01 EC Above-Average 100%

S30Ammonia Scrubber

29.4 15 0.45 6 N/A Ammonia 7664-41-7 0.00E+00 EC Above-Average <1%

S35 Plant Exhaust Air 2.3 20 0.41 8 N/A Hydrogen sulphide 7783-06-4 4.46E-03 EC Average 59%

Notes:"V-ST" - Validated Source Test, "ST" - Source Test, "EF" - Emission Factor, "MB" Mass Balance, "EC" - Engineering Calculation

Table 2a

Normal Operations Source Summary Table

Source Identifier Source Description

Source Parameters Emission Data

Made by: EKL

Checked by: KSAN:\Active\2011\1151\11-1151-0292 bioEnv-Biogas REA-Kawartha\Air-Noise\Air\Calculations\11-1151-0292 Calculations and Tables 16Mar12.xlsm

Page 3 of 10 Golder Associates

March 2012 11-1151-0292

Stack Volumetric

Flow Rate [Am³/s]

Stack Exit Gas

Temperature [°C]

Stack Inner

Diameter [m]

Stack Height

Above Grade [m]

Stack Height

Above Roof [m]Contaminant CAS No.

Maximum

Emission Rate

[g/s]

Emission

Estimating

Technique

Emissions Data

Quality

Percentage of

Overall Emissions

[%]S01 Emergency Flare 2.0 900 0.3 14 N/A Nitrogen oxides 10102-44-0 1.18E-01 EF Above-Average 6%

Carbon monoxide 630-08-0 1.44E-02 EF Above-Average 100%Sulphur dioxide 7446-09-5 2.39E-02 EF Above-Average 100%

Particulate matter N/A 2.21E-01 EF Above-Average 100%PAH as Benzo(a)pyrene 50-32-8 2.26E-05 EC Above-Average 100%

Hydrogen sulphide 7783-06-4 1.97E-02 EC Above-Average 82%

S02Ammonium

Sulphate TankN/A 25 N/A 6.3 N/A Ammonium sulphate 7783-20-2 1.10E-08 EC Above-Average 100%

S03 Sulphuric Acid Tank N/A 25 N/A 6.3 N/A Sulphuric acid 7664-93-9 1.53E-03 EC Above-Average 100%

S23 CHP Boiler 4 Stack 1.0 180 0.25 19 N/A Nitrogen oxides 10102-44-0 8.59E-01 EF Above-Average 47%

S28 CHP Boiler 5 Stack 1.0 180 0.25 19 N/A Nitrogen oxides 10102-44-0 8.59E-01 EF Above-Average 47%

S29Ammonia Scrubber

19.4 15 0.45 6 N/A Ammonia 7664-41-7 7.70E-01 EC Above-Average 100%

S30Ammonia Scrubber

29.4 15 0.45 6 N/A Ammonia 7664-41-7 0.00E+00 EC Above-Average <1%

S35 Plant Exhaust Air 2.3 20 0.41 8 N/A Hydrogen sulphide 7783-06-4 4.46E-03 EC Average 18%

Notes:"V-ST" - Validated Source Test, "ST" - Source Test, "EF" - Emission Factor, "MB" Mass Balance, "EC" - Engineering Calculation

Table 2b

Commissioning Operations Source Summary Table

Source Identifier Source Description

Source Parameters Emission Data

Made by: EKL

Checked by: KSAN:\Active\2011\1151\11-1151-0292 bioEnv-Biogas REA-Kawartha\Air-Noise\Air\Calculations\11-1151-0292 Calculations and Tables 16Mar12.xlsm

Page 4 of 10 Golder Associates

March 2012 11-1151-0292

Relevant Section of the Regulation Section TitleSummary of How the Approved Dispersion

Model Was Used

Location of Supporting

Documentation in ESDM Report

Section 8Negligible Sources of

Contaminants

Sources and contaminants that were considered

negligible were explicitly identified, and

therefore were not modelled in accordance with

s.8 of O.Reg.419/05.

Section 4.0, Table 1

Section 9 Same Structure Contamination

Not applicable as the Facility is the only tenant

occupying the site, and does not have a child

care facility, health care facility, senior's

residence, long-term care facility or an

education facility located at the on-site.

N/A

Section 10 Operating Conditions

All equipment in each modelling scenario was

assumed to be operating at the maximum

production rates, unless otherwise specified.

Section 5.0

Section 11Source of Contaminant Emission

Rates

The emission rate for each significant

contaminant emitted from a significant source

was estimated.

Section 5.0, Table 2

Section 12

Combined Effect of Assumptions

for Operating Conditions and

Emission Rates

The Operating Conditions were estimated in

accordance with s.10(1) 1 and s.11(1) 1 of

O.Reg.419/05 and are therefore considered to

result in the highest POI concentration that the

Facility is capable of for each contaminant

emitted.

Section 5.0

Section 13 Meteorological ConditionsMeteorological conditions were obtained for the

Ottawa, Peterborough and Belleville region from

the MOE website.

Section 7.0

Section 14Area of Modelling Coverage

(receptor locations)

Receptor grid was developed using the grid

density provided in s.14 of O.Reg.419/05.Section 7.0, Figure 6

Section 15Stack Height for Certain New

Sources of Contaminant

Building downwash accounted for using BPIP

pre-processor.Section 7.0

Section 16 Terrain DataTerrain data was assessed for sources and

receptors at the Facility using AERMAP.Section 7.0, Figure 5

Section 17 Averaging Periods

Maximum emission scenarios were developed

for 1-hour and 24-hour averaging periods. For

averaging periods less than 1-hr, POI

concentrations were adjusted using s.17.2 of

O.Reg.419/05.

Section 7.0

Dispersion Modelling Input Summary Table

Table 3

Made by: EKL

Checked by: KSAN:\Active\2011\1151\11-1151-0292 bioEnv-Biogas REA-Kawartha\Air-Noise\Air\Calculations\11-1151-0292 Calculations and Tables 16Mar12.xlsm

Page 5 of 10 Golder Associates

March 2012 11-1151-0292

Stack Height

Above Grade

[m]

Stack Exit Gas

Temperature

[K]

Stack Exit

Velocity [m/s]

Stack Inner

Diameter [m]

Stack

Volumetric

Flow Rate

[Am³/s]

X-coordinate Y-Coordinate

S08 CHP Boiler 1 Stack Point 19 453 40.9 0.25 2.0 275333 4924736 Nitrogen oxides 10102-44-0 1.00E+00 24

S08 Carbon monoxide 630-08-0 2.21E+00 24S08 VOCs as Benzene 71-43-2 3.01E-01 24S08 Formaldehyde 50-00-0 3.01E-01 24S08 Particulate matter N/A 4.01E-02 24S08 Sulphur dioxide 7446-09-5 1.48E-01 24S08 Hydrogen sulphide 7783-06-4 6.12E-04 24

S13 CHP Boiler 2 Stack Point 19 453 40.9 0.25 2.0 275333 4924735 Nitrogen oxides 10102-44-0 1.00E+00 24

S13 Carbon monoxide 630-08-0 2.21E+00 24S13 VOCs as Benzene 71-43-2 3.01E-01 24S13 Formaldehyde 50-00-0 3.01E-01 24S13 Particulate matter N/A 4.01E-02 24S13 Sulphur dioxide 7446-09-5 1.48E-01 24S13 Hydrogen sulphide 7783-06-4 6.12E-04 24

S18 CHP Boiler 3 Stack Point 19 453 40.9 0.25 2.0 275333 4924735 Nitrogen oxides 10102-44-0 1.00E+00 24

S18 Carbon monoxide 630-08-0 2.21E+00 24S18 VOCs as Benzene 71-43-2 3.01E-01 24S18 Formaldehyde 50-00-0 3.01E-01 24S18 Particulate matter N/A 4.01E-02 24S18 Sulphur dioxide 7446-09-5 1.48E-01 24S18 Hydrogen sulphide 7783-06-4 6.12E-04 24

S23 CHP Boiler 4 Stack Point 19 453 40.9 0.25 2.0 275332 4924735 Nitrogen oxides 10102-44-0 1.00E+00 24

S23 Carbon monoxide 630-08-0 2.21E+00 24S23 VOCs as Benzene 71-43-2 3.01E-01 24S23 Formaldehyde 50-00-0 3.01E-01 24S23 Particulate matter N/A 4.01E-02 24S23 Sulphur dioxide 7446-09-5 1.48E-01 24S23 Hydrogen sulphide 7783-06-4 6.12E-04 24

S28 CHP Boiler 5 Stack Point 19 453 40.9 0.25 2.0 275332 4924736 Nitrogen oxides 10102-44-0 1.00E+00 24

S28 Carbon monoxide 630-08-0 2.21E+00 24S28 VOCs as Benzene 71-43-2 3.01E-01 24S28 Formaldehyde 50-00-0 3.01E-01 24S28 Particulate matter N/A 4.01E-02 24S28 Sulphur dioxide 7446-09-5 1.48E-01 24S28 Hydrogen sulphide 7783-06-4 6.12E-04 24

S29Ammonia Scrubber

1Point 6 288 59.3 0.45 9.4 275392 4924762 Ammonia 7664-41-7 7.70E-01 24

Averaging Period

[hours]

Table 4a

Dispersion Modelling Source Summary Table

Source ID Source ID(s) Source Type

Modelling Source Data Emissions Data

Contaminant CAS No.Maximum Emission

Rate [g/s]

N:\Active\2011\1151\11-1151-0292 bioEnv-Biogas REA-Kawartha\Air-Noise\Air\Calculations\11-1151-0292 Calculations and Tables 16Mar12.xlsm

Page 6 of 10

Made by: EKL

Checked by: KSAGolder Associates

March 2012 11-1151-0292

Stack Height

Above Grade

[m]

Stack Exit Gas

Temperature

[K]

Stack Exit

Velocity [m/s]

Stack Inner

Diameter [m]

Stack

Volumetric

Flow Rate

[Am³/s]

X-coordinate Y-Coordinate

Averaging Period

[hours]

Table 4a

Dispersion Modelling Source Summary Table

Source ID Source ID(s) Source Type

Modelling Source Data Emissions Data

Contaminant CAS No.Maximum Emission

Rate [g/s]

S30Ammonia Scrubber

2Point 6 288 59.3 0.45 9.4 275396 4924763 Ammonia 7664-41-7 N/A 24

S35 Plant Exhaust Air Point 8 293 17.7 0.4064 2.3 275328 4924735 Hydrogen sulphide 7783-06-4 4.46E-03 24

Modelling ID Source ID(s) Source TypeBuilding Length

[m]

Release Height

[m]

Initial Lateral

Dimension [m]

Initial Vertical

Dimension [m]

Initial

Lateral

Dimension

[m]

X-coordinate Y-Coordinate Contaminant CAS No.Maximum Emission

Rate [g/s]

Averaging Period

[hours]

S02Ammonium

Sulphate TankVolume 4.5 6.3 1.05 2.93 1.05 275323 4924710 Ammonium sulphate 7783-20-2 1.10E-08 24

S03Sulphuric Acid

TankVolume 4.5 6.3 1.05 2.93 1.05 275324 4924703 Sulphuric acid 7664-93-9 1.53E-03 24

N:\Active\2011\1151\11-1151-0292 bioEnv-Biogas REA-Kawartha\Air-Noise\Air\Calculations\11-1151-0292 Calculations and Tables 16Mar12.xlsm

Page 7 of 10

Made by: EKL

Checked by: KSAGolder Associates

March 2012 11-1151-0292

Stack Height

Above Grade [m]

Stack Exit Gas

Temperature

[K]

Stack Exit

Velocity [m/s]

Stack Inner

Diameter [m]

Stack

Volumetric

Flow Rate

[Am³/s]

X-coordinate Y-Coordinate

S23 CHP Boiler 4 Stack Point 19 453 20.4 0.25 1.0 275332 4924735 Nitrogen oxides 10102-44-0 8.59E-01 24

S28 CHP Boiler 5 Stack Point 19 453 20.4 0.25 1.0 275332 4924736 Nitrogen oxides 10102-44-0 8.59E-01 24

S29 Ammonia Scrubber 1 Point 6 288 59.3 0.45 9.4 275392 4924762 Ammonia 7664-41-7 7.70E-01 24

S30 Ammonia Scrubber 2 Point 6 288 59.3 0.45 9.4 275396 4924763 Ammonia 7664-41-7 N/A 24

S35 Plant Exhaust Air Point 8 293 17.7 0.4064 2.3 275328 4924735 Hydrogen sulphide 7783-06-4 4.46E-03 24

Modelling ID Source ID(s) Source TypeBuilding Length

[m]

Release Height

[m]

Initial Lateral

Dimension [m]

Initial Vertical

Dimension [m]

Initial

Lateral

Dimension

[m]

X-coordinate Y-Coordinate Contaminant CAS No.Maximum Emission

Rate [g/s]

Averaging Period

[hours]

S02Ammonium Sulphate

TankVolume 4.5 6.3 1.0 2.9 1.05 275323 4924710 Ammonium sulphate 7783-20-2 1.10E-08 24

S03 Sulphuric Acid Tank Volume 4.5 6.3 1.0 2.9 1.05 275324 4924703 Sulphuric acid 7664-93-9 1.53E-03 24

Modelling ID Source ID(s) Source TypeStack Height

Above Grade [m]

Stack Exit Gas

Temperature

[K]

Stack Exit

Velocity [m/s]

Heat Release

[BTU/hr]

Radiation

Loss [%]X-coordinate Y-Coordinate Contaminant CAS No.

Maximum Emission

Rate [g/s]

Averaging Period

[hours]

S01 Emergency Flare Flare 14 1173 39.6 2.06E+07 50.0 275323 4924749 Nitrogen oxides 10102-44-0 1.18E-01 24S01 Carbon monoxide 630-08-0 1.44E-02 24S01 Sulphur dioxide 7446-09-5 2.39E-02 24S01 Particulate matter N/A 2.21E-01 24

S01PAH as

Benzo(a)pyrene50-32-8 2.26E-05 24

S01 Hydrogen sulphide 7783-06-4 1.97E-02 24

Source ID Source ID(s)

Table 4b

Commissioning Operations Dispersion Modelling Source Summary Table

Source Type

Modelling Source Data Emissions Data

Contaminant CAS No.Maximum Emission

Rate [g/s]

Averaging Period

[hours]

N:\Active\2011\1151\11-1151-0292 bioEnv-Biogas REA-Kawartha\Air-Noise\Air\Calculations\11-1151-0292 Calculations and Tables 16Mar12.xlsm

Page 8 of 10

Made by: EKL

Checked by: KSAGolder Associates

March 2012 11-1151-0292

Contaminant CAS No.

Total Facility

Emission Rate

[g/s]

Air Dispersion

Model Used

Maximum POI

Concentration

[µg/m³]

Averaging

Period [hours]

MOE POI Limit

[µg/m³]Limiting Effect

Regulation Schedule

No.

Percentage of MOE

Limit [%]

Ammonia 7664-41-7 7.70E-01 AERMOD 8.63E+01 24 100 Health Schedule 3 86%

Ammonium sulphate 7783-20-2 1.10E-08 AERMOD 2.00E-05 24 20 — JSL Below JSL

Carbon monoxide 630-08-0 1.10E+01 AERMOD 9.63E+02 ½ 6000 Health Schedule 3 16%

Formaldehyde 50-00-0 1.50E+00 AERMOD 4.63E+01 24 65 Health Schedule 3 71%

Hydrogen sulphide 7783-06-4 7.52E-03 AERMOD 1.74E+00 24 7 Health Schedule 3 25%

Hydrogen sulphide 7783-06-4 7.52E-03 AERMOD 8.69E+00 10-min 13 Odour Schedule 3 67%

Nitrogen oxides 10102-44-0 5.02E+00 AERMOD 1.54E+02 24 200 Health Schedule 3 77%

Nitrogen oxides 10102-44-0 5.02E+00 AERMOD 3.63E+02 1 400 Health Schedule 3 91%

Particulate matter N/A 2.01E-01 AERMOD 6.16E+00 24 120 Visibility Schedule 3 5%

Sulphur dioxide 7446-09-5 7.42E-01 AERMOD 2.28E+01 24 275 Health & Vegetation Schedule 3 8%

Sulphur dioxide 7446-09-5 7.42E-01 AERMOD 5.37E+01 1 690 Health & Vegetation Schedule 3 8%

Sulphuric acid 7664-93-9 1.53E-03 AERMOD 2.38E+00 24 5 Health Schedule 3 48%

VOCs as Benzene 71-43-2 1.50E+00 AERMOD 4.63E+01 24 100 — Schedule 6 Below URT

Table 5a

Normal Operations Emission Summary Table

Made By: EKL Checked By: KSA

N:\Active\2011\1151\11-1151-0292 bioEnv-Biogas REA-Kawartha\Air-Noise\Air\Calculations\11-1151-0292 Calculations and Tables 16Mar12.xlsm

Page 9 of 10 Golder Associates

March 2012 11-1151-0292

Contaminant CAS No.

Total Facility

Emission Rate

[g/s]

Air Dispersion

Model Used

Maximum POI

Concentration

[µg/m³]

Averaging

Period [hours]

MOE POI Limit

[µg/m³]Limiting Effect

Regulation Schedule

No.

Percentage of MOE

Limit [%]

Ammonia 7664-41-7 7.70E-01 AERMOD 8.66E+01 24 100 Health Schedule 3 87%

Ammonium sulphate 7783-20-2 1.10E-08 AERMOD 2.00E-05 24 20 — JSL Below JSL

Carbon monoxide 630-08-0 1.44E-02 AERMOD 1.73E+00 ½ 6000 Health Schedule 3 <1%

Hydrogen sulphide 7783-06-4 2.42E-02 AERMOD 1.97E+00 24 7 Health Schedule 3 28%

Hydrogen sulphide 7783-06-4 2.42E-02 AERMOD 8.69E+00 10-min 13 Odour Schedule 3 67%

Nitrogen oxides 10102-44-0 1.83E+00 AERMOD 1.85E+02 1 400 Health Schedule 3 46%

Nitrogen oxides 10102-44-0 1.83E+00 AERMOD 6.57E+01 24 200 Health Schedule 3 33%

PAH as Benzo(a)pyrene 50-32-8 2.26E-05 AERMOD 9.60E-04 24 0.0011 Health Guideline 87%

Particulate matter N/A 2.21E-01 AERMOD 1.11E+01 24 120 Visibility Schedule 3 9%

Sulphur dioxide 7446-09-5 2.39E-02 AERMOD 1.20E+00 24 275 Health & Vegetation Schedule 3 <1%

Sulphur dioxide 7446-09-5 2.39E-02 AERMOD 2.40E+00 1 690 Health & Vegetation Schedule 3 <1%

Sulphuric acid 7664-93-9 1.53E-03 AERMOD 2.38E+00 24 5 Health Schedule 3 48%

Table 5b

Commissioning Operations Emission Summary Table

Made By: EKL Checked By: KSA

N:\Active\2011\1151\11-1151-0292 bioEnv-Biogas REA-Kawartha\Air-Noise\Air\Calculations\11-1151-0292 Calculations and Tables 16Mar12.xlsm

Page 10 of 10 Golder Associates

EMISSION SUMMARY AND DISPERSION MODELLING REPORT

March 2012 Report No. 11-1151-0292

FIGURES

!

!

!

!

!

!

!

!

!

!

!!

!

!!

!

!!

!

!

!

!

BE

LM

ON

T TO

WN

SH

IP 6T

H L

INE

HWY 7

HWY 7

CO

UN

TY

RD

50

Preneveau

1

2

3

4

5

6

78

9

10

1112

13

14

274500

274500

275000

275000

275500

275500

276000

276000

4924

500

4924

500

4925

000

4925

000

G:\P

roje

cts\

2011

\11-

115

1-02

92_

Ka

war

tha_

Bio

Gas

\GIS

\MX

Ds\

Rep

ortin

g\A

ir\S

ite_L

oca

tion.

mxd

³LEGEND

Base Data - MNR NRVIS, obtained 2004, CANMAP v2006.4Produced by Golder Associates Ltd under licence from Ontario Ministry of Natural Resources, © Queens Printer 2008Projection: Transverse Mercator Datum: NAD 83 Coordinate System: UTM Zone 18

REV. 0.0

Mississauga, Ontario

DESIGN

SITE LOCATION PLAN

FIGURE: 1

PROJECT NO. 11-1151-0292 SCALE AS SHOWN

PROJECT

TITLE

GIS

REVIEW

KD 23 Nov. 2011

CHECK

RENEWABLE ENERGY APPROVAL

KAWARTHA BIOGAS FACILITY

KD 1 Feb. 2012

EKL

EKL

1 Feb. 2012

1 Feb. 2012

!.

!.

!.

!.

!.

!. !.

!.

!.

!.

!.

!.

!.

!.

!.

!.

!.

!.

!.

!.!.

!.

!.!.

!.

!.

!.

HIGHWAY 7

HIGHWAY 7

Marmora

Havelock

Norwood

TrentRiver

AllanMills

AshbyMill Blairton

Connellys

CroweBridge

Rockdale

Woodland

Bonarlaw

CentreDummer

ChaseCorners

Cottesloe

FreemanCorners

Healey Falls

Preneveau

RushPoint

SpringBrookStanwood

Deloro

RylstoneSouthDummer

Kellers

BlairtonStation

MarmoraStation

REFERENCE

INDEX MAP

SCALE

Study Area

1:5,000

100 0 100 200 30050

METERS

Site Boundary Point

Roads

Railways

! ! Utility Line

Watercourse

Proposed Building

Site Boundary

Id Easting Northing

1 275374.4 4924843.2

2 275423.5 4924870.4

3 275440.3 4924891.9

4 275496.6 4924848.1

5 275504.2 4924826.5

6 275510.4 4924790.0

7 275501.2 4924763.0

8 275504.2 4924746.3

9 275464.7 4924674.2

10 275458.9 4924640.1

11 275460.4 4924625.7

12 275458.3 4924593.9

13 275326.6 4924570.1

14 275295.9 4924740.3

SITE BOUNDARY POINT COORDINATES

DRAWING NUMBER

APPROVED:

CHECKED:

NUM

REV

DRAWN:

DESIGNED:

DESCRIPTION CHK'D DATE

BY

PROJECT NO.:

DRWN

BY

10 1/2

ATTENTION:

IF THIS BAR DOES NOT

MEASURE 1" @ 22x34 or

1

2

" @ 11x17, THEN

DRAWING IS NOT TO

SCALE - SCALE

ACCORDINGLY

SCALE:

PURENERGY PROJECT

CANADA, NA

ANAERGIA

NOV. 2011

311210003

REV

1

A

B

C

D

E

F

G

H

I

J

A

B

C

D

E

F

G

H

I

J

234678910111213141516

12345678910111213141516

A

B1.0BLOCK DIAGRAM

NTS

A.K.

WBL

TANKER

RECEIPTION

ANAEROBIC

DIGESTERS

(4 UNITS)

REJECTS

DEWATERED

SOLIDS

FLARE

(1 UNITS)

TREATED

EFFLUENT

RECEPTION TANKS

(3 UNITS)

ELECTRICITY

COMBINED

HEAT &

POWER UNIT

(5 UNITS)

HOT WATER

SUPPLY

CONDENSATE

HOT WATER

RETURN

SOLIDS

SEPERATION

(3 UNITS)

DUMP TRUCK

RECEIPTION

DISPOSE

OFF SITE

PRETREATMENT

GAS

DRYING

(1 UNIT)

DESULPHERIZATION

(1 UNIT)

SERVICE BOXES

HYDRAULIC

MIXERS

BY PRODUCT

VENT TO

ATMOSPHERE

AMMONIUM SULPHATE

STORAGE

(1 UNIT)

AMMONIA

STRIPPER

(2 UNITS)

DE AMMONIFIED EFFLUENT

(RECYCLED)

AMMONIA

SCRUBBER

(2 UNITS)

CENTRIFUGAL

BLOWER

CHEMICAL

RECEIPTION

SULPHURIC ACID

STORAGE

DRY SOLIDS

RECEIPTION

SYRUP AND

DWG

#1

#2

#3 #4

HEAT EXCHANGER

#5 #6 #7 #8

BUFFER TANK

WWTP

DRY SOLIDS

STORAGE

BLOWER

HOT WATER LOOP

DE AMMONIFIED

EFFLUENT /

DILUTION TANK

(1 UNIT)

GRID

INTERCONNECTION

AIR

COMBINATION AIR FOR CHP

TO

DESULPHURIZATION

TO AMMONIA

RECOVERY

POLYMER

DOSING

STEAM

BOILER

STEAM

!.!.

!.!.!.!.!.!.

!.

�)

�)

DMSRL1 LR

CHP

SRL2

SS

WTT2

WTT1

RT1RT2

DWRT3

BT

D2B

D2A

D4B

D4A

D1B

D1A

D3B

D3A

SRLT

3029

2

3

1823

28

81335

1

275300

275300

275400

275400

275500

275500

4924

60 0

4924

600

4924

700

4924

700

4924

800

4924

800

G:\P

roje

cts\

2011

\11-

115

1-02

92_

Ka

war

tha_

Bio

Gas

\GIS

\MX

Ds\

Rep

ortin

g\A

ir\R

oof_

Lay

out.m

xd

³LEGEND

Base Data - MNR NRVIS, obtained 2004, CANMAP v2006.4Produced by Golder Associates Ltd under licence from Ontario Ministry of Natural Resources, © Queens Printer 2008Projection: Transverse Mercator Datum: NAD 83 Coordinate System: UTM Zone 18

REV. 0.0

Mississauga, Ontario

DESIGN

ROOF LAYOUT

FIGURE: 3

PROJECT NO. 11-1151-0292 SCALE AS SHOWN

PROJECT

TITLE

GIS

REVIEW

KD 23 Nov. 2011

CHECK

RENEWABLE ENERGY APPROVAL

KAWARTHA BIOGAS FACILITY

KD 22 Feb. 2012

EKL

EKL

22 Feb. 2012

22 Feb. 2012

!.

!.

!.

!.

!.

!. !.

!.

!.

!.

!.

!.

!.

!.

!.

!.

!.

!.

!.

!.!.

!.

!.!.

!.

!.

!.

HIGHWAY 7

HIGHWAY 7

Marmora

Havelock

Norwood

TrentRiver

AllanMills

AshbyMill Blairton

Connellys

CroweBridge

Rockdale

Woodland

Bonarlaw

CentreDummer

ChaseCorners

Cottesloe

FreemanCorners

Healey Falls

Preneveau

RushPoint

SpringBrookStanwood

Deloro

RylstoneSouthDummer

Kellers

BlairtonStation

MarmoraStation

REFERENCE

INDEX MAP

SCALE

Study Area

1:1,000

20 0 20 40 6010

METRES

!. Point Source

�) Volume Source

Roads

Railways

Site Boundary

!.!.!.!.!.

!.

!.

182328

813

35

1

!

!

!

!

!

!

!

!

!

!

!

!

!

!

!

!

!

!

!

!!

!

!

!

!

!

!

!

!

!

!

!

!

!

!

!

!

!

!

!

!

!

!

!

!

!

!

!

!!

!

!

!

!

!

!

!

!

!

!

!

!

!

!

!

!

!

!

!

!

!

COUNTY RD 48

HWY 7

BE

LM

ON

T TO

WN

SH

IP 6T

H L

INE

BE

LM

ON

T TO

WN

SH

IP 6T

H L

INE

HWY 7

MID

BE

LM

ON

T TO

WN

SH

IP 7T

H L

INE

BE

LMO

NT

TOW

NS

HIP

3RD

LIN

E

BE

LM

ON

T TO

WN

SH

IP 6T

H L

INE

S B

EL

MO

NT

TOW

NS

HIP

7TH

LIN

E

CO

UN

TY

RD

50

BE

LMO

NT

TOW

NS

HIP

4TH

LINE

PreneveauBlairtonStation

273000

273000

274000

274000

275000

275000

276000

276000

277000

277000

278000

278000

279000

279000

4922

000

4922

000

4923

000

4923

000

4924

000

4924

000

4925

000

4925

000

4926

000

4926

000

G:\P

roje

cts\

2011

\11-

115

1-02

92_

Ka

war

tha_

Bio

Gas

\GIS

\MX

Ds\

Rep

ortin

g\A

ir\L

and_

Use

_Zon

ing.

mxd

³LEGEND

Base Data - MNR NRVIS, obtained 2004, CANMAP v2006.4Produced by Golder Associates Ltd under licence from Ontario Ministry of Natural Resources, © Queens Printer 2008Projection: Transverse Mercator Datum: NAD 83 Coordinate System: UTM Zone 18Zoning data obtained from The Township ofHavelock-Belmont-Methuen

REV. 0.0

Mississauga, Ontario

DESIGN

LAND USE ZONING DESIGNATION PLAN

FIGURE: 4

PROJECT NO. 11-1151-0292 SCALE AS SHOWN

PROJECT

TITLE

GIS

REVIEW

KD 23 Nov. 2011

CHECK

RENEWABLE ENERGY APPROVAL

KAWARTHA BIOGAS FACILITY

KD 1 Feb. 2012

EKL

EKL

1 Feb. 2012

1 Feb. 2012

!.

!.

!.

!.

!.

!. !.

!.

!.

!.

!.

!.

!.

!.

!.

!.

!.

!.

!.

!.!.

!.

!.!.

!.

!.

!.

HIGHWAY 7

HIGHWAY 7

Marmora

Havelock

Norwood

TrentRiver

AllanMills

AshbyMill Blairton

Connellys

CroweBridge

Rockdale

Woodland

Bonarlaw

CentreDummer

ChaseCorners

Cottesloe

FreemanCorners

Healey Falls

Preneveau

RushPoint

SpringBrookStanwood

Deloro

RylstoneSouthDummer

Kellers

BlairtonStation

MarmoraStation

REFERENCE

INDEX MAP

SCALE

Study Area

1:20,000

0.5 0 0.5 10.25

KILOMETERS

Roads

Railways

Site Boundary

!

!

!

!

!

!

!

!

!

!

!

!

!

!

!

!

!

!

!

!!

!

!

!

!

!

!

!

!

!

!

!

!

!

!

!

!

!

!

!

!

!

!

!

!

!

!

!

!!

!

!

!

!

!

!

!

!

!

!

!

!

!

!

!

!

!

!

!

!

!

COUNTY RD 48

HWY 7

BE

LM

ON

T TO

WN

SH

IP 6T

H L

INE

BE

LM

ON

T TO

WN

SH

IP 6T

H L

INE

HWY 7

MID

BE

LM

ON

T TO

WN

SH

IP 7T

H L

INE

BE

LMO

NT

TOW

NS

HIP

3RD

LIN

E

BE

LM

ON

T TO

WN

SH

IP 6T

H L

INE

S B

EL

MO

NT

TOW

NS

HIP

7TH

LIN

E

CO

UN

TY

RD

50

BE

LMO

NT

TOW

NS

HIP

4TH

LINE

PreneveauBlairtonStation

273000

273000

274000

274000

275000

275000

276000

276000

277000

277000

278000

278000

279000

279000

4922

000

4922

000

4923

000

4923

000

4924

000

4924

000

4925

000

4925

000

4926

000

4926

000

G:\P

roje

cts\

2011

\11-

115

1-02

92_

Ka

war

tha_

Bio

Gas

\GIS

\MX

Ds\

Rep

ortin

g\A

ir\T

erra

in_E

leva

tions

.mxd

³LEGEND

Base Data - MNR NRVIS, obtained 2004, CANMAP v2006.4Produced by Golder Associates Ltd under licence from Ontario Ministry of Natural Resources, © Queens Printer 2008Projection: Transverse Mercator Datum: NAD 83 Coordinate System: UTM Zone 18

REV. 0.0

Mississauga, Ontario

DESIGN

TERRAIN ELEVATIONS

FIGURE: 5

PROJECT NO. 11-1151-0292 SCALE AS SHOWN

PROJECT

TITLE

GIS

REVIEW

KD 23 Nov. 2011

CHECK

RENEWABLE ENERGY APPROVAL

KAWARTHA BIOGAS FACILITY

KD 1 Feb. 2012

EKL

EKL

1 Feb. 2012

1 Feb. 2012

!.

!.

!.

!.

!.

!. !.

!.

!.

!.

!.

!.

!.

!.

!.

!.

!.

!.

!.

!.!.

!.

!.!.

!.

!.

!.

HIGHWAY 7

HIGHWAY 7

Marmora

Havelock

Norwood

TrentRiver

AllanMills

AshbyMill Blairton

Connellys

CroweBridge

Rockdale

Woodland

Bonarlaw

CentreDummer

ChaseCorners

Cottesloe

FreemanCorners

Healey Falls

Preneveau

RushPoint

SpringBrookStanwood

Deloro

RylstoneSouthDummer

Kellers

BlairtonStation

MarmoraStation

REFERENCE

INDEX MAP

SCALE

Study Area

1:20,000

0.5 0 0.5 10.25

KILOMETERS

Roads

Railways

! ! Utility Line

Watercourse

Waterbody

Site Boundary

Elevation (masl)High : 261

Low : 157

!.

!.

!.

!.

!.

!.

!.

!.

!.

F R

26A

BROWNS LINE RD

TR

ILL

IUM

DR

CO

UN

TY

RD

46

CO

NC

ST

GEORGE ST EOA

K S

T

LK

RD

FR 36

MA

RY

ST

ALMAC DR

FR

31

FR 2

7A

FR 31G

HEMLOC K LANE

OTTAWA ST W

FR 31A

OLD NORWOOD RD

WE

LLE

R R

D

FR 33

CH

UR

CH

ST

SEY

MO

UR

ST

CH

AN

DO

S S

T

ME

THU

EN S

T

OTTAWA ST E

MCLEAN AVE

CO

UN

TY

RD

50

CHURCH RD

POMER OY DR

FR 1

FR

34

HWY 7

TIM

BE

RL

AN

D D

R

14TH LINE E

VIE

WM

OU

NT

AVE

ROUND LK RD

FR 53

MI L

E O

F ME

MO

RIE

S R

D

COUNTY RD 42

COOK

RD

BE

LMO

NT

TOW

NS

HIP

2ND

LINE

FR 28

BE

LMO

NT

TOW

NS

HIP

6TH

LIN

E

13TH LINE E

HWY 7

CR

OW

E R

IVE

R R

D

COLE RD

EV

ER

GR

EE

N

RD

BE

LM

ON

T T

OW

NS

HIP

3RD

LIN

E

CO

UN

TY

RD

30

S B

EL

MO

NT

TO

WN

SH

IP 7T

H L

INE

BE

LM

ON

T TOW

NS

HIP 2N

D L

INE

BE

LMO

NT

TOW

NS

HIP

4TH LIN

E

FR 2

CO

UN

TY R

D 48

CO

UN

TY

RD

48

DEWEY RD

FR

AN

KL

IN R

D

FR 31F

WA

DE

RD

FR 26

FR

26

FR

37

FR

3A

FR

3 1B

FR 26F

FR 3

CO

NC

8 B

EL

MO

NT

TOW

NS

HIP

LK S

T

FR 30

SAW

MIL

L B

AY

RD

BIG

ISLA

ND

RD

FR 27

TE

RR

RD

BLA

IRTO

N R

D

FR

5

Havelock

AshbyMill

Blairton

ChaseCorners

FreemanCorners

Preneveau

RushPoint

BlairtonStation

270000

270000

271000

271000

272000

272000

273000

273000

274000

274000

275000

275000

276000

276000

277000

277000

278000

278000

279000

279000

280000

280000

281000

281000

4920

000

4920

000

4921

000

4921

000

4922

000

4922

000

4923

000

4923

000

4924

000

4924

000

4925

000

4925

000

4926

000

4926

000

4927

000

4927

000

4928

000

4928

000

4929

000

4929

000

G:\P

roje

cts\

2011

\11-

115

1-02

92_

Ka

war

tha_

Bio

Gas

\GIS

\MX

Ds\

Rep

ortin

g\A

ir\D

ispe

rsio

n_M

odel

ling.

mxd

³LEGEND

Base Data - MNR NRVIS, obtained 2004, CANMAP v2006.4Produced by Golder Associates Ltd under licence from Ontario Ministry of Natural Resources, © Queens Printer 2008Projection: Transverse Mercator Datum: NAD 83 Coordinate System: UTM Zone 18

REV. 0.0

Mississauga, Ontario

DESIGN

DISPERSION MODELLING RECEPTORS

FIGURE: 6

PROJECT NO. 11-1151-0292 SCALE AS SHOWN

PROJECT

TITLE

GIS

REVIEW

KD 23 Nov. 2011

CHECK

RENEWABLE ENERGY APPROVAL

KAWARTHA BIOGAS FACILITY

KD 1 Feb. 2012

EKL

EKL

1 Feb. 2012

1 Feb. 2012

!.

!.

!.

!.

!.

!. !.

!.

!.

!.

!.

!.

!.

!.

!.

!.

!.

!.

!.

!.!.

!.

!.!.

!.

!.

!.

HIGHWAY 7

HIGHWAY 7

Marmora

Havelock

Norwood

TrentRiver

AllanMills

AshbyMill Blairton

Connellys

CroweBridge

Rockdale

Woodland

Bonarlaw

CentreDummer

ChaseCorners

Cottesloe

FreemanCorners

Healey Falls

Preneveau

RushPoint

SpringBrookStanwood

Deloro

RylstoneSouthDummer

Kellers

BlairtonStation

MarmoraStation

REFERENCE

INDEX MAP

SCALE

Study Area

1:40,000

0.5 0 0.5 1 1.5 20.25

KILOMETERS

Receptors

Roads

Railways

Watercourse

Watercourse, Intermittent

Waterbody

Site Boundary

DM

SRL1LRCHP

SRL2

SS

WTT2

WTT1

RT1

RT2DW

RT3

BT

D2B

D2A

D4B

D4A

D1B

D1A

D3B

D3A

SRLT

275300

275300

275400

275400

275500

275500

49

24

60

0

49

24

60

0

49

24

70

0

49

24

70

0

49

24

80

0

49

24

80

0

G:\

Pro

jects

\20

11\1

1-1

15

1-0

29

2_

Ka

wa

rth

a_

Bio

Ga

s\G

IS\M

XD

s\R

ep

ort

ing

\Air

\Bu

ildin

g_

Do

wn

wa

sh

_P

lan

.mxd

³LEGEND

Base Data - MNR NRVIS, obtained 2004, CANMAP v2006.4

Produced by Golder Associates Ltd under licence from

Ontario Ministry of Natural Resources, © Queens Printer 2008

Projection: Transverse Mercator Datum: NAD 83 Coordinate System: UTM Zone 18

REV. 0.0

Mississauga, Ontario

DESIGN

BUILDING DOWNWASH PLAN

FIGURE: 7

PROJECT NO. 11-1151-0292 SCALE AS SHOWN

PROJECT

TITLE

GIS

REVIEW

KD 23 Nov. 2011

CHECK

RENEWABLE ENERGY APPROVAL

KAWARTHA BIOGAS FACILITY

KD 22 Feb. 2012

EKL

EKL

22 Feb. 2012

22 Feb. 2012

!.

!.

!.

!.

!.

!. !.

!.

!.

!.

!.

!.

!.

!.

!.

!.

!.

!.

!.

!.!.

!.

!.!.

!.

!.

!.

HIGHWAY 7

HIGHWAY

7

Marmora

Havelock

Norwood

TrentRiver

AllanMills

AshbyMill Blairton

Connellys

CroweBridge

Rockdale

Woodland

Bonarlaw

CentreDummer

ChaseCorners

Cottesloe

FreemanCorners

Healey Falls

Preneveau

RushPoint

Spring

BrookStanwood

Deloro

Rylstone

SouthDummer

Kellers

BlairtonStation

MarmoraStation

REFERENCE

INDEX MAP

SCALE

Study Area

1:1,000

20 0 20 40 6010

METRES

Roads

Railways

Virtual Source

Site Boundary

Building ID Height Above Grade [m]

BT 9.3

CHP 7

D1A 9.3

D1B 7.3

D2A 9.3

D2B 7.3

D3A 9.3

D3B 7.3

D4A 9.3

D4B 7.3

DM 8

DW 9

RT1 9

RT2 9

RT3 9

SRL1 10

SRL2 6

SLRT 17

SS 6

WTT1 7

WTT2 7

EMISSION SUMMARY AND DISPERSION MODELLING REPORT

March 2012 Report No. 11-1151-0292

APPENDIX A Emission Rate Calculations

March 2012 11-1151-0292

Source Number Source 01

Source Name Emergency Flare

Source Description

Operating Rate

Biogas fuel consumption rate = 935 Nm³/hFlare Removal Efficiency = 98%H2S concentration in biogas = 2500 ppmMolecular Weight of H2S = 34.08 g/mol

Sample Calculation Biogas CombustionNitrogen oxides = 4.53E-04 kg 935 Nm³ 1 hr 1000 g

m³ hr engine 3600 s 1 kgNitrogen oxides = 0.12 g

s

Hydrogen Sulfide = 2500 ppm 1 mol K 101325 N 1 34.08 g1.00E+06 8.314 N m m² 273.15 K mol

Hydrogen Sulfide = 3.80 gmn³

Hydrogen Sulfide = 3.80 g 935 mn³ 1 hr 100% - 98%mn³ hr 3600 s

Hydrogen Sulfide = 1.97E-02 gs

Source ID Contaminant CAS NumberEmission

Factor

[kg/m³]

Concentration [ppm]Destruction

Efficiency

Emission Rate

[g/s]MOE Data

Quality

Nitrogen oxides 10102-44-0 4.53E-04 — — 1.18E-01 Above-Average

Carbon monoxide 630-08-0 5.56E-05 — — 1.44E-02 Above-Average

Sulphur dioxide 7446-09-5 9.21E-05 — — 2.39E-02 Above-Average

Particulate matter N/A 8.49E-04 — — 2.21E-01 Above-Average

PAH as Benzo(a)pyrene 50-32-8 8.71E-06 — 99% 2.26E-05 Above-Average

Hydrogen sulphide 7783-06-4 — 2500 98% 1.97E-02 Above-Average

The emission rates for the emergency flare were calculated using emission factors obtained from Environment Canada's biogas flaring emissions estimation tool.

The emergency flare is designed for 100% capacity (replacement of all 5 engines). Most likely, the emergency flare will only operate during maintenance operations or during

emergency situations. These scenarios have not been modelled as maintenance or emergencies are not long term events.

The flare will also operate during commissioning operations that will last approximately 2 months. during this time, the flare will burn off approximately 935 Nm³/hr of biogas or 25%

of the total plant capacity.

It is assumed that 98% of the untreated biogas is removed during combustion, with 2% of the compounds being emitted. It is assumed that 98% of the hydrogen sulphide in the

biogas is destroyed by the flaring process and that 99% of the PAHs would be destroyed by the flaring process.

The biogas plant contains an emergency flare which may be fired with untreated biogas during process upset conditions. The untreated biogas may contain hydrogen sulfide.

S01

Made by: JLK

Checked by: EKLN:\Active\2011\1151\11-1151-0292 bioEnv-Biogas REA-Kawartha\Air-Noise\Air\Calculations\11-1151-0292 Calculations and Tables 16Mar12.xlsm

Page 1 of 8 Golder Associates

March 2012 11-1151-0292

Source Number Source 02

Source Name Ammonium Sulphate Tank

Source Description

Operating Rate

Maximum tank storage capacity = 100,800.00 LTank Storage Temperature = 25 °C

298 KFilling Frequency = 22 fills per weekFilling Rate = 2 m³/hr

0.56 L/sSample Calculation Tank Filling Emissions for One Tank

ammonium sulphate = 3.35E-05 mm Hg 0.08 (mole fraction) 0.56 L 132.14 g 1 mol·K 1 101.3 kPa

s mol 8.314 kPa·L 298 K 760 mm Hgammonium sulphate = 1.10E-08 g

s

Source ID ContaminantCAS

Number

Saturated

Vapour

Pressure

[mm Hg]

Molecular

Weight

[g/mol]

Percent by

Weight

[%]

Moles

Contaminant

/kg Solvent

[g/mol]

Vapour

Mole

Fraction

Maximum

Hourly

Emission

Rate [g/s]

US EPA

Emission

Factor

Rating

MOE Data

Quality

S02 Water 7732-18-5 24.0 18.02 60%0.033

0.92 3.53 N/AAbove-

AverageS02 Ammonium sulphate 7783-20-2 3.35E-05 132.14 40% 0.00303 0.08 1.10E-08 N/A Above-Average

The biogas plant contains three ammonium sulphate storage tanks. The ammonium sulphate is one of two effluent streams from the ammonia scrubbers and will be

sold as a commidity to a third party.

The emissions are calculated using the AWMA "Vapour Emissions from a Solvent Waste Storage Tank" (December 2008) as part of Ontario Air and Noise Best

Practices.

Made by: JLK

Checked by: EKLN:\Active\2011\1151\11-1151-0292 bioEnv-Biogas REA-Kawartha\Air-Noise\Air\Calculations\11-1151-0292 Calculations and Tables 16Mar12.xlsm

Page 2 of 8 Golder Associates

March 2012 11-1151-0292

Source Number Source 03

Source Name Sulphuric Acid Tank

Source Description

Operating Rate

Maximum tank storage capacity = 100,800 LTank Storage Temperature = 25 °C

298 KFilling Frequency = 1 fill per day or 1 hour per dayFilling Rate = 25 m³/hr Where does this rate come from (pretty high)

6.94 L/s

Sample Calculation Tank Filling Emissions for One Tank

sulphuric acid = 1.00E+00 mm Hg 1.00 (mole fraction) 6.94 L 98.08 g 1 mol·K 1 101.3 kPa 1 hr

s mol 8.314 kPa·L 298 K 760 mm Hg 24 hrsulphuric acid = 1.53E-03 g

s

Source ID ContaminantCAS

Number

Saturated

Vapour

Pressure

[mm Hg]

Molecular

Weight

[g/mol]

Percent by

Weight

[%]

Moles

Contaminant

/kg Solvent

[g/mol]

Vapour

Mole

Fraction

Maximum

Hourly

Emission

Rate [g/s]

MOE Data

Quality

S03 Sulphuric acid 7664-93-9 1.00E+00 98.08 100% 0.010 1.00 1.53E-03 Above-Average

The biogas plant contains one sulphuric acid storage tank. The sulphuric acid is used in the counter flow ammonia scrubbers.

The emissions are calculated using the AWMA "Vapour Emissions from a Solvent Waste Storage Tank" (December 2008) as part of Ontario Air and Noise Best

Practices.

Made by: JLK

Checked by: EKLN:\Active\2011\1151\11-1151-0292 bioEnv-Biogas REA-Kawartha\Air-Noise\Air\Calculations\11-1151-0292 Calculations and Tables 16Mar12.xlsm

Page 3 of 8 Golder Associates

March 2012 11-1151-0292

Source Number Source 8, 13, 18, 23, and 28

Source Name Combined Heat and Power Engines

Source Description

Operating Rate

Exhaust gas volume dry = 7222 mn³/h (per engine)

Compound Emissions [mg/mn³]NOX 500CO 1100

VOCs 150HCHO 150

PM 20

PM2.5 15

PM10 20

SO2 74

Biogas fuel per engine = 725 m³/hrHydrogen sulphide concentration in biogas 200 ppmMolecular Weight of H2S = 34.08 g/molFlare Removal Efficiency = 99%

Sample Calculation Biogas CombustionNitrogen oxides = 500.000 mg 7222 mn³ 1 hr 1 g

mn³ hr 3600 s 1000 mgNitrogen oxides = 1.003 g

s

Hydrogen Sulfide = 200 ppm 1 mol K 101325 N 1 34.08 g1.00E+06 8.314 N m m² 273.15 K mol

Hydrogen Sulfide = 0.30 gmn³

Hydrogen Sulfide = 0.30 g 725 mn³ 1 hr 100% - 99%mn³ hr 3600 s

Hydrogen Sulfide = 6.12E-04 gs

The biogas plant contains five combined heat and power engines which may be fired with either natural gas or biogas. The facility will have a nameplate capacity

of 9.8 MW of power fuelled by a maximum biogas production of 3625 m³/hr.

The emission rates for the biogas fired engines were calculated using manufacturer's specifications for the MWM engine (model number TCG 2020 V 20) provide

in Appendix B - Supporting Information for Emission Rate Calculations. Normal operations include all five engines operating simultaneously. The biogas

produced by the digestion process is evenly divided between the five engines.

The emission rate for PM10 is used as a subsitute for total particulate matter, as a value is not available. It is assumed that 99% of the hydrogen sulphide in the

biogas is destroyed by the combustion process.

Made by: JLK

Checked by: EKLN:\Active\2011\1151\11-1151-0292 bioEnv-Biogas REA-Kawartha\Air-Noise\Air\Calculations\11-1151-0292 Calculations and Tables 16Mar12.xlsm

Page 4 of 8 Golder Associates

March 2012 11-1151-0292

Source ID Contaminant CAS NumberExhaust

Flow Rate

[mn³/h]

Emission

Factor

[mg/mn³]

Emission

Rate [g/s]

MOE Data

Quality

Nitrogen oxides 10102-44-0 500 1.00E+00 Above-AverageCarbon monoxide 630-08-0 1100 2.21E+00 Above-AverageVOCs as Benzene 71-43-2 150 3.01E-01 Above-AverageFormaldehyde 50-00-0 150 3.01E-01 Above-AverageParticulate matter N/A 20 4.01E-02 Above-Average

Sulphur dioxide 7446-09-5 74 1.48E-01 Above-Average

Hydrogen sulphide 7783-06-4 N/A 6.12E-04 Above-Average

Note: VOCs are NMHC (non-methane hydrocarbons)

8

13

18

23

28 7,222

7,222

7,222

7,222

7,222

Made by: JLK

Checked by: EKLN:\Active\2011\1151\11-1151-0292 bioEnv-Biogas REA-Kawartha\Air-Noise\Air\Calculations\11-1151-0292 Calculations and Tables 16Mar12.xlsm

Page 5 of 8 Golder Associates

March 2012 11-1151-0292

Source Number Source 29 and 30

Source Name Ammonia Scrubbers

Source Description

Operating Rate

Maximum ammonia concentration in filtrate = 3,328 kg/dayScrubber removal efficiency = 98%Scrubber exhaust flow rate = 40,000 CFM

18.88 m³/sExhaust temperature = 20 °C

293.15 KMolecular weight = 17.03 g/mol

Sample Calculation Ammonia Scrubbing

Ammonia = 3,328 kg 1 day 1 h 1000 g 100% - 98%

day 24 h 3600 s 1 kg

Ammonia = 0.77 gs

Source ID Contaminant CAS numberAmmonia

in Filtrate

[kg/day]

Exhaust

Flow Rate

[m³/s]

Removal

Efficiency

Emission

Rate [g/s]

MOE Data

Quality

S29 Ammonia 7664-41-7 3,328 18.88 98% 7.70E-01 Above-Average

S30 Ammonia 7664-41-7 0 18.88 98% 0.00E+00 Above-Average

The biogas plant contains two counter flow ammonia scrubbers containing sulfuric acid. It has a maximum ammonia concentration of 3328 Kg/day in the filtrate

per unit. Only one unit will operate at any time with the second unit acting as a back-up system.

The emission rates for the ammonia scrubber were calculated using the maximum ammonia amount in the filtrate, scrubber removal efficiency and

the scrubber exhaust parameters (provided by PurEnergy). Where a range was given, the value leading to the highest emission rate was chosen.

Made by: JLK

Checked by: EKLN:\Active\2011\1151\11-1151-0292 bioEnv-Biogas REA-Kawartha\Air-Noise\Air\Calculations\11-1151-0292 Calculations and Tables 16Mar12.xlsm

Page 6 of 8 Golder Associates

March 2012 11-1151-0292

Source Number Source 35

Source Name Common Plant Exhaust

Source Description

Operating Rate

Exhaust flow rate = 8288 m³/h2.302 m³/s

Exhaust Temperature = 293.15 K

Sample Calculation Common Plant Exhaust

Ammonia = 0.002 ppm 1 mol K 101325 N 1 17.03 g1.00E+06 8.314 N m m² 293.15 K mol

Ammonia = 1.42E-06 gm³

Ammonia = 1.42E-06 g 2.30 m³m³ s

Ammonia = 3.26E-06 g

s

Source ID Contaminant CAS numberConcentration

[ppmv]

Molecular

Weight

[g/mol]

Exhaust

Flow Rate

[m³/s]

Emission Rate

[g/s]

MOE Data

Quality

Ammonia 7664-41-7 0.002 17.03 2.30 3.26E-06 Average

Hydrogen Sulphide 7783-06-4 0.186 34.08 2.30 6.07E-04 Average

Carbonyl Sulphide 463-58-1 0.015 60.00 2.30 8.61E-05 Average

Methyl Mercaptan 74-93-1 0.157 48.11 2.30 7.23E-04 Average

Ethyl Mercaptan 75-08-1 0.001 62.13 2.30 5.95E-06 Average

Dimethyl Disulphide 642-92-0 0.003 94.20 2.30 2.70E-05 Average

Dimethyl Sulphide 75-18-3 0.002 62.13 2.30 1.19E-05 Average

Carbon disulphide 75-15-0 0.02 76.10 2.30 1.46E-04 Average

Methane 74-82-8 0.057 15.03 2.30 8.20E-05 Average

Acetaldehyde 75-07-0 0.135 44.05 2.30 5.69E-04 Average

Isobutyraldehyde 78-84-2 0.01 72.11 2.30 6.90E-05 Average

Isovaleraldehyde 590-86-3 0.186 76.13 2.30 1.36E-03 Average

Methyl Alcohol 67-56-1 0.015 32.04 2.30 4.60E-05 Average

Ethyl Alcohol 64-17-5 0.157 46.04 2.30 6.92E-04 Average

Isopropyl Alcohol 67-63-0 0.001 60.10 2.30 5.75E-06 Average

Toluene 108-88-3 0.003 92.14 2.30 2.65E-05 Average

TOTAL Hydrogen sulphide 7783-06-4 - - - 4.46E-03 Average

The common plant exhaust was designed for the exhaust air coming from the Digestate Management Building and from its load-out area.

S35

Emissions from the exhaust are based on source testing from a similar facility provided in Appendix B. As there is the potential for odour emissions from this source, all

emissions are conservatively assumed to be hydrogen sulphide.

Made by: JLK

Checked by: EKLN:\Active\2011\1151\11-1151-0292 bioEnv-Biogas REA-Kawartha\Air-Noise\Air\Calculations\11-1151-0292 Calculations and Tables 16Mar12.xlsm

Page 7 of 8 Golder Associates

March 2012 11-1151-0292

Source Number Source 8, 13, 18, 23, and 28

Source Name Combined Heat and Power Engines

Source Description

Operating Rate

Number of Engines in Operation = 2Maximum Fuel Consumption Per Engine = 4711 kWHalf Load Fuel Consumption = 2355.5 kW

8.04E+00 MMBtu/hr

Sample Calculation Natural Gas CombustionNitrogen oxides = 8.04E+00 MMBtu 8.47E-01 lb 1 hr 453.5924 g

hr MMBtu 3600 s 1 lbNitrogen oxides = 8.59E-01 g

s

Source ID Contaminant CAS Number

Emission

Factor

[lb/MMBtu]

Emission

Rate [g/s]

US EPA

Emission

Factor

Rating

MOE Data

Quality

23 Nitrogen oxides 10102-44-0 8.47E-01 8.59E-01 A Above-Average

28 Nitrogen oxides 10102-44-0 8.47E-01 8.59E-01 A Above-Average

The biogas plant contains five combined heat and power engines which may be fired with either natural gas or biogas. The facility will have a nameplate capacity of 9.8 MW of power and a fuel

consumption of 4711 kW.

During plant startup (approximately 2 months), two of the CHP engines will be in operation at half load (1 MWe each) using natural gas as fuel.

The nitrogen oxides emission rates for the natural gas fired engines were calculated using an emission factor from Tables 3.2-2, in US EPA AP-42 Section 3.2 Natural Gas Fired Reciprocating

Engines (7/00) and are based on the half load fuel consumption of 2355.5 kW per engine.

As per the ESDM Guidance Document, nitrogen oxides is the only significant contaminant resulting from natural gas combustion.

Made by: JLK

Checked by: EKLN:\Active\2011\1151\11-1151-0292 bioEnv-Biogas REA-Kawartha\Air-Noise\Air\Calculations\11-1151-0292 Calculations and Tables 16Mar12.xlsm

Page 8 of 8 Golder Associates

EMISSION SUMMARY AND DISPERSION MODELLING REPORT

March 2012 Report No. 11-1151-0292

APPENDIX B Supporting Information for Emission Rate Calculations

Engine: TCG 2020 V20

515

7,222202319608.38

EU:Emission [mg/mn3] NOx 500Emission [mg/mn3] CO 1100Emission [mg/mn3] VOC (NMHC) 150Emission [mg/mn3] HCHO 150Emission [mg/mn3] PM 2.5 15Emission [mg/mn3] PM 10 20

CAN - RAW Emissions:Emission [g/bhp hr] NOx 1.05Emission [g/bhp hr] CO 2.35Emission [g/bhp hr] VOC (NMHC) 0.32Emission [g/bhp hr] HCHO 0.32Emission [g/bhp hr] PM 2.5 0.03Emission [g/bhp hr] PM 10 0.04

Biogas 60%CH4, 40%CO2

Kawartha Biogas

real O2-content in dry Exhaust [%]

Shaft rated power [kW]Exhaust gas volume dry [mn3/h]

Raw Emission in CAN-Values

Basis EU: O2 in mg/m3 (%)Basis CAN: O2 in ppm (%)

Electrical output [kWe]

MWM 30/09/2011

Source Sampling Emissions from Similar Digestate Management Building

EMISSION SUMMARY AND DISPERSION MODELLING REPORT

March 2012 Report No. 11-1151-0292

APPENDIX C Dispersion Modelling Files (on CD)

INSERT CD POCKET HERE

Golder Associates Ltd. 2390 Argentia Road Mississauga, Ontario, L5N 5Z7 Canada T: +1 (905) 567 4444

Caption Text


Recommended