purEnergy Inc. (purEnergy) commissioned Golder Associates (Golder) to conduct an odour impact assessment for the proposed construction and operation of the Kawartha Biogas Facility (the Facility) at 6830 Highway 7, in Havelock, Ontario. The Facility will produce biogas using an anaerobic digestion system. The biogas will be combusted in generators for the creation of electricity and heat. The Facility will have a maximum electricity generation capacity of 9.8 MW. The electricity will be sold under a Feed-In-Tariff (FIT) contract (reference number FIT-FPZXS2N) awarded by the Ontario Power Authority.
In accordance with O. Reg. 359/09, the Facility is classified as a Class 3, non-farm based, anaerobic digestion facility producing biogas for the purpose of creating green energy. O. Reg. 359/09 also indicates that a Class 3 biogas facility (if the generating unit of the facility is located anywhere other than at a farm operation), requires an Odour Impact Assessment.
The Facility will consist of four anaerobic Triton ® digesters producing biogas to fuel five combined heat and power (CHP) engines with a maximum electricity generation capacity of 9.8 MW. The Facility also has supporting equipment, including:
an emergency flare;
chemical storage tanks;
an ammonia recovery system;
a desulphurization unit; and
a plant exhaust system.
Areas of the Facility that may potentially emit odours will be kept under negative pressure with the air drawn into the CHP engines as combustion air.
The odour impact assessment included conducting air dispersion modelling using the United States Environmental Protection Agency’s (U.S. EPA) AERMOD dispersion model for the significant odour-related air emission sources at the Facility. The modelling assessment followed the methodology outlined in the Ministry of the Environment’s (MOE) technical bulletin entitled "Methodology for Modelling Assessments with 10-Minute Average Standards and Guidelines under O. Reg. 419/05" dated April 2008 (MOE Guidance Document). Two scenarios were included in the analysis to determine impacts of various operating scenarios:
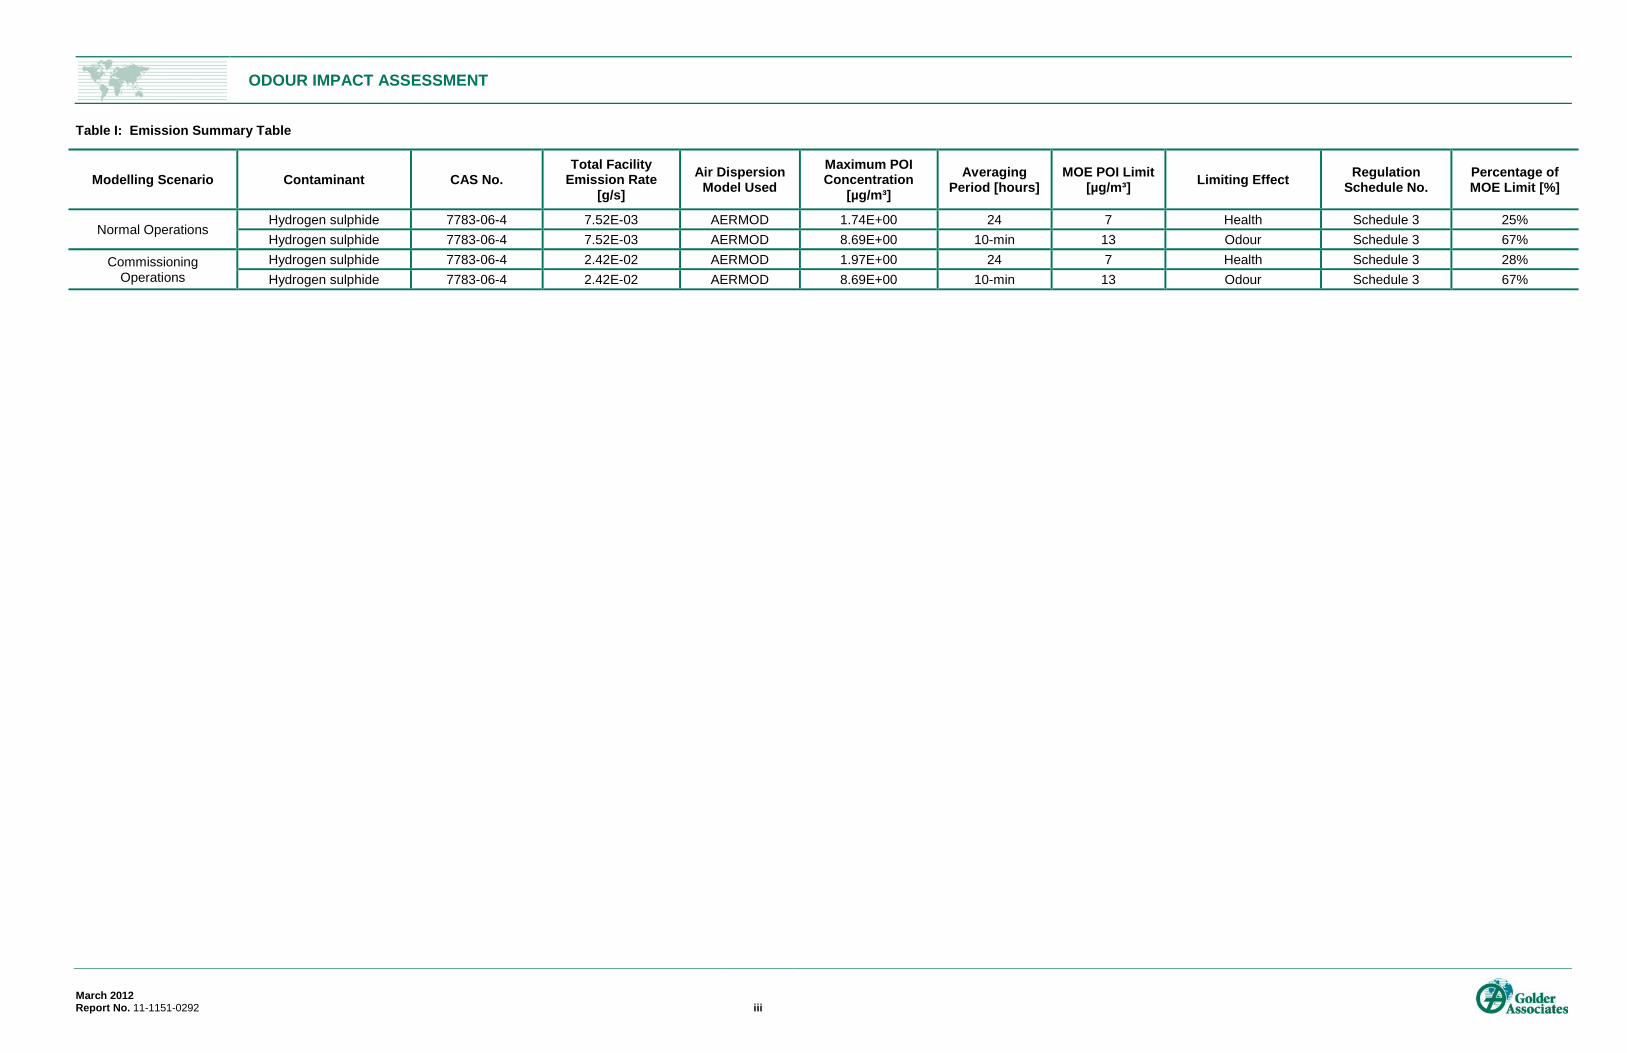
The point of impingement (POI) concentrations listed in the Emission Summary Table were compared against published MOE POI Limits as described in the MOE publication “Guideline A-10: Procedure for Preparing an Emission Summary and Dispersion Modelling (ESDM) Report, Version 3.0”, dated March 2009 (ESDM Procedure Document) PIBS 3614e03. This odour impact analysis demonstrates that the Facility is capable of operating in compliance with the MOE guidance for odorous compounds at all receptors.
ODOUR IMPACT ASSESSMENT
March 2012 Report No. 11-1151-0292 iii
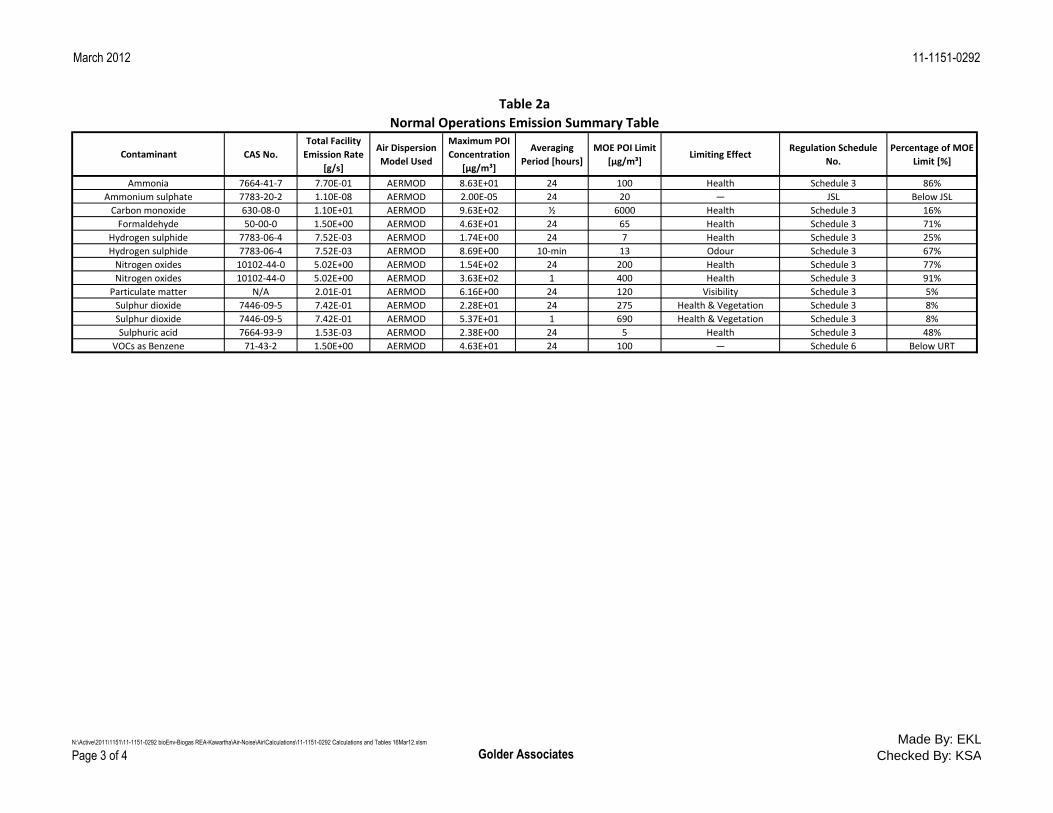
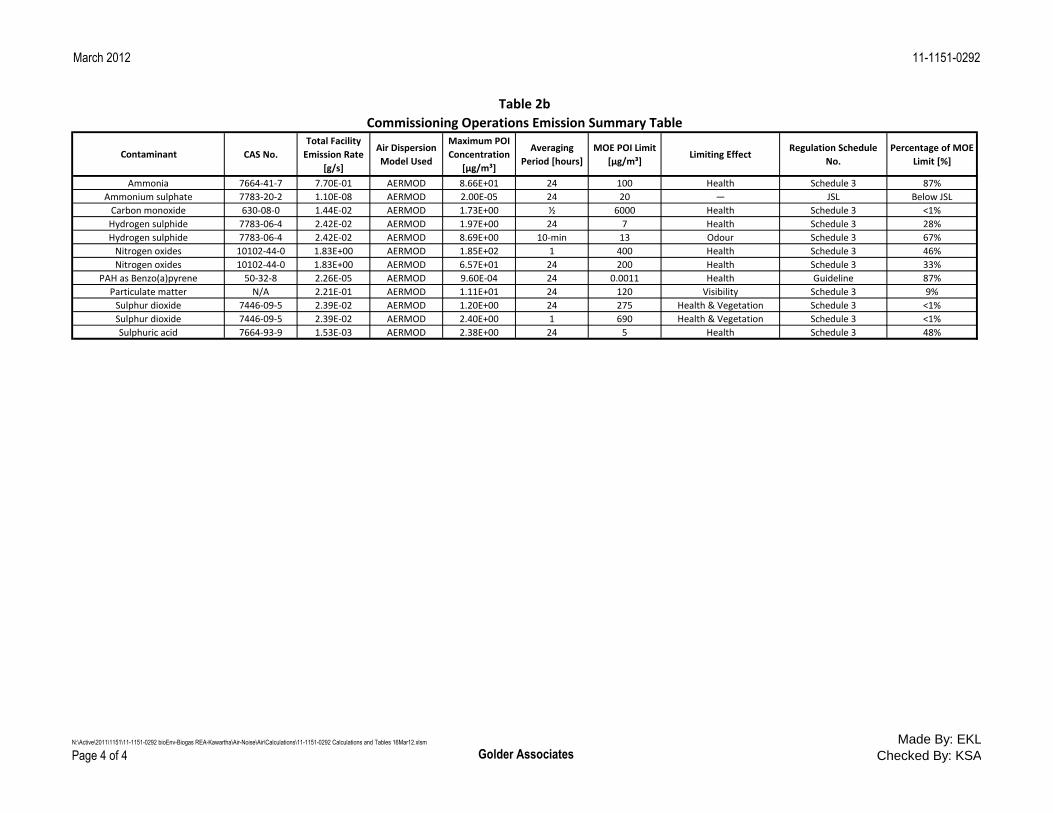
Table I: Emission Summary Table
Modelling Scenario Contaminant CAS No. Total Facility
2.0 SITE BACKGROUND ....................................................................................................................................................... 3
4.0 PROCESS DESCRIPTION ............................................................................................................................................... 5
4.1 Raw Materials ...................................................................................................................................................... 5
4.4 Combined Heat and Power System ..................................................................................................................... 7
5.1.2 Building and Reception Tank Ventilation ........................................................................................................ 9
5.2 Description of Odour Emitting Sources .............................................................................................................. 10
5.2.1 Description of Operation Conditions............................................................................................................. 10
5.2.1.1 Normal Operations .................................................................................................................................... 10
6.1 General Modelling Approach ............................................................................................................................. 12
6.2 Model Executables ............................................................................................................................................ 12
6.3 Meteorological Data ........................................................................................................................................... 12
6.4 Averaging Periods and Time-Based Concentration Conversion ........................................................................ 13
ODOUR IMPACT ASSESSMENT
March 2012 Report No. 11-1151-0292 v
6.5 Digital Elevation Model Data .............................................................................................................................. 13
6.8 Building Downwash ........................................................................................................................................... 14
6.9 Frequency Analysis ........................................................................................................................................... 14
1.0 INTRODUCTION purEnergy Inc. (purEnergy) proposes to construct and operate the Kawartha Biogas Facility (the Facility) at 6830 Highway 7, in Havelock, Ontario. The Facility will produce biogas using an anaerobic digestion system. The biogas will be combusted in generators for the creation of electricity and heat. The Facility will have a maximum electricity generation capacity of 9.8 MW. The electricity will be sold under a Feed-In-Tariff (FIT) contract (reference number FIT-FPZXS2N) awarded by the Ontario Power Authority.
In accordance with O. Reg. 359/09, the Facility is classified as a Class 3, non-farm based, anaerobic digestion facility producing biogas for the purpose of creating green energy. O. Reg. 359/09 also indicates that a Class 3 biogas facility (if the generating unit of the facility is located anywhere other than at a farm operation), requires a Odour Impact Assessment.
This Odour Impact Assessment is intended to support a Renewable Energy Approval for the Facility.
The Facility will consist of four anaerobic Triton ® digesters producing biogas to fuel five combined heat and power (CHP) engines with a maximum electricity generation capacity of 9.8 MW. The Facility also has supporting equipment, including:
an emergency flare;
chemical storage tanks;
an ammonia recovery system;
a desulphurization unit; and
a plant exhaust system.
Areas of the Facility that may potentially emit odours will be kept under negative pressure with the air drawn into the CHP engines as combustion air.
The odour impact assessment included conducting air dispersion modelling using the United States Environmental Protection Agency’s (U.S. EPA) AERMOD dispersion model for the significant odour-related air emission sources at the Facility. The modelling assessment followed the methodology outlined in the Ministry of the Environment’s (MOE) technical bulletin entitled "Methodology for Modelling Assessments with 10-Minute Average Standards and Guidelines under O. Reg. 419/05" dated April 2008 (MOE Guidance Document). Two scenarios were included in the analysis to determine impacts of various operating scenarios:
The four key factors that are typically considered when conducting an odour impact assessment include; intensity, duration, frequency and offensiveness. The use of odour concentrations in an air dispersion model can address only the first three of these factors. An odour concentration is not an indicator of the offensiveness of a particular odour. Offensiveness is a subjective factor that varies by individual, thus has not been considered in this analysis. Offensiveness can be addressed through facility specific odour management plans.
Dispersion modelling is a method of predicting the impact of one or more stationary sources of air pollutants. The models are used to predict the highest concentration expected from a facility. For this reason, the dispersion models may over-predict the concentrations in an assessment. A modelled prediction alone does not mean that there will be an air pollution episode; it is only a flag indicating potential air quality impacts.
This assessment compares the predicted odour concentrations from the proposed operation to the MOE guidelines, and makes recommendations that will allow the Facility to meet the MOE odour guidelines where appropriate.
ODOUR IMPACT ASSESSMENT
March 2012 Report No. 11-1151-0292 3
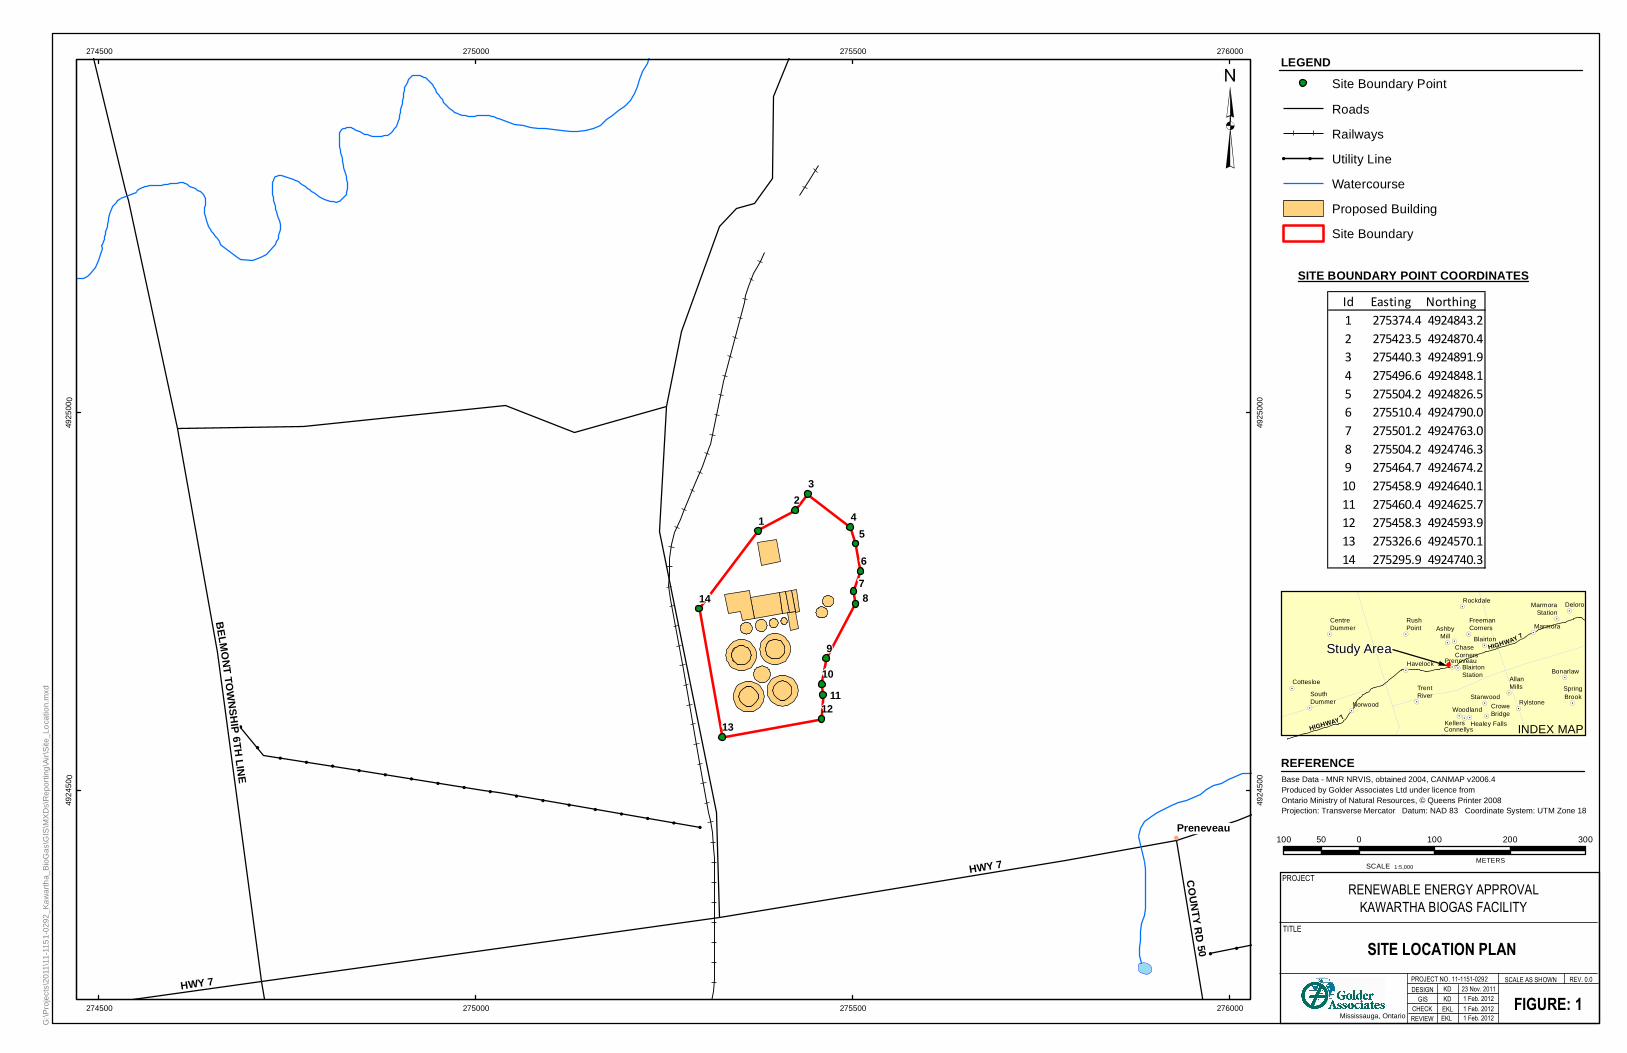
2.0 SITE BACKGROUND The Facility is to be located at 6830 Highway 7, in Havelock, Ontario in a rural agricultural area with relatively flat terrain. The Facility is surrounded by agricultural land use with scattered farm residences in close proximity to the composting facility. In addition, there are some aggregate extraction pits located to the south and industrial, commercial and extraction pits abutting the site. The location of the site is provided in Figure 1.
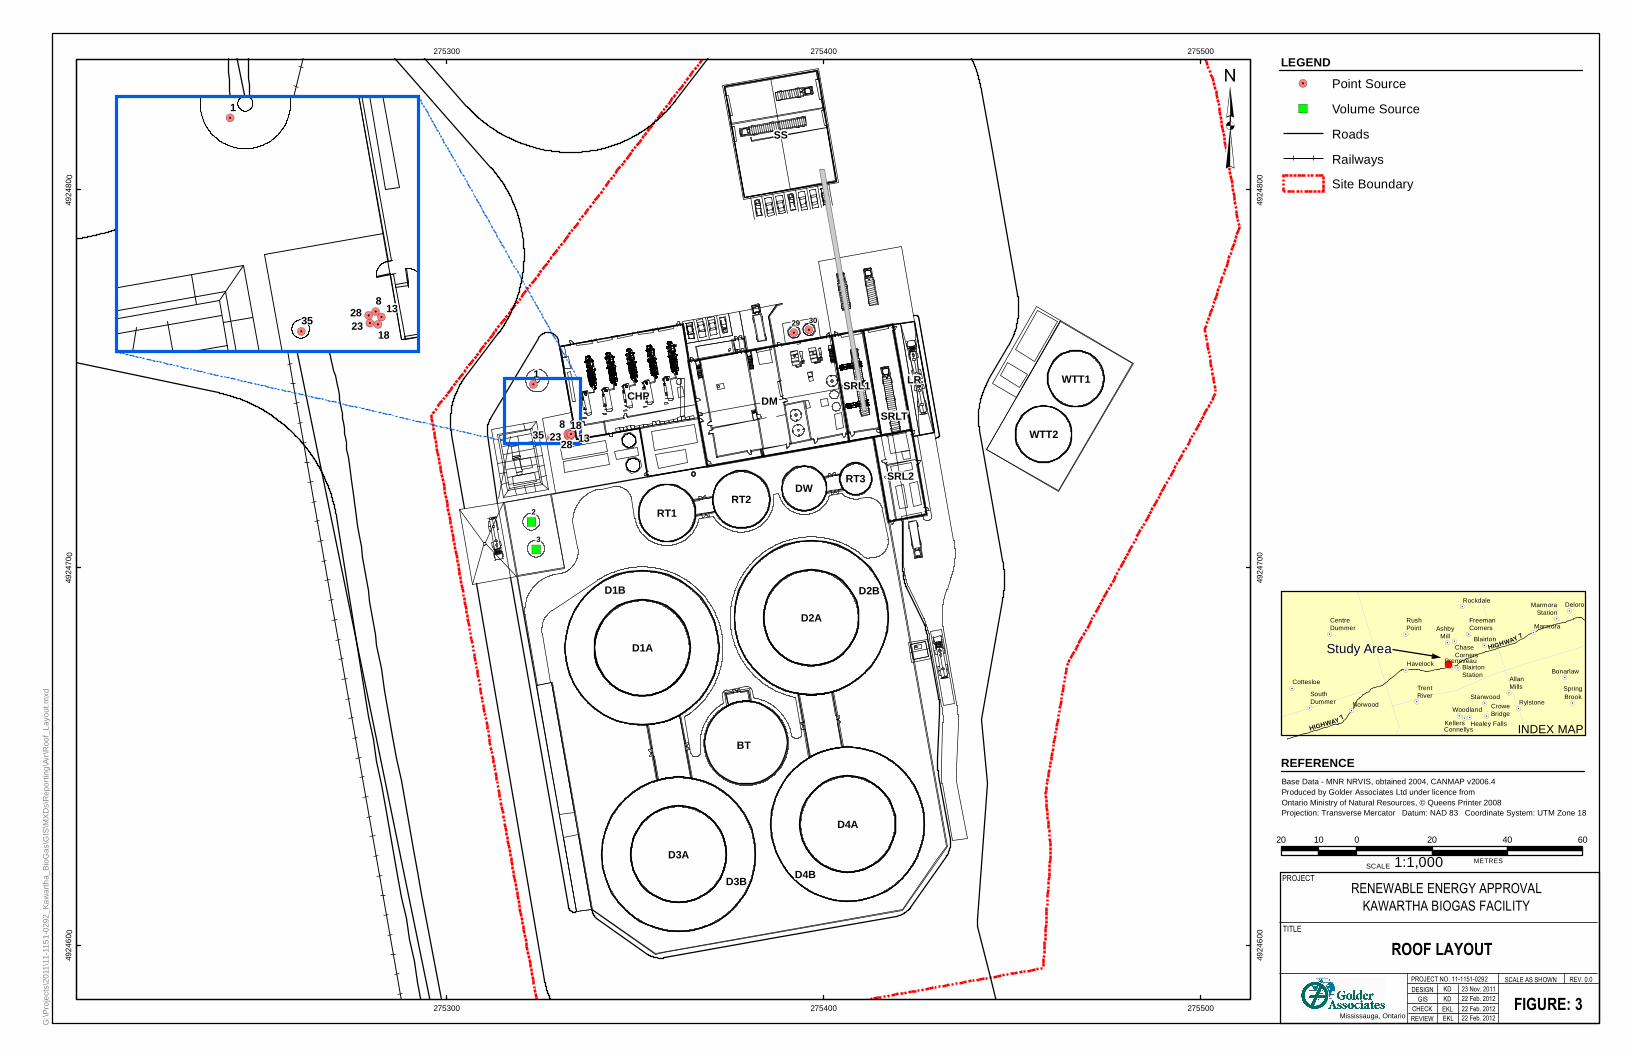
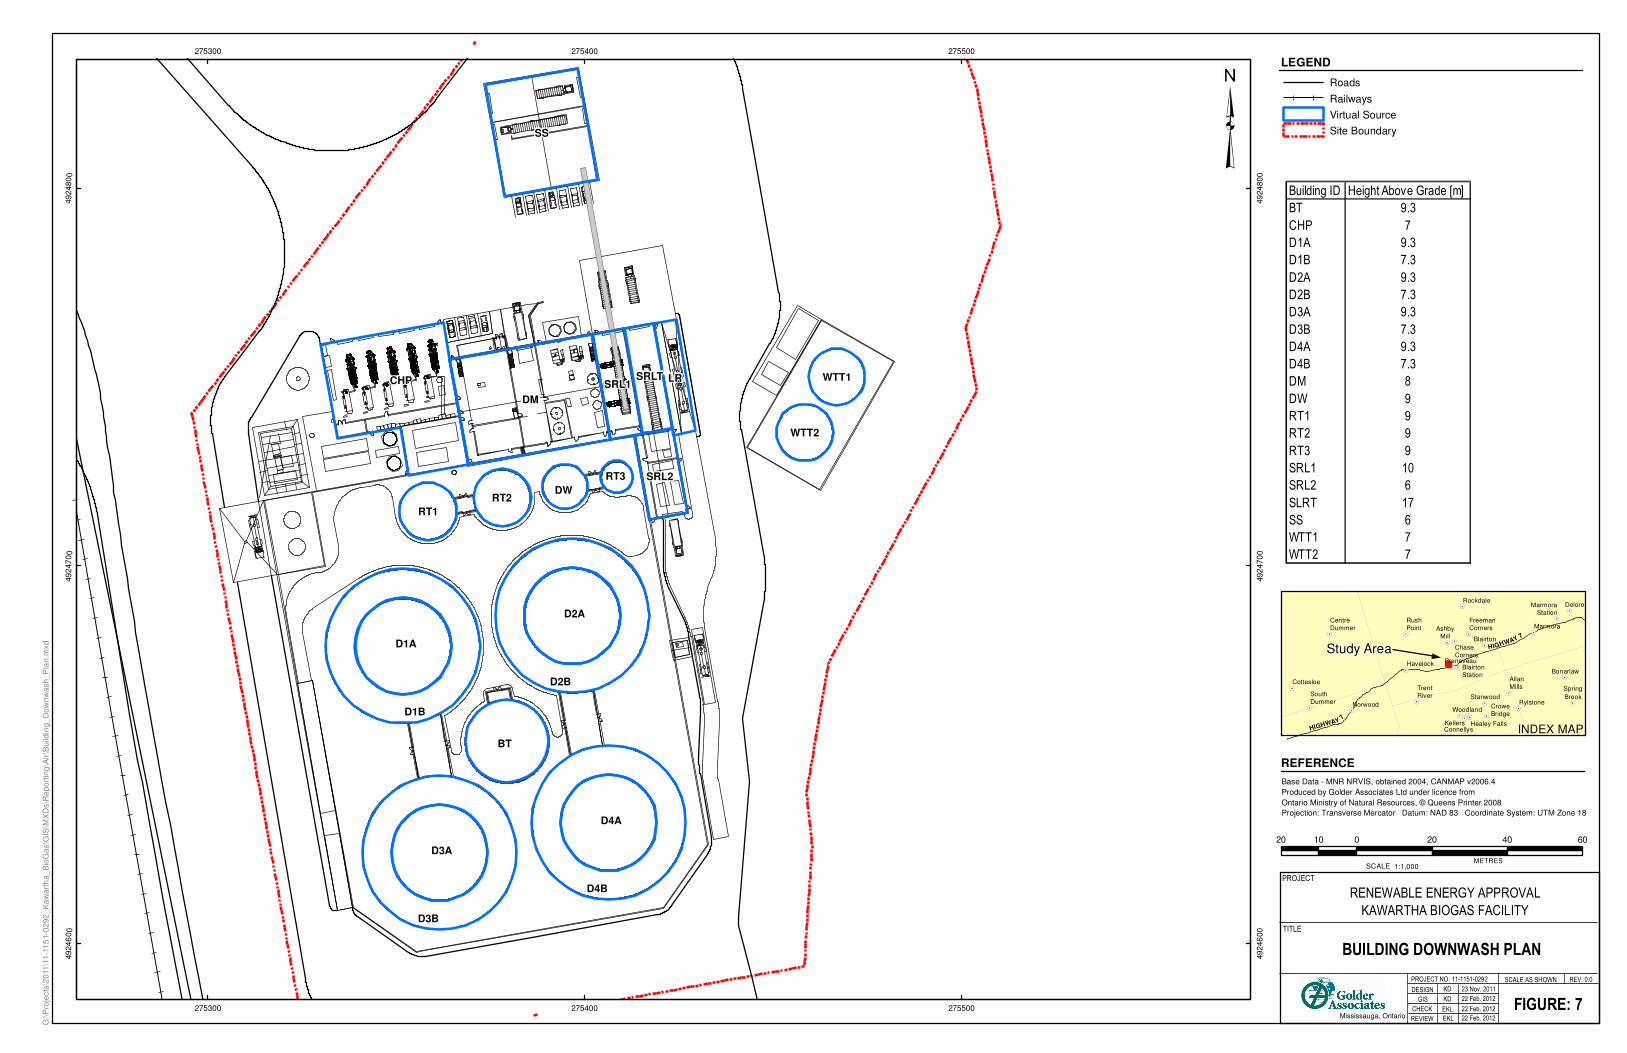
Scaled site information is provided in Figure 3 – Roof Layout. This includes:
Each significant source of significant contaminants; and
The location of buildings on the property.
ODOUR IMPACT ASSESSMENT
March 2012 Report No. 11-1151-0292 4
3.0 REGULATORY FRAMEWORK Under Section 14 (1) of the Ontario Environmental Protection Act (EPA) the release of a contaminant is prohibited if the discharge causes or may cause an adverse effect. The MOE has developed standards and guidelines that are contaminant-specific under Ontario Regulation 419/05 (O. Reg. 419/05), and are used to assess emissions from a single facility. Odour impacts are typically addressed in relation to adverse effects as defined in Section 14 of the EPA. Odour impacts due to aggregate exposure to a mixture of odorous compounds (usually expressed in odour units (OU)) are not addressed in the Point-of-Impingement (POI) standards. These standards and guidelines only apply to contaminant specific emissions. The limits for aggregate odour emissions are regulated through the site specific Environmental Compliance Approval, which is based on site specific conditions. The common guidance level is 1 OU per cubic metre (OU/m³) for a 10-minute basis, with a compliance frequency of 99.5%.
Odour emission concentration data were not available for the Facility so odour was assessed assuming that all odourous compounds are emitted as hydrogen sulphide. Dispersion modelling results were compared against the O. Reg. 419/05 Schedule 3 10-minute standard for hydrogen sulphide which is an odour based standard.
ODOUR IMPACT ASSESSMENT
March 2012 Report No. 11-1151-0292 5
4.0 PROCESS DESCRIPTION The Facility will consist of four anaerobic Triton ® digesters producing biogas to fuel five combined heat and power (CHP) engines with a maximum electricity generation capacity of 9.8 MW and approximately 10 MW of thermal energy. The electricity will be sold under a Feed-In-Tariff (FIT) contract (reference number FIT-FPZXS2N) awarded by the province of Ontario.
Product usages and process information are provided in greater detail in “Emission Summary and Dispersion Modelling Report purEnergy Inc. Kawartha Biogas Facility” dated January 2012, Report No. 11-1151-0292, Golder Associates Ltd (Kawartha ESDM Report). The maximum emission rates for each significant contaminant emitted from the significant sources were estimated and the methodology for the calculation is documented in the source summary tables (Table 1a and Table 1b).
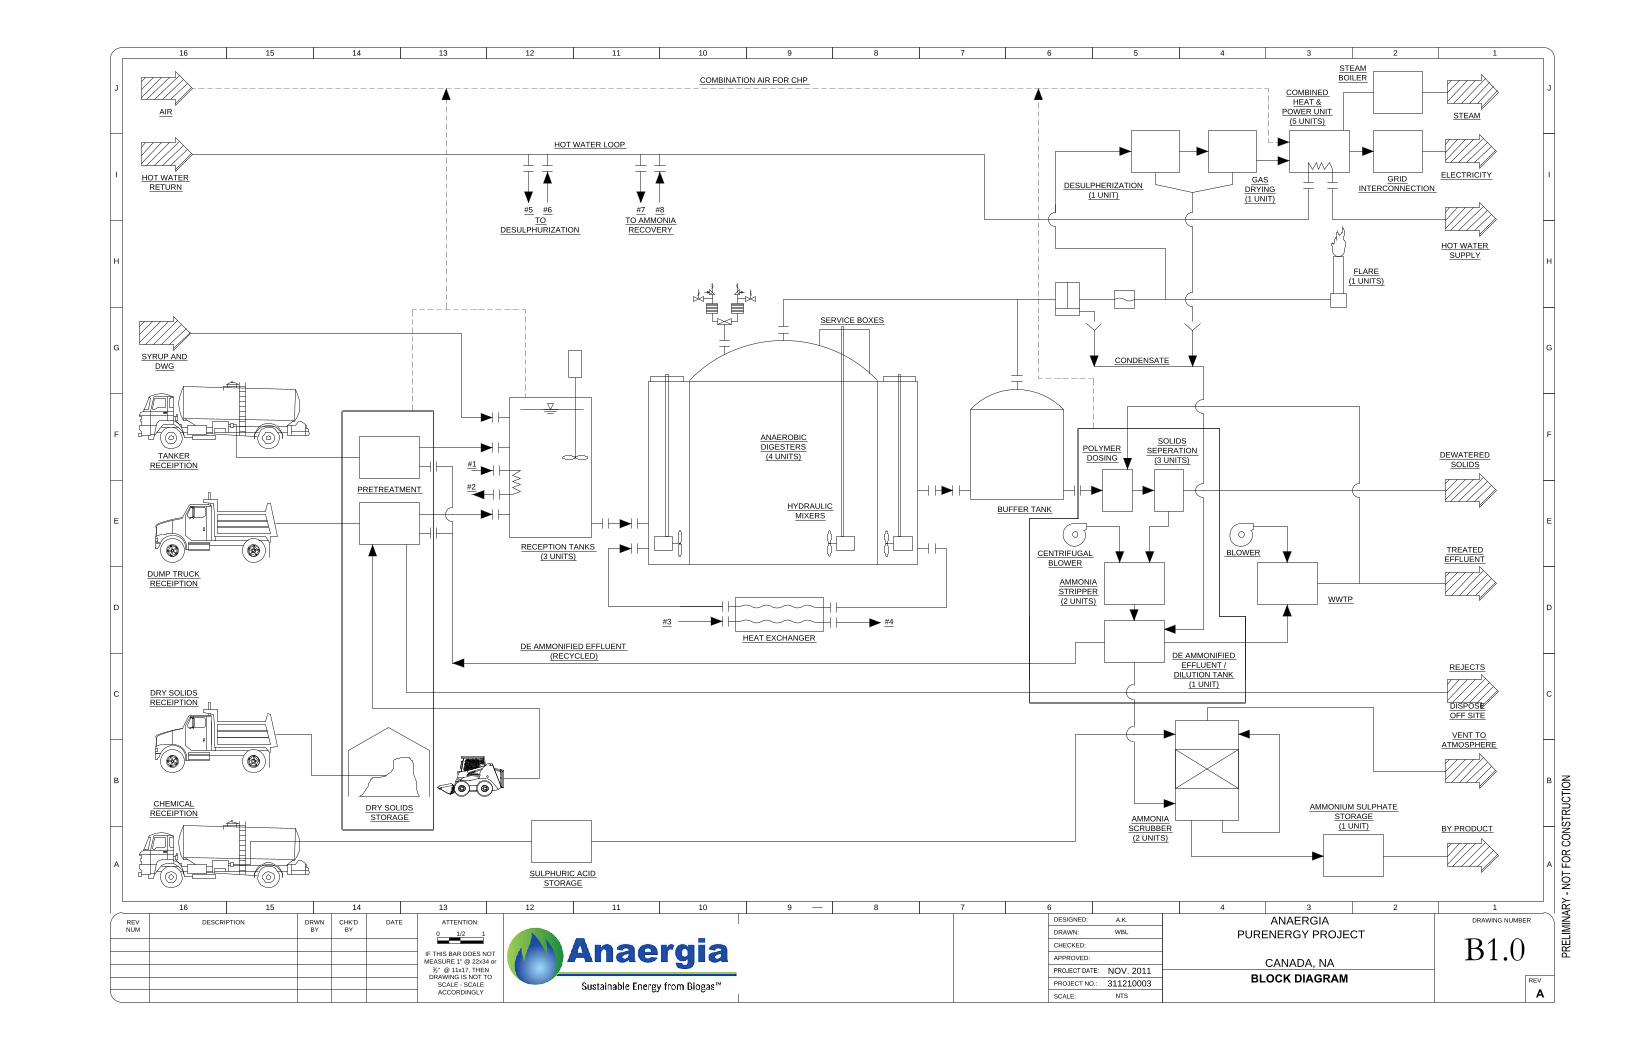
Refer to Figure 2 – Process Flow Diagram for a graphical representation of the processes occurring at the Facility.
4.1 Raw Materials The Facility will continuously receive organic materials (feedstock) in both liquid and solid form. Both types of feedstock will be delivered to the site by MOE-certified waste haulers. Liquid materials are those that are pumpable without any additional particle size reduction or dilution; solid materials are those that may require further particle size reduction or dilution in order to render them pumpable. Organic feedstock will be received in compliance with applicable laws, which will include vehicles that have been approved by the MOE where necessary.
Feedstock will be delivered by trucks at scheduled times throughout the year. In the solids reception building, the trucks will empty the load of solid feedstock into a below-ground reception pit which is outfitted with a mixer and a chopper pump. The solid feedstock will be pre-treated before entering the reception tank. Pre-treatment consists of the mixing and chopping of solid feedstock, as well as the addition of water to the solid feedstock. The trucks delivering liquid feedstock will stop at the liquid reception area and empty their load through the appropriate hose. The liquid organic reception pump will be activated to pump the liquid feedstock to the reception tank.
There will be three reception tanks located on the site used for receiving organic materials.
Tank 1: Low energy substrates (e.g., manure);
Tank 2: Medium energy substrates (e.g., food waste, distillers wet grain); and
Tank 3: High energy substrates (e.g., syrup, grease, whey).
The reception tanks will be insulated and equipped with hydraulic mixers. Hot water piping will be installed around the interior circumference of each tank to heat the feedstock. Dilution water will be mixed with the feedstock in order to achieve its optimum liquid content for the digestion.
ODOUR IMPACT ASSESSMENT
March 2012 Report No. 11-1151-0292 6
4.2 Anaerobic Digestion The diluted feed substrates will be pumped to four anaerobic Triton® digesters. The digesters are configured with a ring-in-ring construction. The outer ring is used as the primary fermenter and the inner ring is used as the secondary fermenter. Submersible mixers will be installed in both the inner and the outer ring to ensure efficient digestion. The inner ring of the digester will have a dual layer flexible membrane that is used for biogas storage.
A buffer storage tank receives the digestate feedstock exiting the four anaerobic digesters. By allowing additional residence time in the buffer storage tank, it allows degasification of the digested material and liberates the entrapped gases thereby reducing the odour level of the digestate to an almost undetectable level, and prevents the unwanted release of methane.
A secondary use of the buffer storage tank is to act as a digestate storage and volume buffering tank. This allows any low solids digestate to be returned to the anaerobic digesters, in order to maintain the optimal total solids content. Biogas can also be stored in the double-membrane gas holder roof of the buffer storage tank.
The digestate and biogas produced through the anaerobic digesters are then treated separately with odour control technologies, as described below.
4.3 Biogas Pre-Treatment Within the produced biogas, the major compound of concern for odour is hydrogen sulphide (H2S). The biogas produced in the digesters and the buffer tank will need its H2S content to be reduced to less than 200 ppm of H2S before the biogas is fed to the CHP engines. The presence of high concentrations of H2S in the biogas reduces the lubrication function of the engine oil, leading to reduced life time of the engines and expensive breakdowns, repairs and oil changes.
The H2S is removed form the biogas through desulphurisation. An external bio-scrubber is used to further reduce the H2S concentration after the introduction of excess air.
Bio-scrubbing involves a two stage process: absorption of H2S via a liquid medium followed by the biological oxidation of H2S in the liquid. When the biogas passes through the media in the bio-scrubber, the H2S is almost entirely biologically converted to sulphate in a series of oxidations. The sulphate is discharged in the scrubber effluent as diluted sulphuric acid. This sulphuric acid will be entirely used in ammonia removal/scrubbing process for digestate, along with fresh commercial sulphuric acid.
Once the H2S has been removed, the biogas enters a gas drying unit where a chiller cools the biogas to allow the excess moisture to condense. After the moisture is removed, the biogas is then heated to achieve the desired relative humidity values for the CHP engines. A blower station will be installed to provide the biogas with the required pressure to enter the CHP engines.
ODOUR IMPACT ASSESSMENT
March 2012 Report No. 11-1151-0292 7
4.4 Combined Heat and Power System In the combined heat and power system, the produced biogas is used as the fuel for five CHP engines, generating 9.8 MW of electrical power. A steam boiler will be attached to each engine (five total) and will use the heat from the engine exhaust gas to produce steam. The heat from the hot water and exhaust gases from the engines will produce approximately 10 MW of thermal energy. The hot water from the engines will be used to heat the reception tanks, the digesters, and also to provide the required heat for the ammonia recovery system.
4.5 Digestate Treatment The digestate is expected to have high ammonia content, with the potential to cause odours. Before the removal of ammonia to control odours, the digestate will be separated into liquid and solid forms using three screw presses in the dewatered solid loading area. The ammonia is expected to remain in the liquid portion of the digestate. The solid portion of the digestate (dewatered sludge) is sold to end users for application as soil conditioner and will be directly loaded into trucks to be transported offsite. In the rare event that the solids cannot be immediately transported offsite and the buffer storage capacity has been exceeded (three days), the solids will be transferred to the dewatered storage solid building through an enclosed conveyor and loaded onto transport trucks by a loader at a later time. As the solids are completely digested with the ammonia removed to the liquid portion, the solid digestate is considered to have low-odour.
Ammonia will be removed from the digestate (filtrate) by a two stage continuous process: ammonia stripping and ammonia chemical scrubbing. In the first stage, the filtrate is pumped to the top of the stripper tower and flows downward through an air stream. Ammonia is stripped from the filtrate into the air stream. In the second stage, the air stream is directed to the chemical scrubbers where the air stream is put in contact with sulphuric acid scrubbing solution to produce an ammonium sulphate solution. The ammonium sulphate solution will have a concentration of approximately 35% by weight and will be sold to other users. The system is designed to consistently meet an ammonia reduction of approximately 85 to 90%. The denitrified effluent from the scrubber will be used for diluting the fresh substrates in the anaerobic digesters eliminating the need for fresh water.
The denitrified effluent that has not been used for diluting the feedstock will be treated in a Sequencing Batch Reactor (SBR) plant before being discharged into the adjacent quarry. The SBR operates in sequential fill and draw mode. The system incorporates a surge/anoxic mix tank as part of the SBR to optimally control the process and provide rapid and complete treatment. This surge tank provides flow and nutrient equalization to ensure treatment at the full range of flows and loadings. Odour control and scum skimming will be achieved in the process. There will be two SBR tanks that can operate independently and in true batch mode as flow accumulates in the tank during settling and decanting.
ODOUR IMPACT ASSESSMENT
March 2012 Report No. 11-1151-0292 8
4.6 Emergency Flare During normal operations, the emergency flare will not be in use at the Facility. The emergency flare will only be in use during the commissioning phase and during process upsets at the Facility.
During the commissioning operations, the emergency flare will burn the biogas produced by the Facility until the biogas quantity and quality is sufficient to feed the five CHP engines.
During process upsets, where one or more biogas engines are not operational and the Facility’s biogas storage volume is exceeded, the emergency flare will burn the excess biogas. Process upset events are projected to be unlikely.
ODOUR IMPACT ASSESSMENT
March 2012 Report No. 11-1151-0292 9
5.0 SOURCES AND EMISSIONS ESTIMATION The Facility has been designed so that production of odours and potential odour emissions are minimized. The design particulars are detailed in the following sections.
5.1 Description of Odour Mitigated Sources 5.1.1 Solid Organic Feedstock Offloading Odour emissions are mitigated in the solid feedstock offloading area by using an air lock system. Conveyors handling the solids will also be covered, preventing direct exposure to the atmosphere at any time.
The air lock system ensures that the feedstock processing will not be directly exposed to the atmosphere at any time by using interior and exterior doors. When a truck arrives to unload feedstock, it will enter the exterior set of doors and the interior doors will be closed. Once the truck is between the two sets of doors, the exterior doors will close and the interior doors will open to allow access to the unloading area. Upon exit, the exterior door is only permitted to open when:
all interior doors and/or the Reception Pit cover is closed; and
15 minutes have passed since the last closing of the interior door.
This system will ensure that all potential odours that have migrated to the area between the interior and exterior doors will have been ventilated to the air duct. This air is directed to the five CHP engines for combustion. The delay of 15 minutes is based on a circulation rate of four air changes per hour. The delay allows for truck inspection, washing of tires (if necessary) and completion of administrative duties with plant operator.
No odour emissions are expected to be directly emitted from this source. Emissions will be accounted for in the CHP engine emissions.
5.1.2 Building and Reception Tank Ventilation In general, all buildings will operate under slight negative pressure and all storage tanks will be tightly sealed and ventilated to prevent odours from being emitted. Negative pressure will be maintained in buildings by controlling the flow of incoming and outgoing air. Negative pressure will be established by keeping the flow of building make-up air slightly lower than the exhaust air.
The Solids Reception building and Reception Tanks will be kept under slight negative pressure at all times to prevent any odours from being emitted to the atmosphere. The Reception Pit area, located in the Solids Reception building, will be ventilated at a rate of approximately 12 air changes per hour in order to mitigate any concerns around workplace safety during the unloading of solid organics. As mentioned in the section above, the air from the Solids Reception building will be drawn into the CHP building for use as combustion air in the biogas engines. The five CHP engines require a much greater flow rate of combustion air than that supplied by the Solids Reception building, ensuring that any odours from the building are not released to the atmosphere.
ODOUR IMPACT ASSESSMENT
March 2012 Report No. 11-1151-0292 10
The Solids Reception building, below-ground reception pit, Reception tanks and CHP buildings will be sealed so that negative pressure is not lost by air infiltrating through exterior walls, windows and doors.
The Digestate Management building and Dewatered Solids Loading building will both be maintained at negative pressure. Only minimal odours are expected in these buildings as the materials handled in these areas have already gone through the digestion process.
The exhaust ventilation air from the Digestate Management building and Dewatered Solids Loading building is directed to a common plant exhaust air stack.
5.2 Description of Odour Emitting Sources 5.2.1 Description of Operation Conditions The operating condition used for the Facility that results in the maximum concentration at a point of impingement (POI) is the scenario where all significant sources are operating simultaneously at their individual maximum rates of production for the appropriate averaging time, as documented in the publication “Summary of Standards and Guidelines to support Ontario Regulation 419: Air Pollution - Local Air Quality (including Schedule 6 of O. Reg. 419 on Upper Risk Thresholds)”, dated February 2008 (MOE POI Limit[s]). The individual maximum rates of production for each significant source of emissions correspond to the maximum emission rate for the averaging time.
5.2.1.1 Normal Operations During maximum normal operations, all five CHP engines will be in operation at 100% load, generating 9.8 MW of electrical power. All five boilers will be operating to generate approximately 4.8 MW of thermal energy in the form of steam. All other sources are also expected to be in operation except the emergency flare.
5.2.1.2 Commissioning Conditions During the Facility’s commissioning operations (approximately 2 months), the biogas produced will be burnt in the flare until the biogas quantity and quality is enough to feed the engines. Up to 25% of the Facility’s biogas production capacity, estimated to be 935 m³/hr, will be burnt in the flare. During this time, two biogas engines will also be in operation at half load using natural gas as fuel.
5.2.2 Explanation of the Methods Used to Calculate Emission Rates The maximum emission rates for each significant contaminant emitted from the significant sources were estimated and the methodology for the calculation is documented in source summary tables (Table 1a and Table 1b). All emission rates were calculated in accordance with requirements of the ESDM Procedure Document.
The emission rate for each significant contaminant emitted from a significant source was estimated and the methodology for the calculation is clearly documented in source summary tables (Table 1a and Table 1b).
ODOUR IMPACT ASSESSMENT
March 2012 Report No. 11-1151-0292 11
5.2.3 Sample Calculations The technical rationale, including sample calculations, required to substantiate the emission rates presented in source summary tables (Table 1a and Table 1b) and are documented in detail in the Kawartha ESDM Report.
The three sources of odours at the Facility are the CHP engine emissions, the common plant exhaust and the emergency flare.
5.2.3.1 Biogas Engine Emissions Emissions from the combustion of biogas in the CHP engines were estimated using emission factors (units of mg/m³) provided by the CHP engine manufacturer. The CHP engines have a hydrogen sulphide oxidation/destruction efficiency of greater than 99%, emission rates were estimated assuming 1% of the hydrogen sulphide in biogas would be emitted to the atmosphere.
During commissioning operations, two biogas engines will operate using natural gas as fuel and no odourous emissions are expected.
5.2.3.2 Emergency Flare Emissions The emission rates for the emergency flare were calculated using emission factors obtained from Environment Canada's biogas flaring emissions estimation tool.
The emergency flare has a hydrogen sulphide oxidation/destruction efficiency of greater than 98%. Therefore, emission rates were conservatively estimated assuming 2% of the hydrogen sulphide in biogas would be emitted to the atmosphere.
5.2.3.3 Common Plant Exhaust Air from the Digestate Management building and Dewatered Solids Loading building is exhausted through the Common Plant Exhaust. Emissions from this exhaust were based on source testing data obtained from a similar facility. Emissions include various odourous compounds that were conservatively assumed to be hydrogen sulphide.
ODOUR IMPACT ASSESSMENT
March 2012 Report No. 11-1151-0292 12
6.0 DISPERSION MODELLING The dispersion modelling was conducted in accordance with the MOE publication “Guideline A-11: Air Dispersion Modelling Guideline for Ontario, Version, 2.0”, dated March 2009 (ADMGO) PIBS 5165e02.
The Facility is currently subject to s.19 of O. Reg. 419/05; therefore, the modelled impact of contaminant emissions can be assessed as half-hour maximum point of impingement (POI) concentrations. However, the AERMOD model is being used for this ESDM Report to allow for the improved dispersion from plume rise due to high temperature and high velocity exhaust characteristics from Facility’s exhaust stacks. The MOE form “Request Under s.20(4) to have the Schedule 3 Standards Apply in Advance of the Date Required by Regulation 419/05” has been provided with the BCCofA (Air & Noise) application.
6.1 General Modelling Approach As per the MOE Guidance Document, the modelling assessment can be conducted on a tiered approach, or the proponent may move directly to a more refined approach. For the purposes of this report the modelling was conduced using a refined approach. This included using the US EPA’s AERMOD dispersion model to predict the maximum 10-minute odour unit concentrations. Two scenarios were included in the analysis:
Scenario 1: Typical Operations.
Scenario 2: Commissioning Operations.
6.2 Model Executables The following US EPA executables were used in the assessment:
AERMOD dispersion model (v. 09292);
AERMAP surface pre-processor (v. 11103); and
BPIP-PRIME building downwash pre-processor (v. 04274).
6.3 Meteorological Data The AERMOD model was run using a five-year (1996 to 2000) crops meteorological data set obtained from the MOE’s “Ontario Regional Meteorological Data” website for the Eastern Region – Ottawa, Peterborough, Belleville. This data includes five years of data, thus it is highly likely that every possible combination of windspeed, atmospheric stability and direction have occurred at least once.
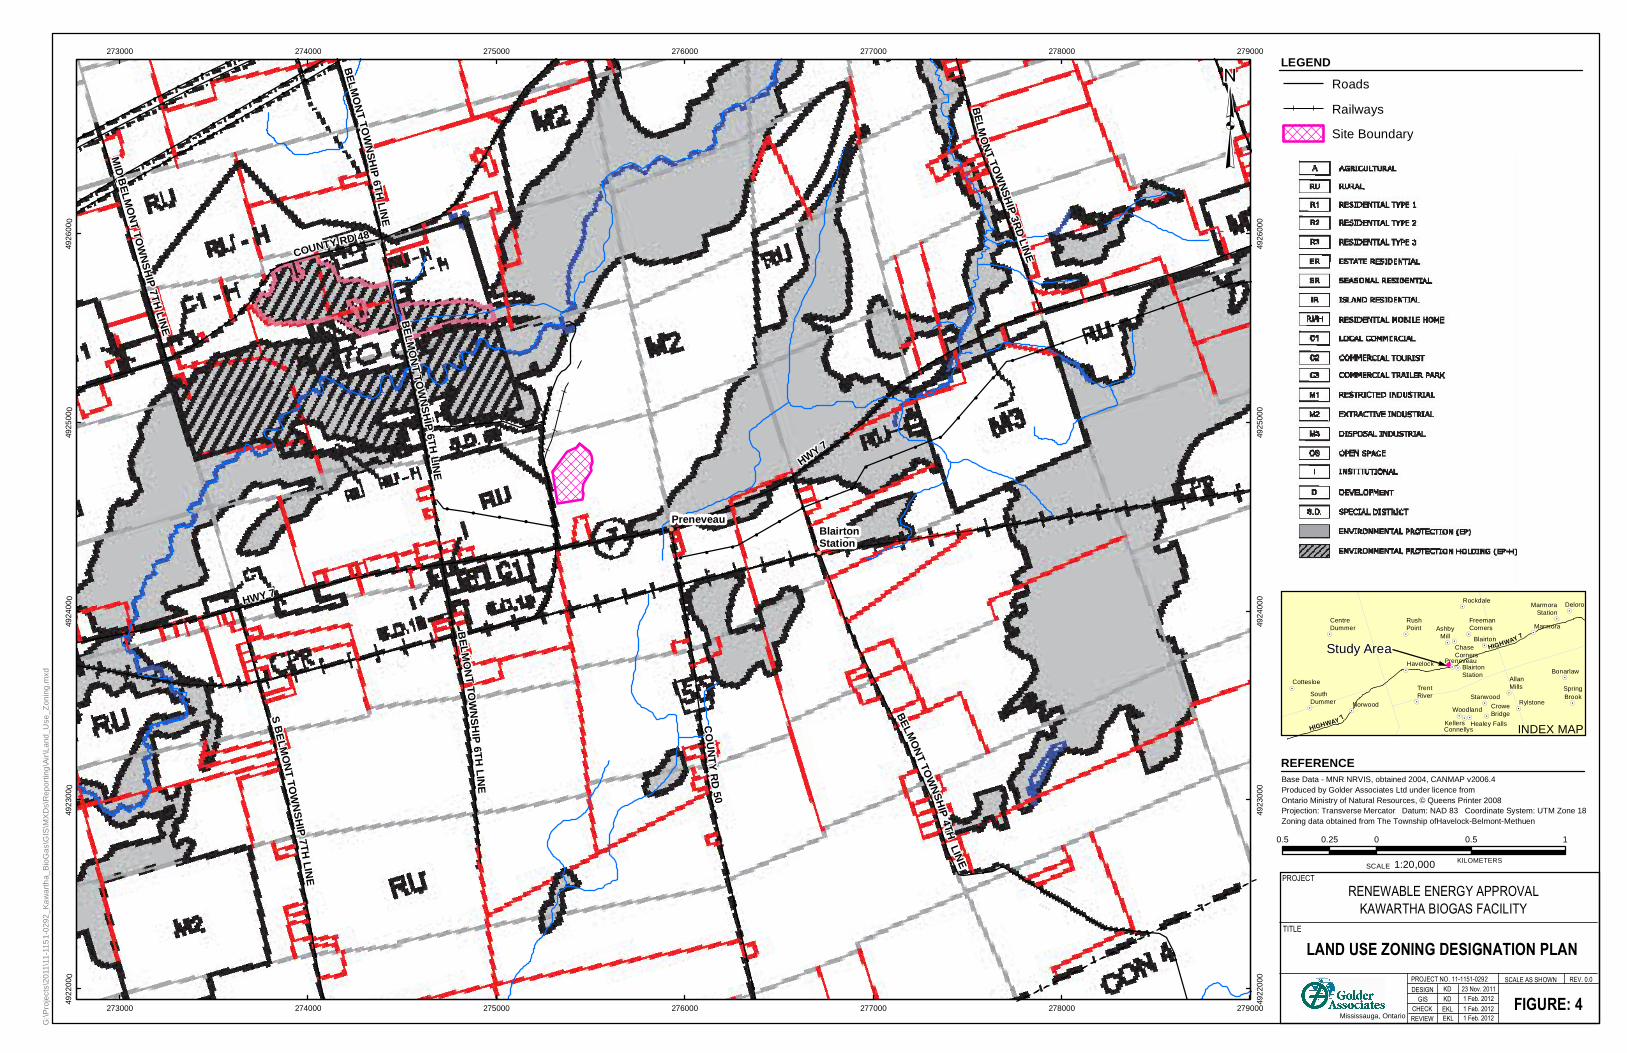
A zoning map including local land uses is provided as Figure 4 – Land Use Zoning Designation Plan.
ODOUR IMPACT ASSESSMENT
March 2012 Report No. 11-1151-0292 13
6.4 Averaging Periods and Time-Based Concentration Conversion The MOE Guidance document requires that odour levels be evaluated based on 10-minute peak concentrations. The shortest time period that the AERMOD model calculates is 1-hour, thus the concentrations must be converted from the 1-hour to 10-minute value. The resulting predicted concentrations were converted to the shorter 10-minute averaging period using the MOE conversion factor of 1.65, as specified in O. Reg. 419/05.
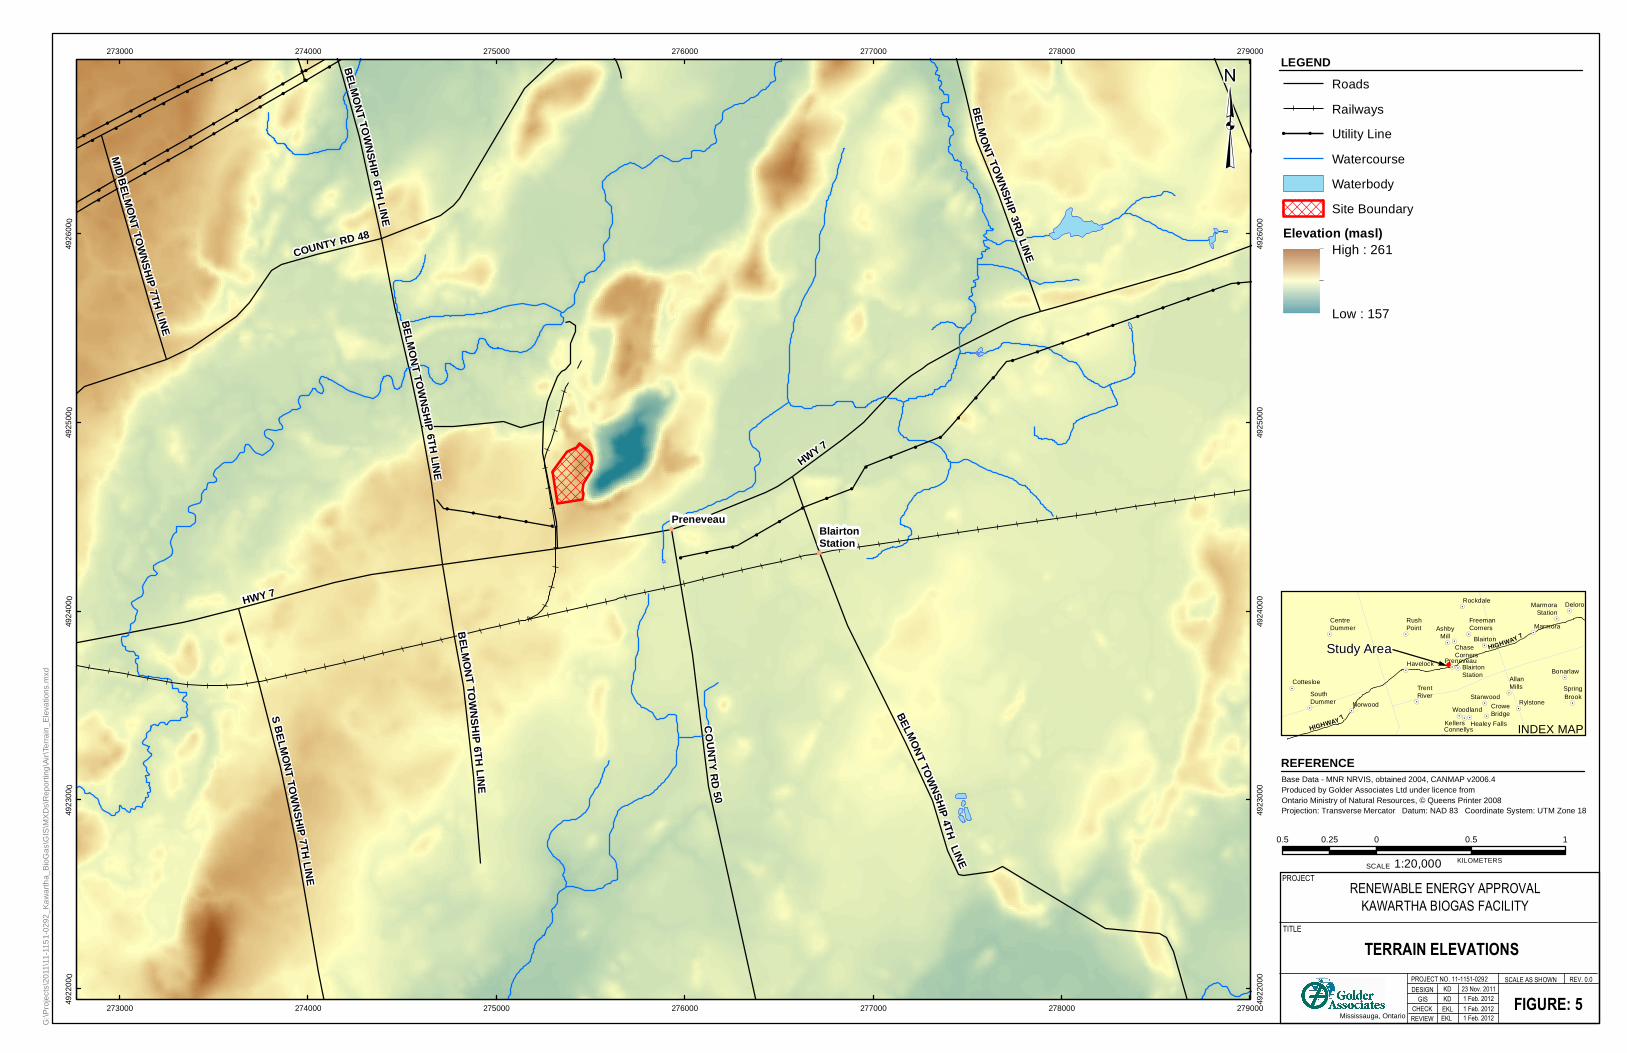
6.5 Digital Elevation Model Data Ontario digital elevation model (DEM) data was obtained from the MOE (7.5 minute format) and is illustrated in Figure 5 – Terrain Elevation. The DEM data was used to include the effects of terrain in the modelling. The terrain used is from the DEM dataset “tile100- Peterborough”. DEM data was pre-processed with AERMAP for use with AERMOD.
6.6 Source Input Parameters The emissions at the facility were modelled as eight point sources and two volume sources. The point sources include the five CHP engine boiler stacks, the ammonia scrubbers (only one is operational at any time), the plant exhaust air and the emergency flare. The ammonium sulphate tank and sulphuric acid tank were modelled as volume sources. Individual source locations were based on information provided by Facility personnel and site drawings (Appendix A). All sources in each scenario were conservatively assumed to be operating simultaneously, continuously, and at maximum emission rates.
Two Facility scenarios were modelled: normal operations and commissioning conditions. During normal operations, all equipment is assumed to be operating except for the emergency flare and one of the ammonia scrubbers. During commissioning conditions, all equipment is operational except for three of the five CHP engines.
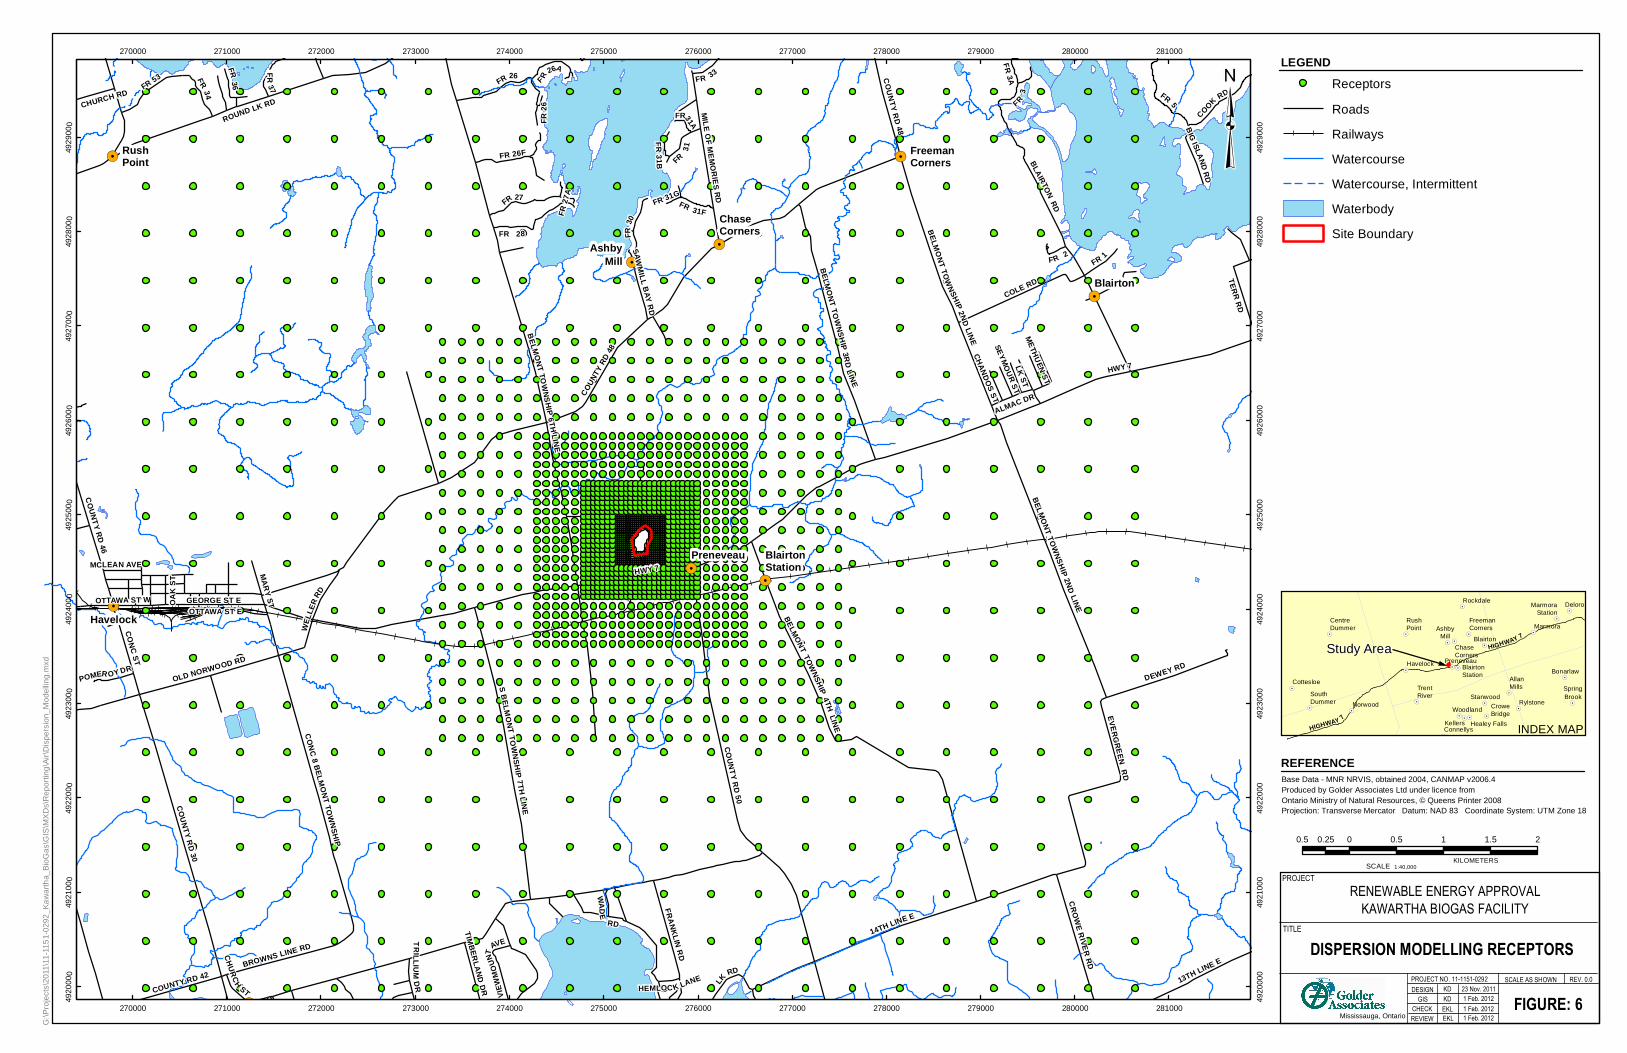
A summary of the AERMOD source input parameters and odour emission rates are provided in source summary tables (Table 1a and Table 1b). The dispersion model sources are provided in Figure 6.
6.7 Receptors Receptors were chosen based on recommendations provided in section 7.1 of the ADMGO, which is in accordance with section 14 of O. Reg. 419/05. Specifically, a nested receptor grid, centered around the outer edges of all the sources, was placed as follows:
a) 20 m spacing, within an area of 200 m by 200 m;
b) 50 m spacing, within an area surrounding the area described in (a) with a boundary at 300 m by 300 m outside the boundary of the area described in (a);
c) 100 m spacing, within an area surrounding the area described in (b) with a boundary at 800 m by 800 m outside the boundary of the area described in (a);
ODOUR IMPACT ASSESSMENT
March 2012 Report No. 11-1151-0292 14
d) 200 m spacing, within an area surrounding the area described in (c) with a boundary at 1,800 m by 1,800 m outside the boundary of the area described in (a); and
e) 500 m spacing, within an area surrounding the area described in (d) with a boundary at 4,800 m by 4,800 m outside the boundary of the area described in (a).
In addition to using the nested receptor grid, receptors were also placed every 10 m along the property line.
Sensitive receptors were not considered as the odour standards were assessed at all receptors, with a special focus on the property boundary. If the odour concentrations are below the MOE standards at the property boundary, they should be met at all outside receptors.
The area of modeling coverage is illustrated on Figure 6 – Dispersion Modelling Receptors.
6.8 Building Downwash Building wake effects were considered in this modelling study using the U.S. EPA’s Building Profile Input Program (BPIP-PRIME), a pre-processor to AERMOD. The inputs into this pre-processor include the coordinates and heights of the buildings and stacks. The BPIP output is used in the AERMOD building wake effect calculation.
The PRIME plume rise algorithms include vertical wind shear calculations (important for buoyant releases from short stacks [i.e., stacks at release heights within the recirculation zones of buildings]). The PRIME algorithm also allows for the wind speed deficit induced by the building to change with respect to the distance from the building. These factors improve the accuracy of predicted concentrations within building wake zones that form in the lee of buildings.
The building obstacles as used in the BPIP program are shown in Figure 7 – Building Downwash Plan.
6.9 Frequency Analysis According to the MOE Guidance Document, frequency analysis is only required when the 10-minute standard is not met at the property boundary receptors. No frequency analysis was performed as the 10-minute standard was met at the property boundary for the Facility.
ODOUR IMPACT ASSESSMENT
March 2012 Report No. 11-1151-0292 15
7.0 DISPERSION MODELLING RESULTS The dispersion model results demonstrate that the 10-minute H2S odour standards are met at the property boundary of the Facility during normal operations and commissioning conditions. The results are presented in Table 2a – Emission Summary Table Normal Operations and Table 2b – Emission Summary Table Commissioning Conditions.
For Scenario 1, Normal Operations, maximum predicted concentrations of hydrogen sulphide were estimated to be 67% of the MOE 10-minute standard for the entire modelled period (5 year data set).
For Scenario 2, Commissioning Operations, maximum predicted concentrations of hydrogen sulphide were estimated to be 67% of the MOE 10-minute standard for the entire modelled period (5 year data set).
ODOUR IMPACT ASSESSMENT
March 2012 Report No. 11-1151-0292 16
8.0 ODOUR MANAGEMENT The dispersion model results demonstrate that the expected odour impact from this Facility is below the MOE 10-minute odour standards for the entire modelling period (five year) at all the receptors. The Facility will employ the systems described in Section 5 to manage potential odour emissions.
ODOUR IMPACT ASSESSMENT
March 2012 Report No. 11-1151-0292 17
9.0 CONCLUSIONS The four key factors that are typically considered when conducting an odour impact assessment include; intensity, duration, frequency and offensiveness. The use of odour concentrations in an air dispersion model can address only the first three of these factors. An odour concentration is not an indicator of the offensiveness of a particular odour. Offensiveness is a subjective factor that varies by individual, and therefore has not been considered in this analysis. Offensiveness can be addressed through facility specific odour management plans.
Dispersion modelling is a method of predicting the impact of one or more stationary sources of air pollutants. The models are used to predict the highest concentration expected from a facility. For this reason, the dispersion models may over-predict the concentrations in an assessment. A modelled prediction alone does not mean that there will be an air pollution episode; it is only a flag indicating potential air quality impacts. The approach to this assessment was conservative, based on maximum operating conditions at the site.
This odour impact analysis demonstrates that the Facility is capable of operating in compliance with the MOE guidance for odorous compounds at all receptors.
ODOUR IMPACT ASSESSMENT
March 2012 Report No. 11-1151-0292
Report Signature Page
GOLDER ASSOCIATES LTD.
Janya Kelly, B.Sc. (Hons), Ph.D. Emily Lau, B.A.Sc., P.Eng. Air Quality Specialist Air Quality Engineer
Anthony Ciccone, Ph.D., P.Eng. Principal
JK/EKL/ADC/ng
Golder, Golder Associates and the GA globe design are trademarks of Golder Associates Corporation.