THE APPROACH TO PERFORMANCE MEASUREMENT 1.1 1 The approach to performance measurement CONTENTS 1.1 Aims of the Review 1.1 1.2 The role of government in delivering services 1.2 1.3 Reasons for measuring comparative performance 1.4 1.4 Scope 1.5 1.5 Approach 1.9 1.6 Using the data in this Report 1.19 1.7 Other performance measurement exercises 1.21 1.8 References 1.26 1.1 Aims of the Review Heads of government (now the Council of Australian Governments or COAG) established the Review of Government Service Provision (the Review) to provide information on the effectiveness and efficiency of government services in Australia (see terms of reference, p. XXXI). A Steering Committee, comprising senior representatives from the central agencies of all governments, manages the Review with the assistance of a Secretariat provided by the Productivity Commission. The Review was established in 1993 to: • provide ongoing comparisons of the performance of government services • report on service provision reforms that governments have implemented or that are under consideration. The Report on Government Services, now in its fifteenth edition, is a tool for government. It has been used for strategic budget and policy planning, and for
Transcript
THE APPROACH TO PERFORMANCE MEASUREMENT
1.1
1 The approach to performance measurement
CONTENTS
1.1 Aims of the Review 1.1
1.2 The role of government in delivering services 1.2
1.3 Reasons for measuring comparative performance 1.4
1.4 Scope 1.5
1.5 Approach 1.9
1.6 Using the data in this Report 1.19
1.7 Other performance measurement exercises 1.21
1.8 References 1.26
1.1 Aims of the Review
Heads of government (now the Council of Australian Governments or COAG) established the Review of Government Service Provision (the Review) to provide information on the effectiveness and efficiency of government services in Australia (see terms of reference, p. XXXI). A Steering Committee, comprising senior representatives from the central agencies of all governments, manages the Review with the assistance of a Secretariat provided by the Productivity Commission. The Review was established in 1993 to:
• provide ongoing comparisons of the performance of government services
• report on service provision reforms that governments have implemented or that are under consideration.
The Report on Government Services, now in its fifteenth edition, is a tool for government. It has been used for strategic budget and policy planning, and for
1.2 REPORT ON GOVERNMENT SERVICES 2010
policy evaluation. Information in the Report has been used to assess the resource needs and resource performance of departments. It has also been used to identify jurisdictions with whom to share information on services.
The data in this Report can also provide an incentive to improve the performance of government services, by:
• enhancing measurement approaches and techniques in relation to aspects of performance, such as unit costs and service quality
• helping jurisdictions identify where there is scope for improvement
• promoting greater transparency and informed debate about comparative performance.
COAG agreed in 2009 to a review of the Report on Government Services, to be undertaken by a combined Senior Officials and Heads of Treasuries Working Group. COAG endorsed the review’s recommendations at its 7 December 2009 meeting, including that ‘the Steering Committee’s central role in collecting and publishing data on government service delivery, and the need for timely access to data held by data providers, should be stated in [a] new terms of reference and mandated by COAG’ (COAG 2009, recommendation 20). The Steering Committee will implement these recommendations over the next three Report editions (chapter 2).
1.2 The role of government in delivering services
All services included in the Report on Government Services affect the community in significant ways. Some services form an important part of the nation’s social welfare system (for example, public housing and other community services), some are provided to people with specific needs (for example, aged care and disability services), and others are typically used by each person in the community at some stage during their life (for example, education and training, health services, police services and emergency services).
THE APPROACH TO PERFORMANCE MEASUREMENT
1.3
Generally, the services that governments deliver are largely concerned with:
• providing ‘public goods’,1 including:
– creating a legal framework that determines the rules for ownership of property and the operation of markets (for example, enforcing property rights, checking abuses of power and upholding the rule of law) — a framework that encompasses the work of the courts, police and corrective services agencies in maintaining law and order
– managing adverse events, including the work of emergency services (such as fire and flood control) and some aspects of the health system (such as vaccinations)
• enabling higher levels, higher quality and/or more equitable consumption of services that governments consider to have particular merit or that generate beneficial spillover effects for the community.2 Examples of such services include education, health services, ambulance services, community services and housing.
How governments deliver services
Governments use a mix of methods to deliver services to the community, including:
• delivering or providing the services directly (a ‘delivery/provider’ role)
• funding external providers through grants or the purchase of services (a ‘purchaser’ role)
• subsidising users (through vouchers or cash payments) to purchase services from external providers
• imposing community service obligations on public and private providers
• providing incentives to users and/or providers, such as reducing tax obligations in particular circumstances (known as ‘tax expenditures’).
1 Public goods are those where one person’s consumption does not reduce consumption by others,
and where it is not possible to exclude individuals from access (for example, national defence). These goods tend not to be produced in private markets because people can consume the goods without paying for them.
2 In private markets, the production of services that result in positive (or beneficial) spillover effects tends to be lower than is desirable for society as a whole, because producers cannot charge for the wider benefits to society.
1.4 REPORT ON GOVERNMENT SERVICES 2010
1.3 Reasons for measuring comparative performance
Government services, including the services covered in this Report, are vital to the community’s wellbeing. Governments need to know whether their policies are effective and being implemented efficiently, and whether services are reaching those people for whom they are intended.
Improving government service provision can lead to major social and economic benefits. Traditionally, much of the effort to improve the effectiveness of government services has focused on increasing the level of resources devoted to them. Another important means of enhancing services is finding higher quality and more cost effective ways to use existing resources.
Performance measurement provides one means of shifting the focus from the level of resources to the efficient and effective use of those resources. In this Report performance measurement is defined as the ongoing comparison of the efficiency, effectiveness and equity of Australian, State and Territory governments’ service delivery. Performance measurement can:
• help clarify government objectives and responsibilities
• promote analysis of the relationships between agencies and between programs, enabling governments to coordinate policy within and across agencies
• make performance more transparent, enabling assessment of whether and how well program objectives are being met
• provide governments with indicators of their policy and program performance over time
• inform the wider community about government service performance
• encourage ongoing performance improvement.
The three main reasons for reporting comparative performance information across jurisdictions are:
• to verify high performance and identify agencies and service areas that are successful
• to enable agencies to learn from peers that are delivering higher quality and/or more cost effective services
• to generate additional incentives for agencies and services to improve performance.
Comparative data are particularly important for government services, given that limited information is available to those supplying, and receiving, services. Each
THE APPROACH TO PERFORMANCE MEASUREMENT
1.5
jurisdiction has, for example, one police service and one protection and support service. As a result, those responsible for delivering the services do not have access to the same level of information that is available to providers in competitive markets. Interjurisdictional comparisons also offer a level of accountability to consumers, who have little opportunity to express their preferences by accessing services elsewhere.
Reporting measures of comparative performance also facilitates interjurisdictional learning, particularly where governments have adopted different policy approaches. While this Report does not extend to recommendations on how best to provide government services, the information in the Report assists governments to make such assessments.
Governments have considered a range of general policy approaches when deciding how to deliver services. These approaches include:
• moving from historical or input based funding to output based funding (for example, casemix funding in public hospitals in Victoria)
• separating the purchaser and provider roles for government organisations (for example, corporatisation of agencies providing services)
• outsourcing the provider roles (for example, competitive tendering for service delivery)
• devolving and decentralising decision making by government service providers (for example, devolving decision making in schools to local school communities)
• examining alternative delivery mechanisms (for example, deinstitutionalising community services and offering greater consumer choice)
• implementing user charging (for example, the use of co-payments to help ration service use).
Comparisons that draw on reliable performance information can help governments better understand the strengths and weaknesses of each approach, and the circumstances in which each can work best.
1.4 Scope
This Report contains performance information on 14 overarching service areas (box 1.1). These government services have two important features:
• their key objectives are common or similar across jurisdictions (lending themselves to comparative performance reporting)
1.6 REPORT ON GOVERNMENT SERVICES 2010
• they make an important contribution to the community and/or economy (meaning there are potentially significant gains from improved effectiveness or efficiency).
Box 1.1 Services included in the 2010 Report Early childhood, education & training — Children’s services (chapter 3)
— Breast cancer detection and management, and specialised mental health services (chapter 12)
Community services — Aged care services (chapter 13)
— Services for people with disability (chapter 14)
— Protection and support services (chapter 15)
Housing — Public housing and mainstream community housing, State owned and managed Indigenous housing, Indigenous community housing and Commonwealth Rent Assistance (chapter 16)
THE APPROACH TO PERFORMANCE MEASUREMENT
1.7
The services in the Report absorb a significant level of government expenditure. While not all data relate to the same time period, the services in the 2010 Report accounted for approximately $136.2 billion in government expenditure (figure 1.1), representing around 73.9 per cent of total government recurrent expenditure3 in 2008-09. This is equivalent to about 13.1 per cent of gross domestic product.
Funding from government may not meet the full cost of delivering a service to the community. Users of services and not-for-profit organisations can also contribute funding and other resources. The scope of the Report, however, is confined to the cost to government, for reasons explained in box 1.2.
Figure 1.1 Estimated government recurrent expenditure on services covered by the 2010 Reporta, b, c, d, e
Emergency management
$5.1 billion
Health $55.3 billion
Early childhood,
education & training
$41.3 billionCommunity
services $18.0 billion
Justice $11.8 billion
Housing $4.7 billion
a Data for 2008-09 were not available for all services. Table 2.1 in chapter 2 indicates the latest year for which data are available for each service area. b Community services expenditure includes juvenile justice services for the first time. c Health expenditure includes only the health services reported on in the health chapters of the Report: public hospitals, primary and community health services, breast cancer screening and specialised mental health services. d Early childhood, education and training expenditure excludes higher education. e Data exclude user cost of capital.
Source: Prefaces C and F; Chapters 3–16.
3 General Government Final Consumption Expenditure, sourced from ABS National Income,
Expenditure and product, Australian National Accounts Cat. no. 5206.0.
1.8 REPORT ON GOVERNMENT SERVICES 2010
Box 1.2 Cost to government and total cost This Report provides information about the cost to government of providing services. Governments aim to maximise the benefit to the community from the use of government funds. It may be argued that the Report should also account for the costs where non-government groups such as charities, not-for-profit organisations, private providers and users of services contribute resources for the services covered by the Report. Although the contributions of these other groups are not negligible, the purpose of the Report is to provide information to assist governments in making decisions about the effectiveness and efficiency of government expenditures.
If a government provides services directly, then it is accountable for all resources used. In such circumstances, the Report aims to include the full costs of providing the service, including the cost of capital. This approach allows governments to compare the internal management of their services with that of counterparts in other jurisdictions.
The Report also includes information on the cost to government of services delivered in other ways, including the purchase of services from government and non-government providers. This information can assist governments in assessing their purchase decisions.
Sometimes, a private organisation will offer to deliver a service at a lower cost to government than the cost of government providing that service directly, even though the private organisation may use at least as many resources as the government provider. This situation can arise for not-for-profit organisations such as charities, which may be able to charge less because they operate the service as an adjunct to another activity or because they have access to resources that are not costed at market rates (such as donations, church buildings and volunteers).
This Report does not seek to facilitate comparisons between the internal management of government providers and that of non-government providers, and there would be difficulties in collecting data to make such comparisons. As a result, there is no attempt to compare the full cost of delivery by non-government organisations with the full cost of delivery by government service providers.
The focus of this Report is on the effectiveness and efficiency of government purchase or supply of specific services, rather than on general government income support. That is, the Report covers aged care but not the aged pension, disability services but not disability pensions, and children’s services but not family payments (although descriptive information on income support is provided in some cases). The impact of child care subsidies on the affordability of childcare services is reported (chapter 3), and Commonwealth Rent Assistance is reported on the basis that it is a targeted payment to assist in the purchase of housing services, and is not general income support (chapter 16).
THE APPROACH TO PERFORMANCE MEASUREMENT
1.9
1.5 Approach
The Report uses a common method for reporting comparative performance for a range of services. Adopting a common method has several benefits:
• a convenient and useful resource for people interested in multiple service areas
• insights into approaches to performance assessment across services
• progress in performance reporting in any one service area demonstrates what is possible and encourages improved reporting by other services
• a capacity to address issues that arise across service areas (for example, how to measure timeliness and other aspects of quality)
• an opportunity to address issues that have an impact on (or are affected by) multiple service areas.
A number of the services covered by the Report are also subject to other performance measurement exercises. Distinguishing features of the approach taken in the Report are:
• a focus on non-technical information, making it accessible to non-specialists
• regular publication, allowing monitoring of performance over time
• inclusion of much otherwise unpublished data to present comprehensive performance information
• the compilation of performance reporting across a number of service areas in a single report, facilitating the sharing of insights across service areas.
Guiding principles
The aim of the Report is to provide objective performance information to facilitate informed policy judgments. The following guiding principles apply:
• A focus on outcomes — performance indicators should focus on outcomes from the provision of government services, reflecting whether service objectives have been met.
• Comprehensiveness — the performance indicator framework should be comprehensive, assessing performance against all important objectives.
• Comparability — data should be comparable across jurisdictions and over time wherever possible. Comparable information is a priority of the Review but is related to progressive data availability and timeliness. Where data are not yet comparable across jurisdictions, time series analysis within jurisdictions is particularly important.
1.10 REPORT ON GOVERNMENT SERVICES 2010
• Progressive data availability — the ultimate aim is comparable data for all jurisdictions but progress may differ across jurisdictions. Data are generally presented for those jurisdictions that can currently report (rather than waiting until data are available for all jurisdictions).
• Timeliness — data published in the Report need to be as recent as possible to retain relevance for decision makers. In some cases, there may be a trade-off between the degree of precision of data and its timely availability, because more recent data has had less time for validation.
The general approach taken in the Report is to use acceptable (albeit imperfect) performance indicators that are already in use in Australia or internationally. Adopting these indicators can lower the costs of, and reduce delays in, reporting on performance. Although the Steering Committee values time series data as a means of evaluating developments in service delivery, performance indicators sometimes change from one Report to the next when improved or more appropriate performance indicators are developed.
As a general rule, the Report does not establish best practice benchmarks. However, governments can use the information in the Report to identify appropriate benchmarks (box 1.3).
THE APPROACH TO PERFORMANCE MEASUREMENT
1.11
Box 1.3 Benchmarking Benchmarking service delivery is a systematic process of searching for and encouraging the introduction of best practice. The three main forms of benchmarking are: (1) results benchmarking (comparing performance within and between organisations using performance indicators of effectiveness and efficiency); (2) process benchmarking (analysing systems, activities and tasks that turn inputs and outputs into outcomes); and (3) setting best practice standards (establishing goals and standards to which organisations can aspire).
Benchmarking typically involves a number of steps. Whatever the chosen approach or focus, the steps usually include:
• deciding why, when, and what to benchmark
• analysing plans and performance (reviewing objectives and identifying performance indicators and own performance)
• establishing benchmarking partners
• obtaining performance data and analysing differences in performance
• identifying best practice and the most useful improvements
• implementing improvements in practice
• assessing improvements and re-benchmarking (MAB/MIAC 1996).
The performance information in the Report can contribute to many of the above steps in a results benchmarking cycle, and assist governments to implement best practice.
The performance indicator framework
The Report’s general performance framework is set out in figure 1.2. The framework depicts the Review’s focus on outcomes, consistent with demand by governments for outcome oriented performance information. This outcome information is supplemented by information on outputs. Output indicators are grouped under ‘equity’, ‘effectiveness’ and ‘efficiency’ headings.
1.12 REPORT ON GOVERNMENT SERVICES 2010
Figure 1.2 A general framework and examples of performance indicators
Outputs Outcomes
Equity ofoutcomeindicators
Programeffectiveness
indicators
Costeffectiveness
indicators
Access
Access
Appropriateness
Quality
Inputs peroutput unit
Equity
Effectiveness
Efficiency
Equity of accessindicators
Accessindicators
Appropriatenessindicators
Qualityindicators
Technicalefficiencyindicators
PERFORMANCE
Objectives
The service process
The general framework reflects the service process through which service providers transform inputs into outputs and outcomes in order to achieve desired policy and program objectives.
For each service, governments have a number of objectives that relate to desired outcomes for the community. To achieve these objectives, governments provide services and/or fund service providers. Service providers transform resources (inputs) into services (outputs). The rate at which resources are used to make this transformation is known as ‘technical efficiency’.
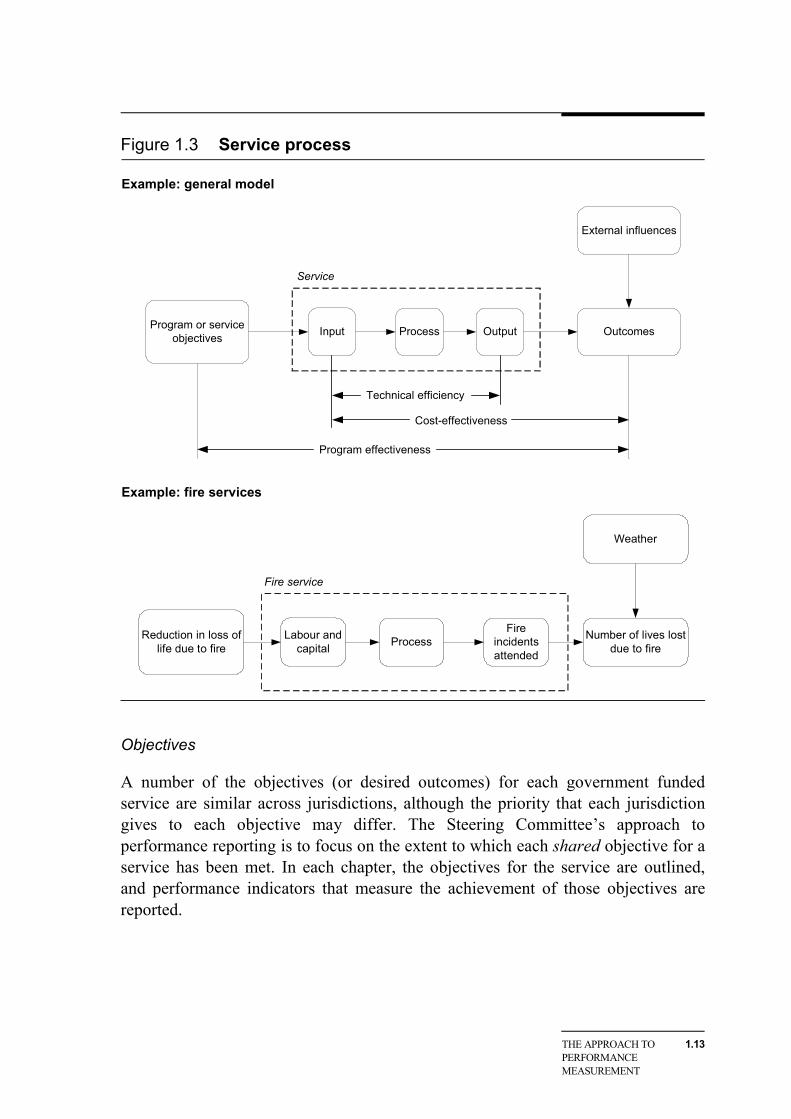
The impact of these outputs on individuals, groups and the community are the outcomes of the service. In this Report, the rate at which resources are used to generate outcomes is referred to as ‘cost effectiveness’. Often, outcomes (and to a lesser extent, outputs) are influenced by factors external to the service. Figure 1.3 distinguishes between program efficiency and program effectiveness, and notes the influence of factors external to a service.
THE APPROACH TO PERFORMANCE MEASUREMENT
1.13
Figure 1.3 Service process
Example: general model
Program or serviceobjectives Input Process Output Outcomes
External influences
Program effectiveness
Cost-effectiveness
Service
Technical efficiency
Example: fire services
Reduction in loss oflife due to fire
Labour andcapital Process
Fireincidentsattended
Number of lives lostdue to fire
Weather
Fire service
Objectives
A number of the objectives (or desired outcomes) for each government funded service are similar across jurisdictions, although the priority that each jurisdiction gives to each objective may differ. The Steering Committee’s approach to performance reporting is to focus on the extent to which each shared objective for a service has been met. In each chapter, the objectives for the service are outlined, and performance indicators that measure the achievement of those objectives are reported.
1.14 REPORT ON GOVERNMENT SERVICES 2010
Distinguishing outcomes and outputs
Outcome indicators provide information on the impact of a service on the status of an individual or a group, and on the success of the service area in achieving its objectives. Outputs are the actual services delivered.
Outcomes may be short term (intermediate) or longer term (final). A short term police random breath testing ‘blitz’, for example, may achieve the intermediate outcome of fewer drunk drivers and lead to a short term reduction in road deaths. A longer term outcome of a permanent reduction in road deaths is likely to reflect external factors such as the design quality of cars and capital investment in improved roads.
The approach in the Report is to:
• use both short term (or intermediate) and long term (or final) outcome indicators, as appropriate
• explain that government provided services are often only one contributing factor and, where possible, point to data on other factors, including different geographic and demographic characteristics across jurisdictions. (Appendix A contains detailed statistics and short profiles on each State and Territory, which may assist in interpreting the performance indicators presented in the Report.)
While the aim of the Review is to focus on outcomes, they are often difficult to measure. The Report therefore includes measures of outputs, with an understanding that there is a relationship between those outputs and desired outcomes, and that the measures of outputs are proxies for measures of outcomes. Output performance information is also critical for efficient and effective management of government services and is often the level of performance information that is of most interest to individuals who access services.
The indicator framework groups output indicators according to the desired characteristics of a service — for example, accessibility, appropriateness or quality (figure 1.2). By contrast, outcome indicators are not grouped according to desired characteristics, as outcomes typically depend on a number of service characteristics.
Equity, effectiveness and efficiency
There are inherent trade-offs in allocating resources and dangers in analysing only some aspects of a service. A unit of service may have a high cost but be more effective than a lower cost service, and therefore be more cost effective. The Report takes a comprehensive view of performance reporting, and its frameworks incorporate indicators across all relevant dimensions of performance.
THE APPROACH TO PERFORMANCE MEASUREMENT
1.15
In early editions, the Report framework gave equal prominence to effectiveness and efficiency as the two overarching dimensions of performance, with equity treated as a sub-dimension of effectiveness. The Report’s framework now refers to equity as a third element of performance, separate from effectiveness and efficiency. The principal reason for this distinction is that effectiveness indicators are generally absolute measures of performance, whereas equity indicators relate to the gap in service delivery outputs and outcomes between special needs groups and the general population. Accentuating equity highlights the potential for trade-offs across all three performance dimensions — equity, effectiveness and efficiency. Improving outcomes for a group with special needs, for example, may necessitate an increase in the average cost per unit of service.
Equity
The term ‘equity’ has a number of interpretations, which are explained in box 1.4. Equity indicators in this Report measure how well a service is meeting the needs of particular groups in society with special needs. Indicators may reflect both equity of access, whereby all Australians are expected to have adequate access to services, and equity of outcome, whereby all Australians are expected to achieve similar outcomes arising from service use.
Box 1.4 Equity Equity is an important concept in economic literature, with two elements:
• horizontal equity — the equal treatment of equals
• vertical equity — the unequal but equitable (‘fair’) treatment of unequals.
In the context of this Report:
• horizontal equity is exhibited when services are equally accessible to everyone in the community with a similar level of need.
• vertical equity is exhibited when services account for the special needs of particular groups in the community and adjust aspects of service delivery to suit these needs. This approach may be needed where geographic, cultural or other reasons mean some members of the community have difficulty accessing a standard service.
A number of criteria can be used to classify groups who may have special needs or difficulties in accessing government services. These include:
• language or literacy proficiency
• gender
• age
1.16 REPORT ON GOVERNMENT SERVICES 2010
• physical or mental capacity
• race or ethnicity
• geographic location.
Identifying those service recipients who belong to groups with special needs or access difficulties poses challenges, particularly when relying on client self-identification. If members of such groups are required to identify themselves, then the accuracy of the data will depend on how a group perceives the advantages (or disadvantages) of identification and whether such perceptions change over time (see for example, SCRGSP 2009). Comparability problems also arise where different data collections and different jurisdictions have different definitions of special needs groups.
The Report often uses the proportion of each target group in the broader community as a point of comparison when examining service delivery to special needs groups. This approach is reasonable for services that are provided on a virtually universal basis (for example, school education), but must be treated with caution for other services, where service provision is based on the level of need, which may vary between groups (for example, aged care services). Another option is to collect a more accurate profile of need (for example, the estimation of the ‘potential population’ of people with the potential to require specialist disability services at some time).
Where geographic location is used to identify groups with special needs, data are usually disaggregated according to either the metropolitan, rural and remote area classification system or the Australian Bureau of Statistics’ (ABS 2007) Australian Standard Geographical Classification of remoteness areas. These classifications are generally based on population density and/or the distance that residents need to travel to access services. The geographic classification system used in each chapter is outlined in chapter 2.
Such classifications are imperfect indicators of the time and cost of reaching a service. Further, they do not consider the client’s capacity to bear the cost of receiving the service (Griffith 1998). To improve the model, service centre locations would need to be reclassified according to the services they provide and the client’s cost of accessing the service. Moreover, for some services, classification systems based on distance or population are not useful indicators of access to services — for example, ambulances can sometimes respond more quickly in rural areas than in metropolitan areas because there is less traffic.
THE APPROACH TO PERFORMANCE MEASUREMENT
1.17
Effectiveness
Effectiveness indicators measure how well the outputs of a service achieve the stated objectives of that service. The reporting framework groups effectiveness indicators according to characteristics that are considered important to the service. For most chapters, these characteristics include access, appropriateness and/or quality.
Access
Access indicators measure how easily the community can obtain a service. In this Report, access has two main dimensions, undue delay (timeliness) and undue cost (affordability). Timeliness indicators in this Report include waiting times (for example, in public hospitals and for aged care services). Affordability indicators in this Report relate to the proportion of income spent on particular services (for example, out-of-pocket expenses in children’s services).
Appropriateness
Appropriateness indicators measure how well services meet client needs. An appropriateness indicator for the Supported Accommodation and Assistance Program, for example, is the proportion of clients receiving the services that they are assessed as needing. Appropriateness indicators also seek to identify the extent of any underservicing or overservicing (Renwick and Sadkowsky 1991).
Some services have developed measurable standards of service need against which levels of service can be assessed. The ‘overcrowding’ measure in housing, for example, measures the appropriateness of the size of the dwelling relative to the size of the household. Other services have few measurable standards of service need; for example, the desirable number of medical treatments for particular populations is not known. However, data on differences in service levels can indicate where further work could identify possible underservicing or overservicing.
Quality
Quality indicators reflect the extent to which a service is suited to its purpose and conforms to specifications. Information about quality is particularly important when there is a strong emphasis on increasing efficiency (as indicated by lower unit costs). There is usually more than one way in which to deliver a service, and each alternative has different implications for both cost and quality. Information about quality is needed to ensure all relevant aspects of performance are considered.
1.18 REPORT ON GOVERNMENT SERVICES 2010
The Steering Committee’s approach is to identify and report on aspects of quality, particularly actual or implied competence. Actual competence can be measured by the frequency of positive (or negative) events resulting from the actions of the service (for example, deaths resulting from health system errors such as an incorrect dose of drugs). Implied competence can be measured by proxy indicators, such as the extent to which aspects of a service (such as inputs, processes and outputs) conform to specifications — for example, the level of accreditation of public hospitals and aged care facilities.
The reporting framework includes quality as one aspect of effectiveness, and distinguishes it from access and appropriateness (figure 1.2). This distinction is somewhat artificial because these other aspects of service provision also contribute to a meaningful picture of quality.
Efficiency
The concept of efficiency has a number of dimensions. Overall economic efficiency requires satisfaction of technical, allocative and dynamic efficiency:
• technical efficiency requires that goods and services be produced at the lowest possible cost
• allocative efficiency requires the production of the set of goods and services that consumers value most, from a given set of resources
• dynamic efficiency means that, over time, consumers are offered new and better products, and existing products at lower cost.
This Report focuses on technical (or productive) efficiency. Technical efficiency indicators measure how well services use their resources (inputs) to produce outputs for the purpose of achieving desired outcomes. Government funding per unit of output delivered is a typical indicator of technical efficiency — for example, recurrent funding per annual curriculum hour for vocational education and training.
Comparisons of the unit cost of a service are a more meaningful input to public policy when they use the full cost to government, accounting for all resources consumed in providing the service. Problems can occur when some costs are not included or are treated inconsistently (for example, superannuation, overheads or the user cost of capital). The Steering Committee approach, where full cost information is not available in the short term, is that:
• data should be calculated consistently across jurisdictions
• data treatment should be fully transparent.
THE APPROACH TO PERFORMANCE MEASUREMENT
1.19
Where there are shortcomings in the data, other indicators of efficiency are used (including partial productivity ratios such as staff levels per student in government schools and administrative costs as a proportion of total expenditure in services for people with a disability).
The Commonwealth Grants Commission, when calculating relativities between states and territories to distribute Australian Government general purpose grants, accounts for both a jurisdiction’s ability to raise revenue, and influences beyond a jurisdiction’s control (called ‘disabilities’) that affect the jurisdiction’s cost of providing services and capacity to raise revenue. In relation to various service areas, the assessment may include a variety of factors, such as the size of the jurisdiction, the dispersed nature of the population and the sociodemographic distribution of the population (CGC 2006). This Report does not make cost adjustments based on any of these factors, but appendix A provides short statistical profiles of each State and Territory, which may assist readers to interpret the performance indicators presented in each chapter.
Variations to the general framework
In the health and emergency management areas of the Report, the general framework has been adapted to align more closely with the specific objectives and functions of the relevant services. These variations are explained in detail in the Health preface (preface E) and the Emergency management chapter (chapter 9).
1.6 Using the data in this Report
Data comparability
For each service, the performance indicator framework and indicator interpretation boxes show which data are provided on a comparable basis and which are not directly comparable. Where data are not directly comparable, appropriate qualifying commentary is provided in the text or footnotes. Data may not be directly comparable if:
• definitions or counting rules differ or are so broad that they result in different interpretations (for example, depreciation rules)
• the scope of measurement varies (for example, waiting times for elective surgery)
• the sample size is too small for statistical reliability.
1.20 REPORT ON GOVERNMENT SERVICES 2010
These issues do not always lead to material differences, and even where the differences are significant, relatively simple adjustments may resolve them in many cases. For example, payroll tax exemption has a material influence on the comparability of unit cost indicators, and cost data are adjusted in most chapters to account for payroll tax (SCRCSSP 1999).
Validation
Data contained in this Report vary in the extent to which they have been reviewed or validated. At a minimum, all data have been endorsed by the contributor and subjected to peer review by the working group for each service. Some data are formally audited and some data are supplied and verified by data collection agencies such as the ABS and the Australian Institute of Health and Welfare.
Timeliness and accuracy
Timeliness of data is an important consideration for policy makers. Sometimes there is a trade-off between the precision of data and its timely availability — data that are provided in a timely manner have had less time to undergo rigorous validation.
The Steering Committee manages this trade-off between timeliness and precision by publishing available data with appropriate qualifications. The ongoing nature of the Report provides an opportunity for the data to be improved over time. Publication increases scrutiny of the data and encourages timely improvements in data quality.
Improving the timeliness and accuracy of the data requires a high level of cooperation between the Steering Committee and participating agencies from all jurisdictions. Users of the Report are also an important source of feedback on issues relating to the improvement of performance reporting. The Steering Committee welcomes feedback, which can be forwarded to the Secretariat (see the contact details inside the front cover of this Report).
Effects of factors beyond the control of agencies
The differing environments in which service agencies operate affect the outcomes achieved by the agencies. Any comparison of performance across jurisdictions needs to consider the potential impact of differences in clients, geography, available inputs and input prices. Relatively high unit costs, for example, may result from inefficient performance, or from a high proportion of special needs clients, geographic dispersal, or a combination of these and other factors. Similarly, a poor
THE APPROACH TO PERFORMANCE MEASUREMENT
1.21
result for an effectiveness indicator may have more to do with client characteristics than service performance.
The Report provides information on some of the differences that might affect service delivery, to assist readers to interpret performance indicator results. This information takes the form of profiles of each service area, footnotes to tables and figures, and a statistical appendix (appendix A). The statistical appendix provides a range of general descriptive information for each jurisdiction, including the age profile, spatial distribution, income levels and education levels of the population, the tenure of dwellings and cultural heritage (such as Indigenous and ethnic status).
This Report does not attempt to adjust reported results for differences that may affect service delivery. Users of the Report will often be better placed to make the necessary judgments, perhaps with the benefit of additional information about the circumstances or priorities of specific jurisdictions.
1.7 Other performance measurement exercises
Related performance measurement exercises
Three other COAG performance measurement exercises are closely related to this Report:
• National Agreement performance reporting under the Intergovernmental Agreement on Federal Financial Relations (IGA)
The governance arrangements of these other COAG performance measurement exercises and their relationship with this Report are outlined below.
National Agreement performance reporting
In November 2008, COAG endorsed a new Intergovernmental Agreement on Federal Financial Relations (2009). The Ministerial Council for Federal Financial Relations has general oversight of the operations of the IGA [para. A4(a)].
The IGA included six new National Agreements (NAs):
• National Healthcare Agreement
• National Education Agreement
1.22 REPORT ON GOVERNMENT SERVICES 2010
• National Agreement for Skills and Workforce Development
• National Affordable Housing Agreement
• National Disability Agreement
• National Indigenous Reform Agreement.
COAG has also agreed to a new form of payment — National Partnership (NP) payments — to fund specific projects and to facilitate and/or reward states and territories that deliver on nationally significant reforms.
Five of the NAs are associated with a national Specific Purpose Payment (SPP) that can provide funding to the states and territories for the sector covered by the NA. These five SPPs cover schools, vocational education and training (VET), disability services, healthcare and affordable housing. The National Indigenous Reform Agreement is not associated with a specific SPP, but draws together Indigenous elements from the other NAs and is associated with several NP agreements.
Under the reforms, each NA contains the objectives, outcomes, outputs and performance indicators for each sector, and clarifies the respective roles and responsibilities of the Australian and State and Territory governments in the delivery of services. The performance of all governments in achieving mutually agreed outcomes and benchmarks specified in each NA will be monitored and assessed by the COAG Reform Council (CRC).
The Steering Committee was requested by COAG to collate information relevant to the NA performance indicators and provide this to the CRC for its analysis (COAG 2008a).
The Steering Committee recognises the importance of ensuring that related COAG performance reporting exercises are aligned. For this Report, the Steering Committee has revised performance indicator reporting in the Early childhood, education and training section (Part B) of this Report, to align with the education and training NAs. The Steering Committee anticipates that further alignment between this Report and the other NAs will be implemented in the 2011 Report.
Overcoming Indigenous Disadvantage report
In 2002, COAG commissioned the Steering Committee to produce a regular public report on progress in overcoming Indigenous disadvantage. The terms of reference for this report was updated in March 2009. Four editions of the Overcoming Indigenous Disadvantage: Key Indicators report have been published (SCRGSP 2003, 2005, 2007, 2009).
THE APPROACH TO PERFORMANCE MEASUREMENT
1.23
In contrast to the Report on Government Services, which focuses on the efficiency and effectiveness of specific services as well as outcomes of these services, the Overcoming Indigenous Disadvantage report focuses on outcomes for Indigenous people. It does not report on individual government services. The reporting framework has two tiers: ‘COAG targets and headline indicators’ for the longer term outcomes sought; and a second tier of ‘strategic areas for action’ and ‘strategic change indicators’ that are potentially responsive to government policies and programs in the shorter term.
COAG endorsed an alignment of the OID report framework and the NIRA indicators in March 2009. The Steering Committee is committed to ensuring alignment with relevant indicators in the Report on Government Services.
Indigenous Expenditure Report
In December 2007, COAG committed to reporting on expenditure on services to Indigenous Australians. In October 2008, Treasury requested the Secretariat for the Review to provide secretariat services to the Indigenous Expenditure Report Steering Committee, an arrangement endorsed by COAG in 2009.
The Indigenous Expenditure Report Steering Committee — under the auspices of the Heads of Treasuries and in consultation with Indigenous organisations, governments and researchers — has developed a national framework for collecting and reporting information on government expenditure on services to Indigenous and non-Indigenous Australians. A high-level overview of the reporting approach was endorsed by COAG at its July 2009 meeting.
The first data report is expected to be delivered to Heads of Treasuries by mid-2010. However, identifying the share of government expenditure that relates to Indigenous people is a complex exercise, and the quality of reporting is likely to improve across subsequent reports.
Developments in the Indigenous Expenditure Report have the potential to improve expenditure reporting in the Report on Government Services.
Performance monitoring in other countries
Performance reporting exercises are undertaken in other countries using various approaches.
1.24 REPORT ON GOVERNMENT SERVICES 2010
OECD
The OECD Factbook provides a global overview of major economic, social and environmental indicators. Data are provided for all OECD member countries and for selected non-member economies. The information is outcome focused, and is not linked to specific service delivery agencies. The 2009 Factbook’s special focus is on inequality — including equity of access to health and education in OECD countries (OECD 2009).
United Kingdom
The United Kingdom Government publishes key performance data on public service delivery on the national Treasury website. This reporting allows the public to assess how the United Kingdom Government is delivering across all areas of government. Reporting includes public service agreements that measure agency performance by setting out the aim of the department or program, the supporting objectives and the key outcome-based targets that are to be achieved during a specified period (HM Treasury 2008).
The Scottish Government publishes Scotland Performs, presenting national performance indicators and outcomes against a national performance framework, assessing how well Scotland is progressing in the following key areas: health and wellbeing; justice and communities; the environment; the economy; and education and skills (The Scottish Government 2009).
United States of America
The United States of America Government publishes reports and testimonies, including performance of government services. Some states in the US also report on government performance. For example, the Commonwealth of Virginia (Virginia’s state government) publishes Virginia Performs, reporting on an outcomes-based performance model encompassing an integrated array of state agency plans, objectives, performance measures and societal indicators (Commonwealth of Virginia 2009).
New Zealand
The New Zealand Ministry of Social Development publishes an annual Social Report, which provides information on the health and well-being of New Zealand society. Indicators are used to measure levels of wellbeing, to monitor trends over time, and to make comparisons with other countries. A web site provides data for
THE APPROACH TO PERFORMANCE MEASUREMENT
1.25
social report indicators by regional council and territorial authority areas. The Social Report covers nine ‘domains’ — unlike this Report, these domains do not directly reflect specific service areas (although there is sometimes a broad connection). A limited number of high level indicators are presented for each domain, but there is no attempt to comprehensively address the full range of objectives of any specific government service (Ministry of Social Development 2008).
1.26 REPORT ON GOVERNMENT SERVICES 2010
1.8 References ABS (Australian Bureau of Statistics) 2006, Measures of Australia’s Progress:
Summary Indicators, Re-issued May 2006, Cat. no. 1370.0.
—— 2007, Australian Standard Geographic Classification, Cat. no. 1216.0, Canberra.
COAG (Council of Australian Governments) 2007, COAG Communiqué 20 December 2007, www.coag.gov.au/coag_meeting_outcomes/2007-12-20/ index (accessed 20 April 2008).
—— 2008a, COAG Communiqué 3 July 2008, www.coag.gov.au/coag_ meeting_outcomes/2008-07-03/index #fragment-3 (accessed 20 October 2008).
—— 2008b, COAG Communique 29 November 2008, www.coag.gov.au/ coag_meeting_outcomes/2008-11-29/index (accessed 1 December 2008).
—— 2009, COAG Communique 7 December 2009, www.coag.gov.au/ coag_meeting_outcomes/2009-12-07/index.cfm (accessed 7 December 2009).
Commonwealth of Virginia 2009, Virginia Performs — Virginia’s Performance Leadership and Accountability System, 3 June, www.nascio.org/awards/ nominations/2009/2009VA3-ASCIO%202009%20VA%20DIKM%20VA%20 Performs.pdf (accessed 7 October 2009).
GAO (US Government Accountability Office) 2009, Reports and testimonies, www.gao.gov/docsearch/repandtest.html (accessed 18 November 2009).
Griffith, D.A. 1998, ‘The Griffith service access frame: a practical model for quantifying access to services, developing education profiles and measuring government policy outcomes in Australia’s service access disadvantaged areas’, Paper presented at the Northern Territory Institute of Educational Research Symposium, Darwin, 22–23 May.
HM Treasury 2008, www.hm-treasury.gov.uk/psp_index.htm (accessed 2 October 2009).
MAB/MIAC (Management Advisory Board and its Management Improvement Advisory Committee) 1996, Raising the Standard: Benchmarking for Better Government, Report no. 21, Canberra.
Ministry of Social Development 2008, The Social Report 2008, www.socialreport. msd.govt.nz/documents/social-report-2008.pdf (accessed 2 October 2009).
NHPC (National Health Performance Committee) 2001, National Health Performance Framework Report, Queensland Health, Brisbane.
THE APPROACH TO PERFORMANCE MEASUREMENT
1.27
OECD (Organisation for Economic Cooperation and Development) 2009, OECD Factbook 2009, www.oberon.sourceoecd.org/vl=2254667/cl=15/nw=1/rpsv/ factbook2009/index.htm (accessed 1 October 2009).
Parham, D. 2002, ‘Microeconomic reform and the revival in Australia’s growth in productivity and living standards’, Paper presented at the Conference of Economists, Adelaide, 1 October.
Renwick, M. and Sadkowsky, K. 1991, Variations in Surgery Rates, Australian Institute of Health and Welfare, Health Services Series no. 2, Canberra.
SCRCSSP (Steering Committee for the Review of Commonwealth/State Service Provision) 1997, Reforms in Government Service Provision 1997, Productivity Commission, Canberra.
—— 1998, Implementing Reforms in Government Services 1998, Productivity Commission, Canberra.
—— 1999, Payroll Tax in the Costing of Government Services, Productivity Commission, Canberra.
SCRGSP (Steering Committee for the Review of Government Service Provision) 2009 (and previous issues), Overcoming Indigenous Disadvantage: Key Indicators 2003, 2005, 2007, 2009, Productivity Commission, Canberra.
The Scottish Government 2009, Scotland Performs, www.scotland.gov.uk/ About/scotPerforms (accessed 7 October 2009).