33
Climate change and impacts on hydrological extremes Patrick Willems KU Leuven – Hydraulics division [email protected]
| Date post: | 08-Aug-2015 |
| Category: |
Environment |
| Upload: | vmmeu |
| View: | 127 times |
| Download: | 1 times |

Climate change and impacts on
hydrological extremes
Patrick Willems
KU Leuven – Hydraulics division

Global temperature rise 1880 – 2014:

Source: MIRA from Royal Meteorological Institute of Belgium
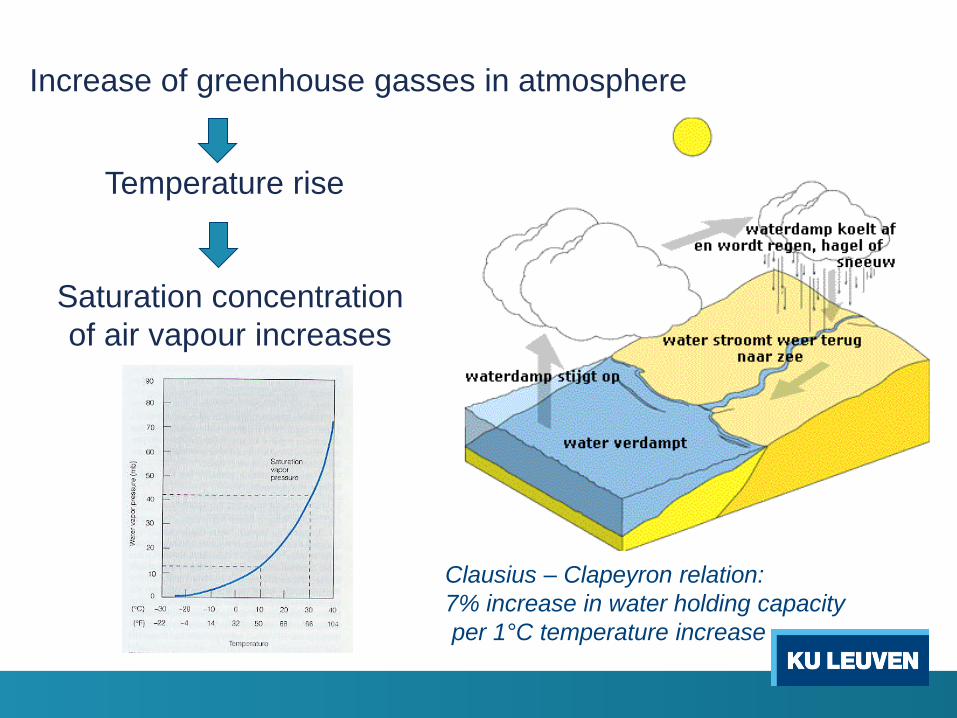
Saturation concentration
of air vapour increases
Temperature rise
Increase of greenhouse gasses in atmosphere
Clausius – Clapeyron relation:
7% increase in water holding capacity
per 1°C temperature increase

Impact temperature rise
Longer dry periods
: lower water availability
Increased peak rainfall intensities
: more floods?
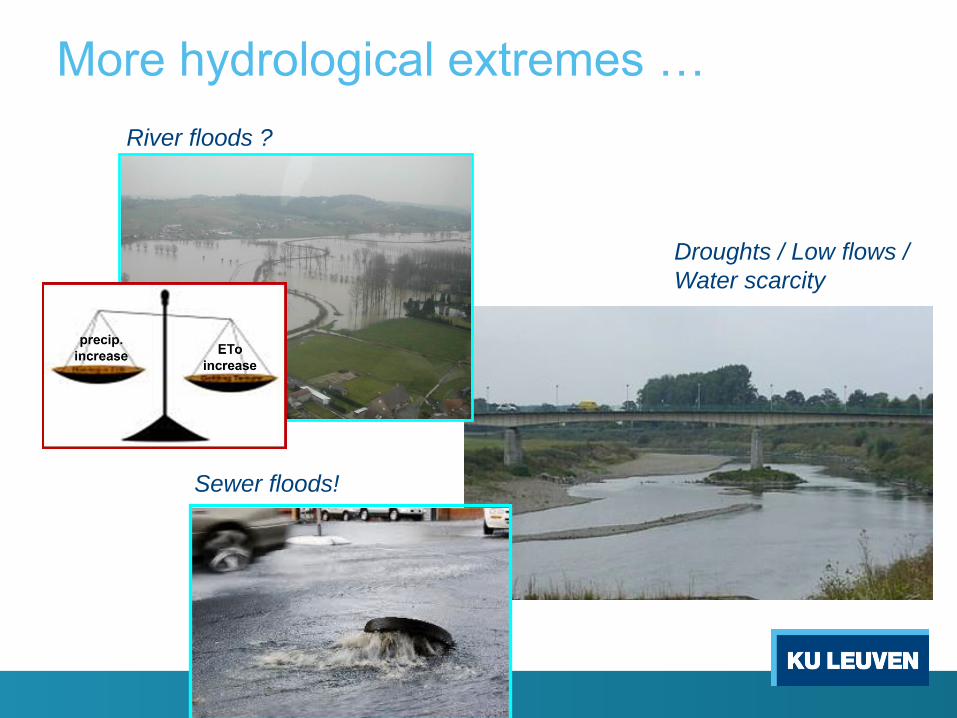
Sewer floods!
River floods ?
Droughts / Low flows /
Water scarcity
More hydrological extremes …

Do we also observe increasing trends
in the occurrence of hydrological extremes?

Historical trend analysis
Historical trends are difficult to quantify because of:
limited length of time series
instrumental or environmental changes (site relocation, changes and
deficiencies in monitoring program, improvement of instrumentation,
urban heat island effect)
strong inter-annual variations (weak signal-to-noise ratio)
(multi-)decadal climate oscillations.
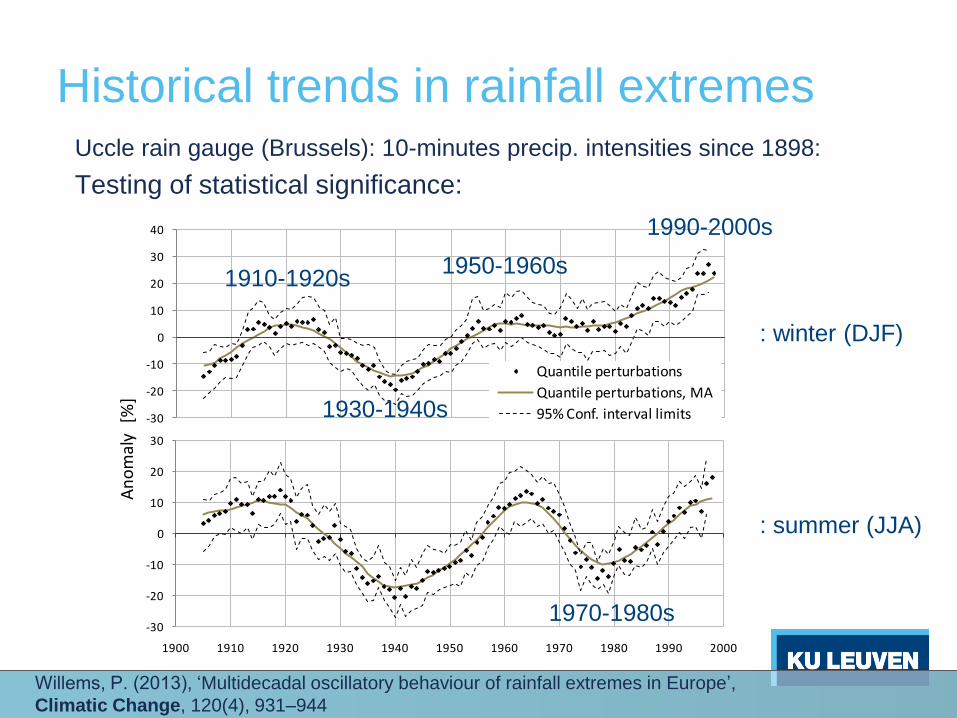
Historical trends in rainfall extremes Uccle rain gauge (Brussels): 10-minutes precip. intensities since 1898:
Testing of statistical significance:
-30
-20
-10
0
10
20
30
40
[%]
Quantile perturbations
Quantile perturbations, MA
95% Conf. interval limits
-30
-20
-10
0
10
20
30
1900 1910 1920 1930 1940 1950 1960 1970 1980 1990 2000
An
om
aly
1910-1920s 1950-1960s
1990-2000s
: winter (DJF)
: summer (JJA)
1930-1940s
1970-1980s
Willems, P. (2013), ‘Multidecadal oscillatory behaviour of rainfall extremes in Europe’,
Climatic Change, 120(4), 931–944
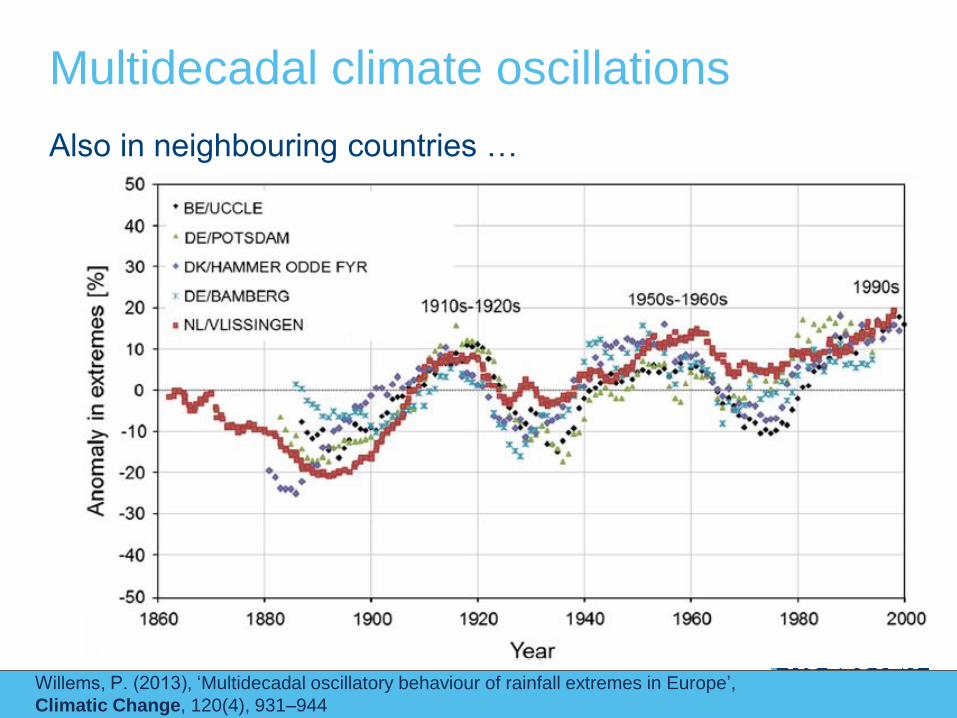
Multidecadal climate oscillations
Willems, P. (2013), ‘Multidecadal oscillatory behaviour of rainfall extremes in Europe’,
Climatic Change, 120(4), 931–944
Also in neighbouring countries …

(Anti-)correlations of climate oscillations across Europe
Daily rainfall ECA&D database:
-40
-20
0
20
40
60
80
1880 1900 1920 1940 1960 1980 2000
An
om
aly
[%]
precipitation, Uccle
precipitation, Bologna
Multidecadal climate oscillations
Willems, P. (2013), ‘Multidecadal oscillatory behaviour of rainfall extremes in Europe’,
Climatic Change, 120(4), 931–944

Multidecadal climate oscillations
Willems, P. (2013), ‘Multidecadal oscillatory behaviour of rainfall extremes in Europe’,
Climatic Change, 120(4), 931–944
Meuse river high flows:
-15
-10
-5
0
5
10
15
20
25
30
1900 1910 1920 1930 1940 1950 1960 1970 1980 1990 2000
An
om
aly
[%
]
Precipitation, Uccle
River flow, Meuse at Monsin
1910s-1920s 1950s-1960s
1990s-2000s

?
1900 1910 1920 1930 1940 1950 1960 1970 1980 1990 2000 2010
year [-]
-50
-40
-30
-20
-10
0
10
20
30
ano
maly
in
extr
em
es [
%]
winter, 10-year window
winter, 15-year window
long-term average
approximate cyclic variations
cyclic variations plus climate change
climate change effect
Future climate trends and oscillations??

Climate model projections
Nested approach: GCMs -> RCMs GCMs
RCMs
cumulus formation and small scale cloud processes leading to rain storms are not modelled
explicitly
cumulus parameterization to represent the collective influence of clouds (e.g. rainfall, radiation
budget) within a larger area (single grid)
primary purpose of cumulus parameterization is not to produce accurate rainfall, but to release
model instabilities ??
synoptic-scale RCMs therefore have poor accuracy in simulating precipitation extremes
Climate models make projections on the response of the
atmosphere to external forcing including GHG concentration
pathways. Such projections are inherently probabilistic and
it is important to treat them as such in further analyses.
GCMs: response of the global circulation to large scale forcing
(i.e. greenhouse gas concentrations)
RCMs:
account for finer scale forcing (topographic features),
convective precipitation due to the local convection effects

Climate model validation point observations
GCM results
areal reduction factor
Bias !
be careful with climate model rejections: cfr. influence natural variability, the limited length of the
available time series, difference in spatial scales, and influence of climate oscillations, AND poor
accuracy of rainfall extremes of short duration
RCM results
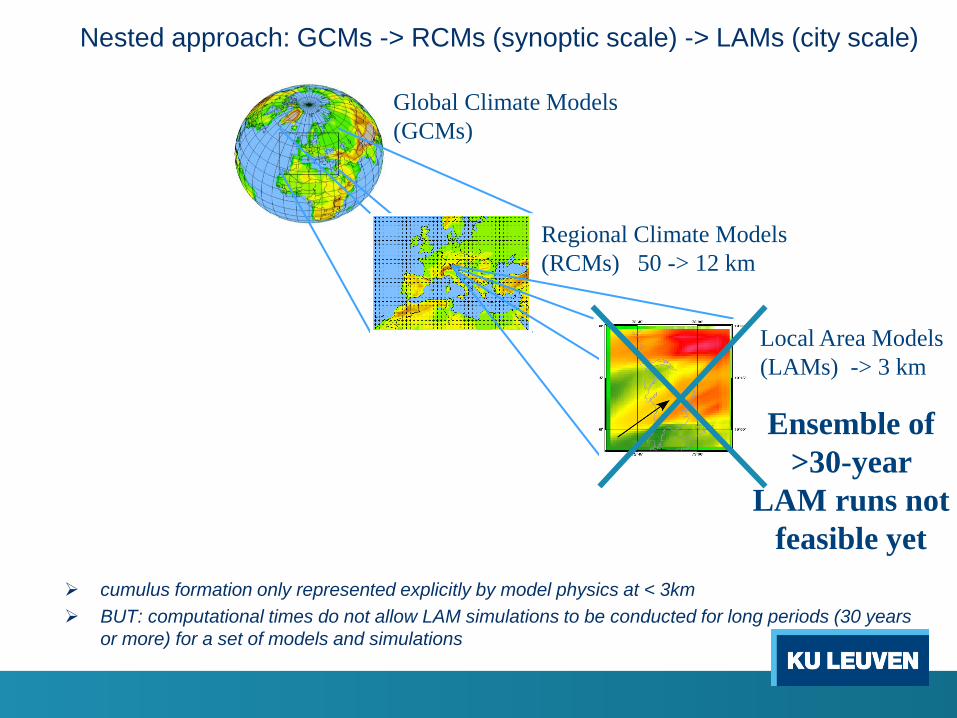
Global Climate Models
(GCMs)
Regional Climate Models
(RCMs) 50 -> 12 km
Local Area Models
(LAMs) -> 3 km
Nested approach: GCMs -> RCMs (synoptic scale) -> LAMs (city scale)
cumulus formation only represented explicitly by model physics at < 3km
BUT: computational times do not allow LAM simulations to be conducted for long periods (30 years
or more) for a set of models and simulations
Ensemble of
>30-year
LAM runs not
feasible yet

Global Climate Models
(GCMs)
Regional Climate Models
(RCMs) 50 -> 12 km
Local Area Models
(LAMs) -> 3 km
Hydrological
impact models
Need for bias correction and
statistical downscaling Ensemble of
>30-year
LAM runs not
feasible yet
Nested approach: GCMs -> RCMs (synoptic scale) -> LAMs (city scale)

Large Scale
Hydrological scale
Dynamical
downscaling
Statistical
downscaling
General
Circulation Models
(GCMs)
Regional
Climate Models
(RCMs)
150 – 300 km; seasonally – monthly
± 50 km; weekly - daily
± 25 km; daily
river catchment; hourly
Downscaling of climate model outputs

Climate system Hydrological system
GCMs 150 km
RCMs 25 km
RCMs 12 km
Large scale
“predictants”
Rainfall-runoff model
Local scale
“predictors”
Transfer function: [Local scale variable (Predictants)]
= F [Large scale variables (Predictors)]
Statistical properties representation
Conditional probability: stochastic model based on a conditional probability
between the predictant and predictors
Stochastic representation
Re-sampling: “Weather typing”, a historical look to the data
Time series representation
Statistical downscaling
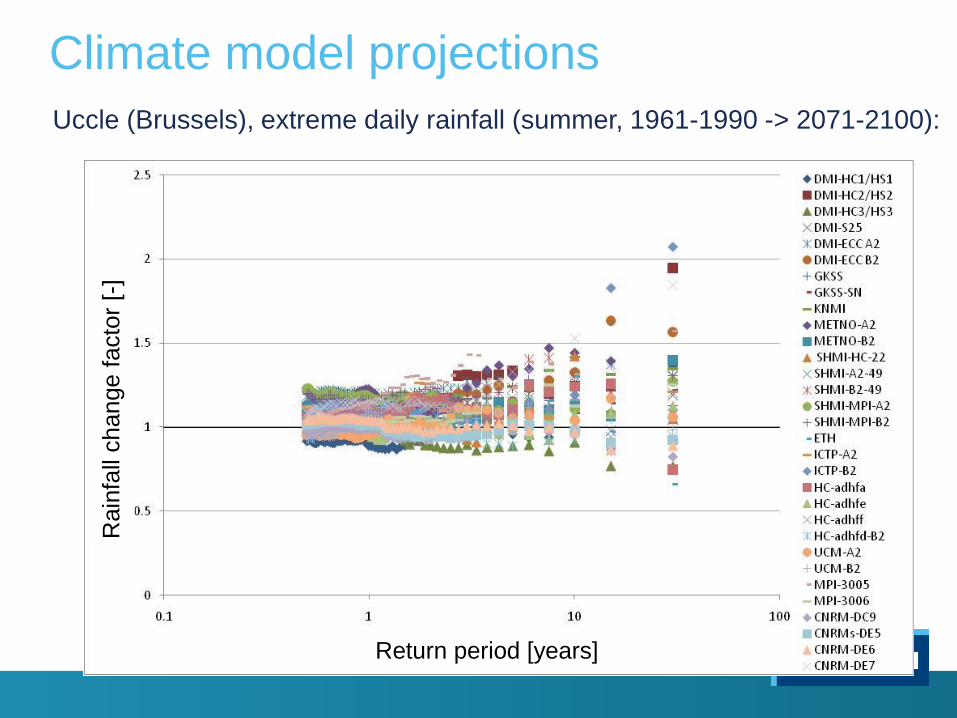
Climate model projections
Uccle (Brussels), extreme daily rainfall (summer, 1961-1990 -> 2071-2100):
Return period [years]
Rain
fall
change
facto
r [-
]

Climate scenarios
Uccle (Brussels), extreme daily rainfall (summer, 1961-1990 -> 2071-2100):
High
Mean
Low
Return period [years]
Facto
r ra
infa
ll change [
-]
Return period [years]
Rain
fall
change
facto
r [-
]

Impact climate scenarios
Caution must be exercised when interpreting climate change scenarios
Order of magnitude of uncertainty assessed by ensemble approach with
several:
future greenhouse gas emission scenarios
GCMs (global scale climate model physics)
RCMs (regional scale climate model physics)
initial states of the climate models
statistical downscaling assumptions and methods
Whatever methods are adopted: resulting change should not be
interpreted as an exact number but only as indicative of the
expected magnitude of future change
+ real uncertainty is larger: models share the same level of process understanding and sometimes
even the same parameterization schemes and code
Impact climate scenarios:
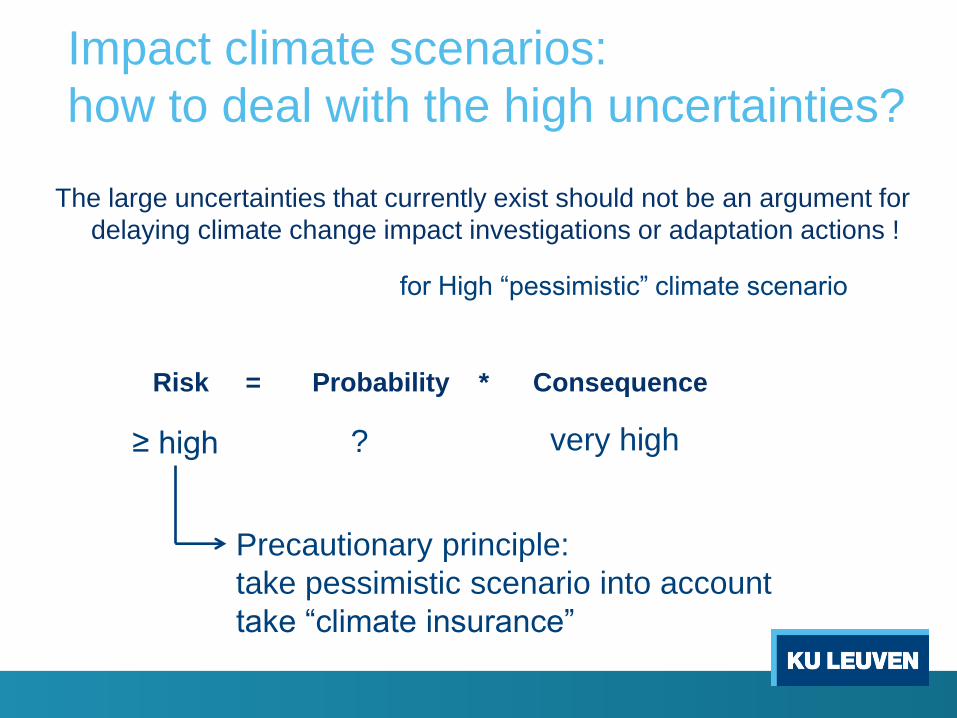
how to deal with the high uncertainties?
The large uncertainties that currently exist should not be an argument for
delaying climate change impact investigations or adaptation actions !
? very high
for High “pessimistic” climate scenario
≥ high
Precautionary principle:
take pessimistic scenario into account
take “climate insurance”
Risk = Probability * Consequence

Impact climate scenarios:
Uncertainties should be accounted for!
Future designs:
• flexible and sustainable solutions
• avoid closing off options (reversibility)
• active learning, public debate
o <-> traditional engineering approach, which is rather static and is
often based on design rules set by engineering communities
o recognize that flexibility is required as understanding increases
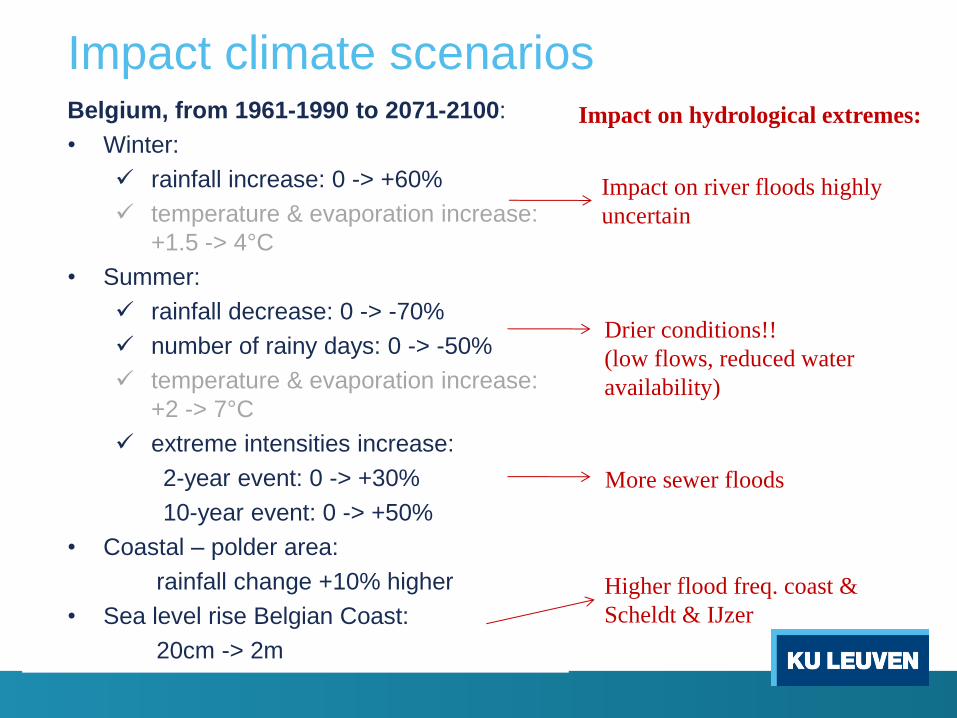
Belgium, from 1961-1990 to 2071-2100:
• Winter:
rainfall increase: 0 -> +60%
temperature & evaporation increase:
+1.5 -> 4°C
• Summer:
rainfall decrease: 0 -> -70%
number of rainy days: 0 -> -50%
temperature & evaporation increase:
+2 -> 7°C
extreme intensities increase:
2-year event: 0 -> +30%
10-year event: 0 -> +50%
• Coastal – polder area:
rainfall change +10% higher
• Sea level rise Belgian Coast:
20cm -> 2m
Impact on river floods highly
uncertain
Drier conditions!!
(low flows, reduced water
availability)
More sewer floods
Impact on hydrological extremes:
Higher flood freq. coast &
Scheldt & IJzer
Impact climate scenarios

Flanders and Brussels: vulnerable to higher peak intensities in summer
Because of high urbanisation (high % pavements)
Impact climate scenarios
1976: 4 – 5% paved
PhD Lien Poelmans,
KU Leuven, 2010
2000: 9 – 10% paved
2000
1976

Flanders and Brussels: vulnerable to drier summers
Because of low water availability
Impact climate scenarios
0
5000
10000
15000
20000
25000
gemiddelde waterbeschikbaarheid
(m3 per jaar en per inwoner)
Mean annual water availability:
1480 m3/(person.year)
International standards:
<2000 “very low”
<1000 “severe water shortage”
Due to: High population density
Limited surface water inflow from rivers

IWA/IAHR Joint Committee on Urban Drainage
INTERNATIONAL GROUP ON URBAN RAINFALL (IGUR)
Provides an international review on the climate change
impacts on urban rainfall extremes and on urban
hydrology and hydraulics
Content:
1. Climate change simulations
2. Modeling of urban rainfall extremes in a stationary
context
3. Study of rainfall and urban runoff variability and
trends in a non-stationary context
4. Statistical downscaling of rainfall extremes
5. Climate factors and changes in IDF relationships
6. Climate change impacts on urban drainage: results
and regional differences
7. Needs for adaptation and flexible designs
Contact: [email protected]

Climate change serves as a driver for
changes in urban drainage paradigm …
Urban design and planning processes incorporating
more sustainable approaches:
In many cities in the world, the rate of renewal of urban
infrastructure is currently low, but this may need to change in the
future, in order for communities to cope with deteriorating pipe
networks, population growth and climate change
At the same time the changes need to be consistent with an
increasing awareness of the environmental stress the end-of-pipe
solution puts on the ecosystem of the city
There will be a need for more natural urban drainage approaches
and installation of “blue-green” storm water infrastructure, all of
which requires a change in design philosophy

Sustainable (urban) water management:
More local-upstream storage and infiltration
Permeable pavements: Individual infiltration:
Stormwater
retention
and re-use:

Stormwater storage and infiltration in public spaces:
reduces sewer flood & overflow frequencies & feeds groundwater system
RIONED 2009
Sustainable (urban) water management:
More local-upstream storage and infiltration
before
after

Improved interfacing between urban water management and spatial
planning / urban design:
Multiple functions to
open spaces (e.g.
parks) in the city:
RIONED 2009
Sustainable (urban) water management:
More local-upstream storage and infiltration
Campus Park, Clichy sous Bois [Composante Urbaine, 2004]

IWA/IAHR Joint Committee on Urban Drainage
INTERNATIONAL GROUP ON URBAN RAINFALL (IGUR)
Provides an international review on the climate change
impacts on urban rainfall extremes and on urban
hydrology and hydraulics
Content:
1. Climate change simulations
2. Modeling of urban rainfall extremes in a stationary
context
3. Study of rainfall and urban runoff variability and
trends in a non-stationary context
4. Statistical downscaling of rainfall extremes
5. Climate factors and changes in IDF relationships
6. Climate change impacts on urban drainage: results
and regional differences
7. Needs for adaptation and flexible designs
Contact: [email protected]


