11 Design and Use of Functional Gene Microarrays (FGAs) for the Characterization of Microbial Communities Christopher W Schadt 1 , Jost Liebich 2 , Song C Chong 1 , Terry J Gentry 1 , Zhili He 1 , Hongbin Pan 1 and Jizhong Zhou 1 1 Environmental Sciences Division, Oak Ridge National Laboratory, P.O. Box 2008, Oak Ridge, TN 37831-6038, USA; 2 Institute of Chemistry and Dynamics of the Geosphere IV: Agrosphere, Forschungszentrum Ju ¨lich GmbH, 52425 Ju ¨lich, Germany VVVVVVVVVVVVVVVVVVVVVVVVVVVVVVVVVVVVVVVVVVVVV CONTENTS Introduction and overview of FGAs Functional gene diversity and data acquisition for probe design Design of specific oligonucleotide probes for FGAs Microarray construction, labeling, hybridization and image acquisition Data analysis techniques Evaluation and validation of FGA results VVVVVV INTRODUCTION AND OVERVIEW OF FGAS The recent development of microarrays as powerful, high-throughput genomic technology has spurred investigators toward their use for the study of various biological processes. Although microarray technology has been used successfully to analyze global gene expression in pure cultures or tissue samples for many different organisms (Lockhart et al., 1996; DeRisi et al., 1997; Schena et al., 1995, 1996; Ye et al., 2000; Thompson et al., 2002; Liu et al., 2003a,b), adapting microarrays for use in environmental studies presents great challenges in terms of design, use and data analysis (Zhou and Thompson, 2002; Zhou, 2003). Recently, various formats of environmental microarrays have been proposed, developed and evaluated for species detection and microbial community analyses in complex environments as reviewed recently by Zhou (2003). These studies have indicated that microarray-based genomic technologies have great potential as specific, sensitive, quantitative, and high- throughput tools for microbial detection, identification and characteriza- tion in natural environments. This chapter will focus on and discuss recent work on the development and use of functional gene microarray METHODS IN MICROBIOLOGY, VOLUME 34 Copyright q 2005 Elsevier B.V. 0580-9517 DOI:10.1016/S0580-9517(04)34011-0 All rights reserved. Design and Use of Functional Gene Microarrays
Transcript
11 Design and Use of FunctionalGene Microarrays (FGAs) for theCharacterization of MicrobialCommunities
Christopher W Schadt1, Jost Liebich2, Song C Chong1,Terry J Gentry1, Zhili He1, Hongbin Pan1 and Jizhong Zhou1
1 Environmental Sciences Division, Oak Ridge National Laboratory, P.O. Box 2008, Oak Ridge,TN 37831-6038, USA; 2 Institute of Chemistry and Dynamics of the Geosphere IV: Agrosphere,Forschungszentrum Julich GmbH, 52425 Julich, Germany
VVVVVVVVVVVVVVVVVVVVVVVVVVVVVVVVVVVVVVVVVVVVV
CONTENTS
Introduction and overview of FGAsFunctional gene diversity and data acquisition for probe designDesign of specific oligonucleotide probes for FGAsMicroarray construction, labeling, hybridization and image acquisitionData analysis techniquesEvaluation and validation of FGA results
VVVVVV INTRODUCTION AND OVERVIEW OF FGAS
The recent development of microarrays as powerful, high-throughputgenomic technology has spurred investigators toward their use for thestudy of various biological processes. Although microarray technologyhas been used successfully to analyze global gene expression in purecultures or tissue samples for many different organisms (Lockhart et al.,1996; DeRisi et al., 1997; Schena et al., 1995, 1996; Ye et al., 2000; Thompsonet al., 2002; Liu et al., 2003a,b), adapting microarrays for use inenvironmental studies presents great challenges in terms of design, useand data analysis (Zhou and Thompson, 2002; Zhou, 2003). Recently,various formats of environmental microarrays have been proposed,developed and evaluated for species detection and microbial communityanalyses in complex environments as reviewed recently by Zhou (2003).These studies have indicated that microarray-based genomic technologieshave great potential as specific, sensitive, quantitative, and high-throughput tools for microbial detection, identification and characteriza-tion in natural environments. This chapter will focus on and discussrecent work on the development and use of functional gene microarray
METHODS IN MICROBIOLOGY, VOLUME 34 Copyright q 2005 Elsevier B.V.0580-9517 DOI:10.1016/S0580-9517(04)34011-0 All rights reserved.
Des
ign
and
Use
ofFu
nct
ional
Gen
eM
icro
arra
ys
(FGA) technology and introduce readers to issues and methodologysurrounding their design and use. As you will see in the followingdiscussions this methodological debate is far from over, as thisrevolutionary technology is still very much in a state of continuingdevelopment.
The genes encoding functional enzymes involved in various biogeo-chemical cycling (e.g. nitrogen, carbon and sulfur) and bioremediationprocesses are very useful as signatures for monitoring the potentialactivities and physiological status of microbial populations and commu-nities that drive these processes in the environment. Microarrayscontaining functional gene sequence information are often referred to asfunctional gene arrays (FGAs) because they are primarily used foranalysis of microbial community activities in the environment (Zhou andThompson, 2002; Wu et al., 2001). Similar to the microarrays used formonitoring gene expression, both oligonucleotides and DNA fragmentsderived from functional genes can be used for fabricating FGAs. Toconstruct microarrays containing large DNA fragments as probes, thefragments are generally amplified by polymerase chain reaction (PCR)from environmental clones or from pure culture genomic DNAs (Wu et al.,2001). Obtaining all the diverse environmental clones and bacterial strainsfrom various sources as templates for amplification can be an over-whelming obstacle. As a result, construction of comprehensive FGAsbased on PCR gene fragments that adequately encompass diverseenvironmental sequences is a near impossibility.
To circumvent this problem, FGAs containing synthetic oligonucleo-tides (oligos) have been developed for use. The main advantage of oligoFGAs is that construction is much easier than DNA-based FGAs becausethe probes can be directly designed and synthesized based on sequenceinformation from public databases. Therefore, comprehensive arraysrepresenting the extreme diversity of environmental sequences can beconstructed. Several studies have applied and evaluated the usefulness ofthis approach for select groups of microorganisms (Taroncher-Oldenburget al., 2002; Koizumi et al., 2002; Bodrossy et al., 2003; Denef et al., 2003;Tiquia et al., 2004; Rhee et al., 2004). In one such recent study originatingfrom our laboratory, a 50mer oligo FGA was constructed and evaluatedencompassing 1033 genes involved in nitrogen transformations (nirS, nirK,nifH and amoA), methane consumption ( pmoA) and dissimilatory sulfatereduction (dsrA/B) from sequences available in public databases and ourown environmental sequence collections (Tiquia et al., 2004). Under thehybridization conditions of 508C and 50% formamide, genes having ,86–90% sequence identity could be clearly differentiated. This level ofhybridization specificity is higher than those of PCR fragment-basedFGAs (Wu et al., 2001). Based on our comparisons of sequences from purecultures involved in nitrification, denitrification, nitrogen fixation,methane oxidation and sulfate reduction, the average percent similarityof such functional genes at species level is usually much less than 85%,suggesting that oligo-based FGAs can provide species-level resolution.Also the detection limits of approximately 8–10 ng for pure genomic DNAwas 10 times lower than the PCR fragment-based FGAs (Zhou and
332
Des
ign
and
Use
ofFu
nct
ional
Gen
eM
icro
arra
ys
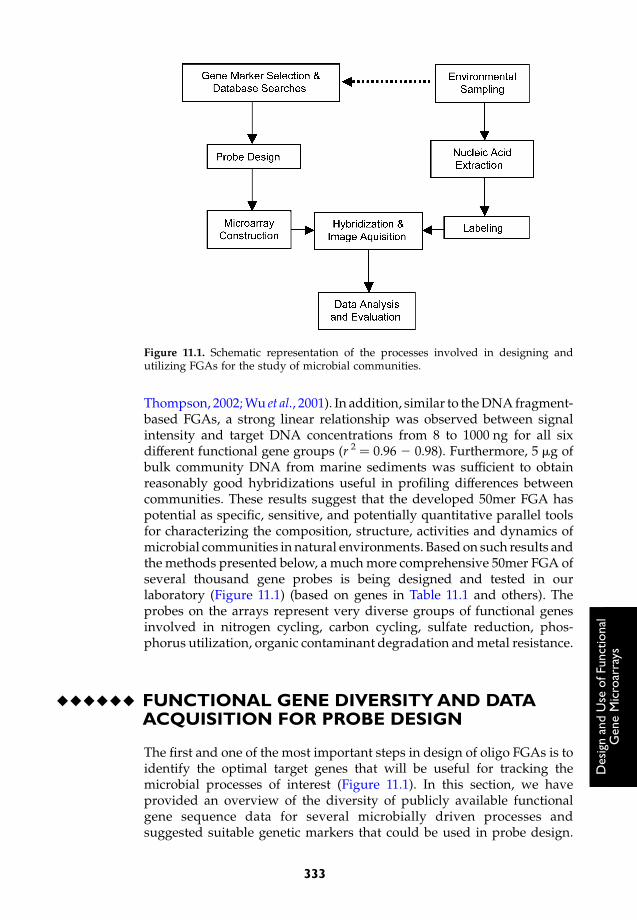
Thompson, 2002; Wu et al., 2001). In addition, similar to the DNA fragment-based FGAs, a strong linear relationship was observed between signalintensity and target DNA concentrations from 8 to 1000 ng for all sixdifferent functional gene groups (r 2 ¼ 0.96 2 0.98). Furthermore, 5 mg ofbulk community DNA from marine sediments was sufficient to obtainreasonably good hybridizations useful in profiling differences betweencommunities. These results suggest that the developed 50mer FGA haspotential as specific, sensitive, and potentially quantitative parallel toolsfor characterizing the composition, structure, activities and dynamics ofmicrobial communities in natural environments. Based on such results andthe methods presented below, a much more comprehensive 50mer FGA ofseveral thousand gene probes is being designed and tested in ourlaboratory (Figure 11.1) (based on genes in Table 11.1 and others). Theprobes on the arrays represent very diverse groups of functional genesinvolved in nitrogen cycling, carbon cycling, sulfate reduction, phos-phorus utilization, organic contaminant degradation and metal resistance.
VVVVVV FUNCTIONAL GENE DIVERSITY AND DATAACQUISITION FOR PROBE DESIGN
The first and one of the most important steps in design of oligo FGAs is toidentify the optimal target genes that will be useful for tracking themicrobial processes of interest (Figure 11.1). In this section, we haveprovided an overview of the diversity of publicly available functionalgene sequence data for several microbially driven processes andsuggested suitable genetic markers that could be used in probe design.
Figure 11.1. Schematic representation of the processes involved in designing andutilizing FGAs for the study of microbial communities.
333
Des
ign
and
Use
ofFu
nct
ional
Gen
eM
icro
arra
ys
Table 11.1. Various microbial functional gene sequences available from publicdatabases of potential use in FGAs. All categories exclude data from vascularplants and metazoans. The availability of environmental sequence data ( p ) and arepresentative reference of such is also provided. Categories including multiplegenes or protein subunits are indicated as (all)
Gene/category Sequences#
Examplereference
Nitrogen cyclingNitrogenase-nifH 1784p Hurek et al.
(1997)Nitrogenase-nifD 180p Ueda et al.
(1995)Nitrogenase-nifK 89Ammonium monooxygenase-amoA 1158p Nold et al.
We utilized a variety of combinatorial search strings within the GenBankENTREZ interface in order to acquire these sequences, in combinationwith a locally executable program to extract and download pertinentinformation (database of origin, species name, gene descriptions,phylogenetic lineage, DNA coding sequence, protein sequence, etc.)starting only from a list of GI (gene identification) numbers in tabdelimited format. These databases were then further screened to removeduplicate and non-homologous sequences. We found that such anapproach greatly reduces the time and effort involved in sorting throughand collecting the vast amounts of sequence data available for probedesign. By conducting searches within the protein sequence database,many duplicated entries associated with the nucleotide database areavoided, and direct retrieval of coding DNA sequences is possible thatavoids problems associated with intron containing sequences. Addition-ally, we have recently developed the program further so that oncekeywords are decided upon it automatically updates the databases (basedon modification date) at user defined intervals and will also removeduplicate sequences. To illustrate the selection of genetic markers basedon the data available from such searches, we discuss below someexamples of this process for selected key functional genes. Table 11.1additionally summarizes the results of many such searches and amountsof available sequence information.
Nitrogen Cycling
Microbial nitrogen transformations involve three major microbiallydriven processes; nitrogen fixation, nitrification and denitrification.These involve many different enzymes including nitrogenase, ammoniummonooxygenase, hydroxylamine oxidoreductase, nitrite oxidase, nitrate
reductase, nitrite reductase, nitric oxide reductase, nitrous oxidereductase, assimilatory nitrate reductase and urease (Table 11.1). Thus,it is essential to understand the diversity of functional genes contributingto the nitrogen cycle contained in microbial communities. Over 6000nitrogen cycle related gene sequences are available from GenBank andother databases (Table 11.1). However, it is beyond the scope of thischapter to discuss all of these processes and enzymes, so we have focusedon the genes involved in microbial nitrogen fixation to illustrate theselection of appropriate markers.
Nitrogen is one of the major components of living cells and about 79%of the earth atmosphere is nitrogen in the form of N2 gas. However,nitrogen is often a limiting factor for growth and biomass production inboth aquatic and terrestrial environments (Vitousek and Howarth, 1991).In order to use nitrogen for growth, N2 must be fixed to ammonium (NH4)or nitrate (NO3) which occurs primarily through microbial nitrogenfixation. Nitrogen fixation is exclusively performed by prokaryotes. Somelive independently of other organisms (free living nitrogen-fixing bacteriasuch as Azotobacter, Beijerinckia, Desulfovibrio, purple sulfur bacteria,purple non-sulfur bacteria, and green sulfur bacteria) while others live insymbiotic association with plants (Rhizobium, Frankia, Azospirillum) andsome are found in both situations (e.g. Bradyrhizobium). Microorganismsperform nitrogen fixation with an evolutionarily conserved nitrogenaseprotein complex, and all consist of two major proteins found in botharchaea and eubacteria (Howard and Rees, 1996). Component I consists ofan a2b3 tetramer molybdoferredoxin (MoFe protein) or dinitrogenase (EC1.18.6.1), the active site for N2 reduction, and is encoded by the genes nifDand nifK. Component II consists of a homodimer, azoferredoxin (Feprotein) or dinitrogenase reductase (EC 1.19.6.1), that couples ATPhydrolysis to interprotein electron transfer, and is encoded by nifH (Deanet al., 1993). Dinitrogenase genes are further divided into four clusters(Normand and Bousquet, 1989; Normand et al., 1992; Chien and Zinder,1994). Cluster I contains most of eubacterial MoFe containing dinitrogen-ase. Cluster II consists of archaea, eubacterial alternative dinitrogenasewith non-Mo, non-V. Cluster III, contains Mo dinitrogenase (nif-1) genesfrom the Gram positive eubacteria Clostridium and the nif-2 genes fromthe archaea Methanosarcia and the sulfate reducer Desulfovibrio. Cluster IV,containing methanogens, utilizes a distantly related gene similar tobacteriochlorophyll. Numerous other genes are also known to be relatedto or interact with nif proteins such as nifJ, nifF, nifM, nifB and are oftenpresent in a complex extended nif operon.
However, of all these potential targets for a functional marker, the nifHgene is the most widely used. Dinitrogenase reductase (nifH) is especiallyevolutionarily conserved and has often been used as a genetic marker fordetecting nitrogen fixing microorganisms in natural environments(Kirshtein et al., 1991; Zehr et al., 1995; Widmer et al., 1999) and also as abasis for the phylogenetic analysis of nifH containing organisms (Zehrand McReynolds, 1989). Over 1700 nifH gene sequences are available frompublic DNA databases and this is expanding rapidly. However, nifD andnifK have also been used as additional information, especially for
338
Des
ign
and
Use
ofFu
nct
ional
Gen
eM
icro
arra
ys
resolving differences between closely related sequences. For thesereasons, the nifH gene makes an excellent functional marker, but theimportance of nifD and nifK for resolving finer scale differences shouldnot be discounted.
Carbon Cycling
Microbially driven aspects of the carbon cycle could play important rolesin determining the amplitude of anthropogenic effects on climate changeand their potential mitigation. Microorganisms play important rolesthrough direct effects on such processes as methane oxidation andproduction, carbon fixation, and the breakdown and decomposition oforganic substrates. While a discussion of all these aspects is not possible,we provide potential target genes for monitoring these processes inTable 11.1. To illustrate some of the issues surrounding selection ofsuitable genetic markers for these processes, we will proceed with anoverview of aerobic methane oxidation. Methanotrophic bacteria oxidizemethane for energy production and biosynthesis of organic compounds.These organisms are ubiquitous in environments such as oceanic andinland waters, wetlands, soils, groundwaters and even the deep subsur-face and are of great interest to microbial ecologists because of thepotentially important role they could play in mitigating global warming(Holmes et al., 1995; Dunfield et al., 1999). They are also of interest for usewithin certain industrial applications such as bioremediation or steps inthe synthesis of certain organic compounds (Sullivan et al., 1998).
The first step in the oxidation of methane is the conversion of methaneto methanol by the enzyme methane monooxygenase (EC 1.14.13.25).After this step methanol is converted to formaldehyde via a non-specificalcohol dehydrogenase (e.g. EC 1.1.99.8), where it enters one of twodifferent pathways (RuMP or serine-isocytrate) for the production of C3
compounds. As a specific genetic marker for methanotrophy we aretherefore left with methane monooxygenase. This key enzyme exists intwo forms: the cytoplasmic, soluble, methane monooxygenase (sMMO)and the membrane-bound, particulate, methane monooxygenase(pMMO). Of the two forms of MMO, all known methanotrophscarry pMMO whereas only some select methanotrophs (Type II) carryboth pMMO and sMMO (Murrell et al., 2000). However, pMMO is alsoevolutionarily related to the important nitrogen cycling enzymeammonium monooxygenase (AMO) and they share a high degree ofsequence similarity in some regions of these genes (Holmes et al., 1995).Because it is present in all known methanotrophs, pMMO carries distinctadvantages as a specific functional marker for methanotrophy (Murrellet al., 1998). Practically speaking, however, because of the high degree ofsimilarity between the two genes (AMO and pMMO) any probe designeffort must most likely consider both simultaneously. Both pMMO andAMO are made up of two different polypeptide subunits, the smallerof which ( pmoA and amoA) contain the active sites and have been much
339
Des
ign
and
Use
ofFu
nct
ional
Gen
eM
icro
arra
ys
more widely sequenced and studied as functional and phylogeneticmarkers.
While many organisms can utilize methanol and some other methylcompounds (methylotrophy), currently true methanotrophy is onlyknown to occur within the beta and gamma-proteobacteria. However,studies of environmental libraries of pmoA suggest diversity within thesebacteria is high, and many lineages contained within them are onlyknown from such environmental libraries. Additionally, several studieshave suggested that there may be divergent lineages related to eitherpmoA or amoA that could possibly fall outside the proteobacteria (Noldet al., 2000). Currently ,503 pmoA genes are listed in GenBank. However,because the closely related amoA can often be amplified with the samePCR primers (Nold et al., 2000), care should be taken to ensure that suchgene annotations are correctly identified in sequences retrieved fromdatabases.
Sulfur Cycling
The most widespread biochemical reaction of the sulfur cycle is probablythe assimilatory sulfate reduction in which inorganic sulfate is reduced tobecome integrated in amino acids and proteins where they play anessential role in the formation of secondary structures. This process isfollowed by the release of reduced hydrogen sulfide by the degradation(or desulfurylation) of the organic sulfur compounds. This process isimportant for almost every life form on Earth and therefore can be foundthroughout all biological kingdoms. More specific to prokaryotes aresulfide/sulfur oxidation and dissimilatory sulfate reduction (sulfurrespiration) for which we discuss probe selection. Sulfate respiration,using oxidized sulfur forms as a terminal electron acceptor, is widespreadoften leading to the formation of black metal sulfides (e.g. iron sulfide)and the toxic gas hydrogen sulfide (H2S) (Rabus et al., 2000). Sulfatereducers occur in a wide variety of environments such as marinesediments, deep-sea hydrothermal vents, freshwater systems, anaerobicsludge and as endosymbionts (Jørgensen, 1982; Singleton, 1993; Finegoldand Jousimies-Somer, 1997; Manz et al., 1998; Dubilier et al., 2001; Laueet al., 2001; Castro et al., 2002; Liu et al., 2003a,b; Nakagawa et al., 2004).Some sulfate reducing bacteria are also capable of oxidizingorganic contaminants of anthropogenic origin (e.g. petroleum hydro-carbons) along with other naturally occurring substances (Lovley, 1997;Kleikemper et al., 2002). Others are able to reduce many different metalsbeyond sulfur species, for example, some aid in immobilizing potentiallyhazardous metals like uranium via such reductions (Chang et al., 2001).Both features make this group of interest for bioremediation processes inanoxic environments. In many cases, sulfate reducing bacteria may alsocompete with methanogens and denitrifiers for electron donors andsulfate reducing bacteria seem to often dominate if sufficient sulfatesupply is available (Lovley and Klug, 1983).
340
Des
ign
and
Use
ofFu
nct
ional
Gen
eM
icro
arra
ys
Dissimilatory sulfate reduction is generally a three-enzyme transforma-tion involving activation of sulfate by ATP sulfurylase (EC 2.7.7.4),reduction of the product adenosine-phosphosulfate (aps) to sulfite byadenylylsulfate reductase (EC 1.8.99.2) and subsequent further reductionto hydrogen sulfide by dissimilatory sulfite reductase (dsr, EC 1.8.99.3),the latter enzyme consists of at least three subunits. However, only APSreductase and dsr-genes are suitable indicators of dissimilatory sulfatereduction in the environment, since the first step is also involved inassimilatory sulfate reduction that is widely evolutionarily distributed.Furthermore, several organisms are known to use only sulfite as anelectron acceptor but not sulfate, and they lack adenylylsulfate reductasegenes (Huber et al., 1997; Holliger et al., 1998; Molitor et al., 1998; Laue et al.,2001). Because of this limitation, aps genes have only more recently beenapplied as a marker for this process, primarily to distinguish sulfate/sulfite reducers from those only capable of reducing sulfite (Deplanckeet al., 2000; Friedrich, 2002). As a result, in our recent searches, only 81nucleotide sequences of APS genes from different species or subspecieswere found in publicly available databases, whereas 924 sequences can beretrieved for dsrA and dsrB genes. Because of this better studied diversity,dsr genes are a more indicative marker for this overall function. dsrA anddsrB genes occur in all known sulfate or sulfite reducing bacteria and canbe targeted by a single set of conserved primers (Karkhoff-Schweizer et al.,1995; Wagner et al., 1998) allowing probe design for both subunits. A thirdsubunit for dissimilatory sulfite reductase, encoded by dsrD, is alsoknown but available sequence information to date is mostly limited tocultured species (Karkhoff-Schweizer et al., 1995). A large portion of thedsrA and dsrB sequence data were obtained from uncultivated organisms,after the discovery of the conserved nature of dissimilatory sulfitereductases over different phyla made their detection by PCR possible(Karkhoff-Schweizer et al., 1995; Wagner et al., 1998). Many of thesesequences are phylogenetically divergent relative to thoseknown sequences from cultured organisms (Liu et al., 2003a,b; Nakagawaet al., 2004).
According to sequence information deposited in GenBank and otherpublicly accessible sequence databases, 99 species have been identifiedto belong to this functional group spreading over five bacterial phyla(Chlorobi, Firmicutes, Nitrosospira, Proteobacteria, Thermodesulfobac-teria) and two archaeal phyla (Crenarchaeota, Euryarchaeota), withmembers of the genus Desulfovibrio forming the largest group.However, more species existing in nature are able to perform sulfaterespiration, some of which are likely to fall into novel to date yetunknown lineages as shown recently by Mori et al. (2003). Sequencecomparison of these highly conserved genes over distant phylogeneticgroups of archaeal and bacterial origin suggests that these genes mayhave been horizontally transferred in some lineages (Larsen et al.,1999; Klein et al., 2001; Friedrich, 2002). Thus, dsr-gene sequences canonly partially be used as a phylogenetic marker for sulfate and sulfitereducing microorganisms, but they are very suitable for functionaldiversity studies.
341
Des
ign
and
Use
ofFu
nct
ional
Gen
eM
icro
arra
ys
Organic Contaminant Degradation
There are thousands of different gene sequences available in publicdatabases encoding various enzymes that transform one or more ofhundreds of complex organic chemicals. A review of all availablecontaminant degradation genes is beyond the scope of this chapter, sofor the purposes of illustrating the diversity of available degradativegenes and how they may be used in microarrays, we have focused on thenaphthalene degradation pathway. Naphthalene is the most widelystudied member of the polycyclic aromatic hydrocarbons (PAHs) whichare composed of multiple, fused aromatic rings. In addition to naturallyoccurring sources, environmental PAH-contamination often results fromanthropogenic deposition of various fossil fuel-derived chemicals such asthe wood preservative creosote (Sun et al., 2003).
In Table 11.1, we have listed the enzymes which sequentially convertnaphthalene to salicylate (Bosch et al., 1999; Takizawa et al., 1999). Theinitial reaction in the pathway occurs via a multi-component naphthalenedioxygenase (NDO) (EC 1.14.12.12) (Kauppi et al., 1998). The a subunitof the NDO iron sulfur protein is believed to confer the specificity ofthe enzyme and, as indicated in Table 11.1, is the most studied ofthe naphthalene genes (Parales et al., 2000; Wackett, 2002). The other threeNDO subunits probably have limited impact on enzymatic specificity(Parales et al., 1998; Romine et al., 1999). For these reasons, the a subunit ispotentially the best candidate for use as a microarray marker gene. Ithas been identified in numerous eubacteria including Burkholderia,Comamonas, Cycloclasticus, Marinobacter, Neptunomonas, Polaromonas,Pseudoalteromonas, Pseudomonas, Ralstonia and Rhodococcus spp. (Kurkelaet al., 1988; Denome et al., 1993; Takizawa et al., 1994; Fuenmayor et al.,1998; Hedlund et al., 1999, 2001; Larkin et al., 1999; Melcher et al., 2002;Jeon et al., 2003; Kasai et al., 2003). The a subunit gene is referred to byvarious names, including doxB, nagAc, nahAc, narAa, ndoB, pahAc andphnAc, that were initially chosen in part based on the substrate on whichthe host bacterium was isolated (Habe and Omori, 2003). Most of the a
subunit sequence information from isolated organisms is derived fromGram negative bacteria, primarily Pseudomonas spp. containing nah-likeNDO genes (Habe and Omori, 2003). But, it has recently beendemonstrated that other NDO genes such as the phn genes, of whichmuch less is known, may be prevalent in environmental samples(Lloyd-Jones et al., 1999; Wilson et al., 2003). Information on naphthalenedegradation genes in Gram positive bacteria is limited and even lessinformation is available for the fungal genes (Andreoni et al., 2000; Larkinet al., 1999). Several different primers have been designed for the a subunitgenes (Hamann et al., 1999; Lloyd-Jones et al., 1999; Wilson et al., 1999;Baldwin et al., 2003), but only a handful of studies have directly amplifiedand sequenced the genes from soil, sediment, or groundwater samples(Wilson et al., 1999; Stach and Burns, 2002; Jeon et al., 2003). To ourknowledge, the diversity of the a subunit gene has not been thus assessedin marine environments even though the gene has been identified in
342
Des
ign
and
Use
ofFu
nct
ional
Gen
eM
icro
arra
ys
several marine bacteria (Geiselbrecht et al., 1998; Hedlund et al., 1999,2001).
Another potential application of environmental microarrays is in thedetermination of horizontal gene transfer events. Gene transfer hascontributed to the evolution of metabolic pathways and has also playeda role in the spread of NDO genes (Herrick et al., 1997; McGowan et al.,1998; Habe and Omori, 2003; Wilson et al., 2003). Bacteria have beenidentified that contain multiple copies of the nah genes, and it alsoappears that some isolates have mosaics of nah operons from differentorganisms (Bosch et al., 1999; Ferrero et al., 2002). Microarraytechnology could be used to quickly assess if an isolate containsmultiple copies of a given gene and if some of the genes in a pathwayare similar to those in one organism while other genes are similar toanother organism. This knowledge could help to determine the factorsinvolved in microbial adaptation following environmental contami-nation with xenobiotics (Rensing et al., 2002; Top and Springael, 2003).However, for successful application of microarray technology to thestudy of pathway evolution, probes would be required for all of thegenes in a given pathway, which in the case of naphthalene wouldnecessitate more sequence information from many organisms for theother genes besides the NDO a subunit.
Metals Resistance
A recent search of public databases revealed 2303 sequences eitheridentified as, or similar to, genes encoding microbial resistance to 15different metals and metalloids. Sequences for the various mercuryresistance genes were the most numerous; therefore, we have focused onthese genes for illustration. Mercury compounds are widely distributedaround the Earth, and their presence in the environment can occurthrough natural or anthropogenic processes with the latter estimated toaccount for approximately two-thirds of the worldwide Hg input (Masonet al., 1994). Not surprisingly, mercury resistance is among the mostcommon phenotypes observed in bacteria (Barkay et al., 2003). It has beenproposed that the emergence of the basic mercury resistance genes (mer)predates the divergence of Gram negative and positive bacteria (Osbornet al., 1997). Of the mer functional genes, merA, which encodes themercuric ion reductase enzyme (EC 1.16.1.1) that converts Hg2þ to thevolatile species Hg0, is the most studied and has the most availablesequence data (Table 11.1) (Barkay et al., 2003; Nascimento andChartone-Souza, 2003). The merA gene is therefore a good candidate formicroarray fabrication and monitoring bacterial mercury resistance,although other genes may be more appropriate for specific samplessuch as merB encoding organomercurial lyase (EC 4.99.1.2) for samplescontaminated with organomercury compounds.
The merA gene is widely spread among both Gram negative and Grampositive bacteria including Alcaligenes, Bacillus, Delftia, Exiguobacterium,Pantoea, Pseudomonas, Shigella, Staphylococcus and Xanthomonas spp.
343
Des
ign
and
Use
ofFu
nct
ional
Gen
eM
icro
arra
ys
(Laddaga et al., 1987; Yurieva et al., 1997; Bogdanova et al., 1998; Renieroet al., 1998; Kholodii et al., 2000; Venkatesan et al., 2001; Sota et al., 2003).Whole genome sequences of archaea have also indicated the presence ofmer-like sequences, and the first report of functional, archaeal merA andmerR genes has recently been published for Sulfolobus solfataricus (Schelertet al., 2004). There is, however, very limited sequence data in the literatureand databases regarding the diversity of merA genes from unculturedmicroorganisms in environmental samples. In fact, the only culture-independent merA sequences we found were from plasmids isolated fromsewage sludge and soil via an exogenous plasmid isolation method(Schluter et al., 2003; Schneiker et al., 2001). Researchers have amplifiedmerA from environmental samples; however, the PCR products were notsequenced but analyzed with other procedures (Felske et al., 2003; Hartet al., 1998). Further information on the diversity of uncultured merAsequences would be useful prior to microarray construction since thesequences from isolated organisms may not comprehensively representthe genetic diversity in the environment (Bruce et al., 1995; Marchesi andWeightman, 2003). Additionally, only limited information is available formercury resistance genes in fungi, although several genes involved inmercury (metal) resistance in yeast have recently been identifiedwhich may help to expand this knowledge base in the future (Furuchiet al., 2002; Nguyen-nhu and Knoops, 2002; Westwater et al., 2002; Gueldryet al., 2003).
VVVVVV DESIGN OF SPECIFIC OLIGONUCLEOTIDEPROBES FOR FGAS
Oligonucleotide-based microarrays are becoming more popular becausethey offer a number of advantages over cDNA microarrays. First, asstated previously, only sequence information is required and PCRamplification can therefore be avoided. Secondly, more flexibility tocontrol specificity of hybridization can be achieved in probe design bythe ability to strictly delimit parameters such as melting temperature(Tm), overall similarity (% homology) and other factors. Thirdly,oligonucleotide synthesis costs have dropped considerably in the lastfew years (Relogio et al., 2002). In addition, oligonucleotide arraysprovide potential solutions to some of the more complicated problemsinvolved in environmental studies. For example, short oligonucleotidesmay be used to avoid highly conserved regions of orthologous genes thatwould not be possible with PCR amplification using conserved primers.The challenge for probe design is how to identify the optimum probesfor each gene or each group of genes.
There are a number of pre-existing programs available for automatedselection of oligonucleotide probes for DNA microarrays (Table 11.2).OligoArraySelector (Zhu et al., 2003) runs on Linux/Unix systems anduses a BLAST approach to search for sequence similarity and compute thethermodynamic properties for only the most probable non-specific
344
Des
ign
and
Use
ofFu
nct
ional
Gen
eM
icro
arra
ys
Table 11.2. Oligonucleotide probe design programs
Name OS Reference
ArrayOligoSelector Linux Zhu et al. (2003), http://sourceforge.net/projects/arrayoligosel/OligoArray Windows
and Unix/LinuxRouillard et al. (2002), http://berry.engin.umich.edu/oligoarray
OligoArray 2.0 Unix/Linux Rouillard et al. (2003), http://berry.engin.umich.edu/oligoarray2OligoPicker Linux Wang and Seed (2003), http://pga.mgh.harvard.edu/oligopicker/index.htmlOligoWiz
(Web-based)Unix Nielsen et al. (2003), http://cbs.dtu.dk/services/oligowiz/
PRIMEGENS Unix/Linux Xu et al. (2002), http://compbio.ornl.gov/structure/primegens/PROBEmer
(Web-based)Linux Emrich et al. (2003), http://probemer.cs.loyola.edu
ProbeSelect Unix/Linux Li and Stormo (2001)ROSO
(Web-based)Windows
and UnixReymond et al. (2004), http://pbil.univ-lyon1.fr/roso
ArrayDesigner(Commercial)
N/A TeleChem International Inc., http://arrayit.com
hybridization. Oligopicker (Wang and Seed, 2003) runs on Linuxplatforms and relies on BLAST search and 15-base stretch filtering.Those two programs select 70mer oligonucleotides for whole genomes.OligoArray (Rouillard et al., 2002) can run on Windows, Unix or Linuxsystems and the oligonucleotide specificity is checked using BLAST(Altschul et al., 1997) and possible secondary structures are predicted bythe Mfold server (Zuker et al., 1999). Its sister program, OligoArray 2.0(Rouillard et al., 2003), runs on Linux or Unix systems and the probespecificity is based on a comparison of sequence similarity between thespecific target and putative non-specific targets. PRIMEGENS (Xu et al.,2002) uses BLAST search and sequence alignment to select gene-specificfragments and then feeds those fragments to the Primer3 program (Rozenand Skaletsky, 2000) to design PCR primer pairs or probes on a genomescale. The program runs on Linux or Unix platforms and can also be usedfrom a web interface. ProbeSelect (Li and Storomo, 2001) runs on Linux orUnix and uses a suffix tree to search for sequence similarity and theMyersgrep program (Myers, 1998) to search for matching sequences withfew mismatches. This program can choose short (20–25 bases) or long (50or 70 bases) oligonucleotides. Recently, some web-based probe designprograms have been developed. OligoWiz (Nielsen et al., 2003) isimplemented as a client-server application. The server is responsible forthe calculation of scores and utilizes the BLAST program for homologysearch. The client is used to submit jobs to the server, to visualize thescores and to fine-tune the placement of oligonucleotides. PROBEmer(Emrich et al., 2003) uses suffix tree-based algorithms to identify commonsubstrings. The program can design oligonucleotide probes for a singlesequence or a defined group of sequences (16S rRNA gene) or PCRprimers. ROSO (Reymond et al., 2004) separates the time-consumingBLAST search from the fast step of thermodynamic analysis. The programcan be used to select oligonucleotide probes or PCR primers. Probe designparameters, such as oligonucleotide length, number of probes for eachgene and target Tm can be changed by users for some of the programsdescribed.
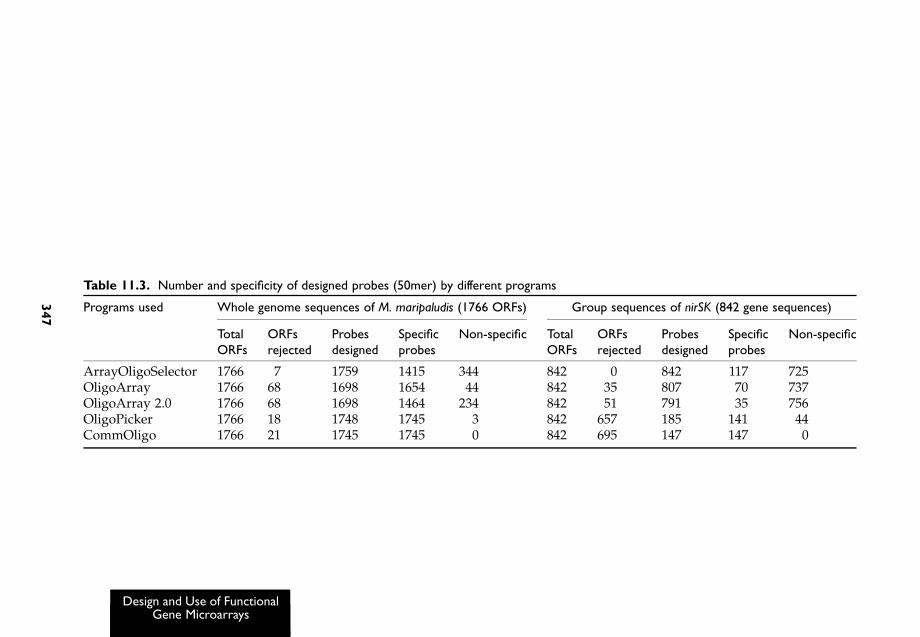
Some of the programs mentioned above were used to design probesfor the whole genome of Methanococcus maripaludis and a separate groupof sequences of nirS and nirK (nitrite reductase) based on those publiclyavailable and our own sequence collections. The results are summarizedin Table 11.3. Most programs worked well for the whole genome data.However, serious problems occurred when they were used to design50mer oligonucleotides for the nirSK group of sequences. First, too fewspecific probes and too many non-specific probes were designed. For thepurposes of this test we categorized probes as non-specific if they had.85% similarity, identical stretches .15 bp, or mismatch free energy,230 kcal/mol. Secondly, a large majority of sequences did not haveprobes if only unique oligonucleotides were selected. A similar situationwould be expected in probe selection for many other genes that might beused for FGAs because the nature of sequence data for these arrays isquite different from whole genome data. For example, sequences forFGAs are often highly homologous, and many sequences originating
346
Des
ign
and
Use
ofFu
nct
ional
Gen
eM
icro
arra
ys
Table 11.3. Number and specificity of designed probes (50mer) by different programs
Programs used Whole genome sequences of M. maripaludis (1766 ORFs) Group sequences of nirSK (842 gene sequences)
from phylogenetic and environmental studies are incomplete. Addition-ally, as little is known about the diversity that might be encountered inany given environmental sample, probe design should focus on theconserved, well-known, regions of a sequence. For example, when full-length sequences and shorter environmental sequences are usedtogether, most algorithms will design what are thought to be uniqueprobes for the full-length sequences outside of the conserved region usedfor environmental data.
For these reasons, a new probe design software tool called CommOligois currently being developed and tested in our laboratory that will selectoptimal oligonucleotide probes for whole genomes, meta-genomes orgroups of orthologous sequences such as those involved in FGAs.A multiple sequence alignment (MSA) approach is used to pre-processsequence data, and then users can choose regions for designing probes bymasking based on the MSA results. The program then uses a new globalalignment algorithm to design single or multiple unique probes for eachgene and designate allowable parameters such as maximal similarity(default ¼ 85%), maximal number of continuous match stretches (15bases) and free energy (230 kcal/mol) all of which can be controlledindependently and simultaneously. The program is also able to designsingle or multiple group-specific probes for related groups of genes if it isnot possible to select unique probes for a sequence. This new algorithmselects probes which have maximal similarities within a groupand minimal similarities outside groups. Using defaults, group-specificprobes should have a minimal similarity of 96% within a group andthe same parameters as unique probes outside a group. Other filters, suchas self-binding, mismatch position and GC content can also be used.While the above parameters are used as defaults, users may adjust allthese parameters and values to meet their own needs. The program wasevaluated using both whole genome and orthologous gene sequence dataand compared with other software. For example, 147 specific (unique)probes were designed for the nirS and nirK sequences, and mostimportantly, this program did not choose any non-specific probes(Table 11.3). A group-specific probe algorithm has been evaluated usingsmall to medium size data sets with documented phylogenetic relation-ships. For example, for nirS and nirK sequences, the program automati-cally formed 59 groups based on the default settings and each group had2–30 sequences. Single or multiple probes could be designed for eachgroup. Those group-specific probes covered an additional 180 sequencesfor which no unique probes were possible for single sequences because oftheir close similarities. For this particular data set, only 40% of sequenceshad unique or group-specific probes under default conditions. Relaxingdesign parameters will produce more probes but it also could potentiallyjeopardize the probe quality.
In summary, the application of oligonucleotide arrays for environ-mental studies presents many problems for probe design. To achieve theoptimal specificity of oligonucleotide arrays, probe design criteria need tobe further investigated and better algorithms are needed to facilitate theseintensive computations. We are currently still in the pre-release stage of
348
Des
ign
and
Use
ofFu
nct
ional
Gen
eM
icro
arra
ys
testing solutions for this problem presented in the discussion ofCommOligo. In the meantime, great care must be taken whenapplying tools originally designed for whole genome data to the designof FGA probes.
VVVVVV MICROARRAY CONSTRUCTION, LABELING,HYBRIDIZATION AND IMAGE ACQUISITION
Reproducibility is one of the most critical requirements for microarrayfabrication. For reliable and reproducible data, the uniformity of spotsacross the entire array is crucial to simplify image analysis andenhance the accuracy of signal detection. While array construction(oligo synthesis and printing) of FGAs does not significantly differfrom that of other types of arrays, several recommendations can bemade. Various factors will affect the uniformity of spots includingarray substrate, slide quality, printing pins, printing buffer andenvironmental controls. For instance, significant variations could becaused by pin characteristics due to the mechanical difference in pingeometry, pin age and sample solutions. Additionally, the printingbuffer is critical for obtaining homogeneous spots. Using saline sodiumcitrate (SSC) buffer, the spot homogeneity as well as binding efficiencyis often poor, largely because of high evaporation rates. We and othershave found more uniform spots can be obtained with the printingbuffer containing 50% DMSO (dimethyl sulfoxide) and between 50 and100 pmol/ul probe concentration (Hegde et al., 2000; Diehl et al., 2001;Wu et al., 2001; Tiquia et al., 2004). We use this in combination withaminopropyl silane coated glass slides (e.g. UltraGAPS, Corning,Corning, NY) and UV cross-linking at 200 mJ. In general, more cross-linking time or energy may bind oligos more strongly to slides, butmay also interfere with proper hybridization. However, the individualslide manufacturer’s recommendations for printing, cross-linking andpre-hybridization should always be consulted, as slight variations inslide chemistry and preparation procedure greatly affect theseprocesses.
Protocol 1: Microarray Printing
1. Prepare printing oligo probe solution in a 384-well, v-bottom, printingplate. Final concentration will be 50–100 pmol/ml probe and 50%DMSO (generally 5 ml probe and 5 ml DMSO).
2. Cover the plate with plastic lid and mix in an orbital shaker at 700 rpmfor 3 min.
3. Spin the printing plate using a centrifuge equipped with a rotor formicrotiter plates at 500 rpm for 5 min.
4. Setup the array printer and software (we use a PixSys 5500 printer;Cartesian technologies, Inc. Irvine, CA). Print slides according to themanufacturer’s protocol. The ideal relative humidity should be
349
Des
ign
and
Use
ofFu
nct
ional
Gen
eM
icro
arra
ys
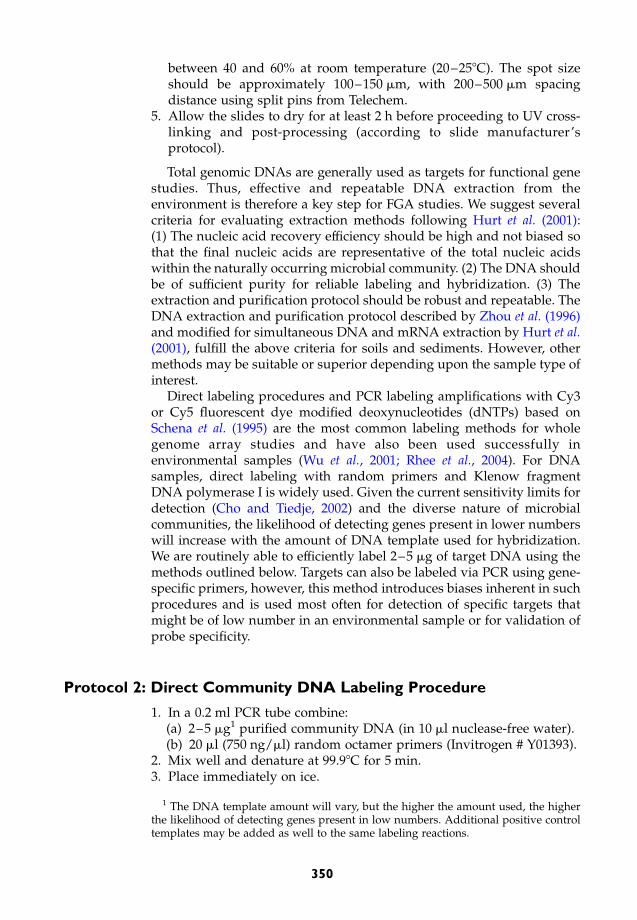
between 40 and 60% at room temperature (20–258C). The spot sizeshould be approximately 100–150 mm, with 200–500 mm spacingdistance using split pins from Telechem.
5. Allow the slides to dry for at least 2 h before proceeding to UV cross-linking and post-processing (according to slide manufacturer’sprotocol).
Total genomic DNAs are generally used as targets for functional genestudies. Thus, effective and repeatable DNA extraction from theenvironment is therefore a key step for FGA studies. We suggest severalcriteria for evaluating extraction methods following Hurt et al. (2001):(1) The nucleic acid recovery efficiency should be high and not biased sothat the final nucleic acids are representative of the total nucleic acidswithin the naturally occurring microbial community. (2) The DNA shouldbe of sufficient purity for reliable labeling and hybridization. (3) Theextraction and purification protocol should be robust and repeatable. TheDNA extraction and purification protocol described by Zhou et al. (1996)and modified for simultaneous DNA and mRNA extraction by Hurt et al.(2001), fulfill the above criteria for soils and sediments. However, othermethods may be suitable or superior depending upon the sample type ofinterest.
Direct labeling procedures and PCR labeling amplifications with Cy3or Cy5 fluorescent dye modified deoxynucleotides (dNTPs) based onSchena et al. (1995) are the most common labeling methods for wholegenome array studies and have also been used successfully inenvironmental samples (Wu et al., 2001; Rhee et al., 2004). For DNAsamples, direct labeling with random primers and Klenow fragmentDNA polymerase I is widely used. Given the current sensitivity limits fordetection (Cho and Tiedje, 2002) and the diverse nature of microbialcommunities, the likelihood of detecting genes present in lower numberswill increase with the amount of DNA template used for hybridization.We are routinely able to efficiently label 2–5 mg of target DNA using themethods outlined below. Targets can also be labeled via PCR using gene-specific primers, however, this method introduces biases inherent in suchprocedures and is used most often for detection of specific targets thatmight be of low number in an environmental sample or for validation ofprobe specificity.
Protocol 2: Direct Community DNA Labeling Procedure
1. In a 0.2 ml PCR tube combine:(a) 2–5 mg1 purified community DNA (in 10 ml nuclease-free water).(b) 20 ml (750 ng/ml) random octamer primers (Invitrogen # Y01393).
2. Mix well and denature at 99.98C for 5 min.3. Place immediately on ice.
1 The DNA template amount will vary, but the higher the amount used, the higherthe likelihood of detecting genes present in low numbers. Additional positive controltemplates may be added as well to the same labeling reactions.
350
Des
ign
and
Use
ofFu
nct
ional
Gen
eM
icro
arra
ys
4. In a 1.5 ml microcentrifuge tube, combine:(a) 2.5 ml dNTP’s (5 mM dATP, dTTP, dGTP and 2.5 mM dCTP).(b) 1 ml (1 mM) Cy3 or Cy5 dCTP.(c) 1.5 ml (40 U/ml) Klenow fragment (Invitrogen # Y01396).(d) 1.25 ml DTT (Invitrogen # Y00147).(e) 13.75 ml DNase- and RNase-free water.
5. Add this mixture to the 0.2 ml PCR from step 1 (total volume ¼ 50 ml).6. Mix well and centrifuge the mixture briefly at maximum speed.7. Incubate at 378C for 6 h or overnight.8. Purify labeled target DNA using QIAquick PCR purification columns
according to the manufacturer’s instructions (Qiagen, Valencia, CA).9. Quantify labeling efficiency as below.
Protocol 3: Quantifying Labeling Efficiency of Cy-LabeledDNA Targets
1. Use a spectrophotometer to quantify the OD at 550 for Cy3 and OD 650for Cy5. Also, measure OD at 230, 260 and 280 to assess purity. This canbe done by using only 1 ml of the labeled DNA and a NanoDrope ND-1000 spectrophotometer (NanoDrop Technologies, Inc., Montchanin,DE) or equivalent.
2. Calculate the amount of DNA as well as the specific activity ofthe labeled DNA. The specific activity is calculated as follows:
Specific activity ¼amount of target DNA £ 1000
pmole of dye incorporated £ 324:5
3. Dry in vacuum centrifuge (458C) for 1 h. Do not use higher heat levelsor heat lamps to accelerate evaporation as the fluorescent dyes could bedegraded.
Temperature, concentration of formamide and the volume of thehybridization mixture are critically important parameters for allmicroarray hybridizations. Temperature and formamide concentrationtogether control the specificity of the resulting hybridization. While thisis true of all microarray hybridizations, this can be especially importantin FGAs as many orthologous and highly similar genes may be present inany given sample. Uneven hybridizations resulting from fluctuations involume across the array can also result in spurious signal strengths andstrong backgrounds. However, in FGA studies where detection limits arealways an issue, it is highly desirable to minimize the volume ofhybridization solution. We utilize a 22 £ 22 mm glass LifterSlip coverslip (Erie Scientific, Portsmouth, NH) that allows even hybridizationswith as little as 15 ml of hybridization solution. These methods andmaterials are not the only ones available; other procedures have beenused successfully by different researchers. We present several protocolshere for illustration of the steps involved based on those currentlyemployed in our laboratory.
351
Des
ign
and
Use
ofFu
nct
ional
Gen
eM
icro
arra
ys
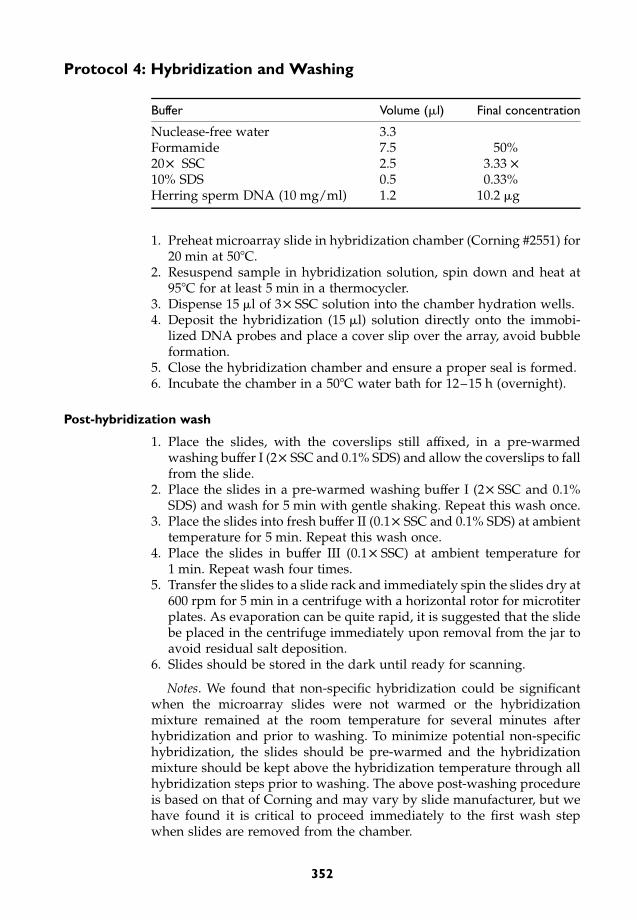
Protocol 4: Hybridization and Washing
Buffer Volume (ml) Final concentration
Nuclease-free water 3.3Formamide 7.5 50%20£ SSC 2.5 3.33 £
1. Preheat microarray slide in hybridization chamber (Corning #2551) for20 min at 508C.
2. Resuspend sample in hybridization solution, spin down and heat at958C for at least 5 min in a thermocycler.
3. Dispense 15 ml of 3£ SSC solution into the chamber hydration wells.4. Deposit the hybridization (15 ml) solution directly onto the immobi-
lized DNA probes and place a cover slip over the array, avoid bubbleformation.
5. Close the hybridization chamber and ensure a proper seal is formed.6. Incubate the chamber in a 508C water bath for 12–15 h (overnight).
Post-hybridization wash
1. Place the slides, with the coverslips still affixed, in a pre-warmedwashing buffer I (2£ SSC and 0.1% SDS) and allow the coverslips to fallfrom the slide.
2. Place the slides in a pre-warmed washing buffer I (2£ SSC and 0.1%SDS) and wash for 5 min with gentle shaking. Repeat this wash once.
3. Place the slides into fresh buffer II (0.1£ SSC and 0.1% SDS) at ambienttemperature for 5 min. Repeat this wash once.
4. Place the slides in buffer III (0.1£ SSC) at ambient temperature for1 min. Repeat wash four times.
5. Transfer the slides to a slide rack and immediately spin the slides dry at600 rpm for 5 min in a centrifuge with a horizontal rotor for microtiterplates. As evaporation can be quite rapid, it is suggested that the slidebe placed in the centrifuge immediately upon removal from the jar toavoid residual salt deposition.
6. Slides should be stored in the dark until ready for scanning.
Notes. We found that non-specific hybridization could be significantwhen the microarray slides were not warmed or the hybridizationmixture remained at the room temperature for several minutes afterhybridization and prior to washing. To minimize potential non-specifichybridization, the slides should be pre-warmed and the hybridizationmixture should be kept above the hybridization temperature through allhybridization steps prior to washing. The above post-washing procedureis based on that of Corning and may vary by slide manufacturer, but wehave found it is critical to proceed immediately to the first wash stepwhen slides are removed from the chamber.
352
Des
ign
and
Use
ofFu
nct
ional
Gen
eM
icro
arra
ys
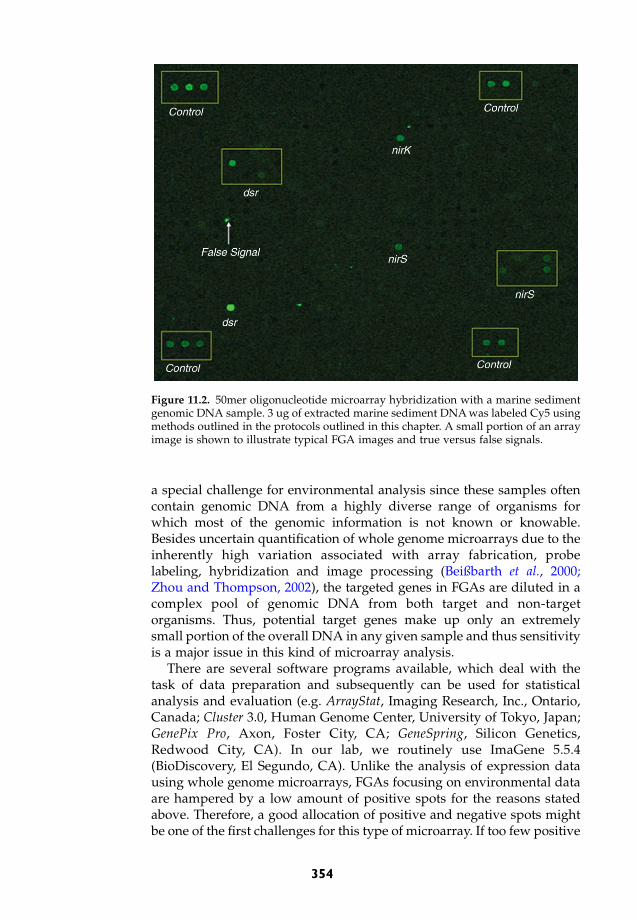
Microarray image processing is critical to control signal variation dueto high background and weak signals, and to remove false positive signals(Schuchhardt et al., 2000). One of the critical steps in the analysis ofmicroarray image data is filtering noise versus true signals. Problematicfalse signals introduced by impurities in the arrays can be identified andremoved by visual examination of each spot. This is particularly a criticalprocedure for reducing misinterpretations in the final results. With thecurrent sensitivity limits of environmental FGAs, it is most often requiredto use very high laser power and photomultiplier tube (PMT) settings fordetection of microarray signals. Compared to whole genome microarrays,that are usually scanned at much lower settings, one may thus find veryhigh levels of background for FGAs. Because of this, it is important toprevent impurities from being introduced to the process and to examineall spots critically to distinguish real signals and false signals (Figure 11.1).This can most easily be done after the image is imported to software suchas ImaGenee for spot identification and quantification, and beforeproceeding to data analysis. The image in Figure 11.2 shows typicalhybridization results for an FGA of nitrogen and sulfur cycle genes (Laserpower 100%, PMT gain 95%).
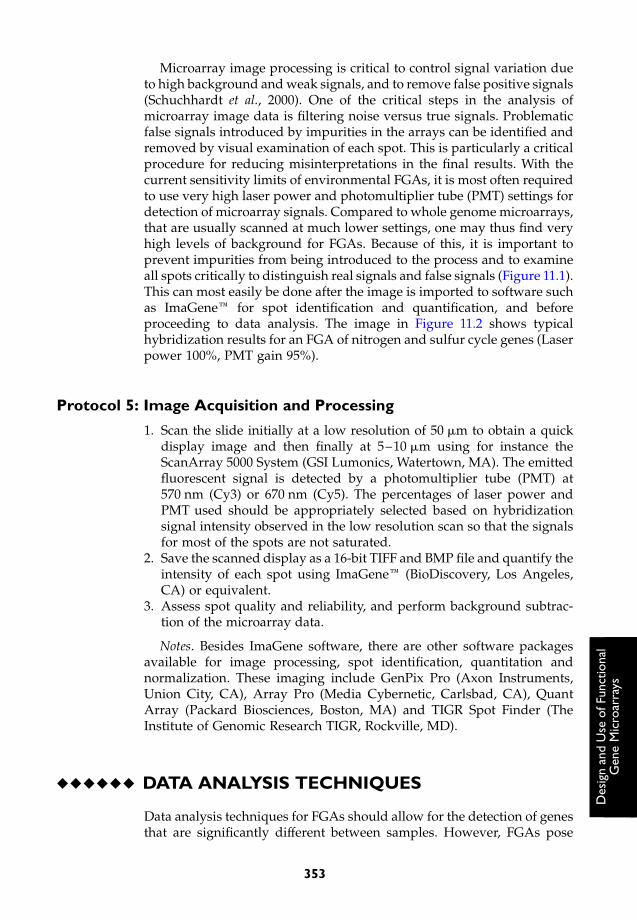
Protocol 5: Image Acquisition and Processing
1. Scan the slide initially at a low resolution of 50 mm to obtain a quickdisplay image and then finally at 5–10 mm using for instance theScanArray 5000 System (GSI Lumonics, Watertown, MA). The emittedfluorescent signal is detected by a photomultiplier tube (PMT) at570 nm (Cy3) or 670 nm (Cy5). The percentages of laser power andPMT used should be appropriately selected based on hybridizationsignal intensity observed in the low resolution scan so that the signalsfor most of the spots are not saturated.
2. Save the scanned display as a 16-bit TIFF and BMP file and quantify theintensity of each spot using ImaGenee (BioDiscovery, Los Angeles,CA) or equivalent.
3. Assess spot quality and reliability, and perform background subtrac-tion of the microarray data.
Notes. Besides ImaGene software, there are other software packagesavailable for image processing, spot identification, quantitation andnormalization. These imaging include GenPix Pro (Axon Instruments,Union City, CA), Array Pro (Media Cybernetic, Carlsbad, CA), QuantArray (Packard Biosciences, Boston, MA) and TIGR Spot Finder (TheInstitute of Genomic Research TIGR, Rockville, MD).
VVVVVV DATA ANALYSIS TECHNIQUES
Data analysis techniques for FGAs should allow for the detection of genesthat are significantly different between samples. However, FGAs pose
353
Des
ign
and
Use
ofFu
nct
ional
Gen
eM
icro
arra
ys
a special challenge for environmental analysis since these samples oftencontain genomic DNA from a highly diverse range of organisms forwhich most of the genomic information is not known or knowable.Besides uncertain quantification of whole genome microarrays due to theinherently high variation associated with array fabrication, probelabeling, hybridization and image processing (Beißbarth et al., 2000;Zhou and Thompson, 2002), the targeted genes in FGAs are diluted in acomplex pool of genomic DNA from both target and non-targetorganisms. Thus, potential target genes make up only an extremelysmall portion of the overall DNA in any given sample and thus sensitivityis a major issue in this kind of microarray analysis.
There are several software programs available, which deal with thetask of data preparation and subsequently can be used for statisticalanalysis and evaluation (e.g. ArrayStat, Imaging Research, Inc., Ontario,Canada; Cluster 3.0, Human Genome Center, University of Tokyo, Japan;GenePix Pro, Axon, Foster City, CA; GeneSpring, Silicon Genetics,Redwood City, CA). In our lab, we routinely use ImaGene 5.5.4(BioDiscovery, El Segundo, CA). Unlike the analysis of expression datausing whole genome microarrays, FGAs focusing on environmental dataare hampered by a low amount of positive spots for the reasons statedabove. Therefore, a good allocation of positive and negative spots mightbe one of the first challenges for this type of microarray. If too few positive
Figure 11.2. 50mer oligonucleotide microarray hybridization with a marine sedimentgenomic DNA sample. 3 ug of extracted marine sediment DNA was labeled Cy5 usingmethods outlined in the protocols outlined in this chapter. A small portion of an arrayimage is shown to illustrate typical FGA images and true versus false signals.
354
Des
ign
and
Use
ofFu
nct
ional
Gen
eM
icro
arra
ys
spots are present, placing the grid correctly can be very time consuming.We suggest users consider adding several positive control spots to eachgrid sector of a printed array. This allows for better spot locating ability aswell as an easy way to implement localized quality control measures.
Because all raw microarray data, and especially FGAs, are affected byunspecific background binding of labeled DNA to the slides, correctionfor background signal intensity of the raw data is necessary. To performthis task, usually the mean or median value of the local backgroundintensity of a spot is subtracted from the image intensities of the spot.Generally speaking, the application of median values is preferablebecause extreme outliers are not taken into calculations which couldotherwise falsify the real value (Beißbarth et al., 2000). However, bothapproaches have been used to process microarray data. The subtraction oflocal background data is especially imperative, whenever unevenbackground staining makes the usage of a global background valuesimpossible. Other methods of background correction are also possible:Fluorescence intensity may also be corrected from empty spots (arraypositions that do not contain any DNA) and negative control spots(e.g. probes targeting human genes in soil or groundwater samples). Todistinguish between background and real hybridizations, signal-to-noiseratios (SNR) are calculated and only those spots above a certain threshold(usually SNR $ 2 or 3) are considered as positive hybridizations. The SNRcan be calculated as follows:
SNR ¼signal mean 2 background mean
background standard deviation:
However, the method of calculation sometimes varies between authorsand thus the method must always be included when data are presented.
Meaningful interpretation and comparisons of microarray data requirestandardization of the measured raw signal intensities. Variability due topre-hybridization handling and uneven labeling efficiency can beaccounted for by the analysis of replicate microarray slides for eachsample. However, if this does not lead to adequate information, raw datamay be corrected by dividing their intensity values by negative controlspots (Dennis et al., 2003). If two or more samples are compared in two-color experiments, standardization of all data by calculating the ratio ofcy5 labeled samples and a cy3 labeled control is always necessary. Asmentioned above, in contrast to whole genome arrays, where overallexpression levels between two differently labeled samples are compared,only a small fraction of genes can often be detected when environmentalsamples are hybridized to FGAs, thus quantitative comparisons (likegeneration of ratios and relative abundances of certain genes) in this typeof microarray can only be generated for genes detectable in both samples(Talaat et al., 2002). As a consequence, many standard normalizationprocedures are not applicable for this type of microarray analysis and theuser should use great care in selecting such automated procedures.
In most cases, two or more replicates of each probe are printed on amicroarray. While many software programs offer automatic calculation
355
Des
ign
and
Use
ofFu
nct
ional
Gen
eM
icro
arra
ys
of the accordant means, data concerning the overall variability might belost and thus should rather be handled separately (Beißbarth et al., 2000).Microarray data is not in most cases normally distributed. Logarithmictransformation (log10 or log2) is needed and the transformed values willthus largely reflect the degree of abundance or expression increase of atreated sample versus the control (Dennis et al., 2003). More informationconcerning normalization and data transformations that goes beyond thescope of this chapter may be found at Zar (1999). However, newapproaches for normalization and interpretation of microarray data areconstantly being considered (Pietu et al., 1996; Chen et al., 1996; Richmondet al., 1999; Beißbarth et al., 2000; Dudley et al., 2002; Talaat et al., 2002), butthe user must be aware that most have not been fully evaluated forapplication to FGAs and their inherently different problems.
After processing the raw data, several statistical tests can be employedto discover prominent genes within specific samples or relationshipsbetween different samples. This can be done by describing similaritiesand distances of data sets by methods such as cluster analysis, principalcomponent analysis (PCA) or with the aid of self-organizing maps (SOM).Similarity comparisons are the most obvious methods to comparemicroarray data. They can be calculated either from Euclidean distances,which calculate the absolute distances between two data points in space,or as Pearson correlations, which are insensitive to the amplitude of thesignal intensity and as a result are most often used. In PCA, a multi-variant table with P columns in a P-dimensional (Euclidean) space isreduced to the two or three most representative dimensions. The firstdimension explains as many of the differences in the data sets as possibleand the second dimension as many as possible of what cannot beexplained by the first one, and so on (Gilbert et al., 2000). This approachhas been widely employed to analyze microarray data for gene expressionanalysis (Hilsenbeck et al., 1999; Thomas et al., 2001; Spanakis andBrouty-Boye, 1997).
Clustering analyses apply one of the above-mentioned similaritymeasurements to groups of genes with similar expression profiles, inorder to detect clusters of genes that are presumably involved in acommon process or that respond to a given treatment (Eisen et al., 1998). Adata set is divided in several subsets on the basis of their similarities. Inhierarchical clustering, first the most closely related data are combined toform a cluster. Subsequently, the next cluster will be formed by a subset oftwo other data possibly including the already formed clusters. As a result,the data are combined to form a phylogenetic tree, the branch lengths ofwhich represent the degree of similarity between the sets. However,several clustering methods exist, which might lead to slightly differentinterpretations (Gilbert et al., 2000). Applied to FGAs, this type of analysishelps to identify similarities and differences in the genes present inthe microbial communities at different sites as well as specific changes thatmight be due to a specific experimental treatment, etc. Such differences inclustering may indicate presumed differences in the function of interest,for example, nitrate reduction. SOM are a kind of artificial neural networkswhich can be considered as a type of mathematical cluster analysis. Data
356
Des
ign
and
Use
ofFu
nct
ional
Gen
eM
icro
arra
ys
are iteratively relocated leading to adjoining clusters with high similaritiesand more distant clusters further apart. Similar patterns will occur asneighbors in SOM (Tamayo et al., 1999).
VVVVVV EVALUATION AND VALIDATIONOF FGA RESULTS
Probes should be highly specific for the target gene in order to preventcross-hybridization from similar environmental sequences which couldlead to inaccurate results (Rhee et al., 2004; Wu et al., 2001). Specificity canbe assessed by test hybridizations using pure culture genomic DNAs andPCR amplified genes, or by synthetic oligonucleotides. While templatesmay not always be available for testing with genomic DNA or PCRproduct, synthetic oligonucleotides can be synthesized to test thespecificity of any probe. Additionally, more comprehensive testing canbe achieved with oligos, as mismatches can be designed in any numberand at any position along the probe template hybrid. Using such methods,50mer FGAs tested in our laboratory have been shown to be specific when% homology is not .85–88% (Tiquia et al., 2004; Rhee et al., 2004).However, the free energy of potential probe target hybrids is possibly abetter predictor of specificity, and with the techniques outlined here wehave found that probe-hybrid combinations with DG values of.230 kcal/mol were very specific (Rhee et al., 2004; Liebich, unpub-lished data). However, as in sensitivity measurements, these values aredependent upon the specifics of the protocols in use, and have to beempirically determined for each study.
Evaluation of the sensitivity (e.g. lower detection limit) and thequantitative relationship between hybridization strength and DNAamount are critical for understanding the results of microarray-basedapproaches for detecting genes in environmental samples. Dilutions ofpure culture genomic DNA hybridized against corresponding probesprovide a rather straightforward approach for measuring sensitivity andevaluating the quantitative nature of FGAs. However, unlike wholegenome arrays, detection limits for FGA and other environmentalmicroarrays must account for the effects of heterogeneous non-targetDNA sequences characteristic of environmental samples (Cho and Tiedje,2002; Rhee et al., 2004). Cho and Tiedje (2002) proposed that the detectionlimit of a PCR fragment of the denitrification gene nirS in anenvironmental sample was ,10 pg. This means only genes of organismswith a total DNA amount ,50 ng are detectable (assuming a 4 Mbpaverage genome size). In their experiments, 1 mg of total environmentalDNA was analyzed, suggesting that a particular organism containing nirSmust contribute at least 1/20 of the applied DNA amount to be detectable.However, increasing the amount of environmental DNA applied andother methods can improve these detection limitations. Using the sameprotocols suggested in this chapter, Rhee et al. (2004) estimated thatseveral genes involved in biodegradation of naphthalene could be
357
Des
ign
and
Use
ofFu
nct
ional
Gen
eM
icro
arra
ys
detected with 5 ng genomic DNA in the absence of background DNA.However, detection limits were 50–100 ng of pure culture genomic DNAwhen diluted in a heterogeneous background of Shewanella oneidensis. Inthis case, however, hybridizations were carried out with 5 mg of totalsample DNA, suggesting the FGA could detect cells present at a level ofabout 1/50–1/100 of the total. After logarithmic transformation, therelationship between signal intensity and applied DNA amount is mostoften linear to at least 1 mg of target (Wu et al., 2001; Cho and Tiedje, 2002;Tiquia et al., 2004; Rhee et al., 2004). However, the quantitative nature ofthe relationship is dependent upon the specifics of the protocols in use,and has to be empirically determined for each study. Ideally, quantitativecontrols should be introduced to every slide using a series of control spotsand corresponding control DNA that is co-labeled with each sample(Chen et al., 1996; Dudley et al., 2002).
While FGAs have the potential to rapidly quantify thousands ofdifferent DNA/RNA sequences in environmental samples simul-taneously (Cho and Tiedje, 2002; Dennis et al., 2003; Rhee et al., 2004;Tiquia et al., 2004; Wu et al., 2001), it may be useful to validate selectedresults using other techniques such as quantitative PCR (qPCR). Forexample, Rhee et al. (2004) used a real-time PCR-based qPCR approach toverify FGA data obtained from a PAH contaminated soil. The FGAanalysis had indicated the presence of numerous organic contaminantdegradation genes in the soil including several from the naphthalenecatabolic pathway. The researchers designed primers for six of thesenaphthalene genes, four of which generated single PCR products from thesoil DNA and were subsequently used for qPCR. The qPCR resultscorroborated the FGA data for each of the four genes by demonstratingsignificant correlations between the gene copy number and the FGAhybridization signals (r 2 ¼ 0.74 for all genes and 0.96 for genes withSNR . 3). This approach for validation, however, is most useful whenprobes target relatively unique genes. When data originating fromnumerous orthologous gene sequences are used for probe design, thespecific primers necessary for qPCR may not be possible to design.
Acknowledgements
The authors would like to thank Sonia Tiquia, Sung K. Rhee, and LiyouWu for their pioneering work in the initial development of many of theprotocols and ideas contained in this paper. The authors’ efforts inpreparing this chapter were supported by the US DOE Office of Scienceas part of its Biological and Environmental Research Programs inNatural and Accelerated Bioremediation Research, Genomes To Life,Biotechnology Investigations-Ocean Margins, and Carbon Sequestration(as part of the consortium on research to enhance Carbon Sequestration inTerrestrial Ecosystems-CSiTE). Jost Liebich’s work was also supported bythe postdoctoral program of the German Academic Exchange Service[DAAD]. Oak Ridge National Laboratory is managed by UT-Battelle,LLC, for the US Department of Energy under contract DE-AC05-00OR22725.
358
Des
ign
and
Use
ofFu
nct
ional
Gen
eM
icro
arra
ys
References
Allen, A., Booth, M. G., Frischer, M. E., Verity, P. G., Zehr, J. P. and Zani, S. (2001).Diversity and detection of nitrate assimilation genes in marine bacteria. Appl.Environ. Microbiol. 67, 5343–5348.
Altschul, S., Madden, T., Schaffer, A., Zhang, J., Miller, W. and Lipman, D. (1997).Gapped BLAST and PSI-BLAST: a new generation of protein database searchprograms. Nucleic Acids Res. 25, 3389–3402.
Andreoni, V., Bernasconi, S., Colombo, M., van Beilen, J. B. and Cavalca, L. (2000).Detection of genes for alkane and naphthalene catabolism in Rhodococcus sp.strain 1BN. Environ. Microbiol. 2, 572–577.
Baldwin, B. R., Nakatsu, C. H. and Nies, L. (2003). Detection and enumeration ofaromatic oxygenase genes by multiplex and real-time PCR. Appl. Environ.
Microbiol. 69, 3350–3358.Barkay, T., Miller, S. M. and Summers, A. O. (2003). Bacterial mercury resistance
from atoms to ecosystems. FEMS Microbiol. Rev. 27, 355–384.Beaulieu, M., Becaert, V., Deschenes, L. and Villemur, R. (2000). Evolution of
bacterial diversity during enrichment of PCP-degrading activated soils. Microb.Ecol. 40, 345–356.
Beißbarth, T., Fellenberg, K., Brors, B., Arribas-Prat, R., Boer, J. M., Hauser, N. C.,Scheideler, M., Hoheisel, J. D., Schutz, G., Poustka, A. and Virgon, M. (2000).Processing and quality control of DNA array hybridization data. Bioinformatics
16, 1014–1022.Bodrossy, L., Stralis-Pavese, N., Jurrell, J. C., Radejewski, S., Weilharter, A. and
Sessitsch, A. (2003). Development and validation of a diagnostic microbialmicroarray for methanotrophs. Environ. Microbiol. 5, 566–582.
Bogdanova, E. S., Bass, I. A., Minakhin, L. S., Petrova, M. A., Mindlin, S. Z.,Volodin, A. A., Kalyaeva, E. S., Tiedje, J. M., Hobman, J. L., Brown, N. L. andNikiforov, V. G. (1998). Horizontal spread of mer operons among Gram-positivebacteria in natural environments. Microbiology 144, 609–620.
Bosch, R., Garcia-Valdes, E. and Moore, E. R. B. (1999). Genetic characterizationand evolutionary implications of a chromosomally encoded naphthalene-degradation upper pathway from Pseudomonas stutzeri AN10. Gene 236,149–157.
Braker, G. and Tiedje, J. M. (2003). Nitric oxide reductase (norB) genes from purecultures and environmental samples. Appl. Environ. Microbiol. 69, 3476–3483.
Bruce, K. D., Osborn, A. M., Pearson, A. J., Strike, P. and Ritchie, D. A. (1995).Genetic diversity within mer genes directly amplified from communities ofnoncultivated soil and sediment bacteria. Mol. Ecol. 4, 605–612.
Cassidy, S. L. (2002). Microbial activity and biodiversity as indicators ofhydrocarbon bioremediation. Thesis. University of London, United Kingdom.
Castro, H., Reddy, K. R. and Ogram, A. (2002). Composition and function ofsulfate-reducing prokaryotes in eutrophic and pristine areas of the FloridaEverglades. Appl. Environ. Microbiol. 68, 6129–6137.
Chang, Y. J., Peacock, A. D., Long, P. E., Stephen, J. R., McKinley, J. P.,Macnaughton, S. J., Hussain, A. K., Saxton, A. M. and White, D. C. (2001).Diversity and characterization of sulfate-reducing bacteria in groundwater at auranium mill tailings site. Appl. Environ. Microbiol. 67, 3149–3160.
Chen, Y., Dougherty, E. R. and Bittner, M. (1996). Ratio-based decisions and thequantitative analysis of cDNA microarray images. J. Biomed. Opt. 2, 364–374.
Chien, Y. T. and Zinder, S. H. (1994). Cloning, DNA sequencing, andcharacterization of a nifD-homologous gene from the archaeon Methanosarcina
359
Des
ign
and
Use
ofFu
nct
ional
Gen
eM
icro
arra
ys
barkeri 227 which resembles nifD from the eubacterium Clostridium pasteur-
ianum. J. Bacteriol. 176, 6590–6598.Cho, J. C. and Tiedje, J. M. (2002). Quantitative detection of microbial genes by
using DNA microarrays. Appl. Environ. Microbiol. 68, 1425–1430.Dean, D. R., Bolin, J. T. and Zheng, L. M. (1993). Nitrogenase metalloclusters:
structures, organization, and synthesis. J. Bacteriol. 175, 6737–6744.Denef, V. J., Park, J., Rodrigues, J. L. M., Tsoi, T. V., Hashsham, S. A. and Tiedje, J. M.
(2003). Validation of a more sensitive method for using spotted oligonucleotideDNA microarrays for functional genomics studies on bacterial communities.Environ. Microbiol. 5, 933–943.
Dennis, P., Edwards, E. A., Liss, S. N. and Fulthorpe, R. (2003). Monitoring geneexpression in mixed microbial communities by using DNA microarrays. Appl.
Environ. Microbiol. 69, 769–778.Denome, S. A., Stanley, D. C., Olson, E. S. and Young, K. D. (1993). Metabolism of
dibenzothiophene and naphthalene in Pseudomonas strains – complete DNA-sequence of an upper naphthalene catabolic pathway. J. Bacteriol. 175,6890–6901.
Deplancke, B., Hristova, K. R., Oakley, H. A., McCracken, V. J., Aminov, R.,Mackie, R. I. and Gaskins, H. R. (2000). Molecular ecological analysis of thesuccession and diversity of sulfate-reducing bacteria in the mouse gastrointes-tinal tract. Appl. Environ. Microbiol. 66, 2166–2174.
DeRisi, J. L., Iyer, V. R. and Brown, P. O. (1997). Exploring the metabolic andgenetic control of gene expression on a genomic scale. Science 278, 680–686.
Diehl, F., Grahlmann, S., Beier, M. and Hoheisel, J. D. (2001). Manufacturing DNAmicroarrays of high spot homogeneity and reduced background signal. Nucleic
Acids Res. 29, E38.Duarte, G. F., Rosado, A. S., Seldin, L., de Araujo, W. and van Elsas, J. D. (2001).
Analysis of bacterial community structure in sulfurous-oil-containing soils anddetection of species carrying dibenzothiophene desulfurization (dsz) genes.Appl. Environ. Microbiol. 67, 1052–1062.
Dubilier, N., Mulders, C., Ferdelman, T., de Beer, D., Pernthaler, A., Klein, M.,Wagner, M., Erseus, C., Thiermann, F., Krieger, J., Giere, O. and Amann, R.(2001). Endosymbiotic sulphate-reducing and sulphide-oxidizing bacteria in anoligochaete worm. Nature 411, 298–302.
Dudley, A. M., Aach, J., Steffen, M. A. and Church, G. M. (2002). Measuringabsolute expression with microarrays with a calibrated reference sample and anextended signal intensity range. Proc. Natl Acad. Sci. 99, 7554–7559.
Dunfield, P. F., Liesack, W., Henckel, T., Knowles, R. and Conrad, R. (1999). High-affinity methane oxidation by a soil enrichment culture containing a type IImethanotroph. Appl. Environ. Microbiol. 65, 1009–1014.
Eisen, M. B., Spellman, P. T., Brown, P. O. and Botstein, D. (1998). Cluster analysisand display of genome-wide expression patterns. Proc. Natl Acad. Sci. 95,14863–14868.
Elsaied, H. and Naganuma, T. (2001). Phylogenetic diversity of ribulose-1,5-bisphosphate carboxylase/oxygenase large-subunit genes from deep-seamicroorganisms. Appl. Environ. Microbiol. 67, 1751–1765.
Emrich, S. J., Lowe, M. and Delcher, A. (2003). PROBEmer: a web-based softwaretool for selecting optimal DNA oligos. Nucleic Acids Res. 31, 3746–3750.
Felske, A. D. M., Fehr, W., Pauling, B. V., von Canstein, H. and Wagner-Dobler, I.(2003). Functional profiling of mercuric reductase (mer A) genes in biofilmcommunities of a technical scale biocatalyzer. BMC Microbiol. 3, 22, (publishedonline- http://www.biomedcentral.com/1471-2180/3/22).
Ferrero, M., Llobet-Brossa, E., Lalucat, J., Garcia-Valdes, E., Rossello-Mora, R. andBosch, R. (2002). Coexistence of two distinct copies of naphthalene degradationgenes in Pseudomonas strains isolated from the western Mediterranean region.Appl. Environ. Microbiol. 68, 957–962.
Finegold, S. M. and Jousimies-Somer, H. (1997). Recently described clinicallyimportant anaerobic bacteria: medical aspects. Clin. Infect. Dis. 25(Suppl. 2),S88–S93.
Friedrich, M. W. (2002). Phylogenetic analysis reveals multiple lateral transfers ofadenosine-50-phosphosulfate reductase genes among sulfate-reducing micro-organisms. J. Bacteriol. 184, 278–289.
Fuenmayor, S. L., Wild, M., Boyes, A. L. and Williams, P. A. (1998). A gene clusterencoding steps in conversion of naphthalene to gentisate in Pseudomonas sp.strain U2. J. Bacteriol. 180, 2522–2530.
Furuchi, T., Hwang, G. W. and Naganuma, A. (2002). Overexpression of theubiquitin-conjugating enzyme Cdc34 confers resistance to methylmercury inSaccharomyces cerevisiae. Mol. Pharmacol. 61, 738–741.
Geiselbrecht, A. D., Hedlund, B. P., Tichi, M. A. and Staley, J. T. (1998). Isolation ofmarine polycyclic aromatic hydrocarbon (PAH)-degrading Cycloclasticus strainsfrom the Gulf of Mexico and comparison of their PAH degradation ability withthat of Puget Sound Cycloclasticus strains. Appl. Environ. Microbiol. 64,4703–4710.
Gilbert, D. R., Schroeder, M. and van Helden, J. (2000). Interactive visualizationand exploration of relationships between biological objects. Trends Biotechnol. 18,487–494.
Gueldry, O., Lazard, M., Delort, F., Dauplais, M., Grigoras, I., Blanquet, S. andPlateau, P. (2003). Ycf1p-dependent Hg(II) detoxification in Saccharomycescerevisiae. Eur. J. Biochem. 270, 2486–2496.
Habe, H. and Omori, T. (2003). Genetics of polycyclic aromatic hydrocarbonmetabolism in diverse aerobic bacteria. Biosci. Biotechnol. Biochem. 67, 225–243.
Hallam, S. J., Girguis, P. R., Preston, C. M., Richardson, P. M. and DeLong, E. F.(2003). Identification of methyl coenzyme M reductase A (mcrA) genesassociated with methane-oxidizing archaea. Appl. Environ. Microbiol. 69,5483–5491.
Hamann, C., Hegemann, J. and Hildebrandt, A. (1999). Detection of polycyclicaromatic hydrocarbon degradation genes in different soil bacteria by poly-merase chain reaction and DNA hybridization. FEMS Microbiol. Lett. 173,255–263.
Hart, M. C., Elliott, G. N., Osborn, A. M., Ritchie, D. A. and Strike, P. (1998).Diversity amongst Bacillus mer A genes amplified from mercury resistant isolatesand directly from mercury polluted soil. FEMS Microbiol. Ecol. 27, 73–84.
Hedlund, B. P., Geiselbrecht, A. D., Bair, T. J. and Staley, J. T. (1999). Polycyclicaromatic hydrocarbon degradation by a new marine bacterium, Neptunomonasnaphthovorans gen. nov., sp. nov. Appl. Environ. Microbiol. 65, 251–259.
Hedlund, B. P., Geiselbrecht, A. D. and Staley, J. T. (2001). Marinobacter strainNCE312 has a Pseudomonas-like naphthalene dioxygenase. FEMS Microbiol. Lett.201, 47–51.
Hegde, P., Qi, R., Abernathy, K., Gay, C., Dharap, S., Gaspard, R., Hughes, J. E.,Snesrud, E., Lee, N. and Quackenbush, J. (2000). A concise guide to cDNAmicroarray analysis. BioTechniques 29, 548–560.
Herrick, J. B., StuartKeil, K. G., Ghiorse, W. C. and Madsen, E. L. (1997). Naturalhorizontal transfer of a naphthalene dioxygenase gene between bacterianative to a coal tar-contaminated field site. Appl. Environ. Microbiol. 63,2330–2337.
361
Des
ign
and
Use
ofFu
nct
ional
Gen
eM
icro
arra
ys
Hilsenbeck, S. G., Friedrichs, W. E., Schiff, R., O’Connell, P., Hansen, R. K.,Osborne, C. K. and Fuqua, S. A. (1999). Statistical analysis of array expressiondata as applied to the problem of tamoxifen resistance. J. Natl Cancer Inst.
91, 53–459.Holliger, C., Hahn, D., Harmsen, H., Ludwig, W., Schumacher, W., Tindall, B.,
Vazquez, F., Weiss, N. and Zehnder, A. J. (1998). Dehalobacter restrictus gen. nov.and sp. nov., a strictly anaerobic bacterium that reductively dechlorinates tetra-and trichloroethene in an anaerobic respiration. Arch. Microbiol. 169, 313–321.
Holmes, A. J., Costello, A., Lidstrom, M. E. and Murrell, J. C. (1995). Evidence thatparticipate methane monooxygenase and ammonia monooxygenase may beevolutionarily related. FEMS Microbiol. Lett. 132, 203–208.
Horz, H. P., Yimga, M. T. and Liesack, W. (2001). Detection of methanotrophdiversity on roots of submerged rice plants by molecular retrieval of pmoA,mmoX, mxaF, and 16S rRNA and ribosomal DNA including pmoA-basedterminal restriction fragment length polymorphism profiling. Appl. Environ.
Microbiol. 67, 4177–4185.Howard, J. B. and Rees, D. C. (1996). Structural basis of biological nitrogen
fixation. Chem. Rev. 96, 2965–2982.Huber, H., Jannasch, H., Rachel, R., Fuchs, T. and Stetter, K. O. (1997).
Archaeoglobus veneficus sp. nov., a novel facultative chemolithoautotrophichyperthermophilic sulfite reducer, isolated from abyssal black smokers. Syst.
Appl. Microbiol. 20, 374–380.Hurek, T., Egener, T. and Reinhold-Hurek, B. (1997). Divergence in nitrogenases of
Azoarcus spp., Proteobacteria of the beta subclass. J. Bacteriol. 179, 4172–4178.Hurt, R. A., Qui, X., Wu, L., Roh, Y., Palumbo, A. V., Tiedje, J. M. and Zhou, J.
(2001). Simultaneous recovery of RNA and DNA from soils and sediments.Appl. Environ. Microbiol. 67, 4495–4503.
Jeon, C. O., Park, W., Padmanabhan, P., DeRito, C., Snape, J. R. and Madsen, E. L.(2003). Discovery of a bacterium, with distinctive dioxygenase, that isresponsible for in situ biodegradation in contaminated sediment. Proc. NatlAcad. Sci. USA 100, 13591–13596.
Jørgensen, B. B. (1982). Mineralization of organic-matter in the sea bed – the role ofsulfate reduction. Nature 296, 643–645.
Karkhoff-Schweizer, R. R., Huber, D. P. and Voordouw, G. (1995). Conservation ofthe genes for dissimilatory sulfite reductase from Desulfovibrio vulgaris andArchaeoglobus fulgidus allows their detection by PCR. Appl. Environ. Microbiol. 61,290–296.
Kasai, Y., Shindo, K., Harayama, S. and Misawa, N. (2003). Molecularcharacterization and substrate preference of a polycyclic aromatic hydrocarbondioxygenase from Cycloclasticus sp. strain A5. Appl. Environ. Microbiol. 69,6688–6697.
Kauppi, B., Lee, K., Carredano, E., Parales, R. E., Gibson, D. T., Eklund, H.and Ramaswamy, S. (1998). Structure of an aromatic-ring-hydroxylatingdioxygenase-naphthalene 1,2-dioxygenase. Struct. Fold. Des. 6, 571–586.
Kholodii, G., Yurieva, O., Mindlin, S., Gorlenko, Z., Rybochkin, V. andNikiforov, V. (2000). Tn5044, a novel Tn3 family transposon coding fortemperature-sensitive mercury resistance. Res. Microbiol. 151, 291–302.
Kirshtein, J. D., Paerl, H. W. and Zehy, J. (1991). Amplification, cloning, andsequencing of a nifH segment from aquatic microorganisms and naturalcommunities. Appl. Environ. Microbiol. 57, 2645–2650.
Kleikemper, J., Schroth, M. H., Sigler, W. V., Schmucki, M., Bernasconi, S. M.and Zeyer, J. (2002). Activity and diversity of sulfate-reducing bacteria
362
Des
ign
and
Use
ofFu
nct
ional
Gen
eM
icro
arra
ys
in a petroleum hydrocarbon-contaminated aquifer. Appl. Environ. Microbiol. 68,1516–1523.
Klein, M., Friedrich, M., Roger, A. J., Hugenholtz, P., Fishbain, S., Abicht, H.,Blackall, L. L., Stahl, D. A. and Wagner, M. (2001). Multiple lateral transfers ofdissimilatory sulfite reductase genes between major lineages of sulfate-reducingprokaryotes. J. Bacteriol. 83, 6028–6035.
Koizumi, Y., Kelly, J. J., Nakagawa, T., Urakawa, H., El-Fantroussi, S., Al-Muzaini,S., Fukui, M., Urushigawa, Y. and Stahl, D. A. (2002). Parallel characterization ofanaerobic toluene- and ethylbenzene-degrading microbial consortia by PCR-denaturing gradient gel electrophoresis, RNA–DNA membrane hybridization,and DNA microarray technology. Appl. Environ. Microbiol. 68, 3215–3225.
Kurkela, S., Lehvaslaiho, H., Palva, E. T. and Teeri, T. H. (1988). Cloning,nucleotide-sequence and characterization of genes encoding naphthalenedioxygenase of Pseudomonas putida strain NCIB9816. Gene 73, 355–362.
Laddaga, R. A., Chu, L. E., Misra, T. K. and Silver, S. (1987). Nucleotide sequenceand expression of the mercurial-resistance operon from Staphylococcus aureusplasmid pI258. Proc. Natl Acad. Sci. USA 84, 5106–5110.
Larkin, M. J., Allen, C. C. R., Kulakov, L. A. and Lipscomb, D. A. (1999).Purification and characterization of a novel naphthalene dioxygenase fromRhodococcus sp. strain NCIMB12038. J. Bacteriol. 181, 6200–6204.
Larsen, O., Lien, T. and Birkeland, N. K. (1999). Dissimilatory sulfite reductasefrom Archaeoglobus profundus and Desulfotomaculum thermocisternum: phyloge-netic and structural implications from gene sequences. Extremophiles 3, 63–70.
Laue, H., Friedrich, M., Ruff, J. and Cook, A. M. (2001). Dissimilatory sulfitereductase (desulfoviridin) of the taurine-degrading, non-sulfate-reducingbacterium Bilophila wadsworthia RZATAU contains a fused DsrB–DsrD subunit.J. Bacteriol. 183, 1727–1733.
Leaphart, A. B. and Lovell, C. R. (2001). Recovery and analysis of formyltetra-hydrofolate synthetase gene sequences from natural populations of acetogenicbacteria. Appl. Environ. Microbiol. 67, 1392–1395.
Li, F. and Stormo, G. (2001). Selection of optimal DNA oligos for gene expressionarrays. Bioinformatics 17, 1067–1076.
Liu, X., Tiquia, S. M., Holguin, G., Wu, L., Nold, S. C., Devol, A. H., Luo, K.,Palumbo, A., Tiedje, J. M. and Zhou, J. (2003a). Molecular diversity ofdenitrifying genes in continental margin sediments within the oxygen-deficientzone off the pacific coast of Mexico. Appl. Environ. Microbiol. 69, 3549–3560.
Liu, Y., Zhou, J., Omelchenko, M., Beliaev, A., Venkateswaran, A., Stair, J., Wu, L.,Thompson, D. K., Xu, D., Rogozin, I. B., Gaidamakova, E. K., Zhai, M.,Makarova, K. S., Koonin, E. V. and Daly, M. J. (2003b). Transcriptome dynamicsof Deinococcus radiodurans recovering from ionizing radiation. Proc. Natl Acad.Sci. USA 100, 4191–4196.
Lloyd-Jones, G., Laurie, A. D., Hunter, D. W. F. and Fraser, R. (1999). Analysis ofcatabolic genes for naphthalene and phenanthrene degradation in contami-nated New Zealand soils. FEMS Microbiol. Ecol. 29, 69–79.
Lockhart, D. J., Dong, H., Byrne, M. C., Follettie, M. T., Gallo, M. V., Chee, M. S.,Mittmann, M., Wang, C., Kobayashi, M., Horton, H. and Brown, E. L. (1996).Expression monitoring by hybridization to high-density oligonucleotide arrays.Nat. Biotechnol. 14, 1675–1680.
Lovley, D. R. (1997). Potential for anaerobic bioremediation of BTEX in petroleum-contaminated aquifers. J. Ind. Microbiol. Biotechnol. 18, 75–81.
Lovley, D. R. and Klug, M. J. (1983). Sulfate reducers can out-competemethanogens at fresh-water sulfate concentrations. Appl. Environ. Microbiol.45, 187–192.
363
Des
ign
and
Use
ofFu
nct
ional
Gen
eM
icro
arra
ys
Lyons, J. I., Newell, S. Y., Buchan, A. and Moran, M. A. (2003). Diversity ofascomycete laccase gene sequences in a southeastern U.S. salt marsh. Microb. Ecol.
45, 270–281.Manz, W., Eisenbrecher, M., Neu, T. R. and Szewzyk, U. (1998). Abundance and
spatial organization of Gram-negative sulfate-reducing bacteria in activatedsludge investigated by in situ probing with specific 16S rRNA targetedoligonucleotides. FEMS Microbiol. Ecol. 25, 43–61.
Marchesi, J. R. and Weightman, A. J. (2003). Comparing the dehalogenase genepool in cultivated a-halocarboxylic acid-degrading bacteria with the environ-mental metagene pool. Appl. Environ. Microbiol. 69, 4375–4382.
Martin-Laurent, F., Piutti, S., Hallet, S., Wagschal, I., Philippot, L., Catroux, G. andSoulas, G. (2003). Monitoring of atrazine treatment on soil bacterial, fungal andatrazine-degrading communities by quantitative competitive PCR. Pest. Manag.
Sci. 59, 259–268.Mason, R. P., Fitzgerald, W. F. and Morel, F. M. M. (1994). The biogeochemical
cycling of elemental mercury – anthropogenic influences. Geochim. Cosmochim.
Acta 58, 3191–3198.McGowan, C., Fulthorpe, R., Wright, A. and Tiedje, J. M. (1998). Evidence for
interspecies gene transfer in the evolution of 2,4-dichlorophenoxyacetic aciddegraders. Appl. Environ. Microbiol. 64, 4089–4092.
McMahon, K. D., Dojka, M. A., Pace, N. R., Jenkins, D. and Keasling, J. D. (2002).Polyphosphate kinase from activated sludge performing enhanced biologicalphosphorus removal. Appl. Environ. Microbiol. 68, 4971–4978.
Melcher, R. J., Apitz, S. E. and Hemmingsen, B. B. (2002). Impact of irradiation andpolycyclic aromatic hydrocarbon spiking on microbial populations in marinesediment for future aging and biodegradability studies. Appl. Environ. Microbiol.
68, 2858–2868.Metcalfe, A. C., Krsek, M., Gooday, G. W., Prosser, J. I. and Wellington, E. M. H.
(2002). Molecular analysis of a bacterial chitinolytic community in an uplandpasture. Appl. Environ. Microbiol. 68, 5042–5050.
Molitor, M., Dahl, C., Molitor, I., Schafer, U., Speich, N., Huber, R., Deutzmann, R.and Truper, H. G. (1998). A dissimilatory sirohaem-sulfite-reductase-typeprotein from the hyperthermophilic archaeon Pyrobaculum islandicum. Micro-
biology 144, 529–541.Mori, K., Kim, H., Kakegawa, T. and Hanada, S. (2003). A novel lineage of sulfate-
narugense, gen. nov., sp. nov., a new thermophilic isolate from a hot spring.Extremophiles 7, 283–290.
Murrell, J. C., Gilbert, B. and McDonald, I. R. (2000). Molecular biology andregulation of methane monooxygenase. Arch. Microbiol. 173, 325–332.
Murrell, J. C., McDonald, I. R. and Bourne, D. G. (1998). Molecular methods for thestudy of methanotroph ecology. FEMS Microbiol. Ecol. 27, 103–114.
Myers, E. W. (1998). A fast bit-vector algorithm for approximate string matchingbased on dynamic programming. Ninth Combinatorial Pattern MatchingConference. Springer, Piscataway, NJ, pp. 1–13.
Nakagawa, T., Nakagawa, S., Inagaki, F., Takai, K. and Horikoshi, K.(2004). Phylogenetic diversity of sulfate-reducing prokaryotes in activedeep-sea hydrothermal vent chimney structures. FEMS Microbiol. Lett. 232,145–152.
Nascimento, A. M. and Chartone-Souza, E. (2003). Operon mer: bacterialresistance to mercury and potential for bioremediation of contaminatedenvironments. Genet. Mol. Res. 2(92), 101.
364
Des
ign
and
Use
ofFu
nct
ional
Gen
eM
icro
arra
ys
Nguyen-nhu, N. T. and Knoops, B. (2002). Alkyl hydroperoxide reductase1 protects Saccharomyces cerevisiae against metal ion toxicity and glutathionedepletion. Toxicol. Lett. 135, 219–228.
Nielsen, H. B., Wernersson, R. and Knudsen, S. (2003). Design of oligonucleotidesfor microarrays and perspectives for design of multi-transcriptome arrays.Nucleic Acids Res. 31, 3491–3496.
Nold, S. C., Zhou, J. Z., Devol, A. H. and Tiedje, J. M. (2000). Pacific northwestmarine sediments contain ammonia-oxidizing bacteria in the beta subdivisionof the Proteobacteria. Appl. Environ. Microbiol. 66, 4532–4535.
Normand, P. and Bousquet, J. (1989). Phylogeny of nitrogenase sequences inFrankia and other nitrogen-fixing microorganisms. J. Mol. Evol. 29, 436–447.
Normand, P., Gouy, M., Cournoyer, B. and Simonet, P. (1992). Nucleotide sequenceof nifD from Frankia alni strain ARI3: phylogenetic inferences. Mol. Biol. Evol. 9,495–506.
Oger, C., Mahillon, J. and Petit, F. (2003). Distribution and diversity of a cadmiumresistance (cadA) determinant and occurrence of IS257 insertion sequences inStaphylococcal bacteria isolated from a contaminated estuary (Seine, France).FEMS Microbol. Ecol. 43, 173–183.
Osborn, A. M., Bruce, K. D., Strike, P. and Ritchie, D. A. (1997). Distribution,diversity and evolution of the bacterial mercury resistance (mer) operon. FEMSMicrobiol. Rev. 19, 239–262.
Parales, R. E., Emig, M. D., Lynch, N. A. and Gibson, D. T. (1998). Substratespecificities of hybrid naphthalene and 2,4-dinitrotoluene dioxygenase enzymesystems. J. Bacteriol. 180, 2337–2344.
Parales, R. E., Lee, K., Resnick, S. M., Jiang, H. Y., Lessner, D. J. and Gibson, D. T.(2000). Substrate specificity of naphthalene dioxygenase: effect of specific aminoacids at the active site of the enzyme. J. Bacteriol. 182, 1641–1649.
Park, W., Padmanabhan, P., Padmanabhan, S., Zylstra, G. J. and Madsen, E. L.(2002). nahR, encoding a LysR-type transcriptional regulator, is highlyconserved among naphthalene-degrading bacteria isolated from a coal tarwaste-contaminated site and in extracted community DNA. Microbiology 148,2319–2329.
Philippot, L., Piutti, S., Martin-Laurent, F., Hallet, S. and Germon, J. C. (2002).Molecular analysis of the nitrate-reducing community from unplanted andmaize-planted soils. Appl. Environ. Microbiol. 68, 6121–6128.
Pietu, G., Alibert, O., Guichard, V., Lamy, B., Bois, F., Leroy, E., Mariage-Samson, R.,Houlgatte, R., Soularue, P. and Auffray, C. (1996). Novel gene transcriptspreferentially expressed in human muscles revealed by quantitative hybridiza-tion of a high density cDNA array. Genome Res. 6, 492–503.
Rabus, R., Hansen, T. and Widdel, F. (2000). The dissimilatory sulfate- and sulfurreducing Prokaryotes. In The Prokaryotes: An Evolving Electronic Resource for the
Microbiological Community (M. Dworkin et al., eds), 3rd edn. Springer, New York,release 3.3, http://link.springer-ny.com/link/service/books/10125/.
Relogio, A., Schwager, C., Richter, A., Ansorge, W. and Valcarcel, A. (2002).Optimization of oligonucleotide-based DNA microarrays. Nucleic Acids Res.
30, e51.Reniero, D., Mozzon, E., Galli, E. and Barbieri, P. (1998). Two aberrant
mercury resistance transposons in the Pseudomonas stutzeri plasmid pPB. Gene
208, 37–42.Rensing, C., Newby, D. T. and Pepper, I. L. (2002). The role of selective pressure
and selfish DNA in horizontal gene transfer and soil microbial communityadaptation. Soil Biol. Biochem. 34, 285–296.
Reymond, N., Charles, H., Duret, L., Calevro, F., Beslon, G. and Fayard, J.-M.(2004). ROSO: optimizing oligonucleotide probes for microarrays. Bioinformatics
20, 271–273.Rhee, S. K., Liu, X., Wu, L., Chong, S. C., Wan, X. and Zhou, J. (2004). Detection of
genes involved in biodegradation and biotransformation in microbial commu-nities by using 50-mer oligonucleotide microarrays. Appl. Environ. Microbiol. 70,4303–4317.
Richmond, C. S., Glasner, J. D., Mau, R., Jin, H. and Blattner, F. R. (1999). Genome-wide expression profiling in Escherichia coli K-12. Nucleic Acids Res. 27,3821–3835.
Romine, M. F., Stillwell, L. C., Wong, K. K., Thurston, S. J., Sisk, E. C., Sensen, C.,Gaasterland, T., Fredrickson, J. K. and Saffer, J. D. (1999). Complete sequence ofa 184-kilobase catabolic plasmid from Sphingomonas aromaticivorans F199.J. Bacteriol. 181, 1585–1602.
Rouillard, J.-M., Herbert, C. and Zuker, M. (2002). OligoArray: genome-scaleoligonucleotide design for microarrays. Bioinformatics 18, 486–487.
Rouillard, J.-M., Zuker, M. and Gulari, E. (2003). OligoArray 2.0: design ofoligonucleotide probes for DNA microarrays using thermodynamic approach.Nucleic Acids Res. 31, 3057–3062.
Rozen, S. and Skaletsky, H. J. (2000). Primer3 on the WWW for general users andfor biologist programmers. Meth. Mol. Biol. 13, 365–386.
Scala, D. and Kerkhof, L. J. (1999). Diversity of nitrous oxide reductase (nosZ)genes in continental shelf sediments. Appl. Environ. Microbiol. 65, 1681–1687.
Schelert, J., Dixit, V., Hoang, V., Simbahan, J., Drozda, M. and Blum, P. (2004).Occurrence and characterization of mercury resistance in the hyperthermo-philic archaeon Sulfolobus solfataricus by use of gene disruption. J. Bacteriol.
2, 427–437.Schena, M., Shalon, D., Davis, R. W. and Brown, P. O. (1995). Quantitative
monitoring of gene expression patterns with a complementary DNA micro-array. Science 270, 467–470.
Schena, M., Shalon, D., Heller, R., Chai, A., Brown, P. O. and Davis, R. W. (1996).Parallel human genome analysis: microarray-based expression monitoring of1000 genes. Proc. Natl Acad. Sci. USA 93, 10614–10619.
Schluter, A., Heuer, H., Szczepanowski, R., Forney, L. J., Thomas, C. M., Puhler, A.and Top, E. M. (2003). The 64 508 bp IncP-1b antibiotic multiresistance plasmidpB10 isolated from a waste-water treatment plant provides evidence forrecombination between members of different branches of the IncP-1b group.Microbiology 149, 3139–3153.
Schneiker, S., Keller, M., Droge, M., Lanka, E., Puhler, A. and Selbitschka, W.(2001). The genetic organization and evolution of the broad host range mercuryresistance plasmid pSB102 isolated from a microbial population residing in therhizosphere of alfalfa. Nucleic Acids Res. 29, 5169–5181.
Schuchhardt, J., Beule, D., Malik, A., Wolski, E., Eickhoff, H., Lehrach, H. andHerzel, H. (2000). Normalization strategies for cDNA microarrays. Nucleic AcidsRes. 28, E47.
Singleton, R. Jr. (1993). The sulfate-reducing bacteria: an overview. In The Sulfate-
Reducing Bacteria: Contemporary Perspectives (J. M. Odom and R. Singleton Jr.,eds), Brock/Springer Series in Contemporary Bioscience, pp. 1–20. Springer,New York.
Sota, M., Kawasaki, H. and Tsuda, M. (2003). Structure of haloacetate-catabolicIncP-1b plasmid pUO1 and genetic mobility of its residing haloacetate-catabolictransposon. J. Bacteriol. 185, 6741–6745.
366
Des
ign
and
Use
ofFu
nct
ional
Gen
eM
icro
arra
ys
Spanakis, E. and Brouty-Boye, D. (1997). Discrimination of fibroblast subtypes bymultivariate analysis of gene expression. Int. J. Cancer 71, 402–409.
Stach, J. E. M. and Burns, R. G. (2002). Enrichment versus biofilm culture: afunctional and phylogenetic comparison of polycyclic aromatic hydrocarbon-degrading microbial communities. Environ. Microbiol. 4, 169–182.
Sullivan, J. P., Dickinson, D. and Chase, H. A. (1998). Methanotrophs, Methylosinustrichosporium OB3b, sMMO, and their application to bioremediation. Crit. Rev.Microbiol. 24, 335–373.
Sun, C. G., Snape, C. E., McRae, C. and Fallick, A. E. (2003). Resolving coal andpetroleum-derived polycyclic aromatic hydrocarbons (PAHs) in some contami-nated land samples using compound-specific stable carbon isotope ratiomeasurements in conjunction with molecular fingerprints. Fuel 82, 2017–2023.
Takizawa, N., Iida, T., Sawada, T., Yamauchi, K., Wang, Y. W., Fukuda, M. andKiyohara, H. (1999). Nucleotide sequences and characterization of genesencoding naphthalene upper pathway of Pseudomonas aeruginosa PaK1 andPseudomonas putida OUS82. J. Biosci. Bioeng. 87, 721–731.
Takizawa, N., Kaida, N., Torigoe, S., Moritani, T., Sawada, T., Satoh, S. andKiyohara, H. (1994). Identification and characterization of genes encodingpolycyclic aromatic hydrocarbon dioxygenase and polycyclic aromatic hydro-carbon dihydrodiol dehydrogenase in Pseudomonas putida OUS82. J. Bacteriol.176, 2444–2449.
Talaat, A. M., Howard, S. T., Hale IV, W., Lyons, R., Garner, H. and Jonston, S. A.(2002). Genomic DNA standards for gene expression profiling in Mycobacteriumtuberculosis. Nucleic Acids Res. 30, e104.
Tamayo, P., Slonim, D., Mesirov, J., Zhu, Q., Kitareewan, S., Dmitrovsky, E.,Lander, E. S. and Golub, T. R. (1999). Interpreting patterns of gene expressionwith self-organizing maps: methods and application to hematopoietic differen-tiation. Proc. Natl Acad. Sci. 96, 2907–2912.
Taroncher-Oldenburg, G., Griner, E. M., Francis, C. A. and Ward, B. B. (2002).Oligonucleotide microarray for the study of functional gene diversity in thenitrogen cycle in the environment. Appl. Environ. Microbiol. 69, 1159–1171.
Thomas, J. G., Olson, J. M., Tapscott, S. J. and Zhao, L. P. (2001). An efficient androbust statistical modeling approach to discover differentially expressed genesusing genomic expression profiles. Genome Res. 11, 1227–1236.
Thompson, D. K., Beliaev, A. S., Giometti, C. S., Tollaksen, S. L., Khare, T., Lies,D. P., Nealson, K. H., Lim, H., Yates III, J., Brandt, C. C., Tiedje, J. M. and Zhou, J.(2002). Transcriptional and proteomic analysis of a ferric uptake regulator(Fur) mutant of Shewanella oneidensis: possible involvement of Fur in energymetabolism, transcriptional regulation, and oxidative stress. Appl. Environ.Microbiol. 68, 881–892.
Tiquia, S. M., Wu, L., Chong, S. C., Passovets, S., Xu, D., Xu, Y. and Zhou, J. (2004).Evaluation of 50-mer oligonucleotide arrays for detecting microbial populationsin environmental samples. BioTechniques 36, 664–675.
Top, E. M. and Springael, D. (2003). The role of mobile genetic elements in bacterialadaptation to xenobiotic organic compounds. Curr. Opin. Biotechnol. 14, 262–269.
Ueda, T., Suga, Y., Yahiro, N. and Matsuguchi, T. (1995). Genetic diversity of N2-fixing bacteria associated with rice roots by molecular evolutionary analysis of anifD library. Can. J. Microbiol. 41, 235–240.
Venkatesan, M. M., Goldberg, M. B., Rose, D. J., Grotbeck, E. J., Burland, V. andBlattner, F. R. (2001). Complete DNA sequence and analysis of the largevirulence plasmid of Shigella flexneri. Infect. Immun. 69, 3271–3285.
Vitousek, P. M. and Howarth, R. W. (1991). Nitrogen limitation on land and in thesea: how can it occur? Biogeochemistry 13, 87–115.
367
Des
ign
and
Use
ofFu
nct
ional
Gen
eM
icro
arra
ys
Wackett, L. P. (2002). Mechanism and applications of Rieske non-heme irondioxygenases. Enzyme Microb. Technol. 31, 577–587.
Wagner, M., Roger, A. J., Flax, J. L., Brusseau, G. A. and Stahl, D. A. (1998).Phylogeny of dissimilatory sulfite reductases supports an early origin of sulfaterespiration. J. Bacteriol. 180, 2975–2982.
Wang, X. and Seed, B. (2003). Selection of oligonucleotide probes for proteincoding sequences. Bioinformatics 19, 796–802.
Westwater, J., McLaren, N. F., Dormer, U. H. and Jamieson, D. J. (2002). Theadaptive response of Saccharomyces cerevisiae to mercury exposure. Yeast 19,233–239.
Widmer, F., Shaffer, B. T., Porteous, L. A. and Seidler, R. J. (1999). Analysis of nifHgene pool complexity in soil and litter at a Douglas fir forest site in the OregonCascade mountain range. Appl. Environ. Microbiol. 65, 374–380.
Wilson, M. S., Bakermans, C. and Madsen, E. L. (1999). In situ, real-time catabolicgene expression: extraction and characterization of naphthalene dioxygenasemRNA transcripts from groundwater. Appl. Environ. Microbiol. 65, 80–87.
Wilson, M. S., Herrick, J. B., Jeon, C. O., Hinman, D. E. and Madsen, E. L. (2003).Horizontal transfer of phnAc dioxygenase genes within one of two phenotypi-cally and genotypically distinctive naphthalene-degrading guilds from adjacentsoil environments. Appl. Environ. Microbiol. 69, 2172–2181.
Wu, L. Y., Thompson, D. K., Li, G., Hurt, R. A., Tiedje, J. M. and Zhou, J. (2001).Development and evaluation of functional gene arrays for detection of selectedgene in the environment. Appl. Environ. Microbiol. 67, 5780–5790.
Xu, D., Li, G., Wu, L., Zhou, J. and Xu, Y. (2002). PRIMEGENS: robust and efficientdesign of gene-specific probes for microarray analysis. Bioinformatics 18(11),1432–1437.
Ye, R. W., Tao, W., Beddzyk, L., Young, T., Chen, M. and Li, L. (2000). Global geneexpression profiles of Bacillus subtilis grown under anaerobic conditions.J. Bacteriol. 182, 4458–4465.
Yurieva, O., Kholodii, G., Minakhin, L., Gorlenko, Z., Kalyaeva, E., Mindlin, S. andNikiforov, V. (1997). Intercontinental spread of promiscuous mercury-resistancetransposons in environmental bacteria. Mol. Microbiol. 24, 321–329.
Zar, J. H. (1999). Biostatistical Analysis. Prentice-Hall, Englewood Cliffs, NJ.Zehr, J. P. and McReynolds, L. A. (1989). Use of degenerate oligonucleotides for
amplification of the nifH gene from the marine cyanobacterium Trichodesmiumspp. Appl. Environ. Microbiol. 55, 2522–2526.
Zehr, J. P., Mellon, M., Braun, S., Litaker, W., Steppe, T. and Paerl, H. W. (1995).Diversity of heterotrophic nitrogen fixation genes in a marine cyanobacterialmat. Appl. Environ. Microbiol. 61, 2527–2532.
Zhou, J. (2003). Microarrays for bacterial detection and microbial communityanalysis. Curr. Opin. Microbiol. 6, 288–294.
Zhou, J. and Thompson, D. K. (2002). Challenges in applying microarrays toenvironmental studies. Curr. Opin. Biotechnol. 13, 204–207.
Zhou, J., Bruns, M. A. and Tiedje, J. M. (1996). DNA recovery from soils of diversecomposition. Appl. Environ. Microbiol. 62, 461–468.
Zhu, J., Bozdech, Z. and DeRisi, J. (2003). ArrayOligoSelector. http://sourceforge.net/projects/arrayoligosel/.
Zuker, M., Mathews, D. H. and Turner, D. H. (1999). Algorithms andthermodynamics for RNA secondary structure prediction: a practical guide.In RNA Biochemistry and Biotechnology (J. Barciszewski and B. F. C. Clark, eds),pp. 11–43. Kluwer Academic Publishers, Dordrecht.