Debt Instruments and Markets 1 Introduction to Fixed Income Portfolio Management Professor Carpenter Introduction to Fixed Income Portfolio Management Outline and Reading Outline Overview of the US Bond Fund Industry Overview of China’s Wealth Management and Mutual Fund Industries Risk, Returns, and Performance Measures Mean Excess Returns, Volatility, Sharpe Ratio Evidence on US Bond ETF Returns Reading ICI Factbook https://www.ici.org/research/stats/factbook
Transcript
Debt Instruments and Markets
1
Introduction to Fixed Income Portfolio Management
Professor Carpenter
Introduction to Fixed Income Portfolio Management
Outline and Reading Outline
n Overview of the US Bond Fund Industry
n Overview of China’s Wealth Management and Mutual Fund Industries
n Risk, Returns, and Performance Measures
n Mean Excess Returns, Volatility, Sharpe Ratio
n Evidence on US Bond ETF Returns
Reading
n ICI Factbook https://www.ici.org/research/stats/factbook
Debt Instruments and Markets
2
Introduction to Fixed Income Portfolio Management
Professor Carpenter
Worldwide Total AUM of Regulated Open-End Funds Surpassed $43 Trillion by End of 2017
3
US Bond Fund Industry: Total Mutual Fund + ETF AUM is 110% of GDP Bond, Hybrid, and Money Market are 41% of Total
4
Debt Instruments and Markets
3
Introduction to Fixed Income Portfolio Management
Professor Carpenter
Cumulative Net Flows Into Bond Mutual Funds Over the Last Decade Reached $2.2T
5
Index Mutual Funds and ETFs are a Growing Share of Total Funds
6
Debt Instruments and Markets
4
Introduction to Fixed Income Portfolio Management
Professor Carpenter
Bond and Hybrid ETFs are 14% of ETF AUM
7
Bond and Hybrid Funds are 26% of New ETF Issuance
8
Debt Instruments and Markets
5
Introduction to Fixed Income Portfolio Management
Professor Carpenter
Bond Funds are 60% of $275 Billion Closed-End Mutual Fund Market
9
China’s Wealth Management Industry
10
Like the rest of China’s financial system, China’s asset management industry is dominated by banks and shadow banks, such as trusts and internet finance companies, which issue wealth-management products (WMPs) backed by pools of loans and securities.
Many WMPs are short-term, deposit-like instruments, issued or marketed by banks to individuals. They offer a higher interest rate than deposits and do not claim the same guarantee. However, they are typically viewed by households as implicitly guaranteed by the government (“rigid bailout”).
Other WMPs have riskier, contingent payoffs, that can be equity-linked, option-like, or levered positions.
Estimates of WMP issuance range widely, around 40% of GDP.
Major source of systemic risk? Interest rate liberalization?
Debt Instruments and Markets
6
Introduction to Fixed Income Portfolio Management
Professor Carpenter
Example of a Bank Wealth Management Pool
11
Internet Companies also offer WMPs: E.g., Alibaba’s Yue Bao Money Market Fund
12
• Now the world’s largest money market fund, over $260 Billion AUM.
• Offers 4-5% on 7-day products.
• Has a perceived implicit guarantee.
• China’s securities should be priced by domestic investors to compete with these wealth management products.
Debt Instruments and Markets
7
Introduction to Fixed Income Portfolio Management
Professor Carpenter
Chinese Money Market Returns are Driving Sales of MMkt Funds in Asia-Pacific Region
13
Chinese Banks Are Turning to Structured Deposits Paying Potentially Higher Rates to Compete with WMPs and Money Market Products – 10% of GDP
Sources: WSJ, WIND
Debt Instruments and Markets
8
Introduction to Fixed Income Portfolio Management
Professor Carpenter
Structured deposit coupons are linked to a benchmark such as FX, an interest rate, or commodity price, collared between a cap and floor rate.
P2P lending platforms are also popular, with loans outstanding totaling $180B.
P2P platforms enable small borrowers without collateral to get loans at high rates (around 20%). Renrendai (“everybody can get a loan”) is one of the largest. Offers a rate of 10% for first-time lenders, for a 1-month investment. Defaults are an increasing concern for regulators.
Money Market Funds Alternative Investment Funds QD II Funds
China’s Mutual Fund Industry: AUM only 13% of GDP, mostly in money market, but growing fast…
Debt Instruments and Markets
10
Introduction to Fixed Income Portfolio Management
Professor Carpenter
Cross-Country Variation in Long-Term Asset Mutual Fund AUM Relative to Size of Stock Market
19
Portfolio Management Portfolio managers typically try to maximize their expected return for a given level of risk or other portfolio constraints.
Factor-based investing refines this idea to allow for multiple dimensions of risk, or risk factors, and considers whether the managed portfolio earns a higher expected return than required given its exposure to these factors, i.e., “alpha.”
In order to maximize risk-adjusted return, managers need to understand the risks and expected returns on the securities they hold, how they covary with each other and other market factors.
Insight can be gained by analyzing historical data and studying the statistical properties of past returns.
Of course this always needs to be blended with an understanding of how the current and future economic and investment environment may be different from the past.
Debt Instruments and Markets
11
Introduction to Fixed Income Portfolio Management
Professor Carpenter
Security Returns and Performance Measures
The return of a given security with price P, say a stock or bond, over a given month t+1 is Rt+1 = (Pt+1-Pt)/Pt
If the security price is risky, this is unknown at the end of month t.
If the security is the zero maturing at the end of month t+1, this is known at end of month t and we call it the riskless rate, Rft+1.
The excess return of the security is Rt+1 = Rt+1- Rft+1.
The Sharpe Ratio of a security or portfolio is its expected excess return divided by the volatility of its return.
The Sharpe Ratio is leverage-invariant. E.g., if you lever a position 2 to 1, you double the excess return and you double the volatility, but the Sharpe Ratio remains the same.
Portfolio Returns and Performance Measures
Ultimately, investors hold securities and other assets in portfolios, not in isolation. When you put securities or other assets together in a portfolio, you can get diversification benefits. The expected return of a portfolio is the average of the expected returns of its securities. The variance of the return of a well-diversified portfolio is the average covariance of these returns. We typically use the time series of returns to estimate means, variances, and covariances.
Debt Instruments and Markets
12
Introduction to Fixed Income Portfolio Management
Professor Carpenter
Statistics Review
Statistics Review, cont’d
Debt Instruments and Markets
13
Introduction to Fixed Income Portfolio Management
Professor Carpenter
Portfolio Returns and Performance Measures: Formulas
The raw return Rp of a portfolio with pv weights w1 in asset 1, w2 in asset 2, …, wn in asset n is the weighted average return Rp = w1R1 + w2R2 + … + wnRn. The excess return Rp of a portfolio with pv weights w1 in asset 1, …, wn in asset n is Rp = Rp-Rf = w1(R1-Rf) … + wn(Rn-Rf) = w1R1 + … + wnRn, the weighted average excess return of the assets. The expected portfolio excess return is E{Rp} = w1E{R1} + w2E{R2} + … + wnE{Rn}. The variance of the portfolio excess return is Var{Rp} = w1
2Var{R1}+…+wn2Var{Rn} + 2ΣiΣj>iwiwjCov{Ri,Rj}
Ptf variance à average covariance as n grows large.
Ptf Sharpe Ratio is SR{RP}=E{Rp}/√Var{RP}=E{Rp}/Vol{RP}
26
Debt Instruments and Markets
14
Introduction to Fixed Income Portfolio Management
Professor Carpenter
Performance Measures for US Treasury ETFs: Annualized Measures based on Monthly Returns 2007 to 2018
• Annualized mean excess return = 12 x monthly mean excess return. • Annualized volatility of excess return = √12 x monthly volatility. • Declining Sharpe Ratios across maturities--suggests more than one priced
risk factor is driving bond returns.
Performance Measures for Benchmark US ETFs: Annualized Measures based on Monthly Returns 2007 to 2018
Name Ticker Mean Excess Return
Volatility Sharpe Ratio
Blackrock iShares Core US Aggregate Bond ETF AGG 3.10% 3.82% 0.81
PIMCO Total Return Active ETF BOND 3.25% 3.34% 0.97
Blackrock iShares iBoxx High Yield Corp. Bond ETF HYG 5.00% 11.50% 0.43
State Street SPDR S&P 500 ETF SPY 8.01% 14.66% 0.55
Debt Instruments and Markets
15
Introduction to Fixed Income Portfolio Management
Professor Carpenter
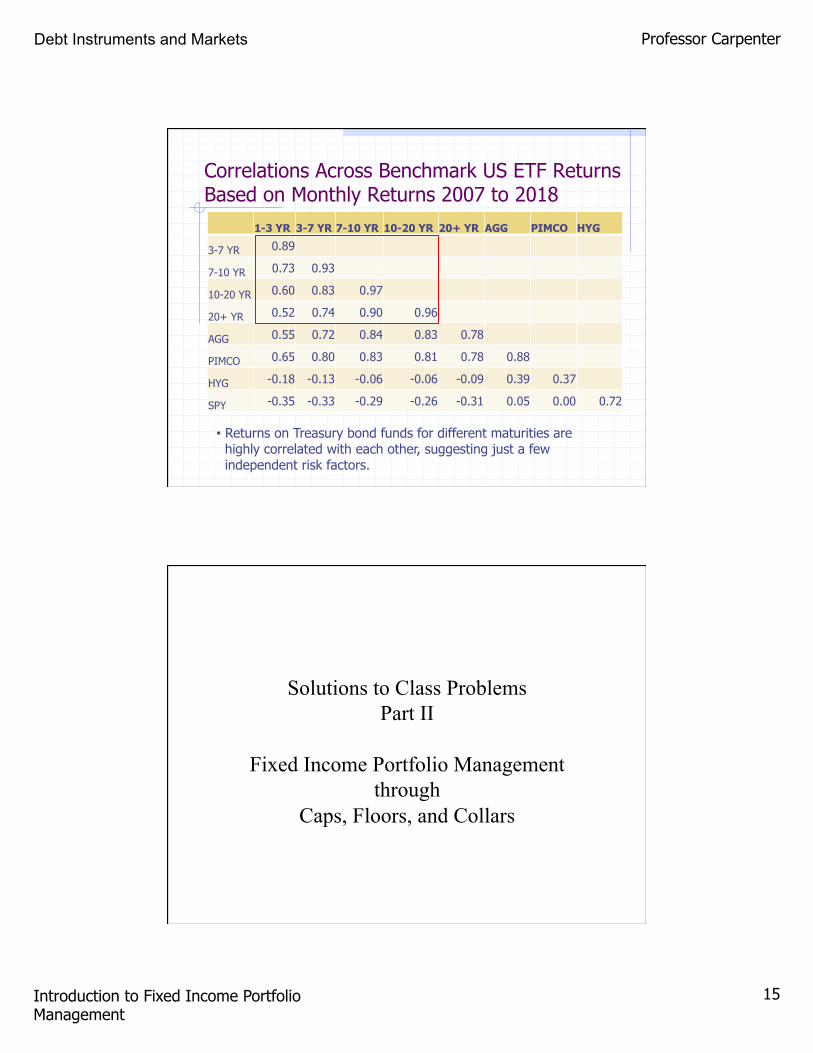
Correlations Across Benchmark US ETF Returns Based on Monthly Returns 2007 to 2018
• Returns on Treasury bond funds for different maturities are highly correlated with each other, suggesting just a few independent risk factors.
1-3 YR 3-7 YR 7-10 YR 10-20 YR 20+ YR AGG PIMCO HYG
3-7 YR 0.89
7-10 YR 0.73 0.93
10-20 YR 0.60 0.83 0.97
20+ YR 0.52 0.74 0.90 0.96
AGG 0.55 0.72 0.84 0.83 0.78
PIMCO 0.65 0.80 0.83 0.81 0.78 0.88
HYG -0.18 -0.13 -0.06 -0.06 -0.09 0.39 0.37
SPY -0.35 -0.33 -0.29 -0.26 -0.31 0.05 0.00 0.72
Solutions to Class Problems Part II
Fixed Income Portfolio Management
through Caps, Floors, and Collars
Debt Instruments and Markets
16
Introduction to Fixed Income Portfolio Management
Professor Carpenter
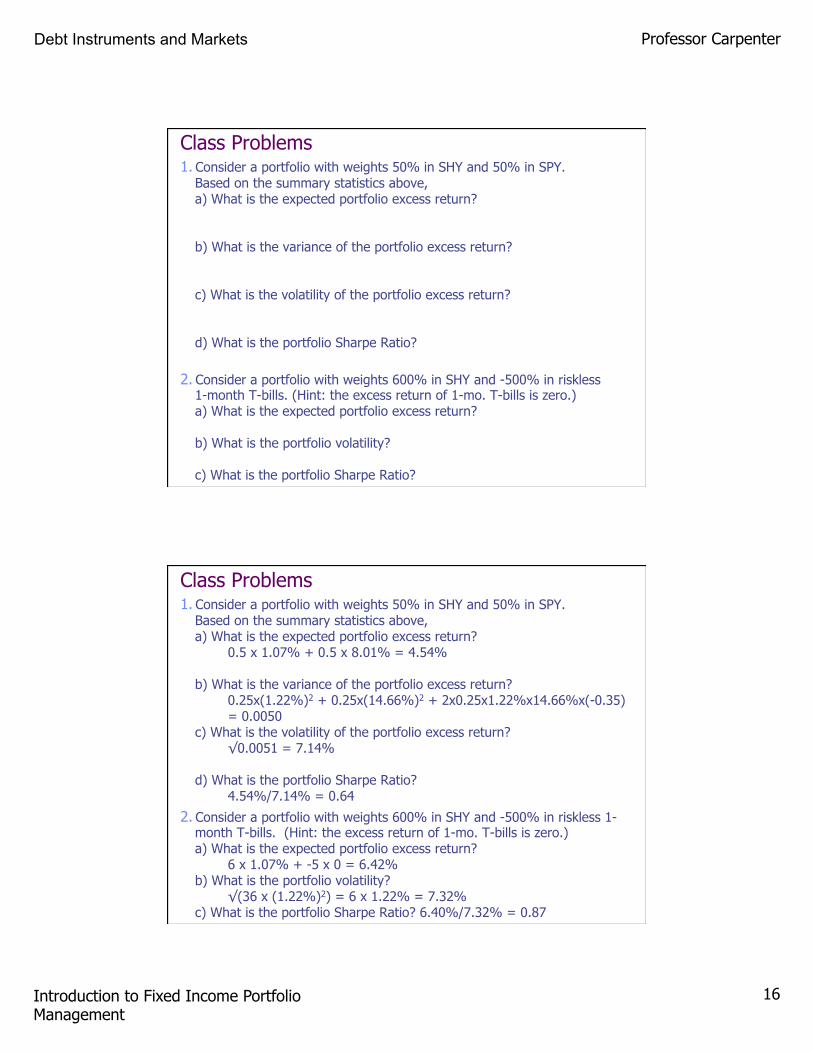
Class Problems 1. Consider a portfolio with weights 50% in SHY and 50% in SPY.
Based on the summary statistics above, a) What is the expected portfolio excess return? b) What is the variance of the portfolio excess return? c) What is the volatility of the portfolio excess return? d) What is the portfolio Sharpe Ratio?
2. Consider a portfolio with weights 600% in SHY and -500% in riskless 1-month T-bills. (Hint: the excess return of 1-mo. T-bills is zero.) a) What is the expected portfolio excess return? b) What is the portfolio volatility? c) What is the portfolio Sharpe Ratio?
Class Problems 1. Consider a portfolio with weights 50% in SHY and 50% in SPY.
Based on the summary statistics above, a) What is the expected portfolio excess return?
0.5 x 1.07% + 0.5 x 8.01% = 4.54% b) What is the variance of the portfolio excess return?
c) What is the volatility of the portfolio excess return? √0.0051 = 7.14%
d) What is the portfolio Sharpe Ratio? 4.54%/7.14% = 0.64
2. Consider a portfolio with weights 600% in SHY and -500% in riskless 1-month T-bills. (Hint: the excess return of 1-mo. T-bills is zero.) a) What is the expected portfolio excess return?
6 x 1.07% + -5 x 0 = 6.42% b) What is the portfolio volatility?
√(36 x (1.22%)2) = 6 x 1.22% = 7.32% c) What is the portfolio Sharpe Ratio? 6.40%/7.32% = 0.87