Earnings start shifting gears Q1FY19 results are expected to build up strongly on the earnings growth momentum seen in last few quarters. Auto, metals, media and NBFC space have gained further ground whereas banks & cement are expected to be a drag. With strong buoyancy in industry-wide auto volumes, we expect our auto universe to report strongest earnings growth. We expect yet another quarter of strong & broad-based earnings performance from our metals & mining universe. Within the media space, broadcasters are set to report strong double digit ad growth; print companies, however will continue to disappoint. Our banking universe is set to report a mixed quarter with NBFC and micro-lenders on strong wicket; banks continue to suffer with elevated credit cost issues. Pharma sector is expected to report strong quarter following the recovery in domestic market and positive US FDA developments. Cement sector is expected to report worst earnings led by low pricing & cost inflation. Sector View: We expect another strong earnings performance from metals space with superlative YoY growth led by solid realisations supported by steady volumes partially negated by higher RM costs. Auto sector is likely to be one of the strongest performers on account of strong volume growth across different segments. In Media, print companies are likely to get impacted by higher newsprint prices while broadcasters would see double digit subscription revenues growth on the back of digitization. For cement sector, while demand remained buoyant, price recovery has been weak across most markets and input cost inflation has firmed up and we see aggregate margin compression. We expect the pharma sector earnings to be strong led by recovery in the domestic market after successful GST implementation, positive development on regulatory front from US FDA, softening of pricing pressure in the US generic market & weak rupee. On back of improved systemic credit growth and firm margins, we expect our banking universe reporting strong headline growth (+11.7% YoY). Pace of new NPA addition is expected to decline; weak treasury gains, investment provisions, feeble fee income growth and elevated credit costs on back of NPA ageing, however will see bottom line remain weak. NBFC remain in sweet spot; we remain constructive on rating agencies and micro-lenders. Earnings – Positive & Negative surprises: We expect strong YoY earnings growth from almost all companies in metals with JSW Steel/Coal India leading the way in large-caps and Graphite India/Tata Metaliks/Kirloskar Ferrous/Ratnamani in midcaps. On the auto-side, led by good volume growth across different segments, we see positive earnings surprise from Bajaj, TVS and FIEM. We expect Karnataka Bank and micro-lenders – both Ujjivan and Satin Creditcare to report strong AuM growth and improved profitability. While we expect improved growth for MMFS, seasonality nature of business and migration to 90-dpd will see NPA’s remain higher. We expect positive surprises from Sun TV, Dish TV, Info Edge and negative earnings surprise from Jagran Prakashan, HT Media and DB Corp. In cement we expect earnings to remain lacklustre and estimate sharp 20%+ EBITDA decline in case of Orient Cement, JK Cement, JK Lakshmi, ACC, Ambuja Cement and Deccan Cement. We expect positive surprise for Dr. Reddy’s Labs and Glaxo SmithKline Pharma and negative surprise from Cipla and Marksans Pharma. Valuations: The quarter saw huge divergence in market performance, where the BSE Sensex was up 7.45% but the broader markets further continue its correction, with the BSE midcap index down 3.21% and small cap index down 5.66%.led by a various domestic and global factors. Valuations in certain pockets have now turned attractive from a longer-term perspective. We prefer Hindalco/Coal India in large cap metals and Kirloskar Ferrous/Tata Metaliks/Orient Refractories in the mid-cap metal space. From the cement universe, we like UltraTech and Star Cement. We prefer Hero, Bajaj and Mayur Uniquoters in the auto space. ZEEL and Sun TV are our preferred stocks in the media space. We remain positive on Aurobindo Pharma (APL), Abbott India (AIL) and Pfizer. From the banking space, we like DCB Bank, Karnataka bank and SBI. Our Top Sells remain as M&M Financials, JK Lakshmi and Shree Cement. Positive earnings surprise Y/E Mar (Rs mn) EBITDA Q1FY19E YoY (%) QoQ (%) Sun TV 6,830 52.2 30.7 Dish TV 5,129 154.9 28.0 Info Edge 817 16.2 37.8 Karnataka Bank 3,595 16.1 (24.5) Ujjivan Financial 1,279 187.1 (3.5) Satin Creditcare 845 196.0 3.1 Dr. Reddy’s Labs 5,690 76.1 1.0 Glaxo SmithKline Pharma 1,300 559.9 (16.1) UltraTech 15,900 1.9 (6.6) Star Cement 1,566 (1.3) 8.4 Bajaj Auto 15,007 59.9 14.1 TVS Motor 3,091 46.2 10.1 Fiem Industries 414 34.3 13.4 JSW Steel 47,110 80.0 (10.9) Coal India 64,665 83.6 (14.7) Graphite India 10,858 2,957.6 62.4 Tata Metaliks 717 44.8 (18.5) Kirloskar Ferrous 543 236.8 59.9 Ratnamani Metals 947 101.1 2.1 Source: Companies, Centrum Research Estimate, #PPOP Negative earnings surprise Y/E Mar (Rs mn) EBITDA Q1FY19E YoY (%) QoQ (%) MMFS 6,060 23.8 (26.6) Jagran Prakashan 1,560 (3.3) 29.6 HT Media 727 (9.0) (9.7) DB Corp 1,617 (13.3) 65.2 Cipla 7,160 10.8 28.6 Marksans Pharma 270 (6.9) 542.9 Orient Cement 729 (37.7) (2.3) JK Cement 1,491 (24.6) (18.0) JK Lakshmi 953 (20.8) (5.9) ACC 4,954 (22.2) 0.7 Ambuja Cement 5,110 (21.5) 0.8 Deccan Cement 191 (22.0) (10.5) Source: Companies, Centrum Research Estimates Top Buys Co. Name Rating CMP* (Rs) TP (Rs) Sun TV BUY 771 1,170 Zee Entertainment BUY 550 660 Karnataka Bank BUY 110 180 DCB Bank BUY 169 215 SBI BUY 257 330 Aurobindo Pharma BUY 618 1,070 Abbott India BUY 7,172 7,530 Pfizer BUY 2,539 2,900 UltraTech BUY 3,954 4,980 Star Cement BUY 121 167 Hero MotoCorp BUY 3,637 4,245 Bajaj Auto BUY 3,020 3,413 Mayur Uniquoters BUY 406 649 Hindalco BUY 220 350 Coal India BUY 271 375 Kirloskar Ferrous BUY 90 155 Tata Metaliks BUY 694 1,060 Orient Refractories BUY 177 230 Oriental Carbon BUY 980 1,480 IFGL Refractories BUY 177 230 Source: Centrum Research, *as on 6July 2018 Top Sells Co. Name Rating CMP* (Rs) TP (Rs) MMFS SELL 455 380 JK Lakshmi SELL 333 330 Shree Cement SELL 16,201 15,100 Source: Centrum Research, *as on 6 July 2018 Centrum Equity Research Team +91 22 4215 9000 11 July 2018 INDIA Q1FY19 Results Preview In the interest of timeliness, this document is not edited. Centrum Equity Research is available on Bloomberg, Thomson Reuters and FactSet
Transcript
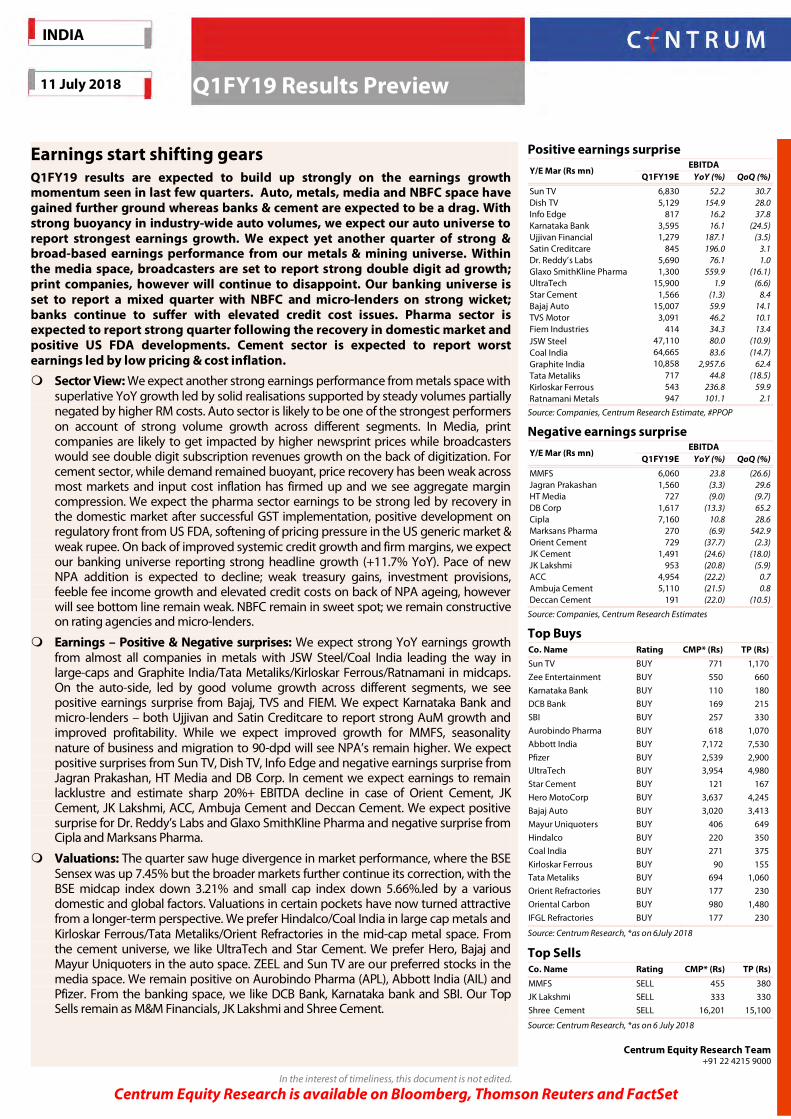
Earnings start shifting gears Q1FY19 results are expected to build up strongly on the earnings growth momentum seen in last few quarters. Auto, metals, media and NBFC space have gained further ground whereas banks & cement are expected to be a drag. With strong buoyancy in industry-wide auto volumes, we expect our auto universe to report strongest earnings growth. We expect yet another quarter of strong & broad-based earnings performance from our metals & mining universe. Within the media space, broadcasters are set to report strong double digit ad growth; print companies, however will continue to disappoint. Our banking universe is set to report a mixed quarter with NBFC and micro-lenders on strong wicket; banks continue to suffer with elevated credit cost issues. Pharma sector is expected to report strong quarter following the recovery in domestic market and positive US FDA developments. Cement sector is expected to report worst earnings led by low pricing & cost inflation.
Sector View: We expect another strong earnings performance from metals space with superlative YoY growth led by solid realisations supported by steady volumes partially negated by higher RM costs. Auto sector is likely to be one of the strongest performers on account of strong volume growth across different segments. In Media, print companies are likely to get impacted by higher newsprint prices while broadcasters would see double digit subscription revenues growth on the back of digitization. For cement sector, while demand remained buoyant, price recovery has been weak across most markets and input cost inflation has firmed up and we see aggregate margin compression. We expect the pharma sector earnings to be strong led by recovery in the domestic market after successful GST implementation, positive development on regulatory front from US FDA, softening of pricing pressure in the US generic market & weak rupee. On back of improved systemic credit growth and firm margins, we expect our banking universe reporting strong headline growth (+11.7% YoY). Pace of new NPA addition is expected to decline; weak treasury gains, investment provisions, feeble fee income growth and elevated credit costs on back of NPA ageing, however will see bottom line remain weak. NBFC remain in sweet spot; we remain constructive on rating agencies and micro-lenders.
Earnings – Positive & Negative surprises: We expect strong YoY earnings growth from almost all companies in metals with JSW Steel/Coal India leading the way in large-caps and Graphite India/Tata Metaliks/Kirloskar Ferrous/Ratnamani in midcaps. On the auto-side, led by good volume growth across different segments, we see positive earnings surprise from Bajaj, TVS and FIEM. We expect Karnataka Bank and micro-lenders – both Ujjivan and Satin Creditcare to report strong AuM growth and improved profitability. While we expect improved growth for MMFS, seasonality nature of business and migration to 90-dpd will see NPA’s remain higher. We expect positive surprises from Sun TV, Dish TV, Info Edge and negative earnings surprise from Jagran Prakashan, HT Media and DB Corp. In cement we expect earnings to remain lacklustre and estimate sharp 20%+ EBITDA decline in case of Orient Cement, JK Cement, JK Lakshmi, ACC, Ambuja Cement and Deccan Cement. We expect positive surprise for Dr. Reddy’s Labs and Glaxo SmithKline Pharma and negative surprise from Cipla and Marksans Pharma.
Valuations: The quarter saw huge divergence in market performance, where the BSE Sensex was up 7.45% but the broader markets further continue its correction, with the BSE midcap index down 3.21% and small cap index down 5.66%.led by a various domestic and global factors. Valuations in certain pockets have now turned attractive from a longer-term perspective. We prefer Hindalco/Coal India in large cap metals and Kirloskar Ferrous/Tata Metaliks/Orient Refractories in the mid-cap metal space. From the cement universe, we like UltraTech and Star Cement. We prefer Hero, Bajaj and Mayur Uniquoters in the auto space. ZEEL and Sun TV are our preferred stocks in the media space. We remain positive on Aurobindo Pharma (APL), Abbott India (AIL) and Pfizer. From the banking space, we like DCB Bank, Karnataka bank and SBI. Our Top Sells remain as M&M Financials, JK Lakshmi and Shree Cement.
Positive earnings surprise
Y/E Mar (Rs mn) EBITDA
Q1FY19E YoY (%) QoQ (%)
Sun TV 6,830 52.2 30.7 Dish TV 5,129 154.9 28.0 Info Edge 817 16.2 37.8 Karnataka Bank 3,595 16.1 (24.5) Ujjivan Financial 1,279 187.1 (3.5) Satin Creditcare 845 196.0 3.1 Dr. Reddy’s Labs 5,690 76.1 1.0 Glaxo SmithKline Pharma 1,300 559.9 (16.1) UltraTech 15,900 1.9 (6.6) Star Cement 1,566 (1.3) 8.4 Bajaj Auto 15,007 59.9 14.1 TVS Motor 3,091 46.2 10.1 Fiem Industries 414 34.3 13.4 JSW Steel 47,110 80.0 (10.9) Coal India 64,665 83.6 (14.7) Graphite India 10,858 2,957.6 62.4 Tata Metaliks 717 44.8 (18.5) Kirloskar Ferrous 543 236.8 59.9 Ratnamani Metals 947 101.1 2.1
Source: Companies, Centrum Research Estimate, #PPOP
Media ................................................................................................................................................................................. 26
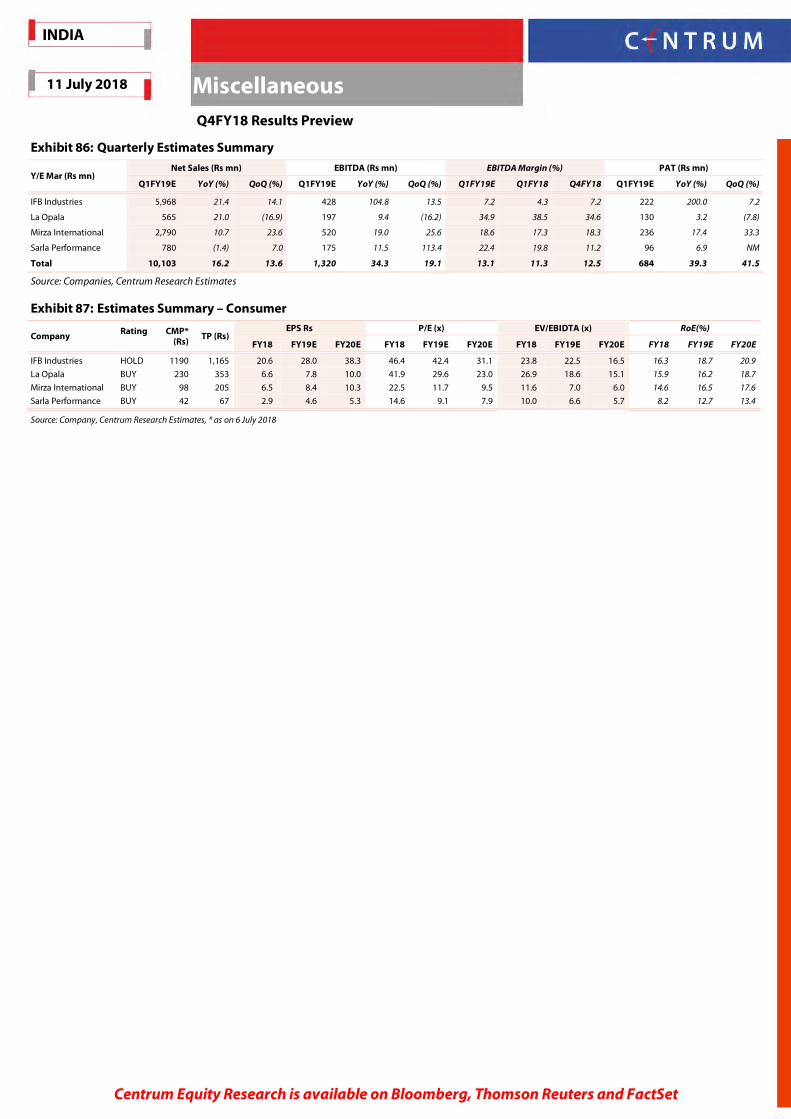
On continued good growth path We expect auto sector to report another strong earnings performance for Q1FY19 as all the segments of the sector have posted strong volume growth during the quarter. Low base effect did play a role especially for CVs and 3Ws segments. BS-IV transition and implementation of GST were main reasons for low base of 1QFY18. Most of the PV players, led by Maruti Suzuki continued its growth momentum and the segment posted a growth of ~20% during 1QFY19. Apart from low base, pick-up in the infrastructure activities and mining led demand supported strong 83.6% growth in M&HCV segment whereas LCVs posted a good growth of 36.5% on cyclical recovery. Led by low base and permit openings, 3Ws continue to witness strong growth and posted 54% growth. In the 2W segment, revival in rural economy, marriage season, high discounts in some models and slightly lower base, led the sales growth of ~16% during Q1FY19. Tractor industry also continued its growth momentum, supported by two years of good monsoon and recovery in rural economy and posted good growth of ~20%. We maintain our preference for Hero MotoCorp, Bajaj Auto and Mayur Uniquoters, considering strong fundamentals and business visibility. On LED transition in 2Ws, Fiem Industries is a good play.
2W companies to display good show despite several margin pressures: 2W companies posted strong volume growth, better than what street was expecting at the start of the year. However, companies are facing margin pressure due to higher RM costs, higher sales related expenses (in a bid to grab market share) and higher R&D expenses due to regulatory changes. Hence, margin performance of 2W companies is expected to be flattish sequentially, especially for Hero MotoCorp and Bajaj Auto. We expect Hero MotoCorp, Bajaj Auto and TVS Motor to post EBITDA/PAT growth of 10.4%/10.4%, 59.9%/32.1% and 46.2%/24.3% respectively.
Ancillary/midcaps companies to continue growth momentum: On the back of LED headlamp adoption in Activa 5G and good volume growth performance from its key clients, Fiem Industries is expected to maintain its strong quarter performance. Led by recovery in footwear segment and expected good performance in auto OEM and auto replacement market, Mayur Uniquoters is expected to post decent set of performance. Tractor industry has maintained its growth momentum on the back of last two years of normal monsoon, good crop production and good start of the monsoon in the current year. We expect Swaraj Engines’ performance to mirror the M&M’s tractor sales growth and come out with a good performance.
Recommendation and Key Risks: In large caps 2Ws space, we remain positive on Hero MotoCorp considering rural growth prospects whereas we like Bajaj Auto due to good recovery at exports front and continued momentum at 3Ws front, however we have a neutral view on TVS considering its current valuations and low visibility on management’s earlier double digit margin promise. Among midcaps, we continue to like Mayur Uniquoters on its strong fundamentals whereas Fiem Industries is a good play on 2Ws industry growth along with LED adoption in the sector.
We expect Hero MotoCorp’s revenue to increase by 14.0% YoY to Rs90,876mn. This is on the back of good total volume growth of 13.6% posted by Hero during Q1FY19, which was 2,104,949 units.
We expect the company to report EBITDA margins of 15.7% (down 52bps YoY/ down 27bps QoQ). The contraction is on account of expiry of Haridwar plant benefits and RM cost pressure.
On account of good sales growth and some margin contraction, PAT is expected to grow by 10.4% YoY to Rs10,090mn in Q1FY19E.
We expect Bajaj Auto’s revenue to increase by 42% YoY to Rs77,282mn. This is on the back of a strong total volume growth of 38.1% posted by Bajaj during Q1FY19, which was 1,226,949 units. Domestic motorcycle sales grew by 39.3% YoY and exports of motorcycles grew by 24.8% YoY. Three wheeler domestic sales grew by 80.4% YoY and exports of three wheelers grew by 70.2% YoY.
Overall domestic motorcycle sales were higher, as June 2017 witnessed slowdown in buying due to overhang of GST implementation in July 2017, resulting in customers deferring their buying decisions. Domestic three wheeler sales were supported by opening of permits in a few states. Exports of motorcycles and three wheelers were higher as the target oil producing countries benefitted from higher oil prices.
We expect the company to report EBITDA margins of 19.4% (up 218bps YoY/ flat QoQ). The expansion in margin is due to higher three wheeler sales and higher exports, which are high margin sales.
On account of strong sales growth and good margin expansion, PAT is expected to grow by 32.1% YoY to Rs12,206mn in Q1FY19E.
We expect TVS Motor’s revenue to increase by 23% YoY to Rs41,814mn. This is on the back of a good total volume growth of 17.1% posted by TVS during Q1FY19, which was 939,220 units. Domestic motorcycle sales grew by 8.8% YoY and exports of motorcycles grew by 43.7% YoY. Three wheeler domestic sales grew by 134.8% YoY and exports of three wheelers grew by 196.0% YoY.
The increase in volume along with a change in product mix, as higher number three wheelers were sold in the quarter and some price increase taken by TVS during the quarter will drive the high revenue growth.
We expect the company to report EBITDA margins of 7.4% (up 177bps YoY/ up 36bps QoQ). The expansion in margin is due to higher three wheeler sales and higher exports, which are high margin sales.
On account of strong sales growth and decent margin expansion, PAT is expected to grow by 24.3% YoY to Rs1,609mn in Q1FY19E.
We expect Mayur’s revenues to increase 12.2% YoY/ 16.6% QoQ to Rs1,581mn, on the back of continued recovery in footwear business. The impetus is also expected from domestic Auto OEMs as well as Auto Replacement businesses which have been gaining good traction over the last few quarters.
We expect the company to report EBITDA margins of 26.1% (down 272bps YoY/ up 88bps QoQ) as RM cost pressure mounts with crude prices inching up. The management has always highlighted that they will not be able to maintain peak margins (29%-30%) witnessed during few quarters of FY17 and FY18. We believe margins should stabilize at ~26%.
On account of good sales growth and some margin contraction, PAT is expected to grow by 2.6% YoY to Rs263mn in Q1FY19E.
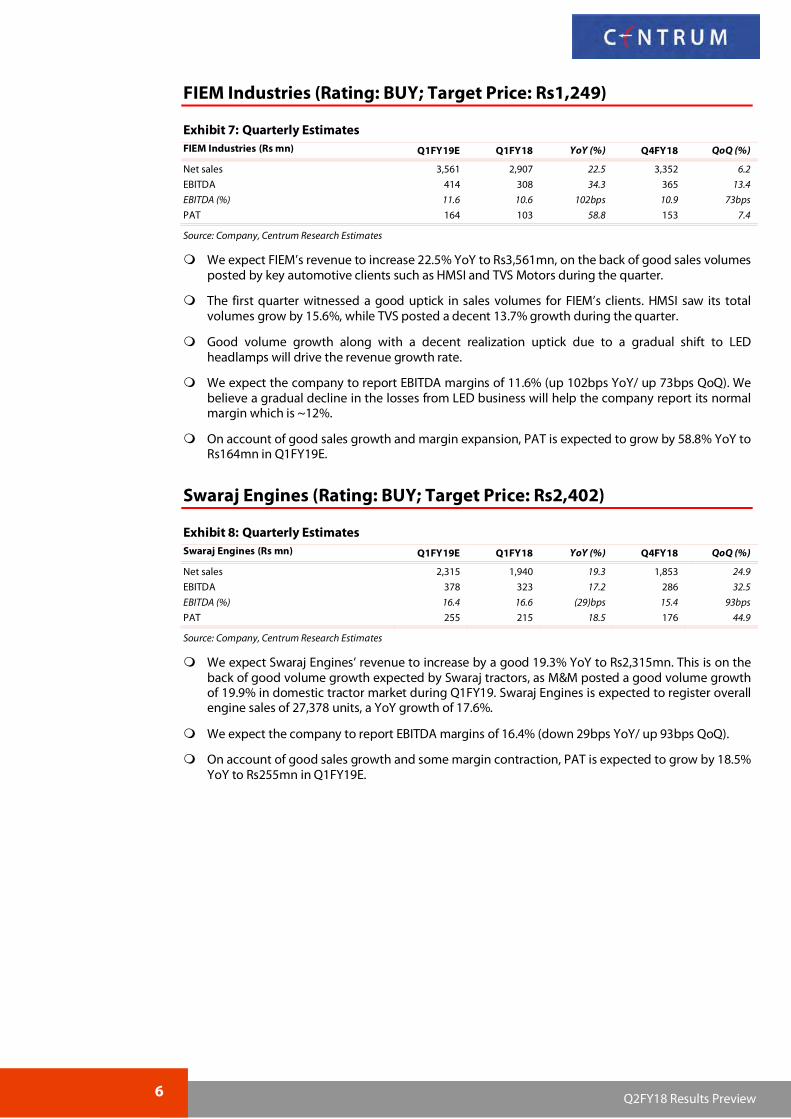
We expect FIEM’s revenue to increase 22.5% YoY to Rs3,561mn, on the back of good sales volumes posted by key automotive clients such as HMSI and TVS Motors during the quarter.
The first quarter witnessed a good uptick in sales volumes for FIEM’s clients. HMSI saw its total volumes grow by 15.6%, while TVS posted a decent 13.7% growth during the quarter.
Good volume growth along with a decent realization uptick due to a gradual shift to LED headlamps will drive the revenue growth rate.
We expect the company to report EBITDA margins of 11.6% (up 102bps YoY/ up 73bps QoQ). We believe a gradual decline in the losses from LED business will help the company report its normal margin which is ~12%.
On account of good sales growth and margin expansion, PAT is expected to grow by 58.8% YoY to Rs164mn in Q1FY19E.
We expect Swaraj Engines’ revenue to increase by a good 19.3% YoY to Rs2,315mn. This is on the back of good volume growth expected by Swaraj tractors, as M&M posted a good volume growth of 19.9% in domestic tractor market during Q1FY19. Swaraj Engines is expected to register overall engine sales of 27,378 units, a YoY growth of 17.6%.
We expect the company to report EBITDA margins of 16.4% (down 29bps YoY/ up 93bps QoQ).
On account of good sales growth and some margin contraction, PAT is expected to grow by 18.5% YoY to Rs255mn in Q1FY19E.
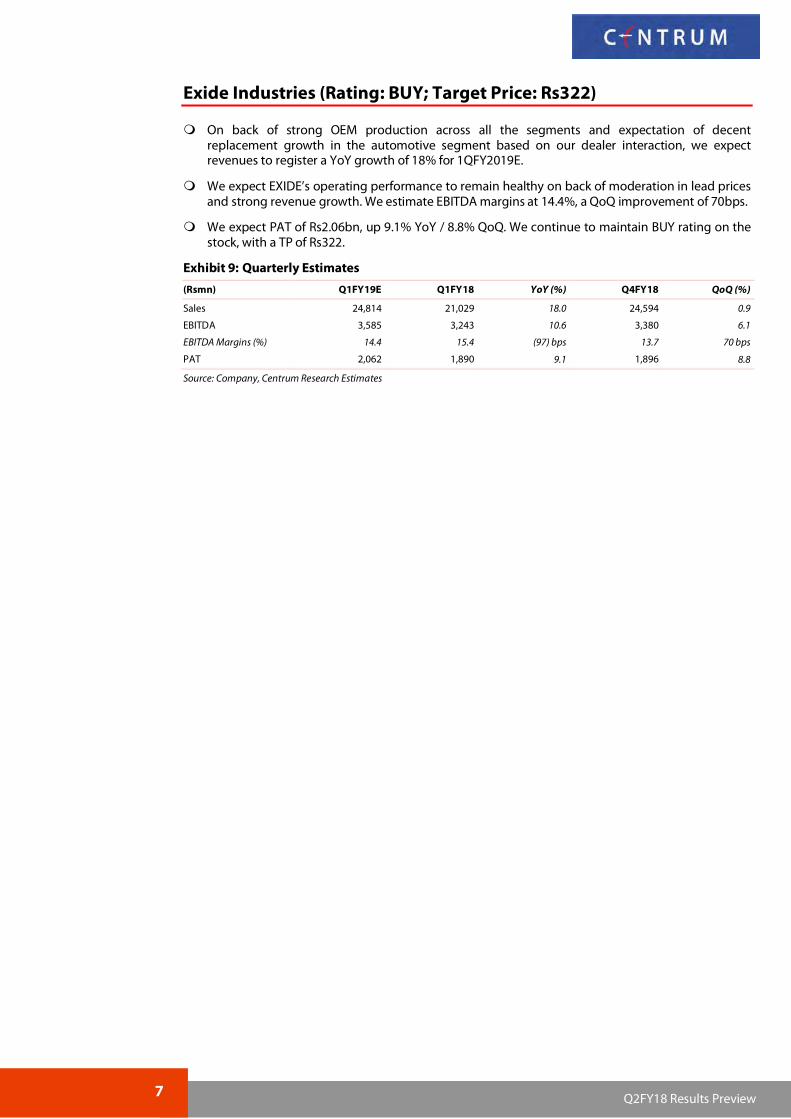
On back of strong OEM production across all the segments and expectation of decent replacement growth in the automotive segment based on our dealer interaction, we expect revenues to register a YoY growth of 18% for 1QFY2019E.
We expect EXIDE’s operating performance to remain healthy on back of moderation in lead prices and strong revenue growth. We estimate EBITDA margins at 14.4%, a QoQ improvement of 70bps.
We expect PAT of Rs2.06bn, up 9.1% YoY / 8.8% QoQ. We continue to maintain BUY rating on the stock, with a TP of Rs322.
Exhibit 9: Quarterly Estimates
(Rsmn) Q1FY19E Q1FY18 YoY (%) Q4FY18 QoQ (%)
Sales 24,814 21,029 18.0 24,594 0.9
EBITDA 3,585 3,243 10.6 3,380 6.1
EBITDA Margins (%) 14.4 15.4 (97) bps 13.7 70 bps
PAT 2,062 1,890 9.1 1,896 8.8
Source: Company, Centrum Research Estimates
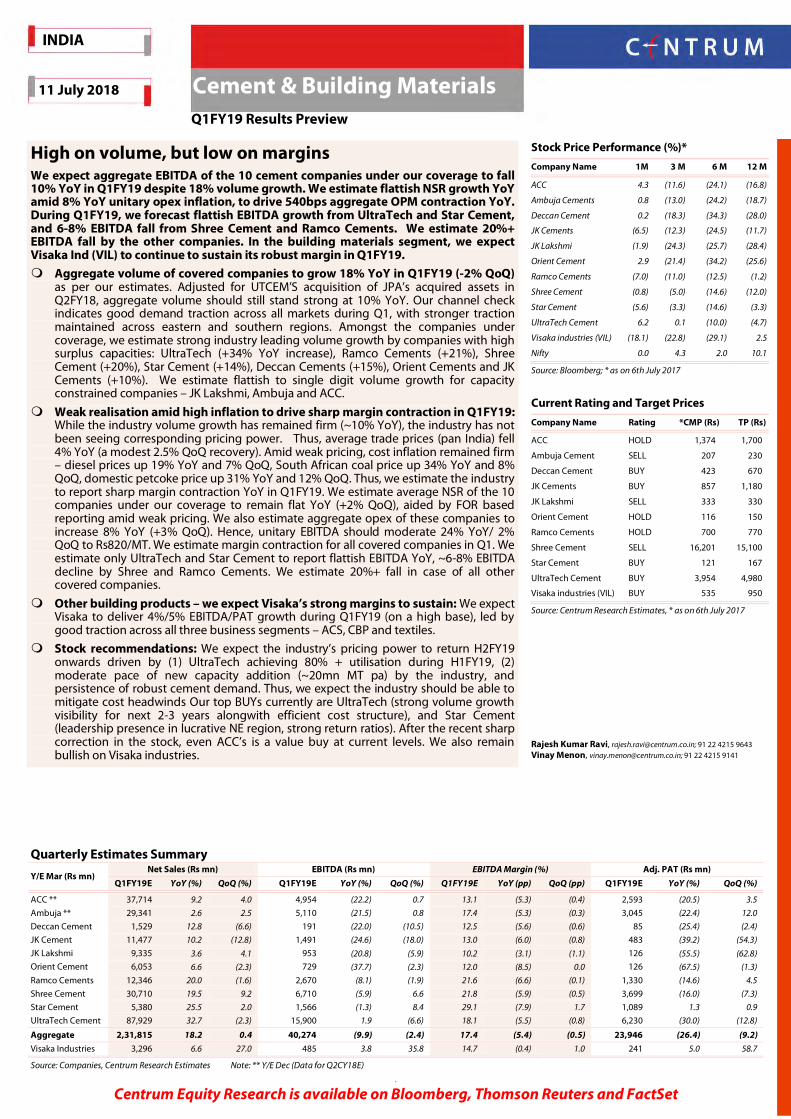
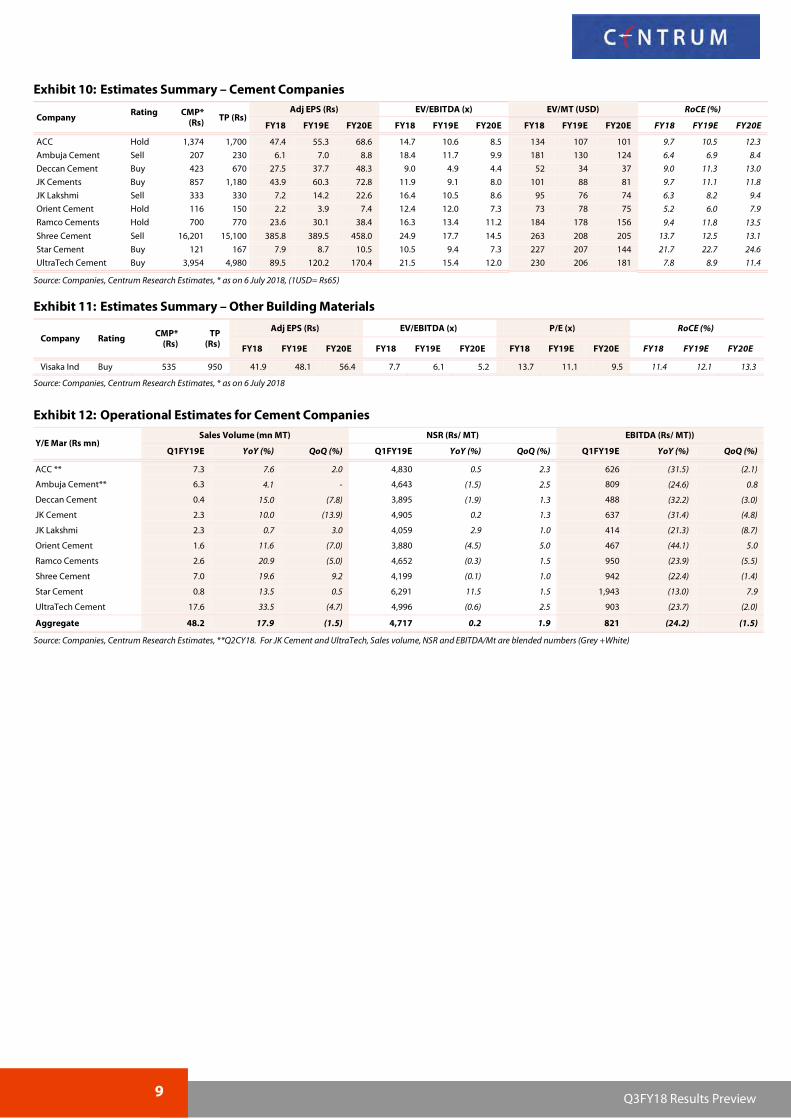
High on volume, but low on margins We expect aggregate EBITDA of the 10 cement companies under our coverage to fall 10% YoY in Q1FY19 despite 18% volume growth. We estimate flattish NSR growth YoY amid 8% YoY unitary opex inflation, to drive 540bps aggregate OPM contraction YoY. During Q1FY19, we forecast flattish EBITDA growth from UltraTech and Star Cement, and 6-8% EBITDA fall from Shree Cement and Ramco Cements. We estimate 20%+ EBITDA fall by the other companies. In the building materials segment, we expect Visaka Ind (VIL) to continue to sustain its robust margin in Q1FY19.
Aggregate volume of covered companies to grow 18% YoY in Q1FY19 (-2% QoQ) as per our estimates. Adjusted for UTCEM’S acquisition of JPA’s acquired assets in Q2FY18, aggregate volume should still stand strong at 10% YoY. Our channel check indicates good demand traction across all markets during Q1, with stronger traction maintained across eastern and southern regions. Amongst the companies under coverage, we estimate strong industry leading volume growth by companies with high surplus capacities: UltraTech (+34% YoY increase), Ramco Cements (+21%), Shree Cement (+20%), Star Cement (+14%), Deccan Cements (+15%), Orient Cements and JK Cements (+10%). We estimate flattish to single digit volume growth for capacity constrained companies – JK Lakshmi, Ambuja and ACC.
Weak realisation amid high inflation to drive sharp margin contraction in Q1FY19: While the industry volume growth has remained firm (~10% YoY), the industry has not been seeing corresponding pricing power. Thus, average trade prices (pan India) fell 4% YoY (a modest 2.5% QoQ recovery). Amid weak pricing, cost inflation remained firm – diesel prices up 19% YoY and 7% QoQ, South African coal price up 34% YoY and 8% QoQ, domestic petcoke price up 31% YoY and 12% QoQ. Thus, we estimate the industry to report sharp margin contraction YoY in Q1FY19. We estimate average NSR of the 10 companies under our coverage to remain flat YoY (+2% QoQ), aided by FOR based reporting amid weak pricing. We also estimate aggregate opex of these companies to increase 8% YoY (+3% QoQ). Hence, unitary EBITDA should moderate 24% YoY/ 2% QoQ to Rs820/MT. We estimate margin contraction for all covered companies in Q1. We estimate only UltraTech and Star Cement to report flattish EBITDA YoY, ~6-8% EBITDA decline by Shree and Ramco Cements. We estimate 20%+ fall in case of all other covered companies.
Other building products – we expect Visaka’s strong margins to sustain: We expect Visaka to deliver 4%/5% EBITDA/PAT growth during Q1FY19 (on a high base), led by good traction across all three business segments – ACS, CBP and textiles.
Stock recommendations: We expect the industry’s pricing power to return H2FY19 onwards driven by (1) UltraTech achieving 80% + utilisation during H1FY19, (2) moderate pace of new capacity addition (~20mn MT pa) by the industry, and persistence of robust cement demand. Thus, we expect the industry should be able to mitigate cost headwinds Our top BUYs currently are UltraTech (strong volume growth visibility for next 2-3 years alongwith efficient cost structure), and Star Cement (leadership presence in lucrative NE region, strong return ratios). After the recent sharp correction in the stock, even ACC’s is a value buy at current levels. We also remain bullish on Visaka industries.
Stock Price Performance (%)*
Company Name 1M 3 M 6 M 12 M
ACC 4.3 (11.6) (24.1) (16.8)
Ambuja Cements 0.8 (13.0) (24.2) (18.7)
Deccan Cement 0.2 (18.3) (34.3) (28.0)
JK Cements (6.5) (12.3) (24.5) (11.7)
JK Lakshmi (1.9) (24.3) (25.7) (28.4)
Orient Cement 2.9 (21.4) (34.2) (25.6)
Ramco Cements (7.0) (11.0) (12.5) (1.2)
Shree Cement (0.8) (5.0) (14.6) (12.0)
Star Cement (5.6) (3.3) (14.6) (3.3)
UltraTech Cement 6.2 0.1 (10.0) (4.7)
Visaka industries (VIL) (18.1) (22.8) (29.1) 2.5
Nifty 0.0 4.3 2.0 10.1
Source: Bloomberg; * as on 6th July 2017
Current Rating and Target Prices
Company Name Rating *CMP (Rs) TP (Rs)
ACC HOLD 1,374 1,700
Ambuja Cement SELL 207 230
Deccan Cement BUY 423 670
JK Cements BUY 857 1,180
JK Lakshmi SELL 333 330
Orient Cement HOLD 116 150
Ramco Cements HOLD 700 770
Shree Cement SELL 16,201 15,100
Star Cement BUY 121 167
UltraTech Cement BUY 3,954 4,980
Visaka industries (VIL) BUY 535 950
Source: Centrum Research Estimates, * as on 6th July 2017
Source: Companies, Centrum Research Estimates, **Q2CY18. For JK Cement and UltraTech, Sales volume, NSR and EBITDA/Mt are blended numbers (Grey +White)
10 Q3FY18 Results Preview
Major input costs trends during Q1FY19
Exhibit 13: Crude price (Brent) up 16% QoQ, +53% YoY Exhibit 14: Diesel prices up 7% QoQ and up 19% YoY
Source: Bloomberg, Centrum Research Source: Bloomberg, Centrum Research
Exhibit 15: Domestic petcoke price rose 12% QoQ/31% YoY Exhibit 16: S-African coal is up 8% QoQ and 34% YoY
Source: Bloomberg, Centrum Research Source: Steelmint, Centrum Research
Exhibit 17: Indonesian coal is up 3% QoQ and 20% YoY
Source: Bloomberg, Centrum Research
20
30
40
50
60
70
80
90
2000
3000
4000
5000
6000
Dec
-15
Mar
-16
Jun-
16
Sep
-16
Dec
-16
Mar
-17
Jun-
17
Sep
-17
Dec
-17
Mar
-18
Jun-
18
Rs/B
bl
Brent Rs/Bbl Brent USD/Bbl (RHS)
40
45
50
55
60
65
70
75
Jul-1
5
Oct
-15
Jan
-16
Ap
r-16
Jul-1
6
Oct
-16
Jan
-17
Ap
r-17
Jul-1
7
Oct
-17
Jan
-18
Ap
r-18
Jul-1
8
Rs/L
itre
Average diesel price
3,000
4,000
5,000
6,000
7,000
8,000
9,000
10,000
Jul-1
5
Oct
-15
Jan
-16
Ap
r-16
Jul-1
6
Oct
-16
Jan
-17
Ap
r-17
Jul-1
7
Oct
-17
Jan
-18
Ap
r-18
Jul-1
8
Rs/M
T
Domestic Petcoke
2,000
3,000
4,000
5,000
6,000
7,000
8,000
Jul-1
5
Oct
-15
Jan
-16
Ap
r-16
Jul-1
6
Oct
-16
Jan
-17
Ap
r-17
Jul-1
7
Oct
-17
Jan
-18
Ap
r-18
Jul-1
8
Rs/M
T
South African Coal
3,000
4,000
5,000
6,000
7,000
8,000
Dec
-14
Mar
-15
Jun-
15
Sep
-15
Dec
-15
Mar
-16
Jun-
16
Sep
-16
Dec
-16
Mar
-17
Jun-
17
Sep
-17
Dec
-17
Mar
-18
Jun-
18
Rs/M
T
Indonesian Coal
11 Q3FY18 Results Preview
Building Materials - Cement
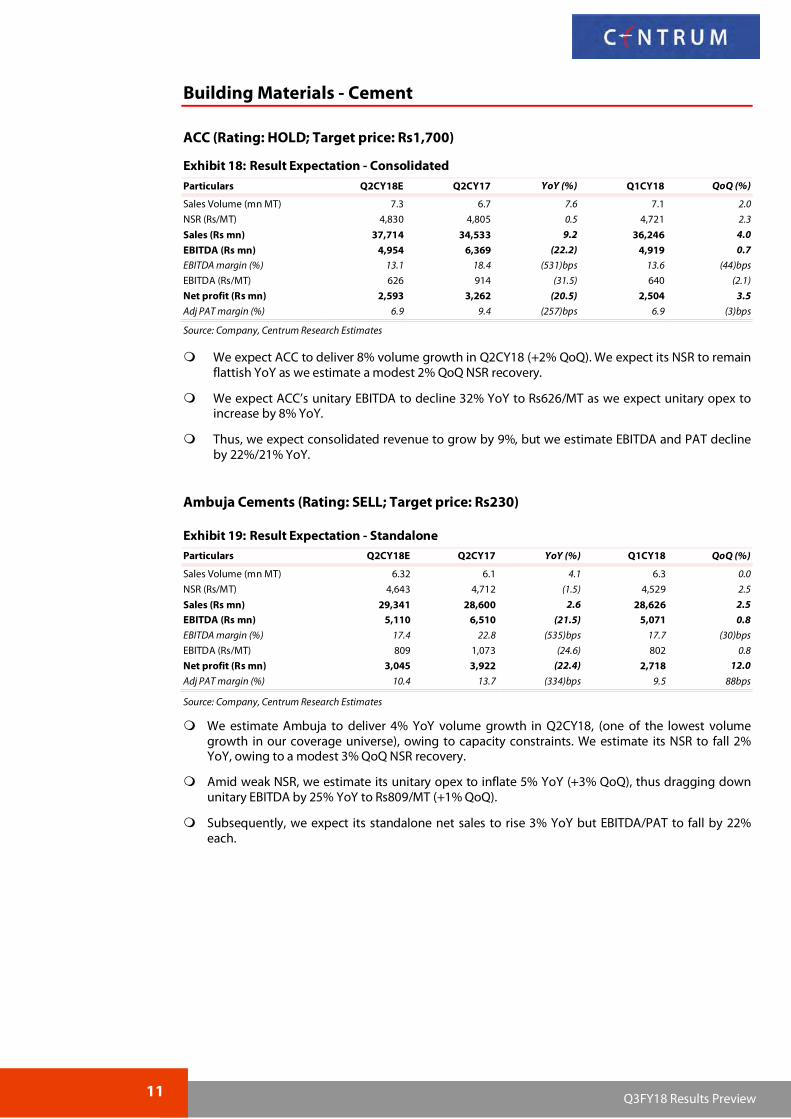
ACC (Rating: HOLD; Target price: Rs1,700)
Exhibit 18: Result Expectation - Consolidated
Particulars Q2CY18E Q2CY17 YoY (%) Q1CY18 QoQ (%)
Sales Volume (mn MT) 7.3 6.7 7.6 7.1 2.0
NSR (Rs/MT) 4,830 4,805 0.5 4,721 2.3
Sales (Rs mn) 37,714 34,533 9.2 36,246 4.0
EBITDA (Rs mn) 4,954 6,369 (22.2) 4,919 0.7
EBITDA margin (%) 13.1 18.4 (531)bps 13.6 (44)bps
EBITDA (Rs/MT) 626 914 (31.5) 640 (2.1)
Net profit (Rs mn) 2,593 3,262 (20.5) 2,504 3.5
Adj PAT margin (%) 6.9 9.4 (257)bps 6.9 (3)bps
Source: Company, Centrum Research Estimates
We expect ACC to deliver 8% volume growth in Q2CY18 (+2% QoQ). We expect its NSR to remain flattish YoY as we estimate a modest 2% QoQ NSR recovery.
We expect ACC’s unitary EBITDA to decline 32% YoY to Rs626/MT as we expect unitary opex to increase by 8% YoY.
Thus, we expect consolidated revenue to grow by 9%, but we estimate EBITDA and PAT decline by 22%/21% YoY.
We estimate Ambuja to deliver 4% YoY volume growth in Q2CY18, (one of the lowest volume growth in our coverage universe), owing to capacity constraints. We estimate its NSR to fall 2% YoY, owing to a modest 3% QoQ NSR recovery.
Amid weak NSR, we estimate its unitary opex to inflate 5% YoY (+3% QoQ), thus dragging down unitary EBITDA by 25% YoY to Rs809/MT (+1% QoQ).
Subsequently, we expect its standalone net sales to rise 3% YoY but EBITDA/PAT to fall by 22% each.
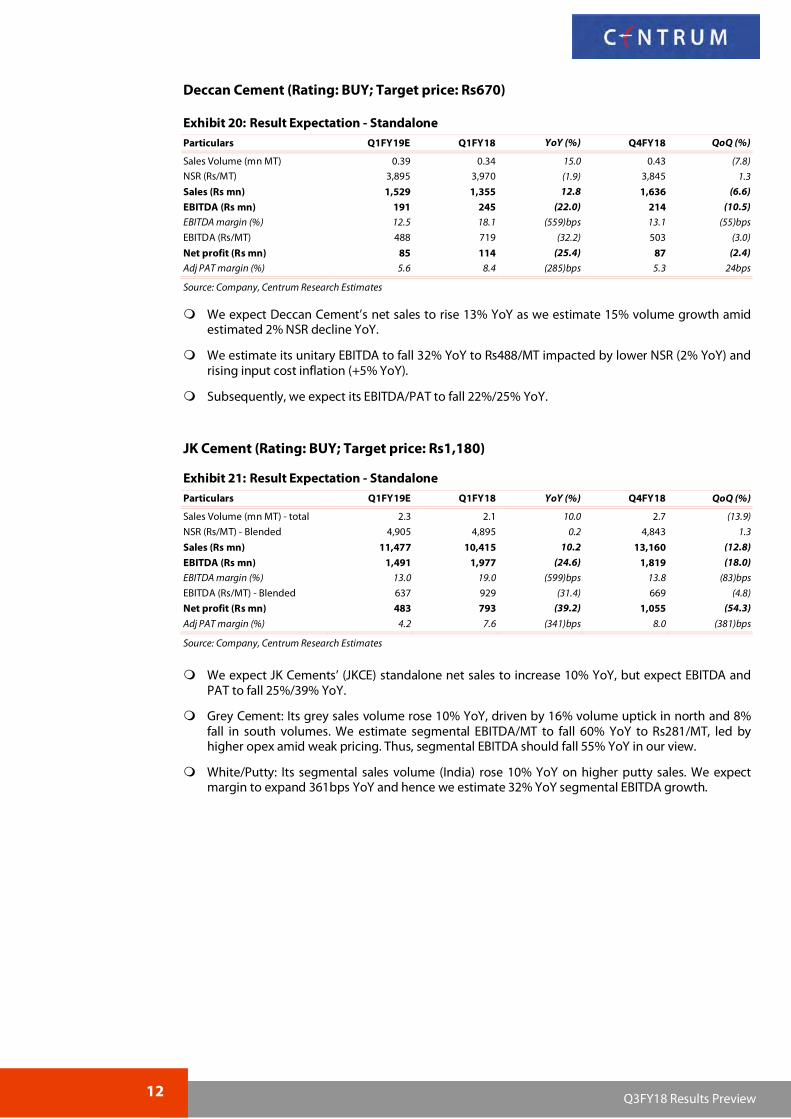
We expect JK Cements’ (JKCE) standalone net sales to increase 10% YoY, but expect EBITDA and PAT to fall 25%/39% YoY.
Grey Cement: Its grey sales volume rose 10% YoY, driven by 16% volume uptick in north and 8% fall in south volumes. We estimate segmental EBITDA/MT to fall 60% YoY to Rs281/MT, led by higher opex amid weak pricing. Thus, segmental EBITDA should fall 55% YoY in our view.
White/Putty: Its segmental sales volume (India) rose 10% YoY on higher putty sales. We expect margin to expand 361bps YoY and hence we estimate 32% YoY segmental EBITDA growth.
13 Q3FY18 Results Preview
JK Lakshmi Cement (Rating: SELL; Target price: Rs330)
We expect JK Lakshmi Cement to deliver the lowest volume growth in our coverage universe (+1% YoY), owing to its capacity peak-out across both north and east. We estimate 1% QoQ NSR increase to drive 3% higher NSR YoY.
As we estimate unitary opex to rise 7% YoY, unitary EBITDA should compress 21% YoY to Rs414/MT.
Thus, while we estimate 4% NSR increase, we see EBITDA/PAT decline by 21%/56% YoY.
We estimate Ramco Cement’s net sales to rise 20% YoY driven by 21% YoY volume growth amid 8% lower NSR YoY. We expect Ramco’s volume growth to benefit from robust demand across south and east markets.
We expect opex to rise 8% YoY which would further lead to unitary EBIDTA falling by 24% YoY to 950/MT.
Adj PAT margin (%) 12.0 17.1 (508)bps 14.2 (216)bps
Source: Company, Centrum Research Estimates
We expect Shree Cement’s net sales to rise 20% YoY, driven by 20% grey cement volume growth and 20% rise in merchant power revenue. We estimate flattish NSR YoY.
We expect Shree’s cement unitary EBITDA to fall 22% YoY to Rs942/MT, as we estimate opex increase of 9% YoY. Subsequently, cement EBITDA to fall 7% YoY to Rs6.6bn. Aided by higher utilisation, we estimate power EBITDA at Rs75mn vs loss of Rs13mn YoY.
We this estimate Shree’s total EBITDA/PAT to decline 6%/16% YoY.
Adj PAT margin (%) 20.2 25.1 (483)bps 20.5 (22)bps
Source: Company, Centrum Research Estimates
We expect Star Cement’s consolidated net sales to increase 26% YoY driven by 12% higher NSR YoY along with 14% YoY increase in sales volume. Star recorded 15% YoY volume increase in in the NE region.
We estimate unitary opex to inflate 26% YoY on account of FOR based sales reporting and expiration of freight subsidy wef from Feb-2018. Thus, unitary EBITDA should compress 13% YoY to Rs1943/MT.
We expect consolidated EBITDA to fall a modest 1% YoY (on high base of last year), as robust volume growth should offset margin compression. Thus, we estimate 1% PAT growth YoY.
Net profit (Rs mn) 6,230 8,906 (30.0) 7,142 (12.8)
Adj PAT margin (%) 7.1 13.4 (636)bps 7.9 (85)bps
Source: Company, Centrum Research Estimates
We expect UltraTech Cement’s standalone sales volume to rise 34% YoY driven by both organic volume uptick (~8% YoY) and ramp-up from JPA’s acquired plants to 80% utilisation in Q1FY19. We estimate NSR to fall 1% YoY, despite 3% QoQ recovery. Thus, net sales should rise 33% YoY.
However, we estimate unitary EBITDA to fall by 24% YoY to Rs903/MT as we estimate cost inflation to remain high at 7% amid 1% NSR fall.
Thus, we estimate EBITDA to grow a modest 2% YoY. Higher capital charges should drag down PAT by 30% YoY.
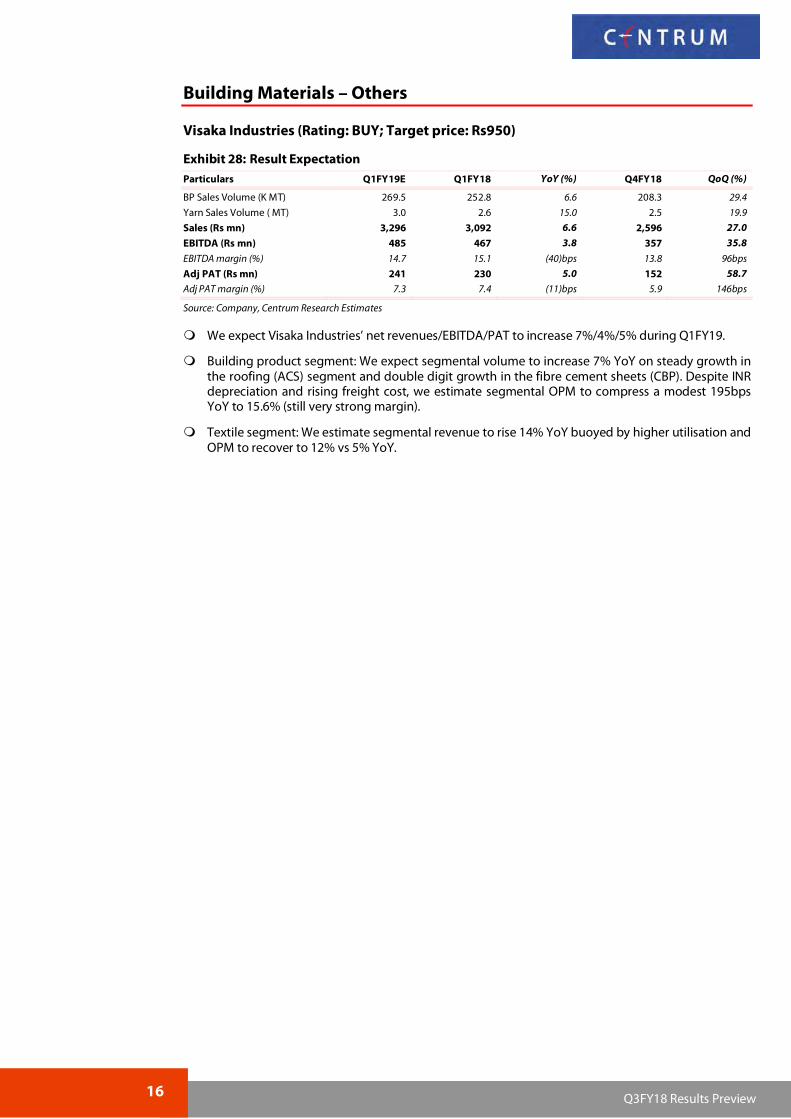
We expect Visaka Industries’ net revenues/EBITDA/PAT to increase 7%/4%/5% during Q1FY19.
Building product segment: We expect segmental volume to increase 7% YoY on steady growth in the roofing (ACS) segment and double digit growth in the fibre cement sheets (CBP). Despite INR depreciation and rising freight cost, we estimate segmental OPM to compress a modest 195bps YoY to 15.6% (still very strong margin).
Textile segment: We estimate segmental revenue to rise 14% YoY buoyed by higher utilisation and OPM to recover to 12% vs 5% YoY.
`
ct
Headline firming up; bottom line, still weak We expect the headline numbers (ie revenues) for our banking universe to come in higher (11.7% YoY growth) on back of improved systemic credit growth (12-13% YoY) and firm margins. The pace of new NPA addition too is expected to decline sequentially (in certain cases on a YoY basis as well) as banks have recognised a substantial part of the stressed portfolio as NPA in Q4’18 quarter itself. However, with weak treasury gains and MTM provisions on the investment portfolio (following the hardening of yield curve), feeble fee income growth and elevated credit costs on back of NPA ageing, we expect earnings growth to remain weak. We stick with our preference for ICICI Bank and SBI in the large-cap space. NBFCs (AFC and HFC) remain in sweet spot given the improved AuM growth and stable operating performance. Micro-lending institutions are back in business; the quarter could well see provisions remain higher as the lenders resort to aggressive write-offs. We remain constructive on the rating space. Banking: Systemic credit growth has seen a pick-up with last reported growth at12-13%
YoY; the same however continues to be retail driven. We expect our coverage universe to report 11.7% YoY growth in NII led by 11-12% YoY growth in loans. Trend in non-interest income – both fee income (on back of muted corporate credit growth) and treasury gains (following adverse yield movement) is expected to come in lower. However, with stable costs, we expect operating profit for our coverage universe to grow 14.2% YoY. ICICI Bank will report gains on sale of its stake in its insurance business. Q4’18 saw banks recognise a substantial part of its stressed assets portfolio as NPAs. The pace of new bad loan addition thus is expected to remain lower on a sequential basis. The quarter, however will see elevated credit cost following NPA ageing and MTM provisions on the investment portfolio. We thus expect net profit for our coverage universe to decline 64% YoY. Our estimates factor in the increased provision coverage ratio on a QoQ basis. Key things to watch out from the quarter – commentaries on margin and resolution of select large stressed assets including NCLT cases.
NBFCs –AFCs and HFCs: Industry-wide auto volumes have been on a rise and bodes well for our AFCs under coverage – MMFS and Sundaram Finance. We expect our AFC universe to report 18% YoY / 21.4% YoY growth in AuM / revenue (combined) for Q’19. NIM on AuM (calc) is expected to improve YoY; on a QoQ basis, the same however is expected to decline following increased borrowing costs and the seasonal nature of business. Migration to 90-dpd coupled with Q1 phenomenon will see NPA’s for MMFS remain higher. We have factored the same into our estimates. The migration to Ind-AS starting Q1’19 will see credit cost (ie expected credit loss ECL) remain volatile. Earnings , thus may not be strictly comparable. We expect GICHF to report healthy 20%+ growth in loans; earnings growth however is expected to remain muted following margin pressures. We expect GICHF to report 8% YoY / 3.2% YoY growth in NII / PPOP.
Rating Agencies; Micro-Lending Institutions: While we expect volume growth from bank loan ratings and corporate bond issuance business to remain lower, our interaction with rating agencies have pointed to greater focus at commercial paper ratings, SME business and opportunity under the NCLT framework. We expect our coverage universe (CARE and CRISIL combined) to report 6% YoY growth in overall revenues. Pricing pressures prevail and we expect trend therein to reverse in H2FY2019. Micro-lenders are in a better position following a) strong AuM growth and b) further improvement in collection efficiency (CE). Also, on back of low base effect of the previous year, we expect both Ujjivan and Satin to report robust AuM and revenue growth. Q1’18 saw entities report elevated NPA’s (following withdrawal of RBI dispensation on NPA recognition) and thus higher credit cost. Trend in recoveries, since then has improved. Pace of new delinquencies too have moderated. We thus expect micro-lenders to report robust 68.6% YoY growth in NII and improved profitability (Ujjivan and Satin reported lossess in Q1’18 quarter).
Recommendation: We continue with our preference for ICICI Bank and SBI in the large cap banking space. Commentaries on growth, margins and resolution of NPA assets remain key monitorable. Karnataka Bank followed by DCB Bank and City Union Bank are our preferred picks in the old private banking space. AFC space will see improved loan growth; we prefer Sundaram Finance for its positioning and returns profile. We like GICHF for its business model and inexpensive valuations. Micro-lending institutions (Ujjivan and Satin) have seen improved AuM growth and operating performance. We remain constructive on the space. We also like rating agencies space (Buy on both CARE, CRISIL). With expensive valuations, we retain SELL on Mahindra Finance.
Stock Price performance (%)*
Co. Name 1-Mth 3-Mth 6-Mth YTD
Axis Bank (5.3) 2.7 (8.8) 1.4
ICICI Bank (7.2) (3.8) (13.7) (6.8)
City Union Bank (0.3) 6.1 6.6 12.5
DCB Bank (7.3) (2.5) (14.2) (11.9)
Karnataka Bank (7.6) (12.7) (30.1) (32.7)
SBIN (4.6) (1.0) (16.0) (9.3)
GICHF (10.7) (9.9) (24.9) (36.4)
MMFS (6.3) (8.4) (6.1) 26.5
SUF (11.6) (7.3) (6.2) 9.4
CARE Ratings (7.4) (2.8) (5.9) (25.4)
CRISIL (1.9) (5.3) (5.8) (7.3)
Satin Creditcare (12.8) (21.6) (23.2) 7.3
Ujjivan Financial (6.4) (0.5) (7.3) 17.7
Bank Nifty (0.1) 6.5 3.5 12.3
PSU Bank Nifty (6.7) (8.2) (25.0) (19.2)
Nifty 0.0 4.3 2.0 10.1
Source: Bloomberg; * as on 6 July 2018
Rating and target prices
Co Name Rating CMP* TP (Rs)
Axis Bank HOLD 514 520
ICICI Bank BUY 270 360
City Union Bank HOLD 188 165
DCB Bank Ltd BUY 169 215
Karnataka Bank BUY 110 180
SBI BUY 257 330
GIC Housing Fin. BUY 350 640
MMFS SELL 455 380
Sundaram Finance BUY 1,583 2,240
CARE BUY 1,251 1.750
CRISIL BUY 1,807 2,000
Satin Creditcare BUY 334 590
Ujjivan Financial HOLD 378 430
Source: Centrum Research Estimates; * as on 6 July 2018
Source: Company, Centrum Research Estimates. *as on 6th July 2018 #ROA for rating agencies is RoCE. # Core RoE’s
19 Q4FY18 Results Preview
Banking
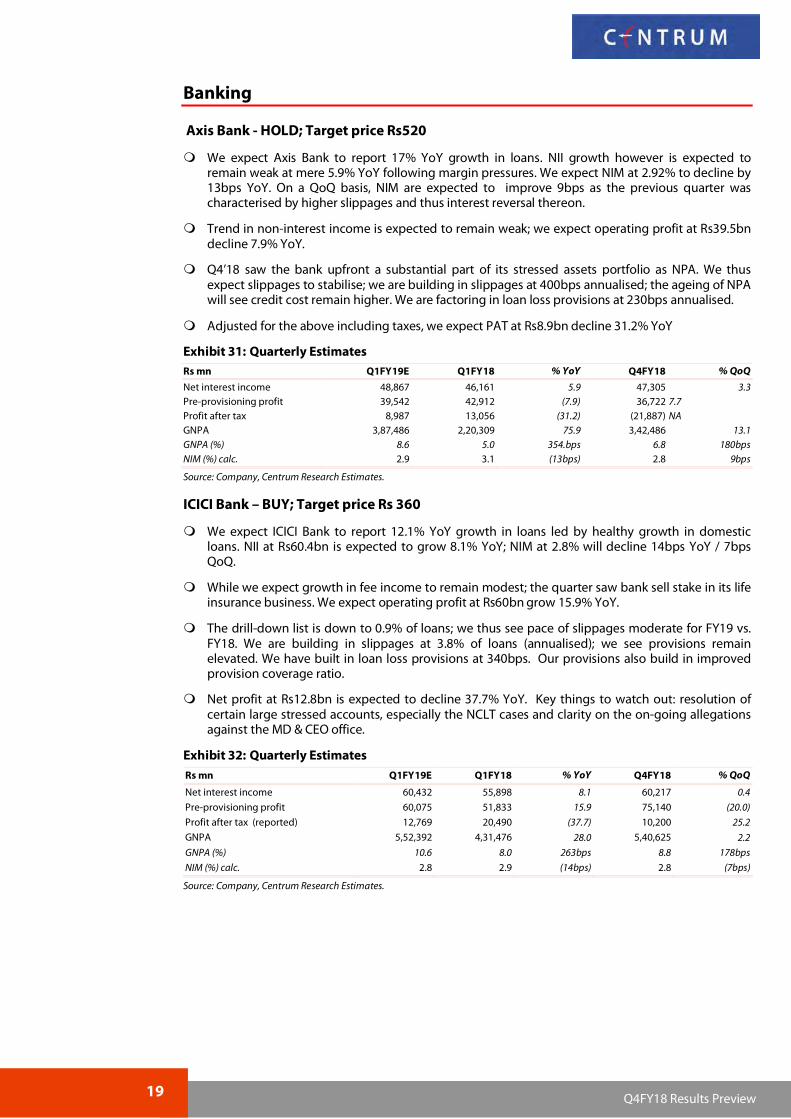
Axis Bank - HOLD; Target price Rs520
We expect Axis Bank to report 17% YoY growth in loans. NII growth however is expected to remain weak at mere 5.9% YoY following margin pressures. We expect NIM at 2.92% to decline by 13bps YoY. On a QoQ basis, NIM are expected to improve 9bps as the previous quarter was characterised by higher slippages and thus interest reversal thereon.
Trend in non-interest income is expected to remain weak; we expect operating profit at Rs39.5bn decline 7.9% YoY.
Q4’18 saw the bank upfront a substantial part of its stressed assets portfolio as NPA. We thus expect slippages to stabilise; we are building in slippages at 400bps annualised; the ageing of NPA will see credit cost remain higher. We are factoring in loan loss provisions at 230bps annualised.
Adjusted for the above including taxes, we expect PAT at Rs8.9bn decline 31.2% YoY
Net interest income 48,867 46,161 5.9 47,305 3.3 Pre-provisioning profit 39,542 42,912 (7.9) 36,722 7.7 Profit after tax 8,987 13,056 (31.2) (21,887) NA GNPA 3,87,486 2,20,309 75.9 3,42,486 13.1 GNPA (%) 8.6 5.0 354.bps 6.8 180bps NIM (%) calc. 2.9 3.1 (13bps) 2.8 9bps
Source: Company, Centrum Research Estimates.
ICICI Bank – BUY; Target price Rs 360
We expect ICICI Bank to report 12.1% YoY growth in loans led by healthy growth in domestic loans. NII at Rs60.4bn is expected to grow 8.1% YoY; NIM at 2.8% will decline 14bps YoY / 7bps QoQ.
While we expect growth in fee income to remain modest; the quarter saw bank sell stake in its life insurance business. We expect operating profit at Rs60bn grow 15.9% YoY.
The drill-down list is down to 0.9% of loans; we thus see pace of slippages moderate for FY19 vs. FY18. We are building in slippages at 3.8% of loans (annualised); we see provisions remain elevated. We have built in loan loss provisions at 340bps. Our provisions also build in improved provision coverage ratio.
Net profit at Rs12.8bn is expected to decline 37.7% YoY. Key things to watch out: resolution of certain large stressed accounts, especially the NCLT cases and clarity on the on-going allegations against the MD & CEO office.
Profit after tax (reported) 12,769 20,490 (37.7) 10,200 25.2
GNPA 5,52,392 4,31,476 28.0 5,40,625 2.2
GNPA (%) 10.6 8.0 263bps 8.8 178bps
NIM (%) calc. 2.8 2.9 (14bps) 2.8 (7bps)
Source: Company, Centrum Research Estimates.
20 Q4FY18 Results Preview
City Union Bank - HOLD; Target price Rs165
We expect CUBK to report healthy 16.9% YoY growth in loans. NII growth is however expected to come in lower at 7.7% YoY / 0.2% QoQ. The recent past has seen margins compress; we expect the trend therein to continue. We expect Q1’19 NIM (calc) at 3.6% (down 29bps YoY).
Operating profit at Rs3bn is expected to remain flat.
Management has guided for moderation in slippages run-rate. We are factoring in slippages at 180bps; we are building in an increased provision coverage ratio.
Net profit at Rs1.57bn is expected to rise 12.3% YoY.
We expect Karnataka bank to report a healthy 25.9% Yoy growth in loans. NII at Rs4.9bn is expected to rise 16.3% YoY. We expect NIM to improve 11bps YoY to 2.8%; on a QoQ basis, NIM are expected to decline following one-off (interest on income tax refund).
Q4’18 saw bank rationalise its fee income across many services. We expect positive momentum therein to continue to Q1’19. This in addition to strong loan growth should contribute to sharp increase in fee income and thus overall non-interest income. We expect operating profit at Rs3.6bn to grow 16.1% YoY.
We expect pace of slippages to moderate. This is following large part of stressed portfolio being already recognised as GNPA in Q4’18. We are building in slippages at 2.3% of loans; NPA ageing will see credit cost remain higher. We are factoring in provisions at 130bps annualised.
Adjusted for the above, we expect KBL to report net profit to the tune of Rs1.52bn (+13.3% YoY).
We expect SBI to report 14.2% YoY growth in NII led by 9.2% YoY growth in loans and expansion in NIM by 13bps YoY to 2.3%. On a QoQ basis, we expect NIM to see 9bps moderation.
Hardening of yield curve will see treasury gains too will remain feeble; Operating profit at Rs144.5bn is expected to rise 21.8% YoY.
Watchlist portfolio for the bank was down to 1.3% of loans; we thus expect slippages to moderate. We are building in slippages at 410bps annualised. Resolution from ceratin NCLT cases will see overall recovery remain higher. Provisions for the quarter, however is expected to remain high following ageing related provisions. Adverse yield movement will also see investment related provisions ie MTM on investment portfolio.
We thus expect the bank to report losses for the quarter. Key things to watch out: resolution from certain large stressed accounts – both NCLT and non-NCLT cases; commentaries on growth and margins.
Exhibit 36: Quarterly Estimates
Rs mn Q1FY19E Q1FY18 % YoY Q4FY18 % QoQ
Net interest income 2,01,143 1,76,060 14.2 1,99,743 0.7
We expect GICHF to report healthy 20.7% YoY growth in loans. However, given the re-pricing pressure on the asset side, we expect growth in NII to come in lower at 8% YoY.
NIM (calc) at 3.7% are expected to decline 5bps QoQ / 42bps YoY; Starting Q2’19, we expect spreads to compress further.
GICHF will reports its results under Ind-AS. This will have a bearing on its fee income. Total income at Rs1.1bn is expected to grow by mere 3.2% YoY.
Operating profit at Rs911mn is expected to rise 3.2% YoY.
Q1 tends to be seasonally a weak quarter on asset quality. We thus expect marginal increase in GNPA. However, we draw comfort in overall PCR at 70%+. We have built in credit cost at 40bps (annualised). We, however will watch out for overall provisions following the change in accounting policy.
Q1’18 saw elevated provisions on back of sharp increase in GNPA. We do not expect similar nature of provisions for the current quarter. Resultant, net profit at Rs526mn is expected to increase 30.4% YoY.
Stock trades at 1.6x FY19E ABV / 1,4x FY20E ABV. We have a BUY on the stock with TP at Rs640.
Exhibit 37: Quarterly Estimates
Rs mn Q1FY19E Q1FY18 % YoY Q4FY18 % QoQ
Net interest income 1,057 979 8.0 1,024 3.2
Pre-provisioning profit 911 884 3.2 875 4.2
Profit after tax 526 404 30.4 599 (12.1)
NIM (calc) 3.7 4.1 (42bps) 3.7 (5bps)
Source: Company, Centrum Research Estimates.
23 Q4FY18 Results Preview
Asset financing companies
M&M Financial Services – SELL; Target price Rs380
We expect MMFS to report 25.3% YoY growth in NII led by 17% YoY / 19Y YoY growth in value of asset financed /AuM. NIM at 7.8% (calc) is expected to improve on a YoY basis; on a QoQ basis, we however expect the same to moderate given the seasonality factor and increased borrowing costs.
Operating profit at Rs6.1bn is expected to grow 23.8% YoY. The migration to 90-dpd will see trend in new slippages remain elevated. MMFS will migrate to Ind-AS standards. The quarter thus will see elevated provisions. We have built in loan loss provisions at 250bps annualised.
After providing for the same including tax related provisioning, we expect net profit at Rs2.1bn. While we remain constructive on the improving rural demand and improved farm incomes, our negative stance on MMFS is given its expensive valuations.
Exhibit 38: Quarterly Estimates
Rs mn Q1FY19E Q1FY18 % YoY Q4FY18 % QoQ
Net interest income 10,771 8,597 25.3 13,050 (17.5)
Industry-wide auto volumes have been on a rise and we expect momentum therein to benefit asset financers. Rating agencies, leading OEM and financiers have pointed for 9-11% growth in M&HCV, 12-14% YoY growth in LCV; 10-12% growth in PV and yet another year of strong growth in tractor industry for FY19.
We expect Sundaram Finance to report 10% YoY / 16.8% YoY growth in disbursements / AuM for Q1’19. Management has guided for greater focus in segments of LCV, CE and tractor portfolio. WE will watch for trend therein.
NII at Rs3.3bn is expected to grow 10.3% YoY. The lower than expected NII growth (vis-à-vis strong disbursement / AuM growth) follows pricing pressure (impacting the lending rates). Sundaram Finance has a balanced ALM portfolio (duration of 1.5 years); also mere 27% of its NCD’s are due for re-pricing in the next 1-year. We thus expect overall borrowing cost pressures to remain limited.
Operating profit at Rs2.1bn is expected to rise 7.5% YoY.
Asset quality trends remain comfortable, and after providing for the same including tax related provisioning, we expect SUF to report net profit at Rs1.19bn.
Subsidiaries continue to remain profitable. We will watch for commentaries from other core subsidiaries - Sundaram Home Finance, Royal Insurance and AMC business.
While we expect volume growth in bank loan rating and corporate bond issuances to remain lower; management in recent past have guided for greater focus at commercial paper rating, SME business and opportunity under the NCLT framework. These businesses should aid in higher volume growth for CARE in Q1’19.
We expect CARE to report 20% YoY growth in volume of debt rated. Rating revenues, however are expected to grow 7.6% YoY and follows continued pricing pressure.
EBIDTA at Rs374mn is expected to decline 4.7% YoY; EBIDTA margins to come in at 56.5% (down 700bps+ YoY). The compression in EBIDTA follows higher employee expenses, especially the ESOP related expenses.
Net profit, adjusted for the above and tax at Rs292mn is expected to decline 17.8% YoY.
Profit after Tax (reported) 292 355 (17.8) 399 (26.9)
Source: Company, Centrum Research Estimates
CRISIL– BUY; TP Rs2,000
We expect CRISIL to report 5.7% YoY growth in overall revenues led by 5.5% YoY growth in rating revenue and 15% YoY growth in advisory services. Research revenues are expected grow 5% YoY. Commentaries on revival in SME business and GAC will be closely monitored.
EBIDTA at Rs1.18bn is expected to improve 15.4% YoY. We expect EDBITA margins at 27.5% (vs. 25.2% YoY).
Reported PAT at Rs775mn is expected to grow 15.2% YoY.
Other comprehensive income line item will include MTM loss on CRISIL’s investment in CARE.
Profit after Tax (reported) 775 673 15.2 822 (5.8)
Source: Company, Centrum Research Estimates.
25 Q4FY18 Results Preview
Micro-lending institutions
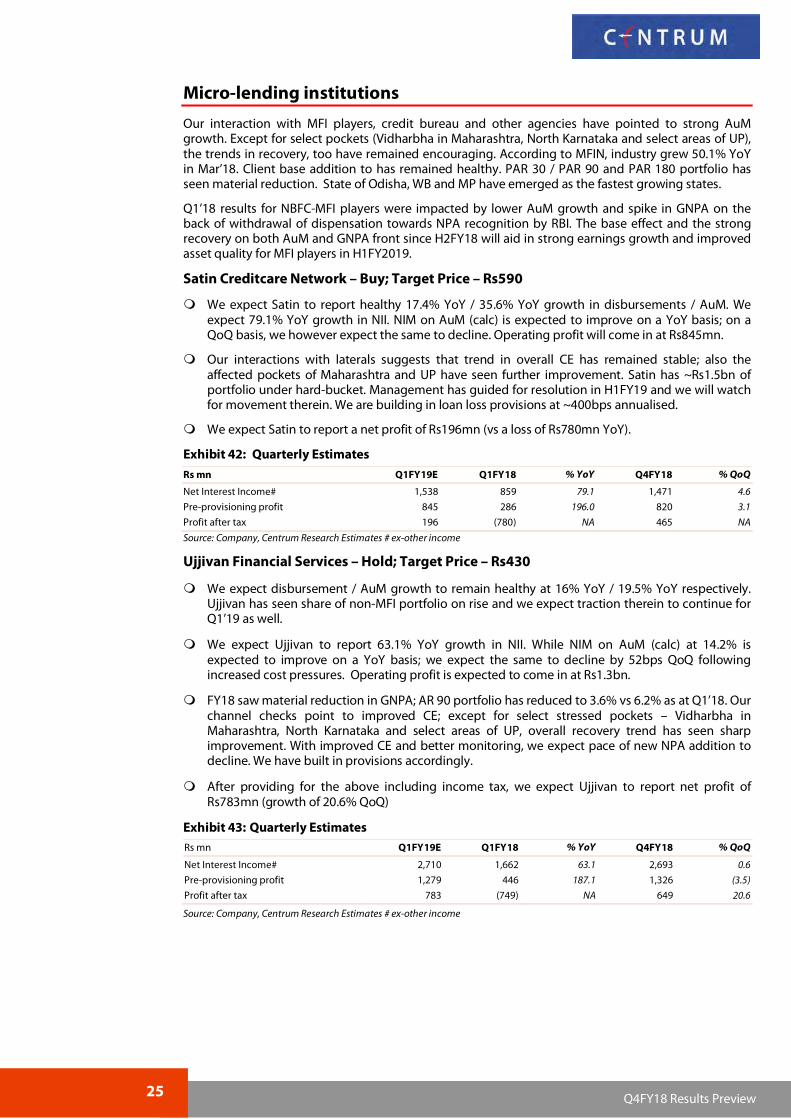
Our interaction with MFI players, credit bureau and other agencies have pointed to strong AuM growth. Except for select pockets (Vidharbha in Maharashtra, North Karnataka and select areas of UP), the trends in recovery, too have remained encouraging. According to MFIN, industry grew 50.1% YoY in Mar’18. Client base addition to has remained healthy. PAR 30 / PAR 90 and PAR 180 portfolio has seen material reduction. State of Odisha, WB and MP have emerged as the fastest growing states.
Q1’18 results for NBFC-MFI players were impacted by lower AuM growth and spike in GNPA on the back of withdrawal of dispensation towards NPA recognition by RBI. The base effect and the strong recovery on both AuM and GNPA front since H2FY18 will aid in strong earnings growth and improved asset quality for MFI players in H1FY2019.
We expect Satin to report healthy 17.4% YoY / 35.6% YoY growth in disbursements / AuM. We expect 79.1% YoY growth in NII. NIM on AuM (calc) is expected to improve on a YoY basis; on a QoQ basis, we however expect the same to decline. Operating profit will come in at Rs845mn.
Our interactions with laterals suggests that trend in overall CE has remained stable; also the affected pockets of Maharashtra and UP have seen further improvement. Satin has ~Rs1.5bn of portfolio under hard-bucket. Management has guided for resolution in H1FY19 and we will watch for movement therein. We are building in loan loss provisions at ~400bps annualised.
We expect Satin to report a net profit of Rs196mn (vs a loss of Rs780mn YoY).
Exhibit 42: Quarterly Estimates
Rs mn Q1FY19E Q1FY18 % YoY Q4FY18 % QoQ
Net Interest Income# 1,538 859 79.1 1,471 4.6
Pre-provisioning profit 845 286 196.0 820 3.1
Profit after tax 196 (780) NA 465 NA
Source: Company, Centrum Research Estimates # ex-other income
We expect disbursement / AuM growth to remain healthy at 16% YoY / 19.5% YoY respectively. Ujjivan has seen share of non-MFI portfolio on rise and we expect traction therein to continue for Q1’19 as well.
We expect Ujjivan to report 63.1% YoY growth in NII. While NIM on AuM (calc) at 14.2% is expected to improve on a YoY basis; we expect the same to decline by 52bps QoQ following increased cost pressures. Operating profit is expected to come in at Rs1.3bn.
FY18 saw material reduction in GNPA; AR 90 portfolio has reduced to 3.6% vs 6.2% as at Q1’18. Our channel checks point to improved CE; except for select stressed pockets – Vidharbha in Maharashtra, North Karnataka and select areas of UP, overall recovery trend has seen sharp improvement. With improved CE and better monitoring, we expect pace of new NPA addition to decline. We have built in provisions accordingly.
After providing for the above including income tax, we expect Ujjivan to report net profit of Rs783mn (growth of 20.6% QoQ)
Source: Company, Centrum Research Estimates # ex-other income
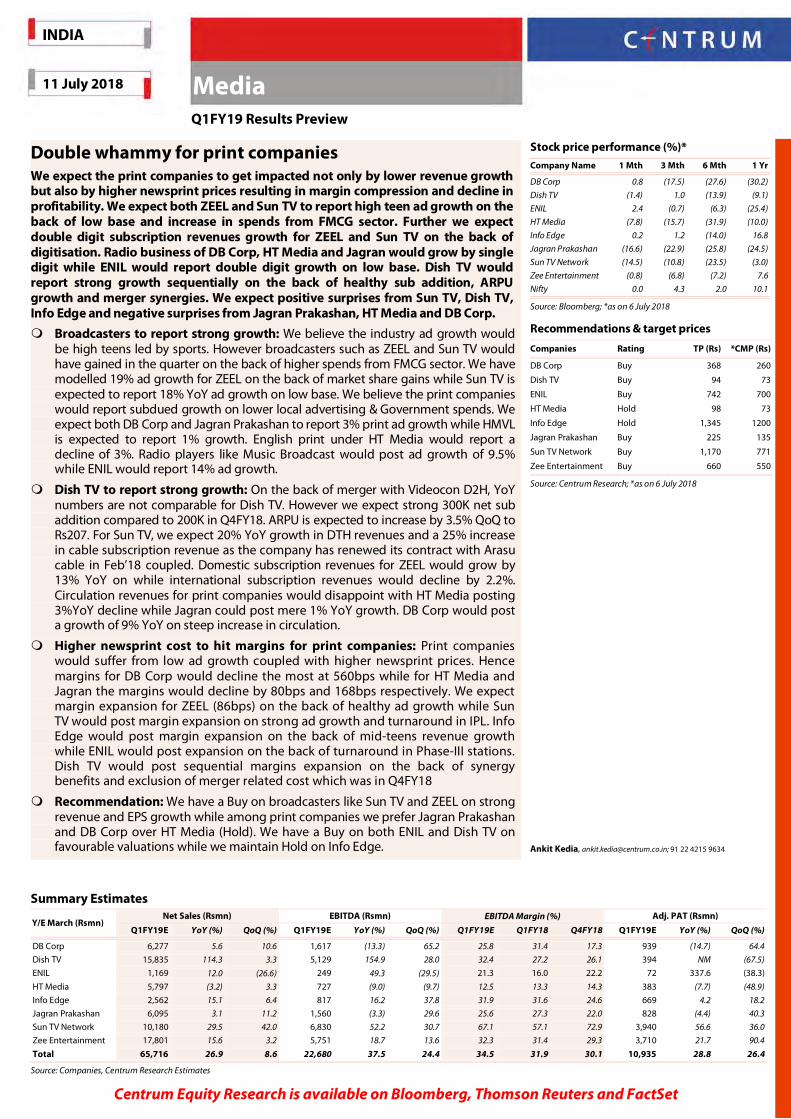
Double whammy for print companies We expect the print companies to get impacted not only by lower revenue growth but also by higher newsprint prices resulting in margin compression and decline in profitability. We expect both ZEEL and Sun TV to report high teen ad growth on the back of low base and increase in spends from FMCG sector. Further we expect double digit subscription revenues growth for ZEEL and Sun TV on the back of digitisation. Radio business of DB Corp, HT Media and Jagran would grow by single digit while ENIL would report double digit growth on low base. Dish TV would report strong growth sequentially on the back of healthy sub addition, ARPU growth and merger synergies. We expect positive surprises from Sun TV, Dish TV, Info Edge and negative surprises from Jagran Prakashan, HT Media and DB Corp.
Broadcasters to report strong growth: We believe the industry ad growth would be high teens led by sports. However broadcasters such as ZEEL and Sun TV would have gained in the quarter on the back of higher spends from FMCG sector. We have modelled 19% ad growth for ZEEL on the back of market share gains while Sun TV is expected to report 18% YoY ad growth on low base. We believe the print companies would report subdued growth on lower local advertising & Government spends. We expect both DB Corp and Jagran Prakashan to report 3% print ad growth while HMVL is expected to report 1% growth. English print under HT Media would report a decline of 3%. Radio players like Music Broadcast would post ad growth of 9.5% while ENIL would report 14% ad growth.
Dish TV to report strong growth: On the back of merger with Videocon D2H, YoY numbers are not comparable for Dish TV. However we expect strong 300K net sub addition compared to 200K in Q4FY18. ARPU is expected to increase by 3.5% QoQ to Rs207. For Sun TV, we expect 20% YoY growth in DTH revenues and a 25% increase in cable subscription revenue as the company has renewed its contract with Arasu cable in Feb’18 coupled. Domestic subscription revenues for ZEEL would grow by 13% YoY on while international subscription revenues would decline by 2.2%. Circulation revenues for print companies would disappoint with HT Media posting 3%YoY decline while Jagran could post mere 1% YoY growth. DB Corp would post a growth of 9% YoY on steep increase in circulation.
Higher newsprint cost to hit margins for print companies: Print companies would suffer from low ad growth coupled with higher newsprint prices. Hence margins for DB Corp would decline the most at 560bps while for HT Media and Jagran the margins would decline by 80bps and 168bps respectively. We expect margin expansion for ZEEL (86bps) on the back of healthy ad growth while Sun TV would post margin expansion on strong ad growth and turnaround in IPL. Info Edge would post margin expansion on the back of mid-teens revenue growth while ENIL would post expansion on the back of turnaround in Phase-III stations. Dish TV would post sequential margins expansion on the back of synergy benefits and exclusion of merger related cost which was in Q4FY18
Recommendation: We have a Buy on broadcasters like Sun TV and ZEEL on strong revenue and EPS growth while among print companies we prefer Jagran Prakashan and DB Corp over HT Media (Hold). We have a Buy on both ENIL and Dish TV on favourable valuations while we maintain Hold on Info Edge.
Source: Company, Centrum Research Estimates; *as on 6 July 2018
DB Corp (Rating: BUY; Target Price: Rs368)
Exhibit 45: Quarterly Estimates
(Rsmn) Q1FY19E Q1FY18 Q4FY18 QoQ (%) YoY (%)
Sales 6,277 5,943 5,673 10.6 5.6
EBIDTA 1,617 1,864 979 65.2 (13.3)
EBIDTA Margin (%) 25.8 31.4 17.3 850bps (560)bps
PAT 939 1101 571 64.4 (14.7)
Source: Company, Centrum Research Estimates
We expect 3%YoY growth in print ad revenues which we believe was marginally impacted due to lower growth in the month of June’18. Circulation revenue growth is expected to be 9.4% on steep increase in circulation. Radio and digital revenues are expected to grow by 5.6% and 5.3% respectively.
Operating margins are expected to decline by 560bps to 25.8% on increase in newsprint prices coupled with investment in copies. Operating profit is expected to decline 13.3% YoY to Rs1,617mn.
We expect PAT to decline 14.7% to Rs939mn.
Dish TV (Rating: BUY; Target Price: Rs94)
Exhibit 46: Quarterly Estimates
(Rsmn) Q1FY19E Q1FY18 Q4FY18 QoQ (%) YoY (%)
Sales 15,835 7,389 15,324 3.3 114.3
EBIDTA 5,129 2,012 4,007 28.0 154.9
EBIDTA Margin (%) 32.4 27.2 26.1 624bps 516bps
PAT 394 (117) 1,213 (67.5) NM
Source: Company, Centrum Research Estimates
We expect addition of 0.3mn net subscribers in the quarter while ARPU is expected to increase by 3.5% sequentially to Rs207.
Dish TV would post margin expansion on the back of synergies with merger of Videocon D2H. Overall operating profit would be at Rs5129mn with margins at 32.4%.
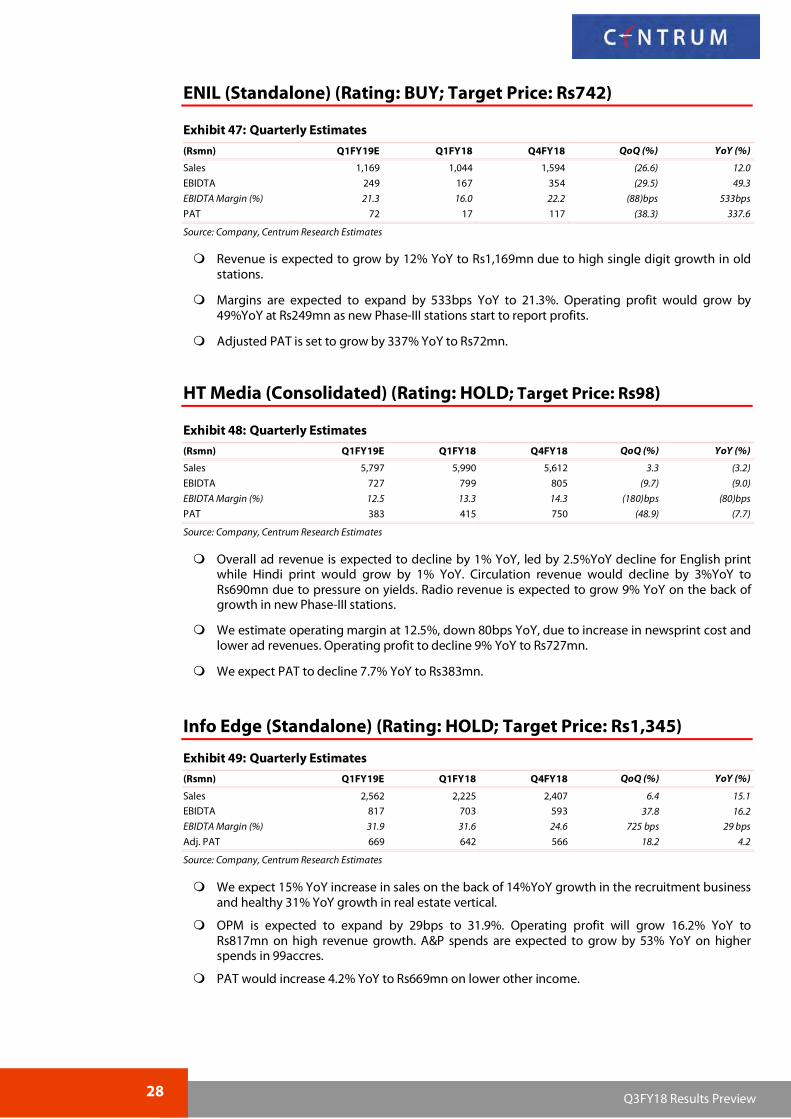
Revenue is expected to grow by 12% YoY to Rs1,169mn due to high single digit growth in old stations.
Margins are expected to expand by 533bps YoY to 21.3%. Operating profit would grow by 49%YoY at Rs249mn as new Phase-III stations start to report profits.
Adjusted PAT is set to grow by 337% YoY to Rs72mn.
HT Media (Consolidated) (Rating: HOLD; Target Price: Rs98)
Exhibit 48: Quarterly Estimates
(Rsmn) Q1FY19E Q1FY18 Q4FY18 QoQ (%) YoY (%)
Sales 5,797 5,990 5,612 3.3 (3.2)
EBIDTA 727 799 805 (9.7) (9.0)
EBIDTA Margin (%) 12.5 13.3 14.3 (180)bps (80)bps
PAT 383 415 750 (48.9) (7.7)
Source: Company, Centrum Research Estimates
Overall ad revenue is expected to decline by 1% YoY, led by 2.5%YoY decline for English print while Hindi print would grow by 1% YoY. Circulation revenue would decline by 3%YoY to Rs690mn due to pressure on yields. Radio revenue is expected to grow 9% YoY on the back of growth in new Phase-III stations.
We estimate operating margin at 12.5%, down 80bps YoY, due to increase in newsprint cost and lower ad revenues. Operating profit to decline 9% YoY to Rs727mn.
We expect PAT to decline 7.7% YoY to Rs383mn.
Info Edge (Standalone) (Rating: HOLD; Target Price: Rs1,345)
Exhibit 49: Quarterly Estimates
(Rsmn) Q1FY19E Q1FY18 Q4FY18 QoQ (%) YoY (%)
Sales 2,562 2,225 2,407 6.4 15.1
EBIDTA 817 703 593 37.8 16.2
EBIDTA Margin (%) 31.9 31.6 24.6 725 bps 29 bps
Adj. PAT 669 642 566 18.2 4.2
Source: Company, Centrum Research Estimates
We expect 15% YoY increase in sales on the back of 14%YoY growth in the recruitment business and healthy 31% YoY growth in real estate vertical.
OPM is expected to expand by 29bps to 31.9%. Operating profit will grow 16.2% YoY to Rs817mn on high revenue growth. A&P spends are expected to grow by 53% YoY on higher spends in 99accres.
PAT would increase 4.2% YoY to Rs669mn on lower other income.
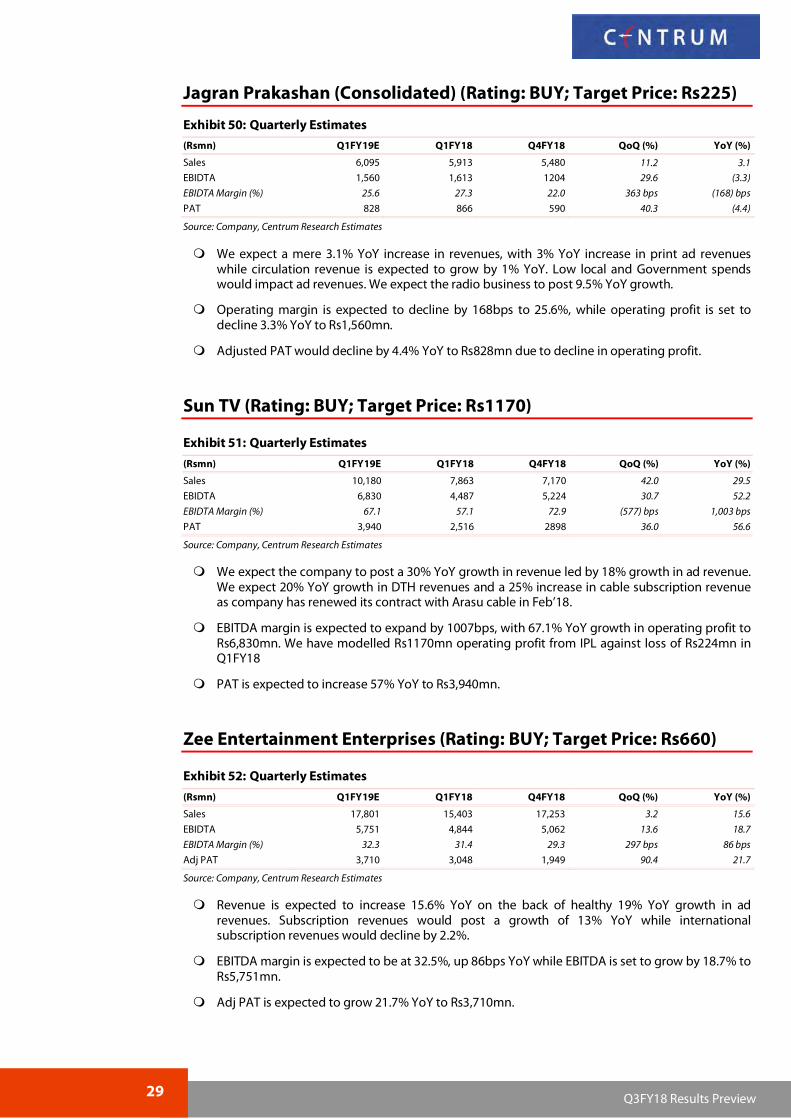
We expect a mere 3.1% YoY increase in revenues, with 3% YoY increase in print ad revenues while circulation revenue is expected to grow by 1% YoY. Low local and Government spends would impact ad revenues. We expect the radio business to post 9.5% YoY growth.
Operating margin is expected to decline by 168bps to 25.6%, while operating profit is set to decline 3.3% YoY to Rs1,560mn.
Adjusted PAT would decline by 4.4% YoY to Rs828mn due to decline in operating profit.
We expect the company to post a 30% YoY growth in revenue led by 18% growth in ad revenue. We expect 20% YoY growth in DTH revenues and a 25% increase in cable subscription revenue as company has renewed its contract with Arasu cable in Feb’18.
EBITDA margin is expected to expand by 1007bps, with 67.1% YoY growth in operating profit to Rs6,830mn. We have modelled Rs1170mn operating profit from IPL against loss of Rs224mn in Q1FY18
PAT is expected to increase 57% YoY to Rs3,940mn.
Zee Entertainment Enterprises (Rating: BUY; Target Price: Rs660)
Exhibit 52: Quarterly Estimates
(Rsmn) Q1FY19E Q1FY18 Q4FY18 QoQ (%) YoY (%)
Sales 17,801 15,403 17,253 3.2 15.6
EBIDTA 5,751 4,844 5,062 13.6 18.7
EBIDTA Margin (%) 32.3 31.4 29.3 297 bps 86 bps
Adj PAT 3,710 3,048 1,949 90.4 21.7
Source: Company, Centrum Research Estimates
Revenue is expected to increase 15.6% YoY on the back of healthy 19% YoY growth in ad revenues. Subscription revenues would post a growth of 13% YoY while international subscription revenues would decline by 2.2%.
EBITDA margin is expected to be at 32.5%, up 86bps YoY while EBITDA is set to grow by 18.7% to Rs5,751mn.
Adj PAT is expected to grow 21.7% YoY to Rs3,710mn.
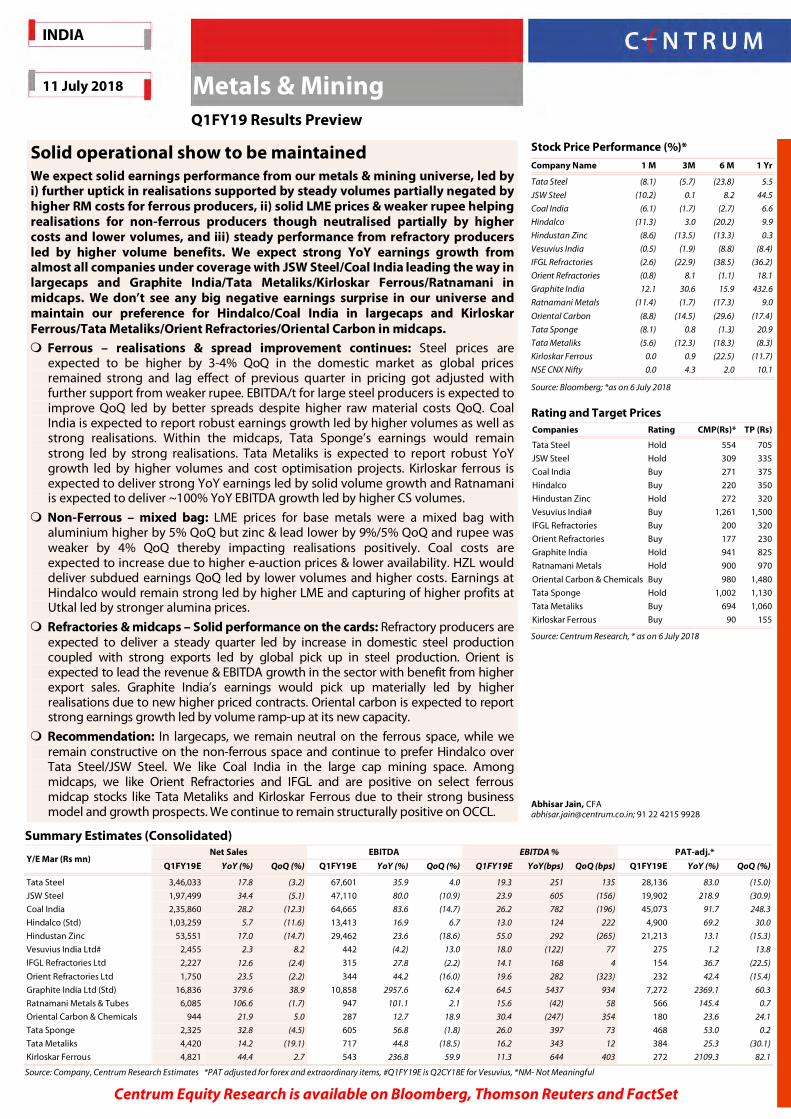
Solid operational show to be maintained We expect solid earnings performance from our metals & mining universe, led by i) further uptick in realisations supported by steady volumes partially negated by higher RM costs for ferrous producers, ii) solid LME prices & weaker rupee helping realisations for non-ferrous producers though neutralised partially by higher costs and lower volumes, and iii) steady performance from refractory producers led by higher volume benefits. We expect strong YoY earnings growth from almost all companies under coverage with JSW Steel/Coal India leading the way in largecaps and Graphite India/Tata Metaliks/Kirloskar Ferrous/Ratnamani in midcaps. We don’t see any big negative earnings surprise in our universe and maintain our preference for Hindalco/Coal India in largecaps and Kirloskar Ferrous/Tata Metaliks/Orient Refractories/Oriental Carbon in midcaps. Ferrous – realisations & spread improvement continues: Steel prices are
expected to be higher by 3-4% QoQ in the domestic market as global prices remained strong and lag effect of previous quarter in pricing got adjusted with further support from weaker rupee. EBITDA/t for large steel producers is expected to improve QoQ led by better spreads despite higher raw material costs QoQ. Coal India is expected to report robust earnings growth led by higher volumes as well as strong realisations. Within the midcaps, Tata Sponge’s earnings would remain strong led by strong realisations. Tata Metaliks is expected to report robust YoY growth led by higher volumes and cost optimisation projects. Kirloskar ferrous is expected to deliver strong YoY earnings led by solid volume growth and Ratnamani is expected to deliver ~100% YoY EBITDA growth led by higher CS volumes.
Non-Ferrous – mixed bag: LME prices for base metals were a mixed bag with aluminium higher by 5% QoQ but zinc & lead lower by 9%/5% QoQ and rupee was weaker by 4% QoQ thereby impacting realisations positively. Coal costs are expected to increase due to higher e-auction prices & lower availability. HZL would deliver subdued earnings QoQ led by lower volumes and higher costs. Earnings at Hindalco would remain strong led by higher LME and capturing of higher profits at Utkal led by stronger alumina prices.
Refractories & midcaps – Solid performance on the cards: Refractory producers are expected to deliver a steady quarter led by increase in domestic steel production coupled with strong exports led by global pick up in steel production. Orient is expected to lead the revenue & EBITDA growth in the sector with benefit from higher export sales. Graphite India’s earnings would pick up materially led by higher realisations due to new higher priced contracts. Oriental carbon is expected to report strong earnings growth led by volume ramp-up at its new capacity.
Recommendation: In largecaps, we remain neutral on the ferrous space, while we remain constructive on the non-ferrous space and continue to prefer Hindalco over Tata Steel/JSW Steel. We like Coal India in the large cap mining space. Among midcaps, we like Orient Refractories and IFGL and are positive on select ferrous midcap stocks like Tata Metaliks and Kirloskar Ferrous due to their strong business model and growth prospects. We continue to remain structurally positive on OCCL.
Stock Price Performance (%)*
Company Name 1 M 3M 6 M 1 Yr
Tata Steel (8.1) (5.7) (23.8) 5.5
JSW Steel (10.2) 0.1 8.2 44.5
Coal India (6.1) (1.7) (2.7) 6.6
Hindalco (11.3) 3.0 (20.2) 9.9
Hindustan Zinc (8.6) (13.5) (13.3) 0.3
Vesuvius India (0.5) (1.9) (8.8) (8.4)
IFGL Refractories (2.6) (22.9) (38.5) (36.2)
Orient Refractories (0.8) 8.1 (1.1) 18.1
Graphite India 12.1 30.6 15.9 432.6
Ratnamani Metals (11.4) (1.7) (17.3) 9.0
Oriental Carbon (8.8) (14.5) (29.6) (17.4)
Tata Sponge (8.1) 0.8 (1.3) 20.9
Tata Metaliks (5.6) (12.3) (18.3) (8.3)
Kirloskar Ferrous 0.0 0.9 (22.5) (11.7)
NSE CNX Nifty 0.0 4.3 2.0 10.1
Source: Bloomberg; *as on 6 July 2018
Rating and Target Prices Companies Rating CMP(Rs)* TP (Rs)
Source: Company, Centrum Research Estimates *adjusted for exceptional items
We expect consolidated revenue to increase by 18% YoY to ~Rs346bn. We expect sales volumes of ~3.0 MT in India (up 8.5% YoY) and 2.4 MT in Europe. Blended realisations are expected to be higher QoQ in domestic operations due to sequential price increase in domestic market, and realisations in European operations are likely to be marginally lower QoQ.
We expect consolidated EBITDA margin of 19.3%. EBITDA/t at domestic operations is expected to be higher by 63% YoY and higher by 11% QoQ at Rs17636. We expect European operations to show lower profitability on QoQ basis led by delayed impact of higher coking coal costs & muted realisations. We expect EBITDA/t of US$60 in European operations (vs US$70 in Q4). Consolidated EBITDA at ~Rs67.6bn is expected to be higher by ~36% YoY and higher by ~4% QoQ.
Source: Company, Centrum Research Estimates *adjusted for exceptional items and forex loss/ (gain)
We expect sales volumes to be higher by 15% YoY at 3.9MT in line with the company’s yearly sales plan and led by aggressive marketing efforts in domestic & export markets. Realisations are expected to be higher by 16.3% on YoY basis and 2% QoQ led by better pricing environment.
We expect EBITDA of Rs47.1bn, up ~80% YoY with an EBITDA margin of 23.9%. We expect steel business EBITDA/t of Rs11933, up 57% YoY and 1.7% QoQ. Iron ore cost is expected to be higher QoQ due to higher imports and is likely to negate the positive impact of higher realisations.
We expect revenue to be higher by 17% led by higher realisations and higher volumes in lead and silver. MIC volumes are expected to be lower YoY due to no contribution from open cast mining and hence lower zinc volumes of 170kt, down 10% YoY. Lead volumes are expected at 42kt, up 24% YoY and silver volumes are expected at 145t, up 32% YoY. Zinc LME was higher by ~20% YoY while lead LME was up 10.1% YoY.
EBITDA is expected to be higher by ~24% YoY but down ~19% QoQ to Rs29.5bn. We expect EBITDA margin of 55%.
Source: Company, Centrum Research Estimates, *NM- Not Meaningful
We expect revenue to be higher YoY led by better LME realizations. Aluminium volumes are expected to be at ~310kt, driven by optimum output at all smelters. Copper volumes are expected to be at 80kt, down 27% YoY due to high base effect and annual maintenance shutdown impacting 22 days of production in Q1.
EBITDA is expected to be up ~17% YoY to Rs13.4bn led by higher realisations aided by weak rupee partially negated by the sequential increase in commodity prices & hedges at lower LME prices. We expect EBITDA margin of 13%. All-in aluminium prices were up 18% YoY and 5.6% QoQ. Aluminium division EBITDA is expected at Rs10.5bn (excl. Utkal) and at Rs15.2bn (incl Utkal), up ~20% QoQ.
Standalone PAT is expected to be at Rs4.9bn.
34 Q3FY18 Results Preview
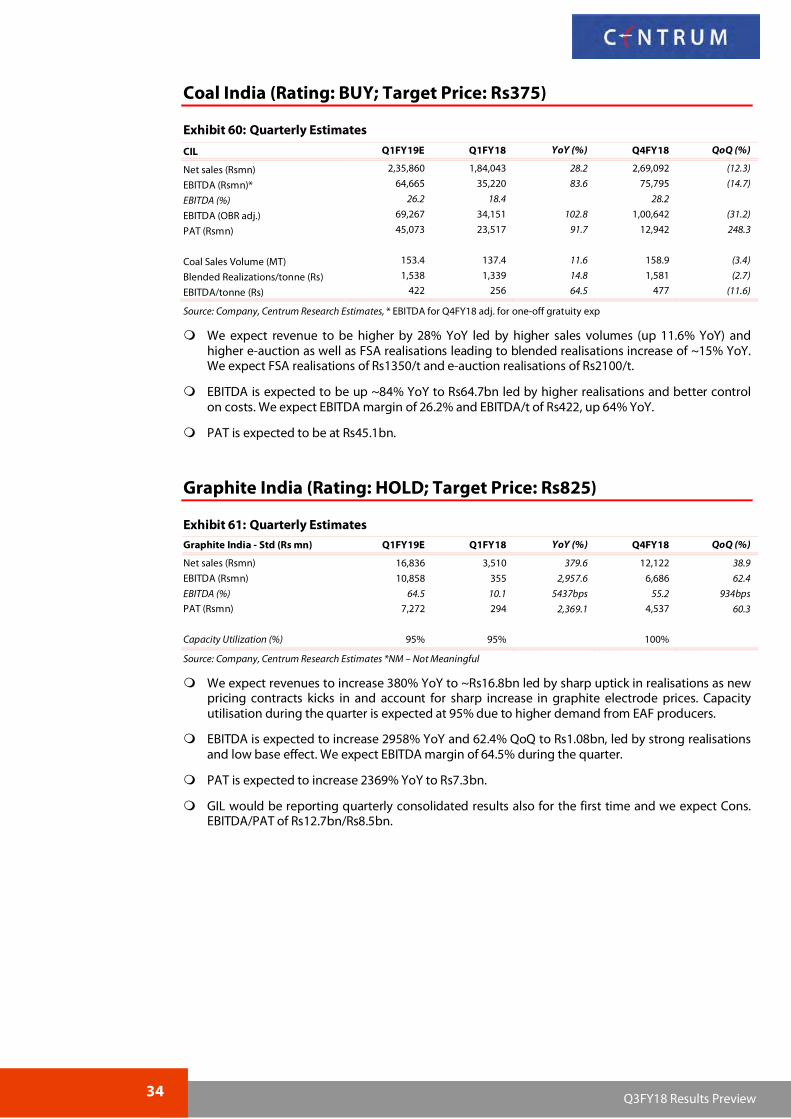
Coal India (Rating: BUY; Target Price: Rs375)
Exhibit 60: Quarterly Estimates
CIL Q1FY19E Q1FY18 YoY (%) Q4FY18 QoQ (%)
Net sales (Rsmn) 2,35,860 1,84,043 28.2 2,69,092 (12.3)
Source: Company, Centrum Research Estimates, * EBITDA for Q4FY18 adj. for one-off gratuity exp
We expect revenue to be higher by 28% YoY led by higher sales volumes (up 11.6% YoY) and higher e-auction as well as FSA realisations leading to blended realisations increase of ~15% YoY. We expect FSA realisations of Rs1350/t and e-auction realisations of Rs2100/t.
EBITDA is expected to be up ~84% YoY to Rs64.7bn led by higher realisations and better control on costs. We expect EBITDA margin of 26.2% and EBITDA/t of Rs422, up 64% YoY.
PAT is expected to be at Rs45.1bn.
Graphite India (Rating: HOLD; Target Price: Rs825)
Source: Company, Centrum Research Estimates *NM – Not Meaningful
We expect revenues to increase 380% YoY to ~Rs16.8bn led by sharp uptick in realisations as new pricing contracts kicks in and account for sharp increase in graphite electrode prices. Capacity utilisation during the quarter is expected at 95% due to higher demand from EAF producers.
EBITDA is expected to increase 2958% YoY and 62.4% QoQ to Rs1.08bn, led by strong realisations and low base effect. We expect EBITDA margin of 64.5% during the quarter.
PAT is expected to increase 2369% YoY to Rs7.3bn.
GIL would be reporting quarterly consolidated results also for the first time and we expect Cons. EBITDA/PAT of Rs12.7bn/Rs8.5bn.
35 Q3FY18 Results Preview
Vesuvius India (Rating: BUY; Target Price: Rs1500)
We expect revenue to rise 2.3% YoY, largely on account of higher volumes to its large customers like Tata Steel, SAIL and JSW Steel negated by slowdown in export sales. Revenue momentum to large NCLT accounts is likely to pick up in H2CY18 as the cases start getting resolved
EBITDA is expected to be lower by ~4% YoY to Rs442mn, led by higher raw material costs. We expect the EBITDA margin to decrease 122bps YoY to 18%.
PAT is expected to be higher by 1.2% YoY to Rs275mn.
We expect revenue to increase by 12.6% YoY to Rs2227mn. Standalone performance is expected to improve substantially YoY supported by higher sales in both domestic and export markets and strong volumes from Kandla operations. Overseas subsidiaries are expected to perform steady on a sequential basis and low base effect of last year in Hoffmann and Monocon would lead to strong growth in operational profits YoY.
EBITDA is expected to increase by 27.8% YoY to Rs315mn led by higher contribution from higher margins subs and improvement in the standalone business. We expect cons. EBITDA margin of 14.1%, up by 168bps YoY.
PAT is expected to increase by ~37% YoY to Rs154mn.
We expect revenue to increase ~24% YoY to Rs1.75bn, led mainly by higher volumes on account of higher steel production. Higher exports to both RHI and non-RHI customers would aid revenues.
EBITDA is expected to increase by 44% YoY to Rs344mn aided by higher sales and low base effect of last year due to provisioning of Rs33mn towards NCLT accounts in Q1FY18. We expect EBITDA margin of 19.6%.
PAT is expected to be up 42% YoY to Rs232mn but lower QoQ by ~15%.
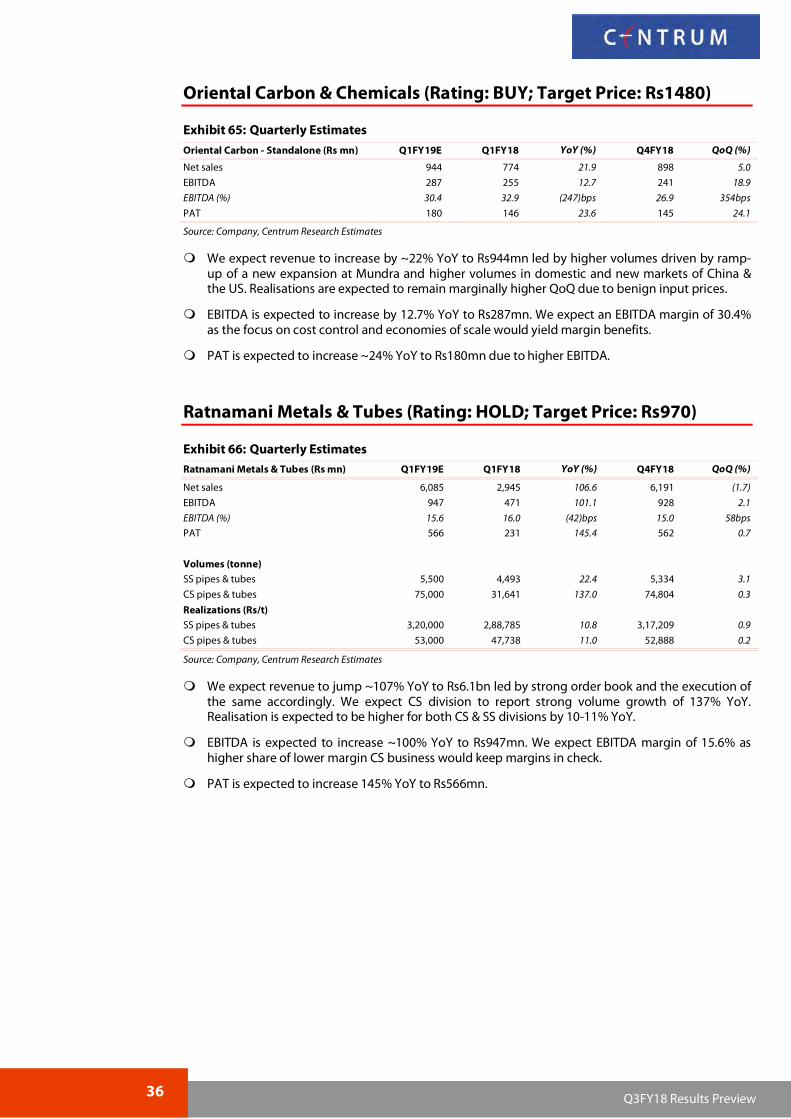
We expect revenue to increase by ~22% YoY to Rs944mn led by higher volumes driven by ramp-up of a new expansion at Mundra and higher volumes in domestic and new markets of China & the US. Realisations are expected to remain marginally higher QoQ due to benign input prices.
EBITDA is expected to increase by 12.7% YoY to Rs287mn. We expect an EBITDA margin of 30.4% as the focus on cost control and economies of scale would yield margin benefits.
PAT is expected to increase ~24% YoY to Rs180mn due to higher EBITDA.
We expect revenue to jump ~107% YoY to Rs6.1bn led by strong order book and the execution of the same accordingly. We expect CS division to report strong volume growth of 137% YoY. Realisation is expected to be higher for both CS & SS divisions by 10-11% YoY.
EBITDA is expected to increase ~100% YoY to Rs947mn. We expect EBITDA margin of 15.6% as higher share of lower margin CS business would keep margins in check.
Source: Company, Centrum Research Estimates *NM – Not Meaningful
We expect revenue to increase 33% YoY led by higher realisations (up 32% YoY). Volumes are expected to remain strong at 100kt, up 1.5% YoY.
EBITDA is expected to increase 57% YoY to Rs605mn, led by higher prices and volumes leading to better spreads. We expect coal costs to be higher QoQ led by uptick in global coal prices and iron ore prices also to be higher leading to partial negation in spread improvement.
We expect revenue to increase by 14% YoY led by higher realisation of both pig iron and ductile iron pipes. Volumes of pig iron are expected to be higher by 38% led by low base of last year whereas ductile iron pipe volumes would be lower YoY due to maintenance shutdowns.
EBITDA is expected to increase 45% YoY to Rs717mn led by higher realisations and various cost saving initiatives. We expect blended EBITDA/t to be at ~Rs6200/t.
We expect revenue to increase by 44% YoY led by higher volumes in both pig iron and castings division. Castings volumes are expected to see a large jump YoY due to higher demand from existing customers and addition of new customers. Higher realisation of both pig iron and castings would also aid revenue growth.
EBITDA is expected to increase ~237% YoY to Rs543mn led by strong volume growth and better spreads in pig iron business. We expect gross margins to improve to 37.6% vs 35% in Q4.
PAT is expected at Rs272mn, up 82% QoQ.
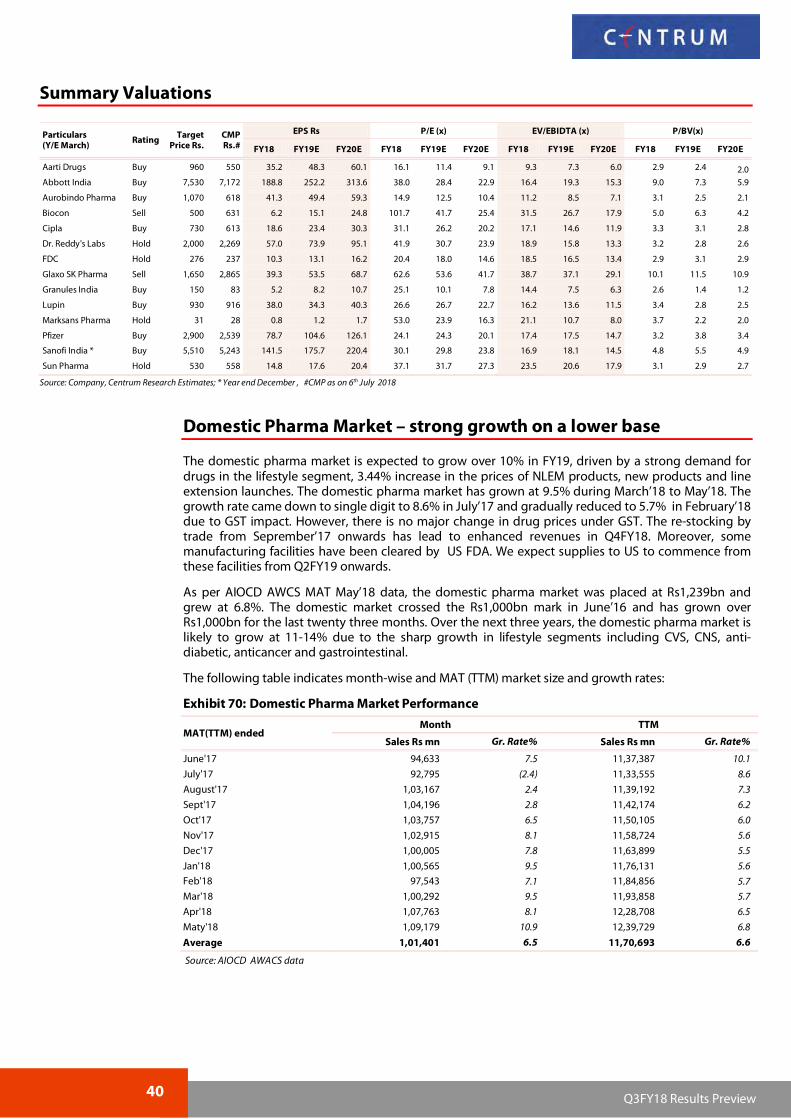
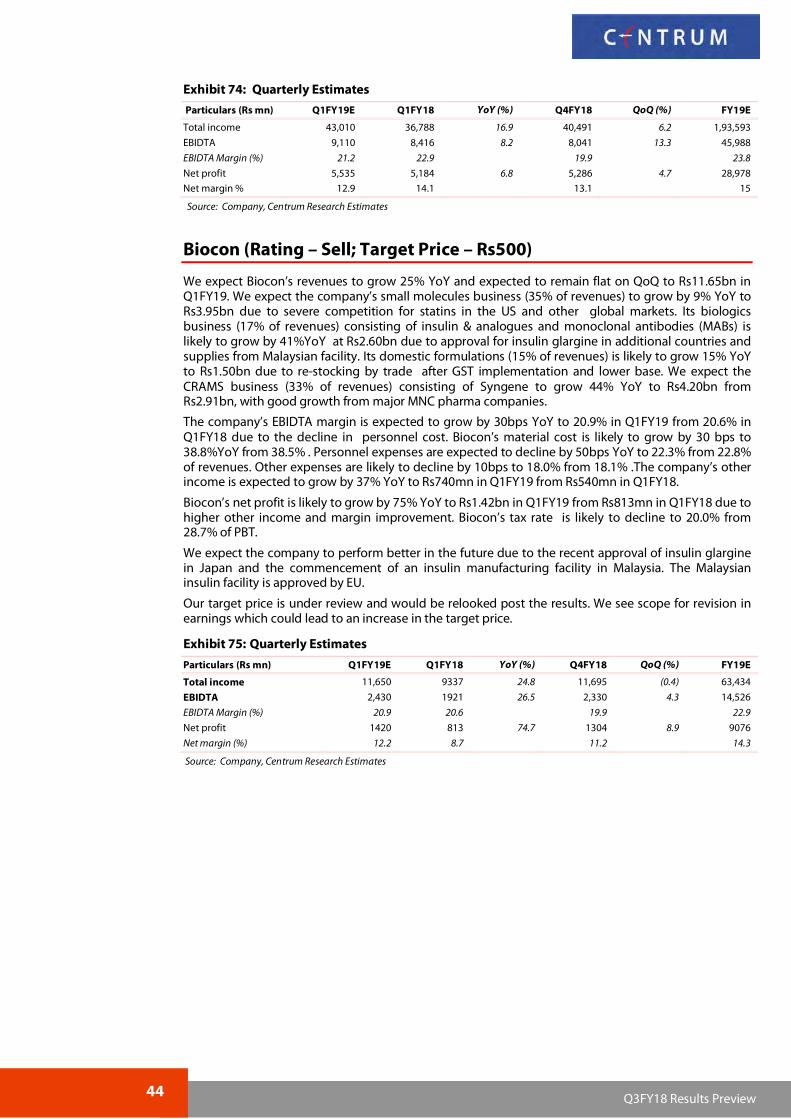
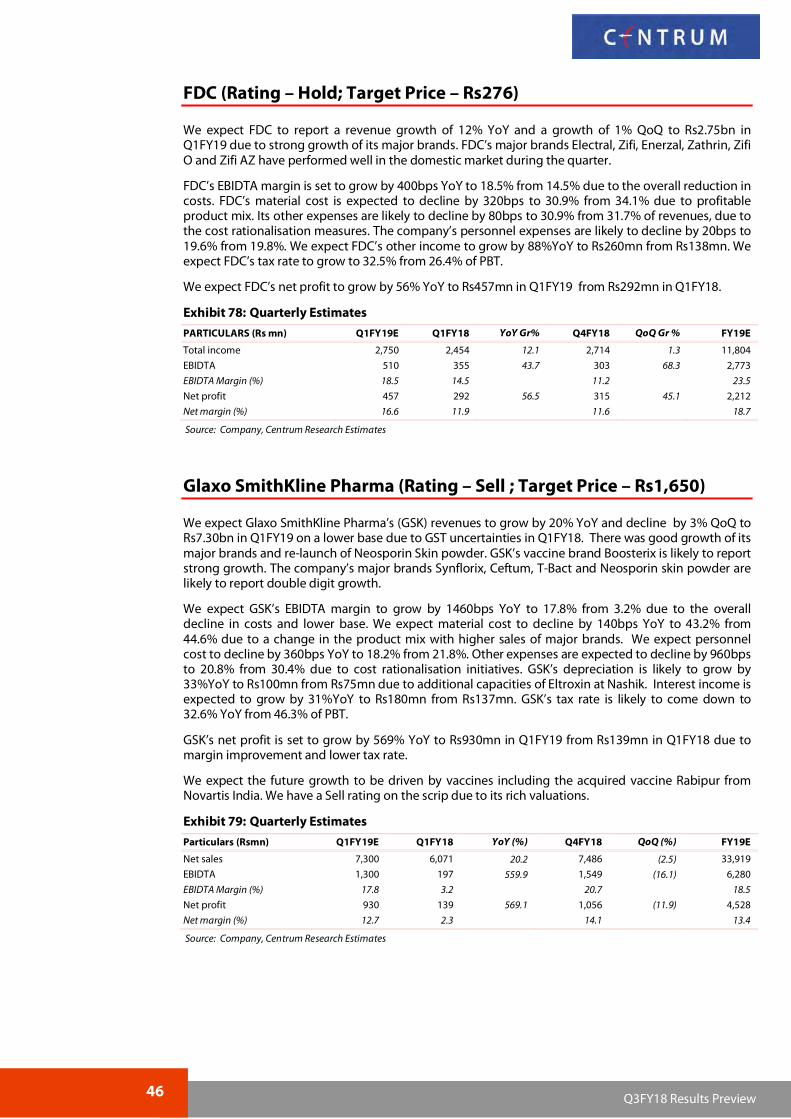
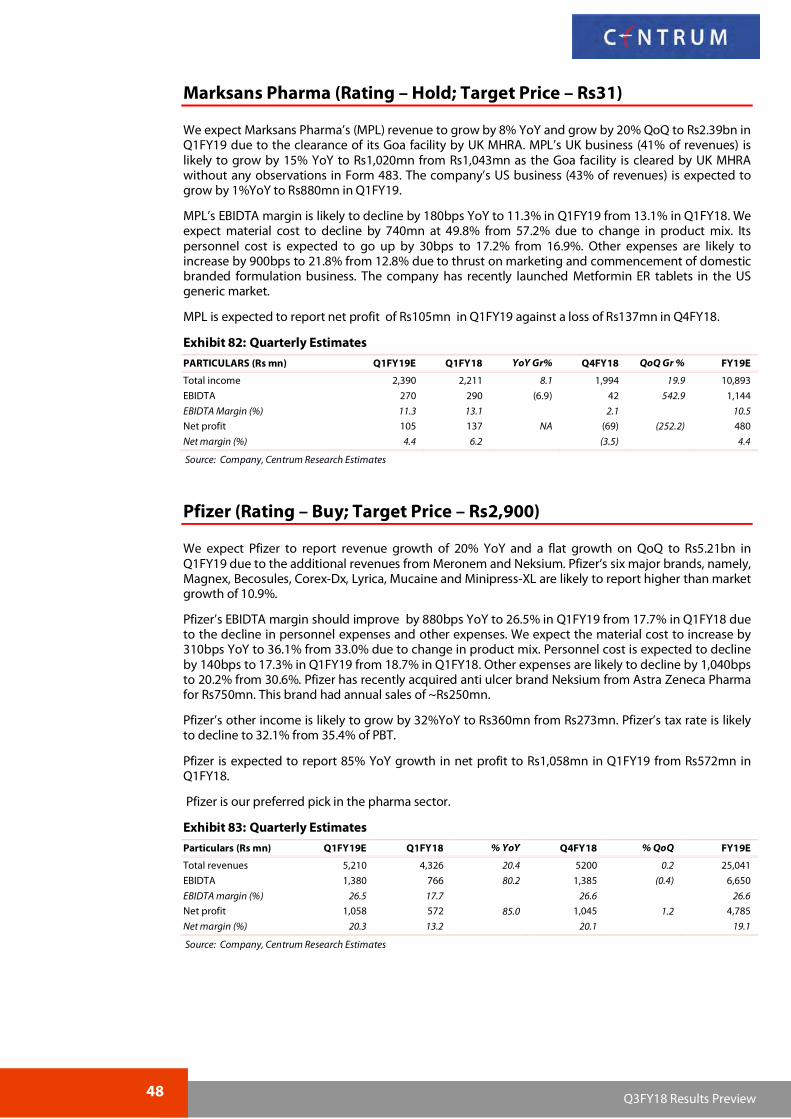
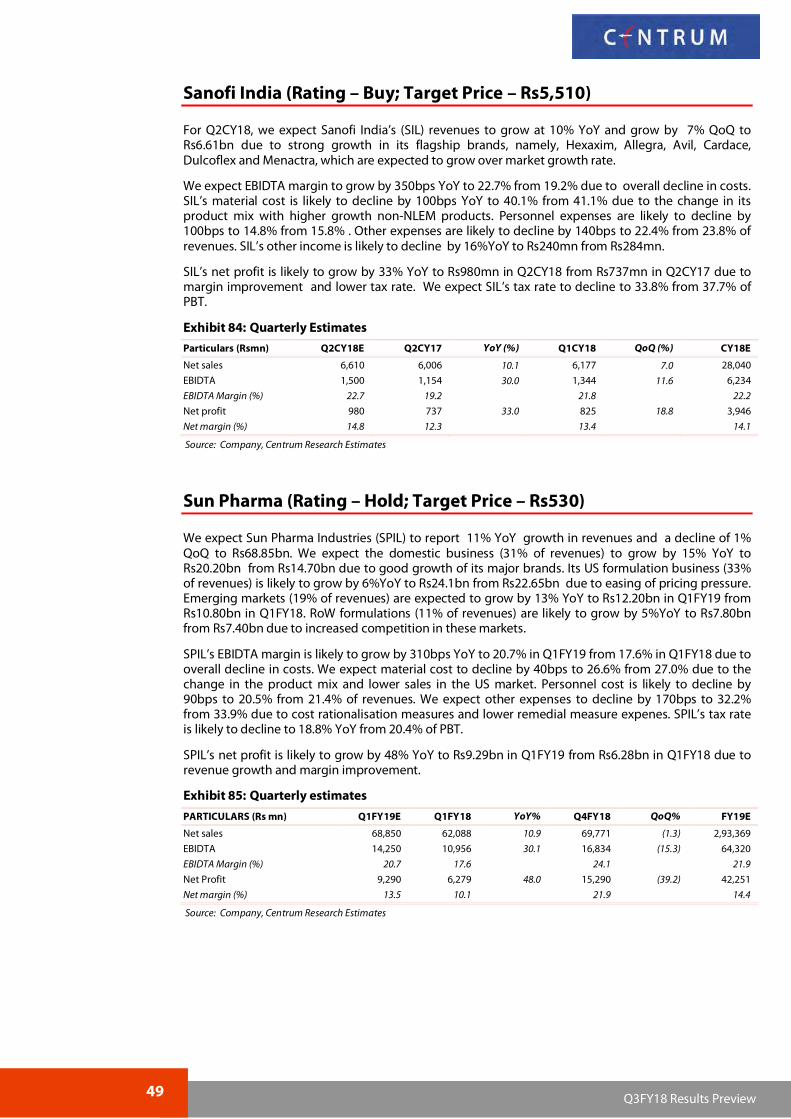
Growth at reasonable valuation We expect the pharma sector to report good results for Q1FY19 due to recovery in the domestic market and no major threat from price control as most of the leading brands are already under price control. The domestic market has recovered after successful implementation of GST. The 14 pharma companies under our coverage would post revenue/EBIDTA/net profit growth of 12%/24%/58% YoY in Q1FY19. We expect margins of these companies to improve by 190bps YoY to 19.1% in Q1FY19 from 17.2% in Q1FY18. We expect the pricing pressure in the US market to continue for another two quarters. Aurobindo Pharma (APL), Abbott India (AIL), Pfizer remain our top pharma picks. We expect positive surprises from Dr. Reddy’s Labs (DRL) and Glaxo SmithKline Pharma (GSK) and negative surprises from Cipla and Marksans Pharma (MPL). Domestic Pharma Market recovered after GST: As per AIOCD AWCS MAT data,
the domestic pharma market grew by ~9.5% during Q1FY19 after the sucessful GST implementation and low base in Q1FY18. The Government has revised the prices of NLEM products upwards by 3.44% in April’18 in line with WPI of 3.44% for FY18. That said, the price increase of up to 10% in non-NLEM products, volume growth and new product launches are likely to drive the domestic pharma market up by double-digit in FY19. .We expect the growth momentum to continue, driven by growing demand in lifestyle segments. The weakening of rupee by 4% against the dollar would help the Indian exporters with higher revenues.
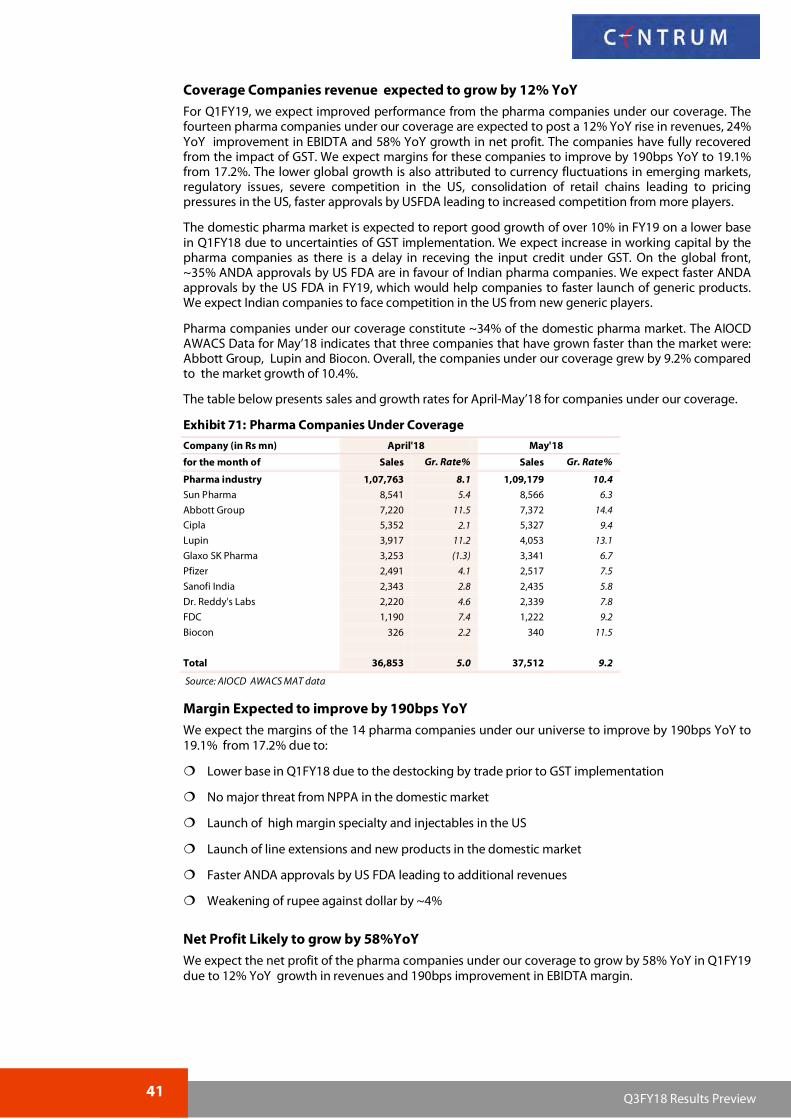
Companies Under Coverage to Report 12% Sales Growth: For Q1FY19, we expect our pharma universe to report 12% YoY growth in revenues, 24% growth in EBIDTA and 57% improvement in net profit. We expect EBIDTA margin to grow by 190bps YoY to 19.1% from 17.2% due to the strong revenue growth. Companies under our coverage constitute ~34% of the domestic market and were impacted by GST de-stocking in Q4FY19 resulting in a low base. We expect the US revenues of the companies to get impacted by pricing pressure in the US due to consolidation of distributors and faster ANDA approvals by US FDA leading to price erosion.
On the recovery path: The pharma sector has sailed through the uncertainty on the regulatory front, price decline in NLEM products, pricing pressure in the US and increased competition in the US generic market. Around 35% of Abbreviated New Drug Application (ANDA) approvals from USFDA are in favour of Indian companies which would help them gain additional market share in the US. The launch of complex generics and injectables in the US would also improve the profitability .
Recommendation and Key Risks: We expect pharma companies to report good growth in Q1FY19 in the domestic and global markets due to new product introductions, changes in lifestyles and enhanced exports. There is a shortage of several products in the US, especially injectables which would benefit Indian companies. APL, AIL and Pfizer remain our preferred picks in the pharma sector. Indian pharma sector is one of the most competitive sector globally. Key risks: 1) Appreciation of rupee against the dollar and 2) regulatory risks for manufacturing facilities.
Stock Price Performance (%)* Company Name 1 M 3M 6 M 1 Yr
Sun Pharma Hold 530 558 14.8 17.6 20.4 37.1 31.7 27.3 23.5 20.6 17.9 3.1 2.9 2.7
Source: Company, Centrum Research Estimates; * Year end December , #CMP as on 6th July 2018
Domestic Pharma Market – strong growth on a lower base
The domestic pharma market is expected to grow over 10% in FY19, driven by a strong demand for drugs in the lifestyle segment, 3.44% increase in the prices of NLEM products, new products and line extension launches. The domestic pharma market has grown at 9.5% during March’18 to May’18. The growth rate came down to single digit to 8.6% in July’17 and gradually reduced to 5.7% in February’18 due to GST impact. However, there is no major change in drug prices under GST. The re-stocking by trade from Seprember’17 onwards has lead to enhanced revenues in Q4FY18. Moreover, some manufacturing facilities have been cleared by US FDA. We expect supplies to US to commence from these facilities from Q2FY19 onwards.
As per AIOCD AWCS MAT May’18 data, the domestic pharma market was placed at Rs1,239bn and grew at 6.8%. The domestic market crossed the Rs1,000bn mark in June’16 and has grown over Rs1,000bn for the last twenty three months. Over the next three years, the domestic pharma market is likely to grow at 11-14% due to the sharp growth in lifestyle segments including CVS, CNS, anti-diabetic, anticancer and gastrointestinal.
The following table indicates month-wise and MAT (TTM) market size and growth rates:
Exhibit 70: Domestic Pharma Market Performance
MAT(TTM) ended Month TTM
Sales Rs mn Gr. Rate% Sales Rs mn Gr. Rate%
June'17 94,633 7.5 11,37,387 10.1
July'17 92,795 (2.4) 11,33,555 8.6
August'17 1,03,167 2.4 11,39,192 7.3
Sept'17 1,04,196 2.8 11,42,174 6.2
Oct'17 1,03,757 6.5 11,50,105 6.0
Nov'17 1,02,915 8.1 11,58,724 5.6
Dec'17 1,00,005 7.8 11,63,899 5.5
Jan'18 1,00,565 9.5 11,76,131 5.6
Feb'18 97,543 7.1 11,84,856 5.7
Mar'18 1,00,292 9.5 11,93,858 5.7
Apr'18 1,07,763 8.1 12,28,708 6.5
Maty'18 1,09,179 10.9 12,39,729 6.8
Average 1,01,401 6.5 11,70,693 6.6
Source: AIOCD AWACS data
41 Q3FY18 Results Preview
Coverage Companies revenue expected to grow by 12% YoY
For Q1FY19, we expect improved performance from the pharma companies under our coverage. The fourteen pharma companies under our coverage are expected to post a 12% YoY rise in revenues, 24% YoY improvement in EBIDTA and 58% YoY growth in net profit. The companies have fully recovered from the impact of GST. We expect margins for these companies to improve by 190bps YoY to 19.1% from 17.2%. The lower global growth is also attributed to currency fluctuations in emerging markets, regulatory issues, severe competition in the US, consolidation of retail chains leading to pricing pressures in the US, faster approvals by USFDA leading to increased competition from more players.
The domestic pharma market is expected to report good growth of over 10% in FY19 on a lower base in Q1FY18 due to uncertainties of GST implementation. We expect increase in working capital by the pharma companies as there is a delay in receving the input credit under GST. On the global front, ~35% ANDA approvals by US FDA are in favour of Indian pharma companies. We expect faster ANDA approvals by the US FDA in FY19, which would help companies to faster launch of generic products. We expect Indian companies to face competition in the US from new generic players.
Pharma companies under our coverage constitute ~34% of the domestic pharma market. The AIOCD AWACS Data for May’18 indicates that three companies that have grown faster than the market were: Abbott Group, Lupin and Biocon. Overall, the companies under our coverage grew by 9.2% compared to the market growth of 10.4%.
The table below presents sales and growth rates for April-May’18 for companies under our coverage.
Exhibit 71: Pharma Companies Under Coverage
Company (in Rs mn) April'18 May'18
for the month of Sales Gr. Rate% Sales Gr. Rate%
Pharma industry 1,07,763 8.1 1,09,179 10.4
Sun Pharma 8,541 5.4 8,566 6.3
Abbott Group 7,220 11.5 7,372 14.4
Cipla 5,352 2.1 5,327 9.4
Lupin 3,917 11.2 4,053 13.1
Glaxo SK Pharma 3,253 (1.3) 3,341 6.7
Pfizer 2,491 4.1 2,517 7.5
Sanofi India 2,343 2.8 2,435 5.8
Dr. Reddy's Labs 2,220 4.6 2,339 7.8
FDC 1,190 7.4 1,222 9.2
Biocon 326 2.2 340 11.5
Total 36,853 5.0 37,512 9.2
Source: AIOCD AWACS MAT data
Margin Expected to improve by 190bps YoY
We expect the margins of the 14 pharma companies under our universe to improve by 190bps YoY to 19.1% from 17.2% due to:
Lower base in Q1FY18 due to the destocking by trade prior to GST implementation
No major threat from NPPA in the domestic market
Launch of high margin specialty and injectables in the US
Launch of line extensions and new products in the domestic market
Faster ANDA approvals by US FDA leading to additional revenues
Weakening of rupee against dollar by ~4%
Net Profit Likely to grow by 58%YoY
We expect the net profit of the pharma companies under our coverage to grow by 58% YoY in Q1FY19 due to 12% YoY growth in revenues and 190bps improvement in EBIDTA margin.
42 Q3FY18 Results Preview
Top Picks
Aurobindo Pharma (APL), Abbott India (AIL) and Pfizer are our top picks in the pharma sector. We expect these companies to report superior results in the long-term. We expect positive surpises from Dr. Reddy’s Labs (DRL) and Glaxo SK Pharma (GSK) and negative surprises for Cipla and Marksans Pharma (MPL).
Global Pharma Market – Out of Regulatory Issues
Indian generic manufacturers cater to ~40% of the US’ generic demand by volume and are likely to benefit from the strong growth of generics in the US market. Indian pharma companies account for ~35% ANDA approvals by US FDA. The continuous introduction of generic products and specialty products in the US market is likely to drive future growth. Alembic, Ajanta Pharma, Aurobindo, Biocon, Cipla, Divis Labs, Dr. Reddy’s Labs (DRL), Glenmark Pharma, Granules India, Ipca Labs, Lupin, Marksans Pharma, Natco Pharma, Strides Arcolab, SPIL and Zydus Cadila are the pharma companies likely to benefit from the US’ generic market. However, some major pharma companies such as DRL, SPIL, Wockhardt, Ipca Labs and Lupin are facing regulatory issues with the US FDA. We expect these companies to resolve the pending 483s and invite US FDA for re-inspection during 2018. We expect some of these plants to get cleared by US FDA after successful re-inspection during 2018. The performance of these companies is likely to get impacted till their facilities are re-inspected and cleared by regulatory authorities.
Indian pharma companies have suffered due to the consolidation of distribution channels in the US to the extent of ~10% of their revenues. The major companies have migrated to specialty and difficult to manufacture products for the US market to protect their margins. The faster ANDA approvals by US FDA has led to entry of new players in the US generic market leading to higher competition and price erosion. In the absence of any major product approval, the revenues from the US generic market are likely to be subdued in Q1FY19. In the emerging markets, Indian pharma companies have suffered due to currency fluctuations and lower purchasing power. Hence, the generic manufacturers suffer from pricing pressure, regulatory challenges, entry of new players , currency fluctuations and lower purchasing power. However, the recent depreciation of rupee by 4% against the dollar would improve the revenues.
Our TPs are based on March’20E EPS/ December’19E EPS for the companies under our coverage.
Aarti Drugs (Rating – Buy; Target Price – Rs960)
We expect Aarti Drugs’ (ADL) revenues to grow by 25%YoY and 4%QoQ to Rs3.45bn in Q1FY19. The strong revenue growth is attributed to the lower base in Q1FY18 due to uncertainties of GST. The company has resumed the manufacture of Ofloxacin, Norfloxacin and Levofloxacin at Tarapur facility which was damaged by the fire in the adjoining unit. ADL has been able to re-start the production of Ofloxacin and Norfloxacin after due repairs. The entire loss due to the fire and loss of profit have been insured. ADL is likely to generate ~14% of its revenues from the formulations business.
We expect ADL to report 440bps YoY improvement in EBIDTA margin to 17.2% from 12.8% mainly due to the decline in personnel cost and other expenses. ADL’s material cost is expected to increase by 380bps to 62.3% from 58.5% of revenues due to the rise in prices of crude based chemicals. Other expenses are likely to decline by 790bps YoY to 15.9% from 23.8%. We expect ADL’s tax rate to grow to 35.8% from 32.1% of PBT. The company’s net profit is likely to grow by 128% YoY to Rs260mn from Rs114mn.
Exhibit 72: Quarterly Estimates
PARTICULARS (Rs mn) Q1FY19 E Q1FY18 YoY% Q4FY18 QoQ% FY19E
Net sales 3,450 2,772 24.5 3,307 4.3 14,769
EBIDTA 595 354 68.1 566 5.1 2,450
EBIDTA Margin (%) 17.2 12.8 17.1 16.6
Net profit 260 114 128.1 240 8.3 1,128
Net margin (%) 7.5 4.1 7.3 7.6
Source: Company, Centrum Research Estimates
43 Q3FY18 Results Preview
Abbott India (Rating – Buy; Target Price – Rs7,530)
We expect Abbott India’s (AIL) revenues to grow by 16% YoY and grow by 5% QoQ to Rs8.30bn in Q1FY19 mainly due to good growth of its flagship brands Thyronorm, Duphaston, Udiliv and Cremaffin. All these products have grown by over 13% against the domestic market growth of 10.9%. These brands are likely to drive future growth. The higher growth is also attributed to lower base in Q1FY18 due to GST uncertainties.
AIL’s EBIDTA margin is set to grow by 690bps YoY to 15.5% in Q1FY19 from 8.6% in Q1FY18 due to the decline in material cost and personnel expenses. We expect the material cost to decline by 680bps YoY to 54.5% from 61.3% of revenues due to the change in the product mix and new product launches. AIL has launched 21 new products in FY18. We expect personnel expenses to decline by 20bps to 13.2% from 13.5% of revenues. AIL distributes Novo Nordisk’s range of anti-diabetes products in India and derives distribution margins from the same. AIL’s other income is expected to grow 13%YoY to Rs180mn from Rs159mn from treasury operations. The company’s tax rate is expected to grow to 34.3% from 34.0% of PBT.
AIL’s net profit is likely to grow by 91% YoY to Rs920mn in Q1FY19 from Rs482mn in Q1FY18 led by higher revenues , margin improvement and higher other income.
We expect the company to report superior performance in FY19, driven by its strong brands, new product launches, entry into vaccines business and marketing thrust. AIL has launched 21 new products in FY18 and these are likely to drive future growth.
We expect Aurobindo Pharma’s (APL) revenues to grow by 17% YoY and grow by 6% QoQ to Rs43.01bn in Q1FY19. Its high-margin formulation business (81% of revenues) should grow at 13% YoY to Rs34.60bn due to new product launches in the US generic market and good growth in the EU markets. The low-margin API business (19% of revenues) is set to grow at 34% YoY and grow at 5% on a QoQ basis to Rs8.40bn.
The company’s EBIDTA margin is expected to decline by 170bps YoY to 21.2% in Q1FY19 from 22.9% in Q1FY18, mainly due to the pricing pressure in the US market. We expect material cost to decline 50bps to 40.2% from 40.7% due to the change in the product mix with higher sales of injectables. We expect personnel expenses to increase by 40bps to 13.7% from 13.4% due to additional manpower and Portugal acquisition. Other expenses would increase by 180bps to 24.9% from 23.1%.
We expect APL’s net profit to grow by 7% YoY to Rs5.53bn in Q1FY19 from Rs5.18bn in Q1FY18, due to higher other income. We expect 36%YoY rise in other income to Rs300mn from Rs221mn. We expect APL’s tax rate to decline to 25.6% from 27.0% of PBT.
We expect the company to report impressive performance in the US market in FY19 due to its rich product pipeline and pending ANDAs with the US FDA. The acquired Actavis in Europe has been turned around and has become profitable. The acquired Natrol business in the US is well-integrated.
The company’s injectables business could show good growth in the US due to additional approvals expected in FY19. We expect the ARV and controlled substance businesses to report good performance. We expect the growth momentum to continue in FY19 as the company has plans to launch several new products in the US market and consolidation in the Portugal market.
Total income 43,010 36,788 16.9 40,491 6.2 1,93,593
EBIDTA 9,110 8,416 8.2 8,041 13.3 45,988
EBIDTA Margin (%) 21.2 22.9 19.9 23.8
Net profit 5,535 5,184 6.8 5,286 4.7 28,978
Net margin % 12.9 14.1 13.1 15
Source: Company, Centrum Research Estimates
Biocon (Rating – Sell; Target Price – Rs500)
We expect Biocon’s revenues to grow 25% YoY and expected to remain flat on QoQ to Rs11.65bn in Q1FY19. We expect the company’s small molecules business (35% of revenues) to grow by 9% YoY to Rs3.95bn due to severe competition for statins in the US and other global markets. Its biologics business (17% of revenues) consisting of insulin & analogues and monoclonal antibodies (MABs) is likely to grow by 41%YoY at Rs2.60bn due to approval for insulin glargine in additional countries and supplies from Malaysian facility. Its domestic formulations (15% of revenues) is likely to grow 15% YoY to Rs1.50bn due to re-stocking by trade after GST implementation and lower base. We expect the CRAMS business (33% of revenues) consisting of Syngene to grow 44% YoY to Rs4.20bn from Rs2.91bn, with good growth from major MNC pharma companies.
The company’s EBIDTA margin is expected to grow by 30bps YoY to 20.9% in Q1FY19 from 20.6% in Q1FY18 due to the decline in personnel cost. Biocon’s material cost is likely to grow by 30 bps to 38.8%YoY from 38.5% . Personnel expenses are expected to decline by 50bps YoY to 22.3% from 22.8% of revenues. Other expenses are likely to decline by 10bps to 18.0% from 18.1% .The company’s other income is expected to grow by 37% YoY to Rs740mn in Q1FY19 from Rs540mn in Q1FY18.
Biocon’s net profit is likely to grow by 75% YoY to Rs1.42bn in Q1FY19 from Rs813mn in Q1FY18 due to higher other income and margin improvement. Biocon’s tax rate is likely to decline to 20.0% from 28.7% of PBT.
We expect the company to perform better in the future due to the recent approval of insulin glargine in Japan and the commencement of an insulin manufacturing facility in Malaysia. The Malaysian insulin facility is approved by EU.
Our target price is under review and would be relooked post the results. We see scope for revision in earnings which could lead to an increase in the target price.
We expect Cipla’s revenues to grow 7% YoY and grow by 2% QoQ to Rs37.70bn in Q1FY19 due to the re-stocking by trade in the domestic market and good growth in the US generic market. We expect Cipla’s domestic business (38% of revenues) to grow at 14% YoY to Rs14.50bn in Q1FY19 from Rs12.71bn in Q1FY18 on a lower base and due to re-stocking by trade after GST implementation. The company’s N. America business (17% of revenues) is likely to grow by 5% YoY to Rs6.80bn due to pricing pressure in the US market. Cipla’s S.Africa business (21% of revenues) is expected to grow by 7% YoY to Rs8.00bn. The company’s emerging market business (11% of revenues) could decline by 7% YoY due to lower purchasing power. Export of API (5% of revenues) is expected to grow by 8% YoY to Rs1.40bn from Rs1.30bn.
We expect Cipla’s EBIDTA margin to grow by 70bps YoY to 19.0% in Q1FY19 from 18.3% in Q1FY18. We expect its material cost to grow by 40bps YoY to 33.7% from 33.4%. Personnel expenses are expected to decline by 110bps YoY to 18.0% from 19.1%. Other expenses are likely to increase by 10bps to 29.3% from 29.4% . Cipla’s tax rate is likely to decline to 16.8% from 23.5% of PBT. Cipla’s interest cost is likely to go up by 22%YoY to Rs340mn from Rs279mn.
The company’s net profit is expected to decline by 13%YoY to Rs3.72bn in Q1FY19 from Rs4.25bn in Q1FY18 due to margin improvement and lower tax rate.
Dr. Reddy’s Labs (Rating – Hold; Target Price – Rs2,000)
We expect Dr. Reddy’s Labs (DRL) to report 8%YoY revenue growth and a growth of 2% QoQ to Rs36.10bn in Q1FY19 on a lower base. Its global generic business (76% of revenues) is expected to grow by 3% YoY and grow by 1% QoQ to Rs28.20bn due to strong growth in India. We expect DRL’s PSAI business (17% of revenues) to grow by 38% YoY and grow by 2% QoQ to Rs6.40bn.
We expect DRL’s EBIDTA margin to grow by 610bps YoY to 15.8% in Q1FY19 from 9.7% in Q1FY18. DRL’s material cost is likely to decline by 80bps to 28.0% YoY due to the change in product mix. The company’s personnel expenses are likely to decline by 70bps to 23.5%. Other expenses are likely to decline by 450bps to 32.8% from 37.3% due to lower remedial measure expenses. DRL’s tax rate is likely to decline to 14.1% from 29.4% of PBT.
DRL’s net profit should grow by 322% YoY to Rs2.81bn in Q1FY19 from Rs666mn due to moderate sales growth and margin improvement on a lower base.
Net sales 36,100 33,332 8.3 35,539 1.6 1,53,176 (76.4)
EBIDTA 5,690 3,232 76.1 5,636 1.0 26,556 (78.6)
EBIDTA margin % 15.8 9.7
15.9
17.3
Net profit 2,810 666 321.9 2,721 3.3 12,266 (77.1)
Net margin (%) 7.8 2.0
7.7
8.0
Source: Company, Centrum Research Estimates
46 Q3FY18 Results Preview
FDC (Rating – Hold; Target Price – Rs276)
We expect FDC to report a revenue growth of 12% YoY and a growth of 1% QoQ to Rs2.75bn in Q1FY19 due to strong growth of its major brands. FDC’s major brands Electral, Zifi, Enerzal, Zathrin, Zifi O and Zifi AZ have performed well in the domestic market during the quarter.
FDC’s EBIDTA margin is set to grow by 400bps YoY to 18.5% from 14.5% due to the overall reduction in costs. FDC’s material cost is expected to decline by 320bps to 30.9% from 34.1% due to profitable product mix. Its other expenses are likely to decline by 80bps to 30.9% from 31.7% of revenues, due to the cost rationalisation measures. The company’s personnel expenses are likely to decline by 20bps to 19.6% from 19.8%. We expect FDC’s other income to grow by 88%YoY to Rs260mn from Rs138mn. We expect FDC’s tax rate to grow to 32.5% from 26.4% of PBT.
We expect FDC’s net profit to grow by 56% YoY to Rs457mn in Q1FY19 from Rs292mn in Q1FY18.
We expect Glaxo SmithKline Pharma’s (GSK) revenues to grow by 20% YoY and decline by 3% QoQ to Rs7.30bn in Q1FY19 on a lower base due to GST uncertainties in Q1FY18. There was good growth of its major brands and re-launch of Neosporin Skin powder. GSK’s vaccine brand Boosterix is likely to report strong growth. The company’s major brands Synflorix, Ceftum, T-Bact and Neosporin skin powder are likely to report double digit growth.
We expect GSK’s EBIDTA margin to grow by 1460bps YoY to 17.8% from 3.2% due to the overall decline in costs and lower base. We expect material cost to decline by 140bps YoY to 43.2% from 44.6% due to a change in the product mix with higher sales of major brands. We expect personnel cost to decline by 360bps YoY to 18.2% from 21.8%. Other expenses are expected to decline by 960bps to 20.8% from 30.4% due to cost rationalisation initiatives. GSK’s depreciation is likely to grow by 33%YoY to Rs100mn from Rs75mn due to additional capacities of Eltroxin at Nashik. Interest income is expected to grow by 31%YoY to Rs180mn from Rs137mn. GSK’s tax rate is likely to come down to 32.6% YoY from 46.3% of PBT.
GSK’s net profit is set to grow by 569% YoY to Rs930mn in Q1FY19 from Rs139mn in Q1FY18 due to margin improvement and lower tax rate.
We expect the future growth to be driven by vaccines including the acquired vaccine Rabipur from Novartis India. We have a Sell rating on the scrip due to its rich valuations.
Granules India (Rating – Buy; Target Price – Rs150)
We expect Granules India’s (GIL) revenues to grow by 32% YoY and remain flat on QoQ to Rs5.06bn in Q1FY19. The expected sales composition would be as follows: API 39%, PFI 21% and finished dosages 40%.
We expect GIL’s EBIDTA margin to decline by 440bps YoY to 15.4% in Q1FY19 from 19.8% in Q1FY18 due to the rise in material cost. We expect material cost to increase by 1,010bps to 56.9% from 46.8% due to the rise in cost of crude based chemicals. We expect personnel cost to decline by 200bps to 8.1%. Other expenses are expected to decline by 370bps to 19.6% from 23.3% due to cost rationalisation measures. GIL’s other income is expected to grow by 746%YoY to Rs110mn from Rs13mn.
GIL’s net profit is set to grow by 20% YoY to Rs440mn in Q1FY19 from Rs368mn in Q1FY18 due to margin improvement. We expect GIL’s depreciation to grow by 19%YoY to Rs210mn from Rs176mn.
We expect GIL’s future growth to be driven by the approval of Ibuprofen tablets of strengths 400mg, 600mg and 800mg from the USFDA and marketing of Omeprazole and sodium bicarbonate OTC capsules in the US market and supply of anti HIV API Abacavir. We expect Omnichem JV to report better performance as the Vizag facility is approved by US FDA.
We expect Lupin’s revenues to grow by 7% YoY and grow by 2%QoQ to Rs41.20bn in Q1FY19. Its domestic business (25% of its revenues) is expected to grow by 12% YoY to Rs10.40bn in Q4FY18 from Rs9.32bn in Q1FY18 due to good growth of its major brands. We expect the US formulation businesses (37% of revenues) to decline by 5% YoY to Rs15.20bn from Rs16.02bn due to the pricing pressure in the US market and entry of new players. Lupin’s Asia Pacific formulations (18% of revenues) are expected to grow 14% YoY to Rs6.80bn due to good growth in Japan.
We expect Lupin’s EBIDTA margin to decline by 270bps YoY to 17.2% in Q1FY19 from 19.9% in Q1FY18 due to an increase in material cost and other expenses. The company’s material cost is likely to grow by 260bps to 33.5% from 31.9% due to a change in its product mix with lower sales from N. America. Its personnel expenses are expected to decline by 20bps to 18.4%. Other expenses are likely to increase by 110bps to 30.8% from 29.7% due to the increase in remedial cost.
Lupin’s net profit would grow by 3% YoY to Rs3.68bn in Q1FY19 from Rs3.57bn in Q1FY18. We expect Lupin’s tax rate to decline to 26.2%YoY to 27.8%. We expect Lupin to benefit from the strong product pipeline for the US generic market.
We expect Marksans Pharma’s (MPL) revenue to grow by 8% YoY and grow by 20% QoQ to Rs2.39bn in Q1FY19 due to the clearance of its Goa facility by UK MHRA. MPL’s UK business (41% of revenues) is likely to grow by 15% YoY to Rs1,020mn from Rs1,043mn as the Goa facility is cleared by UK MHRA without any observations in Form 483. The company’s US business (43% of revenues) is expected to grow by 1%YoY to Rs880mn in Q1FY19.
MPL’s EBIDTA margin is likely to decline by 180bps YoY to 11.3% in Q1FY19 from 13.1% in Q1FY18. We expect material cost to decline by 740mn at 49.8% from 57.2% due to change in product mix. Its personnel cost is expected to go up by 30bps to 17.2% from 16.9%. Other expenses are likely to increase by 900bps to 21.8% from 12.8% due to thrust on marketing and commencement of domestic branded formulation business. The company has recently launched Metformin ER tablets in the US generic market.
MPL is expected to report net profit of Rs105mn in Q1FY19 against a loss of Rs137mn in Q4FY18.
We expect Pfizer to report revenue growth of 20% YoY and a flat growth on QoQ to Rs5.21bn in Q1FY19 due to the additional revenues from Meronem and Neksium. Pfizer’s six major brands, namely, Magnex, Becosules, Corex-Dx, Lyrica, Mucaine and Minipress-XL are likely to report higher than market growth of 10.9%.
Pfizer’s EBIDTA margin should improve by 880bps YoY to 26.5% in Q1FY19 from 17.7% in Q1FY18 due to the decline in personnel expenses and other expenses. We expect the material cost to increase by 310bps YoY to 36.1% from 33.0% due to change in product mix. Personnel cost is expected to decline by 140bps to 17.3% in Q1FY19 from 18.7% in Q1FY18. Other expenses are likely to decline by 1,040bps to 20.2% from 30.6%. Pfizer has recently acquired anti ulcer brand Neksium from Astra Zeneca Pharma for Rs750mn. This brand had annual sales of ~Rs250mn.
Pfizer’s other income is likely to grow by 32%YoY to Rs360mn from Rs273mn. Pfizer’s tax rate is likely to decline to 32.1% from 35.4% of PBT.
Pfizer is expected to report 85% YoY growth in net profit to Rs1,058mn in Q1FY19 from Rs572mn in Q1FY18.
Pfizer is our preferred pick in the pharma sector.
Sanofi India (Rating – Buy; Target Price – Rs5,510)
For Q2CY18, we expect Sanofi India’s (SIL) revenues to grow at 10% YoY and grow by 7% QoQ to Rs6.61bn due to strong growth in its flagship brands, namely, Hexaxim, Allegra, Avil, Cardace, Dulcoflex and Menactra, which are expected to grow over market growth rate.
We expect EBIDTA margin to grow by 350bps YoY to 22.7% from 19.2% due to overall decline in costs. SIL’s material cost is likely to decline by 100bps YoY to 40.1% from 41.1% due to the change in its product mix with higher growth non-NLEM products. Personnel expenses are likely to decline by 100bps to 14.8% from 15.8% . Other expenses are likely to decline by 140bps to 22.4% from 23.8% of revenues. SIL’s other income is likely to decline by 16%YoY to Rs240mn from Rs284mn.
SIL’s net profit is likely to grow by 33% YoY to Rs980mn in Q2CY18 from Rs737mn in Q2CY17 due to margin improvement and lower tax rate. We expect SIL’s tax rate to decline to 33.8% from 37.7% of PBT.
We expect Sun Pharma Industries (SPIL) to report 11% YoY growth in revenues and a decline of 1% QoQ to Rs68.85bn. We expect the domestic business (31% of revenues) to grow by 15% YoY to Rs20.20bn from Rs14.70bn due to good growth of its major brands. Its US formulation business (33% of revenues) is likely to grow by 6%YoY to Rs24.1bn from Rs22.65bn due to easing of pricing pressure. Emerging markets (19% of revenues) are expected to grow by 13% YoY to Rs12.20bn in Q1FY19 from Rs10.80bn in Q1FY18. RoW formulations (11% of revenues) are likely to grow by 5%YoY to Rs7.80bn from Rs7.40bn due to increased competition in these markets.
SPIL’s EBIDTA margin is likely to grow by 310bps YoY to 20.7% in Q1FY19 from 17.6% in Q1FY18 due to overall decline in costs. We expect material cost to decline by 40bps to 26.6% from 27.0% due to the change in the product mix and lower sales in the US market. Personnel cost is likely to decline by 90bps to 20.5% from 21.4% of revenues. We expect other expenses to decline by 170bps to 32.2% from 33.9% due to cost rationalisation measures and lower remedial measure expenes. SPIL’s tax rate is likely to decline to 18.8% YoY from 20.4% of PBT.
SPIL’s net profit is likely to grow by 48% YoY to Rs9.29bn in Q1FY19 from Rs6.28bn in Q1FY18 due to revenue growth and margin improvement.
We expect sales to decline by 1.4% YoY to Rs780mn on the back of closure of Sarla Flex in Q3FY18. Domestic business is expected to grow by double digit.
We expect company to report operating profit of Rs175mn, up 11.5% YoY with margins expanding to 22.4%, up 259bps.
Centrum Broking Limited (“Centrum”) is a full-service, Stock Broking Company and a member of The Stock Exchange, Mumbai (BSE) and National Stock Exchange of India Ltd. (NSE). Our holding company, Centrum Capital Ltd, is an investment banker and an underwriter of securities. As a group Centrum has Investment Banking, Advisory and other business relationships with a significant percentage of the companies covered by our Research Group. Our research professionals provide important inputs into the Group's Investment Banking and other business selection processes.
Recipients of this report should assume that our Group is seeking or may seek or will seek Investment Banking, advisory, project finance or other businesses and may receive commission, brokerage, fees or other compensation from the company or companies that are the subject of this material/report. Our Company and Group companies and their officers, directors and employees, including the analysts and others involved in the preparation or issuance of this material and their dependants, may on the date of this report or from, time to time have "long" or "short" positions in, act as principal in, and buy or sell the securities or derivatives thereof of companies mentioned herein. Centrum or its affiliates do not own 1% or more in the equity of this company Our sales people, dealers, traders and other professionals may provide oral or written market commentary or trading strategies to our clients that reflect opinions that are contrary to the opinions expressed herein, and our proprietary trading and investing businesses may make investment decisions that are inconsistent with the recommendations expressed herein. We may have earlier issued or may issue in future reports on the companies covered herein with recommendations/ information inconsistent or different those made in this report. In reviewing this document, you should be aware that any or all of the foregoing, among other things, may give rise to or potential conflicts of interest. We and our Group may rely on information barriers, such as "Chinese Walls" to control the flow of information contained in one or more areas within us, or other areas, units, groups or affiliates of Centrum. Centrum or its affiliates do not make a market in the security of the company for which this report or any report was written. Further, Centrum or its affiliates did not make a market in the subject company’s securities at the time that the research report was published.
This report is for information purposes only and this document/material should not be construed as an offer to sell or the solicitation of an offer to buy, purchase or subscribe to any securities, and neither this document nor anything contained herein shall form the basis of or be relied upon in connection with any contract or commitment whatsoever. This document does not solicit any action based on the material contained herein. It is for the general information of the clients of Centrum. Though disseminated to clients simultaneously, not all clients may receive this report at the same time. Centrum will not treat recipients as clients by virtue of their receiving this report. It does not constitute a personal recommendation or take into account the particular investment objectives, financial situations, or needs of individual clients. Similarly, this document does not have regard to the specific investment objectives, financial situation/circumstances and the particular needs of any specific person who may receive this document. The securities discussed in this report may not be suitable for all investors. The securities described herein may not be eligible for sale in all jurisdictions or to all categories of investors. The countries in which the companies mentioned in this report are organized may have restrictions on investments, voting rights or dealings in securities by nationals of other countries. The appropriateness of a particular investment or strategy will depend on an investor's individual circumstances and objectives. Persons who may receive this document should consider and independently evaluate whether it is suitable for his/ her/their particular circumstances and, if necessary, seek professional/financial advice. Any such person shall be responsible for conducting his/her/their own investigation and analysis of the information contained or referred to in this document and of evaluating the merits and risks involved in the securities forming the subject matter of this document.
The projections and forecasts described in this report were based upon a number of estimates and assumptions and are inherently subject to significant uncertainties and contingencies. Projections and forecasts are necessarily speculative in nature, and it can be expected that one or more of the estimates on which the projections and forecasts were based will not materialize or will vary significantly from actual results, and such variances will likely increase over time. All projections and forecasts described in this report have been prepared solely by the authors of this report independently of the Company. These projections and forecasts were not prepared with a view toward compliance with published guidelines or generally accented accounting principles. No independent accountants have expressed an opinion or any other form of assurance on these projections or forecasts. You should not regard the inclusion of the projections and forecasts described herein as a representation or warranty by or on behalf of the Company, Centrum, the authors of this report or any other person that these projections or forecasts or their underlying assumptions will be achieved. For these reasons, you should only consider the projections and forecasts described in this report after carefully evaluating all of the information in this report, including the assumptions underlying such projections and forecasts.
The price and value of the investments referred to in this document/material and the income from them may go down as well as up, and investors may realize losses on any investments. Past performance is not a guide for future performance. Future returns are not guaranteed and a loss of original capital may occur. Actual results may differ materially from those set forth in projections. Forward-looking statements are not predictions and may be subject to change without notice. Centrum does not provide tax advice to its clients, and all investors are strongly advised to consult regarding any potential investment. Centrum and its affiliates accept no liabilities for any loss or damage of any kind arising out of the use of this report. Foreign currencies denominated securities are subject to fluctuations in exchange rates that could have an adverse effect on the value or price of or income derived from the investment. In addition, investors in securities such as ADRs, the value of which are influenced by foreign currencies effectively assume currency risk. Certain transactions including those involving futures, options, and other derivatives as well as non-investment-grade securities give rise to substantial risk and are not suitable for all investors. Please ensure that you have read and understood the current risk disclosure documents before entering into any derivative transactions.
This report/document has been prepared by Centrum, based upon information available to the public and sources, believed to be reliable. No representation or warranty, express or implied is made that it is accurate or complete. Centrum has reviewed the report and, in so far as it includes current or historical information, it is believed to be reliable, although its accuracy and completeness cannot be guaranteed. The opinions expressed in this document/material are subject to change without notice and have no obligation to tell you when opinions or information in this report change.
This report or recommendations or information contained herein do/does not constitute or purport to constitute investment advice in publicly accessible media and should not be reproduced, transmitted or published by the recipient. The report is for the use and consumption of the recipient only. This publication may not be distributed to the public used by the public media without the express written consent of Centrum. This report or any portion hereof may not be printed, sold or distributed without the written consent of Centrum.
The distribution of this document in other jurisdictions may be restricted by law, and persons into whose possession this document comes should inform themselves about, and observe, any such restrictions. Neither Centrum nor its directors, employees, agents or representatives shall be liable for any damages whether direct or indirect, incidental, special or consequential including lost revenue or lost profits that may arise from or in connection with the use of the information.
This document does not constitute an offer or invitation to subscribe for or purchase or deal in any securities and neither this document nor anything contained herein shall form the basis of any contract or commitment whatsoever. This document is strictly confidential and is being furnished to you solely for your information, may not be distributed to the press or other media and may not be reproduced or redistributed to any other person. The distribution of this report in other jurisdictions may be restricted by law and persons into whose possession this report comes should inform themselves about, and observe any such restrictions. By accepting this report, you agree to be bound by the fore going limitations. No representation is made that this report is accurate or complete.
54
Q4FY28 Results Preview
The opinions and projections expressed herein are entirely those of the author and are given as part of the normal research activity of Centrum Broking and are given as of this date and are subject to change without notice. Any opinion estimate or projection herein constitutes a view as of the date of this report and there can be no assurance that future results or events will be consistent with any such opinions, estimate or projection.
This document has not been prepared by or in conjunction with or on behalf of or at the instigation of, or by arrangement with the company or any of its directors or any other person. Information in this document must not be relied upon as having been authorized or approved by the company or its directors or any other person. Any opinions and projections contained herein are entirely those of the authors. None of the company or its directors or any other person accepts any liability whatsoever for any loss arising from any use of this document or its contents or otherwise arising in connection therewith.
Centrum and its affiliates have not managed or co-managed a public offering for the subject company in the preceding twelve months. Centrum and affiliates have not received compensation from the companies mentioned in the report during the period preceding twelve months from the date of this report for service in respect of public offerings, corporate finance, debt restructuring, investment banking or other advisory services in a merger/acquisition or some other sort of specific transaction.
As per the declarations given by research analyst and and/or any of their family members do not serve as an officer, director or any way connected to the company/companies mentioned in this report. Further, as declared by them, they have not received any compensation from the above companies in the preceding twelve months. They does not hold any shares by them or through their relatives or in case if holds the shares then will not to do any transactions in the said scrip for 30 days from the date of release such report. Our entire research professionals are our employees and are paid a salary. They do not have any other material conflict of interest of the research analyst or member of which the research analyst knows of has reason to know at the time of publication of the research report or at the time of the public appearance.
While we would endeavour to update the information herein on a reasonable basis, Centrum, its associated companies, their directors and employees are under no obligation to update or keep the information current. Also, there may be regulatory, compliance or other reasons that may prevent Centrum from doing so.
Non-rated securities indicate that rating on a particular security has been suspended temporarily and such suspension is in compliance with applicable regulations and/or Centrum policies, in circumstances where Centrum is acting in an advisory capacity to this company, or any certain other circumstances.
This report is not directed to, or intended for distribution to or use by, any person or entity who is a citizen or resident of or located in any locality, state, country or other jurisdiction where such distribution, publication, availability or use would be contrary to law or regulation or which would subject Centrum Broking Limited or its group companies to any registration or licensing requirement within such jurisdiction. Specifically, this document does not constitute an offer to or solicitation to any U.S. person for the purchase or sale of any financial instrument or as an official confirmation of any transaction to any U.S. person unless otherwise stated, this message should not be construed as official confirmation of any transaction. No part of this document may be distributed in Canada or used by private customers in United Kingdom.
The information contained herein is not intended for publication or distribution or circulation in any manner whatsoever and any unauthorized reading, dissemination, distribution or copying of this communication is prohibited unless otherwise expressly authorized. Please ensure that you have read “Risk Disclosure Document for Capital Market and Derivatives Segments” as prescribed by Securities and Exchange Board of India before investing in Indian Securities Market.
Hero MotoCorp price chart Bajaj Auto price chart TVS Motor price chart
Jul-15 Jan-16 Jul-16 Jan-17 Jul-17 Jan-18 Jul-18Granules India Ltd
58
Q4FY28 Results Preview
Disclosure of Interest Statement
1 Business activities of Centrum Broking Limited (CBL) Centrum Broking Limited (hereinafter referred to as “CBL”) is a registered member of NSE (Cash, F&O and Currency Derivatives Segments), MCX-SX (Currency Derivatives Segment) and BSE (Cash segment), Depository Participant of CDSL and a SEBI registered Portfolio Manager.
2 Details of Disciplinary History of CBL CBL has not been debarred/ suspended by SEBI or any other regulatory authority from accessing /dealing in securities market.
3 Registration status of CBL: CBL is registered with SEBI as a Research Analyst (SEBI Registration No. INH000001469) Ranjit Kapadia is registered with SEBI as Research Analyst (SEBI Registration No. INH000001352).
Pfizer price chart Sanofi India price chart Sun Pharma price chart
4 Whether Research analyst’s or relatives’ have any financial interest in the subject company and nature of such financial interest
No No No No No No
5 Whether Research analyst or relatives have actual / beneficial ownership of 1% or more in securities of the subject company at the end of the month immediately preceding the date of publication of the document.
No No No No No No
6 Whether the research analyst or his relatives has any other material conflict of interest
No No No No No No
7 Whether research analyst has received any compensation from the subject company in the past 12 months and nature of products / services for which such compensation is received
No No No No No No
8 Whether the Research Analyst has received any compensation or any other benefits from the subject company or third party in connection with the research report
No No No No No No
9 Whether Research Analysts has served as an officer, director or employee of the subject company
No No No No No No
10 Whether the Research Analyst has been engaged in market making activity of the subject company.
No No No No No No
Cement
ACC Ambuja Cement
JK Cements
JK Lakshmi
Orient Cement
Ramco Cements
Shree Cement
Star Ferro & Cement UltraTech Visaka
Industries Deccan
Cements
4 Whether Research analyst’s or relatives’ have any financial interest in the subject company and nature of such financial interest
No No No No No No No No No No No
5 Whether Research analyst or relatives have actual / beneficial ownership of 1% or more in securities of the subject company at the end of the month immediately preceding the date of publication of the document.
No No No No No No No No No No No
6 Whether the research analyst or his relatives has any other material conflict of interest No No No No No No No No No No No
7 Whether research analyst has received any compensation from the subject company in the past 12 months and nature of products / services for which such compensation is received
No No No No No No No No No No No
8 Whether the Research Analyst has received any compensation or any other benefits from the subject company or third party in connection with the research report
No No No No No No No No No No No
9 Whether Research Analysts has served as an officer, director or employee of the subject company No No No No No No No No No No No
10 Whether the Research Analyst has been engaged in market making activity of the subject company. No No No No No No No No No No No
Financials
Axis Bank ICICI Bank SBI CUBK DCB Bank
Karnataka Bank
M & M Financial SUF
GIC Housing
CARE Crisil Ujjivan Financial
LVB
4 Whether Research analyst’s or relatives’ have any financial interest in the subject company and nature of such financial interest No No No No No No No No No No No No No
5 Whether Research analyst or relatives have actual / beneficial ownership of 1% or more in securities of the subject company at the end of the month immediately preceding the date of publication of the document.
No No No No No No No No No No No No No
6 Whether the research analyst or his relatives has any other material conflict of interest
No No No No No No No No No No No No No
7 Whether research analyst has received any compensation from the subject company in the past 12 months and nature of products / services for which such compensation is received
No No No No No No No No No No No No No
8 Whether the Research Analyst has received any compensation or any other benefits from the subject company or third party in connection with the research report
No No No No No No No No No No No No No
9 Whether Research Analysts has served as an officer, director or employee of the subject company No No No No No No No No No No No No No
10 Whether the Research Analyst has been engaged in market making activity of the subject company. No No No No No No No No No No No No No
60
Q4FY28 Results Preview
Media
DB Corp Dish TV ENIL HT Media Info Edge Jagran Prakashan Sun TV Zee Ent
4 Whether Research analyst’s or relatives’ have any financial interest in the subject company and nature of such financial interest No No No No No No No No
5 Whether Research analyst or relatives have actual / beneficial ownership of 1% or more in securities of the subject company at the end of the month immediately preceding the date of publication of the document.
No No No No No No No No
6 Whether the research analyst or his relatives has any other material conflict of interest No No No No No No No No
7 Whether research analyst has received any compensation from the subject company in the past 12 months and nature of products / services for which such compensation is received
No No No No No No No No
8 Whether the Research Analyst has received any compensation or any other benefits from the subject company or third party in connection with the research report
No No No No No No No No
9 Whether Research Analysts has served as an officer, director or employee of the subject company No No No No No No No No
10 Whether the Research Analyst has been engaged in market making activity of the subject company. No No No No No No No No
Metals & Mining
Tata
Steel JSW Steel Kirloskar
Ferrous Hindalco Vesuvius
India IFGL
Refrac. Orient Refrac.
Tata Sponge
Hindustan Zinc
Graphite India
OCCL Orient Refrac
Tata Metaliks
4
Whether Research analyst’s or relatives’ have any financial interest in the subject company and nature of such financial interest
No No No No No No No No No No No No No
5
Whether Research analyst or relatives have actual / beneficial ownership of 1% or more in securities of the subject company at the end of the month immediately preceding the date of publication of the document.
No No No No No No No No No No No No No
6 Whether the research analyst or his relatives has any other material conflict of interest
No No No No No No No No No No No No No
7
Whether research analyst has received any compensation from the subject company in the past 12 months and nature of products / services for which such compensation is received
No No No No No No No No No No No No No
8
Whether the Research Analyst has received any compensation or any other benefits from the subject company or third party in connection with the research report
No No No No No No No No No No No No No
9 Whether Research Analysts has served as an officer, director or employee of the subject company
No No No No No No No No No No No No No
10 Whether the Research Analyst has been engaged in market making activity of the subject company.
No No No No No No No No No No No No No
Pharma
Abbott India
Aurobindo Pharma Biocon Cipla
Dr. Reddy's
Labs FDC Glaxo SK
Pharma Granules
India Lupin Marksans Pharma Pfizer Sanofi
India Sun
Pharma Aarti Drugs
4 Whether Research analyst’s or relatives’ have any financial interest in the subject company and nature of such financial interest
No No No No No No No No No No No No No No
5 Whether Research analyst or relatives have actual / beneficial ownership of 1% or more in securities of the subject company at the end of the month immediately preceding the date of publication of the document.
No No No No No No No No No No No No No No
6 Whether the research analyst or his relatives has any other material conflict of interest No No No No No No No No No No No No No No
7 Whether research analyst has received any compensation from the subject company in the past 12 months and nature of products / services for which such compensation is received
No No No No No No No No No No No No No No
8 Whether the Research Analyst has received any compensation or any other benefits from the subject company or third party in connection with the research report
No No No No No No No No No No No No No No
9 Whether Research Analysts has served as an officer, director or employee of the subject company No No No No No No No No No No Yes No No No
10 Whether the Research Analyst has been engaged in market making activity of the subject company. No No No No No No No No No No No No No No
61
Q4FY28 Results Preview
Miscellaneous IFB Industries La Opala Mirza International Sarla Performance
4 Whether Research analyst’s or relatives’ have any financial interest in the subject company and nature of such financial interest No No No No
5 Whether Research analyst or relatives have actual / beneficial ownership of 1% or more in securities of the subject company at the end of the month immediately preceding the date of publication of the document.
No No No No
6 Whether the research analyst or his relatives has any other material conflict of interest No No No No
7 Whether research analyst has received any compensation from the subject company in the past 12 months and nature of products / services for which such compensation is received No No No No
8 Whether the Research Analyst has received any compensation or any other benefits from the subject company or third party in connection with the research report No No No No
9 Whether Research Analysts has served as an officer, director or employee of the subject company No No No No
10 Whether the Research Analyst has been engaged in market making activity of the subject company. No No No No
Rating Criteria
Rating Market cap < Rs20bn Market cap > Rs20bn but < 100bn Market cap > Rs100bn Buy Upside > 20% Upside > 15% Upside > 10% Hold Upside between -20% to +20% Upside between -15% to +15% Upside between -10% to +10% Sell Downside > 20% Downside > 15% Downside > 10%
Member (NSE and BSE)
Regn No.: CAPITAL MARKET SEBI REGN. NO.: BSE: INB011454239 CAPITAL MARKET SEBI REGN. NO.: NSE: INB231454233
DERIVATIVES SEBI REGN. NO.: NSE: INF231454233 (TRADING & CLEARING MEMBER)