55
11. Presentation Approaches II Dr. Thorsten Büring, 24. Januar 2008, Vorlesung Wintersemester 2007/08 1 Dealing with the presentation problem
LMU Department of Media Informatics | www.medien.ifi.lmu.de | [email protected]
Information Visualization | Thorsten Büring | 11. Presentation II, 24. Januar 2008
/ 55
11. Presentation Approaches II
Dr. Thorsten Büring, 24. Januar 2008, Vorlesung Wintersemester 2007/08
1
Dealing with the presentation problem

LMU Department of Media Informatics | www.medien.ifi.lmu.de | [email protected]
Information Visualization | Thorsten Büring | 11. Presentation II, 24. Januar 2008
/ 55
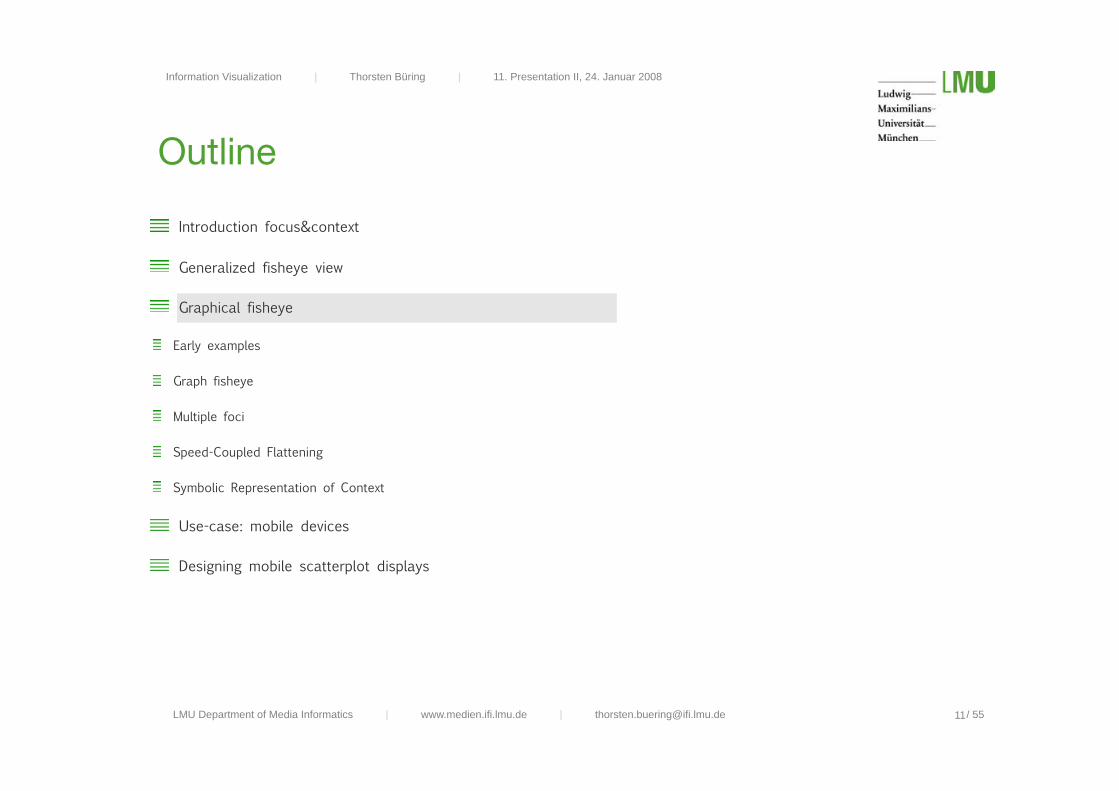
Outline
Introduction focus&context
Generalized fisheye view
Graphical fisheye
Early examples
Graph fisheye
Multiple foci
Speed-Coupled Flattening
Symbolic Representation of Context
Use-case: mobile devices
Designing mobile scatterplot displays
2

LMU Department of Media Informatics | www.medien.ifi.lmu.de | [email protected]
Information Visualization | Thorsten Büring | 11. Presentation II, 24. Januar 2008
/ 55
Focus+Context
Recap presentation problem: information space is too large to be displayed on a single screen
Approaches in previous lecture
Zoomable user interface: scale and translate a single view of the information space
Overview+detail: use multiple views with different scale / detail granularity
Focus+Context (f+c) means a presentation technique where both focus and context information are integrated
into a single view by employing distortion
Local detail for interaction
Context for orientation
No need to zoom out to regain context as in ZUIs
No need to switch and relate between multiple separate views as in overview+detail interfaces
Focus+context is commonly known as fisheye views
Earliest mentioning of the idea in Ph.D. thesis: Farrand 1973
3

LMU Department of Media Informatics | www.medien.ifi.lmu.de | [email protected]
Information Visualization | Thorsten Büring | 11. Presentation II, 24. Januar 2008
/ 55
Outline
4
Introduction focus&context
Generalized fisheye view
Graphical fisheye
Early examples
Graph fisheye
Multiple foci
Speed-Coupled Flattening
Symbolic Representation of Context
Use-case: mobile devices
Designing mobile scatterplot displays

LMU Department of Media Informatics | www.medien.ifi.lmu.de | [email protected]
Information Visualization | Thorsten Büring | 11. Presentation II, 24. Januar 2008
/ 55
Generalized Fisheye Views
Furnas 1986
Idea: trade-off of detail with distance
Naturally occurring, e.g.
Employees being asked about the management structure: they know
local department heads, but only the Vice president of remote
divisions
Regional newspaper contain local news stories and only more distant
ones that are compensatingly of greater importance (e.g. war in a
remote country)
Formalization
Presentation problem: interface can only display n items of a structure
that has a number of items > n
Degree-of-interest function: assign importance value to each item in
structure - only display the n most important items
5
Saul Steinberg

LMU Department of Media Informatics | www.medien.ifi.lmu.de | [email protected]
Information Visualization | Thorsten Büring | 11. Presentation II, 24. Januar 2008
/ 55
Degree-of-Interest
DOIfisheye (x|y) = API(x) - D(x,y)
DOIfisheye : the users‘ degree of interest in point x, given the current focus point y
API(x) : Global a priori importance of point x
D(x,y) : distance between x and focus point y
Can be applied to any structure where the components can be defined
Example: rooted tree structure of programming code
Components definition
D(x,y) = dtree(x,y) = path length distance between node x and node y in the tree
API(x) = –dtree(x,root) = distance of node x from the root node (assumption: nodes closer to the root are generally more
important than nodes farer away)
DOIfisheye(tree) (x|y) = API(x) - D(x,y) = –(dtree(x,y) + dtree(x,root))
6

LMU Department of Media Informatics | www.medien.ifi.lmu.de | [email protected]
Information Visualization | Thorsten Büring | 11. Presentation II, 24. Januar 2008
/ 55
Fisheye Tree
7
An arithmetically larger number
means that the node is more
interesting for interactions focused
on y

LMU Department of Media Informatics | www.medien.ifi.lmu.de | [email protected]
Information Visualization | Thorsten Büring | 11. Presentation II, 24. Januar 2008
/ 55
Fisheye Tree
To obtain fisheye views of different sizes, set a DOI threshold k with DOI(x) > k
8
k = –3; direct ancestral lineage k = –5; siblings are added
k = –7; cousins are added
LMU Department of Media Informatics | www.medien.ifi.lmu.de | [email protected]
Information Visualization | Thorsten Büring | 11. Presentation II, 24. Januar 2008
/ 55
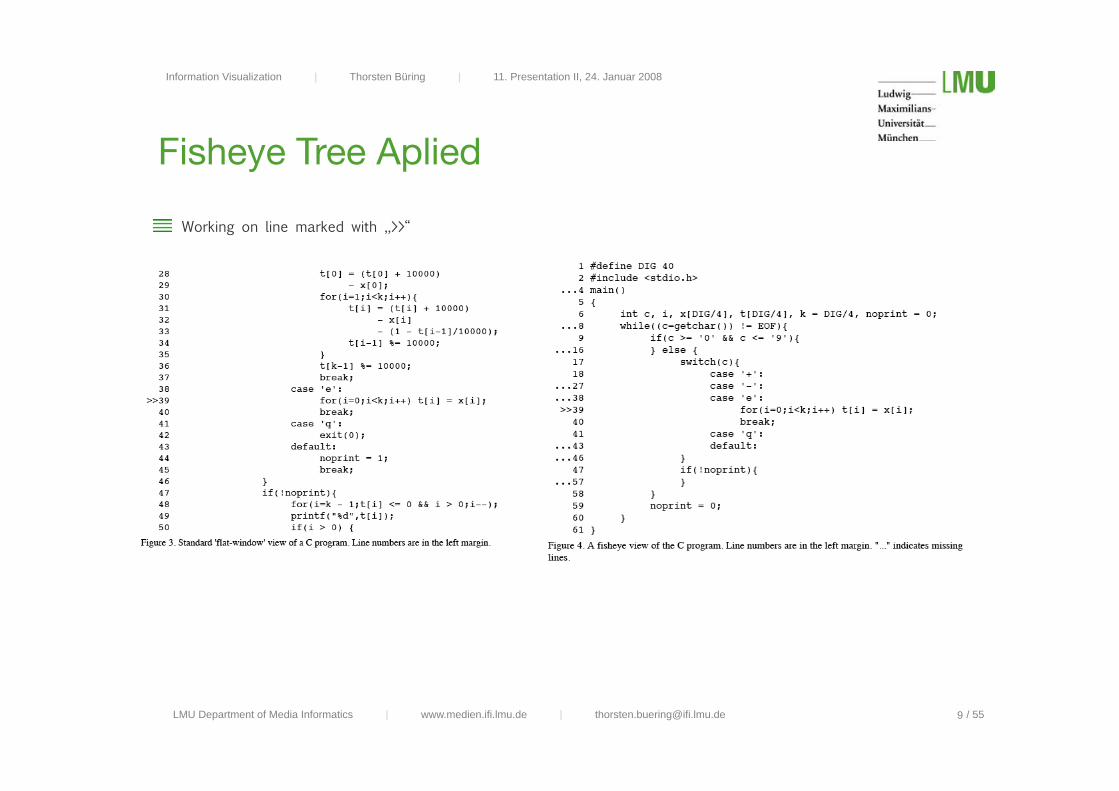
Fisheye Tree Aplied
9
Working on line marked with „>>“
LMU Department of Media Informatics | www.medien.ifi.lmu.de | [email protected]
Information Visualization | Thorsten Büring | 11. Presentation II, 24. Januar 2008
/ 55
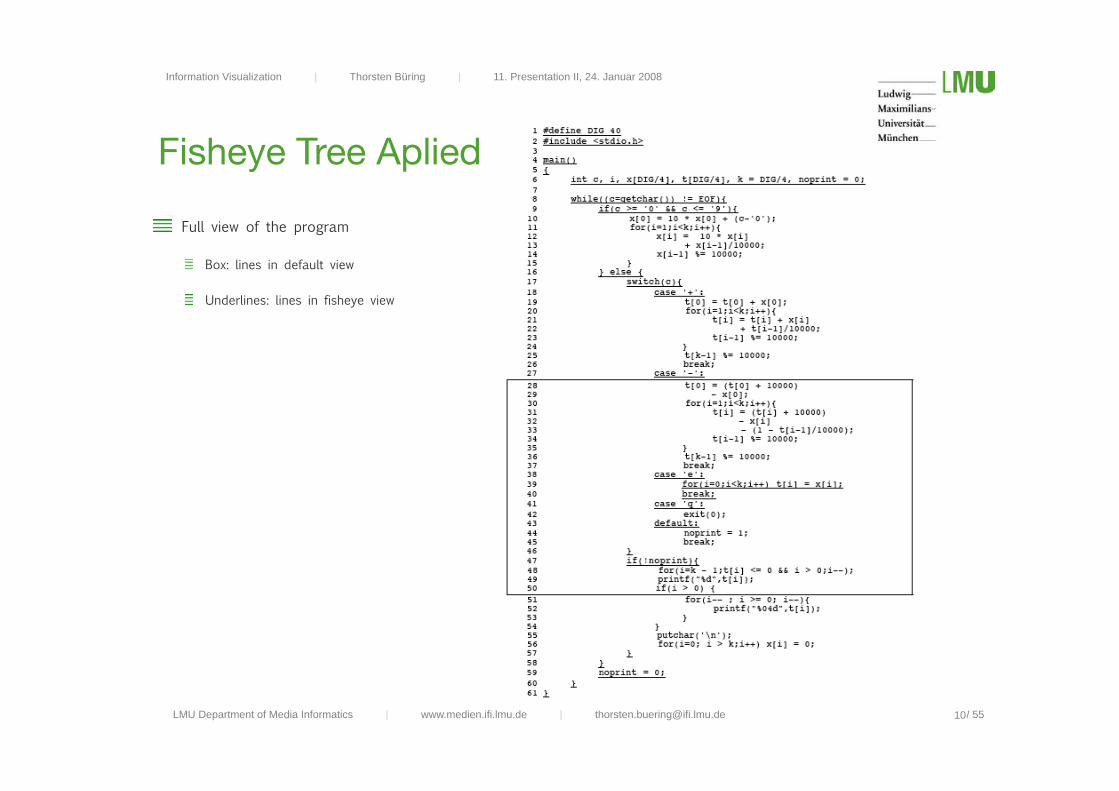
Fisheye Tree Aplied
Full view of the program
Box: lines in default view
Underlines: lines in fisheye view
10
LMU Department of Media Informatics | www.medien.ifi.lmu.de | [email protected]
Information Visualization | Thorsten Büring | 11. Presentation II, 24. Januar 2008
/ 55
Outline
11
Introduction focus&context
Generalized fisheye view
Graphical fisheye
Early examples
Graph fisheye
Multiple foci
Speed-Coupled Flattening
Symbolic Representation of Context
Use-case: mobile devices
Designing mobile scatterplot displays

LMU Department of Media Informatics | www.medien.ifi.lmu.de | [email protected]
Information Visualization | Thorsten Büring | 11. Presentation II, 24. Januar 2008
/ 55
Graphical Fisheye Views
Applied rather to layouts than to logical structure
Furnas fisheye: items are either present in full detail or absent from the view
Objective: continuous distortion of items and item representation
12
LMU Department of Media Informatics | www.medien.ifi.lmu.de | [email protected]
Information Visualization | Thorsten Büring | 11. Presentation II, 24. Januar 2008
/ 55
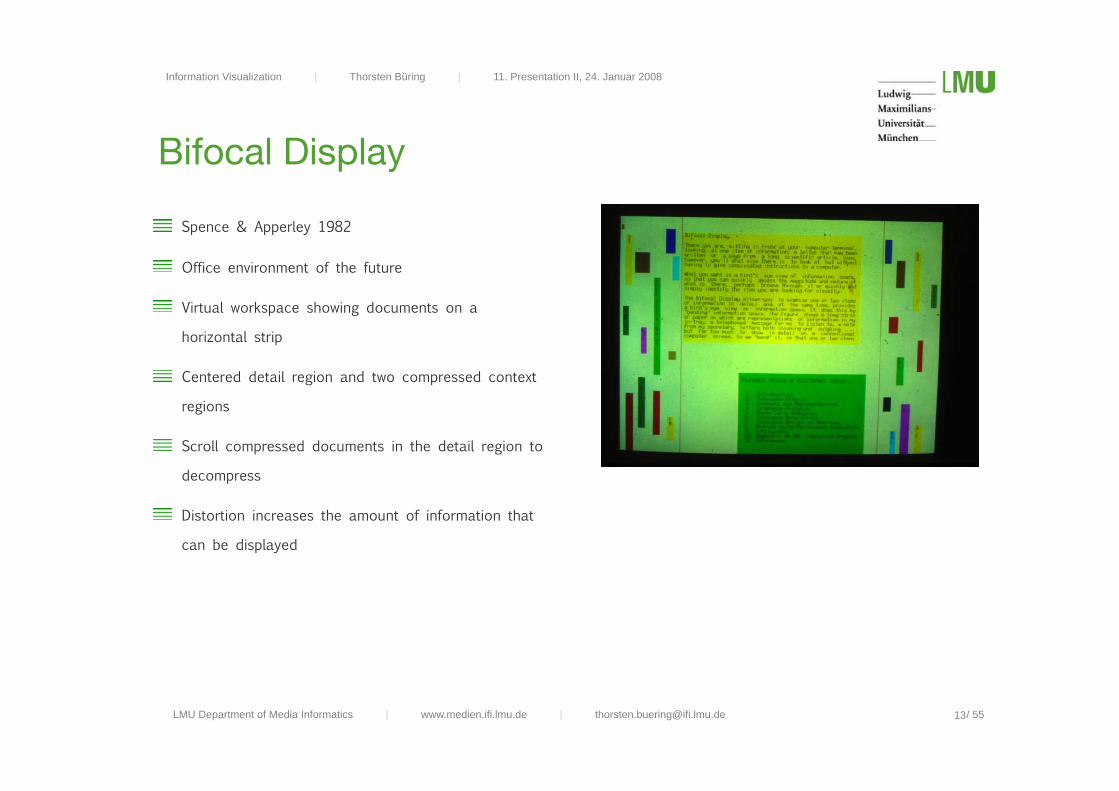
Bifocal Display
Spence & Apperley 1982
Office environment of the future
Virtual workspace showing documents on a
horizontal strip
Centered detail region and two compressed context
regions
Scroll compressed documents in the detail region to
decompress
Distortion increases the amount of information that
can be displayed
13
LMU Department of Media Informatics | www.medien.ifi.lmu.de | [email protected]
Information Visualization | Thorsten Büring | 11. Presentation II, 24. Januar 2008
/ 55
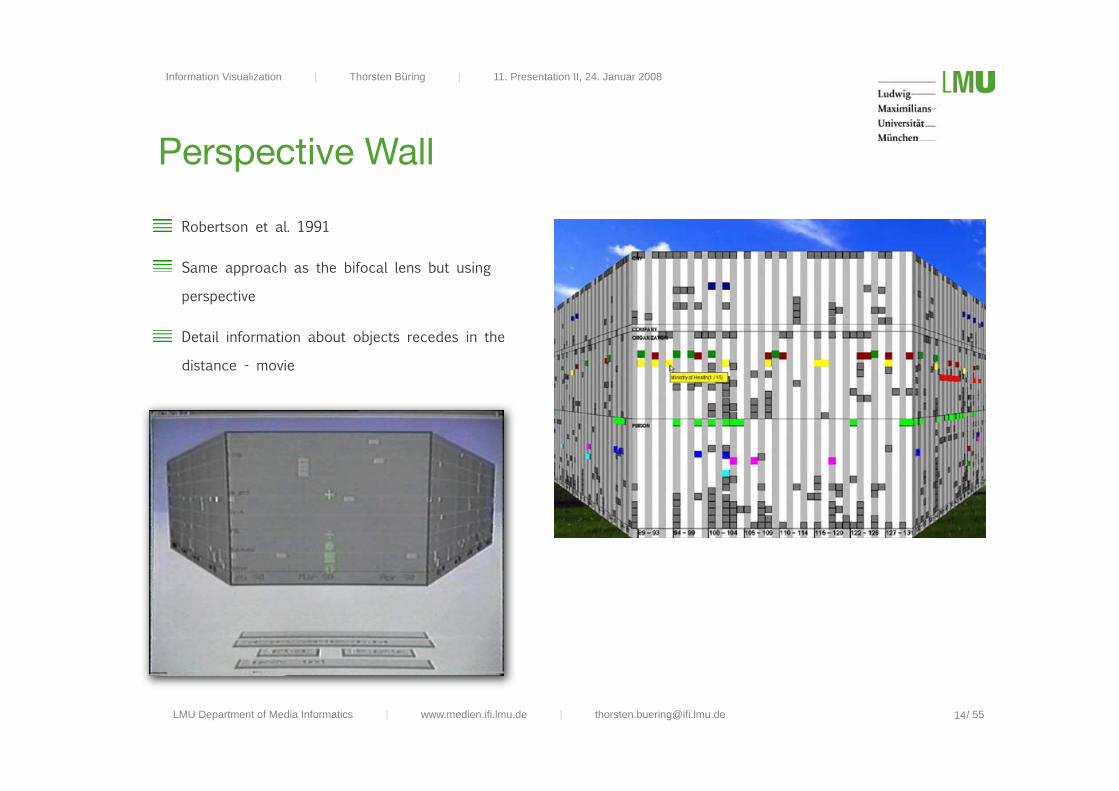
Perspective Wall
Robertson et al. 1991
Same approach as the bifocal lens but using
perspective
Detail information about objects recedes in the
distance - movie
14

LMU Department of Media Informatics | www.medien.ifi.lmu.de | [email protected]
Information Visualization | Thorsten Büring | 11. Presentation II, 24. Januar 2008
/ 55
Document Lens
Robertson 1993
15

LMU Department of Media Informatics | www.medien.ifi.lmu.de | [email protected]
Information Visualization | Thorsten Büring | 11. Presentation II, 24. Januar 2008
/ 55
Distortion Approaches Used
16
Bifocal display Perspective wall Document lens
LMU Department of Media Informatics | www.medien.ifi.lmu.de | [email protected]
Information Visualization | Thorsten Büring | 11. Presentation II, 24. Januar 2008
/ 55
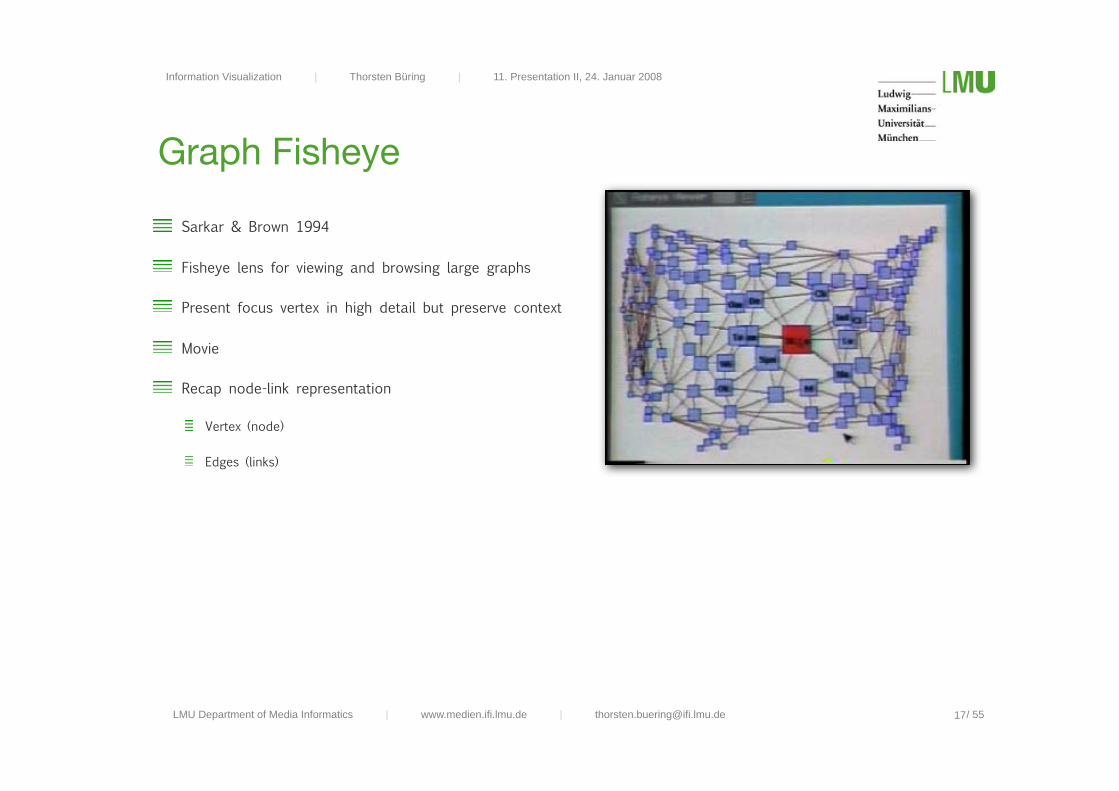
Graph Fisheye
Sarkar & Brown 1994
Fisheye lens for viewing and browsing large graphs
Present focus vertex in high detail but preserve context
Movie
Recap node-link representation
Vertex (node)
Edges (links)
17

LMU Department of Media Informatics | www.medien.ifi.lmu.de | [email protected]
Information Visualization | Thorsten Büring | 11. Presentation II, 24. Januar 2008
/ 55
How did they do that...?
Focus: viewer‘s point of interest
Coordinates in the initial layout: normal coordinates
Coordinates in the fisheye view: fisheye coordinates
Each vertex has
A position specified by normal coordinates
Size (Length of the square-shaped bounding box)
A priori importance (API)
Edge
Straight line from one vertex to another OR
For bended edges: set of intermediate bend points
Apart from the distortion, the systems calculates for each vertex:
Amount of detail (content) to be displayed
Visual worth: shall the vertex be displayed? - display threshold
18

LMU Department of Media Informatics | www.medien.ifi.lmu.de | [email protected]
Information Visualization | Thorsten Büring | 11. Presentation II, 24. Januar 2008
/ 55
Implementation
Two step process
Apply geometric transformation to the normal view to reposition vertices and magnify / demagnify the bounding
boxes
Use the API of vertices to determine their final size, detail, and visual worth
Slides will only present the repositioning of vertices - for the remaining algorithm see the paper!
19
LMU Department of Media Informatics | www.medien.ifi.lmu.de | [email protected]
Information Visualization | Thorsten Büring | 11. Presentation II, 24. Januar 2008
/ 55
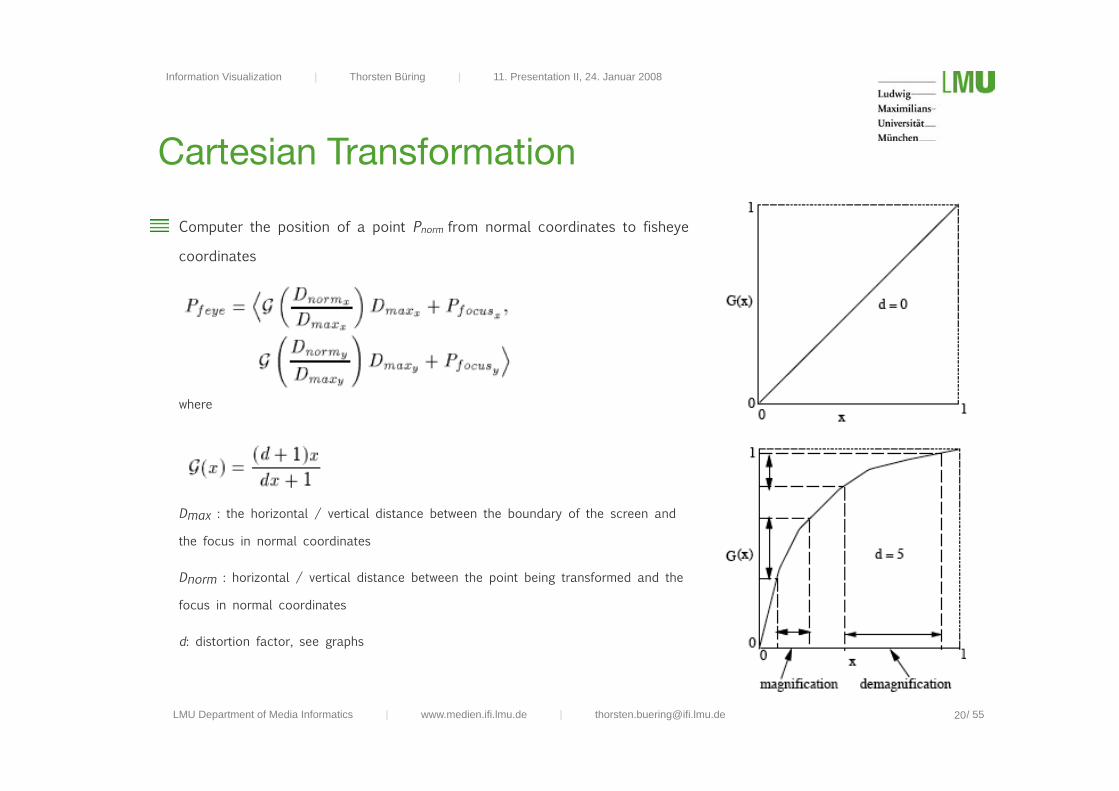
Cartesian Transformation
Computer the position of a point Pnorm from normal coordinates to fisheye
coordinates
where
Dmax : the horizontal / vertical distance between the boundary of the screen and
the focus in normal coordinates
Dnorm : horizontal / vertical distance between the point being transformed and the
focus in normal coordinates
d: distortion factor, see graphs
20
LMU Department of Media Informatics | www.medien.ifi.lmu.de | [email protected]
Information Visualization | Thorsten Büring | 11. Presentation II, 24. Januar 2008
/ 55
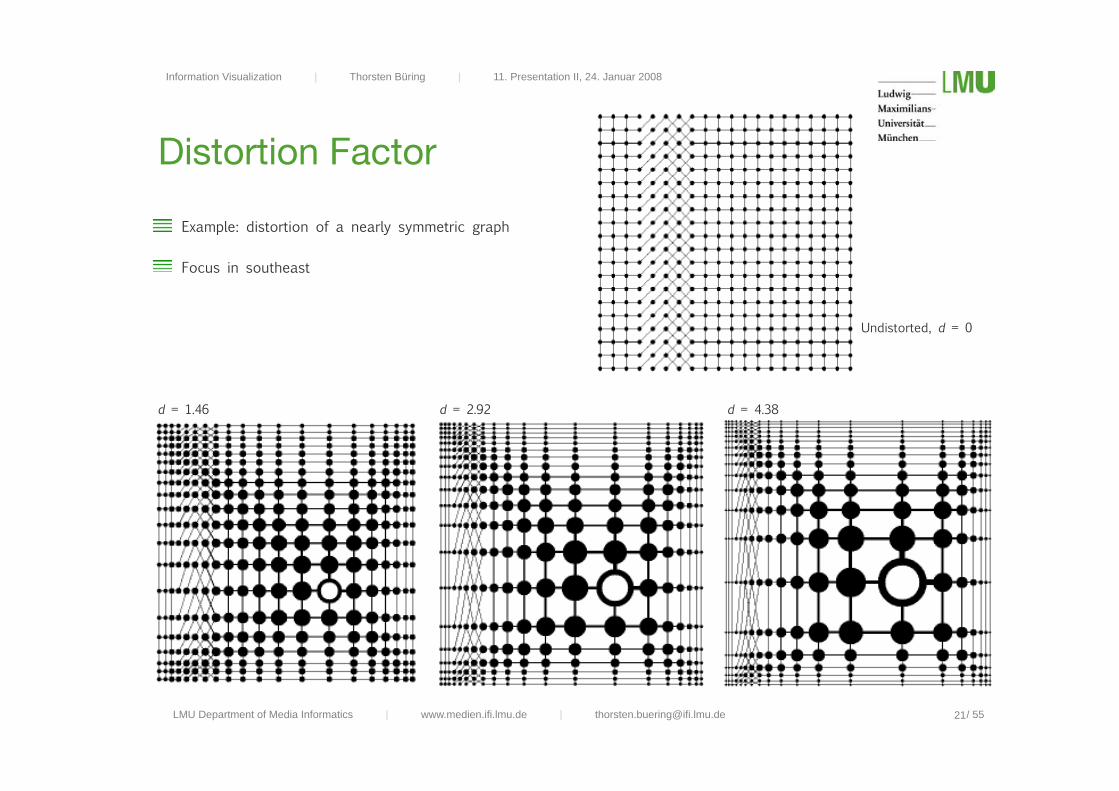
Distortion Factor
Example: distortion of a nearly symmetric graph
Focus in southeast
21
Undistorted, d = 0
d = 1.46 d = 2.92 d = 4.38

LMU Department of Media Informatics | www.medien.ifi.lmu.de | [email protected]
Information Visualization | Thorsten Büring | 11. Presentation II, 24. Januar 2008
/ 55
Polar Transformation
With cartesian transformation all vertical and horizontal lines remain vertical and horizontal in the fisheye view
Makes this approach well suited for abstract orthogonal layouts of information spaces (e.g. circuit design, UML
diagrams, etc.)
Problem: does not seem very natural
Alternative approach: distorting the map onto a hemisphere using polar coordinates (origin = focus)
Point with normal coordinates (rnorm, θ) is mapped to fisheye coordinates (rfeye, θ), where
rmax : maximum possible value of r in the same direction as θ
Note: θ remains unchanged, origin of polar coordinates is the focus
Distortion forms a pyramid lens
Users know this effect from lenses and elastic materials in the real world, often find it fascinating
22

LMU Department of Media Informatics | www.medien.ifi.lmu.de | [email protected]
Information Visualization | Thorsten Büring | 11. Presentation II, 24. Januar 2008
/ 55
Cartesian vs Polar Transformation
23
Cartesian
Polar

LMU Department of Media Informatics | www.medien.ifi.lmu.de | [email protected]
Information Visualization | Thorsten Büring | 11. Presentation II, 24. Januar 2008
/ 55
More Fisheye Lenses
Gutwin & Fedak 2004
24
Original pyramid lens (polar transformation, full screen)
Constrained hemispherical lens:constrain polar algorithm to a fixed radius
Constrained flat-hemispherical lens:insert a region of constant magnification

LMU Department of Media Informatics | www.medien.ifi.lmu.de | [email protected]
Information Visualization | Thorsten Büring | 11. Presentation II, 24. Januar 2008
/ 55
Outlook
I know what you will do next summer (in MMI 2)...
25
LMU Department of Media Informatics | www.medien.ifi.lmu.de | [email protected]
Information Visualization | Thorsten Büring | 11. Presentation II, 24. Januar 2008
/ 55
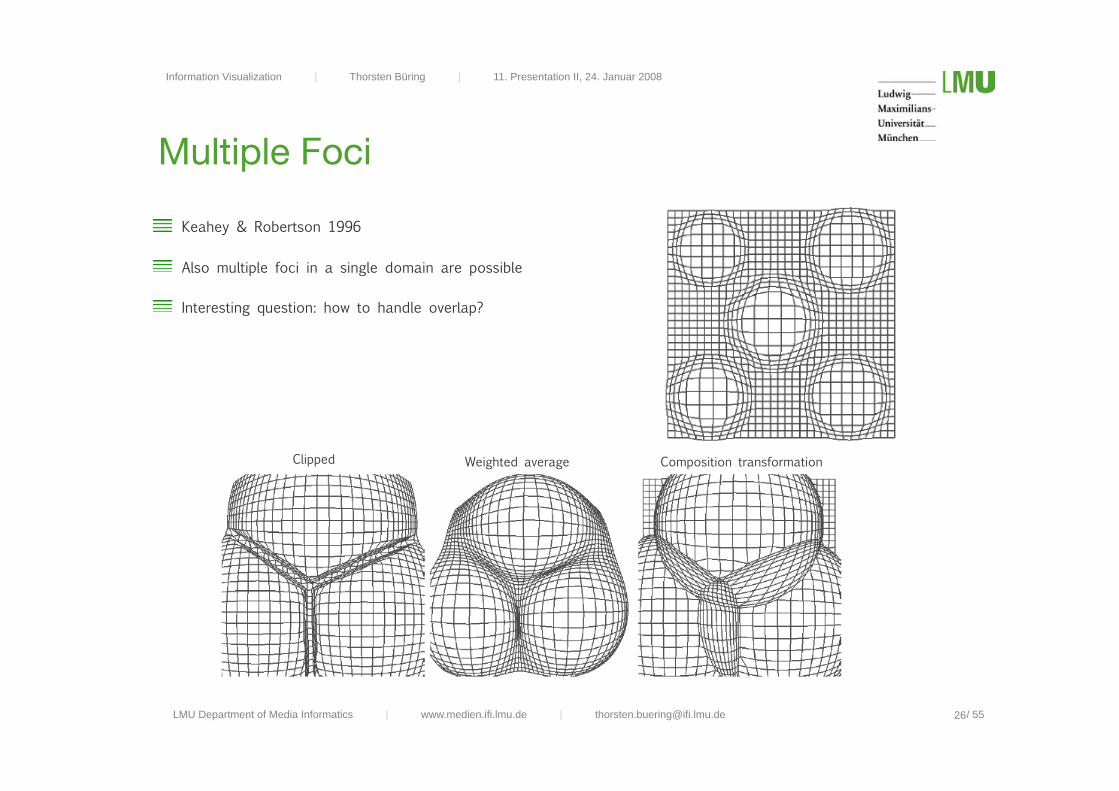
Multiple Foci
Keahey & Robertson 1996
Also multiple foci in a single domain are possible
Interesting question: how to handle overlap?
26
Clipped Weighted average Composition transformation
LMU Department of Media Informatics | www.medien.ifi.lmu.de | [email protected]
Information Visualization | Thorsten Büring | 11. Presentation II, 24. Januar 2008
/ 55
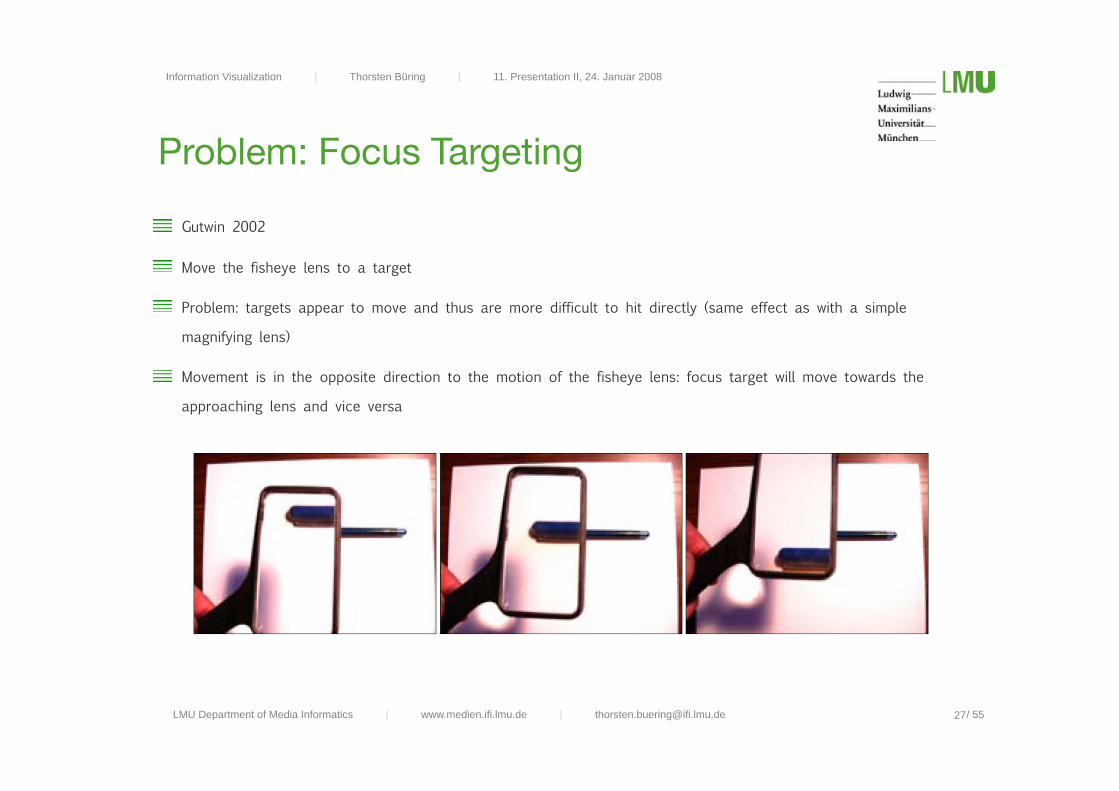
Problem: Focus Targeting
Gutwin 2002
Move the fisheye lens to a target
Problem: targets appear to move and thus are more difficult to hit directly (same effect as with a simple
magnifying lens)
Movement is in the opposite direction to the motion of the fisheye lens: focus target will move towards the
approaching lens and vice versa
27

LMU Department of Media Informatics | www.medien.ifi.lmu.de | [email protected]
Information Visualization | Thorsten Büring | 11. Presentation II, 24. Januar 2008
/ 55
Focus Targeting
Even worse: with the fisheye lens, targets move towards the focus more and more rapidly as the focus
approaches them
Depending on the distortion factor, the targets may move several times faster than the focus
Leads to overshooting
Approach to reduce problem: speed-coupled flattening
Detecting a target acquisition, the system automatically reduces the distortion
Distortion is automatically restored when the target action is completed
Algorithm is based on pointer velocity and acceleration thresholds
28
LMU Department of Media Informatics | www.medien.ifi.lmu.de | [email protected]
Information Visualization | Thorsten Büring | 11. Presentation II, 24. Januar 2008
/ 55
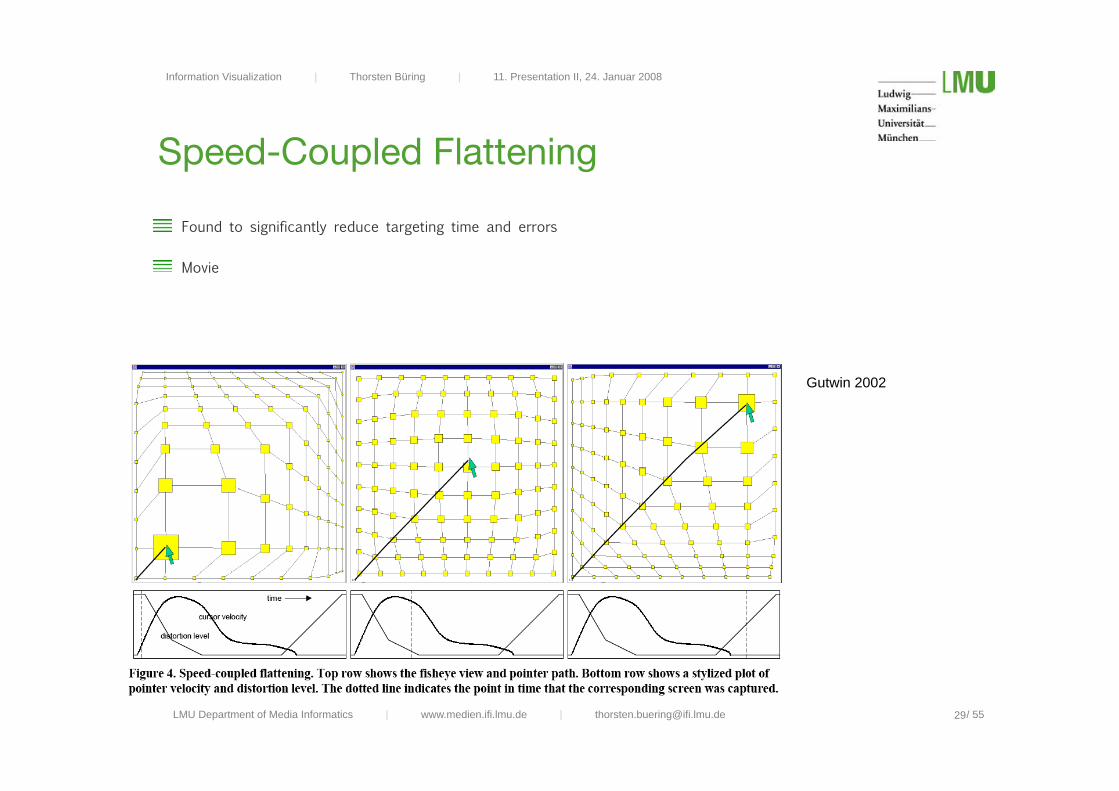
Speed-Coupled Flattening
Found to significantly reduce targeting time and errors
Movie
29
Gutwin 2002

LMU Department of Media Informatics | www.medien.ifi.lmu.de | [email protected]
Information Visualization | Thorsten Büring | 11. Presentation II, 24. Januar 2008
/ 55
Symbolic Representation of Context
F+c is limited to small zoom factors
Allow for greater zoom factors by fusing graphical and
symbolic content representations
Example: Table lens (Rao & Card et al. 1994), (screenshot
taken from inxight.com)
Visualizes many more rows than a conventional spread
sheet application
Simple squishing of text rows would have rendered the
content in the context unreadable
Instead use small-size encodings of attribute values
Movie
30

LMU Department of Media Informatics | www.medien.ifi.lmu.de | [email protected]
Information Visualization | Thorsten Büring | 11. Presentation II, 24. Januar 2008
/ 55
Symbolic Representation of Context
Symbolic representations to visualize objects in the off-screen space
City lights technique (screenshots adapted from (Good 2003))
Orthogonal + corner projections
Point projection
Radial projection
Distance is encoded by color brightness
Click representations to navigate to objects
31

LMU Department of Media Informatics | www.medien.ifi.lmu.de | [email protected]
Information Visualization | Thorsten Büring | 11. Presentation II, 24. Januar 2008
/ 55
Summary Focus+Context
Advantages
Overview information is provided
No visual switching between separate views (compared to O+D)
Less display space is needed (compared to O+D)
Potential problems
Performance is strongly task-dependent
Distortion has negative effect on the perception of proportions, angles, distances
Hampers precise targeting and the recall of spatial locations
Usually only suitable for small zoom factors: maximum of 5 (Shneiderman & Plaisant 2005)
Can be inappropriate for visualizing maps (usually require high fidelity to the standard layout)
32

LMU Department of Media Informatics | www.medien.ifi.lmu.de | [email protected]
Information Visualization | Thorsten Büring | 11. Presentation II, 24. Januar 2008
/ 55
Outline
33
Introduction focus&context
Generalized fisheye view
Graphical fisheye
Early examples
Graph fisheye
Multiple foci
Speed-Coupled Flattening
Symbolic Representation of Context
Use-case: mobile devices
Designing mobile scatterplot displays

LMU Department of Media Informatics | www.medien.ifi.lmu.de | [email protected]
Information Visualization | Thorsten Büring | 11. Presentation II, 24. Januar 2008
/ 55
Use-Case: Mobile Devices
The presentation techniques discussed become even more important when designing for mobile devices
Form factor implies a small screen
Strong research need to improve orientation and navigation issues when displaying large information spaces
Various commercial web browsers already use ZUIs and focus+context techniques (e.g. deepfish, minimap)
34
Halos (Baudisch 2003)F+c sketching (Lank & Phan 2004) Image distortion (Liu & Gleicher 2005)

LMU Department of Media Informatics | www.medien.ifi.lmu.de | [email protected]
Information Visualization | Thorsten Büring | 11. Presentation II, 24. Januar 2008
/ 55
LaunchTile & AppLens
ZUI and fisheye approach (Karlson et al. 2005)
35
LMU Department of Media Informatics | www.medien.ifi.lmu.de | [email protected]
Information Visualization | Thorsten Büring | 11. Presentation II, 24. Januar 2008
/ 55
Outline
36
Introduction focus&context
Generalized fisheye view
Graphical fisheye
Early examples
Graph fisheye
Multiple foci
Speed-Coupled Flattening
Symbolic Representation of Context
Use-case: mobile devices
Designing mobile scatterplot displays
LMU Department of Media Informatics | www.medien.ifi.lmu.de | [email protected]
Information Visualization | Thorsten Büring | 11. Presentation II, 24. Januar 2008
/ 55
Designing Mobile Scatterplot Displays
Work at University of Konstanz
Objective: Merge scatterplot displays with presentation techniques to achieve scalable, concise and highly usable
mobile applications to facilitate access to large information spaces for next-generation PDAs and smartphones
Several projects including system implementations and usability evaluations were carried out
Smooth semantic zooming
Overview+detail starfield versus detail-only ZUI
Focus+context starfield versus detail-only ZUI
37
LMU Department of Media Informatics | www.medien.ifi.lmu.de | [email protected]
Information Visualization | Thorsten Büring | 11. Presentation II, 24. Januar 2008
/ 55
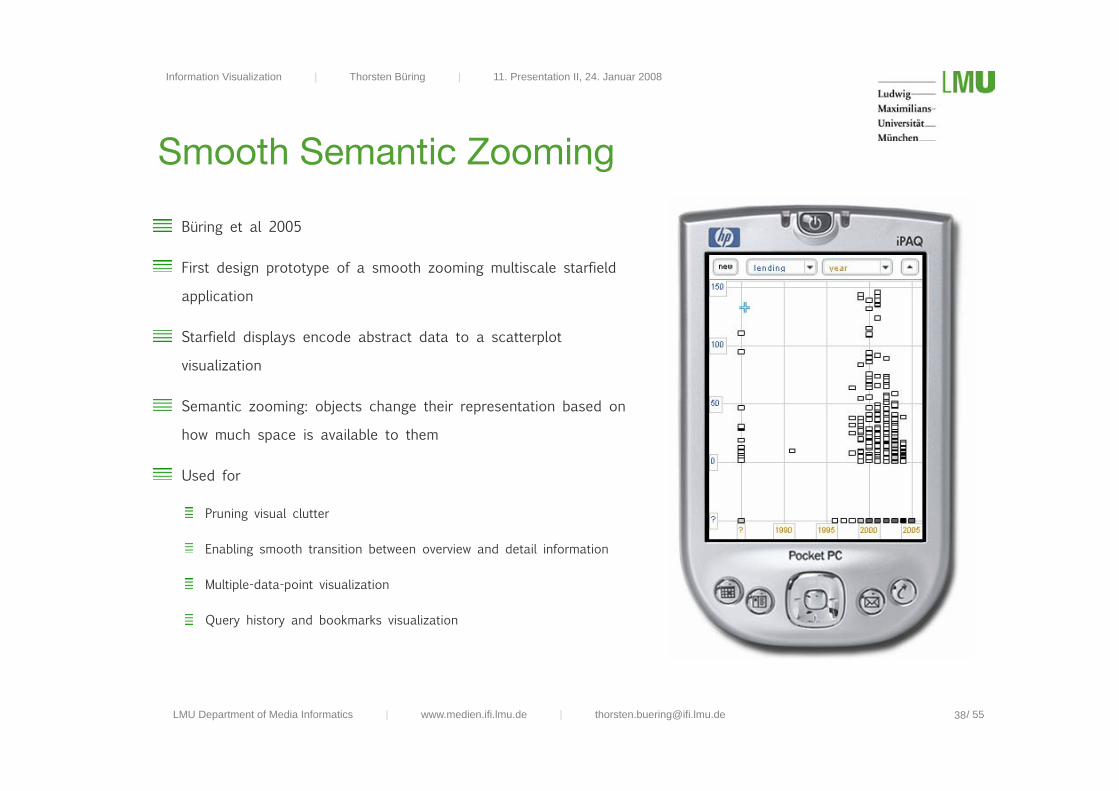
Smooth Semantic Zooming
Büring et al 2005
First design prototype of a smooth zooming multiscale starfield
application
Starfield displays encode abstract data to a scatterplot
visualization
Semantic zooming: objects change their representation based on
how much space is available to them
Used for
Pruning visual clutter
Enabling smooth transition between overview and detail information
Multiple-data-point visualization
Query history and bookmarks visualization
38

LMU Department of Media Informatics | www.medien.ifi.lmu.de | [email protected]
Information Visualization | Thorsten Büring | 11. Presentation II, 24. Januar 2008
/ 55
Smooth Semantic Zooming
Informal user test based on observation & interviews
6 users (2 male, 4 female), 21 to 33 years in age
Ipaq 4700hx, movie database with 335 items
Explore the interface while thinking aloud
Retrieval tasks with increasing navigation effort
Main results
Semantic zooming: an intuitive concept for data exploration and
granularity transition
Orientation problems due to the clipping of context, frequent zoom out
and panning operations
Sequential zoom interaction: tedious and slow
39

LMU Department of Media Informatics | www.medien.ifi.lmu.de | [email protected]
Information Visualization | Thorsten Büring | 11. Presentation II, 24. Januar 2008
/ 55
Overview+Detail ZUI
Büring et al. 2006a
Smooth zooming could not prevent the users from getting lost in the
information space
More powerful concept to preserve orientation: overview+detail (o+d)
interface
An additional overview window to show a miniature of the entire information
space
Field-of-view-box to indicate the clipping currently displayed in the detail view
Problems of o+d
Less space for the detail view means more clutter
Visual switching
Compare a second design iteration of the smooth zooming starfield
display with an overview+detail variant
40

LMU Department of Media Informatics | www.medien.ifi.lmu.de | [email protected]
Information Visualization | Thorsten Büring | 11. Presentation II, 24. Januar 2008
/ 55
Screen Recordings
Detail-only
41
Overview+detail

LMU Department of Media Informatics | www.medien.ifi.lmu.de | [email protected]
Information Visualization | Thorsten Büring | 11. Presentation II, 24. Januar 2008
/ 55
Usability Experiment
Quantitative user study with 24 students (non-IT), (12 female, 12 male), M: 24 years, SD: 2,3
Ipaq 4700hx, movie database with 85 items
Counter-balanced within-subjects design
Two task sets, each containing 12 tasks
Task Types: Visual Scan, Information Access & Comparison
Independent variables: interface type, spatial ability (psychometric test by Horn)
Dependent variables: task completion time, system preference, user-satisfaction (Attrakdiff), error-rate, navigation-
actions (logged)
Introduction video + training phase
42

LMU Department of Media Informatics | www.medien.ifi.lmu.de | [email protected]
Information Visualization | Thorsten Büring | 11. Presentation II, 24. Januar 2008
/ 55
Spatial Ability
Definition: The ability to generate, retain, retrieve and transform
well-structured visual images
One of the best predictors for human-computer performance
O+d interfaces may compensate for the inability of low-spatial users
to construct a mental model of the information space
Visual interfaces can improve the performance of low-spatial
individuals, but may also hinder high-spatial users
43

LMU Department of Media Informatics | www.medien.ifi.lmu.de | [email protected]
Information Visualization | Thorsten Büring | 11. Presentation II, 24. Januar 2008
/ 55
Results
Hypothesis 1: Users would prefer the overview to the detail-only interface because
of the orientation and navigation features (e.g. [Baudisch et al. 2004])
Result preference: user preference balanced (13 detail-only, 10 o+d),
X²(1,N=23)=0,391p = n.s.
Hypothesis 2: Task-completion time would be better for the detail-only interface
due to the rich orientation cues given by the scatterplot labels (e.g. [Hornbæk et
al. 2002])
Results task-completion time: in favor of the detail-only interface
379.34s (SD: 75.19s) detail-only vs. 452.64s (SD:92.10s) o+d
ANOVA results: F(1,23) = 16.5, p<0.001
Reject null hypothesis
44

LMU Department of Media Informatics | www.medien.ifi.lmu.de | [email protected]
Information Visualization | Thorsten Büring | 11. Presentation II, 24. Januar 2008
/ 55
Results
Hypothesis 3: users with low spatial ability would have a longer task-
completion time across interfaces than participants with higher spatial
ability
Results spatial ability: No significant correlation between spatial ability and
neither task performance or user preference
Homogenous test group (mean C-Value=7.46, SD = 0.977)
Even our low-spatial participants were significantly above the population average
(6.5 compared to 5, T(1,9)=6.78; p<0.01)
Task-completion times indicate that high-spatial users were hindered by
the detail+overview interface
45

LMU Department of Media Informatics | www.medien.ifi.lmu.de | [email protected]
Information Visualization | Thorsten Büring | 11. Presentation II, 24. Januar 2008
/ 55
Summary
On small screens, a larger detail window can outweigh the benefits gained from an overview
Participants showed problems with precise interaction on the small overview window
Overview window has reduced the need for long-distance panning and zooming (interaction log)
Lost of performance may be due to the added the cost of visual switching and interaction complexity
46

LMU Department of Media Informatics | www.medien.ifi.lmu.de | [email protected]
Information Visualization | Thorsten Büring | 11. Presentation II, 24. Januar 2008
/ 55
Focus+Context ZUI
Büring et al. 2006b
Previous experiment showed that overview information
can reduce the need for unnecessary navigation
Exploit this potential while avoiding the need for visual
switching
Fisheye: integrates both focus and context in a single
view by using distortion
Compare a third design iteration of the smooth
zooming detail-only starfield to a variant using a
rectangular fisheye distortion
47

LMU Department of Media Informatics | www.medien.ifi.lmu.de | [email protected]
Information Visualization | Thorsten Büring | 11. Presentation II, 24. Januar 2008
/ 55
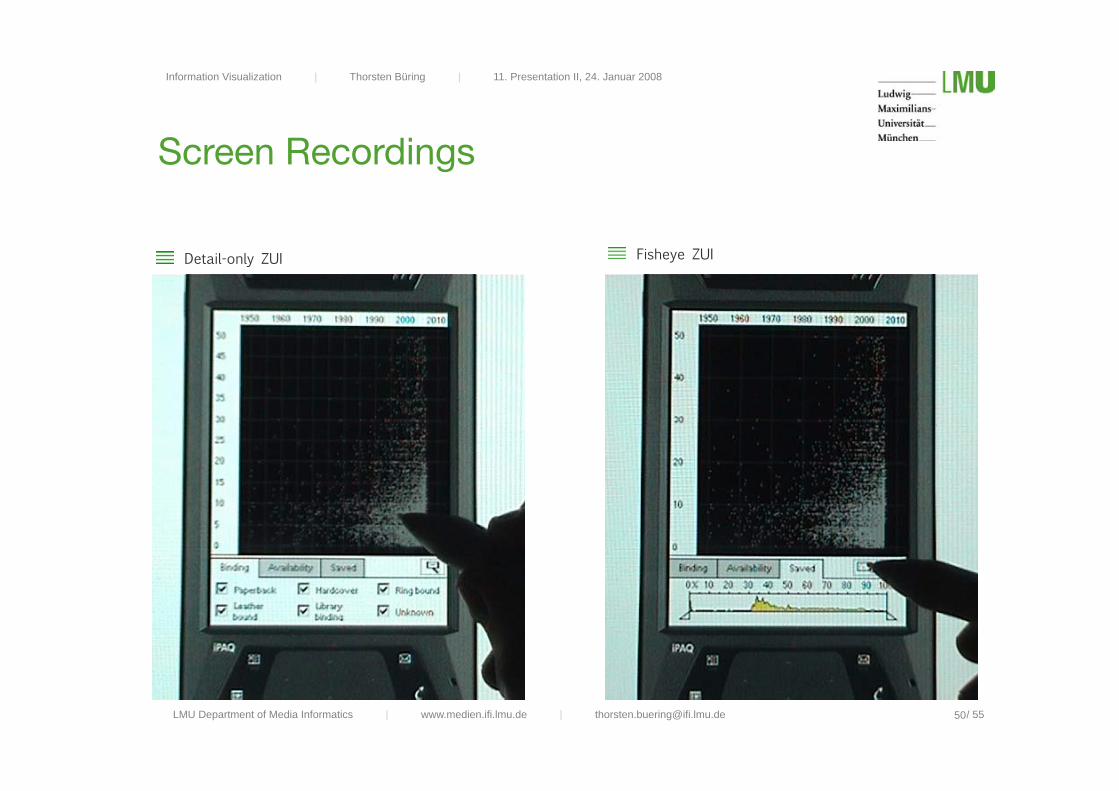
Detail-Only Semantic ZUI
Fluent transitions between zoom steps to support user orientation
Smooth semantic zoom for detail access
The ratio of overview and detail information is controlled via the zoom level
Two-step zoom algorithm
Empty space is minimized by manipulating the scale factor
Selection by proximity avoids desert fog problem
Panning by rate-based scrolling (sliding)
Priority layout for record cards
Continuous adjustment of scatterplot units
48
LMU Department of Media Informatics | www.medien.ifi.lmu.de | [email protected]
Information Visualization | Thorsten Büring | 11. Presentation II, 24. Januar 2008
/ 55
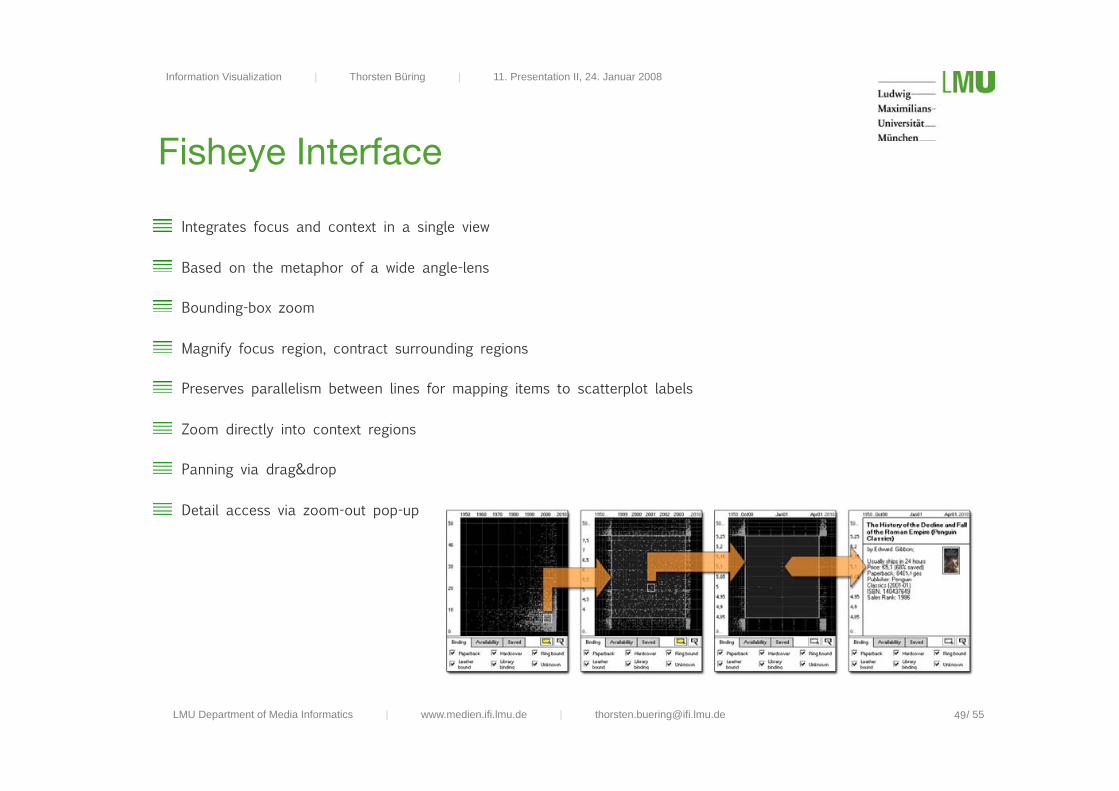
Fisheye Interface
Integrates focus and context in a single view
Based on the metaphor of a wide angle-lens
Bounding-box zoom
Magnify focus region, contract surrounding regions
Preserves parallelism between lines for mapping items to scatterplot labels
Zoom directly into context regions
Panning via drag&drop
Detail access via zoom-out pop-up
49
LMU Department of Media Informatics | www.medien.ifi.lmu.de | [email protected]
Information Visualization | Thorsten Büring | 11. Presentation II, 24. Januar 2008
/ 55
Screen Recordings
Detail-only ZUI
50
Fisheye ZUI

LMU Department of Media Informatics | www.medien.ifi.lmu.de | [email protected]
Information Visualization | Thorsten Büring | 11. Presentation II, 24. Januar 2008
/ 55
Usability Experiment
Comparative evaluation of the two interfaces
User test, 24 participants (23 students – age 19-33, 1
engineer age 50)
PDA simulation on a Wacom Board, 7500 items
Counter-balanced within-subjects design
Two task sets, each containing 10 tasks
Task Types: Visual Scan, Information Access & Comparison
Independent variable: interface type
Dependent variables: task-completion time, system preference,
user-satisfaction (Attrakdiff), error-rate, navigation-actions
(logged)
Introduction video + training phase
51

LMU Department of Media Informatics | www.medien.ifi.lmu.de | [email protected]
Information Visualization | Thorsten Büring | 11. Presentation II, 24. Januar 2008
/ 55
Results
Hypothesis 1: Task-completion time would be better for the fisheye interface
Fewer unnecessary navigation due to preservation of context [Schaffer et al.
1996]
Results
623.8 seconds (detail-only) vs. 612.4 seconds (fisheye-interface)
F(1,22) = 0.002, not significant.
Cannot reject null hypothesis
Although fewer navigation actions needed, those required more time to
execute and probably were cognitively more demanding
52

LMU Department of Media Informatics | www.medien.ifi.lmu.de | [email protected]
Information Visualization | Thorsten Büring | 11. Presentation II, 24. Januar 2008
/ 55
Results
Hypothesis 2: Users would prefer the detail-only ZUI to the fisheye interface
Artificial distortion may decrease user satisfaction [Gutwin&Fedak 2004]
Geometric-semantic ZUI reminds in some aspects of a computer game
20 subjects (fisheye) vs. 3 subjects (detail-only ZUI), X²(1,N = 23) = 12.565,
p<0.001, significant
Attrakdiff PQ Scores: 5.11 (fisheye) vs. 4.11 detial-only ZUI), F(1,23)=20.84,
p<0.001, significant
Cannot reject null hypothesis
Users preferred orientation benefit of the fisheye and the bounding-box zoom
Users experienced problems with sliding
53
LMU Department of Media Informatics | www.medien.ifi.lmu.de | [email protected]
Information Visualization | Thorsten Büring | 11. Presentation II, 24. Januar 2008
/ 55
Summary
The fisheye required less navigation (log data), but did not lead to shorter task-completion times
Still users significantly favored the integrated focus and context view and the bounding-box zoom
Partly contradicts previous research
Hypothesis: fisheye techniques may integrate better with abstract information spaces such as diagrams, but
decrease with domains such as maps, in which a higher fidelity to the standard layout is essential
For those cases a detail-only ZUI with enhanced orientation features (e.g. halos) may provide the better solution
54

LMU Department of Media Informatics | www.medien.ifi.lmu.de | [email protected]
Information Visualization | Thorsten Büring | 11. Presentation II, 24. Januar 2008
/ 55
Obligatory Literature
M. Sarkar & M. Brown: Graphical Fisheye Views, 1992.
55


