1 1 The 10 Economic Freedoms 1. Business Freedom 2. Trade Freedom 3. Fiscal Freedom 4. Government Size 5. Monetary Freedom 6. Investment Freedom 7. Financial Freedom 8. Property Rights 9. Freedom From Corruption 10. Labor Freedom
Transcript
11
The 10 Economic Freedoms
1. Business Freedom
2. Trade Freedom
3. Fiscal Freedom
4. Government Size
5. Monetary Freedom
6. Investment Freedom
7. Financial Freedom
8. Property Rights
9. Freedom From Corruption
10. Labor Freedom
2
Index Users
• Millennium Challenge Corporation – Trade Freedom factor• International Organizations – World Bank, IMF, Inter- American
Development Bank, etc. (Overall Score, Property Rights, Investment Freedom, Freedom from Corruption factors)
• Investment Firms – Emerging Market Investment • News Media (domestic and foreign)• Policy Makers (domestic and foreign) • Colleges and Universities around the World• Textbook publishers
3
The Index Cited in “The Economist”(January 24, 2008)
4
Guest Chapters in the 2008 Index
• Chapter 2 – Carl Schramm, President and CEO of the Ewing Marion Kauffman
Foundation, highlights entrepreneurship and the importance of “economic fluidity” that fosters innovation and as a crucial element of economic freedom.
• Chapter 3 – Professor Stephen Parente, the University of Illinois at Urbana-
Champaign, documents the vital necessity of dismantling barriers to economic catching-up so that all economies can have the chance to flourish in the 21st century.
• Chapter 4 – Guy Sorman, a French journalist and author, reminds us of six
major characteristics of globalization that we enjoy today and potential threats to them that should not be taken lightly.
5
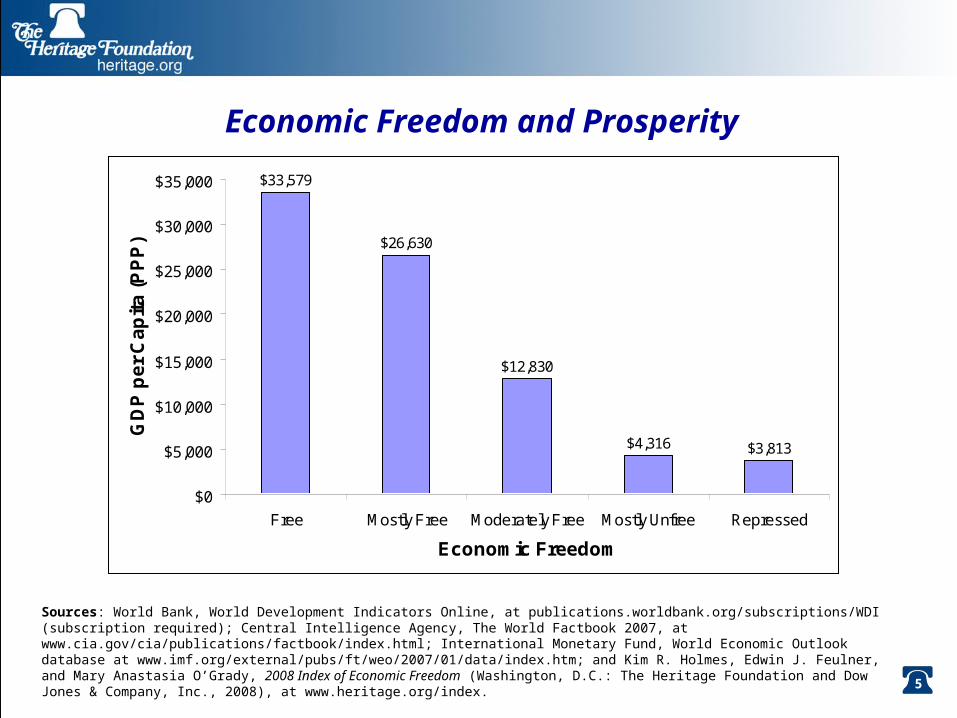
Economic Freedom and Prosperity
Sources: World Bank, World Development Indicators Online, at publications.worldbank.org/subscriptions/WDI (subscription required); Central Intelligence Agency, The World Factbook 2007, at www.cia.gov/cia/publications/factbook/index.html; International Monetary Fund, World Economic Outlook database at www.imf.org/external/pubs/ft/weo/2007/01/data/index.htm; and Kim R. Holmes, Edwin J. Feulner, and Mary Anastasia O’Grady, 2008 Index of Economic Freedom (Washington, D.C.: The Heritage Foundation and Dow Jones & Company, Inc., 2008), at www.heritage.org/index.
Sources: World Bank, World Development Indicators Online, at publications.worldbank.org/subscriptions/WDI (subscription required); Central Intelligence Agency at www.cia.gov/cia/publications/factbook/index.html; International Monetary Fund, World Economic Outlook database, 2007, at www.imf.org/external/pubs/ft/weo/2007/01/data/index.htm; and Kim R. Holmes, Edwin J. Feulner, and Mary Anastasia O’Grady, 2008 Index of Economic Freedom (Washington, D.C.: The Heritage Foundation and Dow Jones & Company, Inc., 2008), at www.heritage.org/index.
$-
$15,000
$30,000
$45,000
20 35 50 65 80 95
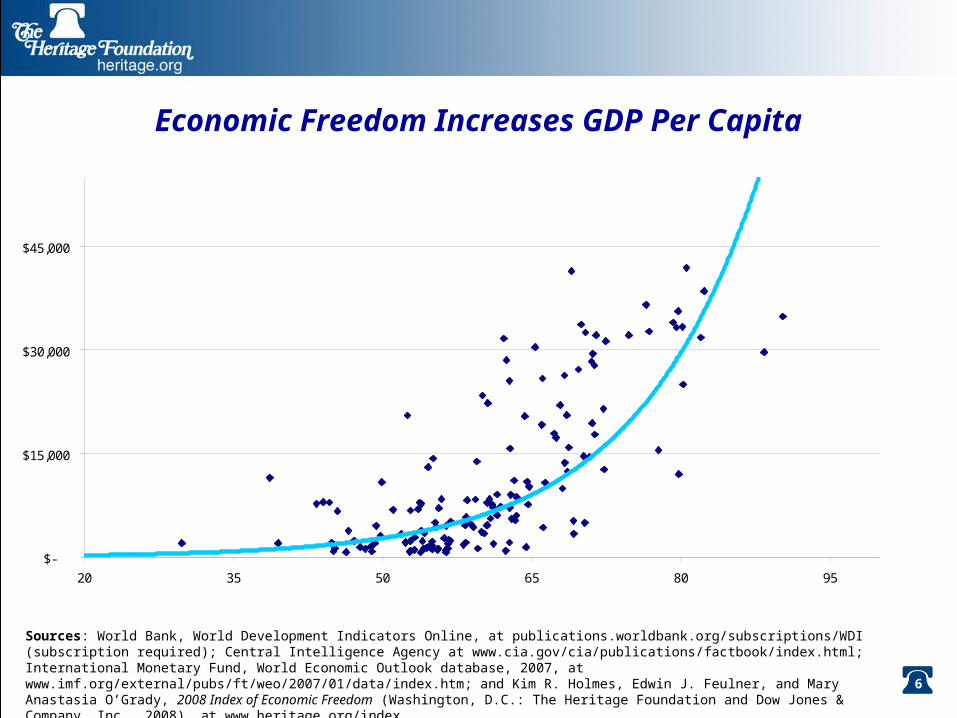
2008 Economic Freedom Score
GDP per Capita in Purchasing Power Parity
7
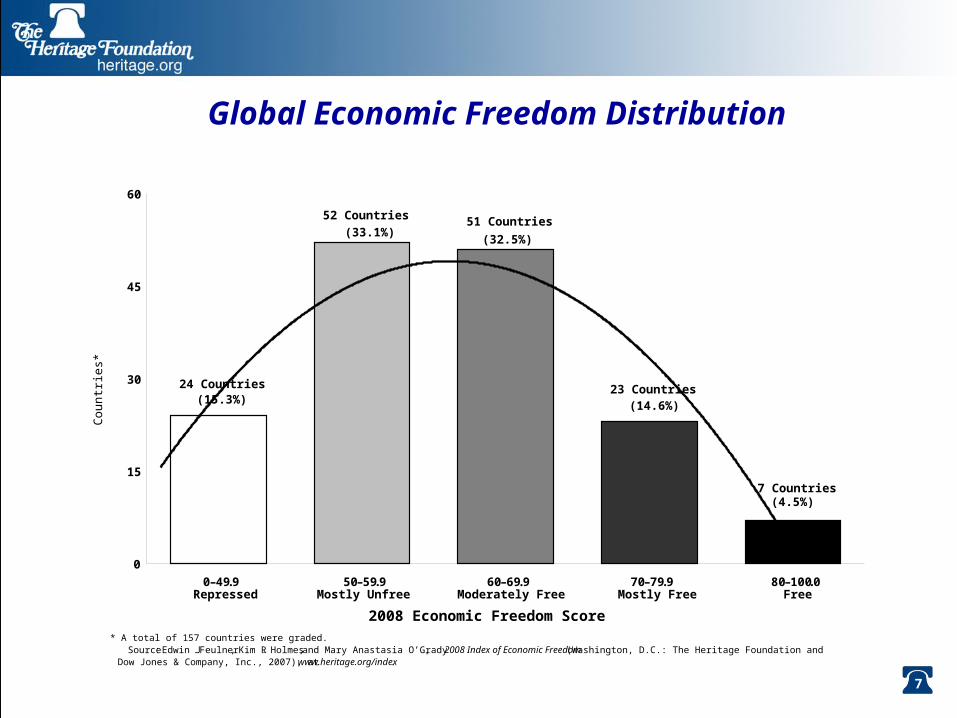
Global Economic Freedom Distribution
7 Countries
23 Countries
51 Countries52 Countries
24 Countries
0
15
30
45
60
80–100.070–79.960–69.950–59.90–49.9
Cou
ntr
ies*
2008 Economic Freedom Score* A total of 157 countries were graded.
Source: Edwin J. Feulner, Kim R. Holmes, and Mary Anastasia O’Grady, 2008 Index of Economic Freedom (Washington, D.C.: The Heritage Foundation and Dow Jones & Company, Inc., 2007), at www.heritage.org/index.
business climate– Mongolia – implementing tax cuts and reducing government spending
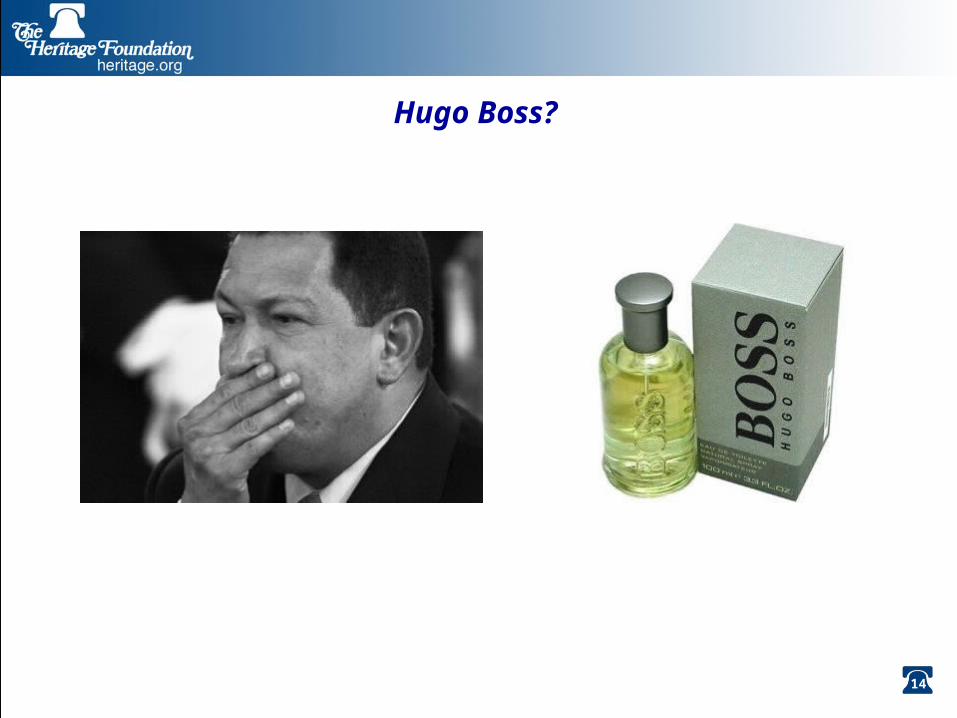
• Bottom 3: Most Severe Reduction in Economic Freedom Scores– Guyana – dramatic increase in government spending – Bangladesh – deteriorated property rights and labor freedom– Venezuela – significantly reduced property rights and trade freedom
99
Which Countries Enjoy Economic Freedom?Top 10
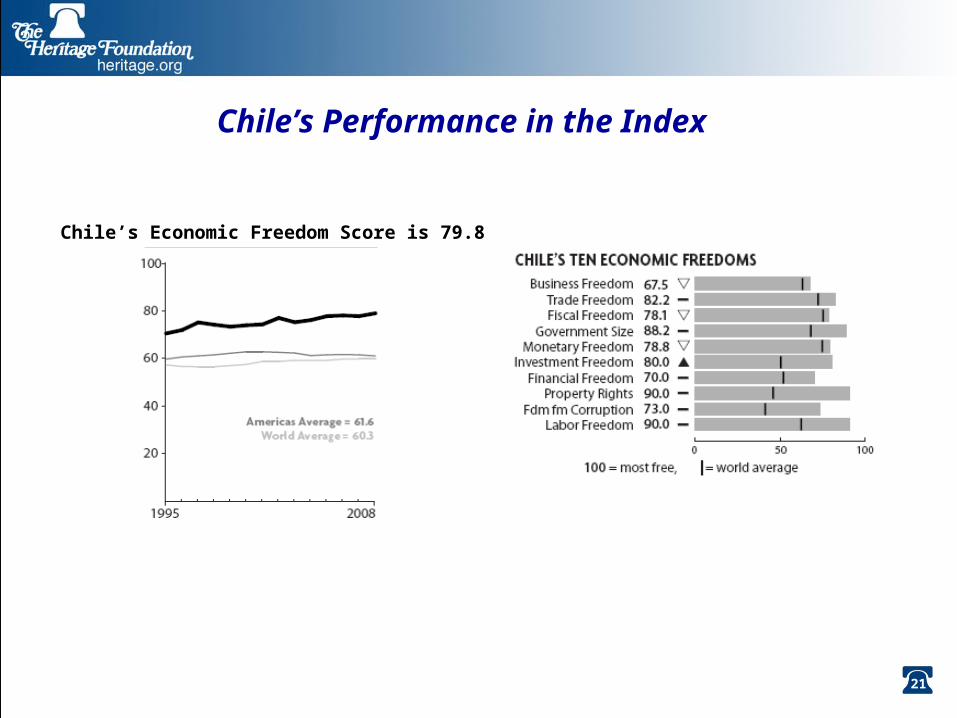
1. Hong Kong 2. Singapore3. Ireland4. Australia5. United States6. New Zealand7. Canada8. Chile
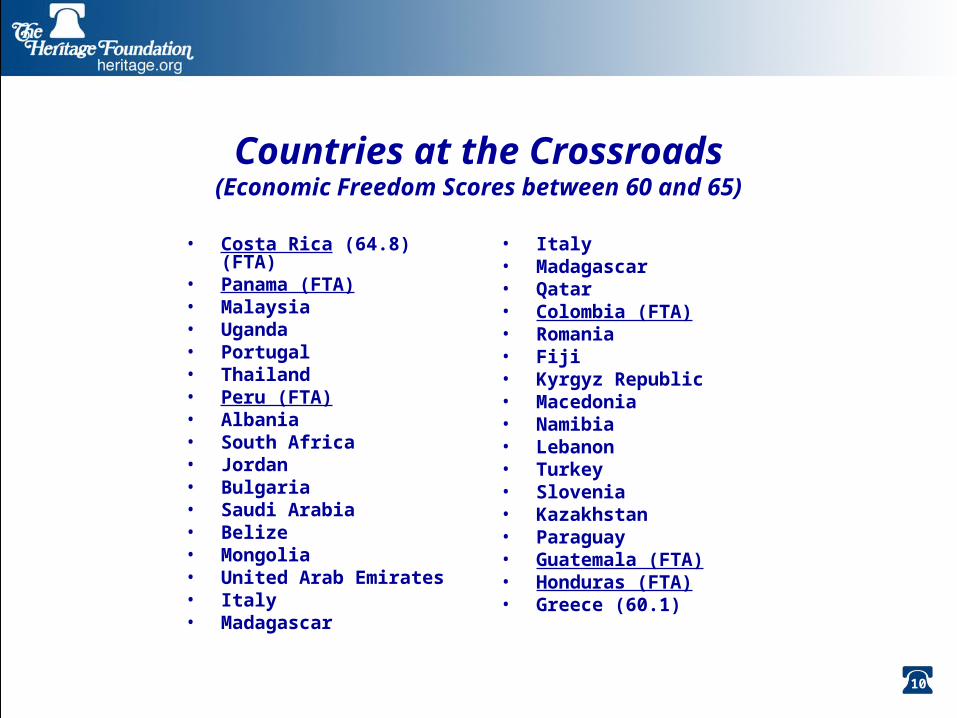
Countries at the Crossroads(Economic Freedom Scores between 60 and 65)
• Costa Rica (64.8) (FTA)• Panama (FTA)• Malaysia• Uganda• Portugal• Thailand• Peru (FTA)• Albania• South Africa• Jordan• Bulgaria• Saudi Arabia• Belize• Mongolia• United Arab Emirates• Italy• Madagascar
Crossroads for Critical Policy Decisions That Will Increase GDP Per Capita
Sources: World Bank, World Development Indicators Online, at publications.worldbank.org/subscriptions/WDI (subscription required); Central Intelligence Agency at www.cia.gov/cia/publications/factbook/index.html; International Monetary Fund, World Economic Outlook database, 2007, at www.imf.org/external/pubs/ft/weo/2007/01/data/index.htm; and Kim R. Holmes, Edwin J. Feulner, and Mary Anastasia O’Grady, 2008 Index of Economic Freedom (Washington, D.C.: The Heritage Foundation and Dow Jones & Company, Inc., 2008), at www.heritage.org/index.
$-
$15,000
$30,000
$45,000
20 35 50 65 80 95
2008 Economic Freedom Score
GDP per Capita in Purchasing Power Parity Critical Junction
12
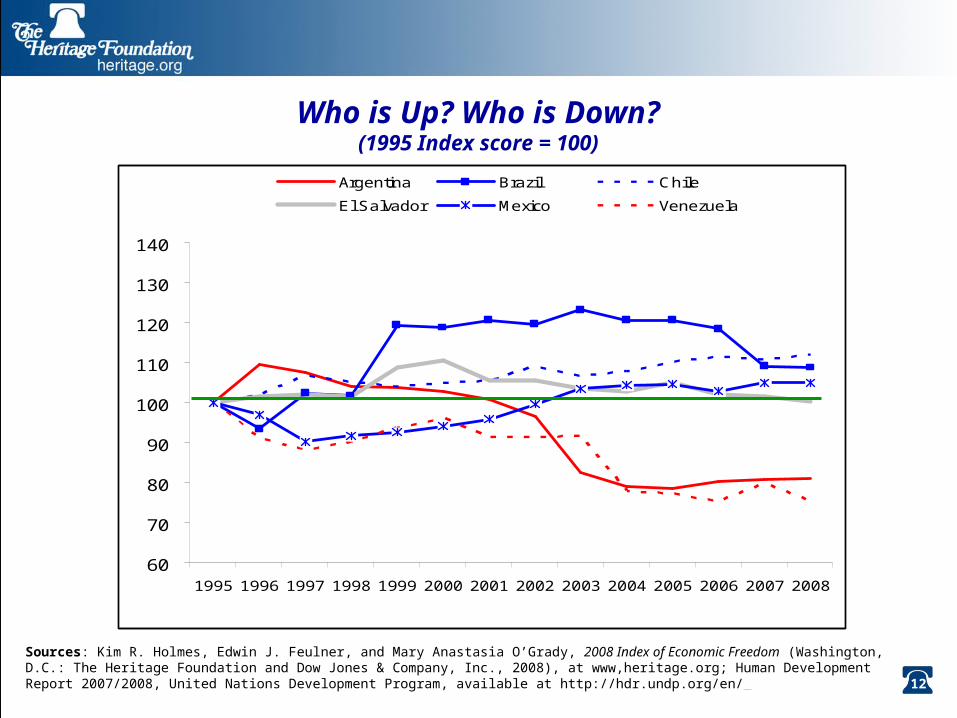
Who is Up? Who is Down?(1995 Index score = 100)
Sources: Kim R. Holmes, Edwin J. Feulner, and Mary Anastasia O’Grady, 2008 Index of Economic Freedom (Washington, D.C.: The Heritage Foundation and Dow Jones & Company, Inc., 2008), at www,heritage.org; Human Development Report 2007/2008, United Nations Development Program, available at http://hdr.undp.org/en/
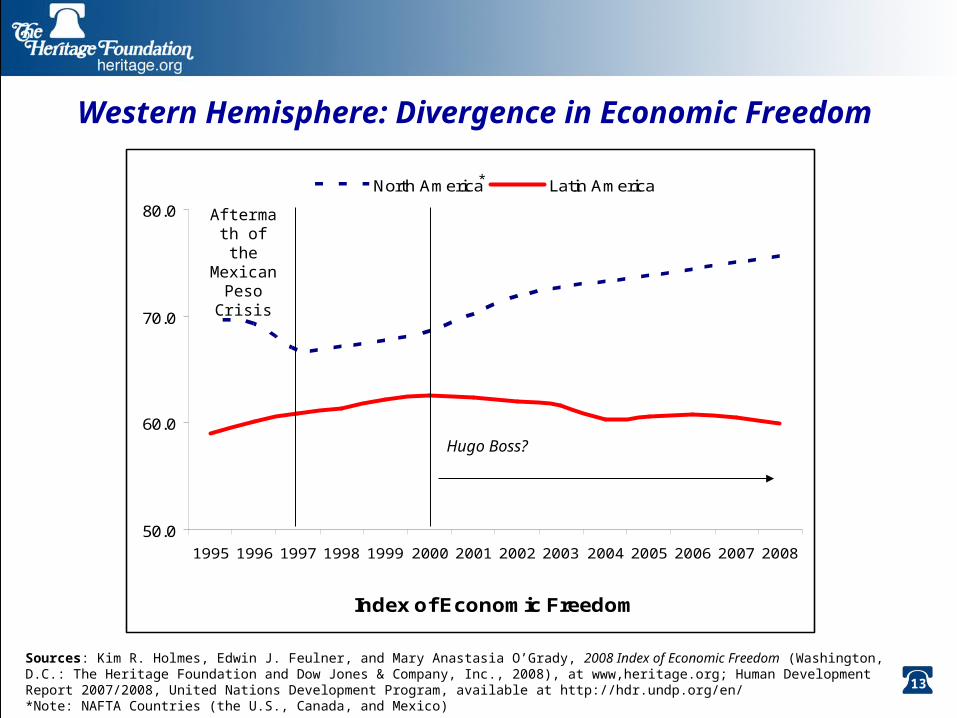
Western Hemisphere: Divergence in Economic Freedom
Sources: Kim R. Holmes, Edwin J. Feulner, and Mary Anastasia O’Grady, 2008 Index of Economic Freedom (Washington, D.C.: The Heritage Foundation and Dow Jones & Company, Inc., 2008), at www,heritage.org; Human Development Report 2007/2008, United Nations Development Program, available at http://hdr.undp.org/en/ *Note: NAFTA Countries (the U.S., Canada, and Mexico)
Regional Performance in the 2008 Index • Global average economic freedom score is 60.3. (median: 60.2)• Europe has the highest average economic freedom score, while Sub-
Saharan Africa has the lowest score.
58.7
66.8
61.5
58.7
54.5
60.27
58.6
66.4
61.9
58.2
54.8
60.24
50.0
60.0
70.0
Asia–Pacific Europe Americas Middle East/NorthAfrica
Sub-SaharanAfrica
World
2008 Index 2007 Index
Source: Edwin J. Feulner, Kim R. Holmes, and Mary Anastasia O’Grady, 2008 Index of Economic Freedom (Washington, D.C.: The Heritage Foundation and Dow Jones & Company, Inc., 2008), at www.heritage.org/index.
*
*Note: Including NAFTA countries (the U.S., Canada, and Mexico)
16
Economic Freedom Matters in Every Region
Sources: Kim R. Holmes, Edwin J. Feulner, and Mary Anastasia O’Grady, 2008 Index of Economic Freedom (Washington, D.C.: The Heritage Foundation and Dow Jones & Company, Inc., 2008), at www,heritage.org;
$31,365$30,511
$19,297
$7,718$9,316
$3,381$4,669
$6,257
$1,432
$24,888 (Without the US and
Canada $13,806)
$0
$7,000
$14,000
$21,000
$28,000
EUROPE ASIA AMERICAS NA AND ME SUB-SAHARA
Average GDP per Capita
(PPP US$)
5 FREEST 5 LEAST FREEMOST FREE
17
North America vs. Latin America?
Sources: Kim R. Holmes, Edwin J. Feulner, and Mary Anastasia O’Grady, 2008 Index of Economic Freedom (Washington, D.C.: The Heritage Foundation and Dow Jones & Company, Inc., 2008), at www,heritage.org; Human Development Report 2007/2008, United Nations Development Program, available at http://hdr.undp.org/en/ Property Rights and Corruption: low scores in Latin America
25 50 75 100
2008 Score
Business
Trade
Fiscal
Gov't Size
Monetary
Investment
Financial
Property Rights
Corruption
Labor
North America (U.S., Canada, and Mexico) Latin America
18
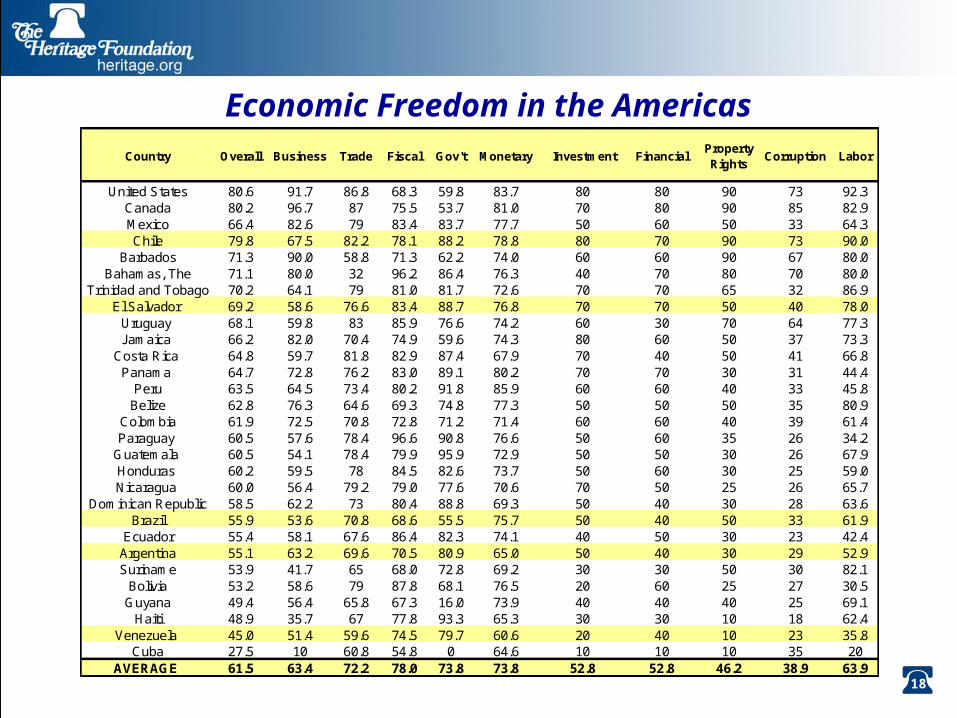
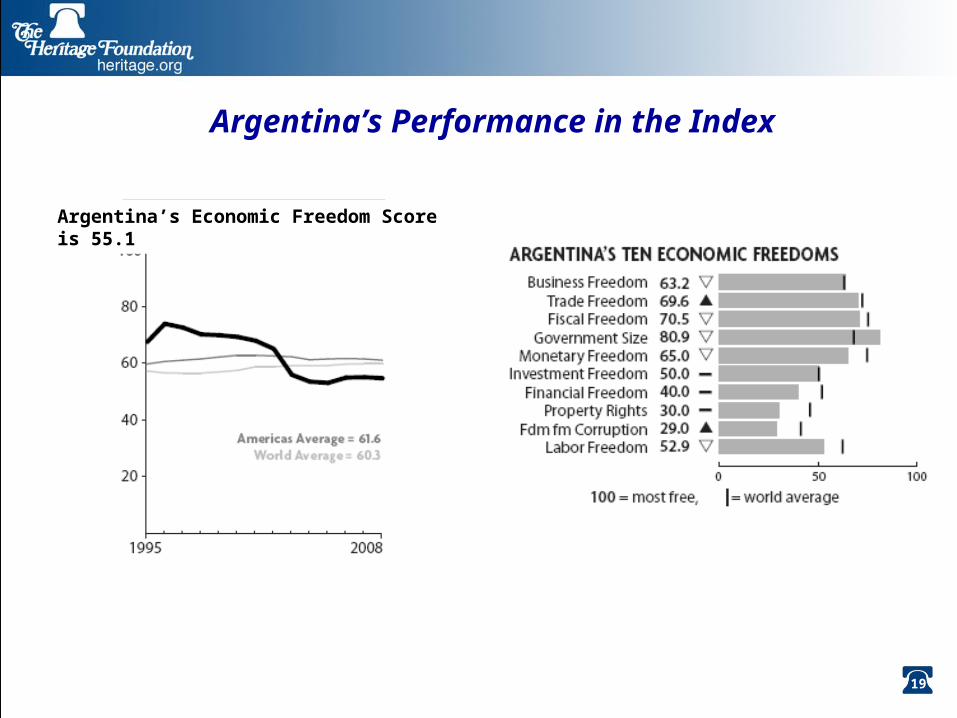
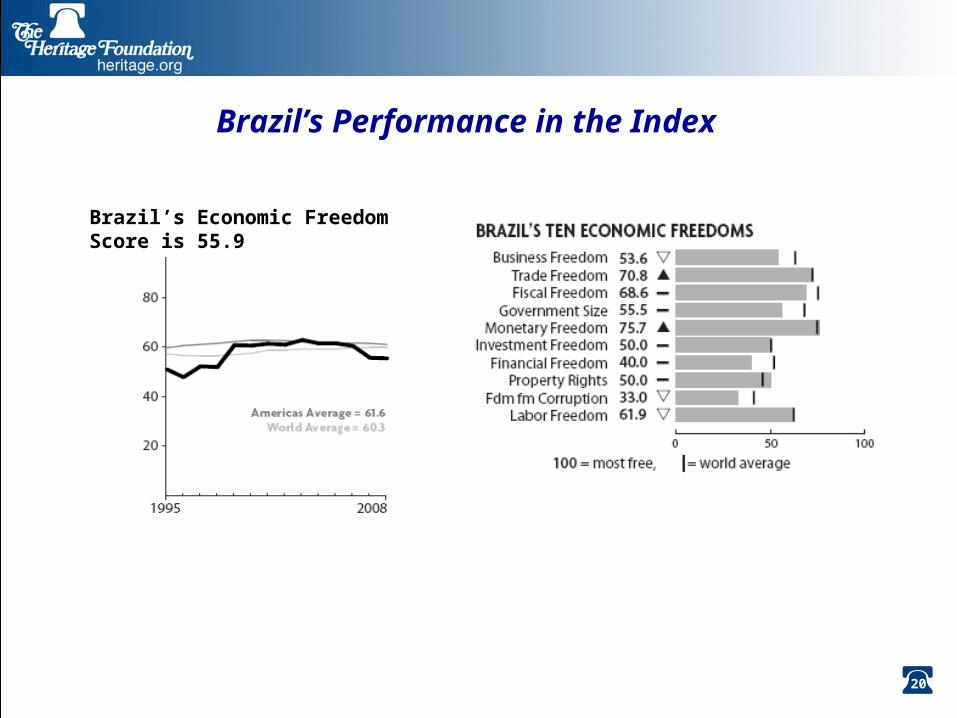
Economic Freedom in the Americas
Country Overall Business Trade Fiscal Gov't Monetary Investment FinancialProperty Rights