60
1 Women & Crime Perpetrators & Victims
| Date post: | 14-Dec-2015 |
| Category: |
Documents |
| Upload: | trenton-wigfield |
| View: | 213 times |
| Download: | 0 times |

11
Women & Crime
Perpetrators & Victims

22
Outline
I. Arrest rates for Women Vs. Men
II. Labor Force Trends For Women
III. Violence Amongst Intimates
IV. Labor Market Analysis for Women
V. Demographic Trends
VI. Forcible Rape
VII. International Traffic in Women

33
Trends in Arrest Rates All Offenses

44
Arrest Rates for Violent Index Offenses

55
Arrest Rates for Property Index Offenses

66
Arrest rates For Murder

77
Arrest Rates For Robbery
88
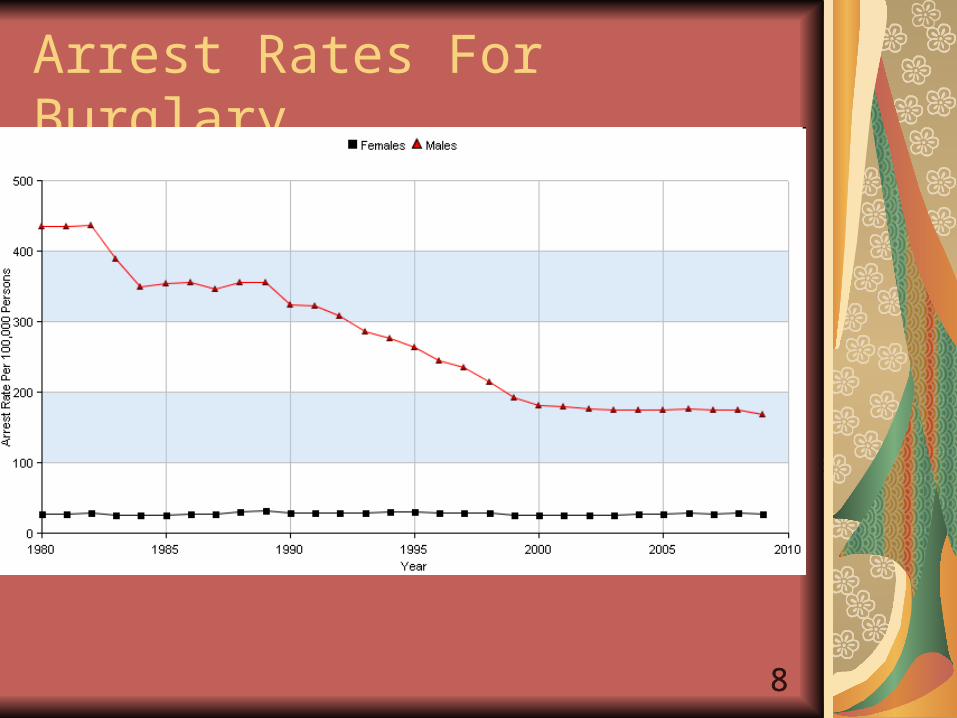
Arrest Rates For Burglary

99
Arrest Rates For Motor Vehicle Theft
1010
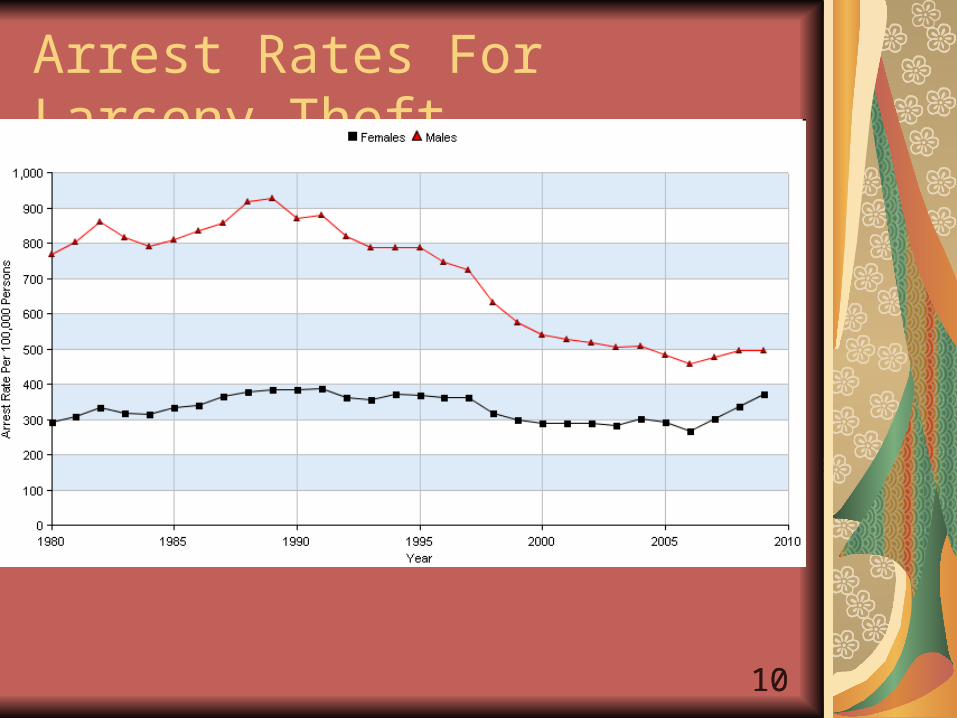
Arrest Rates For Larceny-Theft

1111
Arrest rates For Prostitution and Commercialized Vice

1212
Trends In Arrest Rates For Embezzlement

1313
ConclusionsWomen are becoming more involved in crimeWomen do not like confrontational types of crime
Not so much into violent crime or robbery
As women work, opportunities changeEmbezzlement by women increasingProstitution decreasing

1414
Labor Force Trends For Women
Rosie the Riveter During WWII
Meg Whitman: E-Bay/ Candidate forGovernor/ CEO of Hewlett-Packard

1515
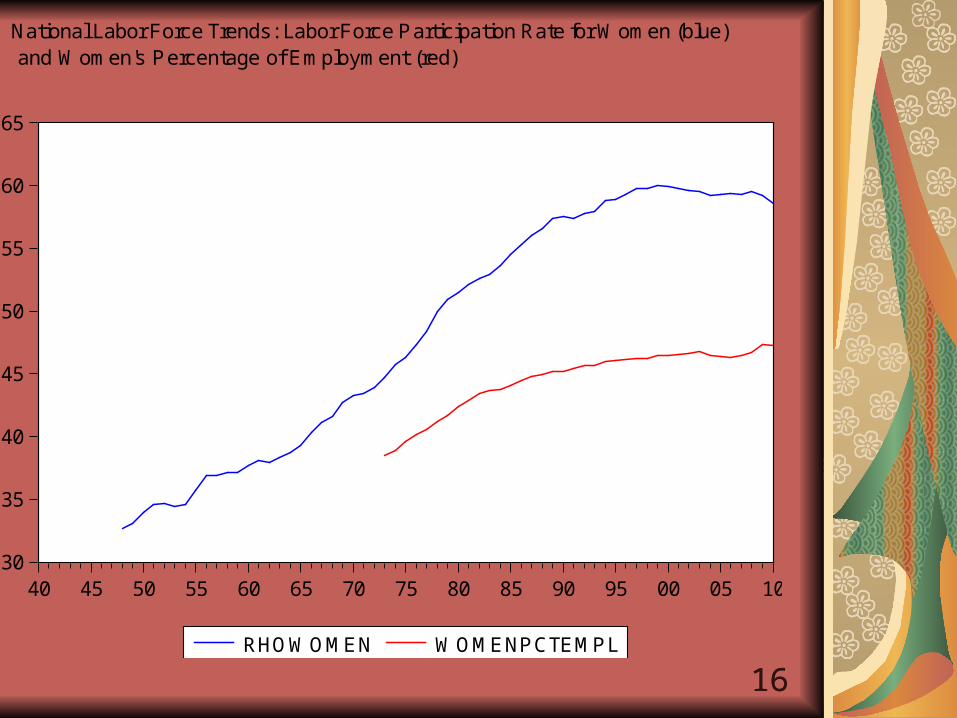
Labor Force Trends For Women
In 1948, nearly one third of women participated in the labor force. By 2008, nearly sixty percent of women participated in the labor force
In 1973, women accounted for 38.5% of national employment. By 2010, this number was over 47 %.
1616
30
35
40
45
50
55
60
65
40 45 50 55 60 65 70 75 80 85 90 95 00 05 10
RHOWOMEN WOMENPCTEMPL
National Labor Force Trends: Labor Force Participation Rate for Women (blue) and Women's Percentage of Employment (red)

1717
Household Survey
Civilian Non-institutionalPopulation, CNIP
Labor Force,LF
Not In The Labor Force, NLF
Employed, E
Unemployed, U
Labor Force Participation Rate, ρ = LF/CNIP

1818
Labor Force Trends For Women
As more women left the role of house wife for the labor force, the nature of the home changed
As women became a larger presence in the workplace, the nature of the workplace changed

1919
In Contrast: Labor Force Partipation Rate Trends For Young Men, 16-24
56
60
64
68
72
76
80
40 45 50 55 60 65 70 75 80 85 90 95 00 05 10
RHOMEN1624

2020
Trends In Property Offense Rates
1,000
2,000
3,000
4,000
5,000
6,000
60 65 70 75 80 85 90 95 00 05 10
PROPERTY
56
60
64
68
72
76
60 65 70 75 80 85 90 95 00 05 10
RHOMEN1624
National Property Crime Rates Per 100,000 andthe Labor Force Participation Rate for Males 16-24. 1960-2010

2121
A statistical analysis of the US property crime rate from 1960 through 2010 was conducted, and the crime rate was positively correlated with the labor force participation rate for men ages 16-24, lagged two years, and negatively correlated with the labor force participation rate for women, lagged three years.

2222
Property Crime Rate : Observed & Regression Estimate
-300
-200
-100
0
100
200
300
1,000
2,000
3,000
4,000
5,000
6,000
1965 1970 1975 1980 1985 1990 1995 2000 2005 2010
Residual Actual Fitted

2323
III. Violence Amongst intimatesI
http://bjs.ojp.usdoj.gov/content/intimate/ipv.cfm

2424
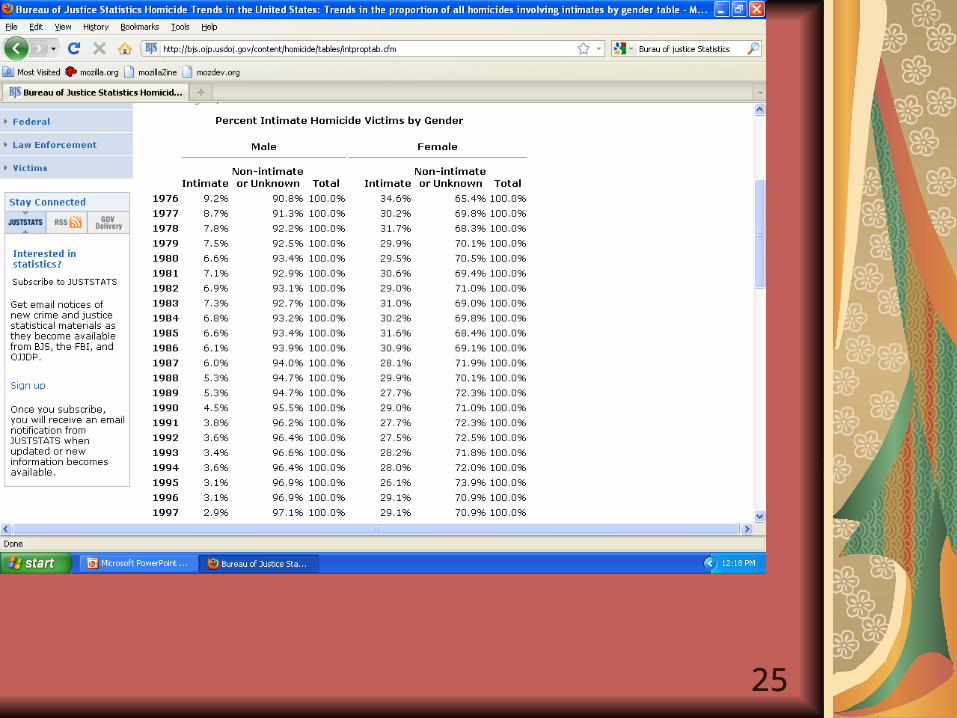
Role of Intimates In Homicides
2525

2626
Victims of Homicide by Intimates

2727
Intimate Partner Victims

2828
Intimate Homicides By Relationship

2929
Homicide By Intimates Rates

3030
Non-fatal Rates Per 1000
3131
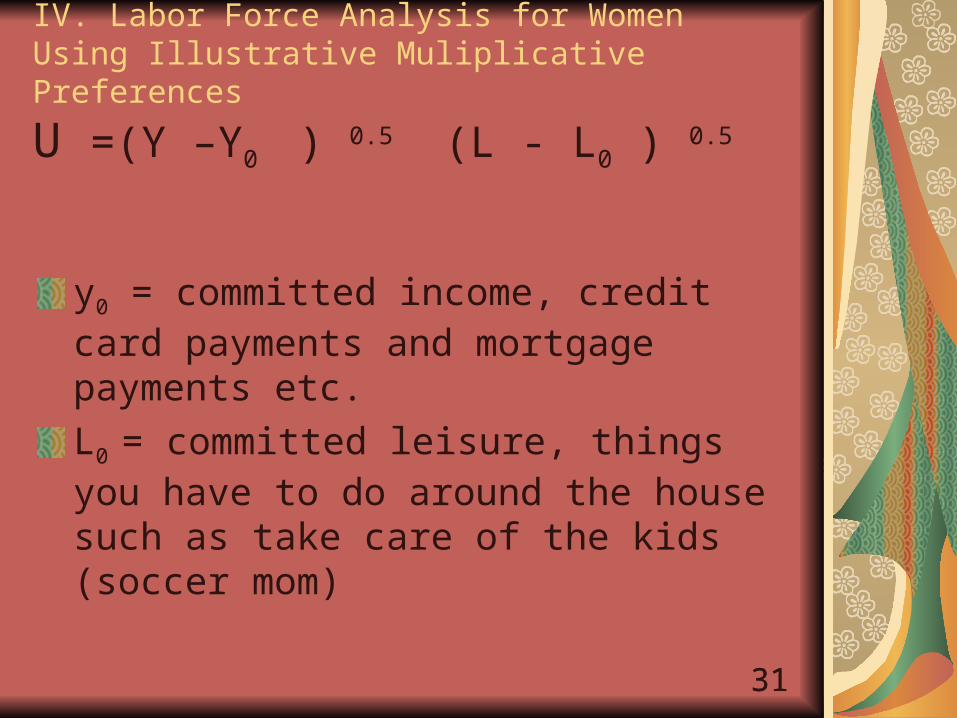
IV. Labor Force Analysis for Women Using Illustrative Muliplicative Preferences
U =(Y –Y0 ) 0.5 (L - L0 ) 0.5
y0 = committed income, credit card payments and mortgage payments etc.
L0 = committed leisure, things you have to do around the house such as take care of the kids (soccer mom)

3232
Fifties and Sixties
Male was the bread-winner, female did the chores around the house

3333
Illustration of Multiplicative Preferences, Cobb-Douglas
0
1000
2000
3000
4000
5000
6000
7000
0 5 10 15 20 25 30
Leisure
Inc
om
e
8 hours work, $25/hr
U =(Y –Y0 ) 0.5 (L - L0 ) 0.5 ,y0 =0 = L0

3434
30
35
40
45
50
55
60
65
40 45 50 55 60 65 70 75 80 85 90 95 00 05 10
RHOWOMEN WOMENPCTEMPL
National Labor Force Trends: Labor Force Participation Rate for Women (blue) and Women's Percentage of Employment (red)
3535
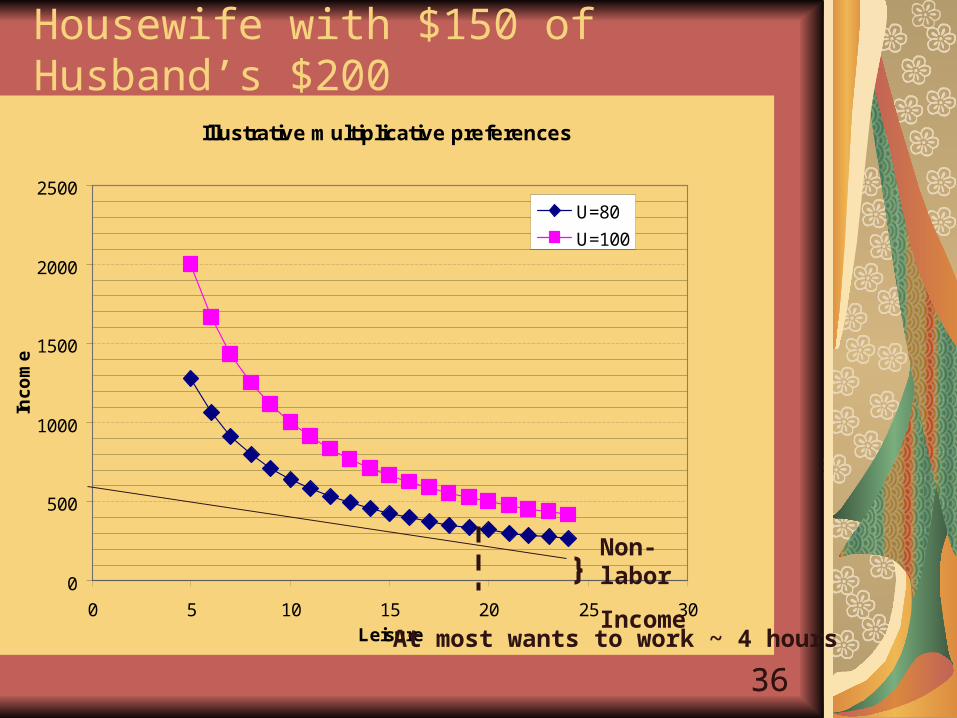
Housewife with $150/day of Husband’s $200/day for Household
Treat $150/day as her non-labor income so less likely to work
Possibly the story in the fifties and sixties
3636
Illustrative multiplicative preferences
0
500
1000
1500
2000
2500
0 5 10 15 20 25 30Leisure
Inc
om
e
U=80
U=100
Housewife with $150 of Husband’s $200
Non-labor
IncomeAt most wants to work ~ 4 hours

3737
Single woman with Kids & Alimony
Ten hours of committed leisureU =(Y – 0)0.5 (L – 10)0.5

3838
Single Woman with Kids & Alimony
0
Illustrtive Multiplicative Preferences
0
500
1000
1500
2000
2500
0 5 10 15 20 25 30
Leisure
Inc
om
e
U=80
U=100
Alimony
Wants to work at most six0 5

3939
Single Woman with Kids, No Alimony, & $150/day of Committed Income
Illustrtive Multiplicative Preferences
0
500
1000
1500
2000
2500
0 5 10 15 20 25 30
Leisure
Inc
om
e
U=80
U=100
Wants to work ~ 8 hours
origin

4040
Modern Woman, Husband Earns $200/day, expenses plus mortgage amounts to $250/day: works 8 hours
Illustrative Multiplicative Preferences
0
500
1000
1500
2000
2500
0 5 10 15 20 25 30
Leisure
Inc
om
e
U=80
U=100
origin
Wants to work ~ 8 hours/day

4141
Currently; Home Ownership is Going Down

4242
Age At First Marriagehttp://www.userniche.com/LoveAndDivorce/ASP/UserNicheMainPage.asp?ID=23

4343
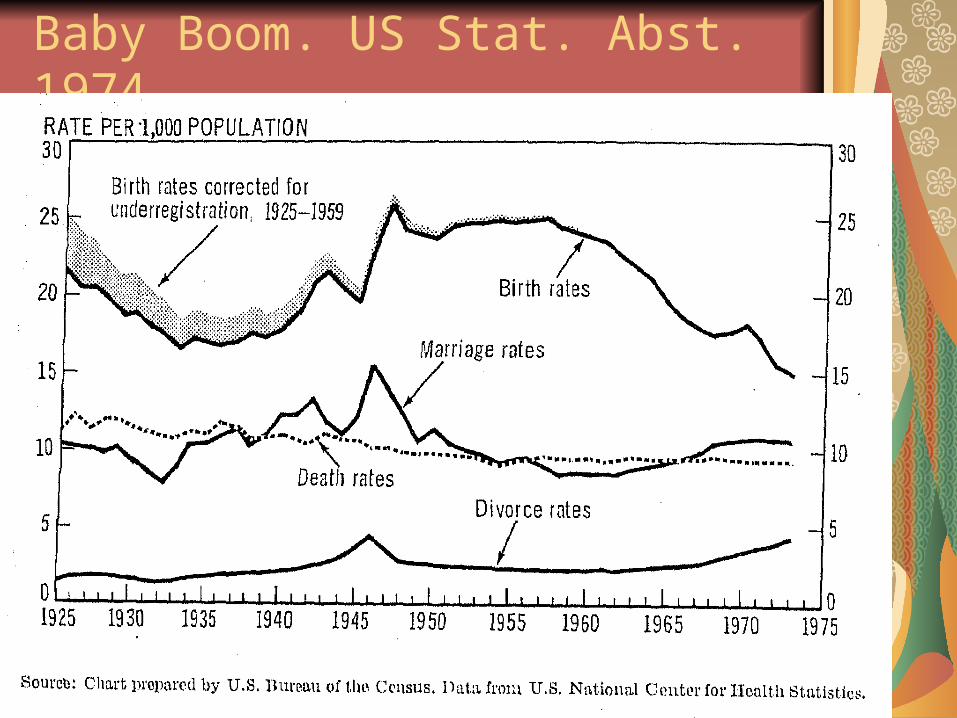
V. Relationship Trends
Marriage Rates
Divorce Rates
Birth Rates

4444
US Statistical Abstract 1953
4545
Baby Boom. US Stat. Abst. 1974

4646
The Long View: Greenwood & Gruner

4747

4848
Where Did All the Married Women Go? How Long Will You Be Married?

4949

5050
OECD Marriage & Divorce Rateshttp://www.oecd.org/dataoecd/4/19/40321815.pdf

5151
Marriage Market

5252
Greenwood-Gruner Model

5353
Living Arrangements For Young Women, 1880-2000

5454
If You Have a Microwave Who Needs a Significant Other?

55
Rape
55
56
8
12
16
20
24
28
32
36
40
44
50 55 60 65 70 75 80 85 90 95 00 05 10
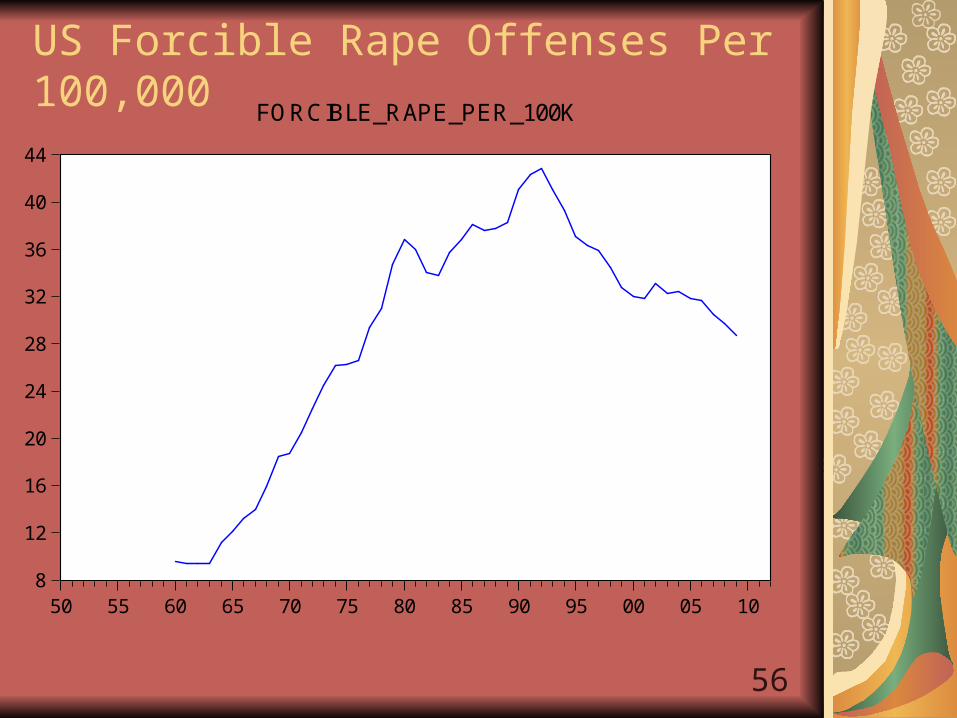
FORCIBLE_RAPE_PER_100K
US Forcible Rape Offenses Per 100,000

5757

58
Uniform Crime Report 2010

59
0
10
20
30
40
50
50 55 60 65 70 75 80 85 90 95 00 05 10
FORCIBLE_RAPES_PER_100K
38
40
42
44
46
48
50
52
50 55 60 65 70 75 80 85 90 95 00 05 10
CLEARANCE_RATIO_RAPE
FBIUniformCrime Reports

6060
International Traffic in Women


