Page 1
110 Informatica Economică vol. 16, no. 1/2012
Survey of Clustering based Financial Fraud Detection Research
Andrei Sorin SABAU
Faculty of Mathematics and Computer Science
University of Pitesti, Pitesti, Romania
[email protected]
Given the current global economic context, increasing efforts are being made to both prevent
and detect fraud. This is a natural response to the ascendant trend in fraud activities
recorded in the last couple of years, with a 13% increase only in 2011. Due to ever increasing
volumes of data needed to be analyzed, data mining methods and techniques are being used
more and more often. One domain data mining can excel at, suspicious transaction
monitoring, has emerged for the first time as the most effective fraud detection method in
2011. Out of the available data mining techniques, clustering has proven itself a constant
applied solution for detecting fraud. This paper surveys clustering techniques used in fraud
detection over the last ten years, shortly reviewing each one.
Keywords: Fraud Detection, Data Mining, Clustering
Introduction
Given the current global economic
context, increasing efforts are being made to
both prevent and detect fraud. This is a
natural response to the ascendant trend in
fraud activities recorded in the last couple of
years, with a 13% increase only in 2011 [1].
Due to ever increasing volumes of data
needed to be analyzed, data mining methods
and techniques are being used more and more
often. One domain data mining can excel at,
suspicious transaction monitoring, has
emerged for the first time as the most
effective fraud detection method in 2011. Out
of the available data mining techniques,
clustering has proven itself a constant applied
solution for detecting fraud.
The current study contains an introduction to
financial fraud, reviews clustering
mathematical foundations and most
commonly used clustering techniques,
surveys research done in this area for the last
ten years, concludes with some insights on
clustering usage in fraud detection activities.
Although a universally understood term,
fraud can have multiple meanings and be
interpreted in different ways depending on its
definition source. Fraud, in general, is
defined in Oxford English Dictionary [2] as
“wrongful or criminal deception intended to
result in financial or personal gain.”
Following the same line, Black's Law
Dictionary [3] defines fraud as "a knowing
misrepresentation of the truth or concealment
of a material fact to induce another to act to
his or her detriment." A definition for
financial fraud can be deducted from
financial fraud main categories: bank fraud,
insurance fraud, securities and commodities
fraud.
At a more in-depth level, we can detail credit
card and money laundering fraud as bank
fraud while healthcare, automobile and crop
related frauds are the most common
insurance frauds. Detection of all the above
financial fraud types can be conducted with
all data mining techniques with the current
study focusing on clustering, either
standalone clustering techniques or hybrid
ones combined with classification
techniques, mostly neural networks and
decision trees. Standalone clustering
techniques can be viewed as unsupervised
data mining while hybrid ones can be viewed
as semi-supervised data mining.
2 Financial fraud taxonomies The scientific literature presents several
definitions and taxonomies for the “fraud”
concept. An understanding of these
definitions and classification models is
fundamental to prevent and detect fraud.
Definition of fraud is important to be known
for both accounting and auditing profession,
1
Page 2
Informatica Economică vol. 16, no. 1/2012 111
and for economic entities, in order to develop
an anti-fraud program. Detailed knowledge
and awareness of fraud can prevent or even
reverse the syndrome '' it-can't-happen-here''
[4].
According to U.S. Association of Certified
Fraud Examiners (ACFE), fraud is classified
as fraud and abuse in the workplace, and
financial statement fraud. Occupational fraud
is defined as: ''The use of one’s occupation
for personal enrichment through the
deliberate misuse or misapplication of the
employing organization’s resources or
assets". ACFE defines fraud financial
statements as: ''deliberate misrepresentation
of the financial condition of an enterprise
accomplished through the intentional
misstatement or omission of amounts or
disclosures in the financial statements in
order to deceive financial statement users.''
The scientific literature provides various
clustering and classification systems for
categorizing fraud. Some are similar, while
others are redundant and ask questions of
interpretation. Common factors found in the
research field, determining fraud
classifications, are: type of responsibility to
the organization's position, motivational
relationships to the organization, the criminal
group.
Table 1. Fraud taxonomies [4]
Bologna and
Lindquist
Albrechet and
Albrecht
Singleton and
Singleton
KPMG
• Internal Fraud
against
organization
• External Fraud
against
organization
• Fraud for
organization
• Employee
Misappropriation
• Management
Fraud
• Investment Fraud
• Suppliers Fraud
• Clients Fraud
• Other Fraud Types
• Tort or criminal
liability Fraud
• Fraud for or
against the
organization
• Internal or
external fraud
• Management or
non-management
Fraud
• Employee Fraud
• Suppliers Fraud
• Clients Fraud
• Informatics Fraud
• Misadministration
• Medical and
insurance Fraud
• Financial
Statement Fraud
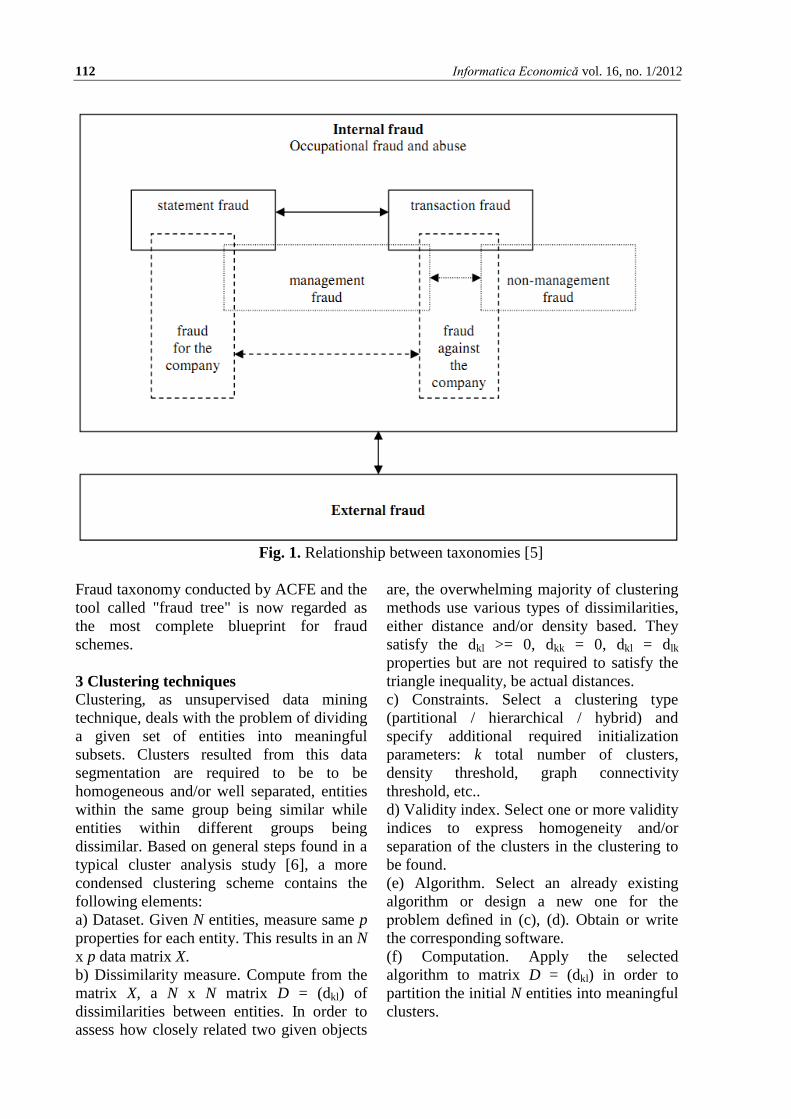
All the above classifications present cross
cutting issues overlapping each other. [5]
overviews how these different classifications
interact with each other, mainly within
internal and external fraud projections.
ACFE has developed a fraud classification
model, known as the "fraud tree", which lists
approximately 49 different individual fraud
schemes, grouped into categories and
subcategories.
The three main categories in which fraud is
classified, are:
• Fraudulent Statements;
• Assets Misappropriation;
• Corruption.
Fraudulent statements schemes are made
usually by people in senior management and
are producing the biggest losses for the
affected organization.
Assets misappropriation schemes are usually
made by employees and can be also
classified into subcategories. They have the
highest frequency of occurrence and are
those that produce the lowest losses. The
fraud tends to be insignificant at an
individual level and it is very difficult to be
recognized by both internal and external
auditors during audits.
Page 3
112 Informatica Economică vol. 16, no. 1/2012
Fig. 1. Relationship between taxonomies [5]
Fraud taxonomy conducted by ACFE and the
tool called "fraud tree" is now regarded as
the most complete blueprint for fraud
schemes.
3 Clustering techniques Clustering, as unsupervised data mining
technique, deals with the problem of dividing
a given set of entities into meaningful
subsets. Clusters resulted from this data
segmentation are required to be to be
homogeneous and/or well separated, entities
within the same group being similar while
entities within different groups being
dissimilar. Based on general steps found in a
typical cluster analysis study [6], a more
condensed clustering scheme contains the
following elements:
a) Dataset. Given N entities, measure same p
properties for each entity. This results in an N
x p data matrix X.
b) Dissimilarity measure. Compute from the
matrix X, a N x N matrix D = (dkl) of
dissimilarities between entities. In order to
assess how closely related two given objects
are, the overwhelming majority of clustering
methods use various types of dissimilarities,
either distance and/or density based. They
satisfy the dkl >= 0, dkk = 0, dkl = dlk
properties but are not required to satisfy the
triangle inequality, be actual distances.
c) Constraints. Select a clustering type
(partitional / hierarchical / hybrid) and
specify additional required initialization
parameters: k total number of clusters,
density threshold, graph connectivity
threshold, etc..
d) Validity index. Select one or more validity
indices to express homogeneity and/or
separation of the clusters in the clustering to
be found.
(e) Algorithm. Select an already existing
algorithm or design a new one for the
problem defined in (c), (d). Obtain or write
the corresponding software.
(f) Computation. Apply the selected
algorithm to matrix D = (dkl) in order to
partition the initial N entities into meaningful
clusters.
Page 4
Informatica Economică vol. 16, no. 1/2012 113
(g) Interpretation. Apply formal tests based
on validity indices selected in (d) on all data
segmentations obtained in (f). Based on
overall data understanding of the initial N
entities, apply informal tests as well.
Describe clusters by their lists of entities and
descriptive statistics. Proceed to a substantive
interpretation of the results.
The above elements can be projected in main
clustering activities. Pattern representation,
including feature extraction, leads to the
target dataset. Based on the target data
domain, choosing a pattern proximity
measure leads to the target dissimilarity
measure. The above constraints, validity
indices, algorithm definition and computation
clustering elements can be viewed as the
clustering grouping activity. Fig. 2 illustrates
these main clustering activities [7], including
a feedback loop incrementally improving
clustering results.
Fig. 2. Main clustering activities [7]
Regardless of the clustering technique used
and its position in the overall taxonomy –
Fig. 3, cross cutting issues always appear and
must be taken into consideration in order to
fully describe a given clustering algorithm
[7]. Following this path, algorithms can be
agglomerative or divisive – in the beginning
each point represents one cluster or all points
represent one cluster, monothetic or
polythetic – sequential or simultaneous use
of data features, crisp or fuzzy – whether or
not a data point belongs to one or multiple
clusters, deterministic or stochastic –
clustering optimization achieved via either
deterministic objective function or random
search technique, incremental or non-
incremental – whether or not the original
target dataset can be increased.
Fig. 3. Clustering taxonomies [7]
With many different, overlapping taxonomies
of clustering algorithms, the most common
generic criteria is represented by the way
clusters are formed dividing clustering
techniques in hierarchical and partitional
clustering. Hierarchical clustering groups
Page 5
114 Informatica Economică vol. 16, no. 1/2012
entities with a sequence of partitions, either
starting with singleton clusters –
agglomerative hierarchical clustering, or
starting from a single cluster containing all
entities – divisive hierarchical clustering.
Partitional clustering methods can be divided
in prototype based methods, density based
methods (grid based, graph based), mixture-
resolving methods, metaheuristic based.
Prototype based methods have a prototype
representing each cluster, either dynamically
generated as an average function of all
entities within the given cluster or
represented by one representative entity
within the given cluster. Prototype based
methods objective is to minimize a cost
function defined by distances between all
entities within a given cluster and cluster
prototype. One of the most used cost
functions is the squared error function
present in k-means, k-medoid, k-modes
algorithms and their variances. Density based
methods start from the assumption that the
entire dataset is partitioned in tightly
grouped/ high density clusters separated by
low density regions. A popular algorithm of
this type is dbscan. Grid based algorithms
and graph based ones are also included in the
density based category. By relying on the
assumption the entire dataset is drawn from a
given set of distributions (Gaussian is usually
used), mixture-resolving methods attempt to
resolve the given distributions parameters in
order to clearly define the clusters. For
metaheuristic based methods, combinatorial
search for optimizing a given clustering
solution is being conducted via tabu search,
scatter search, simulated annealing, genetic
and nature inspired algorithms. With relative
low impact changes to the above clustering
algorithms, all clustering methods can
produce hard or fuzzy clusters. Hard
clustering assigns one entity to only one
cluster where soft clustering deals with
probabilities of one entity belonging to each
cluster. In this sense, hard clustering can be
viewed as a special case of fuzzy clustering.
4 Methodological research framework In terms of research definition, this paper's
research area is represented by academic
research on financial fraud detection making
use of clustering data mining techniques –
Fig. 4. The research scope covers papers
published in the last twelve years, between
2000 and 2011. Considering the momentum
data mining techniques are building as tools
in fraud detection and prevention, this time
span contains the most relevant research to
date.
As part of research methodology, multiple
criteria for searching and selecting articles
have been defined together with an article
classification framework. In an initial stage,
Thomson Reuters Web of Science, IEEE
Transactions, ScienceDirect Freedom
Collection and Springer-Link Contemporary
have been searched against "cluster* fraud*"
regular expression contained in the articles'
topic field. Relevant articles had their
bibliography considered for inclusion as
well, up to two articles deep. In a second
stage, clustering connected to each major
form of financial fraud has been searched
against Google Scholar with the first 100
entries being considered for inclusion,
together with relevant bibliography entries.
The search expressions contained the
keywords "clustering" and "fraud" combined
with one of the following "credit card",
"money laundering", "insurance",
"corporate". No direct searches against "bank
fraud" were conducted as this fraud area was
well covered by "credit card" and "money
laundering" keywords. Using the generic
"insurance" keyword meant no further search
queries were required for "healthcare
insurance", "automobile insurance", "crop
insurance", etc. all being subcategories of
generic insurance fraud.
Besides being relevant to the defined
research area, each article had to meet a
series of additional criteria. The article's full
text had to be available, it had to contain a
case study and that case study needed to be
performed against a real dataset. Exceptions
were made on using synthetic datasets
instead of real datasets on very small number
Page 6
Informatica Economică vol. 16, no. 1/2012 115
of articles the author fell they should be
included nonetheless for their scientific
value. Real datasets were preferred because
in this way, at least to a certain degree,
results are quantifiable.
Fig. 4. Financial Fraud Detection Review Framework [8]
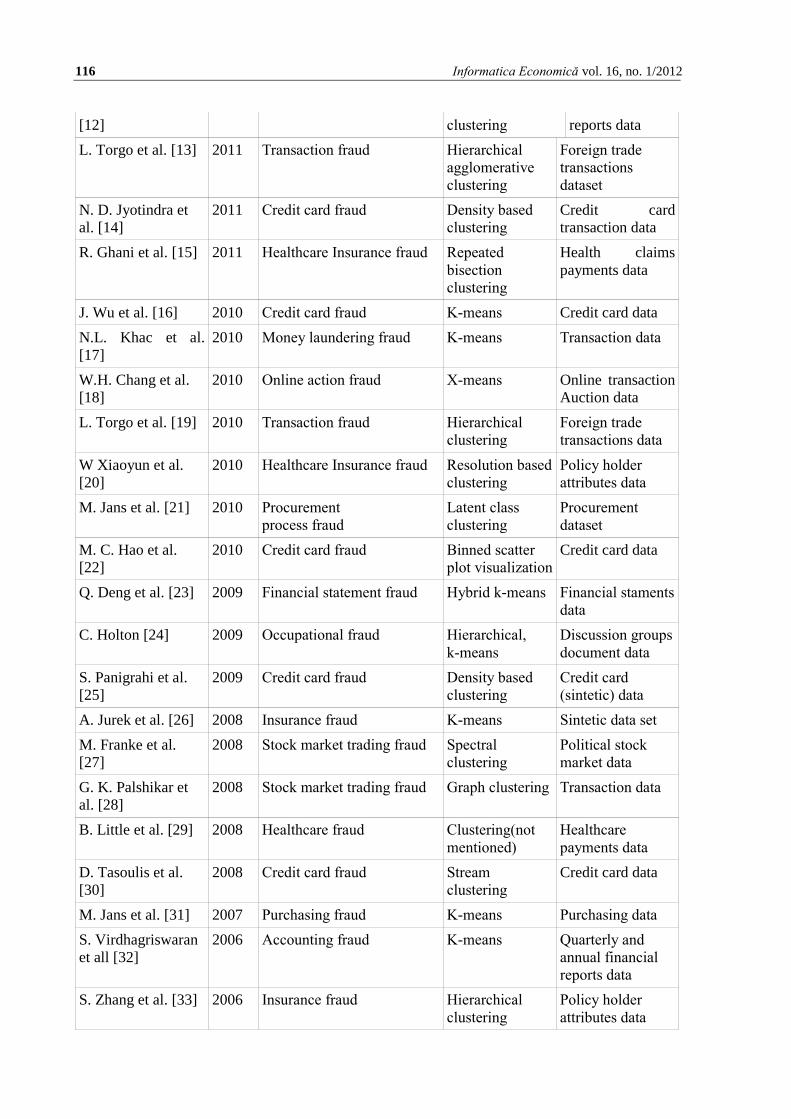
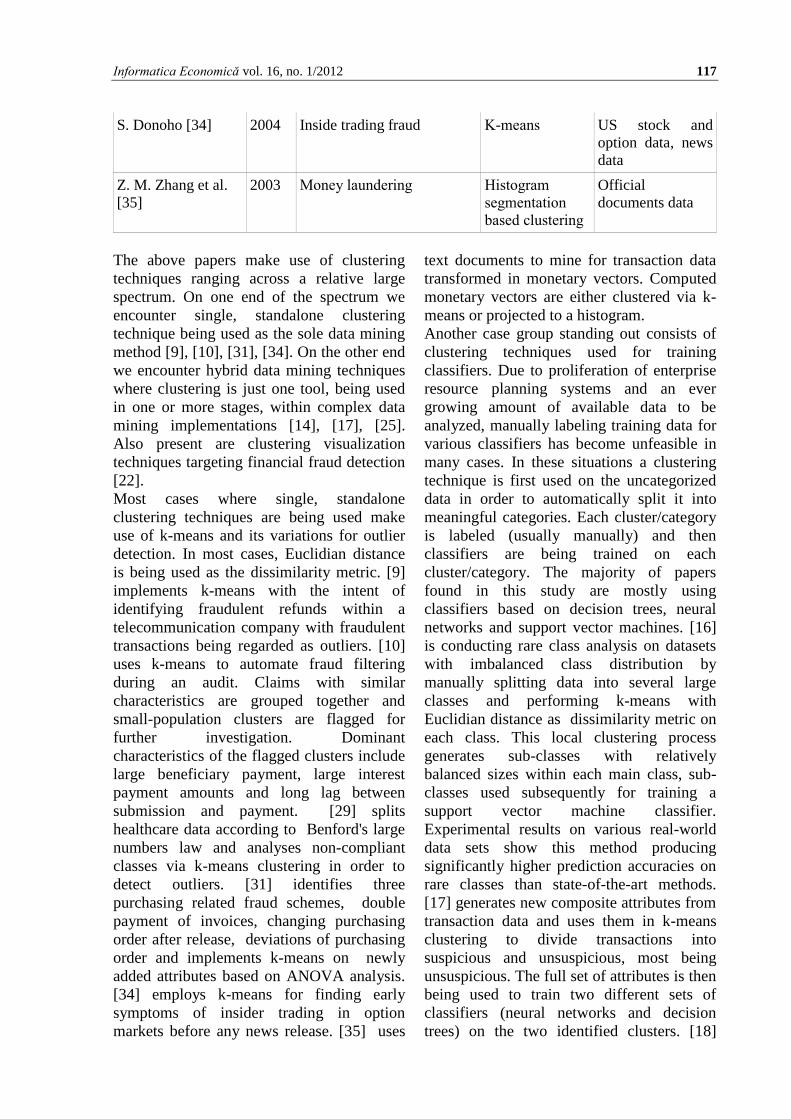
5 Clustering based FFD survey
As a result of the research methodology, 27
articles were selected for inclusion. They
have been grouped based on application
domain, clustering technique and case study
dataset. Papers are ordered on publishing
year and clustering technique in Table 2.
Table 2. Surveyed articles
Author Year Application Domain Clustering
Technique
Dataset
H. Issa et al. [9] 2011 Refund fraud/ financial
fraud
K-means Refund
transaction data
S. Thiprungsri et al.
[10]
2011 Healthcare Insurance fraud K-means Life claims
payment data
R. Liu et al. [11] 2011 Money laundering fraud Birch, k-means Sintetic data
F. H. Glancy et al. 2011 Financial reporting fraud Hierarchical Annual financial
Page 7
116 Informatica Economică vol. 16, no. 1/2012
[12] clustering reports data
L. Torgo et al. [13] 2011 Transaction fraud Hierarchical
agglomerative
clustering
Foreign trade
transactions
dataset
N. D. Jyotindra et
al. [14]
2011 Credit card fraud Density based
clustering
Credit card
transaction data
R. Ghani et al. [15] 2011 Healthcare Insurance fraud Repeated
bisection
clustering
Health claims
payments data
J. Wu et al. [16] 2010 Credit card fraud K-means Credit card data
N.L. Khac et al.
[17]
2010 Money laundering fraud K-means Transaction data
W.H. Chang et al.
[18]
2010 Online action fraud X-means Online transaction
Auction data
L. Torgo et al. [19] 2010 Transaction fraud Hierarchical
clustering
Foreign trade
transactions data
W Xiaoyun et al.
[20]
2010 Healthcare Insurance fraud Resolution based
clustering
Policy holder
attributes data
M. Jans et al. [21] 2010 Procurement
process fraud
Latent class
clustering
Procurement
dataset
M. C. Hao et al.
[22]
2010 Credit card fraud Binned scatter
plot visualization
Credit card data
Q. Deng et al. [23] 2009 Financial statement fraud Hybrid k-means Financial staments
data
C. Holton [24] 2009 Occupational fraud Hierarchical,
k-means
Discussion groups
document data
S. Panigrahi et al.
[25]
2009 Credit card fraud Density based
clustering
Credit card
(sintetic) data
A. Jurek et al. [26] 2008 Insurance fraud K-means Sintetic data set
M. Franke et al.
[27]
2008 Stock market trading fraud Spectral
clustering
Political stock
market data
G. K. Palshikar et
al. [28]
2008 Stock market trading fraud Graph clustering Transaction data
B. Little et al. [29] 2008 Healthcare fraud Clustering(not
mentioned)
Healthcare
payments data
D. Tasoulis et al.
[30]
2008 Credit card fraud Stream
clustering
Credit card data
M. Jans et al. [31] 2007 Purchasing fraud K-means Purchasing data
S. Virdhagriswaran
et all [32]
2006 Accounting fraud K-means Quarterly and
annual financial
reports data
S. Zhang et al. [33] 2006 Insurance fraud Hierarchical
clustering
Policy holder
attributes data
Page 8
Informatica Economică vol. 16, no. 1/2012 117
S. Donoho [34] 2004 Inside trading fraud K-means US stock and
option data, news
data
Z. M. Zhang et al.
[35]
2003 Money laundering Histogram
segmentation
based clustering
Official
documents data
The above papers make use of clustering
techniques ranging across a relative large
spectrum. On one end of the spectrum we
encounter single, standalone clustering
technique being used as the sole data mining
method [9], [10], [31], [34]. On the other end
we encounter hybrid data mining techniques
where clustering is just one tool, being used
in one or more stages, within complex data
mining implementations [14], [17], [25].
Also present are clustering visualization
techniques targeting financial fraud detection
[22].
Most cases where single, standalone
clustering techniques are being used make
use of k-means and its variations for outlier
detection. In most cases, Euclidian distance
is being used as the dissimilarity metric. [9]
implements k-means with the intent of
identifying fraudulent refunds within a
telecommunication company with fraudulent
transactions being regarded as outliers. [10]
uses k-means to automate fraud filtering
during an audit. Claims with similar
characteristics are grouped together and
small-population clusters are flagged for
further investigation. Dominant
characteristics of the flagged clusters include
large beneficiary payment, large interest
payment amounts and long lag between
submission and payment. [29] splits
healthcare data according to Benford's large
numbers law and analyses non-compliant
classes via k-means clustering in order to
detect outliers. [31] identifies three
purchasing related fraud schemes, double
payment of invoices, changing purchasing
order after release, deviations of purchasing
order and implements k-means on newly
added attributes based on ANOVA analysis.
[34] employs k-means for finding early
symptoms of insider trading in option
markets before any news release. [35] uses
text documents to mine for transaction data
transformed in monetary vectors. Computed
monetary vectors are either clustered via k-
means or projected to a histogram.
Another case group standing out consists of
clustering techniques used for training
classifiers. Due to proliferation of enterprise
resource planning systems and an ever
growing amount of available data to be
analyzed, manually labeling training data for
various classifiers has become unfeasible in
many cases. In these situations a clustering
technique is first used on the uncategorized
data in order to automatically split it into
meaningful categories. Each cluster/category
is labeled (usually manually) and then
classifiers are being trained on each
cluster/category. The majority of papers
found in this study are mostly using
classifiers based on decision trees, neural
networks and support vector machines. [16]
is conducting rare class analysis on datasets
with imbalanced class distribution by
manually splitting data into several large
classes and performing k-means with
Euclidian distance as dissimilarity metric on
each class. This local clustering process
generates sub-classes with relatively
balanced sizes within each main class, sub-
classes used subsequently for training a
support vector machine classifier.
Experimental results on various real-world
data sets show this method producing
significantly higher prediction accuracies on
rare classes than state-of-the-art methods.
[17] generates new composite attributes from
transaction data and uses them in k-means
clustering to divide transactions into
suspicious and unsuspicious, most being
unsuspicious. The full set of attributes is then
being used to train two different sets of
classifiers (neural networks and decision
trees) on the two identified clusters. [18]
Page 9
118 Informatica Economică vol. 16, no. 1/2012
distinguishes types of behavior changes from
different fraudsters with the help of x-means
clustering technique. Afterwards, C4.5
decision trees are employed for inducing the
rules of the labeled clusters. [26] performs k-
means on insurance data and trains a naïve
bayes classifier on each found cluster. [32]
attempts to detect frauds camouflaged to look
like normal activities in domains with high
number of known relationships like
accounting fraud detection for rating and
investment, insider attacks on corporate
networks, health care insurance fraud. It uses
k-means for training various classifiers.
There are cases where clustering techniques
are being used to group already flagged,
possible fraudulent entries by classifiers. The
clustering goal in this situation is to define a
taxonomy of the already identified fraud
entries in order to implement counter
measures for each found fraud category. In
certain situations, some categories may be
even found to contain legitimate data,
wrongly labeled by the classifier due to
insufficient training to such cases. [15]
detects payment errors in insurance claims by
applying hierarchical divisive clustering on
entities flagged as fraudulent via a support
vector machine classifier. [23] computes
financial ratios from companies' financial
statements. A self-organizing map neural
network is being used with financial ratios as
its input vector. Subsequently k-means is
being performed on the self-organizing map
node vector.
Hierarchical clustering techniques form
another case group. [11] uses a combination
of the classical agglomerative hierarchical
clustering Birch algorithm with k-means. In
this way low points from both methods are
being minimized, Birch not handling
financial data very well by not being
sensitive to noise, k-means being too
expensive to run on large databases. [12]
uses official financial data to separate
between fraudulent and non-fraudulent
companies. Documents are being processed
via text mining and the corresponding term-
document matrix has its density increased via
a singular value decomposition vector.
Hierarchical agglomerative clustering is
being used with stable end points for all
clustering trials resulting in two stable
clusters. Under the same main author, both
[13] and [19] make use of hierarchical
agglomerative clustering as outlier ranking,
part of a larger data mining solution. The
main idea of the method is that outliers
should offer more resistance to being merged
with large groups of "normal'' cases,
information taken into account within the
hierarchical agglomerative clustering
merging process. In this way, ranking of
fraud probability for a set of unlabeled
observations are being generated. The end
result outlier ranking is able to handle
applications with both global and local
outlier types. [24] mines text based official
documents and applies clustering in two
stages. Initially hierarchical agglomerative
clustering is being performed to a certain
level. In order to speed up the cluster
convergence process, hierarchical clustering
is being interrupted and k-means is being
applied with initial cluster centers being the
hierarchical centers. In this way, all the
remaining entries not covered by hierarchical
clustering are grouped to hierarchical cluster
centers via k-means. Cosine similarity
function was found to be the most successful.
[33] uses a variant of classical hierarchical
clustering chameleon algorithm in order to
define outliers as bridging rules between
different conceptual clusters. A bridging rule
can be viewed as the antecedent and action
belonging to different conceptual clusters
leading to new insights on how entries are
connected, related.
Even though k-means and hierarchical
clustering are the most popular techniques in
this survey, other clustering techniques are
present as well. [14] uses density based
dbscan algorithm to form clusters of
transaction amounts spend by the customer.
Whenever a new credit card transaction is
performed by the customer, the algorithm
finds the cluster coverage of this particular
amount. Clustering is just one part of the
overall proposed transaction risk generation
model consisting of five major components:
Page 10
Informatica Economică vol. 16, no. 1/2012 119
dbscan algorithm, linear equation, rules, data
warehouse and Bayes theorem. [25] also uses
dbscan within a fraud detection system
consisting of 4 components: rule-based filter,
Dempster–Shafer adder, transaction history
database, Bayesian learner.. Within the rule-
based filter, outlier detection is conducted via
dbscan. [20] detects fraudulent insurance
clients' applications via resolution based
clustering. The algorithm, which combines
the advantages of resolution based and
density based algorithms, can detect and rank
top-n outliers from any kind of datasets
without the need for input parameters taking
the size and density of clusters into
consideration. Resolution can be explained as
follows. Just like viewing a density plot with
a microscope or telescope at a certain
magnification, one can identify different
groups in the night sky as the magnification
is adjusted. When the resolution changes on a
dataset, the clusters in the dataset
redistribute. All the objects are in the same
cluster when the resolution is very low, and
every object is a single cluster when the
resolution is very high. [21] uses
multivariate latent class fuzzy clustering in
order to detect internal fraud on procurement
data. [27] analyses irregular stock market
behavior via traders trading behavior using
spectral clustering. [28] combines three
graph clustering algorithms making use of a
Dempster–Shafer adder for detecting
circular trading and price manipulation. [30]
uses stream clustering based on classical
Dbscan algorithm and Wstream. Using
containers (windows) in the form of hyper-
rectangles that are adjusted though time to
discover and track the evolution of the
underlying clusters. Wstream achieves this
using two procedures, “movement” and
“enlargement-contraction”. The “movement”
of windows incrementally recenters windows
every time a new streaming data point
arrives. Windows are recentered to the mean
of the points they include at each time point
in a manner that also depends on each point’s
timestamp. A fading function that decreases
with time, associates a weight with each
timestamp. Visualization [22] is also present
as a form of identifying credit card fraud.
Variable binned scatter plots allow the
visualization of large amounts of data
without overlapping. The basic idea is to use
a non-uniform (variable) binning of the x and
y dimensions and plots all the data points that
fall within each bin into corresponding
squares.
6 Conclusions
Compared to other domains where clustering
is being applied to identify outliers, intrusion
detection, etc.., clustering based fraud
detection techniques tend to use established
clustering techniques. Relative novel
clustering techniques like clustering
ensembles, large scale clustering, multi-way
clustering have very little presence in the
surveyed papers.
Based on the surveyed papers, almost three
quarters of the encountered clustering
techniques are partitional – Figure 5. Some
papers, [11], [24] have been counted as using
both partitional and hierarchical clustering
techniques as they combine both clustering
types. Among partitional clustering
techniques, k-means clustering and its
variants with Euclidian distance as
dissimilarity metric are the most common
used ones. Hierarchical clustering techniques
come in second place being used in one
quarter of the surveyed papers. Interactive,
visualization clustering techniques are also
used but only in very small number of cases.
Regarding the way clustering techniques are
combined or used in conjunction with other
data mining techniques, the surveyed papers
have been classified as containing standalone
clustering techniques with only one
clustering algorithm being used, combined
clustering techniques with two or more
clustering algorithms being used, hybrid
clustering techniques combining both
clustering algorithms and other data mining
algorithms, mostly classifiers based on
decision trees, neural networks and support
vector machines – Figure 6.
Page 11
120 Informatica Economică vol. 16, no. 1/2012
Fig. 5. Clustering techniques based on algorithm type
Fig. 6. Clustering techniques combinations
Both standalone and hybrid clustering
techniques are heavily used with
approximately 40% usage each. Increasing
clustering accuracy by combining multiple
clustering algorithms and staying within a
single data mining domain is not perceived as
having significant benefits as only 18% cases
apply it.
References
[1] PriceWaterhouseCoopers UK, Global
Economic Crime Survey,
PriceWaterhouseCoopers,
Nov. 2011. [Online]. Available:
http://www.pwc.com/gx/en/economic-
crime-survey/download-economic-
crime-people-culture-controls.jhtml
[Accessed: 01 Jan. 2012].
[2] Oxford University Press, Concise Oxford
English Dictionary, Oxford University
Press, Dec. 2009. [Online]. Available:
http://oxforddictionaries.com/
[Accessed: 10 Nov. 2011].
[3] B. A. Garner, Black's Law Dictionary 9th
ed.. New York: West Group Publishing
House, 2009.
[4] Singleton T. W., Fraud Auditing and
Forensic Accounting 4th edition, Ed.
John Wiley and Sons, 2010.
[5] M. Jans, N. Lybaert, and K. Vanhoof, “A
framework for Internal Fraud Risk
Reduction at IT Integrating Business
Processes,” International Journal, 2009.
[6] P. Hansen and B. Jaumard, “Cluster
analysis and mathematical
programming,” Mathematical
Programming, vol. 79, pp. 191-215, Oct.
1997.
[7] A. K. Jain, M. N. Murty, and P. J. Flynn,
“Data clustering: a review,” ACM
computing surveys (CSUR), vol. 31, no.
3, pp. 264–323, 1999.
[8] E. Ngai, Y. Hu, Y. Wong, Y. Chen, and
X. Sun, “The application of data mining
techniques in financial fraud detection:
A classification framework and an
72%
24%
4%
Partitional clustering
Hierarchical clustering
Visualization techniques
41%
18%
41%
Standalone
Combined algorithm
Hybrid algorithm
Page 12
Informatica Economică vol. 16, no. 1/2012 121
academic review of literature,” Decision
Support Systems, vol. 50, no. 3, pp. 559–
569, 2011.
[9] H. Issa and M. Vasarhelyi, “Application
of Anomaly Detection Techniques to
Identify Fraudulent Refunds,” 2011.
[10] S. Thiprungsri and M. Vasarhelyi,
“Cluster Analysis for Anomaly
Detection in Accounting Data: An Audit
Approach,” The International Journal of
Digital Accounting Research, vol. 11,
2011.
[11] Rui Liu, Xiao-long Qian, Shu Mao, and
Shuai-zheng Zhu, “Research on anti-
money laundering based on core
decision tree algorithm,”, Control and
Decision Conference (CCDC), 2011
Chinese, 2011, pp. 4322-4325.
[12] F. H. Glancy and S. B. Yadav, “A
computational model for financial
reporting fraud detection,” Decision
Support Systems, vol. 50, no. 3, pp. 595-
601, Feb. 2011.
[13] L. Torgo and E. Lopes, “Utility-Based
Fraud Detection,” in Twenty-Second
International Joint Conference on
Artificial Intelligence, 2011.
[14] N. D. Jyotindra and R. P. Ashok, “A
Data Mining with Hybrid Approach
Based Transaction Risk Score
Generation Model (TRSGM) for Fraud
Detection of Online Financial
Transaction,” International Journal of
Computer Applications, vol. 16, no. 1,
pp. 18–25, 2011.
[15] R. Ghani and M. Kumar, “Interactive
learning for efficiently detecting errors
in insurance claims,” in Proceedings of
the 17th ACM SIGKDD international
conference on Knowledge discovery and
data mining, New York, NY, USA,
2011, pp. 325–333.
[16] J. Wu, H. Xiong, and J. Chen, “COG:
local decomposition for rare class
analysis,” Data Mining and Knowledge
Discovery, vol. 20, no. 2, pp. 191-220,
Jan. 2010.
[17] Nhien An Le Khac and M.-T. Kechadi,
“Application of Data Mining for Anti-
money Laundering Detection: A Case
Study,” in 2010 IEEE International
Conference on Data Mining Workshops
(ICDMW), 2010, pp. 577-584.
[18] Wen-Hsi Chang and Jau-Shien Chang,
“Using clustering techniques to analyze
fraudulent behavior changes in online
auctions,” in 2010 International
Conference on Networking and
Information Technology (ICNIT), 2010,
pp. 34-38.
[19] L. Torgo and C. Soares, “Resource-
bounded Outlier Detection using
Clustering Methods,” in Proceedings of
the 2010 conference on Data Mining for
Business Applications, Amsterdam, The
Netherlands, The Netherlands, 2010, pp.
84–98.
[20] Wang Xiaoyun and Liu Danyue,
“Hybrid outlier mining algorithm based
evaluation of client moral risk in
insurance company,” in 2010 The 2nd
IEEE International Conference on
Information Management and
Engineering (ICIME), 2010, pp. 585-
589.
[21] M. Jans, N. Lybaert, and K. Vanhoof,
“Internal fraud risk reduction: Results of
a data mining case study,” International
Journal of Accounting Information
Systems, vol. 11, no. 1, pp. 17–41, 2010.
[22] M. C. Hao, U. Dayal, R. K. Sharma, D.
A. Keim, and H. Janetzko, Visual
Analytics of Large Multi-Dimensional
Data Using Variable Binned Scatter
Plots. Bibliothek der Universität
Konstanz, 2010.
[23] Q. Deng and G. Mei, “Combining self-
organizing map and K-means clustering
for detecting fraudulent financial
statements,” in IEEE International
Conference on Granular Computing,
2009, GRC ’09, 2009, pp. 126-131.
[24] C. Holton, “Identifying disgruntled
employee systems fraud risk through text
mining: a simple solution for a multi-
billion dollar problem,” Decision
Support Systems, vol. 46, no. 4, pp. 853–
864, 2009.
[25] S. Panigrahi, A. Kundu, S. Sural, and A.
Majumdar, “Credit card fraud detection:
Page 13
122 Informatica Economică vol. 16, no. 1/2012
A fusion approach using Dempster-
Shafer theory and Bayesian learning,”
Information Fusion, vol. 10, no. 4, pp.
354–363, 2009.
[26] A. Jurek and D. Zakrzewska,
“Improving Naïve Bayes models of
insurance risk by unsupervised
classification,” in Computer Science and
Information Technology, 2008. IMCSIT
2008. International Multiconference on,
2008, pp. 137–144.
[27] M. Franke, B. Hoser, and J. Schröder,
“On the Analysis of Irregular Stock
Market Trading Behavior,” in Data
Analysis, Machine Learning and
Applications, C. Preisach, H. Burkhardt,
L. Schmidt-Thieme, and R. Decker, Eds.
Berlin, Heidelberg: Springer Berlin
Heidelberg, 2008, pp. 355-362.
[28] G. K. Palshikar and M. M. Apte,
“Collusion set detection using graph
clustering,” Data Mining and Knowledge
Discovery, vol. 16, no. 2, pp. 135–164,
2008.
[29] B. Little, R. Rejesus, M. Schucking, and
R. Harris, “Benford’s Law, data mining,
and financial fraud: a case study in New
York State Medicaid data,” 2008, vol.
IX, pp. 195-204.
[30] D. Tasoulis, N. Adams, D. Weston, and
D. Hand, “Mining Information from
Plastic Card Transaction Streams,” in
Proceedings in Computational Statistics:
18th Symposium (COMPSTAT 2008,
2008, vol. 2, pp. 315–322.
[31] M. Jans, N. Lybaert, and K. Vanhoof,
“Data Mining for Fraud Detection:
Toward an Improvement on Internal
Control Systems,” 2007.
[32] S. Virdhagriswaran and G. Dakin,
“Camouflaged fraud detection in
domains with complex relationships,” in
Proceedings of the 12th ACM SIGKDD
international conference on Knowledge
discovery and data mining, 2006, pp.
941–947.
[33] S. Zhang, F. Chen, X. Wu, and C.
Zhang, “Identifying bridging rules
between conceptual clusters,” in
Proceedings of the 12th ACM SIGKDD
international conference on Knowledge
discovery and data mining, 2006, pp.
815–820.
[34] S. Donoho, “Early detection of insider
trading in option markets,” in
Proceedings of the tenth ACM SIGKDD
international conference on Knowledge
discovery and data mining, 2004, pp.
420–429.
[35] Z. M. Zhang, J. J. Salerno, and P. S. Yu,
“Applying data mining in investigating
money laundering crimes,” in
Proceedings of the ninth ACM SIGKDD
international conference on Knowledge
discovery and data mining, 2003, pp.
747–752.
Andrei Sorin SABAU has graduated the Faculty of Commerce – Marketing
Research and Forecast in 2002 at the Bucharest Academy of Economic
Studies. Currently a PhD Student at the Pitesti University, Faculty of
Mathematics and Informatics, his primary research area is unsupervised data
mining techniques used in fraud detection and prevention. With multiple
certifications in SAP, JAVA and ORACLE SQL, he is also attending
SIMPRE professional master program, ASE Bucharest, Faculty of
Cybernetics, Statistics and Informatics. Working in the research-development department in a
multinational software development company, he is successfully embedding research
knowledge with practice.