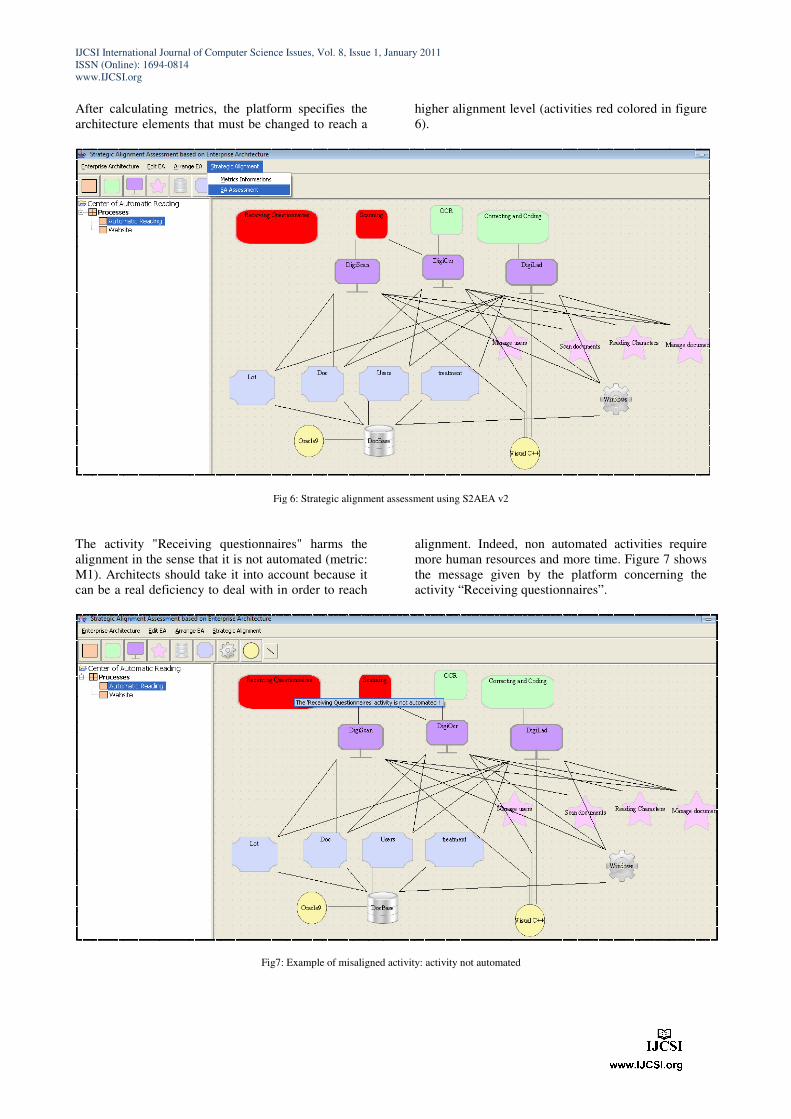
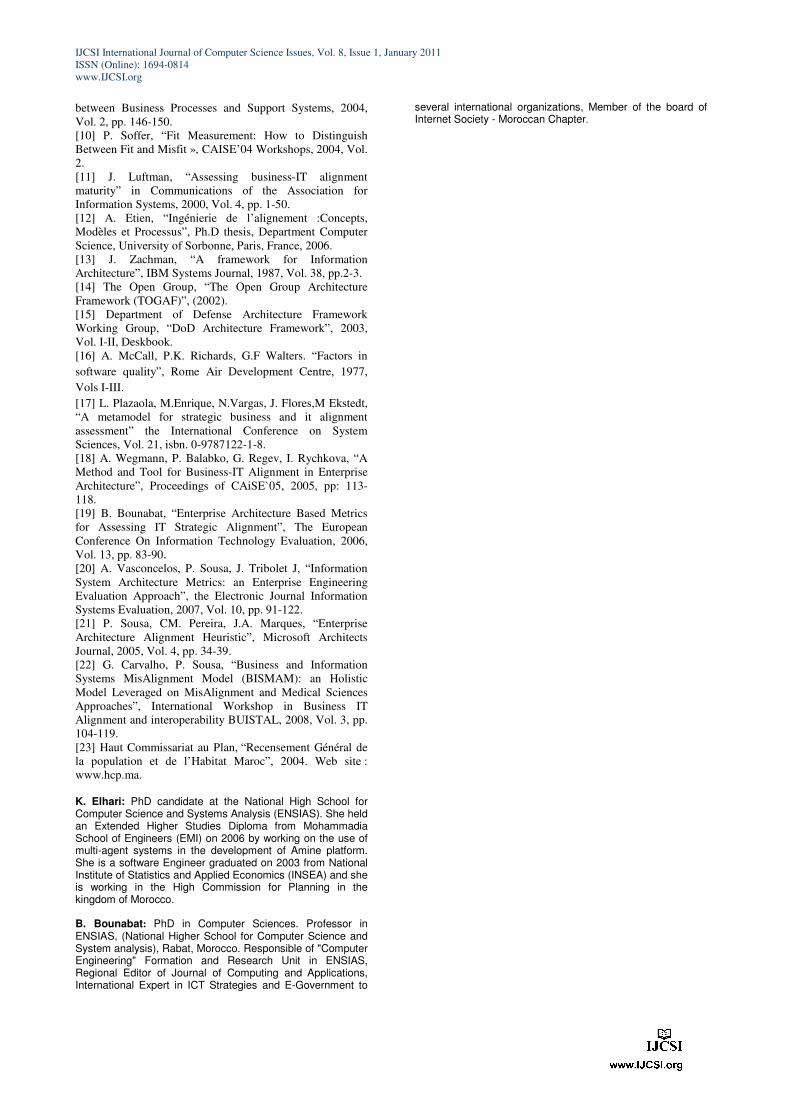
IJCSI International Journal of Computer Science Issues, Vol. 8, Issue 1, January 2011 ISSN (Online): 1694-0814 www.IJCSI.org Platform Platform Platform Platform for Assessing Strategic Alignment Using or Assessing Strategic Alignment Using or Assessing Strategic Alignment Using or Assessing Strategic Alignment Using Enterpr Enterpr Enterpr Enterprise Architecture: Application t ise Architecture: Application t ise Architecture: Application t ise Architecture: Application to E o E o E o E-Government Government Government Government Process Assessment Process Assessment Process Assessment Process Assessment Kaoutar Elhari and Bouchaib Bounabat Al-Qualsadi Research & Development Team, National Higher School for Computer Science and System analysis (ENSIAS), Mohammed Vth University-Souissi Rabat, Mohammed Ben Abdallah Regragui avenue, Madinat Al Irfane, BP 713, Agdal, Morocco [email protected] , [email protected]Abstract This paper presents an overview of S2AEA (v2) (Strategic Alignment Assessment based on Enterprise Architecture (version2)), a platform for modelling enterprise architecture and for assessing strategic alignment based on internal enterprise architecture metrics. The idea of the platform is based on the fact that enterprise architecture provides a structure for business processes and information systems that supports them. This structure can be used to measure the degree of consistency between business strategies and information systems. In that sense, this paper presents a platform illustrating the role of enterprise architecture in the strategic alignment assessment. This assessment can be used in auditing information systems. The platform is applied to assess an e-government process. Keywords: Strategic Alignment, Enterprise Architecture, Platform, Information System, Assessment Metrics. 1. Introduction The information technology investment impacts positively on business performance. In order to reach a good impact, IT must constantly be appropriated to the business strategy. The strategic alignment (SA) has been studied since 1993 [1] how to coordinate the company's strategy with the information system strategy in order to improve the efficiency of information systems which support the company’s business. Indeed, misaligned solutions have negative effects on the business level and, in turn, can reduce the value of services provided by the company. On the other hand, the concept of enterprise architecture has come, more than twenty years ago, to address two problems: systems complexity and poor strategic alignment [2]. The enterprise architecture is the best way of representing information as a model illustrating the links between strategy, business and information systems [3]. Thus, this article presents a platform which assesses SA using the enterprise architecture. It is based on a set of metrics collected from several researches, classified according to the links between the layered structures proposed by enterprise architecture. The platform helps architects to improve the SA maturity level by (a) analyzing the structure of enterprise architecture and (b) suggesting the effort to do in order to reach a better level. This article uses many concepts of [4]. It is recommended to read it before. The layout of this paper is as follows. The second section is devoted to EA and SA concepts; the third section presents an e-government process which will be used as an example to illustrate the platform functionalities. Finally, the fourth section presents the platform developed to support SA assessment by comparing the two versions of the platform. The conclusion and future work are presented in Section 5. 2. Strategic Alignment Evaluation Many terms are used in the literature to refer to the SA [5]. Thus, a lot of synonymous of alignment are proposed: congruence, harmony, correspondence, coherence, and so on. The diversity of terms used involves the diversity of meaning given to the SA concept. [5] defines it as the correspondence between a set of components (e.g. between business process and system that supports them). [6] sees it as the act of applying information technology in harmony with the strategies, needs and objectives of the business. Some others study it as the harmony between architecture and software architecture of business processes [7]. Others consider the alignment between information systems and its environment [8]. And yet others are interested in aligning business processes and systems supporting these processes [9], [10]. In this article, we study the SA as harmony or correspondence between the company strategy represented by business processes and the systems supporting them. 2.1 Strategic alignment evaluation Luftman proposes a framework for measuring the alignment between a company’s strategies and the information technology strategies [11]. This framework is based on the foundations of CMM (Capability Maturity Model). He proposed five levels
Transcript
IJCSI International Journal of Computer Science Issues, Vol. 8, Issue 1, January 2011
ISSN (Online): 1694-0814
www.IJCSI.org
Platform Platform Platform Platform ffffor Assessing Strategic Alignment Using or Assessing Strategic Alignment Using or Assessing Strategic Alignment Using or Assessing Strategic Alignment Using
EnterprEnterprEnterprEnterprise Architecture: Application tise Architecture: Application tise Architecture: Application tise Architecture: Application to Eo Eo Eo E----Government Government Government Government
Process AssessmentProcess AssessmentProcess AssessmentProcess Assessment
Kaoutar Elhari and Bouchaib Bounabat
Al-Qualsadi Research & Development Team, National Higher School for Computer Science and System analysis (ENSIAS),
Grefen, “Aligning application architecture to the business
context.” Conference on Advanced Information System
ineering (CAiSE 03), 2003, Vol., pp. 209–225.
G. Camponovo, Y. Pigneur, “Information Systems
Alignment in Uncertain Environments”, IFIP International
Conference on Decision Support Systems, 2004.
T. Bodhuin, R. Esposito, C. Pacelli, M. Tortorella,
“Impact Analysis for Supporting the Co-Evolution of
orting Software Systems”, in
SE Workshops on Creating and Maintaining the Fit
IJCSI International Journal of Computer Science Issues, Vol. 8, Issue 1, January 2011
ISSN (Online): 1694-0814
www.IJCSI.org
between Business Processes and Support Systems, 2004,
Vol. 2, pp. 146-150.
[10] P. Soffer, “Fit Measurement: How to Distinguish
Between Fit and Misfit », CAISE’04 Workshops, 2004, Vol.
2.
[11] J. Luftman, “Assessing business-IT alignment
maturity” in Communications of the Association for
Information Systems, 2000, Vol. 4, pp. 1-50.
[12] A. Etien, “Ingénierie de l’alignement :Concepts,
Modèles et Processus”, Ph.D thesis, Department Computer
Science, University of Sorbonne, Paris, France, 2006.
[13] J. Zachman, “A framework for Information
Architecture”, IBM Systems Journal, 1987, Vol. 38, pp.2-3.
[14] The Open Group, “The Open Group Architecture
Framework (TOGAF)”, (2002).
[15] Department of Defense Architecture Framework
Working Group, “DoD Architecture Framework”, 2003,
Vol. I-II, Deskbook.
[16] A. McCall, P.K. Richards, G.F Walters. “Factors in
software quality”, Rome Air Development Centre, 1977,
Vols I-III.
[17] L. Plazaola, M.Enrique, N.Vargas, J. Flores,M Ekstedt,
“A metamodel for strategic business and it alignment
assessment” the International Conference on System
Sciences, Vol. 21, isbn. 0-9787122-1-8.
[18] A. Wegmann, P. Balabko, G. Regev, I. Rychkova, “A
Method and Tool for Business-IT Alignment in Enterprise
Architecture”, Proceedings of CAiSE`05, 2005, pp: 113-
118.
[19] B. Bounabat, “Enterprise Architecture Based Metrics
for Assessing IT Strategic Alignment”, The European
Conference On Information Technology Evaluation, 2006,
Vol. 13, pp. 83-90. [20] A. Vasconcelos, P. Sousa, J. Tribolet J, “Information
System Architecture Metrics: an Enterprise Engineering
Evaluation Approach”, the Electronic Journal Information
Systems Evaluation, 2007, Vol. 10, pp. 91-122.
[21] P. Sousa, CM. Pereira, J.A. Marques, “Enterprise
Architecture Alignment Heuristic”, Microsoft Architects
Journal, 2005, Vol. 4, pp. 34-39.
[22] G. Carvalho, P. Sousa, “Business and Information
Systems MisAlignment Model (BISMAM): an Holistic
Model Leveraged on MisAlignment and Medical Sciences
Approaches”, International Workshop in Business IT
Alignment and interoperability BUISTAL, 2008, Vol. 3, pp.
104-119.
[23] Haut Commissariat au Plan, “Recensement Général de
la population et de l’Habitat Maroc”, 2004. Web site :
www.hcp.ma.
K. Elhari: PhD candidate at the National High School for Computer Science and Systems Analysis (ENSIAS). She held an Extended Higher Studies Diploma from Mohammadia School of Engineers (EMI) on 2006 by working on the use of multi-agent systems in the development of Amine platform. She is a software Engineer graduated on 2003 from National Institute of Statistics and Applied Economics (INSEA) and she is working in the High Commission for Planning in the kingdom of Morocco.
B. Bounabat: PhD in Computer Sciences. Professor in ENSIAS, (National Higher School for Computer Science and System analysis), Rabat, Morocco. Responsible of "Computer Engineering" Formation and Research Unit in ENSIAS, Regional Editor of Journal of Computing and Applications, International Expert in ICT Strategies and E-Government to
several international organizations, Member of the board of Internet Society - Moroccan Chapter.