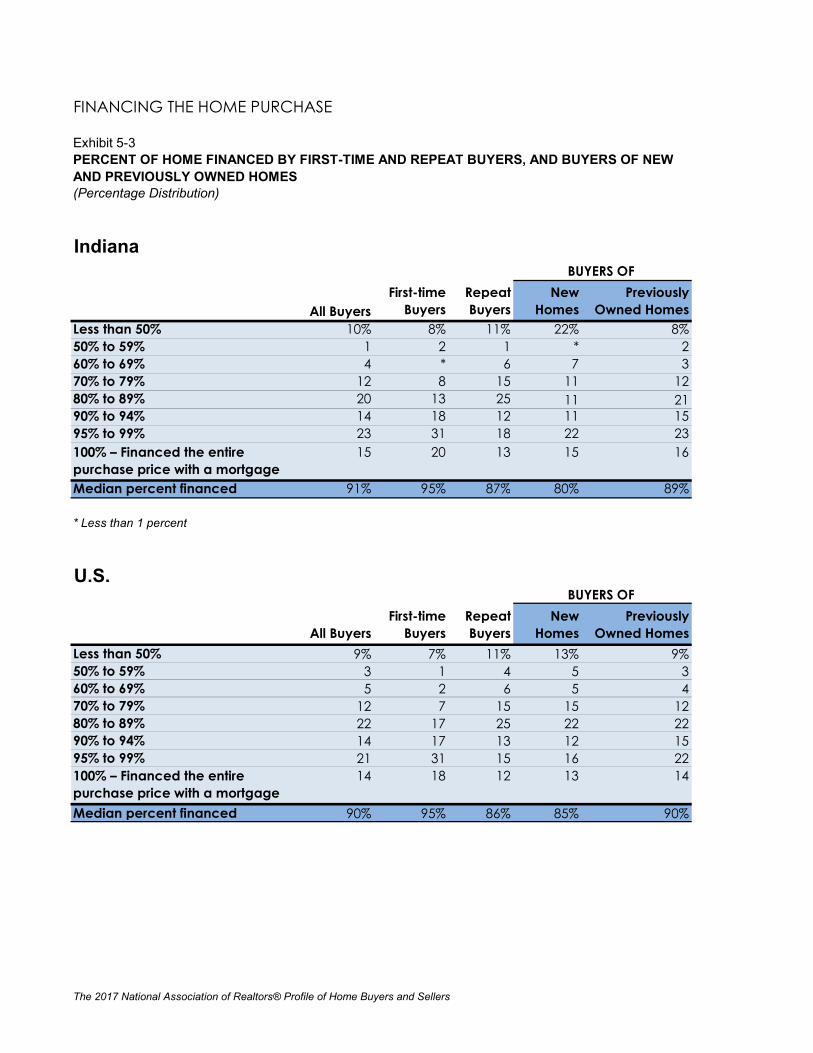
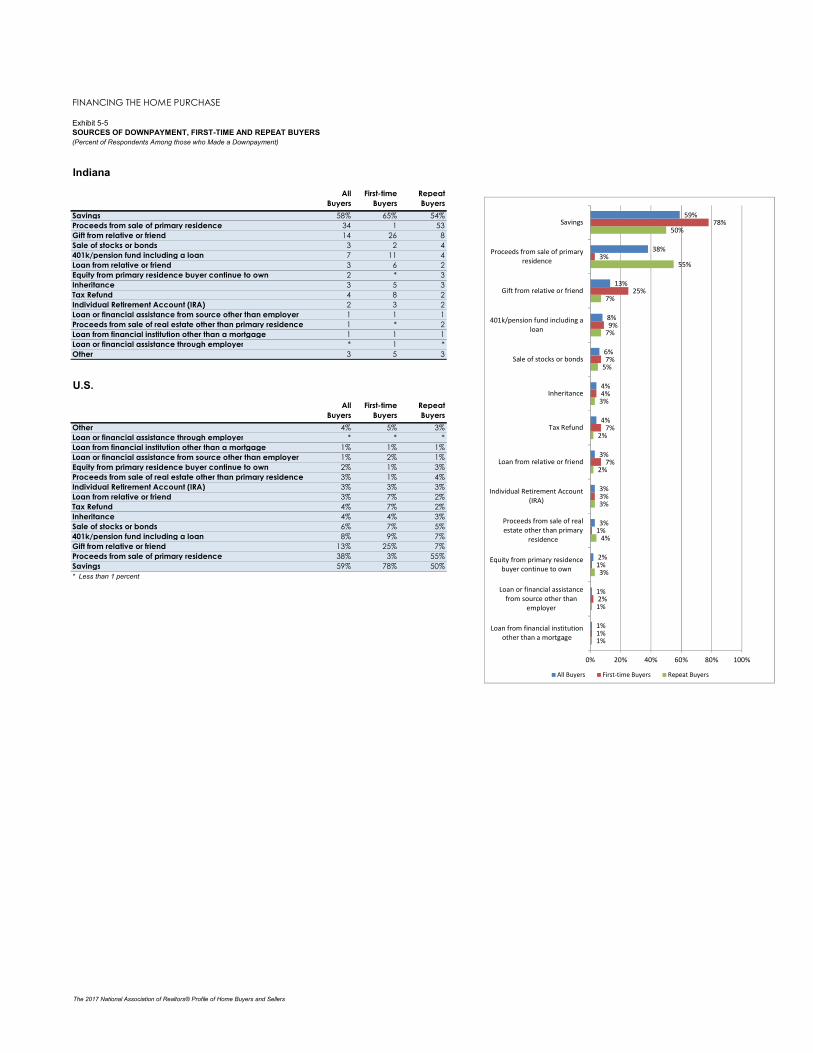
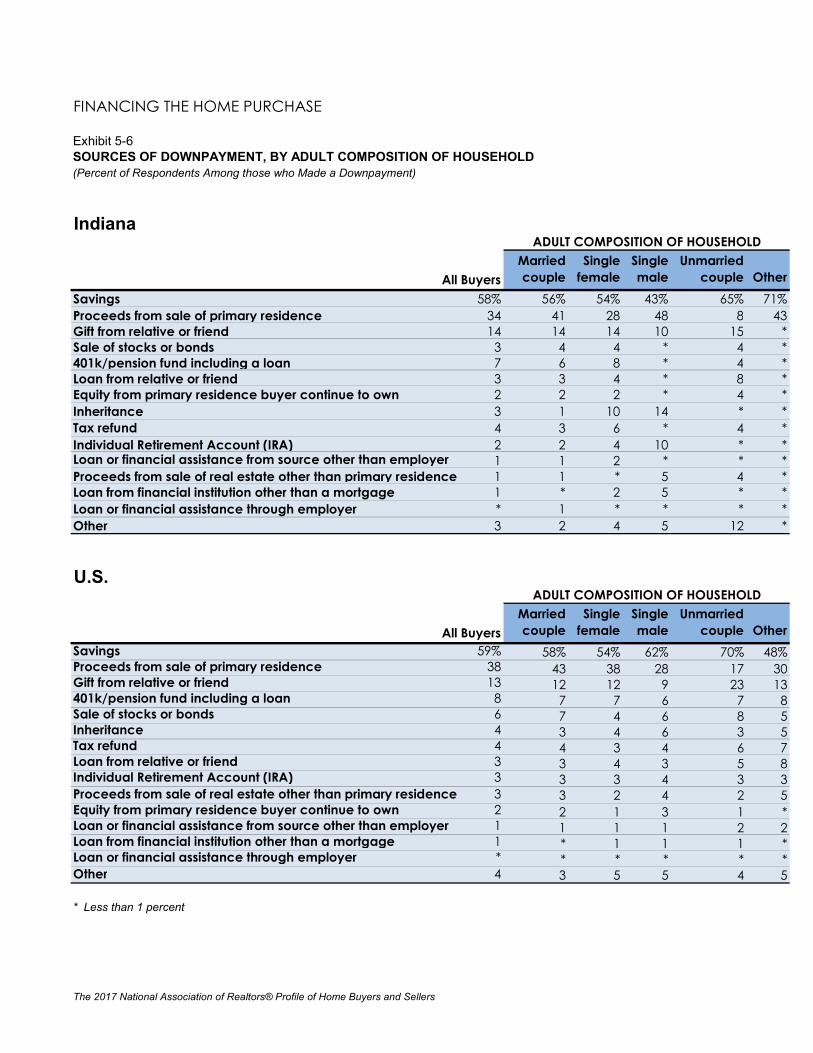
FINANCING THE HOME PURCHASE Exhibit 5-1 BUYERS WHO FINANCED THEIR HOME PURCHASE, BY AGE Exhibit 5-2 BUYERS WHO FINANCED THEIR HOME PURCHASE, BY ADULT COMPOSITION OF HOUSEHOLD Exhibit 5-3 PERCENT OF HOME FINANCED BY FIRST-TIME AND REPEAT BUYERS, AND BUYERS OF NEW AND PREVIOUSLY OWNED HOMES Exhibit 5-4 MEDIAN PERCENT OF DOWNPAYMENT BY FIRST-TIME AND REPEAT BUYERS, 1989-2016 Exhibit 5-5 SOURCES OF DOWNPAYMENT, FIRST-TIME AND REPEAT BUYERS Exhibit 5-6 SOURCES OF DOWNPAYMENT, BY ADULT COMPOSITION OF HOUSEHOLD Exhibit 5-7 LENGTH OF TIME TO SAVE FOR A DOWNPAYMENT, FIRST-TIME AND REPEAT BUYERS Exhibit 5-8 LENGTH OF TIME TO SAVE FOR A DOWNPAYMENT, BY ADULT COMPOSITION OF HOUSEHOLD Exhibit 5-9 YEARS DEBT DELAYED HOME BUYERS FROM SAVING FOR A DOWNPAYMENT OR BUYING A HOME Exhibit 5-10 EXPENSES THAT DELAYED SAVING FOR A DOWNPAYMENT OR SAVING FOR A HOME PURCHASE, BY FIRST-TIME AND REPEAT BUYERS Exhibit 5-11 EXPENSES THAT DELAYED SAVING FOR A DOWNPAYMENT OR SAVING FOR A HOME PURCHASE, BY ADULT COMPOSITION OF HOUSEHOLD Exhibit 5-12 SACRIFICES MADE TO PURCHASE HOME, BY FIRST-TIME AND REPEAT BUYERS Exhibit 5-13 SACRIFICES MADE TO PURCHASE HOME, BY ADULT COMPOSITION OF HOUSEHOLD Exhibit 5-14 DIFFICULTY OF MORTGAGE APPLICATION AND APPROVAL PROCESS, BY FIRST-TIME AND REPEAT BUYERS Exhibit 5-15 DIFFICULTY OF MORTGAGE APPLICATION AND APPROVAL PROCESS, BY ADULT COMPOSITION OF HOUSEHOLD Exhibit 5-16 Exhibit 5-17 BUYERS WHO HAVE STUDENT LOAN DEBT Exhibit 5-18 BUYER PREVIOUSLY SOLD A DISTRESSED PROPERTY (SHORT SALE OR FORECLOSURE) Exhibit 5-19 TYPE OF MORTGAGE, FIRST-TIME AND REPEAT BUYERS Exhibit 5-20 TYPE OF LOAN, FIRST-TIME AND REPEAT BUYERS Exhibit 5-21 BUYERS' VIEW OF HOMES AS A FINANCIAL INVESTMENT, FIRST-TIME AND REPEAT BUYERS, AND BUYERS OF NEW AND PREVIOUSLY OWNED HOMES Exhibit 5-22 BUYERS' VIEW OF HOMES AS A FINANCIAL INVESTMENT, BY ADULT COMPOSITION OF HOUSEHOLD BUYER MORTGAGE APPLICATION HAD BEEN REJECTED FROM MORTGAGE LENDER The 2017 National Association of Realtors® Profile of Home Buyers and Sellers
Transcript
FINANCING THE HOME PURCHASE
Exhibit 5-1 BUYERS WHO FINANCED THEIR HOME PURCHASE, BY AGEExhibit 5-2 BUYERS WHO FINANCED THEIR HOME PURCHASE, BY ADULT COMPOSITION OF HOUSEHOLDExhibit 5-3 PERCENT OF HOME FINANCED BY FIRST-TIME AND REPEAT BUYERS, AND BUYERS OF NEW AND
PREVIOUSLY OWNED HOMESExhibit 5-4 MEDIAN PERCENT OF DOWNPAYMENT BY FIRST-TIME AND REPEAT BUYERS, 1989-2016Exhibit 5-5 SOURCES OF DOWNPAYMENT, FIRST-TIME AND REPEAT BUYERSExhibit 5-6 SOURCES OF DOWNPAYMENT, BY ADULT COMPOSITION OF HOUSEHOLDExhibit 5-7 LENGTH OF TIME TO SAVE FOR A DOWNPAYMENT, FIRST-TIME AND REPEAT BUYERSExhibit 5-8 LENGTH OF TIME TO SAVE FOR A DOWNPAYMENT, BY ADULT COMPOSITION OF HOUSEHOLDExhibit 5-9 YEARS DEBT DELAYED HOME BUYERS FROM SAVING FOR A DOWNPAYMENT OR BUYING A HOME
Exhibit 5-10 EXPENSES THAT DELAYED SAVING FOR A DOWNPAYMENT OR SAVING FOR A HOME PURCHASE, BY FIRST-TIME AND REPEAT BUYERS
Exhibit 5-11 EXPENSES THAT DELAYED SAVING FOR A DOWNPAYMENT OR SAVING FOR A HOME PURCHASE, BY ADULT COMPOSITION OF HOUSEHOLD
Exhibit 5-12 SACRIFICES MADE TO PURCHASE HOME, BY FIRST-TIME AND REPEAT BUYERSExhibit 5-13 SACRIFICES MADE TO PURCHASE HOME, BY ADULT COMPOSITION OF HOUSEHOLD
Exhibit 5-14 DIFFICULTY OF MORTGAGE APPLICATION AND APPROVAL PROCESS, BY FIRST-TIME AND REPEAT BUYERS
Exhibit 5-15 DIFFICULTY OF MORTGAGE APPLICATION AND APPROVAL PROCESS, BY ADULT COMPOSITION OF HOUSEHOLD
Exhibit 5-16Exhibit 5-17 BUYERS WHO HAVE STUDENT LOAN DEBTExhibit 5-18 BUYER PREVIOUSLY SOLD A DISTRESSED PROPERTY (SHORT SALE OR FORECLOSURE)Exhibit 5-19 TYPE OF MORTGAGE, FIRST-TIME AND REPEAT BUYERSExhibit 5-20 TYPE OF LOAN, FIRST-TIME AND REPEAT BUYERSExhibit 5-21 BUYERS' VIEW OF HOMES AS A FINANCIAL INVESTMENT, FIRST-TIME AND REPEAT BUYERS, AND
BUYERS OF NEW AND PREVIOUSLY OWNED HOMESExhibit 5-22 BUYERS' VIEW OF HOMES AS A FINANCIAL INVESTMENT, BY ADULT COMPOSITION OF HOUSEHOLD
BUYER MORTGAGE APPLICATION HAD BEEN REJECTED FROM MORTGAGE LENDER
The 2017 National Association of Realtors® Profile of Home Buyers and Sellers
FINANCING THE HOME PURCHASE
Exhibit 5-1BUYERS WHO FINANCED THEIR HOME PURCHASE, BY AGE(Percent of Respondents)
Indiana
All Buyers 87%18 to 24 100%25 to 44 99%45 to 64 92%65 or older 55%
U.S.
All Buyers 88%18 to 24 97%25 to 44 98%45 to 64 86%65 or older 64%
87%
100% 99%92%
55%
0%
20%
40%
60%
80%
100%
All Buyers 18 to 24 25 to 44 45 to 64 65 or older
BUYERS WHO FINANCED THEIR HOME PURCHASE, BY AGE
(Percent of Respondents)
Indiana
88%
97% 98%
86%
64%
0
20
40
60
80
100
All Buyers 18 to 24 25 to 44 45 to 64 65 or older
BUYERS WHO FINANCED THEIR HOME PURCHASE, BY AGE
(Percent of Respondents)
Age
U.S.
Age
The 2017 National Association of Realtors® Profile of Home Buyers and Sellers
FINANCING THE HOME PURCHASE
Exhibit 5-2BUYERS WHO FINANCED THEIR HOME PURCHASE, BY ADULT COMPOSITION OF HOUSEHOLD(Percent of Respondents)
MEDIAN PERCENT OF DOWNPAYMENT BY FIRST-TIME AND REPEAT BUYERS, 1989-2017
All Buyers First-time Buyers Repeat Buyers
The 2017 National Association of Realtors® Profile of Home Buyers and Sellers
FINANCING THE HOME PURCHASE
Exhibit 5-5SOURCES OF DOWNPAYMENT, FIRST-TIME AND REPEAT BUYERS(Percent of Respondents Among those who Made a Downpayment)
Indiana
All Buyers
First-time Buyers
Repeat Buyers
Savings 58% 65% 54%Proceeds from sale of primary residence 34 1 53Gift from relative or friend 14 26 8Sale of stocks or bonds 3 2 4401k/pension fund including a loan 7 11 4Loan from relative or friend 3 6 2Equity from primary residence buyer continue to own 2 * 3Inheritance 3 5 3Tax Refund 4 8 2Individual Retirement Account (IRA) 2 3 2Loan or financial assistance from source other than employer 1 1 1Proceeds from sale of real estate other than primary residence 1 * 2Loan from financial institution other than a mortgage 1 1 1Loan or financial assistance through employer * 1 *Other 3 5 3
U.S.
All Buyers
First-time Buyers
Repeat Buyers
Other 4% 5% 3%Loan or financial assistance through employer * * *Loan from financial institution other than a mortgage 1% 1% 1%Loan or financial assistance from source other than employer 1% 2% 1%Equity from primary residence buyer continue to own 2% 1% 3%Proceeds from sale of real estate other than primary residence 3% 1% 4%Individual Retirement Account (IRA) 3% 3% 3%Loan from relative or friend 3% 7% 2%Tax Refund 4% 7% 2%Inheritance 4% 4% 3%Sale of stocks or bonds 6% 7% 5%401k/pension fund including a loan 8% 9% 7%Gift from relative or friend 13% 25% 7%Proceeds from sale of primary residence 38% 3% 55%Savings 59% 78% 50%* Less than 1 percent
1%
1%
3%
4%
3%
2%
2%
3%
5%
7%
7%
55%
50%
1%
2%
1%
1%
3%
7%
7%
4%
7%
9%
25%
3%
78%
1%
1%
2%
3%
3%
3%
4%
4%
6%
8%
13%
38%
59%
0% 20% 40% 60% 80% 100%
Loan from financial institutionother than a mortgage
Loan or financial assistancefrom source other than
employer
Equity from primary residencebuyer continue to own
Proceeds from sale of realestate other than primary
residence
Individual Retirement Account(IRA)
Loan from relative or friend
Tax Refund
Inheritance
Sale of stocks or bonds
401k/pension fund including aloan
Gift from relative or friend
Proceeds from sale of primaryresidence
Savings
All Buyers First-time Buyers Repeat Buyers
The 2017 National Association of Realtors® Profile of Home Buyers and Sellers
FINANCING THE HOME PURCHASE
Exhibit 5-6SOURCES OF DOWNPAYMENT, BY ADULT COMPOSITION OF HOUSEHOLD(Percent of Respondents Among those who Made a Downpayment)
Indiana
All BuyersMarried couple
Single female
Single male
Unmarried couple Other
Savings 58% 56% 54% 43% 65% 71%Proceeds from sale of primary residence 34 41 28 48 8 43Gift from relative or friend 14 14 14 10 15 *Sale of stocks or bonds 3 4 4 * 4 *401k/pension fund including a loan 7 6 8 * 4 *Loan from relative or friend 3 3 4 * 8 *Equity from primary residence buyer continue to own 2 2 2 * 4 *Inheritance 3 1 10 14 * *Tax refund 4 3 6 * 4 *Individual Retirement Account (IRA) 2 2 4 10 * *Loan or financial assistance from source other than employer 1 1 2 * * *Proceeds from sale of real estate other than primary residence 1 1 * 5 4 *Loan from financial institution other than a mortgage 1 * 2 5 * *Loan or financial assistance through employer * 1 * * * *Other 3 2 4 5 12 *
U.S.
All BuyersMarried couple
Single female
Single male
Unmarried couple Other
Savings 59% 58% 54% 62% 70% 48%Proceeds from sale of primary residence 38 43 38 28 17 30Gift from relative or friend 13 12 12 9 23 13401k/pension fund including a loan 8 7 7 6 7 8Sale of stocks or bonds 6 7 4 6 8 5Inheritance 4 3 4 6 3 5Tax refund 4 4 3 4 6 7Loan from relative or friend 3 3 4 3 5 8Individual Retirement Account (IRA) 3 3 3 4 3 3Proceeds from sale of real estate other than primary residence 3 3 2 4 2 5Equity from primary residence buyer continue to own 2 2 1 3 1 *Loan or financial assistance from source other than employer 1 1 1 1 2 2Loan from financial institution other than a mortgage 1 * 1 1 1 *Loan or financial assistance through employer * * * * * *Other 4 3 5 5 4 5
* Less than 1 percent
ADULT COMPOSITION OF HOUSEHOLD
ADULT COMPOSITION OF HOUSEHOLD
The 2017 National Association of Realtors® Profile of Home Buyers and Sellers
FINANCING THE HOME PURCHASE
Exhibit 5-7LENGTH OF TIME TO SAVE FOR A DOWNPAYMENT, FIRST-TIME AND REPEAT BUYERS(Percentage Distribution Among those who Made a Downpayment)
Indiana
All BuyersFirst-time
BuyersRepeat Buyers
6 months or less 48% 38% 54%6 to 12 months 15 20 1212 to 18 months 7 8 618 to 24 months 6 12 3More than two years 23 21 25
U.S.
All BuyersFirst-time
BuyersRepeat Buyers
6 months or less 43% 29% 50%6 to 12 months 15% 19% 13%12 to 18 months 8% 11% 6%18 to 24 months 6% 9% 4%More than two years 28% 32% 26%
43%
15%
8%6%
28%29%
19%
11%9%
32%
50%
13%
6% 4%
26%
0%
10%
20%
30%
40%
50%
60%
6 months or less 6 to 12 months 12 to 18 months 18 to 24 months More than twoyearsAll Buyers First-time Buyers Repeat Buyers
The 2017 National Association of Realtors® Profile of Home Buyers and Sellers
FINANCING THE HOME PURCHASE
Exhibit 5-8LENGTH OF TIME TO SAVE FOR A DOWNPAYMENT, BY ADULT COMPOSITION OF HOUSEHOLD(Percentage Distribution Among those who Made a Downpayment)
Indiana
All BuyersMarried couple
Single female
Single male
Unmarried couple Other
6 months or less 48% 51% 43% 65% 45% 40%6 to 12 months 15 15 18 6 21 *12 to 18 months 7 5 5 12 3 4018 to 24 months 6 6 7 * 10 *More than two years 23 22 27 18 21 20
U.S.
All BuyersMarried couple
Single female
Single male
Unmarried couple Other
6 months or less 43% 44% 43% 41% 37% 37%6 to 12 months 15% 15% 13% 13% 20% 14%12 to 18 months 8% 8% 6% 8% 9% 6%18 to 24 months 6% 6% 5% 7% 7% 5%24 months to 5 years 28% 27% 32% 30% 27% 38%
ADULT COMPOSITION OF HOUSEHOLD
ADULT COMPOSITION OF HOUSEHOLD
43%44% 43%
41%
37% 37%
15% 15%13% 13%
20%
14%
8% 8%6%
8% 9%
6%6% 6% 5%7% 7%
5%
28% 27%
32%30%
27%
38%
0%
5%
10%
15%
20%
25%
30%
35%
40%
45%
50%
All Buyers Married couple Single female Single male Unmarried couple Other
6 months or less 6 to 12 months 12 to 18 months 18 to 24 months 24 months to 5 years
The 2017 National Association of Realtors® Profile of Home Buyers and Sellers
FINANCING THE HOME PURCHASE
Exhibit 5-9YEARS DEBT DELAYED HOME BUYERS FROM SAVING FOR A DOWNPAYMENT OR BUYING A HOME(Percentage Distribution)
Indiana
All BuyersFirst-time
BuyersRepeat Buyers
One year 20% 15% 27%Two years 23 15 33Three years 20 24 13Four years 5 9 *Five years 15 21 10More than five years 19 18 16Median 3 3 2
U.S.
All BuyersFirst-time
BuyersRepeat Buyers
One year 16% 16% 16%Two years 21 21 22Three years 14 14 14Four years 9 8 9Five years 18 18 17More than five years 22 23 22Median 3 3 3
The 2017 National Association of Realtors® Profile of Home Buyers and Sellers
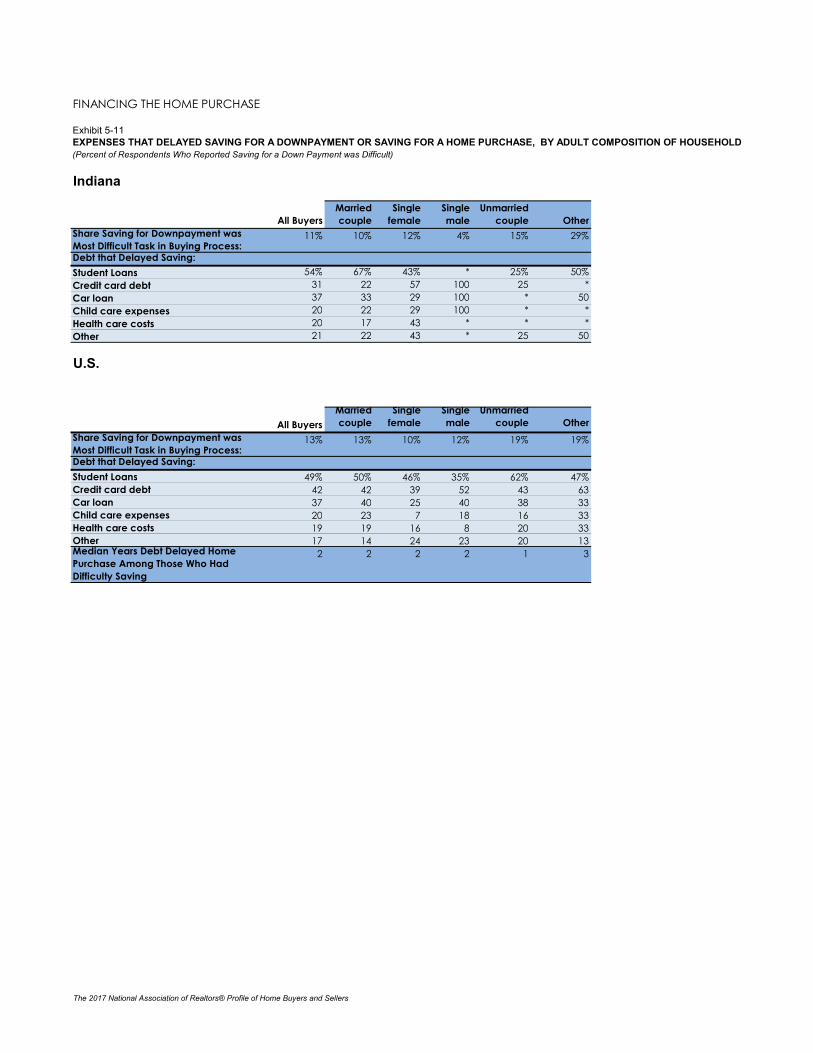
FINANCING THE HOME PURCHASE
Exhibit 5-10EXPENSES THAT DELAYED SAVING FOR A DOWNPAYMENT OR SAVING FOR A HOME PURCHASE, BY FIRST-TIME AND REPEAT BUYERS(Percent of Respondents Who Reported Saving for a Down Payment was Difficult)
Indiana
All BuyersFirst-time
Buyers Repeat BuyersShare Saving for Downpayment was Most Difficult Task in Buying Process:
Buyers Repeat BuyersShare Saving for Downpayment was Most Difficult Task in Buying Process:
13% 25% 7%
Debt that Delayed Saving:
Student Loans 49% 55% 38%Credit card debt 42 43 41Car loan 37 40 31Child care expenses 20 17 26Health care costs 19 19 19Other 17 16 19Median Years Debt Delayed Home Purchase Among Those Who Had Difficulty Saving
2 2 2
The 2017 National Association of Realtors® Profile of Home Buyers and Sellers
FINANCING THE HOME PURCHASE
Exhibit 5-11EXPENSES THAT DELAYED SAVING FOR A DOWNPAYMENT OR SAVING FOR A HOME PURCHASE, BY ADULT COMPOSITION OF HOUSEHOLD(Percent of Respondents Who Reported Saving for a Down Payment was Difficult)
Indiana
All BuyersMarried couple
Single female
Single male
Unmarried couple Other
Share Saving for Downpayment was Most Difficult Task in Buying Process:
Share Saving for Downpayment was Most Difficult Task in Buying Process:
13% 13% 10% 12% 19% 19%
Debt that Delayed Saving:
Student Loans 49% 50% 46% 35% 62% 47%Credit card debt 42 42 39 52 43 63Car loan 37 40 25 40 38 33Child care expenses 20 23 7 18 16 33Health care costs 19 19 16 8 20 33Other 17 14 24 23 20 13Median Years Debt Delayed Home Purchase Among Those Who Had Difficulty Saving
2 2 2 2 1 3
The 2017 National Association of Realtors® Profile of Home Buyers and Sellers
FINANCING THE HOME PURCHASE
Exhibit 5-12SACRIFICES MADE TO PURCHASE HOME, BY FIRST-TIME AND REPEAT BUYERS(Percent of Respondents)
Indiana
All Buyers
First-time Buyers
Repeat Buyers
Cut spending on luxury items or non-essential items 20% 34% 12%Cut spending on entertainment 16 30 7Cut spending on clothes 11 21 5Cancelled vacation plans 7 9 6Earned extra income through a second job 6 8 5Sold a vehicle or decided not to purchase a vehicle 3 3 3Other 3 4 2Did not need to make any sacrifices 69 56 76
U.S.All
BuyersFirst-time
BuyersRepeat Buyers
Other 4% 4% 4%Did not need to make any sacrifices 60% 44% 68%Sold a vehicle or decided not to purchase a vehicle 4% 6% 3%Earned extra income through a second job 5% 7% 4%Paid minimum payments on bills 8% 13% 6%Cancelled vacation plans 9% 12% 7%Cut spending on clothes 15% 26% 10%Cut spending on entertainment 21% 32% 14%Cut spending on luxury or non-essential items 28% 42% 20%
4%
68%
3%
4%
6%
7%
10%
14%
20%
4%
44%
6%
7%
13%
12%
26%
32%
42%
4%
60%
4%
5%
8%
9%
15%
21%
28%
0% 20% 40% 60% 80%
Other
Did not need to make any sacrifices
Sold a vehicle or decided not topurchase a vehicle
Earned extra income through a secondjob
Paid minimum payments on bills
Cancelled vacation plans
Cut spending on clothes
Cut spending on entertainment
Cut spending on luxury or non-essential items
All Buyers First-time Buyers Repeat Buyers
The 2017 National Association of Realtors® Profile of Home Buyers and Sellers
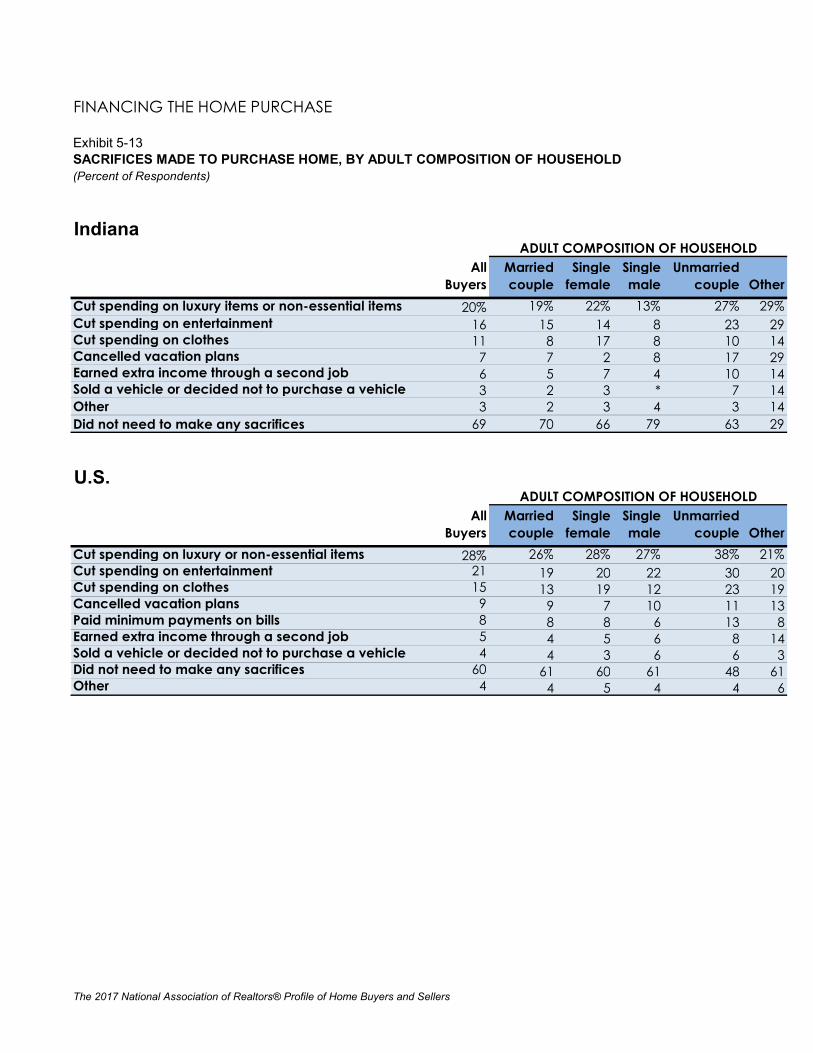
FINANCING THE HOME PURCHASE
Exhibit 5-13SACRIFICES MADE TO PURCHASE HOME, BY ADULT COMPOSITION OF HOUSEHOLD(Percent of Respondents)
Indiana
All Buyers
Married couple
Single female
Single male
Unmarried couple Other
Cut spending on luxury items or non-essential items 20% 19% 22% 13% 27% 29%Cut spending on entertainment 16 15 14 8 23 29Cut spending on clothes 11 8 17 8 10 14Cancelled vacation plans 7 7 2 8 17 29Earned extra income through a second job 6 5 7 4 10 14Sold a vehicle or decided not to purchase a vehicle 3 2 3 * 7 14Other 3 2 3 4 3 14Did not need to make any sacrifices 69 70 66 79 63 29
U.S.
All Buyers
Married couple
Single female
Single male
Unmarried couple Other
Cut spending on luxury or non-essential items 28% 26% 28% 27% 38% 21%Cut spending on entertainment 21 19 20 22 30 20Cut spending on clothes 15 13 19 12 23 19Cancelled vacation plans 9 9 7 10 11 13Paid minimum payments on bills 8 8 8 6 13 8Earned extra income through a second job 5 4 5 6 8 14Sold a vehicle or decided not to purchase a vehicle 4 4 3 6 6 3Did not need to make any sacrifices 60 61 60 61 48 61Other 4 4 5 4 4 6
ADULT COMPOSITION OF HOUSEHOLD
ADULT COMPOSITION OF HOUSEHOLD
The 2017 National Association of Realtors® Profile of Home Buyers and Sellers
FINANCING THE HOME PURCHASE
Exhibit 5-14
(Percentage Distribution Among those who Financed their Home Purchase)
Indiana
All BuyersFirst-time
BuyersRepeat Buyers
Much more difficult than expected 11% 11% 11%Somewhat more difficult than expected 20 28 16Not difficult/No more difficult than expected 49 39 55Easier than expected 19 21 18
* Less than 1 percent
U.S.
Repeat Buyers
First-time Buyers All Buyers
Much more difficult than expected 11% 11% 11%Somewhat more difficult than expected 21% 26% 23%Not difficult/No more difficult than expected 49% 39% 46%Easier than expected 18% 24% 20%
DIFFICULTY OF MORTGAGE APPLICATION AND APPROVAL PROCESS, BY FIRST-TIME AND REPEAT BUYERS
11%
11%
11%
21%
26%
23%
49%
39%
46%
18%
24%
20%
0% 20% 40% 60% 80% 100%
Repeat Buyers
First-time Buyers
All Buyers
Much more difficult than expected Somewhat more difficult than expectedNot difficult/No more difficult than expected Easier than expected
The 2017 National Association of Realtors® Profile of Home Buyers and Sellers
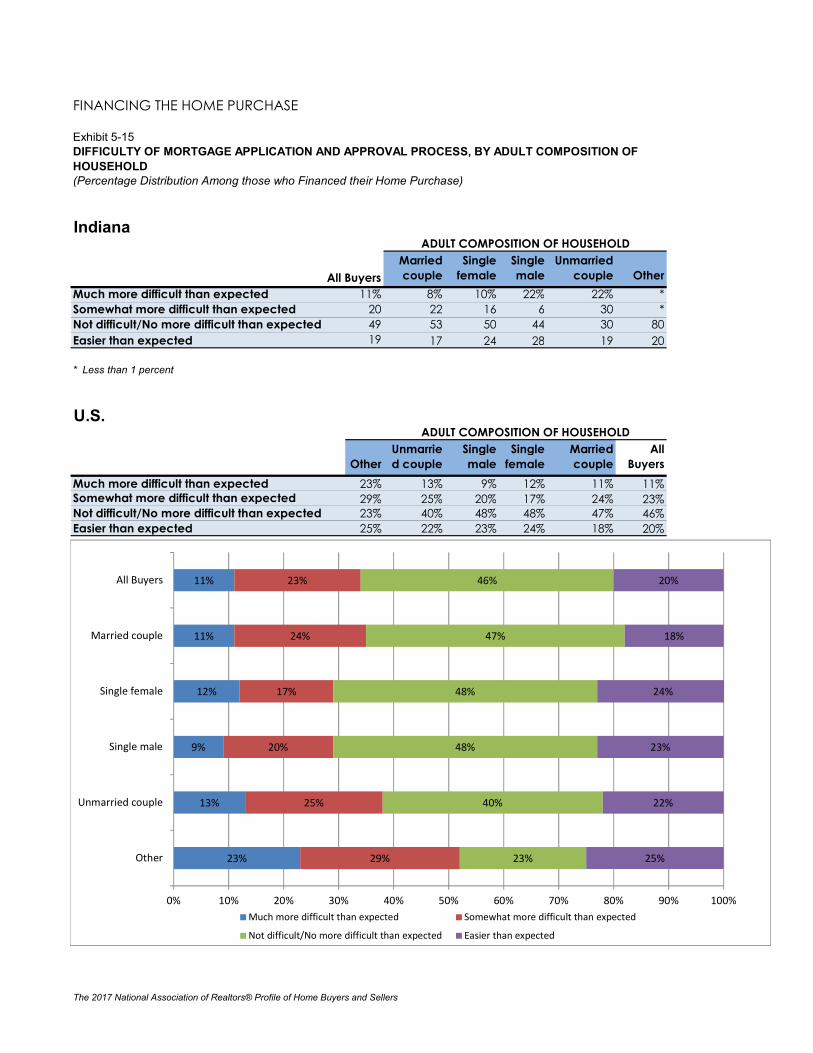
FINANCING THE HOME PURCHASE
Exhibit 5-15
(Percentage Distribution Among those who Financed their Home Purchase)
Indiana
All BuyersMarried couple
Single female
Single male
Unmarried couple Other
Much more difficult than expected 11% 8% 10% 22% 22% *Somewhat more difficult than expected 20 22 16 6 30 *Not difficult/No more difficult than expected 49 53 50 44 30 80Easier than expected 19 17 24 28 19 20
* Less than 1 percent
U.S.
OtherUnmarried couple
Single male
Single female
Married couple
All Buyers
Much more difficult than expected 23% 13% 9% 12% 11% 11%Somewhat more difficult than expected 29% 25% 20% 17% 24% 23%Not difficult/No more difficult than expected 23% 40% 48% 48% 47% 46%Easier than expected 25% 22% 23% 24% 18% 20%
ADULT COMPOSITION OF HOUSEHOLD
ADULT COMPOSITION OF HOUSEHOLD
DIFFICULTY OF MORTGAGE APPLICATION AND APPROVAL PROCESS, BY ADULT COMPOSITION OF HOUSEHOLD
23%
13%
9%
12%
11%
11%
29%
25%
20%
17%
24%
23%
23%
40%
48%
48%
47%
46%
25%
22%
23%
24%
18%
20%
0% 10% 20% 30% 40% 50% 60% 70% 80% 90% 100%
Other
Unmarried couple
Single male
Single female
Married couple
All Buyers
Much more difficult than expected Somewhat more difficult than expected
Not difficult/No more difficult than expected Easier than expected
The 2017 National Association of Realtors® Profile of Home Buyers and Sellers
FINANCING THE HOME PURCHASE
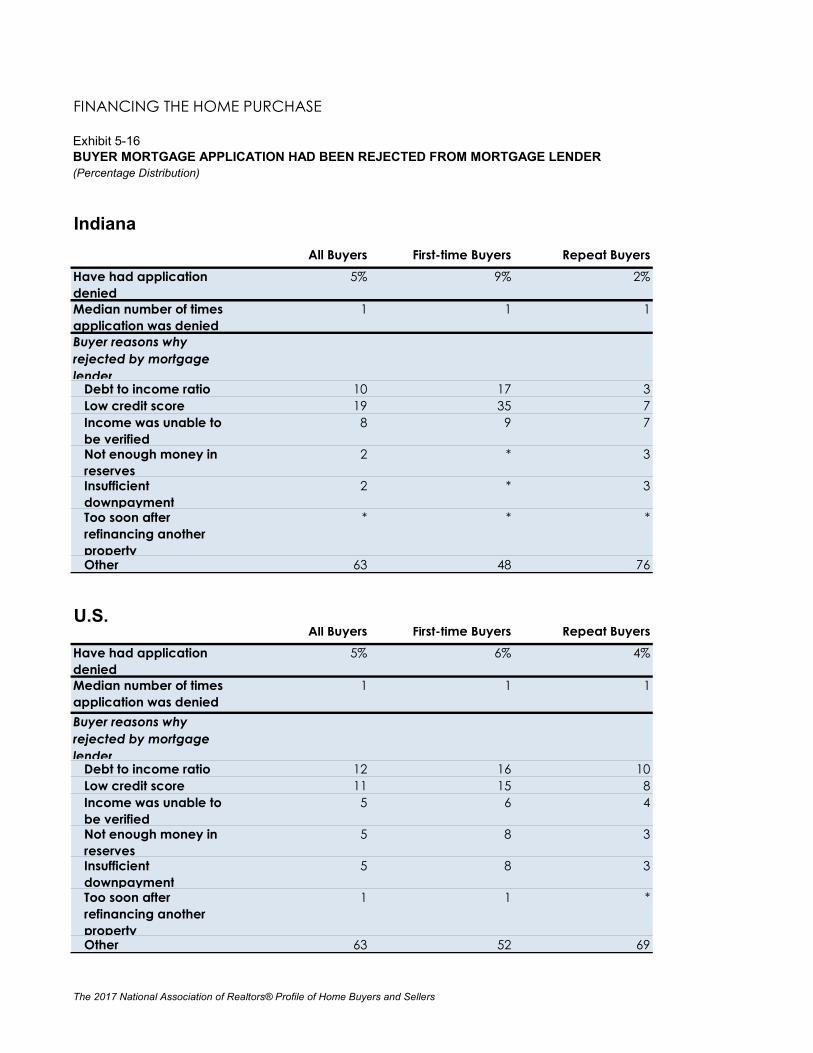
Exhibit 5-16
(Percentage Distribution)
Indiana
All Buyers First-time Buyers Repeat Buyers
Have had application denied
5% 9% 2%
Median number of times application was denied
1 1 1
Buyer reasons why rejected by mortgage lender
Debt to income ratio 10 17 3Low credit score 19 35 7Income was unable to be verified
8 9 7
Not enough money in reserves
2 * 3
Insufficient downpayment
2 * 3
Too soon after refinancing another property
* * *
Other 63 48 76
U.S.All Buyers First-time Buyers Repeat Buyers
Have had application denied
5% 6% 4%
Median number of times application was denied
1 1 1
Buyer reasons why rejected by mortgage lender
Debt to income ratio 12 16 10Low credit score 11 15 8Income was unable to be verified
5 6 4
Not enough money in reserves
5 8 3
Insufficient downpayment
5 8 3
Too soon after refinancing another property
1 1 *
Other 63 52 69
BUYER MORTGAGE APPLICATION HAD BEEN REJECTED FROM MORTGAGE LENDER
The 2017 National Association of Realtors® Profile of Home Buyers and Sellers
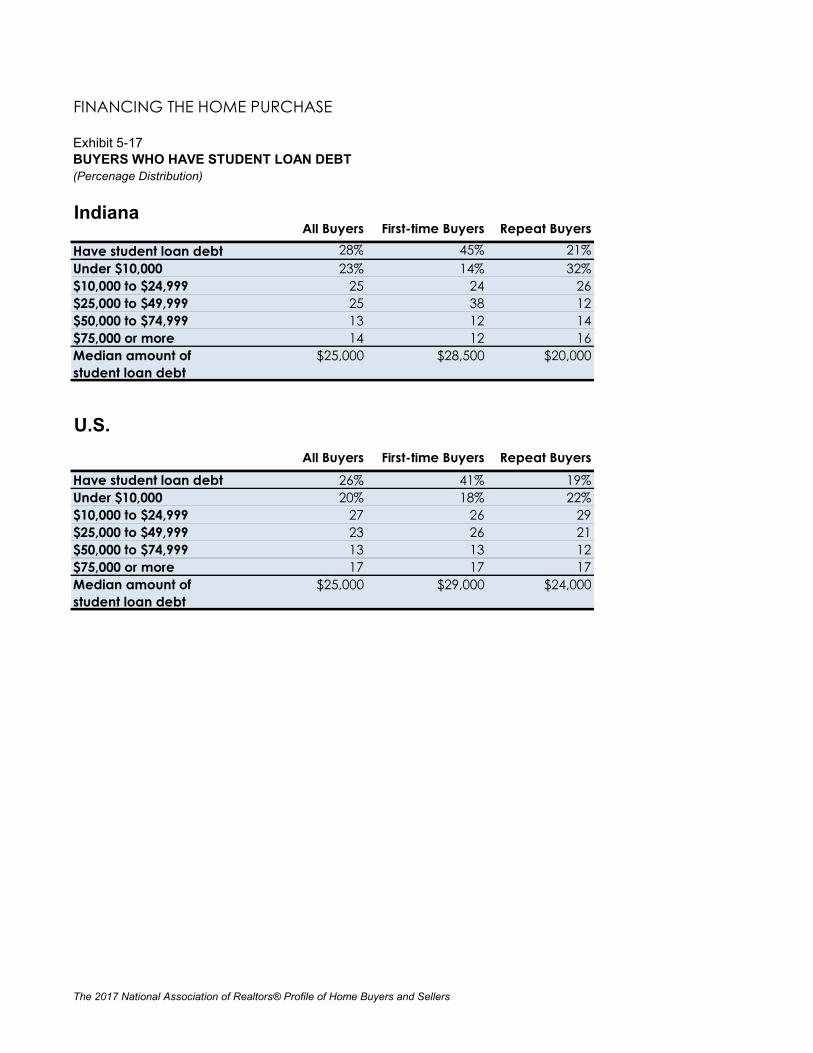
FINANCING THE HOME PURCHASE
Exhibit 5-17BUYERS WHO HAVE STUDENT LOAN DEBT(Percenage Distribution)
IndianaAll Buyers First-time Buyers Repeat Buyers
Have student loan debt 28% 45% 21%Under $10,000 23% 14% 32%$10,000 to $24,999 25 24 26$25,000 to $49,999 25 38 12$50,000 to $74,999 13 12 14$75,000 or more 14 12 16Median amount of student loan debt
$25,000 $28,500 $20,000
U.S.
All Buyers First-time Buyers Repeat Buyers
Have student loan debt 26% 41% 19%Under $10,000 20% 18% 22%$10,000 to $24,999 27 26 29$25,000 to $49,999 23 26 21$50,000 to $74,999 13 13 12$75,000 or more 17 17 17Median amount of student loan debt
$25,000 $29,000 $24,000
The 2017 National Association of Realtors® Profile of Home Buyers and Sellers
FINANCING THE HOME PURCHASE
Exhibit 5-18BUYER PREVIOUSLY SOLD A DISTRESSED PROPERTY (SHORT SALE OR FORECLOSURE)(Percentage Distribution)
Indiana
All BuyersPreviously had a distressed property sale 5%Median year of sale 2010
U.S.
All BuyersPreviously had a distressed property sale 9%Median year of sale 2010
The 2017 National Association of Realtors® Profile of Home Buyers and Sellers
FINANCING THE HOME PURCHASE
Exhibit 5-19TYPE OF MORTGAGE, FIRST-TIME AND REPEAT BUYERS(Percentage Distribution Among those who Financed their Home Purchase)
The 2017 National Association of Realtors® Profile of Home Buyers and Sellers
FINANCING THE HOME PURCHASE
Exhibit 5-21
(Percentage Distribution)
Indiana
All BuyersFirst-time
BuyersRepeat Buyers
New Homes
Previously Owned Homes
Good financial investment 80% 77% 82% 87% 80%Better than stocks 37 38 37 30 37About as good as stocks 28 28 28 40 28Not as good as stocks 15 11 17 17 15
Not a good financial investment 5 5 6 3 6Don’t know 14 18 13 10 15
* Less than 1 percent
U.S.
All BuyersFirst-time
BuyersRepeat Buyers
New Homes
Previously Owned Homes
Good financial investment 83% 84% 82% 83% 82%Better than stocks 44 48 42 41 44About as good as stocks 27 26 27 28 27Not as good as stocks 12 10 13 14 11
Not a good financial investment 5 3 6 4 5Don't know 13 14 13 13 13
BUYERS' VIEW OF HOMES AS A FINANCIAL INVESTMENT, FIRST-TIME AND REPEAT BUYERS, AND BUYERS OF NEW AND PREVIOUSLY OWNED HOMES
BUYERS OF
BUYERS OF
The 2017 National Association of Realtors® Profile of Home Buyers and Sellers
FINANCING THE HOME PURCHASE
Exhibit 5-22
BUYERS' VIEW OF HOMES AS A FINANCIAL INVESTMENT, BY ADULT COMPOSITION OF HOUSEHOLD(Percentage Distribution)
Indiana
All BuyersMarried couple
Single female
Single male
Unmarried couple Other
Good financial investment 80% 82% 83% 68% 77% 85%Better than stocks 37 36 41 36 27 57About as good as stocks 28 27 37 16 37 14Not as good as stocks 15 19 5 16 13 14
Not a good financial investment 5 4 5 12 10 *Don’t know 14 15 12 20 13 14
* Less than 1 percent
U.S.
All BuyersMarried couple
Single female
Single male
Unmarried couple Other
Good financial investment 83% 83% 81% 80% 82% 76%Better than stocks 44 42 44 39 52 44About as good as stocks 27 28 29 26 24 21Not as good as stocks 12 13 8 15 6 11
Not a good financial investment 5 5 4 6 4 6Don't know 13 12 15 14 14 17
ADULT COMPOSITION OF HOUSEHOLD
ADULT COMPOSITION OF HOUSEHOLD
The 2017 National Association of Realtors® Profile of Home Buyers and Sellers