11111111111111111 111111111p111111111111111111111111111111111111111 (12) United States Patent (10) Patent No.: US 8,279,236 B2 Holub (45) Date of Patent: Oct. 2, 2012 4,677,465 A 4,700,218 A 4,729,016 A 4,742,387 A 4,745,465 A 4,839,829 A 4,843,573 A 4,939,581 A 4,941,038 A 4,975,862 A 4,980,759 A 5,040.889 A (54) METHODS AND APPARATUS FOR CALIBRATING A COLOR DISPLAY (75) Inventor: Richard A. Holub, Rochester, NY (US) (73) Assignee: Rah Color Technologies LLC, Rochester, NY (US) ( • ) Notice: Subject to any disclaimer, the term of this patent is extended or adjusted under 35 U.S.C. 154(b) by 0 days. 6/1987 Alkofer 10/1987 Thomsen et al. 3/1988 Alkofer 5/1988 Oshima 5/1988 Kwon 6/1989 Freedman 6/1989 Taylor et al. 7/1990 Shalit 7/1990 Walowit 12/1990 Keller et al. 12/1990 Smyth 8/1991 Keane (Continued) (21) Appl. No.: 13/136,919 (22) Filed: Aug. 15, 2011 (65) Prior Publication Data US 2011/0298837 Al Dec. 8, 2011 Related U.S. Application Data (62) Division of application No. 12/661,663, filed on Mar. 22, 2010, now Pat. No. 8.009,175. which is a division of application No. 11/442,882, filed on May 30, 2006, now Pat. No. 7,710,433, which is a division of application No. 09/832,553, filed on Apr. 11, 2001, now Pat. No. 7,102,648. (60) Provisional application No. 60/195,837, filed on Apr. 11, 2000. (51) Int. Cl. G09G 5/02 (2006.01) (52) U.S. Cl. 345/590: 345/589; 345/593; 345/594 (58) Field of Classification Search 345/589, 345/590, 593, 594, 597, 601, 602; 382/167 See application file for complete search history. (56) References Cited U.S. PATENT DOCUMENTS 4,630,076 A 12/1986 Yoshimura 4.658,286 A 4/1987 Schwartz et al. FOREIGN PATENT DOCUMENTS EP 0579224 1/1994 (Continued) OTHER PUBLICATIONS Ohno, Y et al., Four-Color Matrix Method for Correction of Tristimulus Colorimeters, Proc., IS&T Filth Color Imaging Confer- ence, 301-305 (1997). (Continued) Primary Examiner -- Hau Nguyen (74) Attorney, Agent, or Firm -- Kenneth J. LuKacher (57) ABSTRACT Improved methods are provided for calibrating color on a color display coupled to a computer, which are useful for obtaining calibrated data in a virtual proof network for enabling different color devices to render consistent color. Methods involve user interactions with screens on the display to set color display parameters. An apparatus is also provided for calibrating a sensor which may be used for measuring color of a display in one or more of these methods. 36 Claims, 17 Drawing Sheets line of sight of sensor 10 with regard to screen sensor housing Knell Or 13 faceplate Di gital display's functions line of sight reflects off same and into black inside of amid 11 16 14 cowed limn infklenCe of ambient Iiiht Digital Meng Cenyersion Commusicatinne between hen gniplida section and digital controller of brightness, Pc. in display AppEcatiou Program. Software.gplensted 4— control signals for di:i- nlay based upon sensor lapin Aior User Preis . 4— Video LUTe modify 310 Manor Frame 4— Tone Repro Conversion to Buffer Curses Monitor's ROB Device-Indepoodeol Color Image Dina. e.g From Retouch App. Graphics Display Section of Host Computer
(12) United States Patent (10) Patent No.: US 8,279,236 B2 Holub
(45) Date of Patent: Oct. 2, 2012
4,677,465 A 4,700,218 A 4,729,016 A 4,742,387 A 4,745,465 A 4,839,829 A 4,843,573 A 4,939,581 A 4,941,038 A 4,975,862 A 4,980,759 A 5,040.889 A
(54) METHODS AND APPARATUS FOR CALIBRATING A COLOR DISPLAY
(75) Inventor: Richard A. Holub, Rochester, NY (US)
(73) Assignee: Rah Color Technologies LLC, Rochester, NY (US)
( • ) Notice:
Subject to any disclaimer, the term of this patent is extended or adjusted under 35 U.S.C. 154(b) by 0 days.
6/1987 Alkofer 10/1987 Thomsen et al. 3/1988 Alkofer 5/1988 Oshima 5/1988 Kwon 6/1989 Freedman 6/1989 Taylor et al. 7/1990 Shalit 7/1990 Walowit
12/1990 Keller et al. 12/1990 Smyth
8/1991 Keane
(Continued)
(21) Appl. No.: 13/136,919
(22) Filed: Aug. 15, 2011
(65) Prior Publication Data
US 2011/0298837 Al Dec. 8, 2011
Related U.S. Application Data
(62) Division of application No. 12/661,663, filed on Mar. 22, 2010, now Pat. No. 8.009,175. which is a division of application No. 11/442,882, filed on May 30, 2006, now Pat. No. 7,710,433, which is a division of application No. 09/832,553, filed on Apr. 11, 2001, now Pat. No. 7,102,648.
(60) Provisional application No. 60/195,837, filed on Apr. 11, 2000.
(51) Int. Cl.
G09G 5/02 (2006.01) (52) U.S. Cl. 345/590: 345/589; 345/593; 345/594 (58) Field of Classification Search 345/589,
345/590, 593, 594, 597, 601, 602; 382/167 See application file for complete search history.
(56)
References Cited
U.S. PATENT DOCUMENTS
4,630,076 A 12/1986 Yoshimura
4.658,286 A 4/1987 Schwartz et al.
FOREIGN PATENT DOCUMENTS
EP
0579224 1/1994
(Continued)
OTHER PUBLICATIONS
Ohno, Y et al., Four-Color Matrix Method for Correction of Tristimulus Colorimeters, Proc., IS&T Filth Color Imaging Confer-ence, 301-305 (1997).
(Continued)
Primary Examiner -- Hau Nguyen (74) Attorney, Agent, or Firm -- Kenneth J. LuKacher
(57) ABSTRACT
Improved methods are provided for calibrating color on a color display coupled to a computer, which are useful for obtaining calibrated data in a virtual proof network for enabling different color devices to render consistent color. Methods involve user interactions with screens on the display to set color display parameters. An apparatus is also provided for calibrating a sensor which may be used for measuring color of a display in one or more of these methods.
36 Claims, 17 Drawing Sheets
line of sight of sensor
10 with regard to screen
sensor housing Knell Or
13 faceplate
Digital display's functions
line of sight reflects off same and into black inside of amid
11
16
14
cowed limn infklenCe of ambient Iiiht
Digital Meng
Cenyersion
Commusicatinne between hen gniplida section and digital controller of brightness, Pc. in display
AppEcatiou Program. Software.gplensted
4— control signals for di:i-nlay based upon sensor lapin Aior User Preis.
4—
Video LUTe modify 310 Manor Frame 4— Tone Repro Conversion to Buffer Curses Monitor's ROB
Device-Indepoodeol Color Image Dina. e.g From Retouch App.
Graphics Display Section of Host Computer
US 8,279,236 B2 Page 2
U.S. PATENT DOCUMENTS 6,310,626 131 10/2001 Walker et al.
5,049,986 A 9/1991 Aono et al. 6,310,650 B1 10/2001 Johnson et al. . 6,320,668 B1 11/2001 Kim 5,057,913 A 10/1991 Nagata et al. 6,335,983 B1 1/2002 McCarthy et al. 5,083,195 A 1/1992 Evelin 6,337,922 B2 1/2002 Kumada 5.113,355 A 5/1992 Nomura 6,341,175 B1 1/2002 Usaini • 5,115,229 A 5/1992 Shalit 6,342,951 131 1/2002 Eschbach et al. 5,146,328 A 9/1992 Yamasaki et al. 6,369,901 B1 4/2002 Buhr 5,177,602 A 1/1993 Fujimori 6,373,580 131 4/2002 Walker 5,212,546 A 5/1993 Amzi et al. 6.380,951 B1 4/2002 Petchenlcine et al. 5,231,481 A 7/1993 Eouzan et al. 6,381,343 131 4/2002 Davis et al. 5,243.414 A 9/1993 Dalrymple et al. 6,388,674 131 5/2002 Ito et al. 5,272,518 A 12/1993 Vincent 6,404,509 B1 6/2002 Kuwata et al. 5,278,641 A 1!1994 Sekizawa et al. 6.414,690 Ill 7/2002 Balasubramanian et al. 5,309,257 A 5/1994 Bonin° et al. 6,429,875 B1 8/2002 Pettigrew et al. 5,313,291 A 5/1994 Appel et al. 6,430,311 131 8/2002 Ktunada 5,333,069 A 7/1994 Spence 6,430,312 B1 8/2002 Huang et al. 5,345,315 A 9/1994 Shalit 6,437,792 Ill 8/2002 Ito et al. 5,363,197 A 11/1994 Ohno et al. 6,459,425 B1 10/2002 Holub et al. 5,363,318 A 11/1994 McCauley 6,459,436 131 * 1012002 Kumada et al. 345/590 5,414,538 A 5/1995 Eschbach 6,483,524 BI 11/2002 Petchenlcine et al. 5,416,890 A 5/1995 Beretta 6,501,850 B2 12/2002 Setchell 5,426,517 A 6/1995 Schwartz 6,504,950 B1 1/2003 Murashita et al. 5,428,720 A 6/1995 Adams, Jr. 6,505,256 B1 1/2003 York 5,432,906 A 7/1995 Newman et al. 6,516,089 131 2/2003 McCann et al. 5,444,556 A 8/1995 Ito et al. 6,522,778 131 2/2003 Tamagawa 5,450,502 A 9/1995 Eschbach et al. 6,525,721 B1 2/2003 Thomas et al. 5,459,678 A 10/1995 Feasey 6,549,652 131 4/2003 Persiantsev et al. 5,479,186 A 12/1995 McManus et al. 6,549,653 B1 4/2003 Osawa et al. 5,495,428 A 211996 Schwartz 6,549.654 B1 * 4/2003 Kumada 382/162 5,499,040 A 3/1996 McLaughlin et al. 6,559,944 B1 5/2003 Van Aken et al. 5,512,961 A 4/1996 Cappels, Sr. 6,580,524 B1 6/2003 Weichmann et al. 5,528,261 A 6/1996 Holt et al. 6,603,879 B2 • 8/2003 Haikin et al. 382/167 5,532,848 A 7/1996 Beretta 6,606,165 131 8/2003 Barry et al. 5,539,539 A 7/1996 Fujimoto et al. 6,611,249 131 8/2003 Evanicky et al. 5,544,258 A 8/1996 Levien 6,621,923 B1 9/2003 Gennetten 5,554,912 A 9/1996 Thayer et al. 6,624,908 B1 9/2003 Petchenkine et al. 5,561,459 A 10/1996 Stokes et al. 6,633,396 B1 1012003 Barry et al. 5,568,169 A 10/1996 Dudek et al. 6,636,326 B1 1012003 Zuber 5,596,416 A 1/1997 Barry et al. 6,654,491 B1 1112003 Hidalca 5,604,596 A 2/1997 Ukai et al. 6,657,741 B1 12/2003 Barry et al. 5,625,758 A 4/1997 Schneider et al. 6,704,442 B2 3/2004 Haikin et al. 5,638,117 A 6/1997 Engeldrum et al. 6,724,507 131 4/2004 Ikegatni et al. 5,668,890 A 9/1997 Winkelman 6,748,471 B1 612004 Keeney et al. 5,680,333 A 10/1997 Jansson 6,750,992 131 6/2004 Holub 5,739,809 A 4/1998 McLaughlin et al. 6,757,450 B1 6/2004 Gershony et al. 5,745,657 A 4/1998 Barry et al.
5,751,965 A 5/1998 Mayo et al. 6,788,305 131 9/2004 Ohga 5,767,980 A 6/1998 Wang et al. 6,803,921 B1 10/2004 Balasubrarnanian et al. 5,786,803 A 7/1998 Hernandez et al. 6,867.883 B1 3/2005 Cholewo et al. 5,806,081 A 9/1998 Swett et al. 6,995,870 B2 2/2006 Holub 5,809,165 A 9/1998 Massen 7,075,643 B2 7/2006 Holub 5,809,213 A 9/1998 Bhattachadya 7,102,648 B1 9/2006 Holub 5,812,286 A 9/1998 Lin 7.280,251 B1 10/2007 Holub 5,821,917 A 10/1998 Cappels 7,312,897 B2 12/2007 Holub 5,828,793 A 10/1998 Mann 7,710,433 B2 5/2010 Holub 5,835,817 A 11/1998 Bullock et al. 7,710,560 B2 5/2010 Holub 5,850,472 A 12/1998 Alston et al. 7,715,052 132 5/2010 Holub 5,859,711 A 1/1999 Barry et al. 7,728,845 B2 6/2010 Holub 5,867,603 A 2/1999 Barnsley et al. 7,729,008 B2 6/2010 Holub 5,905,906 A 5/1999 Goffinet et al. 7,791,761 132 9/2010 Holub 5,940,186 A 8/1999 Barry et al.
7,830,546 132 11/2010 Holub 5,978,745 A 11/1999 Devine 8,009,175 132 8/2011 Holub 6,018,361 A 1/2000 Fuji; et al.
6,035,103 A 3/2000 Zuber 2002/0003903 Al 1/2002 Engeldrum et al. 6,043,909 A 3/2000 Holub 2002/0085749 Al 7/2002 Setchell 6,072,546 A 6/2000 Nalcayabu 2010/0231728 Al 9/2010 Holub 6,075,888 A 6/2000 Schwartz 2010/0245874 AI 9/2010 Holub 6,097,471 A 8/2000 Buhr et al. 2010/0289835 Al 11/2010 Holub 6,157,735 A 12/2000 Holub 6,219,099 B1 4/2001 Johnson et al. FOREIGN PATENT DOCUMENTS 6,219,155 Bl 4/2001 Zuber JP 61-292026 12/1986 6,232,954 131 5/2001 Rozzi JP 62-91078 4/1987 6,246,790 B1 6/2001 Huang et al. JP 4-329066 1111992 6,271.937 B1 8/2001 Zuber JP 7-17115 1/1995 6,282.311 BI 8/2001 McCarthy et al. JP 07-095427 4/1995 6,282,312 B1 812001 McCarthy et al. JP 7-288704 10/1995 6,282,313 B1 8/2001 McCarthy et al. JP 10-173943 6/1998 6,285,784 B1 9/2001 Spaulding et al. WO WO 96/00435 111996 6,301,393 B1 10/2001 Spaulding et al. WO WO 99/10866 3/1999
US 8,279,236 B2 Page 3
OTHER PUBLICATIONS
Ohno, Y. et al., Four-Color Matrix Method for Correction of Tristimulus Colorimeters -Part 2, Proc., IS&T Sixth Color Imaging Conference (1998). Cowan. W.. An Inexpensive Scheme for Calibration of a Colour Monitor in Terms of CIE Standard Coordinates, Computer Graphics, vol. 17, No. 3, pp. 315-321, Jul. 1983. Blessing, R.. Before Your Vety Eyes. Publishing & Production Executive, Aug. 1995. Adobe Photoshop Version 5.0, User Guide, Adobe Systems Incorpo-rated, pp. 6 and 79-86, 1998. Commission Internationale de L'Eclairage. "Colorimetry", Second Edition, Austria, Publication CIE 15.2, pp. 19-23. 27-32, (1986). Designmaster 8000, Operator Training Manual, Kodak Electronic Printing Systems, pp. 1-7, 145-147, 301-315 and 361-362 (1990). Cornsweet, TN., Visual Perception, Academic Press, pp. 80-89 and 311-341 (1970). Rose, ILE., Adaptation of Electronic Color Correction to the Printing Process, TAGA Proceedings. pp. 28-37 (1955). Bartleson et al., Brightness Perception in Complex Fields. J. Opt. Soc. Amer.. vol. 57: pp. 953-957 (1967). Holub, R. et al., Color Systems Calibration for Graphic Arts: I. Input Devices, J. Imaging Technol., vol. 14, pp. 47-52, (1988). Holub, R. et al., Color Systems Calibration for Graphic Arts: H. Output Devices. J. Imaging Technol., vol. 14, pp. 53-60, (1988). Edmund Industrial Optics, Optics and Optical Instruments Cata-logue, No. NO0713. p. 266 (2000). International Color Consortium, File Format for Color Profiles, Specification ICC.1:Sep. 1998 and Addendum 2 to Spec. ICC.1:Sep. 1998, under Document ICC. IA:Apr. 1999 (1999). Marszalec, E. et al., Some Aspects of RGB Vision and its Applica-tions in Industry, International Journal of Pattern Recognition and Artificial Intelligence, vol. 10, No. 1, pp. 55-72 (1996). Marszalec. E. et al., On-Line Color Camera Calibration, IEEE, pp. 232-237 (1994). Marszalec, E. et al., Color Measurements Based on a Color Camera, Proc. SPIE/NEW vol. 3101, Image Processing Techniques and Applications: Algorithms, Methods and Components II, Munich, 170-181 (1997). Brown, S. W. et al., NIST Calibration Facility for Display Colorimeters, Proc., IS&T/SPIE 11m International Symposium. Electronic Imaging'99, San Jose (1999). Brown, S. W. et al., Calibrating Colorimeters for Display Measure-ments, Article Manuscript: Information Display Dec. 1999 pp. 30-34 (1999). Buckley, R., Specifying Color in Office Documents, TAGA Proceed-ings, pp. 30-43 (1990). Maria, A., A Digital Color Separating System Based on Principles of Colorimetry, TAGA Proceedings, pp. 346-361 (1984). Newman, T.. Improved Color for the World Wide Web: A Case Study in Color Management for Distributed Digital Media, TAGA Proceed-ings, vol. 2, pp. 772-787 (1995). Micrografx Picture Publisher Reference Guide, Micrografx, Inc., 1992. Radius PressView System User's Manual, Jun. 1995. Radius PressView 17.SR and PressView 21SR User's Manual, Mar. 1995. Radius ProSense Display Calibrator User's Manual, Jun. 1995. Gaido, D. et al., Remote Press Proof System, U.S. Appl. No. 6t)/195,688, filed Apr. 7, 2000. OfficeAction dated Feb. 10, 2009 with Notice of References Cited for U.S. Appl. No. 11/216,784, filed Aug. 31, 2005. Pointer, M.. The Gamut of Real Surface Colours, Color Research and Applications, vol. 5, No. 3, pp. 145-155, 1980.
Hunt, R., A Model of Colour Vision for Predicting Colour Appear-ance in Various Viewing Conditions, Color Research and Applica-tion, vol. 12, No. 6, pp. 297-314, 1987. Silicon Graphics. Inc.. SGI Multilink Adapter Box for the Flat Panel Monitor, Owner's Guide. 1999. Berns, R. et al., CRT Colorimetry. Part I: Theory and Practice, Color Research & Application, 18(5): pp. 299-314, 1993. Berns, R. et al.. CRT Colorimetry. Part II: Metrology, Color Research & Application, 18(5): pp. 315-325, 1993. Imation Verifi Accurate Web Color: Technology White Paper, 2000. Johnson, T., An Effective Color Management Architecture for Graphic Arts, TAGA Proceedings, published by the Technical Asso-ciation of the Graphic Arts, now part of PIA/GATF, Pittsburgh, PA. pp. 88-111, 2000. Defendants' Answer, Affirmative Defenses, and Counterclaims, United States District Court for the Western District of New York, Case 6:10-cv-06710-CJS, Document 9, Filed Apr. 4, 2011, pp. 1-30. Holub, Richard A. et al., Three-Component Color Representations for Graphic Arts, IS&T Final Program and Advance Printing of Paper Summaries, IS&T's 46th Annual Conference, May 9-14, 1993, pp. 163-165. Holub, Richard A. et al., Three Component Color Representations for Graphic Arts, Proceedings of the Annual Technical Conference Tech-nical Association of the Graphic Arts, Rochester, NY, 1993, pp. 50-66. PostScript Language Reference Manual, 2nd Edition, Adobe Sys-tems, Incorporated, 1990, pp. i-vi and 1-764. Defendants' Answer to Plaintiff's First Amended Complaint, Affir-mative Defenses, and Counterclaims, United States District Court for the Western District of New York, Case 6:10-cv-06710-0S, Docu-ment 11, Filed Apr. 25, 2011, pp. 1-42. "Introducing ImagExpoTM 1.2 Interactive Remote Viewing and Annotation Software for the Graphic Arts Professional", Group Logic, Arlington, Virginia, 1994-1995. Sodergard, C. et al., A General Teleproofing System, TAGA Proceed-ings, 1991, pp. 88-99, The Technical Association of the Graphic Arts. Sewickley, PA. Apple Computer, Advanced Color Imaging on the Mac OS, Addison-Wesley, Aug. 1995, p. 344. lnterColor Consortium, ICC Profile Format 3.0, Jun. 10, 1994, p. 82. Murch, G., Management on the Desktop, IS&T and SID's Color Imaging Conference, pp. 95-99, 1993. Birmy Graphics Corp., PowerRIP 3.1 for Macintosh Manual, Jul. 1995, p. 44. Asadi, B. et al., QuarkXPress 3.2/3.3 Bible, IDG Books, 1993, p.694. Takehara, K., et al., A SAW-Based Spread Spectrum Wireless LAN System. IEEE Second International Symposium on Spread Spectrum Techniques and Applications, Nov. 29, 1992, pp. 175-178. Starkweather, G., A High Resolution Laser Printer, J. Imaging Technol. 11(6): 300-305, 1985. Stone, J., et al., Color Gamut Mapping and the Printing of Digital Color Images, ACM Transactions on Graphics 7(4): 249-292, 1988, Gentile, R., Device Independent Color in PostScript, in SPIE vol. 1913. Human Vision, Visual Processing and Digital Display IV, pp. 419-432, 1993. Maeda, M. et al., Object Oriented Color Management System, in SPIE vol. 1909, Device Independent Color Imaging and Imaging System Integration, pp. 195-205, 1993. Tektronix, Inc., Phaser 240 User Manual. p. 202, 1995. Tektronix. Inc., TekColor(tm), Color Management System, p. 115. 1990. Japanese Patent Office Action Mailed Feb. 14, 2012, Japanese Patent Application No. 2011-074873, translation of Action and Pending Claims.
* cited by examiner
12
11
U.S. Patent Oct. 2, 2012
Sheet 1 of 17 US 8,279,236 B2
line of sight of sensor
10 with regard to screen
sensor housing 1,1 screen or
faceplate
G
Digital controller f display's functions
15
line of sight reflects off screen and into black inside of cowel
11 16
14
cowel limits influence of ambient light
Digital to Analog
Conversion
Video Frame Buffer
Communications link between host graphics section and digital controller of brightness, etc. in display
LUTs modify 3X3 Matrix 11 -- Tone Repro III— Conversion to
Curves Monitor's RGB
Application Program: Software-generated control signals for dis-play based upon sensor input &/or User Prefs.
Device-Independent Color Image Data, e.g. From Retouch App.
Graphics Display Display Section of Host Computer
FIG. I
Network Link, 25 Colori-meter,
22
20, Nodal Computer
21
24 Printer/Press
FIG. 2
U.S. Patent Oct. 2, 2012 Sheet 2 of 17 US 8,279,236 B2
I.,.
User invokes measurement routine to verify that physical gray balance and tone reproduction conform to current profile 31
U.S. Patent Oct. 2, 2012 Sheet 3 of 17 US 8,279,236 B2
compared, under desired illumination, with display screen User places proofing or printing stock so that it can be 1%- ?
User invokes teaching program: 1. Program creates on screen a large window
filled with color of current system white point 2. Program provides adjustment controls for each
of display primary channels in region of screen 33 3. User adjusts controls to match screen and stock
visually 4. Program invokes routine to measure User-
requested white balance; data are saved for 3 "I use in calibrating color devices
5. Color transforms are updated as needed at nodes .1 3 S
User has option of verifying that newly defined white point matches reference stock and
illumination and re-iterating as needed
FIG. 3
/ 43 c
Reduce brightness
Measure Red, Blue and White increment r thresholds in order to test superposition 43 a
Verify and refine White Point and Tone Repro using reference films
Measure increment threshold in darkened room and normal light
L16,,
U.S. Patent Oct. 2, 2012 Sheet 4 of 17 US 8,279,236 B2
(start) Identify monitor; attempt to find in database 3. 4 I
If monitor known Load library data such as chromaticities of R, G and B
Raise display's contrast setting to (near-)max store value if possible
Raise display's brightness setting to max and measure decrement threshold from 0=255, R=B=0
Lower brightness to 60% by iteratively using green increment threshold
Compute results; update profiles and /45 shareable components of Virtual Proof
FIG. 4
(File Tutorial IHAqICAL
Step One: Use threshold techniques to estimate white balance, absolute luminance levels and backlight
Access tutorial
Step Two: Verify correctionscorrections as slideshow or using reference films multimedia demo
Save results in Proof
FIG. 5
U.S. Patent Oct. 2, 2012 Sheet 5 of 17 US 8,279,236 B2
(Striped increment signal is detected against background; can have horizontal vertical or 45° orientation and color of R, G or B monitor primaries
Most of the screen is darkened, except for this disk, which can be dark or any other color; it serves as background for increment threshold
judgements by User.
Radio buttons enable User to identify orientation and color of increment stripes
000
000 R G
U.S. Patent Oct. 2, 2012 Sheet 6 of 17 US 8,279,236 B2
FIG. 6
Setup: Size and align black hole on screen with central cut-out of film.
color match area of screen seen through film cutout
,__-_edge of film overlay
Donut - Size - Position
_
Save Setup
Hole - Size - Position
•
annular area o screen, illuminated bright white & `, covered by film
FIG. 7
U.S. Patent Oct. 2, 2012 Sheet 7 of 17 US 8,279,236 B2
FIG. 8
Use sliders or click on color direction of error to get match
U.S. Patent Oct. 2, 2012 Sheet 8 of 17 US 8,279,236 B2
U.S. Patent Oct. 2, 2012 Sheet 9 of 17 US 8,279,236 B2
Prepare Normative Color-Matching Data:
-,- Calibrate each type of monitor instrumentally q I
HSet up annulus on screen; display stimuli (FIGS. 7-8) q?
Loop over monitor type, observers and white points: • Observer makes color match
Record match values Measure match settings instrumentally
Yes
1-"\-- Model relationship between match values and measurements q Li
--- Store models in database accessible on network or other media 95
FIG. 9A
I
0
U.S. Patent Oct. 2, 2012 Sheet 10 of 17 US 8,279,236 B2
Use Normative Data in Subjective Calibration:
Set Contrast control near max; Adjust Brightness control;
Measure threshold
. User makes color matches using one or more film annuli cl‘
1
Retrieve model from database; Plug in color match data; Compute prevailing white point
F. Establish new balance vector cir
COED
FIG. 9B
aulti
2ri
pap
anop
x
x
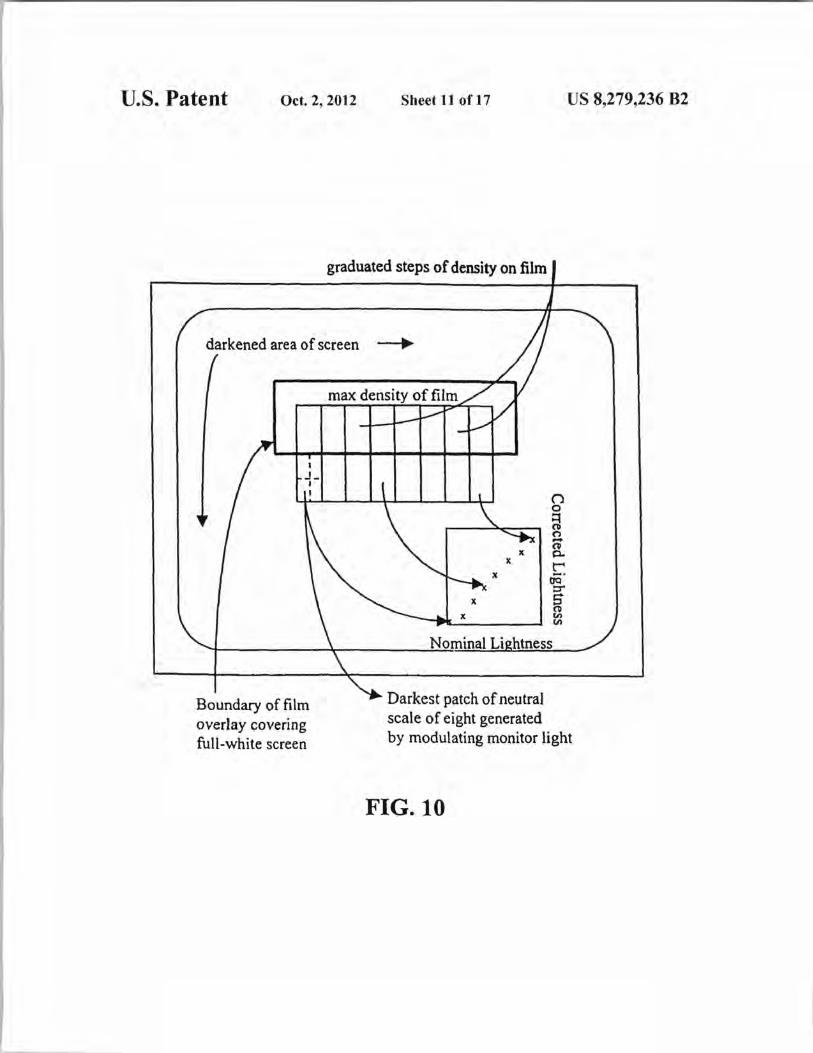
Nominal Lightness
darkened area of screen
max density of fi m
Boundary of film overlay covering full-white screen
Darkest patch of neutral scale of eight generated by modulating monitor light
U.S. Patent Oct. 2, 2012
Sheet 11 of 17 Us 8,279,236 B2
graduated steps of density on film
FIG. 10
(12
11 6
Display 41-- Device Signals (RGB) 4-
c
111 1GIF > Device Indep. Form :?? °
.4•e
4je Modified Colors 4--
4,
U.S. Patent Oct. 2, 2012 Sheet 12 of 17 US 8,279,236 B2
D110 Internet Server
GIF Data & (Via Internet Imaging Protocol) Virtual Proof
FIG. 11
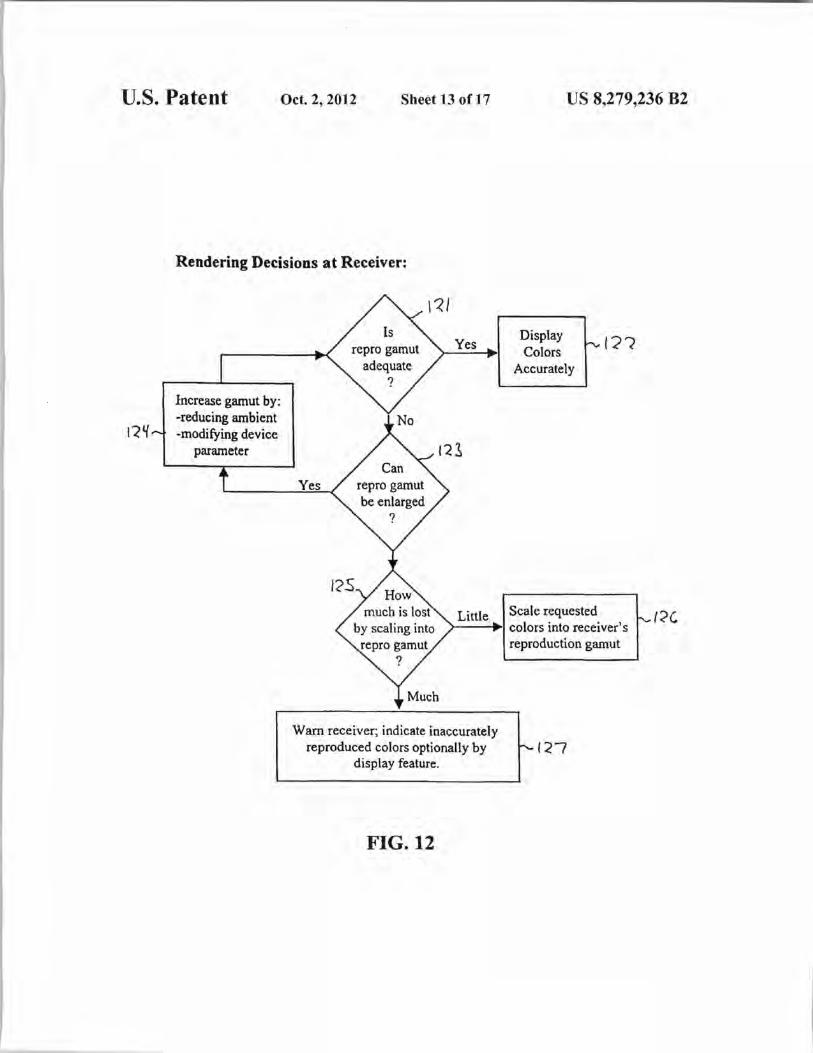
Warn receiver; indicate inaccurately reproduced colors optionally by
display feature. --- I 27
Little Scale requested colors into receiver's reproduction gamut
U.S. Patent Oct. 2, 2012 Sheet 13 of 17 US 8,279,236 B2
Rendering Decisions at Receiver:
FIG. 12
0.9
0.8 • •
• a • • •
wto 0.7
a 0.6
rt° 05
op 04
0.3
■ •
a
•
• a
• • ■ a 0.2
♦ a • ••• ••••• •
▪
a 580 680
• • • 0.1
• ■
oeireas. 380 480
Wavelength, nanometers
FIG. 13
U.S. Patent Oct. 2, 2012 Sheet 14 of 17 US 8,279,236 B2
U.S. Patent Oct. 2, 2012 Sheet 15 of 17 US 8,279,236 B2
*extral atput, RuarescertMeAer Larrp
1.00
0.90 •
>,0.80
E 070 • •
c 0.60
w 0.50
0.40
0.30 •
• •
0.23 •
0.10— '
GOO
390 4,80 590 680
lAtivelerrjh runreteis
FIG. 14
U.S. Patent Oct. 2, 2012 Sheet 16 of 17 US 8,279,236 B2
106 107
it
104
rt-- - 108
;00 Sensor to be
calibrated
to Computer
191
Monochromator
Stepper 103
109
10,2
Computer 4— 105
FIG. 15
Fail Pass
U.S. Patent Oct. 2, 2012 Sheet 17 of 17 US 8,279,236 B2
Position Sensor 100: Lower reflecting screen;
Darken display; Open shutter inmonochromator 16i
DO: I. Increment wavelength
j 62 2. Record reference and sensor responses
+ yes
Compute sensor's spectral sensitivity function; Close shutter; Raise reflectance screen
Verify Calibration: 1. Measure display primaries with sensor
and reference instrument 2. Calculate expected sensor responses by
convolving its spectral sensitivity with spectral emission of each primary
14E
FIG. 16
US 8,279,236 B2 1
METHODS AND APPARATUS FOR CALIBRATING A COLOR DISPLAY
This is a divisional of U.S. patent application Set No. 12/661,663, filed Mar. 22, 2010, now U.S. Pat. No. 8,009,175, 5
which is a divisional of U.S. patent application Ser. No. 11/442,882, filed May 30, 2006, now U.S. Pat. No. 7,710,433, which is a divisional of U.S. patent application Ser. No. 09/832,553, filed Apr. 11, 2001, now U.S. Pat. No. 7,102,648, which claims the benefit of U.S. Provisional Patent Applica- 10
tion No. 60/195,837, filed Apr. 11, 2000, which is herein incorporated by reference.
FIELD OF THE INVENTION 15
The present invention relates to methods for color display calibration which is especially useful in a network for assur-ing consistency of color reproduction of multiple color devices. The invention further relates to an apparatus for calibrating a sensor which may be used for measuring color of 20
a color display in calibration of the display. The invention is related to U.S. Pat. No. 6,043,909 and U.S. patent application Ser. No. 09/139,498, filed Aug. 25, 1998.
BACKGROUND OF THE INVENTION 25
The calibration of color displays, such as cathode ray tube (CRT) displays, has conventionally been provided by soft-ware in the personal computer coupled to the display for enabling a user to manually modify characteristics of color 30
displays, or select predefined color transformation curves. Often, such calibration is a part of typical Desktop Publishing Software. Calibration may be improved by the use of a sensor for measuring color from a display, which can then enable automatic calibration with or without user intervention. An 35
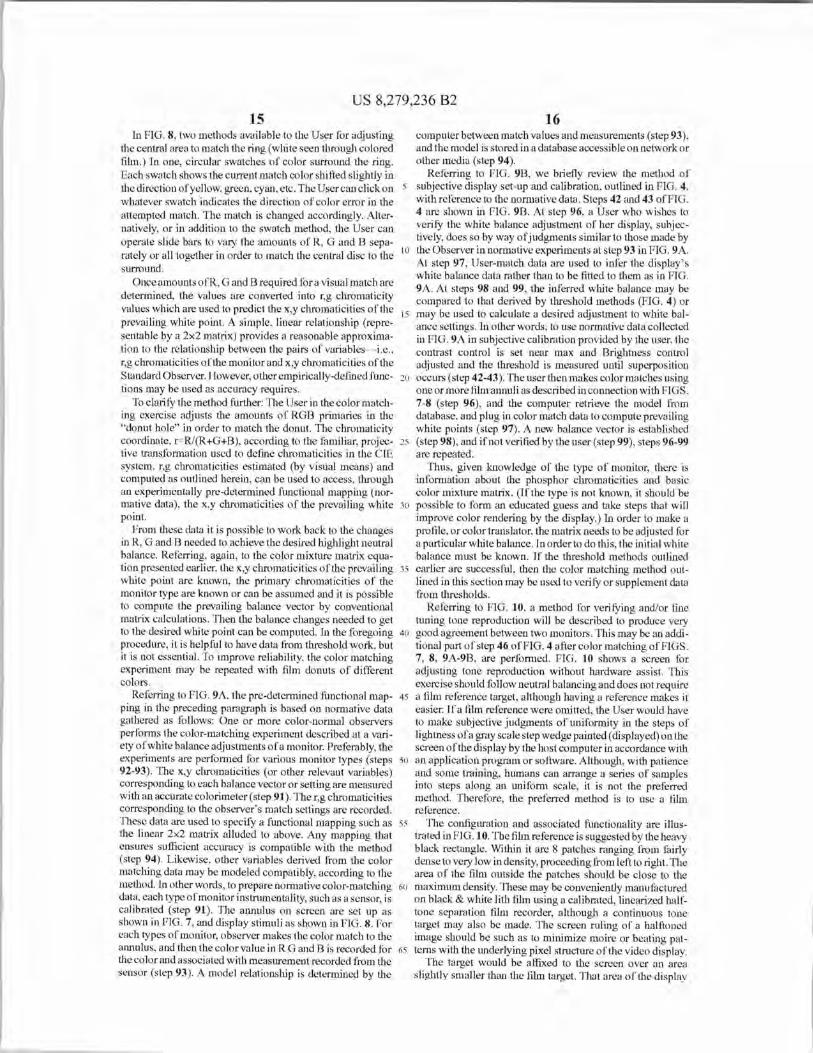
example of an automatic calibration system is shown in FIG. 1. FIG. 1 shows a video display 10 with cowel 11 and sensor 12 as generally described in U.S. Pat. No. 6,043,909 and U.S. patent application Ser. No. 09/139,498, integrated with a host computer's graphics display section 14 and a display control- 40 ler for controlling display 10 function (e.g., brightness, con-trast). Sensor 12 is called "Iumeter" in application Ser. No. 09/139,498. Display 10 is shown in cross section as viewed from the side. An upper, heavy black line may represent a mounting arm coupled to the display which supports a sensor 45
and may support a cowel. The cowel helps to shield the screen 13 of the display from ambient illumination and the sensor enables highly automatic (and even unattended) calibration. A circumferential cowel provides a "black trap" or surface which prevents any light from reflecting specularly off the 50
screen of the monitor and into the sensor housing—in other words, the lower flange of the cowel provides better shielding from stray light and ensures that the sensor sees only light which is diffusely reflected from the screen. The latter is important to automatic measurement. 55
Many high performance displays have embedded micro-processors 15 which provides a digital controller for control-ling the functions of the display. For example, it is possible to modify the gains in the R, C; and B channels by sending signals from the host computer to the processor in the display. to In some situations, the sensor 12 communicates directly with the display's processor, rather than, or in addition to, a host computer.
In displays which employ cathode ray tubes (CRTs) the gains in the R, G and 13 channels affect the voltages on the 65
electron guns and thence the amount of light emitted by phosphors in response to electron bombardment. By adjust-
2 ing analog gains and offsets, one can exert control over the tone reproduction and neutral balance of the display. When this method of control is available, it is preferred, but it requires knowledge of the control codes, which vary from one make of display monitor to another. The system of FIG. 1 may be adapted to interact with analogous controls in newer "digi-tal displays."
The operation of Graphics Display Section (software and hardware) of the host computer is illustrated in block 14. Device-independent color image data are fetched from RAM in the host computer and introduced to the graphics display section. The next two steps, namely 1) conversion in a 3x3 matrix (which handles the color mixture problem) and 2) processing of R, U and B data each through its own Look Up Table (LUT) can be combined in a color translator (which may be in International Color Consortium (ICC) or other standard format) for the video display. Channel-separate LUTs can be positioned both before and after the mixing matrix, as detailed in related U.S. Pat. No. 6,043,909 and U.S. patent application Ser. No. 09/139,498. The LUTs may pro-vide a means of influencing neutral balance and tone repro-duction. White-balance or neutral-balance is an adjustment to the display system that maps a neutral color represented by numbers in the computer, to a particular displayed color. In other words, it adjusts the balance between red, green and blue channels of the physical display in order to realize color coordinates of a particular, perceived white. Tone reproduc-tion curves (TRC's) define the orderly progression of relative lightness values for the points in an image. Differently shaped curves mean that neighboring image points will be more or less similar in lightness. Tone reproduction is closely related to a property of displays known as gamma.
Processed data are stored in video RAM and are scanned repeatedly for transfer to the display. The LUTs and the DACs (Digital to Analog Converters) often limit the quality of the system. LUTs are often 8-bits in and 8-bits out, providing resolution that may not be acceptable in some applications. Therefore. although modifications to neutral balance and Tone Reproduction Curves (TRCs) can be effected in the LUTs, it is preferable to make most of the changes in the gains and offsets of the display's RGB channels, if possible, and to reserve the I.UTs for "fine tuning."
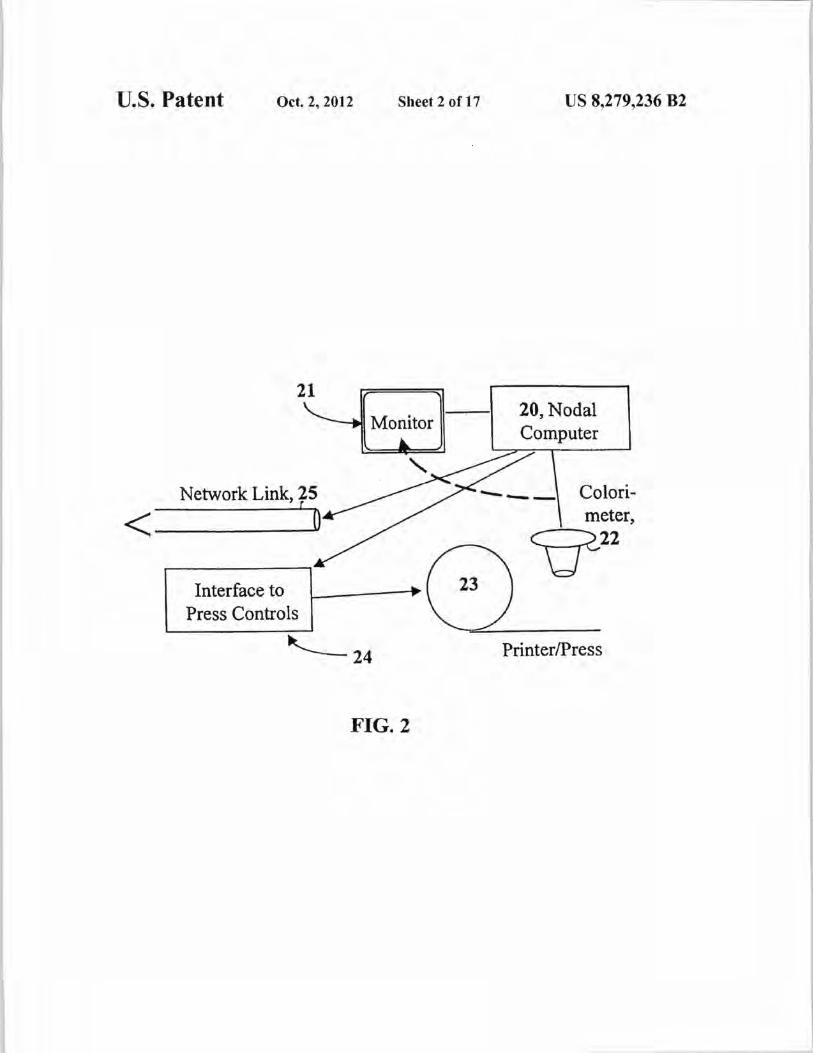
A generalized node of a Virtual Proofing network as described in U.S. Pat. No. 6,043,909 and U.S. patent appli-cation Ser. No. 09/139.498 is shown in FIG. 2. A nodal com-puter 20 receives calibration data (preferably in device inde-pendent coordinates which are preferably based on the Standard Observer) from (a) device(s) 22 which can measure a video display 21 and hard copy 23. (One device may be capable of all the necessary measurements or more special-ized devices may handle different tasks.) The computer 20 processes the data and 1) modifies shared constituents of the Virtual Proof to be communicated through the network link 25 to other nodes, and 2) exercises appropriate control over the rendering devices (21 and 23) at the node.
Visual calibration may be performed for a display. For example, in U.S. Pat. No. 5,638,117, a card or reflector is used in visual calibration of a display. The card is used as a cali-bration reference by the user with respect to images displayed on the display to enable visual calibration. However, such calibration is not provided for as part of a virtual proof to enable other color devices in a network, which may be remote from each other, to render the same color.
Further, other approaches to assuring calibration of dis-plays provides for locking display controls. For example, a "Color Sentry" feature for locking controls is described in U.S. Pat. No. 5,739,809. However, locking controls do not
US 8,279,236 B2 3
provide the capability for insuring that the controls are prop-erly set for linear operation of the display.
SUMMARY OF THE INVENTION
It is the principal object of the present invention to provide improved methods for calibrating a display to assure that color is consistent between calibrations of the same display and/or between color reproduced by different color displays or rendering devices, such as printers or proofers, which may be in a network.
It is another object of the present invention to provide improved methods by which two display monitors may be placed into a desirable state of tone reproduction by maxi-mizing contrast and setting brightness, such as to 50 or 60%, while insuring that superposition applies.
Briefly described, the method includes providing a color display (or monitor) coupled to a computer system, display-ing one or more screens on the display, and adjusting the brightness and contrast of the display to set one or more of white balance, gamma and tone, which accounts for the influ-ence of ambient illumination on color reproduction of display and provides superposition of color of the display.
The color display may have brightness and contrast con-trols and receive signals from a host computer in a plurality of color channels, such that the method may further include increasing the contrast of the display to about a 'maximum level for the display, increasing the brightness of the display to about a maximum level for the display, lowering the bright-ness of the display until superposition of colors is observed, measuring at least the neutral balance and tone reproduction of the display, and adjusting the balance and tone to match desired values.
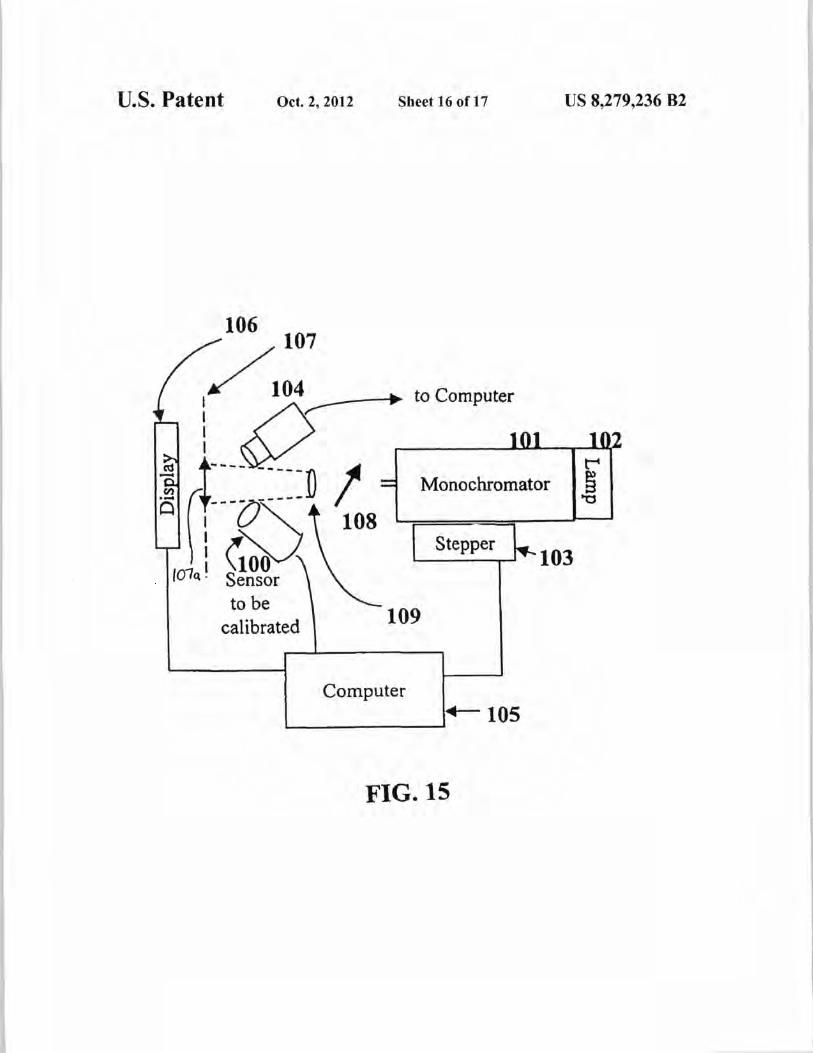
At least one sensor may be directed toward the display for providing color measurement of the display to the computer system. The present invention further provides a system for calibrating such a sensor having one or more channels which is useful for calibrating display surfaces. The system includes one of a self-luminous-display or a reflective surface, a mea-surement sensor and a reference sensor each directed toward one or more display surfaces, a computer system coupled to the display, and a monochromator for illuminating the reflec-tor with light of certain color in which the color of the light is controllable by the computer system and the measurement and reference sensors are capable of measuring the color of the reflector when illuminated by the monochromator to cali-brate the measurement sensor in accordance with the mea-surements taken by both the measurement sensor and the reference sensor.
A method of calibrating color devices associated in a net-work is further provided having the steps of adjusting one or more devices to match one or more reference images, mea-suring adjusted calibration parameters of the devices, and storing the calibration parameters for use in calibrating color devices in the network to reproduce substantially the same colors within the capabilities of said devices.
BRIEF DESCRIPTION OF THE DRAWINGS
The foregoing objects, features and advantages of the invention will become more apparent from a reading of the following description in connection with the accompanying drawings, in which:
FIG. 1 is a schematic diagram of a display system showing a color display of a host computer which has a conventional computer graphics driver to output images from memory to the color display having a sensor and control for color mea-
4 surements described in U.S. Pat. No. 6,043,909 and U.S. patent application Ser. No. 09/134,498;
FIG. 2 is a block diagram of a single node of a virtual proofing network described in U.S. Pat. No. 6,043,909 to
5 enable color on different color devices to appear the same, in which the monitor, nodal computer and colorimeters may represent the display, host computer and sensor of FIG. 1;
FIG. 3 is a llow diagram o fa method by which the sensor of FIG. 1 used for automatic maintenance of calibration is
10 "taught" a white balance adjustment determined subjectively by the user and by which the preferred white balance can be communicated to other nodes in the network;
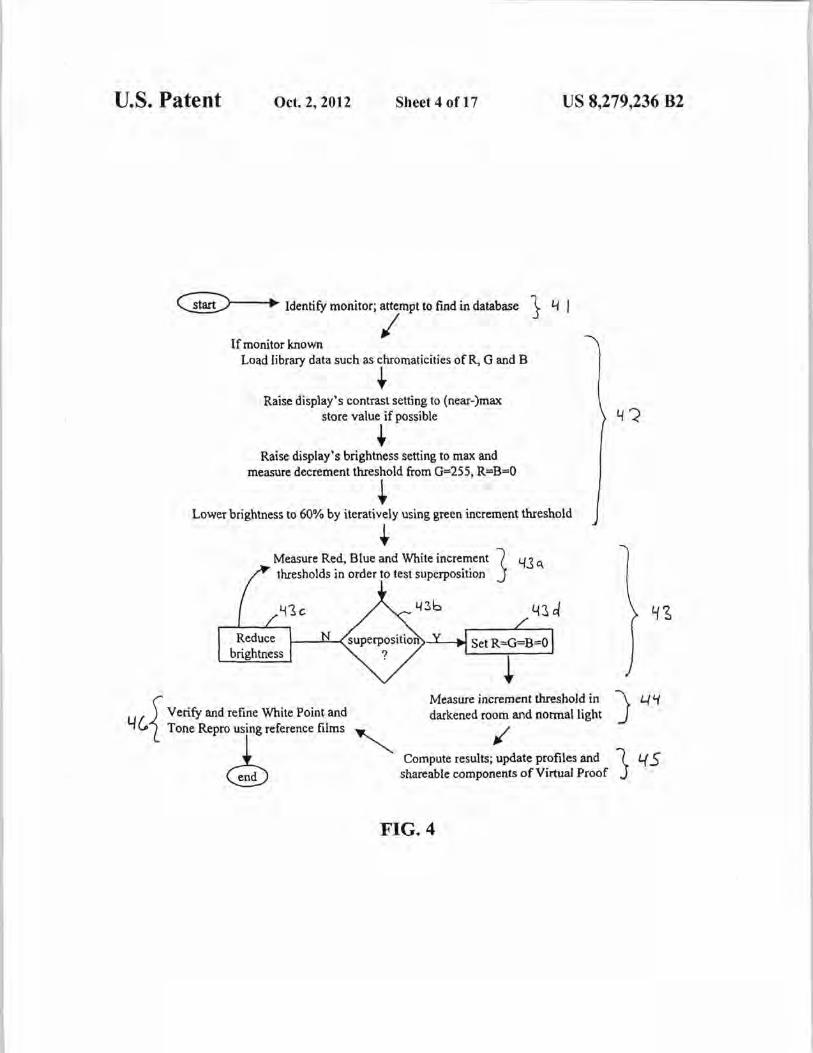
FIG. 4 is a flow diagram of a process for setting up (initial-izing or resetting brightness and contrast for linear color
15 mixture) and measuring/adjusting white balance and tone reproduction of the display of FIG. 1 in the absence of any automatic sensor, i.e., by subjective, visual judgments of the user based on threshold techniques;
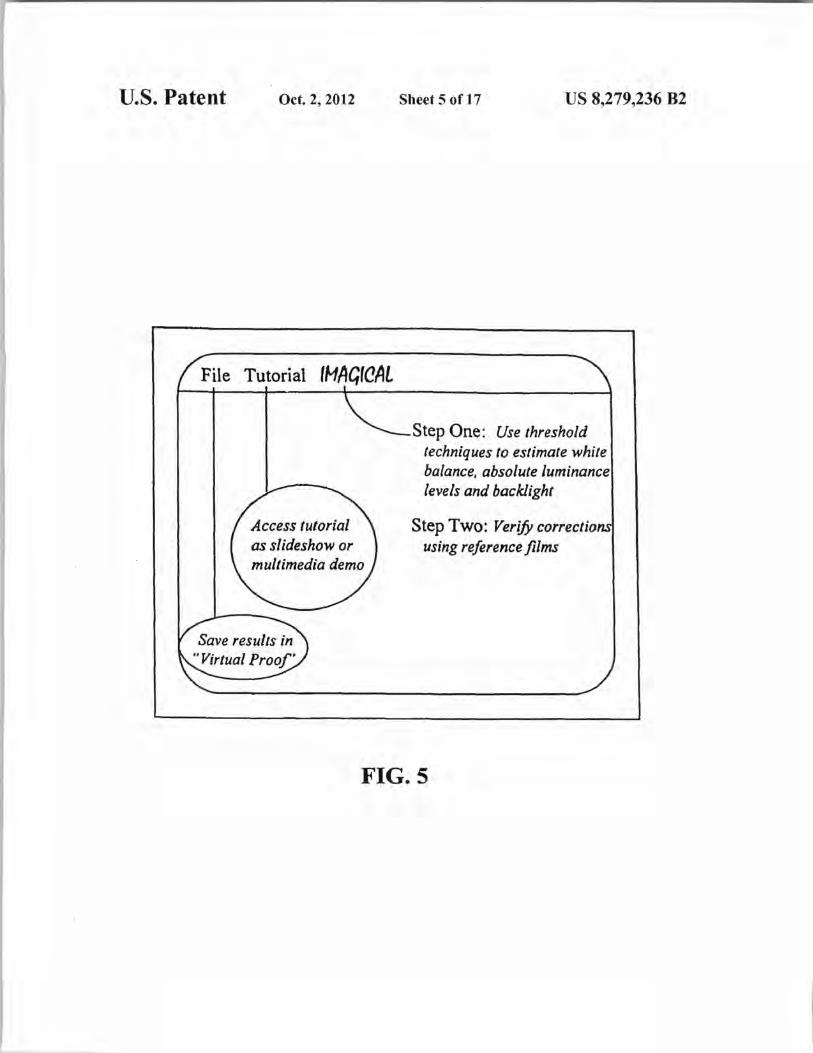
FIG. 5 is a top level menu screen of a user interface of a 20 software application operating on the computer of FIG. 1 to
enable collection of nonnative data for subjective calibration by a user which may be used to enable the user to calibrate the display of FIG. 1 visually for carrying out the method of FIG. 4;
25 FIG. 6 is a screen of the same user interface as FIG. 5 for enabling the user to interact with the software application operating to enable the method of FIG. 4 in which user per-ception of displayed color is provided in a stimulus configu-ration that might be used for increment/decrement threshold
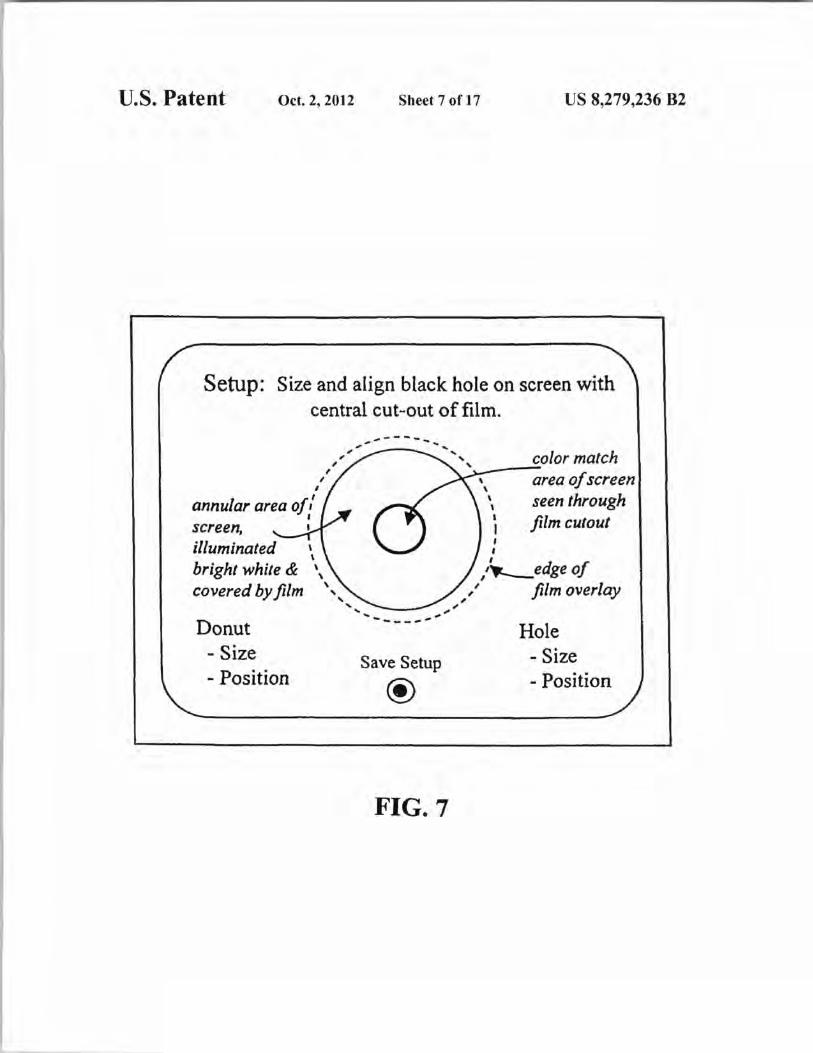
30 measurements; FIGS. 7 and 8 are two screens of the same user interface of
FIG. 5 for color matching to reference films placed onto screen to enable subjective, metomeric color matching experiments to verify white balance settings of the display;
35 FIGS. 9A and 9B are flow diagrams showing a method for obtaining normative reference data for subjective calibration, and using the reference data in calibrating a display, in which the user performs color matching using the screens of FIGS. 7 and 8 to provide white balance;
40 FIG. 10 is a screen of the same user interface of FIG. 5 for enabling subjectively derived adjustments from the user to tone reproduction;
FIG. 11 is a block diagram of communication by an Inter-net or WWW (World Wide Web) server with a client corn-
45 puter for virtual proofing on a display coupled to a computer; FIG. 12 is a flow diagram of a method for operating a color
monitor when the color gamut (range of color) is not adequate to display colors on the color monitor;
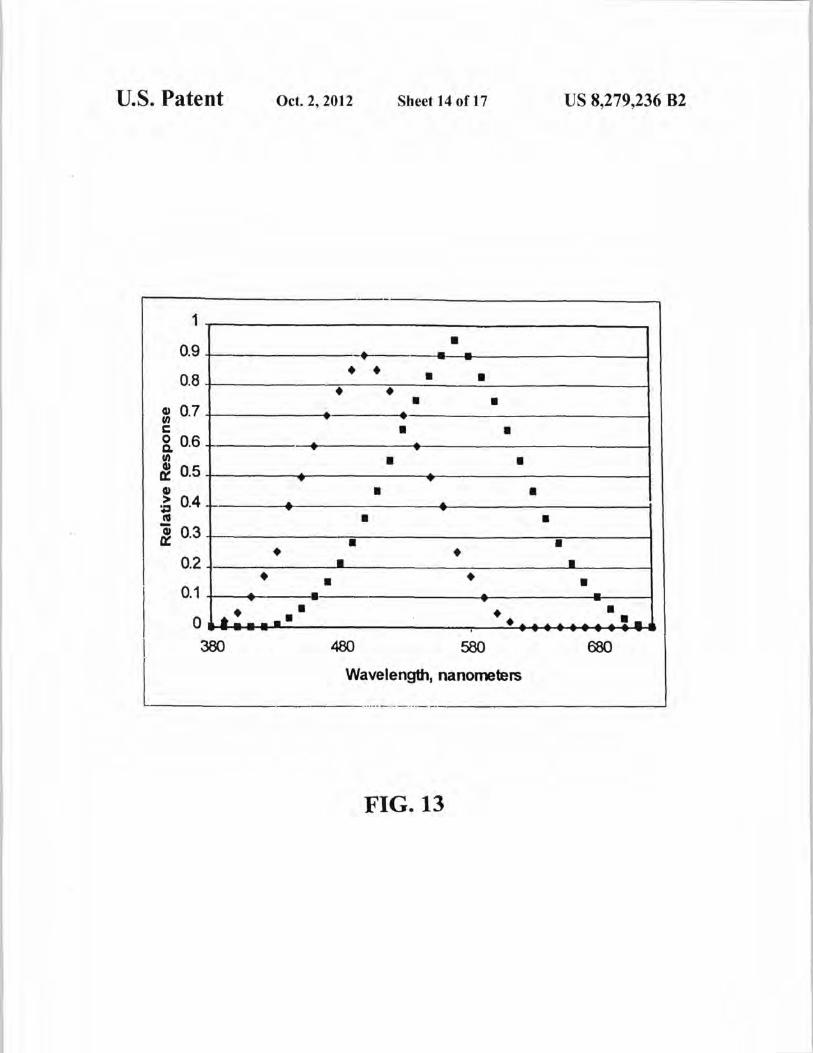
FIG. 13 is an example of a spectral response of a dual-50 channel sensor to measure or detect changes in the white point
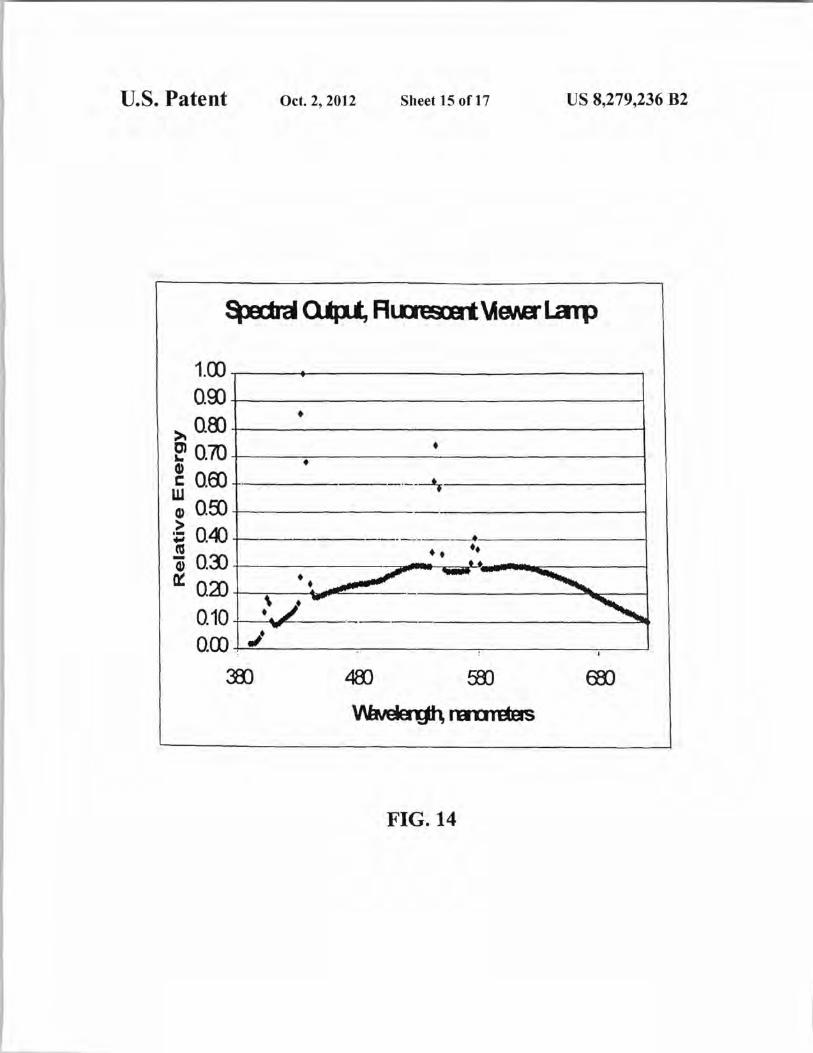
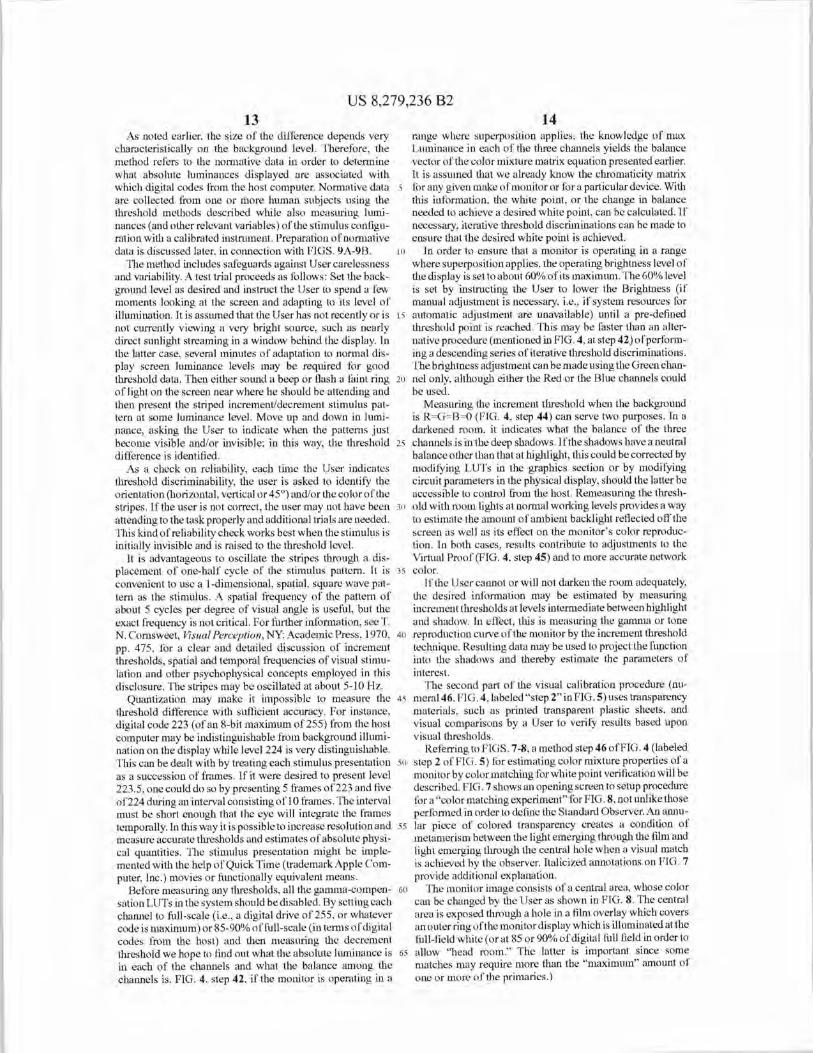
of a known illumination source; FIG. 14 is an example of a stimulus spectrum of a fluores-
cent lamp reflected off a white stock in which the lamp is commonly used for appraisal of reflection color images;
55 FIG. 15 is a block diagram of an apparatus for calibrating a dual channel sensor with a reference device and for verify-ing accuracy of calibration; and
FIG.16 is a flow diagram of the calibration operation using the system of FIG. 15.
60
DETAILED DESCRIPTION OF THE INVENTION
Terms used below are described in U.S. Pat. No. 6,043,909 and U.S. patent application Ser. No. 09/139,498. filed Aug.
65 25, 1998, which are herein incorporated by reference. The methods described herein for display calibration may be per-formed using the common display configuration of FIG. 1
US 8,279,236 B2
0
40
5 with a host computer. The color display or monitor may optionally have a digital controller interfaced with the host computer in addition to the driving signals outputted to the color display. However, any other computer controlled color display may be used with these methods with or without the sensor and cowel assembly coupled to the display, or the computer being networked as shown in FIG. 2.
The color sensor may be taught a subjectively preferred neutral balance with the aid of the user of the computer
coupled to the display. The incorporated patent and applica-
tion describe the color sensor as a spectral one or a colorim-
eter ("SOM" or means to simulate the Standard Observer) or a single channel sensor (lumeter") which sets and maintains
white balance and tone reproduction. Many technologies and particular products are available that can perform the afore-
mentioned functions. Although accurate calibration of sensors is essential to
reliable network color, practical applications may arise in
which an operator uses a calibrated sensor to measure a white balance established subjectively, so that the information can
be shared in Virtual Proofing as described in the incorporated
patent and application. For example, a "standard" reflection
viewing hood for color appraisal of hard copy may exist at a node in the network. The word "standard" was put in quotes
because the deviation of a viewer from its nominal value (e.g.
"D50" or Daylight 5000, a standard white value for viewing
printed copy) is often quite noticeable. Non-standard white
points constitute a motivation for subjective adjustment of white balance on a display or other medium. A viewing hood
was described in U.S. patent application Ser. No. 09/139,498. It may be desirable to set the white points of displays in the
network to the color of paper stock under the illumination provided by the viewing hood. The Users may lack the means to measure paper white instrumentally or may prefer to rely
on a subjective judgment of match. Accordingly, it is one
feature of the present invention to provide a User at a node
with a viewing hood that provides "standard illumination of reflection copy. User may use a software tool such as Photo-shop (Trademark of Adobe Systems) to match the display white to the paper white and invoke a routine in which a sensor measures the balance of primary channels set by the User. This white point information can then be communicated to other nodes through the Virtual Proof and used to modify profiles at the various nodal displays to conform. Use of the information to modify profiles is well known in the art, but will be clarified further in the section entitled "Color Calibra-tion of Displays." A flow diagram of the method is shown as FIG. 3.
First, the User has the option of verifying that the neutral balance and tone reproduction of the physical monitor are consistent with those assuined by the profile-generating soft-ware (step 31). User invokes measurement routine to verify that physical gray balance and tone reproduction conform to current profile. For a conventional. three-primary system, there is a relation between neutral balance and the balance of physical activation in the three channels, as described in the next section. The purpose of verifying white balance is to make sure that the display is at a known starting point if the state of calibration of the display has not been checked recently.
6 The User is instructed to make sure that the reference paper
(or other substrate) stock is positioned under the reference illuminator so that comparisons of its color with the display white can be made easily (step 32). User places proofing or
5 printing stock so that it can be compared, under desired illu- mination, with display screen. Then the software permits the User to modify the white balance at highlight in such a way as to match screen white with the reference (step 33). This may be provided by the user invoking (or executing) a teaching program on the computer coupled to the display which cre- ates on the screen of the display a large window filled with the color of the current system's white point, provides adjustment controls for each of the displays primary channels in a region
15 on the screen, and allows the user to adjust the controls to match screen and the stock visually. Then, the balance of primary channels chosen to match the reference is measured by the sensor 12 coupled to display 10 (step 34) and a white
20 point is computed for sharing by means of the Virtual Proof (defined in incorporated patent and application) so that color translation profiles for the color devices of the nodes of the network may be revised in accord with the new white (step 35). In this way, the sensor and system are "taught". and may
25 retain, the User's subjective preference. User has the option of verifying that the newly defined white point matches the reference stock and illumination, and reiterating steps 33-35, if needed (step 36).
:30 The foregoing discussion has been in terms of matching a video display to an illuminated white paper. However, colors other than white and devices and media other than video displays and paper, may also be matched in the same manner. For example, information regarding how to match a paper
35 substrate color to a textile's off white color could be prepared for incorporation in a Virtual Proof with reference to this and the other applications cited above.
In the ordinary operation described in incorporated patent and application, the sensor measures the balance of activity in the primary channels, computes the white point, compares the white point to a standard value or to that assumed by the image processing computers of the network and then deter-mines the re-balancing necessary to bring the physical dis-
45 play into conformance. The re-balancing may be imple- mented by changes to offsets and gains in the analog section of the display controls and/or modifications to LUTs in the graphics control circuitry of the host computer.
For some users and applications, a variation of the forego- 5 ing scheme, in which complex images are matched rather
than homogeneous fields, may be desirable. In this case, there are two ways of utilizing the match data. In one, the sensor measures white point and tone reproduction curves of the
55 monitor after matching and records them, or correction func-tions based upon them, in the Virtual Proof In the other, the sensor is used to ensure that the system is in calibration (white point and tone reproduction at least—possibly chromatici-ties, too.) Then, the User employs color editing tools (gray
60 balance, tonal correction, selective color, etc.) and the correc-tions are recorded in the color-to-color' table of the Virtual Proof and shared. Color-to-color' tables are disclosed in the above incorporated patent.
65 One should consider the following factors for successful monitor color calibration of a display, which may be useful for Internet or other networked applications:
(Yr Yg Yb 1 • bl = (
( xw
Y. I
Zr Zg u, /22 Z.
Xg bo
chromatithiet in !mime White
co4or-nn2ndre maim onion P.um
5
US 8,279,236 B2 7 8
1) knowledge of a linear color-mixture matrix for a set of three, additive light primaries such as are found in today's video display technologies (four or more primaries are considered in other, related applications,)
2) set up of the display with regard to properties such as "brightness" and "contrast;' so that it truly operates as a linear. additive device,
3) ability to set neutral balance of the physical display to 10 At the left is a matrix of cbromaticities, x's, y's and z's which summarize the color mixture properties of the Red, Green and conform closely to information used to make color trans- Blue (indicated by subscripts r, g, b) channels of the display in lotion profiles relative terms. Chromaticities depend on the spectral emis-
4) ability to set tone reproduction (gamma) of the physical sion properties of the primary channels.
display to conform to what is assumed by the application To setup the display for linear operation, display controls 15 may be used. Brightness and contrast are two controls avail-
software, encoded in the image data and or represented in able to Users on almost all displays. The icon for the bright- components of the color translation profiles and ness control is often a shining sun while that for Contrast is
5) means of measuring and computing the effects of factors often a split circle. On the Type II monitor, the controls are available as two knobs that provide continuous adjustment.
such as ambient illumination or maximum attainable high- On the older Type I monitor, the controls are typically avail- light luminance on device gamuts and of communicating able as positive and negative, digital push-buttons—i.e., digi-
such infonnation among different nodes in a network and tal means that continuous control is not available. On the
of modifying device profiles in order to compensate and newer Type I monitor, software exists to make the controls ensure the best possible match at different sites. visible and operable on the display through a graphical user
interface featuring slide bar adjustments.
Illustrative data from real monitors are shown below in Table 25 The brightness and contrast controls influence the offsets
One, which may provide a basis for calibration methods and gains in the analog section of a CRT display and deter-
described herein. First, the emission of light by excited phos- mine whether the display is operated within its linear range.
phor molecules under electron bombardment is a stereotypi- The two controls adjust how dark the screen is when the host
cal process. The spectral emission functions of Red. Green computer sends zero signals to R, G and B channels as well as and Blue channels in two monitors of the same make are 3o the maximum brightness realized when R, G and B are full-
believed to be nearly identical. For example, one monitor was scale. The host computer, such as a personal computer, can be coupled to each monitor to output images on the monitor. used extensively over 4.5 years and the other monitor has had
White balance refers to the vector-inner-product of the very limited use over the last 1.5 years. I will refer to these two color mixture matrix (see preceding equation) and the bal- monitors as Type I. one "older" and the other "newer" in once vector which yields the white point. Many white points subsequent data presentation. For either monitor of Type I, 35 are available, depending upon the balance among the three
the spectral emission characteristics do not change apprevia- color channels R, G, B. In the software system, one of those
bly in repeated measurements over extended periods of time. white points can be picked which associates with a particular
Data from a third monitor of different make ("Type II" herein) vector of balance factors (b's.) An important aspect of good are also considered. calibration is to make sure that the channels of the physical Although the examples considered here are based on cath- 41 monitor are balanced consistently with what the software
ode ray tube technology, the methods and instrumentation expects. Mentioned earlier, in the previous section, the offset
apply to any video display technology. In the event that the and gain controls of the display and/or graphic LUTs can be
chromaticities of the color channels of a liquid crystal display, modified to that end.
for example, are not constant with time, then instrumental Even when the color mixture properties of a display are 45 invariant, the efficiency of the channels may change with means similar to those described in incorporated patent and
time. Cathode Ray Tubes exhibit "phosphor fatigue" in which
application should be used to re-measure the chromaticities at ti the ability to produce light in response to electron bombard-
the required intervals, unless, of course, the change is pre- the declines over time. Fatigue may occur differently in the dictable to within an acceptable tolerance. In the latter case, a different channels. U.S. Pat. No. 5,821,917 (and U.S. Pat.
suitable correction function, known to the controlling system' re
so Nos. 5.512,961, 5,561,459 and 5,978,745) discloses internal
can be applied. Also, a simple instrument is disclosed in a monitoring of beam current and adjustment of same over time
subsequent section of this application which applies to situ- to compensate for the loss of efficiency.
ations in which spectral changes (that cause the apparent For gamma and tone reproduction on a color display, typi-
chromaticity shifts) are stereotyped in nature, but may not cally gamma is treated as a constant by imaging applications. occur at predictable times. However, it seldom is constant, usually tending to increase in
Key results of Table One, as they apply to factors 1 through 55
value as the voltage to the electron guns decreases, i.e., at there are three rows of
4 of the calibration problem, will be abstracted following lower light levels. For this reason, the
definition of the following terms: Gamma is the slope of the gamma values for each monitor in Table One. The first is called "slope 255 to 223." What this means is that the log of
function relating log light intensity to log applied voltage. light output for a digital signal from the host computer of 255 Dynamic Range refers to the ratio of maximum to minimum 60 (the 8-bit maximum) minus the log of light output for a drive
luminances emitted by the display in a given operating con- of 223 is divided by log 255 minus log 223 and so on. The
dition. Max(imum) Luminance is the brightest displayable column headings represent different settings of the brightness tonal value, or highlight. control. For each monitor, contrast was set to the maximum or
very near the maximum. Then the brightness was adjusted to
Color Mixture should be considered in which the term 20%, 40%, etc. of maximum. Generally, the numbers corre- "chromaticity" used below refers to a color property based on 65 spond to the luminance of the green channel measured at that
the Standard Observer. The color mixture problem can be brightness setting as a percent of the maximum green lumi- summarized by the following equation: nonce at the full scale setting.
US 8,279,236 B2
9 TABLE ONE
20% Bri 40% Bri 50% Bri 60% Bri 80% Bri 100% Bri
Newer '1Ype
slope 255 to 223 2.78 2.50 2.25 2.04 1.85 slope 255 to 159 3.05 2.65 2.33 2.07 1.83 slope 255 to 31 2.69 PR 700 Lum, 255 Green 21.98 28.17 35.66 44.43 54.34 PR 700 Lum, 255 White 35.92 45.33 50.34 56.49 69.57 81.92 Dynamic Range >6K:1 >7.5K:1 10K:1 -500:1 -60:1
Type Ti
slope 255 to 223 3.88 2.77 2.45 2.27 1.95 1.70 slope 255 to 159 4.66 2.97 2.53 2.31 1.92 1.64 slope 255 to 31 4.43 3.13 2.35 PR 700 Lum, 255 Green 14.12 27.89 36.71 42.92 57.71 72.57 PR 700 Lunt, 255 White 19.88 38.29 48.23 50.04 52.19 53.33 Dynamic Range >6K:1 >11K:1 7.5K:1 -550:1 -35:1 -13:1
Older Type I
slope 255 to 223
unavail., 2.48 2.26
2.01
1.81 slope 255 to 159
beyond
2.64 2.40
1.92
1.71 slope 255 to 31
adjust. 2.54 PR 7(X) Lum, 255 Green
limit
22.35 27.20
37.84
45.25 PR 700 Lam. 255 White
42.39
67.78 Dynamic Range
Suitable data not available
10
25
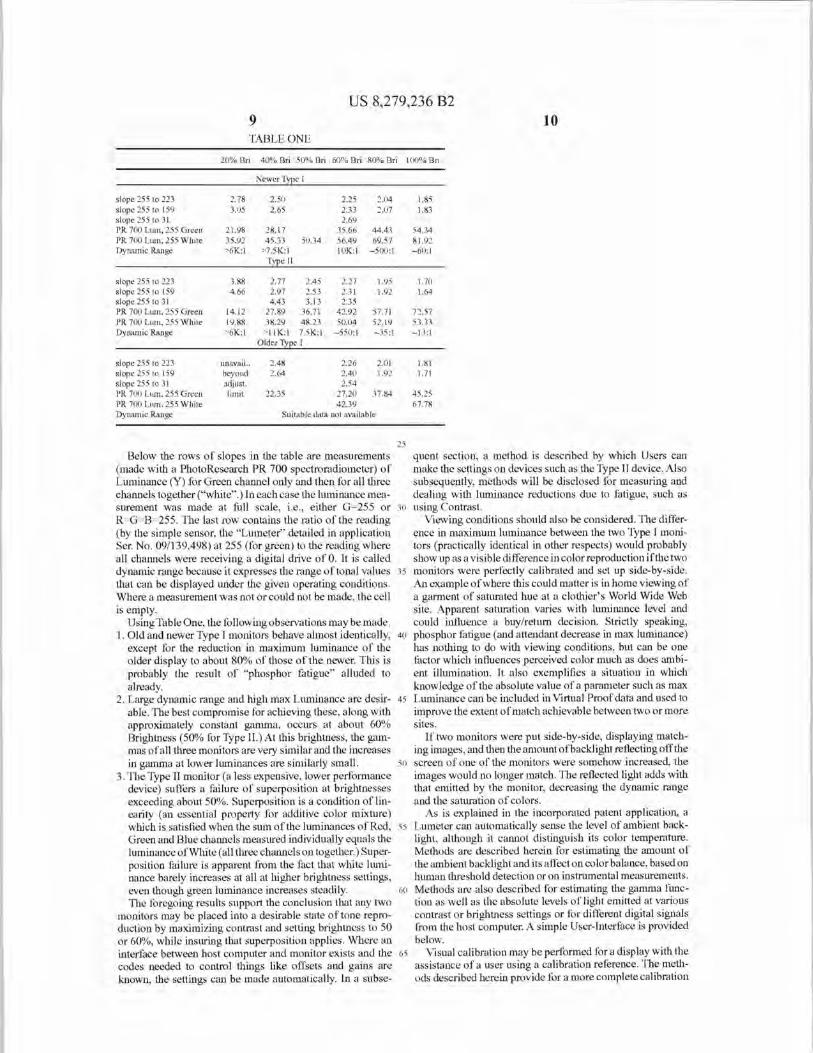
Below the rows of slopes in the table are measurements (made with a PhotoResearch PR 700 spectroradiometer) of Luminance (Y) for Green channel only and then for all three channels together ("white".) In each case the huninance mea-surement was made at full scale, i.e., either G-255 or 30
R-G-=B=255. The last row contains the ratio of the reading (by the simple sensor, the "Lumeter" detailed in application Ser. No. 09/139,498) at 255 (for green) to the reading where all channels were receiving a digital drive of 0. It is called dynamic range because it expresses the range of tonal values 35
that can be displayed under the given operating conditions. Where a measurement was not or could not be made, the cell is empty.
Using Table One, the following observations may be made. 1. Old and newer Type I monitors behave almost identically, 40
except for the reduction in maximum luminance of the older display to about 80% of those of the newer. This is probably the result of "phosphor fatigue" alluded to already.
2. Large dynamic range and high max Luminance are desir- 45
able. The best compromise for achieving these, along with approximately constant gamma, occurs at about 60% Brightness (50% for Type II.) At this brightness, the gam-mas of all three monitors are very similar and the increases in gamma at lower luminances are similarly small. 50
3. The Type II monitor (a less expensive, lower performance device) suffers a failure of superposition at brightnesses exceeding about 50%. Superposition is a condition of lin-earity (an essential property for additive color mixture) which is satisfied when the sum of the luminances of Red, 55
Green and Blue channels measured individually equals the luminance of White (all three channels on together.) Super-position failure is apparent from the fact that white lumi-nance barely increases at all at higher brightness settings, even though green luminance increases steadily. 60
The foregoing results support the conclusion that any two monitors may be placed into a desirable state of tone repro-duction by maximizing contrast and setting brightness to 50 or 60%, while insuring that superposition applies. Where an interface between host computer and monitor exists and the 65
codes needed to control things like offsets and gains are known, the settings can be made automatically. In a subse-
quent section, a method is described by which Users can make the settings on devices such as the Type II device. Also subsequently, methods will be disclosed for measuring and dealing with luminance reductions due to fatigue, such as using Contrast.
Viewing conditions should also be considered. The differ-ence in maximum luminance between the two Type I moni-tors (practically identical in other respects) would probably show up as a visible difference in color reproduction i f the two monitors were perfectly calibrated and set up side-by-side. An example of where this could matter is in home viewing of a garment of saturated hue at a clothier's World Wide Web site. Apparent saturation varies with luminance level and could influence a buy/return decision. Strictly speaking, phosphor fatigue (and attendant decrease in max luminance) has nothing to do with viewing conditions, but can be one factor which influences perceived color much as does ambi-ent illumination. It also exemplifies a situation in which knowledge of the absolute value of a parameter such as max Luminance can be included in Virtual Proof data and used to improve the extent of match achievable between two or more sites.
If two monitors were put side-by-side, displaying match-ing images, and then the amount of backlight reflecting off the screen of one of the monitors were somehow increased, the images would no longer match. The reflected light adds with that emitted by the monitor, decreasing the dynamic range and the saturation of colors.
As is explained in the incorporated patent application, a Lumeter can automatically sense the level of ambient back-light, although it cannot distinguish its color temperature. Methods are described herein for estimating the amount of the ambient backlight and its affect on color balance, based on human threshold detection or on instrumental measurements. Methods are also described for estimating the gamma func-tion as well as the absolute levels of light emitted at various contrast or brightness settings or for different digital signals from the host computer. A simple User-Interface is provided below.
Visual calibration may be performed for a display with the assistance of a user using a calibration reference. The meth-ods described herein provide for a more complete calibration
US 8,279,236 B2 11
than described in U.S. Pat. No. 5,638,117, and such calibra-tion is useful in providing data for networking using the Virtual Proof as well as stand-alone operation of the display. Visual calibration is described in connection with FIGS. 4-10.
A step-wise approach to visual calibration is presented which permits the estimation of parameters, which can be used as constituents of the Virtu al Proof without any hardware assist. One of these parameters is the absolute luminance of highlight white on a video display. Differences in the absolute luminances prevailing on two video displays can give rise to differences in the appearance of imagery on two monitors. The differences could detract from Virtual Proofing.
The use of "visual" calibration techniques in the estimation ofVirtual Proof parameters is covered in U.S. Pat. No. 6,043, 909, which recommends the use of a "standard observer meter" or SOM. As is explained in the earlier application, a SOM may be an electronic instrument designed to simulate the color matching behavior of the Standard Observer. The Standard Observer represents the average human with normal color vision. In this application, a particular method is detailed for insuring that a human performing "visual" cali-bration provides reliable, objective data. Note that visual calibration, by definition, is not automatic. While it may be more laborious, compared to instrumental methods, and pos-sibly more prone to error, the methods are less expensive and available to a broader base of Users.
Referring to FIG. 4, the method for enabling visual cali-bration of a color display is shown using thresholds. This method is carried out with the assistance of the user interact-ing with a software application operating on the computer or via the Internet on the computer. First, identifying informa-tion about the display-to-be-calibrated is gathered such as locating information about the monitor in a database (step 41). At step 42, contrast and brightness (such as controls of the display) are adjusted so as to insure that the display is operated in the range in which linear color mixture applies. Increment or decrement threshold techniques are employed to adjust brightness in the absence of automatic sensing device. For example, if the monitor is known, library data is loaded from the database, such as chromaticities of R, G and B. The display's contrast setting is raised to nearly maximum value. Then, raise display's brightness setting to max and measure decrement threshold from G=255, R=B=O, and lower brightness to 60% by iteratively using green increment threshold. At step 43, data from red, blue and white increment threshold tests are combined with the green data to test whether the display is in the linear range (for color mixture---see earlier discussion.) If not, brightness is lowered in modest steps until linearity is realized. In other words, red, blue and white increment thresholds are measured in order to test superposition (step 43a). If at that brightness superposition is not present (step 43h), brightness is reduced (step 43c), until superposition is achieved and R, G, and B are all then reset to zero (step 43d). At step 44, threshold measurements are taken by measuring increment threshold in darkened room and normal light. The threshold measurements provide data use-able in step 45 to adjust neutral balance at low display light levels and to compensate for, or alert the User to, the effects of ambient illumination conditions. At step 45, the threshold measurements are completed, and a profile for the color cali-bration is updated, and in the case of a Virtual Proof, the shareable components of Virtual Proof are updated. The user may optionally verify and refine White Point and Tone Repro-duction using reference films (step 46). The steps of FIG. 4 are described in more detail below in which visual calibration is facilitated by the use of screens (FIGS. 5-8,10) provided on the display by the software (application program) operating
12 on the host computer coupled to the display, or provided to the computer via an Internet connection from a web server. For example, the software could be created by a Java applet, downloaded over the Internet to run in a browser, or it could
5 be a stand-alone application. The host computer would have Internet connectability through a modem, or other network interface means, such as a leased line, and the like. Further, FIGS. 9A-9B further describe the process of the software using the screens of FIGS. 7 and 8.
10 The procedure of FIG. 4 is applicable with an automatic sensor, such as shown in FIG. 1. The sensor, rather than the user observing the screen to detect when superposition is present, is used to detect display output at max brightness (and an established, nearly maximal value of contrast) and
15 then reduce the brightness iteratively until readings from the sensor indicate that the system is observing superposition. For example, a sensor may be used when a new display is initially placed in service or when automatic sensing suggests that brightness and contrast controls have been tampered
20 with. FIG. 5 illustrates a opening (top menu) screen provided to
the user. Step One consists of an army of threshold discrimi-nation tasks designed to measure critical parameters without reliance on instruments or reference transparencies as gener-
25 ally described at steps 41-44 in FIG. 4. Step Two presents step 46 of FIG. 4 and involves a color-matching exercise which employs one or more colored transparency films in an effort to verify and refine the white point setting from step one, and a gradation-like function employing a reference film step
30 wedge for the purpose of verifying and refining tone repro-duction curves.
Weber's Law of human visual perception holds that AI/1 is a constant. In other words, when a human just barely detects a light signal against a light background, the amount of incre-
35 mental light needed is proportional to the amount of light in the background. Of course, it is also possible to measure a decrement threshold—the amount of decrease in light level which is just detectable. Call this quantity Alt in the case of the Red channel of the display. A decrement is the only
40 direction we can go when R or G or B is set to 255 digital, or whatever the maximum is. In this description, AR will have the same meaning as APR, for increment threshold. An incre-ment is the only option when R-G=B-i) and we are trying to measure the amount of intrinsic emission from the tube in the
45 absence of digital input (in a darkened room) or to measure the effects of ambient illumination reflecting off the screen and adding to the light emitted by the tube.
The method described herein employs normative data as the basis for translating a User's threshold discrimination into
so an absolute physical luminance. Normal color vision is essen-tial. In general, a simple screening for color blindness may be desirable. Preferably, it is administered using the video dis-play.
FIG. 6 illustrates another display screen provided to the 55 user (having selected step 1 of the FIG. 5 screen) in which the
stimulus configuration is shown for increment or decrement thresholds. In the latter case, the stripes would appear just noticeably darker than the background at threshold, rather than just detestably lighter. In either case, the idea is to adjust
60 the brightness of the stripes until they appear just noticeably brighter or dimmer than the background. When the User clicks the mouse, coupled to the computer, upon one or more radio buttons on the screen, the user is indicating to the computer that "I just see the change", and the computer then
65 records the difference in intensity of stripes from background. This quantity is the increment or decrement threshold differ-ence.
US 8,279,236 B2 13
As noted earlier, the size of the difference depends very characteristically on the background level. Therefore, the method refers to the normative data in order to determine what absolute luminances displayed are associated with which digital codes from the host computer. Normative data are collected from one or chore human subjects using the threshold methods described while also measuring lumi-nances (and other relevant variables) of the stimulus configu-ration with a calibrated instrument. Preparation of normative data is discussed later, in connection with FIGS. 9A-9B.
The method includes safeguards against User carelessness and variability. A test trial proceeds as follows: Set the back-ground level as desired and instruct the User to spend a few moments looking at the screen and adapting to its level of illumination. It is assumed that the User has not recently or is not currently viewing a very bright source, such as nearly direct sunlight streaming in a window behind the display. In the latter case, several minutes of adaptation to normal dis-play screen luminance levels may be required for good threshold data. Then either sound a beep or flash a faint ring of light on the screen near where he should be attending and then present the striped increment/decrement stimulus pat-tern at some luminance level. Move up and down in lumi-nance, asking the User to indicate when the patterns just become visible and/or invisible., in this way, the threshold difference is identified.
As a check on reliability, each time the User indicates threshold discriminability, the user is asked to identify the orientation (horizontal, vertical or 45°) and/or the color of the stripes. If the user is not correct, the user may not have been attending to the task properly and additional trials are needed. This kind of reliability check works best when the stimulus is initially invisible and is raised to the threshold level.
It is advantageous to oscillate the stripes through a dis-placement of one-half cycle of the stimulus pattern. It is convenient to use a 1-dimensional, spatial, square wave pat-tern as the stimulus. A spatial frequency of the pattern of about 5 cycles per degree of visual angle is useful, but the exact frequency is not critical. For further information, see T. N. Cornsweet, Visual Perception, NY: Academic Press, 1970, pp. 475, for a clear and detailed discussion of increment thresholds, spatial and temporal frequencies of visual stimu-lation and other psychophysical concepts employed in this disclosure. The stripes may be oscillated at about 5-10 Hz.
Quantization may make it impossible to measure the threshold difference with sufficient accuracy. For instance, digital code 223 (of an 8-bit maximum of 255) from the host computer may be indistinguishable from background illumi-nation on the display while level 224 is very distinguishable. This can be dealt with by treating each stimulus presentation as a succession of frames. If it were desired to present level 223.5, one could do so by presenting 5 frames of 223 and five of 224 during an interval consisting of 10 frames. The interval must be short enough that the eye will integrate the frames temporally. In this way it is possible to increase resolution and measure accurate thresholds and estimates of absolute physi-cal quantities. The stimulus presentation might be imple-mented with the help of Quick Time (trademark Apple Com-puter, Inc.) movies or functionally equivalent means.
Before measuring any thresholds, all the gamma-compen-sation LUTs in the system should be disabled. By setting each channel to full-scale (i.e., a digital drive of 255, or whatever code is maximum) or 85-90% of full-scale (in terms of digital codes from the host) and then measuring the decrement threshold we hope to find out what the absolute luminance is in each of the channels and what the balance among the channels is. FIG. 4, step 42, if the monitor is operating in a
14 range where superposition applies, the knowledge of max Luminance in each of the three channels yields the balance vector of the color mixture matrix equation presented earlier. It is assumed that we already know the chromaticity matrix
5 for any given make of monitor or for a particular device. With this information, the white point, or the change in balance needed to achieve a desired white point, can be calculated. If necessary, iterative threshold discriminations can be made to ensure that the desired white point is achieved.
10 In order to ensure that a monitor is operating in a range where superposition applies, the operating brightness level of the display is set to about 60% of its maximum. The 60% level is set by instructing the User to lower the Brightness (if manual adjustment is necessary, i.e., if system resources for
15 automatic adjustment are unavailable) until a pre-defined threshold point is reached. This may be faster than an alter-native procedure (mentioned in FIG. 4, at step 42) ofperfonn-ing a descending series of iterative threshold discriminations. The brightness adjustment can be made using the Green chan-
20 nel only, although either the Red or the Blue channels could be used.
Measuring the increment threshold when the background is (FIG. 4, step 44) can serve two purposes. In a darkened mom, it indicates what the balance of the three
25 channels is in the deep shadows. If the shadows have a neutral balance other than that at highlight, this could be corrected by modifying LUTs in the graphics section or by modifying circuit parameters in the physical display, should the latter be accessible to control from the host. Remeasuring the thresh-
30 old with room lights at normal working levels provides a way to estimate the amount of ambient backlight reflected off the screen as well as its effect on the monitor's color reproduc-tion. In both cases, results contribute to adjustments to the Virtual Proof (FIG. 4, step 45) and to more accurate network
35 color. If the User cannot or will not darken the room adequately,
the desired information may be estimated by measuring increment thresholds at levels intemiediate between highlight and shadow. In effect, this is measuring the gamma or tone
40 reproduction curve of the monitor by the increment threshold technique. Resulting data may be used to project the function into the shadows and thereby estimate the parameters of interest.
The second part of the visual calibration procedure (nu- 45 meral 46. FIG. 4, labeled "step 2" in FIG. 5) uses transparency
materials, such as printed transparent plastic sheets, and visual comparisons by a User to verify results based upon visual thresholds.
Referring to FIGS. 7-8, a method step 46 of FIG. 4 (labeled 50 step 2 of FIG. 5) for estimating color mixture properties of a
monitor by color matching for white point verification will be described. FIG. 7 shows an opening screen to setup procedure for a "color matching experiment" for FIG. 8, not unlike those performed in order to define the Standard Observer. An amm-
55 lar piece of colored transparency creates a condition of metamerism between the light emerging through the film and light emerging through the central hole when a visual match is achieved by the observer. Italicized annotations on FIG. 7 provide additional explanation.
60 The monitor image consists of a central area, whose color can be changed by the User as shown in FIG. S. The central area is exposed through a hole in a film overlay which covers an outer ring of the monitor display which is illuminated at the full-field white (or at 85 or 90% of digital full field in order to
65 allow "head mom." The latter is important since some matches may require more than the "maximum" amount of one or more of the primaries.)
US 8,279,236 B2 15
In FIG. 8, two methods available to the User for adjusting the central area to match the ring (white seen through colored film.) In one, circular swatches of color surround the ring. Each swatch shows the current match color shifted slightly in the direction of yellow, green, cyan, etc. The User can click on whatever swatch indicates the direction of color error in the attempted match. The match is changed accordingly. Alter-natively, or in addition to the swatch method, the User can operate slide bars to vary the amounts of R, G and B sepa-rately or all together in order to match the central disc to the surround.
Once amounts of R, G and B required fora visual match are determined, the values are converted into r,g chromaticity values which are used to predict the x,y chromaticities of the prevailing white point. A simple, linear relationship (repre-sentable by a 2x2 matrix) provides a reasonable approxima-tion to the relationship between the pairs of variables—i.e., r,g chromaticities of the monitor and x,y chromaticities of the Standard Observer. However, other empirically-defined func-tions may be used as accuracy requires.
To clarify the method further: The User in the color match-ing exercise adjusts the amounts of RGB primaries in the "donut hole" in order to match the donut. The chromaticity coordinate, r-R/(R+G+B), according to the familiar, projec-tive transformation used to define chmmaticities in the CIE system. r,g chromaticities estimated (by visual means) and computed as outlined herein, can be used to access, through an experimentally pre-determined functional mapping (nor-mative data), the x.y chmmaticities of the prevailing white point.
From these data it is possible to work back to the changes in R, G and B needed to achieve the desired highlight neutral balance. Referring, again, to the color mixture matrix equa-tion presented earlier, the x,y chromaticities of the prevailing white point are known, the primary chromaticitics of the monitor type are known or can be assumed and it is possible to compute the prevailing balance vector by conventional matrix calculations. Then the balance changes needed to get to the desired white point can be computed. In the foregoing procedure, it is helpful to have data from threshold work, but it is not essential. To improve reliability, the color matching experiment may be repeated with film donuts of different colors.
Referring to FIG. 9A. the pre-determined functional map-ping in the preceding paragraph is based on normative data gathered as follows: One or more color-normal observers performs the color-matching experiment described at a vari-ety of white balance adjustments of a monitor. Preferably, the experiments are performed for various monitor types (steps 92-93). The x,y chromaticities (or other relevant variables) corresponding to each balance vector or setting are measured with an accurate colorimeter (step 91). The r,g chromaticities corresponding to the observer's match settings are recorded. These data are used to specify a functional mapping such as the linear 2x2 matrix alluded to above. Any mapping that ensures sufficient accuracy is compatible with the method (step 94). Likewise, other variables derived from the color matching data may be modeled compatibly, according to the method. In other words, to prepare normative color-matching data, each type of monitor instrumentality, such as a sensor, is calibrated (step 91). The annulus on screen are set up as shown in FIG. 7, and display stimuli as shown in FIG. 8. For each types of monitor, observer makes the color match to the annulus, and then the color value in R G and B is recorded for the color and associated with measurement recorded from the sensor (step 93). A model relationship is determined by the
16 computer between match values and measurements (step 93). and the model is stored in a database accessible on network or other media (step 94).
Referring to FIG. 9B, we briefly review the method of 5 subjective display set-up and calibration, outlined in FIG. 4,
with reference to the normative data. Steps 42 and 43 of FIG. 4 are shown in FIG. 9B. At step 96. a User who wishes to verify the white balance adjustment of her display, subjec-tively, does so by way of judgments similar to those made by
10 the Observer in normative experiments at step 93 in FIG. 9A. At step 97, User-match data are used to infer the display's white balance data rather than to be fitted to them as in FIG. 9A. At steps 98 and 99, the inferred white balance may be compared to that derived by threshold methods (FIG. 4) or
is may be used to calculate a desired adjustment to white bal-ance settings. In other words, to use normative data collected in FIG. 9A in subjective calibration provided by the user, the contrast control is set near max and Brightness control adjusted and the threshold is measured until superposition
20 occurs (step 42-43). The user then makes color matches using one or more film annuli as described in connection with FIGS. 7-8 (step 96), and the computer retrieve the model from database, and plug in color match data to compute prevailing white points (step 97). A new balance vector is established
25 (step 98), and if not verified by the user (step 99), steps 96-99 are repeated.
Thus, given knowledge of the type of monitor, there is information about the phosphor chromaticities and basic color mixture matrix. (If the type is not known, it should be
30 possible to form an educated guess and take steps that will improve color rendering by the display.) In order to make a profile, or color translator, the matrix needs to be adjusted for a particular white balance. In order to do this, the initial white balance must be known. If the threshold methods outlined
35 earlier arc successful, then the color matching method out-lined in this section may be ustxd to verify or supplement data from thresholds.
Referring to FIG. 10. a method for verifying and/or fine tuning tone reproduction will be described to produce very
411 good agreement between two monitors. This may be an addi-tional part of step 46 of FIG. 4 after color matching of FIGS. 7, 8, 9A-9B, are performed. FIG. 10 shows a screen for adjusting tone reproduction without hardware assist. This exercise should follow neutral balancing and does not require
45 a film reference target, although having a reference makes it easier. If a film reference were omitted, the User would have to make subjective judgments of uniformity in the steps of lightness of a gray scale step wedge painted (displayed) on the screen of the display by the host computer in accordance with
so an application program or software. Although, with patience and some training, humans can arrange a series of samples into steps along an uniform scale, it is not the preferred method. Therefore, the preferred method is to use a film reference.
55 The configuration and associated functionality are illus- trated in FIG. 10. The film reference is suggested by the heavy black rectangle. Within it are 8 patches ranging from fairly dense to very low in density, proceeding from left to right. The area of the film outside the patches should be close to the
so maximum density. These may be conveniently manufactured on black & white lith film using a calibrated, linearized half-tone separation film recorder, although a continuous tone target may also be made. The screen ruling of a halftoncx1 image should be such as to minimize moire or beating pat-
6S terns with the underlying pixel structure of the video display. The target would be affixed to the screen over an area
slightly smaller than the film target. That area of the display
US 8,279,236 B2
10
17 will be driven to full scale white. The rest of the screen should be left dark, except for an array of 8 neutral patches which should be moveable by the User to butt up to the correspond-ing gray scale patches of the film target. (The exact number of patches in the scale is not critical and the User can choose to work on selected patches, relying on spline- or Bezier-like techniques to ensure a smooth tonal mapping.) In the bottom right comer of the screen is shown a graphical gradation curve on which each patch of the monitor's gray scale is represented by an "x" or a numerical indicator that correlates with the displayed gray scale. Initially, the x's appear on a line of slope 1, as though the initial tonal transfer characteristic of the monitor were correct.
The User can move the x's up or down as needed to match the lightnesses of corresponding steps of the film and monitor gray scales. Corrections indicated by the Users in this process will be used to correct the gains and offsets within the display and/or the LUTs in the graphic display section of the host. Specifically, the corrections made, either channel-by-chan-nel, or on the sum of the channels, in order to match the displayed gray scale to the film gray scale, are recorded by the software and then used according to the well-known algo-rithm (cf , H. E. Rose, 1955, "Adaptation of electronic color correction to the printing process," TAGA Proceedings, pp. 15-27, published by the Technical Association of the Graphic Arts, Rochester, N.Y. 14623) illustrated in FIG. 30, applica-tion Ser. No. 09/139,498, to bring the physical display into conformance with what is assumed in the software.
Methods of acquiring the relevant data have been described above to provide calibration data regarding viewing condi-tions, maximum Luminance levels and like variables, which may be used to optimize Virtual Proofing. Examples of use of the calibration data are reviewed below.
First, maximum luminance is considered. In Table One, two monitors of Type I are observed to differ in the maximum Luminance attainable. Two strategies for dealing with the difference are outlined in this section. The difference can be detected automatically and instrumentally or by using the visual calibration technologies disclosed herein. Either way, the max. luminances at different nodes are stored in a field of the Virtual Proof and compared as part of the preparation for critical viewing.
One strategy calls for reducing the maximum Luminances at other, participating nodes to that prevailing at the node of lowest maximum. This is analogous to the "least common gamut" method mentioned in U.S. Pat. No. 6,043,909. It is useful in a situation in which a small number of collaborators (e.g., users at different rendering devices, such as color dis-plays) wish to be confident that they are seeing the same thing (color) and in which the Luminance restriction is not too limiting of color appreciation. Profiles for the different moni-tors may not have to be modified unless they encode absolute luminances—this is generally not the case. Instrumental and visual methods have been disclosed in this and earlier, pend-ing applications for adjusting down the max. Luminance by the desired amount—visually, they might take the form of a contrast adjustment that is analogous to the brightness adjust-ment discussed in connection with superposition earlier.
A second strategy employs tonal remappings according to equivalent appearance models such as those discussed by Bartleson and Breneman ("Brightness perception in complex fields," J. Opt. Soc. Amer. 57: 953-957, 1967) and by Holub, et al. ("Color systems calibration for graphic arts. II: Output devices," J. Imaging Technol., 14: 53-60, 1988.) There are many models of color appearance and perceptual constancy that could be used as a basis for calculating profiles for dif-ferent nodal displays apropos of consistent color. Models of
18 Guth, Hunt, Land, Nayatani and others are well known and many have been applied with varying degrees of success in computer imaging applications. The two studies cited above describe simple adjustments to tonal gradation functions
5 intended to compensate for most of the differences occa- sioned by different maximum luminance levels.
The kind of approach outlined in the preceding paragraph may be preferred in applications such as e-commerce. A clothier posting images of garments on its web site would want to include information about the assumed Luminance of viewing (or, more generally, about the assumed gamut of a rendering device.)At a particular consumer's node, a browser applet would compare the "recommended" viewing condi-
15 tions stored and communicated through the Virtual Proof to those prevailing locally and modify at least the tone repro- duction aspects of the local monitor profile in order to repre- sent the imagery more consistently with the clothier's inten- tions. Since the CIE variable of Chroma ("perceived
20 saturation") depends on Luminance, the image-viewing applet might well want to modify the device profile so as to enhance saturation as well.
FIG. 11 expresses the relationship described in the preced-ing paragraph schematically in which an Internet server 1.11.
25 provides a web site to which a client computer 112 (or 20 in FIG. 2) can be connected via the Internet or WWW through browser software at the client computer, such as to received GIF Data and Virtual Proof (or data structure) 111. GIF is an image file format that is common in Internet applications.
30 Others, such as JPEG, are possible. At this time, GIF images do not generally have a device independent interpretation; hence, a conversion 113 is shown at the client, and colors modified (via shared and local parts of Virtual Proof) 114 for output via signals 115 to display 116 (or 21 in FIG. 2). It
35 would be preferable if device independent data could be issued from the server or image source.
Next, viewing conditions in terms of the effects of ambient illumination is considered. For example, in the situation in which the consumer is at home and is paying a visit to the
40 clothier's web site. Morning light is streaming in the window and reflecting from the screen into the consumer's eyes. As was mentioned earlier, this reflected ambient light adds to that emitted by the display with potentially dramatic effects on dynamic range and saturation—i.e., on the gamut of the dis-
45 play. In the case in which the effects of ambient illumination are dramatic enough, it may not be possible to make any compensation which will ensure that a garment is displayed with sufficient color accuracy.
The browser applet, on comparing intended gamut with 50 realizable, could either warn the consumer that his color is not
credible and/or could use gamut filter technology (gamuts, gamut descriptors expressing models of device gamuts, gamut mapping strategies and gamut filters are discussed in considerable detail in U.S. Pat. No. 6,043,909) to show the
55 consumer what regions in the image are not faithfully repro-duced.
More generally, referring to FIG. 12, given an intended gamut conveyed through a Virtual Proof, available strategies include:
60 1) If the reproduction gamut at the receiving node is adequate to reproduce all colors faithfully (step 121), then simply display the colors accurately (step 122)
2) If the reproduction gamut is not adequate (step 121), then can the gamut be enlarged (step 123)
ss a) using instrumental or visual calibration technologies to guide the process, do what can be done (increasing Brightness or dynamic range, etc.) to increase the gamut of the device.
US 8,279,236 B2 19
This could include an advisory to the consumer to mitigate the ambient illumination (step 124)
b) if the deficiencies of gamut at the receiver are not too limiting, and thus the gamut cannot be enlarged (step 123) or do not affect critical colors (such as important garment colors which could be flagged either in a gamut filter or in a special field of the Virtual Proof) then gamut-scaling techniques dis-cussed in the earlier application could be employed to display a sufficiently faithful reproduction if only a little of the gamut is lost (steps 125 and 126)
c) otherwise, warn (notify) the receiver (or user), and use gamut filters to show the consumer which colors are poorly reproduced (step 127). The increase of device gamut of step 124 and scaling of step 126 are not mutually exclusive.
To be very clear about how the receiver's display gamut is known: Instrumental and/or visual techniques are employed to obtain calibration data about the device. Calculation of a gamut descriptor (which represents all the colors reproduc-ible with a device) was disclosed in U.S. Pat. No. 6,043,909. Briefly, an appropriately white-balanced color mixture matrix and a set of tone reproduction curves are sufficient for most applications to model a display which demonstrates superposition as explained earlier in this application.
There are various ways of representing the effects of ambi-ent, but one directly incorporates its effects into the primary chromaticities and the tone reproduction curves and, thereby, into the gamut descriptor. Alternatively, colors arc often expressed as XYZ TriStimulu s Variables (TSVs) in the course of being converted into CIELAB or similar uniform coordi-nates that may be employed in a gamut descriptor. At the TSV stage, the ambient, expressed as X, Y, Z coordinates may be added to the TSVs generated by the model (without any ambient effects incorporated.) Then the modified model out-put may be converted into perceptually uniform gamut descriptor coordinates expressive of ambient effects. How-ever, the invention is not limited to the foregoing methods for modeling and incorporating effects of ambient illumination into gamut descriptors and Virtual Proofing data. It is also possible to represent compensations for the effixts of differ-ences in max luminance between two devices in terms of a gamut adjustment.
Other instrumentation than a single-channel sensor may be used for measuring color of the display screen. It was noted earlier that a single-channel sensor cannot discriminate the exact color o f ambient light, only its level. One way of dealing with this is to query the User regarding the source of the environmental light by a software application operating at the host computer coupled to the display. For example, tungsten/ incandescent, "cool white" fluorescent, etc. sources have fairly well-known spectral energy distributions which can be used to calculate the chromaticity coordinates of the ambient which is adding to the light emitted from the display. Another way of querying the observer is to employ the psychophysical methods outlined in previous sections. A single-channel device is also unable to detect changes in the chromaticity of one or more of the channels of the display if the spectral energy distribution of said channel changes in shape.
Accurate colorimetry of arbitrary spectral stimuli requires convolution of said stimuli with weighting functions that are linear combinations of the human color matching functions. However, in cases where the stimuli are not arbitrary, but are singular, or few in number, and are known spectrally, it may be possible to use a simple sensor which does not match human spectral sensitivity. FIG. 13 shows spectral response functions of a dual-channel sensor that is based on a light-to-frequency converter such as that referred to in incorporated U.S. application Ser. No. 09/139,498. The method outlined
20 here is similar to the method outlined in that application for detecting changes in the calibration of a self-calibrating spec-tral colorimeter.
The spectral response functions chosen for FIG. 13 are 5 arbitrary. In general, it is preferable that they be broad, over-
lapping and cover, in concert at least, the entire visible spec-trum. As shown, they can respond differentially to a change in the spectrum of a stimulus with which they are convolved. More channels than two provide greater ability to localize (by
to differential changes in the responses of individual channels) exactly where changes in the stimulus spectrum have occurred. In the limit of additional channels, of course, we obtain sampling characteristic of a spectral sensor.
FIG. 14 illustrates a "stimulus spectrum," i.e., that of a 15 fluorescent lamp reflected off a white proofing stock. If
changes in that stimulus were predictable, then the dual chan-nel sensor could be calibrated to record chromaticity changes reliably. For example, if the spikes in the spectrum never moved positionally, but fluctuated in relative amplitude, then
20 the dual channel device could predict color changes accu-rately. The same would be true of other sources, such as video display channels. However, if the spectral changes in the stimulus were more complex and unpredictable, then the dual-channel sensor might be capable only of registering a
25 change in the stimulus over time, indicating a need for re-calibration with a more sophisticated colorimeter.
The situation in which a dual-channel sensor may be pref-erable to a single channel device is one in which the User does not want to purchase an accurate (expensive) colorimeter but
30 needs to be aware of changes in spectral shape of relevant stimuli, such as a fluorescent source in a viewing hood or a color channel of a video display.
FIG. 15 is a schematic of an apparatus for calibrating a sensor described in foregoing discussion, and FIG. 16 flow-
35 charts the calibration procedure. Sensor 100 is a sensor which is to be calibrated. It is mounted in a fixture so as to view a white reflecting surface of a reflector 107a, such as upon sheet or board. The reflector can be moved, preferably by an arm that is computer-controlled, in and out of the line of sight of
ao the sensor in a plane 107, indicated by a dashed line in FIG. 15. Reflector 107a may also be located manually by a user. A reference instrument 104, whose calibration is stable and traceable to a standards laboratory such as the U.S. National Institute of Standards and Technology, also views the same
45 area on the reflector as the sensor to be calibrated. The refer-ence instrument is one whose response at each, narrow wave-band of the visual spectrum has been measured carefully as part of its calibration. It may be a spectral instrument, but need not be (FIG. 16, step 162). The goal is to transfer its
so calibration to the newly manufactured instrument; its calibra-tion is likely to be more stable over time than that of the monochromatic source.
The monochromator 101 has a lamp assembly 102 to pro-vide white light that is dispersed into component wavebands.
55 (Edmund Scientific supplies a "mini-chrom" assembly, which integrates monochromator, lamp and stepping motor, along with controller software which is adequate for the pur-poses described here---seep. 222 of catalogue no. N987A.) A stepper motor 103 is operated by the computer to control the
60 waveband of dispersed light that is focused on the exit slit of the monochromator. Light emerging from the slit can be shuttered by a shutter 108, i.e., prevented from reaching the reflector or allowed to reach it. A lens (or lens assembly) 109 is used to create a fairly uniform field of monochromatic
65 illumination on the reflector in plane 107. The sensor-to-be-calibrated 100 and reference instrument 104 both view the uniformly illuminated field provided by reflector 107a.
US 8,279,236 B2 21
In the flow chart of FIG. 16, to position sensor 100, the reflecting screen 107a is lowered, the display 106 darkened, and the shutter of the monochromator 101 is opened (step 161). The wavelength of illumination is incremented in wave-bands such that the computer causes different, narrow bands 5 of the visible spectrum, from about 380 nm to about 720 tim, to illuminate the field (steps 162 and 163). At each waveband, the computer measures and records the responses of sensor and reference instrument. These data are used to determine the spectral response function (plotting response of the sensor l'-' as a function of the wavelength of incident light) of a fully assembled (manufactured) sensor with reference to the known standard 104 (step 164). Next, the shutter is closed and the reflector 107a is moved out of the way, such as raised so that a video display screen 106 immediately behind the plane 15 107 is viewed by sensor 100 and reference instrument 104. The calibration is then verified (steps 165-166) The purpose of this second step is verification of the calibration and quality assurance of the sensor. A sheet of proofing stock illuminated by a fluorescent, viewing illuminator could be used en lieu of 20 the video display. The primaries (primary colors) are each displayed and measured with the sensor and reference instru-ment, and the expected sensor response is calculated by con-volving its spectral sensitivity with the spectral emission of each primary. If the calculated responses equal the measured 25 responses (step 166), the calculation is verified, otherwise, the verification fails and steps 161-165 should be repeated.
The following further describes the verification provided at steps 165-166. As a result of prior measurements with a spectral instrument of adequate resolution (see application 30 Ser. No. 09/139,498) the computer has stored data on the spectral emission characteristics of each of the primary chan-nels of the display—typically these are called "red," "green" and "blue." However, other primaries are possible. The com-puter lights up each of the primary channels on the display in 35 turn and measures and records the responses of the sensor-to-be-calibrated and the reference instrument. It calculates the response expected from the sensor using the relation:
12=-1c.l[e(k)*s()„lAki ( 0, 40
where R is the Response of the sensor being calibrated, e is the spectral energy distribution of one of the display's primary channels, s is the spectral response function of the sensor as measured in the preceding step, k is a constant, X represents 45 wavelength and AX represents the wavelength increment of the summation. Equation (1) can be thought of as a convolu-tion summation with a shift parameter equal to zero.
If it is desired to know the CIE Luminance, Y, that corre-sponds to R, it may be calculated as 50
Y.41.,Ye(krs(k)'p()+,),Nk] (2),
where p(?.) is the ratio of the value ofthe y-bar color matching function of the CIE Standard Observer to the response of the sensor at each wavelength. Of course, Y can also be calculated 55
directly by its defining equation, but equation (2) shows the relationship to sensor sensitivity.
If the value of R calculated using equation (1) agrees suf-ficiently well with the value actually measured, the instru-ment passes quality assurance; otherwise, it fails. In most 60
cases, a recalibration will suffice following an initial failure. Occasionally, an instrument must be discarded.
The calibration procedure outlined can be applied to single- or multi-channel sensors. With knowledge of the spec-tral response of the sensor and of the form and variations of 65
the stimulus, it is possible to calculate changes in the color of the stimulus.
22 Apparatus and methods have been disclosed for cost-effec-
tive and highly accurate set-up, calibration and color-control of video displays.
From the foregoing description, it will be apparent that there has been provided improved methods and apparatus for color display calibration. Variations and modifications in the herein described methods and apparatus in accordance with the invention will undoubtedly suggest themselves to those skilled in the art. Accordingly, the foregoing description should be taken as illustrative and not in a limiting sense.
The invention claimed is: 1. A computer-readable storage medium encoded with a
computer program comprising: one or more screens displayable at a first computer
enabling collection of data characterizing at least the effects of viewing conditions on color reproduction by a rendering device associated with said first computer, wherein at least said data collected is used in computing a first gamut for said rendering device; and
software providing a comparison of said first gamut with a second gamut of colors for reproduction by said render-ing device, said second gamut of colors being provided by a second computer employing a network protocol, wherein said collection of data is enabled by at least one of instrumental measurement or subjective visual judg-ments.
2. The computer-readable storage medium according to claim 1 wherein said viewing conditions comprise ambient illumination, and said computer-readable storage medium further comprises software enabling measurement of colors rendered by said device.
3. The computer-readable storage medium according to claim 2 further comprising software for computing one or more transformations for rendering color on said rendering device responsive to said measurement or said collection of data.
4. The computer-readable storage medium according to claim 3 wherein said software providing said comparison, said software for rendering, said software enabling measure-ment, and said software for computing are capable of being distributed among a plurality of processors which communi-cate through network interfaces.
5. The computer-readable storage medium according to claim 1 wherein said measurement or said judgments are representable in standard units based in human color vision.
6. The computer-readable storage medium according to claim 5 further comprising software for rendering colors of said second gamut on said rendering device responsive to said comparison.
7. The computer-readable storage medium according to claim 6 wherein said software for rendering provides an indi-cation that colors when rendered are reproduced inaccurately.
8. The computer-readable storage medium according to claim 6 wherein said software for rendering renders color in accordance with said comparison by enabling the selection of one of said second gamut, an enlarged said first gamut, or a scaling of said second gamut.
9. The computer-readable storage medium according to claim 1 wherein said second gamut of colors is provided by a device calibrated to provide data in units capable of colori-metric interpretation.
10. The computer-readable storage medium according to claim 9 wherein said calibrated device provides data enabling substitution of a viewing illuminant for the measuring illumi-nant in calculation of color values from measurements.
11. The computer-readable storage medium according to claim 1 further comprising a database storing information
US 8,279,236 B2 23
descriptive of devices of the network, said information com-prising calibration data, dates and times of calibration, and device capabilities.
12. The computer-readable storage medium according to claim 1 wherein said first computer and said second computer communicate employing client-server protocols.
13. The computer-readable storage medium according to claim t wherein said comparison employs a data structure having inputs which are color values and outputs indicating whether said color values are in or out of at least one of said first and second gamuts.
14. The computer-readable storage medium according to claim 1 wherein said second gamut comprises one or more colors to be rendered and said software alerts the user if viewing conditions should be changed to enable accurate reproduction of said one or more colors to be rendered.
15. A system for color processing comprising: a server having a network interface for communication
with at least a client computer; and software executable by one or more networked computers
and data, wherein said data comprise calibration data based at least partly upon at least one of instrumental or visual measurement for at least one rendering device associated with said client computer, and first gamut data characterizing at least the effects of viewing condi-tions on the gamut of colors reproducible by said at least one rendering device as determined by at least one of instrumental or visual measurement, and said software comprises a program for comparison of said first gamut with a second gamut of colors provided by said server for reproduction by said at least one rendering device.
16. The system according to claim 15 wherein said soft-ware further comprises a program for rendering color on said at least one rendering device responsive to said comparison.
17. The system according to claim 16 wherein said pro-gram for rendering renders color in accordance with said comparison by enabling the selection of one of said second gamut, an enlarged said first gamut, or a scaling of said second gamut.
18. The system according to claim 16 wherein said pro-gram for rendering provides an indication that colors when rendered are reproduced inaccurately.
19. The system according to claim 15 wherein said viewing conditions comprise ambient illumination.
20. The system according to claim 19 wherein said soft-ware further comprises one or more programs for computing one or more transformations for rendering color on said at least one rendering device responsive to said measurement.
21. The system according to claim 20 wherein said pro-gram for comparison, said program for rendering, one or more programs enabling measurement, and said programs for computing are capable of being distributed among a plurality of processors which communicate through network inter-faces.
22. The system according to claim 15 wherein said mea-surement is representable in standard units based in human color vision.
23. The system according to claim 15 wherein said second gamut of colors is provided by a device calibrated to provide data in units capable of colorimetric interpretation.
24. The system according to claim 23 wherein said cali-brated device provides data enabling substitution of a viewing illuminant for the measuring illuminant in calculation of color values from measurements.
25. The system according to claim 15 further comprising a database storing information descriptive of color devices of the network, said information comprising said calibration
24 data, dates and times of calibration, device capabilities and information of relationships between said color devices of the network.
26. The system according to claim 15 wherein said corn-s mtmication employs a file comprising a data structure which
defines the colors of said second gamut which are to be reproduced by said at least one rendering device.
27. The computer-readable storage medium according to claim 26 wherein said data structure represents a gamut filter
to having inputs which are color values expressible as three device independent coordinates and outputs which indicate whether input colors are in or out of said second gamut, said colors to be reproduced comprising ones within said second gamut.
is 28. The computer-readable storage medium according to claim 26 wherein said data structure represents a gamut descriptor having inputs related to the lightness and hue of colors and outputs related to the maximum Chroma of said second gamut for the input values.
20 29. A method of color processing comprising the steps of: displaying one or more screens on a client computer
enabling collection of data characterizing at least the effects of viewing conditions on color reproduction by a rendering device associated with said client computer
25 and calibration of said rendering device wherein said collection of data and said calibration are enabled by at least one of instrumental or subjective visual measure-ment and said calibration comprises at least adjustment of neutral balance and tone reproduction of said render-
30 ing device for conformance with aim values; computing a first gamut for said rendering device in accor-
dance with at least said collected data; and comparing said first gamut with a second gamut compris-
ing one or more colors provided by a server employing a 35 network protocol for reproduction by said rendering
device. 30. The method according to claim 29 further comprising
the steps of: rendering, responsive to said comparing step, said one or
40 more colors provided by said server on said rendering device utilizing one of said second gamut, an enlarged said first gamut, or a gamut-scaling of said one or more colors provided by said server; and
employing a data structure enabling indication of colors 45 reproduced inaccurately by said rendering device.
31. The method according to claim 29 further comprising the step of providing information to alert a user to said effects of viewing conditions on the accuracy of color reproduction by said rendering device.
so 32. A computer-readable storage medium encoded with a computer program comprising:
stored data representing graphical menu elements for dis-play on a display device associated with a first computer which enable a user to control the operation of a spectral
55 colorimeter, wherein said menu elements further enable display of tutorial information regarding a calibration process and wherein said spectral colorimeter comprises an internal reference for calibration of said spectral colo-rimeter;
60 data representing screens displayable on said display device for calibration of said display device and one or more programs for collecting calibration data provided by said colorimeter, said calibration data comprising at least neutral balance and tone reproduction;
65 software enabling measurement of ambient illumination and adjustment of the maximum luminance displayed on said display for improved color matching;
US 8,279,236 B2 25
one or more programs that compute color transformations, responsive to at least said calibration data, that enable rendering of image data expressible in device indepen-dent units of color on said display, said transformations comprising a chromatic adaptation transform which modifies input color values in a device-independent coordinate system to produce output values in said coor-dinate system, wherein said transformations are stored in a file having a header which enables access to said transformations;
software operable on said first computer which prepares one or more files comprising at least data useful for color matched rendering for communication to a second com-puter through a network interface employing a network protocol; and
software for determining a state of calibration of a render-ing device associated with said second computer and for alerting a user of said second computer when said state of calibration does not enable color matched rendering on said device associated with said second computer.
26 33. The computer-readable storage medium according to
claim 32 further comprising software operable on said first computer for transmitting said communication to said second computer.
5 34. The computer-readable storage medium according to claim 32 wherein said communication comprises a program enabling said color-matchal. rendering.
35. The computer-readable storage medium according to claim 34 further comprising a program that modifies a rea-
l() dering transformation at said second computer responsive to a gamut operation which increases saturation of colors or to viewing conditions as they affect rendering on a device asso-ciated with said second computer.
36. The computer-readable storage medium according to is claim 35 further comprising a program operable at said sec-
ond computer for receiving data of measurements of at least ambient illumination at said device associated with said sec-ond computer, said measurements comprising one of instru-mental or visual measurements.