103
ANNUAL STATEMENT FOR THE YEAR 2019 OF THE HANOVER NEW JERSEY INSURANCE COMPANY

ANNUAL STATEMENT FOR THE YEAR 2019 OF THE HANOVER NEW JERSEY INSURANCE COMPANY

ANNUAL STATEMENT FOR THE YEAR 2019 OF THE HANOVER NEW JERSEY INSURANCE COMPANY
ASSETSCurrent Year Prior Year
1
Assets
2
Nonadmitted Assets
3Net Admitted Assets
(Cols. 1 - 2)
4Net Admitted
Assets
1. Bonds (Schedule D) 27,035,930 0 27,035,930 30,528,120
2. Stocks (Schedule D):
2.1 Preferred stocks 0 0 0 0
2.2 Common stocks 0 0 0 0
3. Mortgage loans on real estate (Schedule B):
3.1 First liens 0 0 0 0
3.2 Other than first liens 0 0 0 0
4. Real estate (Schedule A):
4.1 Properties occupied by the company (less $ 0
encumbrances) 0 0 0 0
4.2 Properties held for the production of income (less
$ 0 encumbrances) 0 0 0 0
4.3 Properties held for sale (less $ 0
encumbrances) 0 0 0 0
5. Cash ($ 35,004 , Schedule E - Part 1), cash equivalents
($ 3,751,500 , Schedule E - Part 2) and short-term
investments ($ 0 , Schedule DA) 3,786,504 0 3,786,504 293,229
6. Contract loans (including $ 0 premium notes) 0 0 0 0
7. Derivatives (Schedule DB) 0 0 0 0
8. Other invested assets (Schedule BA) 0 0 0 0
9. Receivable for securities 0 0 0 0
10. Securities lending reinvested collateral assets (Schedule DL) 0 0 0 0
11. Aggregate write-ins for invested assets 0 0 0 0
12. Subtotals, cash and invested assets (Lines 1 to 11) 30,822,434 0 30,822,434 30,821,349
13. Title plants less $ 0 charged off (for Title insurers
only) 0 0 0 0
14. Investment income due and accrued 196,268 0 196,268 231,956
15. Premiums and considerations:
15.1 Uncollected premiums and agents' balances in the course of collection 0 0 0 0
15.2 Deferred premiums and agents' balances and installments booked but
deferred and not yet due (including $ 0
earned but unbilled premiums) 0 0 0 0
15.3 Accrued retrospective premiums ($ 0 ) and
contracts subject to redetermination ($ 0 ) 0 0 0 0
16. Reinsurance:
16.1 Amounts recoverable from reinsurers 0 0 0 0
16.2 Funds held by or deposited with reinsured companies 0 0 0 0
16.3 Other amounts receivable under reinsurance contracts 0 0 0 0
17. Amounts receivable relating to uninsured plans 0 0 0 0
18.1 Current federal and foreign income tax recoverable and interest thereon 0 0 0 579
18.2 Net deferred tax asset 0 0 0 0
19. Guaranty funds receivable or on deposit 0 0 0 0
20. Electronic data processing equipment and software 0 0 0 0
21. Furniture and equipment, including health care delivery assets
($ 0 ) 0 0 0 0
22. Net adjustment in assets and liabilities due to foreign exchange rates 0 0 0 0
23. Receivables from parent, subsidiaries and affiliates 0 0 0 0
24. Health care ($ 0 ) and other amounts receivable 0 0 0 0
25. Aggregate write-ins for other than invested assets 0 0 0 0
26. Total assets excluding Separate Accounts, Segregated Accounts and Protected Cell Accounts (Lines 12 to 25) 31,018,702 0 31,018,702 31,053,884
27. From Separate Accounts, Segregated Accounts and Protected Cell Accounts 0 0 0 0
28. Total (Lines 26 and 27) 31,018,702 0 31,018,702 31,053,884
DETAILS OF WRITE-INS
1101.
1102.
1103.
1198. Summary of remaining write-ins for Line 11 from overflow page 0 0 0 0
1199. Totals (Lines 1101 thru 1103 plus 1198)(Line 11 above) 0 0 0 0
2501.
2502.
2503.
2598. Summary of remaining write-ins for Line 25 from overflow page 0 0 0 0
2599. Totals (Lines 2501 thru 2503 plus 2598)(Line 25 above) 0 0 0 0
2

ANNUAL STATEMENT FOR THE YEAR 2019 OF THE HANOVER NEW JERSEY INSURANCE COMPANY
LIABILITIES, SURPLUS AND OTHER FUNDS1
Current Year2
Prior Year
1. Losses (Part 2A, Line 35, Column 8) 0 0
2. Reinsurance payable on paid losses and loss adjustment expenses (Schedule F, Part 1, Column 6) 0 0
3. Loss adjustment expenses (Part 2A, Line 35, Column 9) 0 0
4. Commissions payable, contingent commissions and other similar charges 0 0
5. Other expenses (excluding taxes, licenses and fees) 0 0
6. Taxes, licenses and fees (excluding federal and foreign income taxes) 0 0
7.1 Current federal and foreign income taxes (including $ 0 on realized capital gains (losses)) 1,050 0
7.2 Net deferred tax liability 15,160 14,381
8. Borrowed money $ 0 and interest thereon $ 0 0 0
9. Unearned premiums (Part 1A, Line 38, Column 5) (after deducting unearned premiums for ceded reinsurance of
$ 0 and including warranty reserves of $ 0 and accrued accident and
health experience rating refunds including $ 0 for medical loss ratio rebate per the Public Health
Service Act) 0 0
10. Advance premium 0 0
11. Dividends declared and unpaid:
11.1 Stockholders 0 0
11.2 Policyholders 0 0
12. Ceded reinsurance premiums payable (net of ceding commissions) 0 0
13. Funds held by company under reinsurance treaties (Schedule F, Part 3, Column 20) 0 0
14. Amounts withheld or retained by company for account of others 0 0
15. Remittances and items not allocated 0 0
16. Provision for reinsurance (including $ 0 certified) (Schedule F, Part 3, Column 78) 0 0
17. Net adjustments in assets and liabilities due to foreign exchange rates 0 0
18. Drafts outstanding 0 0
19. Payable to parent, subsidiaries and affiliates 3,105 2,773
20. Derivatives 0 0
21. Payable for securities 0 0
22. Payable for securities lending 0 0
23. Liability for amounts held under uninsured plans 0 0
24. Capital notes $ 0 and interest thereon $ 0 0 0
25. Aggregate write-ins for liabilities 0 0
26. Total liabilities excluding protected cell liabilities (Lines 1 through 25) 19,315 17,154
27. Protected cell liabilities 0 0
28. Total liabilities (Lines 26 and 27) 19,315 17,154
29. Aggregate write-ins for special surplus funds 0 0
30. Common capital stock 5,000,000 5,000,000
31. Preferred capital stock 0 0
32. Aggregate write-ins for other than special surplus funds 0 0
33. Surplus notes 0 0
34. Gross paid in and contributed surplus 19,000,000 19,000,000
35. Unassigned funds (surplus) 6,999,387 7,036,730
36. Less treasury stock, at cost:
36.1 0 shares common (value included in Line 30 $ 0 ) 0 0
36.2 0 shares preferred (value included in Line 31 $ 0 ) 0 0
37. Surplus as regards policyholders (Lines 29 to 35, less 36) (Page 4, Line 39) 30,999,387 31,036,730
38. TOTALS (Page 2, Line 28, Col. 3) 31,018,702 31,053,884
DETAILS OF WRITE-INS
2501.
2502.
2503.
2598. Summary of remaining write-ins for Line 25 from overflow page 0 0
2599. Totals (Lines 2501 thru 2503 plus 2598)(Line 25 above) 0 0
2901.
2902.
2903.
2998. Summary of remaining write-ins for Line 29 from overflow page 0 0
2999. Totals (Lines 2901 thru 2903 plus 2998)(Line 29 above) 0 0
3201.
3202.
3203.
3298. Summary of remaining write-ins for Line 32 from overflow page 0 0
3299. Totals (Lines 3201 thru 3203 plus 3298)(Line 32 above) 0 0
3

ANNUAL STATEMENT FOR THE YEAR 2019 OF THE HANOVER NEW JERSEY INSURANCE COMPANY
STATEMENT OF INCOME1
Current Year2
Prior Year
UNDERWRITING INCOME
1. Premiums earned (Part 1, Line 35, Column 4) 0 0
DEDUCTIONS:
2. Losses incurred (Part 2, Line 35, Column 7) 0 0
3. Loss adjustment expenses incurred (Part 3, Line 25, Column 1) 0 0
4. Other underwriting expenses incurred (Part 3, Line 25, Column 2) 0 0
5. Aggregate write-ins for underwriting deductions 0 0
6. Total underwriting deductions (Lines 2 through 5) 0 0
7. Net income of protected cells 0 0
8. Net underwriting gain or (loss) (Line 1 minus Line 6 plus Line 7) 0 0
INVESTMENT INCOME
9. Net investment income earned (Exhibit of Net Investment Income, Line 17) 964,922 982,307
10. Net realized capital gains or (losses) less capital gains tax of $ 1,183 (Exhibit of Capital
Gains (Losses) ) (1,041) 53,500
11. Net investment gain (loss) (Lines 9 + 10) 963,881 1,035,807
OTHER INCOME
12. Net gain (loss) from agents’ or premium balances charged off (amount recovered
$ 0 amount charged off $ 0 ) 0 0
13. Finance and service charges not included in premiums 0 0
14. Aggregate write-ins for miscellaneous income 0 0
15. Total other income (Lines 12 through 14) 0 0
16. Net income before dividends to policyholders, after capital gains tax and before all other federal and foreign income taxes (Lines 8 + 11 + 15) 963,881 1,035,807
17. Dividends to policyholders 0 0
18. Net income, after dividends to policyholders, after capital gains tax and before all other federal and foreign income taxes (Line 16 minus Line 17) 963,881 1,035,807
19. Federal and foreign income taxes incurred 200,445 198,889
20. Net income (Line 18 minus Line 19)(to Line 22) 763,436 836,918
CAPITAL AND SURPLUS ACCOUNT
21. Surplus as regards policyholders, December 31 prior year (Page 4, Line 39, Column 2) 31,036,730 30,814,193
22. Net income (from Line 20) 763,436 836,918
23. Net transfers (to) from Protected Cell accounts 0 0
24. Change in net unrealized capital gains or (losses) less capital gains tax of $ 0 0 0
25. Change in net unrealized foreign exchange capital gain (loss) 0 0
26. Change in net deferred income tax (779) (39,339)
27. Change in nonadmitted assets (Exhibit of Nonadmitted Assets, Line 28, Col. 3) 0 24,958
28. Change in provision for reinsurance (Page 3, Line 16, Column 2 minus Column 1) 0 0
29. Change in surplus notes 0 0
30. Surplus (contributed to) withdrawn from protected cells 0 0
31. Cumulative effect of changes in accounting principles 0 0
32. Capital changes:
32.1 Paid in 0 0
32.2 Transferred from surplus (Stock Dividend) 0 0
32.3 Transferred to surplus 0 0
33. Surplus adjustments:
33.1 Paid in 0 0
33.2 Transferred to capital (Stock Dividend) 0 0
33.3 Transferred from capital 0 0
34. Net remittances from or (to) Home Office 0 0
35. Dividends to stockholders (800,000) (600,000)
36. Change in treasury stock (Page 3, Lines 36.1 and 36.2, Column 2 minus Column 1) 0 0
37. Aggregate write-ins for gains and losses in surplus 0 0
38. Change in surplus as regards policyholders for the year (Lines 22 through 37) (37,343) 222,537
39. Surplus as regards policyholders, December 31 current year (Line 21 plus Line 38) (Page 3, Line 37) 30,999,387 31,036,730
DETAILS OF WRITE-INS
0501.
0502.
0503.
0598. Summary of remaining write-ins for Line 5 from overflow page 0 0
0599. Totals (Lines 0501 thru 0503 plus 0598)(Line 5 above) 0 0
1401.
1402.
1403.
1498. Summary of remaining write-ins for Line 14 from overflow page 0 0
1499. Totals (Lines 1401 thru 1403 plus 1498)(Line 14 above) 0 0
3701.
3702.
3703.
3798. Summary of remaining write-ins for Line 37 from overflow page 0 0
3799. Totals (Lines 3701 thru 3703 plus 3798)(Line 37 above) 0 0
4

ANNUAL STATEMENT FOR THE YEAR 2019 OF THE HANOVER NEW JERSEY INSURANCE COMPANY
CASH FLOW1
Current Year
2
Prior Year
Cash from Operations
1. Premiums collected net of reinsurance 0 0
2. Net investment income 1,000,691 998,725
3. Miscellaneous income 0 0
4. Total (Lines 1 through 3) 1,000,691 998,725
5. Benefit and loss related payments 0 0
6. Net transfers to Separate Accounts, Segregated Accounts and Protected Cell Accounts 0 0
7. Commissions, expenses paid and aggregate write-ins for deductions 0 0
8. Dividends paid to policyholders 0 0
9. Federal and foreign income taxes paid (recovered) net of $ 1,183 tax on capital gains (losses) 199,999 111,001
10. Total (Lines 5 through 9) 199,999 111,001
11. Net cash from operations (Line 4 minus Line 10) 800,692 887,724
Cash from Investments
12. Proceeds from investments sold, matured or repaid:
12.1 Bonds 5,976,098 5,065,396
12.2 Stocks 0 0
12.3 Mortgage loans 0 0
12.4 Real estate 0 0
12.5 Other invested assets 0 0
12.6 Net gains or (losses) on cash, cash equivalents and short-term investments (1) 0
12.7 Miscellaneous proceeds 0 2,031
12.8 Total investment proceeds (Lines 12.1 to 12.7) 5,976,097 5,067,427
13. Cost of investments acquired (long-term only):
13.1 Bonds 3,259,909 5,717,475
13.2 Stocks 0 0
13.3 Mortgage loans 0 0
13.4 Real estate 0 0
13.5 Other invested assets 0 0
13.6 Miscellaneous applications 0 0
13.7 Total investments acquired (Lines 13.1 to 13.6) 3,259,909 5,717,475
14. Net increase (decrease) in contract loans and premium notes 0 0
15. Net cash from investments (Line 12.8 minus Line 13.7 minus Line 14) 2,716,188 (650,048)
Cash from Financing and Miscellaneous Sources
16. Cash provided (applied):
16.1 Surplus notes, capital notes 0 0
16.2 Capital and paid in surplus, less treasury stock 0 0
16.3 Borrowed funds 0 0
16.4 Net deposits on deposit-type contracts and other insurance liabilities 0 0
16.5 Dividends to stockholders 23,937 600,000
16.6 Other cash provided (applied) 332 (492)
17. Net cash from financing and miscellaneous sources (Lines 16.1 to 16.4 minus Line 16.5 plus Line 16.6) (23,605) (600,492)
RECONCILIATION OF CASH, CASH EQUIVALENTS AND SHORT-TERM INVESTMENTS
18. Net change in cash, cash equivalents and short-term investments (Line 11, plus Lines 15 and 17) 3,493,275 (362,816)
19. Cash, cash equivalents and short-term investments:
19.1 Beginning of year 293,229 656,045
19.2 End of period (Line 18 plus Line 19.1) 3,786,504 293,229
Note: Supplemental disclosures of cash flow information for non-cash transactions:
20.0001. Bonds sold in settlement of intercompany dividend (771,182) 0
20.0002. Accrued interest on bonds sold in settlement of intercompany dividend (4,881) 0
5

ANNUAL STATEMENT FOR THE YEAR 2019 OF THE HANOVER NEW JERSEY INSURANCE COMPANY
Underwriting and Investment Exhibit - Part 1 - Premiums Earned
N O N E
Underwriting and Investment Exhibit - Part 1A - Recapitulation of all Premiums
N O N E
Underwriting and Investment Exhibit - Part 1B - Premiums Written
N O N E
6, 7, 8

ANNUAL STATEMENT FOR THE YEAR 2019 OF THE HANOVER NEW JERSEY INSURANCE COMPANY
UNDERWRITING AND INVESTMENT EXHIBITPART 2 - LOSSES PAID AND INCURRED
Losses Paid Less Salvage 5 6 7 8
Line of Business
1
Direct Business
2
ReinsuranceAssumed
3
ReinsuranceRecovered
4
Net Payments(Cols. 1 + 2 -3 )
Net Losses UnpaidCurrent Year
(Part 2A , Col. 8)Net Losses Unpaid
Prior Year
Losses Incurred Current Year
(Cols. 4 + 5 - 6)
Percentage ofLosses Incurred(Col. 7, Part 2) to Premiums Earned
(Col. 4, Part 1)
1. Fire 0 0 0 0 0 0 0 0.0
2. Allied lines 0 0 0 0 0 0 0 0.0
3. Farmowners multiple peril 0 0 0 0 0 0 0 0.0
4. Homeowners multiple peril 0 0 0 0 0 0 0 0.0
5. Commercial multiple peril 0 0 0 0 0 0 0 0.0
6. Mortgage guaranty 0 0 0 0 0 0 0 0.0
8. Ocean marine 0 0 0 0 0 0 0 0.0
9. Inland marine 0 0 0 0 0 0 0 0.0
10. Financial guaranty 0 0 0 0 0 0 0 0.0
11.1 Medical professional liability - occurrence 0 0 0 0 0 0 0 0.0
11.2 Medical professional liability - claims-made 0 0 0 0 0 0 0 0.0
12. Earthquake 0 0 0 0 0 0 0 0.0
13. Group accident and health 0 0 0 0 0 0 0 0.0
14. Credit accident and health (group and individual) 0 0 0 0 0 0 0 0.0
15. Other accident and health 0 0 0 0 0 0 0 0.0
16. Workers' compensation 0 0 0 0 0 0 0 0.0
17.1 Other liability - occurrence 0 0 0 0 0 0 0 0.0
17.2 Other liability - claims-made 0 0 0 0 0 0 0 0.0
17.3 Excess workers' compensation 0 0 0 0 0 0 0 0.0
18.1 Products liability - occurrence 0 0 0 0 0 0 0 0.0
18.2 Products liability - claims-made 0 0 0 0 0 0 0 0.0
19.1, 19.2 Private passenger auto liability (18,223) 0 (18,223) 0 0 0 0 0.0
19.3, 19.4 Commercial auto liability 0 0 0 0 0 0 0 0.0
21. Auto physical damage (4,362) 0 (4,362) 0 0 0 0 0.0
22. Aircraft (all perils) 0 0 0 0 0 0 0 0.0
23. Fidelity 0 0 0 0 0 0 0 0.0
24. Surety 0 0 0 0 0 0 0 0.0
26. Burglary and theft 0 0 0 0 0 0 0 0.0
27. Boiler and machinery 0 0 0 0 0 0 0 0.0
28. Credit 0 0 0 0 0 0 0 0.0
29. International 0 0 0 0 0 0 0 0.0
30. Warranty 0 0 0 0 0 0 0 0.0
31. Reinsurance - nonproportional assumed property XXX 0 0 0 0 0 0 0.0
32. Reinsurance - nonproportional assumed liability XXX 0 0 0 0 0 0 0.0
33. Reinsurance - nonproportional assumed financial lines XXX 0 0 0 0 0 0 0.0
34. Aggregate write-ins for other lines of business 0 0 0 0 0 0 0 0.0
35. TOTALS (22,585) 0 (22,585) 0 0 0 0 0.0
DETAILS OF WRITE-INS
3401.
3402.
3403.
3498. Summary of remaining write-ins for Line 34 from overflow page 0 0 0 0 0 0 0 0.0
3499. Totals (Lines 3401 thru 3403 plus 3498)(Line 34 above) 0 0 0 0 0 0 0 0.0
9

ANNUAL STATEMENT FOR THE YEAR 2019 OF THE HANOVER NEW JERSEY INSURANCE COMPANY
UNDERWRITING AND INVESTMENT EXHIBITPART 2A - UNPAID LOSSES AND LOSS ADJUSTMENT EXPENSES
Reported Losses Incurred But Not Reported 8 9
Line of Business
1
Direct
2
ReinsuranceAssumed
3
DeductReinsuranceRecoverable
4
Net Losses Excl. Incurred But Not
Reported(Cols. 1 + 2 - 3)
5
Direct
6
ReinsuranceAssumed
7
ReinsuranceCeded
Net Losses Unpaid(Cols. 4 + 5 + 6 - 7)
Net UnpaidLoss Adjustment
Expenses
1. Fire 0 0 0 0 0 0 0 0 0
2. Allied lines 0 0 0 0 0 0 0 0 0
3. Farmowners multiple peril 0 0 0 0 0 0 0 0 0
4. Homeowners multiple peril 0 0 0 0 0 0 0 0 0
5. Commercial multiple peril 0 0 0 0 0 0 0 0 0
6. Mortgage guaranty 0 0 0 0 0 0 0 0 0
8. Ocean marine 0 0 0 0 0 0 0 0 0
9. Inland marine 0 0 0 0 0 0 0 0 0
10. Financial guaranty 0 0 0 0 0 0 0 0 0
11.1 Medical professional liability - occurrence 0 0 0 0 0 0 0 0 0
11.2 Medical professional liability - claims-made 0 0 0 0 0 0 0 0 0
12. Earthquake 0 0 0 0 0 0 0 0 0
13. Group accident and health 0 0 0 0 0 0 0 (a) 0 0
14. Credit accident and health (group and individual) 0 0 0 0 0 0 0 0 0
15. Other accident and health 0 0 0 0 0 0 0 (a) 0 0
16. Workers' compensation 0 0 0 0 0 0 0 0 0
17.1 Other liability - occurrence 0 0 0 0 0 0 0 0 0
17.2 Other liability - claims-made 0 0 0 0 0 0 0 0 0
17.3 Excess workers' compensation 0 0 0 0 0 0 0 0 0
18.1 Products liability - occurrence 0 0 0 0 0 0 0 0 0
18.2 Products liability - claims-made 0 0 0 0 0 0 0 0 0
19.1, 19.2 Private passenger auto liability 2,500 0 2,500 0 111 0 111 0 0
19.3, 19.4 Commercial auto liability 0 0 0 0 0 0 0 0 0
21. Auto physical damage 0 0 0 0 0 0 0 0 0
22. Aircraft (all perils) 0 0 0 0 0 0 0 0 0
23. Fidelity 0 0 0 0 0 0 0 0 0
24. Surety 0 0 0 0 0 0 0 0 0
26. Burglary and theft 0 0 0 0 0 0 0 0 0
27. Boiler and machinery 0 0 0 0 0 0 0 0 0
28. Credit 0 0 0 0 0 0 0 0 0
29. International 0 0 0 0 0 0 0 0 0
30. Warranty 0 0 0 0 0 0 0 0 0
31. Reinsurance - nonproportional assumed property XXX 0 0 0 XXX 0 0 0 0
32. Reinsurance - nonproportional assumed liability XXX 0 0 0 XXX 0 0 0 0
33. Reinsurance - nonproportional assumed financial lines XXX 0 0 0 XXX 0 0 0 0
34. Aggregate write-ins for other lines of business 0 0 0 0 0 0 0 0 0
35. TOTALS 2,500 0 2,500 0 111 0 111 0 0
DETAILS OF WRITE-INS
3401.
3402.
3403.
3498. Summary of remaining write-ins for Line 34 from overflow page 0 0 0 0 0 0 0 0 0
3499. Totals (Lines 3401 thru 3403 plus 3498)(Line 34 above) 0 0 0 0 0 0 0 0 0
(a) Including $ 0 for present value of life indemnity claims.
10
ANNUAL STATEMENT FOR THE YEAR 2019 OF THE HANOVER NEW JERSEY INSURANCE COMPANY
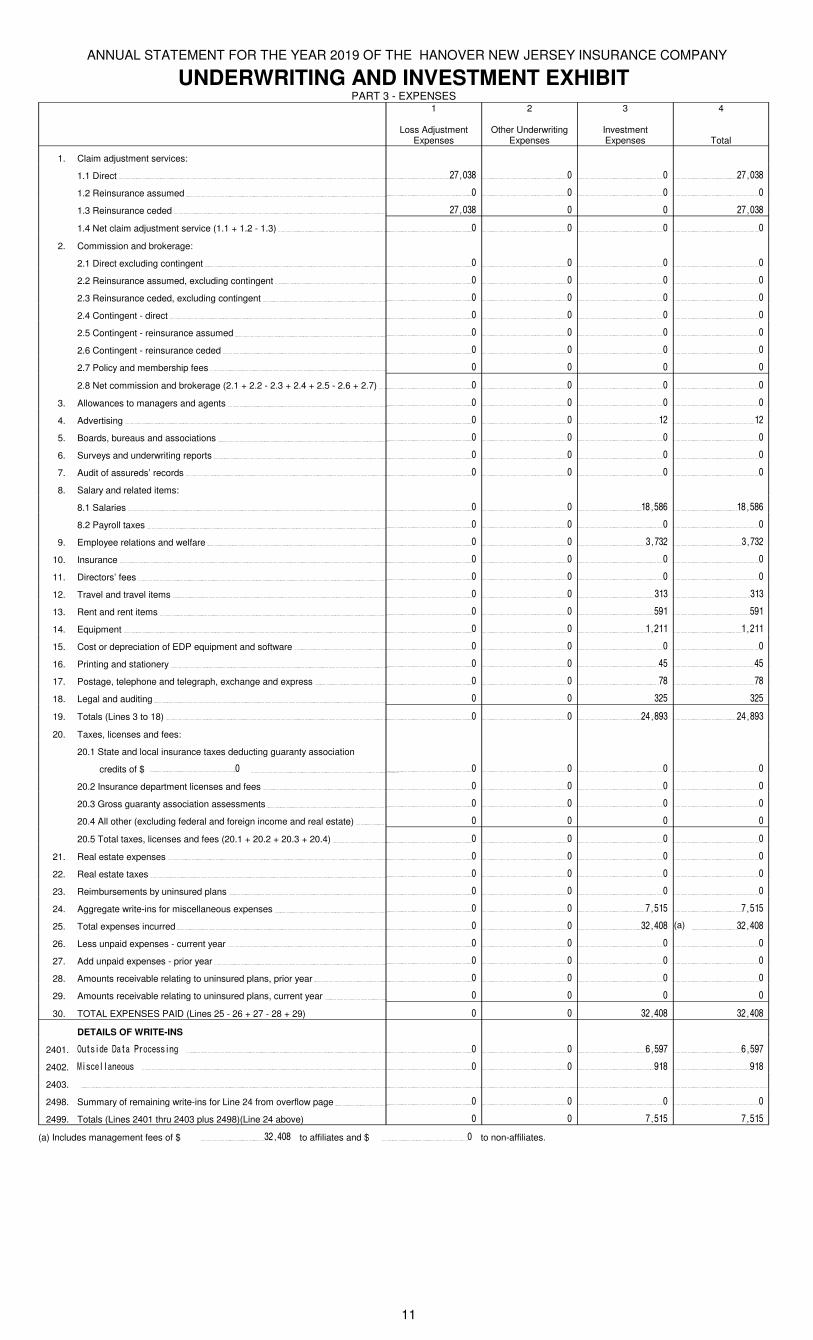
UNDERWRITING AND INVESTMENT EXHIBITPART 3 - EXPENSES
1
Loss Adjustment Expenses
2
Other Underwriting Expenses
3
InvestmentExpenses
4
Total
1. Claim adjustment services:
1.1 Direct 27,038 0 0 27,038
1.2 Reinsurance assumed 0 0 0 0
1.3 Reinsurance ceded 27,038 0 0 27,038
1.4 Net claim adjustment service (1.1 + 1.2 - 1.3) 0 0 0 0
2. Commission and brokerage:
2.1 Direct excluding contingent 0 0 0 0
2.2 Reinsurance assumed, excluding contingent 0 0 0 0
2.3 Reinsurance ceded, excluding contingent 0 0 0 0
2.4 Contingent - direct 0 0 0 0
2.5 Contingent - reinsurance assumed 0 0 0 0
2.6 Contingent - reinsurance ceded 0 0 0 0
2.7 Policy and membership fees 0 0 0 0
2.8 Net commission and brokerage (2.1 + 2.2 - 2.3 + 2.4 + 2.5 - 2.6 + 2.7) 0 0 0 0
3. Allowances to managers and agents 0 0 0 0
4. Advertising 0 0 12 12
5. Boards, bureaus and associations 0 0 0 0
6. Surveys and underwriting reports 0 0 0 0
7. Audit of assureds’ records 0 0 0 0
8. Salary and related items:
8.1 Salaries 0 0 18,586 18,586
8.2 Payroll taxes 0 0 0 0
9. Employee relations and welfare 0 0 3,732 3,732
10. Insurance 0 0 0 0
11. Directors’ fees 0 0 0 0
12. Travel and travel items 0 0 313 313
13. Rent and rent items 0 0 591 591
14. Equipment 0 0 1,211 1,211
15. Cost or depreciation of EDP equipment and software 0 0 0 0
16. Printing and stationery 0 0 45 45
17. Postage, telephone and telegraph, exchange and express 0 0 78 78
18. Legal and auditing 0 0 325 325
19. Totals (Lines 3 to 18) 0 0 24,893 24,893
20. Taxes, licenses and fees:
20.1 State and local insurance taxes deducting guaranty association
credits of $ 0 0 0 0 0
20.2 Insurance department licenses and fees 0 0 0 0
20.3 Gross guaranty association assessments 0 0 0 0
20.4 All other (excluding federal and foreign income and real estate) 0 0 0 0
20.5 Total taxes, licenses and fees (20.1 + 20.2 + 20.3 + 20.4) 0 0 0 0
21. Real estate expenses 0 0 0 0
22. Real estate taxes 0 0 0 0
23. Reimbursements by uninsured plans 0 0 0 0
24. Aggregate write-ins for miscellaneous expenses 0 0 7,515 7,515
25. Total expenses incurred 0 0 32,408 (a) 32,408
26. Less unpaid expenses - current year 0 0 0 0
27. Add unpaid expenses - prior year 0 0 0 0
28. Amounts receivable relating to uninsured plans, prior year 0 0 0 0
29. Amounts receivable relating to uninsured plans, current year 0 0 0 0
30. TOTAL EXPENSES PAID (Lines 25 - 26 + 27 - 28 + 29) 0 0 32,408 32,408
DETAILS OF WRITE-INS
2401. Outside Data Processing 0 0 6,597 6,597
2402. Miscellaneous 0 0 918 918
2403.
2498. Summary of remaining write-ins for Line 24 from overflow page 0 0 0 0
2499. Totals (Lines 2401 thru 2403 plus 2498)(Line 24 above) 0 0 7,515 7,515
(a) Includes management fees of $ 32,408 to affiliates and $ 0 to non-affiliates.
11

ANNUAL STATEMENT FOR THE YEAR 2019 OF THE HANOVER NEW JERSEY INSURANCE COMPANY
EXHIBIT OF NET INVESTMENT INCOME
1 2Collected During Year Earned During Year
1. U.S. Government bonds (a) 55,403 55,386
1.1 Bonds exempt from U.S. tax (a) 2,699 2,387
1.2 Other bonds (unaffiliated) (a) 939,928 904,569
1.3 Bonds of affiliates (a) 0 0
2.1 Preferred stocks (unaffiliated) (b) 0 0
2.11 Preferred stocks of affiliates (b) 0 0
2.2 Common stocks (unaffiliated) 0 0
2.21 Common stocks of affiliates 0 0
3. Mortgage loans (c) 0 0
4. Real estate (d) 0 0
5 Contract loans 0 0
6 Cash, cash equivalents and short-term investments (e) 34,988 34,988
7 Derivative instruments (f) 0 0
8. Other invested assets 0 0
9. Aggregate write-ins for investment income 0 0
10. Total gross investment income 1,033,018 997,330
11. Investment expenses (g) 32,408
12. Investment taxes, licenses and fees, excluding federal income taxes (g) 0
13. Interest expense (h) 0
14. Depreciation on real estate and other invested assets (i) 0
15. Aggregate write-ins for deductions from investment income 0
16. Total deductions (Lines 11 through 15) 32,408
17. Net investment income (Line 10 minus Line 16) 964,922
DETAILS OF WRITE-INS
0901.
0902.
0903.
0998. Summary of remaining write-ins for Line 9 from overflow page 0 0
0999. Totals (Lines 0901 thru 0903 plus 0998) (Line 9, above) 0 0
1501.
1502.
1503.
1598. Summary of remaining write-ins for Line 15 from overflow page 0
1599. Totals (Lines 1501 thru 1503 plus 1598) (Line 15, above) 0
(a) Includes $ 20,426 accrual of discount less $ 25,388 amortization of premium and less $ 2,811 paid for accrued interest on purchases.
(b) Includes $ 0 accrual of discount less $ 0 amortization of premium and less $ 0 paid for accrued dividends on purchases.
(c) Includes $ 0 accrual of discount less $ 0 amortization of premium and less $ 0 paid for accrued interest on purchases.
(d) Includes $ 0 for company’s occupancy of its own buildings; and excludes $ 0 interest on encumbrances.
(e) Includes $ 32,375 accrual of discount less $ 0 amortization of premium and less $ 0 paid for accrued interest on purchases.
(f) Includes $ 0 accrual of discount less $ 0 amortization of premium.
(g) Includes $ 0 investment expenses and $ 0 investment taxes, licenses and fees, excluding federal income taxes, attributable tosegregated and Separate Accounts.
(h) Includes $ 0 interest on surplus notes and $ 0 interest on capital notes.
(i) Includes $ 0 depreciation on real estate and $ 0 depreciation on other invested assets.
EXHIBIT OF CAPITAL GAINS (LOSSES)1
Realized Gain (Loss) On Sales or Maturity
2
Other Realized Adjustments
3
Total Realized Capital Gain (Loss)
(Columns 1 + 2)
4
Change inUnrealized Capital
Gain (Loss)
5
Change in Unrealized Foreign Exchange Capital Gain (Loss)
1. U.S. Government bonds 0 0 0 0 0
1.1 Bonds exempt from U.S. tax (552) 0 (552) 0 0
1.2 Other bonds (unaffiliated) 695 0 695 0 0
1.3 Bonds of affiliates 0 0 0 0 0
2.1 Preferred stocks (unaffiliated) 0 0 0 0 0
2.11 Preferred stocks of affiliates 0 0 0 0 0
2.2 Common stocks (unaffiliated) 0 0 0 0 0
2.21 Common stocks of affiliates 0 0 0 0 0
3. Mortgage loans 0 0 0 0 0
4. Real estate 0 0 0 0 0
5. Contract loans 0 0 0 0 0
6. Cash, cash equivalents and short-term investments (1) 0 (1) 0 0
7. Derivative instruments 0 0 0 0 0
8. Other invested assets 0 0 0 0 0
9. Aggregate write-ins for capital gains (losses) 0 0 0 0 0
10. Total capital gains (losses) 142 0 142 0 0
DETAILS OF WRITE-INS
0901.
0902.
0903.
0998. Summary of remaining write-ins for Line 9 from overflow page 0 0 0 0 0
0999. Totals (Lines 0901 thru 0903 plus 0998) (Line 9, above) 0 0 0 0 0
12

ANNUAL STATEMENT FOR THE YEAR 2019 OF THE HANOVER NEW JERSEY INSURANCE COMPANY
EXHIBIT OF NON-ADMITTED ASSETS1
Current Year Total Nonadmitted Assets
2
Prior Year Total Nonadmitted Assets
3Change in Total
Nonadmitted Assets (Col. 2 - Col. 1)
1. Bonds (Schedule D)
2. Stocks (Schedule D):
2.1 Preferred stocks
2.2 Common stocks
3. Mortgage loans on real estate (Schedule B):
3.1 First liens
3.2 Other than first liens
4. Real estate (Schedule A):
4.1 Properties occupied by the company
4.2 Properties held for the production of income
4.3 Properties held for sale
5. Cash (Schedule E - Part 1), cash equivalents (Schedule E - Part 2) and short-term investments (Schedule DA)
6. Contract loans
7. Derivatives (Schedule DB)
8. Other invested assets (Schedule BA)
9. Receivables for securities
10. Securities lending reinvested collateral assets (Schedule DL)
11. Aggregate write-ins for invested assets
12. Subtotals, cash and invested assets (Lines 1 to 11)
13. Title plants (for Title insurers only)
14. Investment income due and accrued
15. Premiums and considerations:
15.1 Uncollected premiums and agents' balances in the course of collection
15.2 Deferred premiums, agents' balances and installments booked but deferred and not yet due
15.3 Accrued retrospective premiums and contracts subject to redetermination
16. Reinsurance:
16.1 Amounts recoverable from reinsurers
16.2 Funds held by or deposited with reinsured companies
16.3 Other amounts receivable under reinsurance contracts
17. Amounts receivable relating to uninsured plans
18.1 Current federal and foreign income tax recoverable and interest thereon
18.2 Net deferred tax asset
19. Guaranty funds receivable or on deposit
20. Electronic data processing equipment and software
21. Furniture and equipment, including health care delivery assets
22. Net adjustment in assets and liabilities due to foreign exchange rates
23. Receivables from parent, subsidiaries and affiliates
24. Health care and other amounts receivable
25. Aggregate write-ins for other than invested assets
26. Total assets excluding Separate Accounts, Segregated Accounts and Protected Cell Accounts (Lines 12 to 25)
27. From Separate Accounts, Segregated Accounts and Protected Cell Accounts
28. Total (Lines 26 and 27)
DETAILS OF WRITE-INS
1101.
1102.
1103.
1198. Summary of remaining write-ins for Line 11 from overflow page
1199. Totals (Lines 1101 thru 1103 plus 1198)(Line 11 above)
2501.
2502.
2503.
2598. Summary of remaining write-ins for Line 25 from overflow page
2599. Totals (Lines 2501 thru 2503 plus 2598)(Line 25 above)
NONE
13
ANNUAL STATEMENT FOR THE YEAR 2019 OF THE HANOVER NEW JERSEY INSURANCE COMPANY
NOTES TO FINANCIAL STATEMENTS
NOTE 1 Summary of Significant Accounting Policies and Going Concern
A. Accounting Practices
NET INCOME
(1)
(2)
(3)
(4)
SURPLUS
(5) State basis (Page 3, Line 37, Columns 1 & 2)
(6) State Prescribed Practices that are an increase/(decrease) from NAIC SAP:
(7) State Permitted Practices that are an increase/(decrease) from NAIC SAP:
(8) NAIC SAP (5-6-7=8)
B. Use of Estimates in the Preparation of the Financial Statements
C. Accounting Policy
(1) Short-term investments are stated at amortized cost.
(2)
(3)
(4)
(5) The Company does not own any mortgage loans.
(6)
(7) The Company does not own any stocks of, or have any interest in, any subsidiaries.
(8) The Company does not own any other invested assets.
(9) The Company does not own any derivatives.
(10)The Company does utilize anticipated investment income as a factor in the premium deficiency calculation.
(11)
(12)The Company has not modified its capitalization policy from the prior year.
(13)The Company does not write major medical insurance with prescription drug coverage.
D. Going Concern
NOTE 2 Accounting Changes and Corrections of Errors
NOTE 3 Business Combinations and Goodwill
NOTE 4 Discontinued Operations
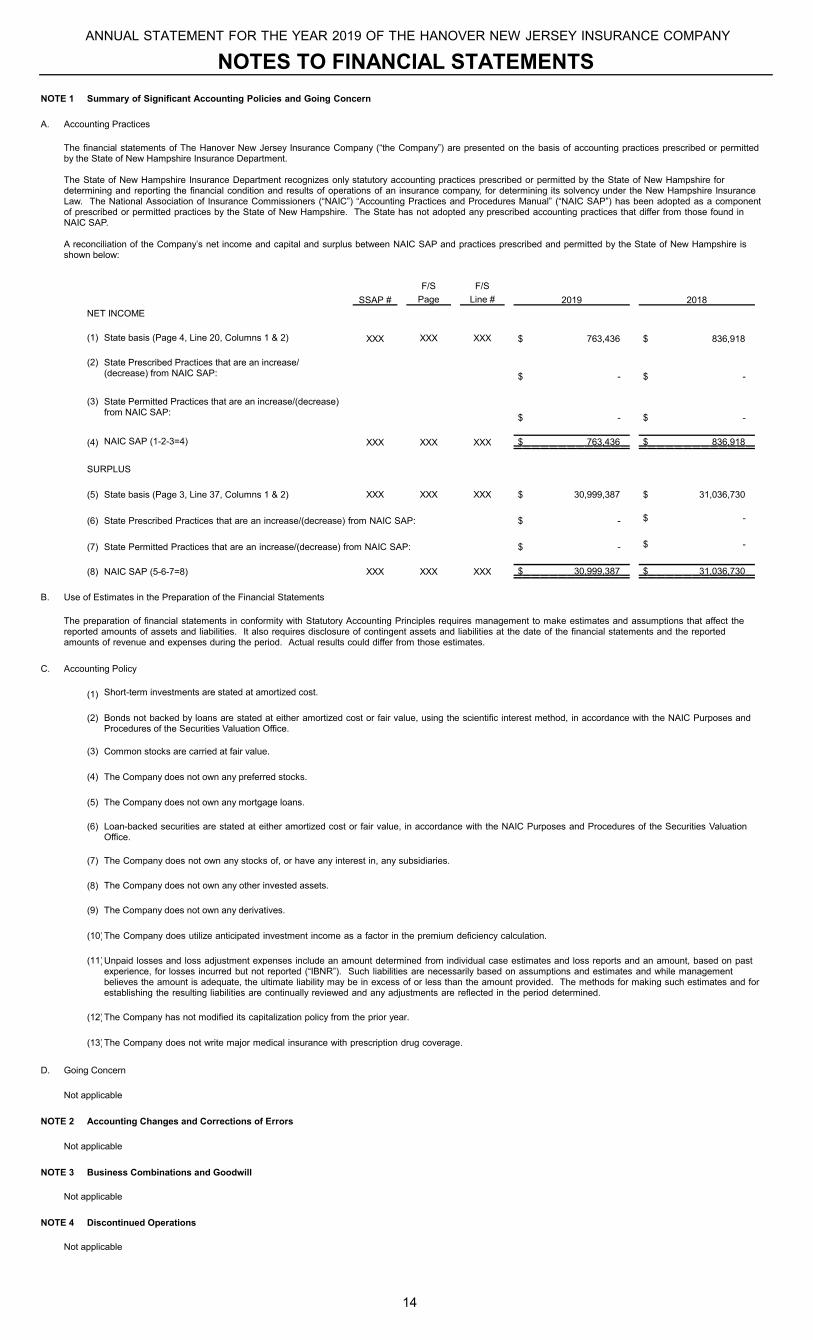
The financial statements of The Hanover New Jersey Insurance Company (“the Company”) are presented on the basis of accounting practices prescribed or permitted by the State of New Hampshire Insurance Department.
The State of New Hampshire Insurance Department recognizes only statutory accounting practices prescribed or permitted by the State of New Hampshire for determining and reporting the financial condition and results of operations of an insurance company, for determining its solvency under the New Hampshire Insurance Law. The National Association of Insurance Commissioners (“NAIC”) “Accounting Practices and Procedures Manual” (“NAIC SAP”) has been adopted as a component of prescribed or permitted practices by the State of New Hampshire. The State has not adopted any prescribed accounting practices that differ from those found in NAIC SAP.
A reconciliation of the Company’s net income and capital and surplus between NAIC SAP and practices prescribed and permitted by the State of New Hampshire is shown below:
F/S F/S
SSAP # Page Line # 2019 2018
State basis (Page 4, Line 20, Columns 1 & 2) XXX XXX XXX $ 763,436 $ 836,918
State Prescribed Practices that are an increase/(decrease) from NAIC SAP: $ - $ -
State Permitted Practices that are an increase/(decrease) from NAIC SAP:
$ - $ -
NAIC SAP (1-2-3=4) XXX XXX XXX $ 763,436 $ 836,918
XXX XXX XXX $ 30,999,387 $ 31,036,730
$ - $ -
$ - $ -
XXX XXX XXX $ 30,999,387 $ 31,036,730
The preparation of financial statements in conformity with Statutory Accounting Principles requires management to make estimates and assumptions that affect the reported amounts of assets and liabilities. It also requires disclosure of contingent assets and liabilities at the date of the financial statements and the reported amounts of revenue and expenses during the period. Actual results could differ from those estimates.
Bonds not backed by loans are stated at either amortized cost or fair value, using the scientific interest method, in accordance with the NAIC Purposes and Procedures of the Securities Valuation Office.
Common stocks are carried at fair value.
The Company does not own any preferred stocks.
Loan-backed securities are stated at either amortized cost or fair value, in accordance with the NAIC Purposes and Procedures of the Securities Valuation Office.
Unpaid losses and loss adjustment expenses include an amount determined from individual case estimates and loss reports and an amount, based on past experience, for losses incurred but not reported (“IBNR”). Such liabilities are necessarily based on assumptions and estimates and while management believes the amount is adequate, the ultimate liability may be in excess of or less than the amount provided. The methods for making such estimates and for establishing the resulting liabilities are continually reviewed and any adjustments are reflected in the period determined.
Not applicable
Not applicable
Not applicable
Not applicable
14

ANNUAL STATEMENT FOR THE YEAR 2019 OF THE HANOVER NEW JERSEY INSURANCE COMPANY
NOTES TO FINANCIAL STATEMENTS
NOTE 5 Investments
A. Mortgage Loans, including Mezzanine Real Estate Loans
The Company does not own any mortgage loans.
B. Debt Restructuring
The Company did not have any restructured debt.
C. Reverse Mortgages
The Company does not own any reverse mortgages.
D. Loan-Backed Securities
(1)
(2) Not applicable
(3) The Company had no securities with a recognized other-than-temporary impairment.
(4)
a) The aggregate amount of unrealized losses:
1. Less than 12 Months
2. 12 Months or Longer
b)The aggregate related fair value of securities with unrealized losses:
1. Less than 12 Months
2. 12 Months or Longer
(5)
E., F., G., H., I., J., K.
L. Restricted Assets
1. Restricted Assets (Including Pledged)
(a) Subset of Column 1
(b) Subset of Column 3
Prepayment assumptions for loan-backed and structured securities were obtained from prepayment models that are sensitive to refinancing, turnover, equity take-out and other relevant factors. These assumptions are consistent with the current interest rate and economic environment.
All impaired securities (fair value is less than cost or amortized cost) for which an other-than-temporary impairment has not been recognized in earnings as a realized loss (including securities with a recognized other-than-temporary impairment for non-interest related declines when a non-recognized interest related impairment remains):
$ 2,513
$ 1,249
$ 267,633
$ 55,089
The Company employs a systematic methodology to determine if a decline in market value below book/adjusted carrying value is other-than-temporary. In determining whether a decline in fair value below book/adjusted carrying value is other-than-temporary, the Company evaluates several factors and circumstances, including the issuer’s overall financial condition; the issuer’s credit and financial strength ratings; the issuer’s financial performance, including earnings trends, dividend payments, and asset quality; any specific events which may influence the operations of the issuer including governmental actions; a weakening of the general market conditions in the industry or geographic region in which the issuer operates; the length of time and degree to which the fair value of an issuer’s securities remains below cost; the Company’s intent and ability to hold the security until such time to allow for the expected recovery in value; and with respect to fixed maturity investments, any factors that might raise doubt about the issuer’s ability to pay all amounts due according to the contractual terms. These factors are applied to all securities.
Not applicable
Gross (Admitted & Nonadmitted) Restricted
Current Year 6 7
1 2 3 4 5
Restricted Asset Category
Total General Account
(G/A)
G/A Supporting Protected
Cell AccountActivity
(a)
Total Protected
Cell Account Restricted
Assets
Protected Cell Account
Assets Supporting G/A Activity
(b)Total
(1 plus 3)
TotalFrom Prior
Year
Increase/(Decrease) (5
minus 6)
a. Subject to contractual obligation for which liability is not shown $ - $ - $ - $ - $ - $ - $ -b. Collateral held under security lending agreements $ - $ - $ - $ - $ - $ - $ -
c. Subject to repurchase agreements $ - $ - $ - $ - $ - $ - $ -
d. Subject to reverse repurchase agreements $ - $ - $ - $ - $ - $ - $ -
e. Subject to dollar repurchase agreements $ - $ - $ - $ - $ - $ - $ -f. Subject to dollar reverse repurchase agreements $ - $ - $ - $ - $ - $ - $ -
g. Placed under option contracts $ - $ - $ - $ - $ - $ - $ -h. Letter stock or securities restricted as to sale - excluding FHLB capital stock $ - $ - $ - $ - $ - $ - $ -
i. FHLB capital stock $ - $ - $ - $ - $ - $ - $ -
j. On deposit with states $ 104,260 $ - $ - $ - $ 104,260 $ 88,685 $ 15,575
k. On deposit with other regulatory bodies $ - $ - $ - $ - $ - $ - $ -l. Pledged collateral to FHLB (including assets backing funding agreements) $ - $ - $ - $ - $ - $ - $ -m. Pledged as collateral not captured in other categories $ - $ - $ - $ - $ - $ - $ -
n. Other restricted assets $ - $ - $ - $ - $ - $ - $ -
o. Total Restricted Assets $ 104,260 $ - $ - $ - $ 104,260 $ 88,685 $ 15,575
14.1

ANNUAL STATEMENT FOR THE YEAR 2019 OF THE HANOVER NEW JERSEY INSURANCE COMPANY
NOTES TO FINANCIAL STATEMENTS
(c) Column 5 divided by Asset Page, Column 1, Line 28
(d) Column 9 divided by Asset Page, Column 3, Line 28
2.
Not applicable
3.
Not applicable
4.
Not applicable
M., N., O., P.
Q. Prepayment Penalty and Acceleration Fees
1. Number of CUSIPs
2. Aggregate Amount of Investment Income
NOTE 6 Joint Ventures, Partnerships and Limited Liability Companies
NOTE 7 Investment Income
NOTE 8 Derivative Instruments
Current Year
8 9 Percentage
Restricted Asset Category
TotalNon-
admitted Restricted
Total Admitted Restricted(5 minus 8)
10
Gross (Admitted &
Non-admitted)
Restricted to Total
Assets(c)
11
Admitted Restricted
to Total Admitted Assets
(d)
a. Subject to contractual obligation for which liability is not shown $ - $ - 0.000% 0.000%b. Collateral held under security lending agreements $ - $ - 0.000% 0.000%
c. Subject to repurchase agreements $ - $ - 0.000% 0.000%
d. Subject to reverse repurchase agreements $ - $ - 0.000% 0.000%
e. Subject to dollar repurchase agreements $ - $ - 0.000% 0.000%f. Subject to dollar reverse repurchase agreements $ - $ - 0.000% 0.000%
g. Placed under option contracts $ - $ - 0.000% 0.000%
h. Letter stock or securities restricted as to sale - excluding FHLB capital stock $ - $ - 0.000% 0.000%
i. FHLB capital stock $ - $ - 0.000% 0.000%
j. On deposit with states $ - $ 104,260 0.336% 0.336%
k. On deposit with other regulatory bodies $ - $ - 0.000% 0.000%
l. Pledged collateral to FHLB (including assets backing funding agreements) $ - $ - 0.000% 0.000%m. Pledged as collateral not captured in other categories $ - $ - 0.000% 0.000%
n. Other restricted assets $ - $ - 0.000% 0.000%
o. Total Restricted Assets $ - $ 104,260 0.336% 0.336%
Detail of Assets Pledged as Collateral Not Captured in Other Categories (Contracts That Share Similar Characteristics, Such as Reinsurance and Derivatives, Are Reported in the Aggregate)
Detail of Other Restricted Assets (Contracts That Share Similar Characteristics, Such as Reinsurance and Derivatives, Are Reported in the Aggregate)
Collateral Received and Reflected as Assets Within the Reporting Entity’s Financial Statements
Not applicable
General Account Protected Cell
3 0
$ 5,635 $ -
Not applicable
The Company did not have any due and accrued amounts over 90 days past due to exclude from surplus.
Not applicable
14.2

ANNUAL STATEMENT FOR THE YEAR 2019 OF THE HANOVER NEW JERSEY INSURANCE COMPANY
NOTES TO FINANCIAL STATEMENTS
NOTE 9 Income Taxes
A. The components of the net deferred tax asset/(liability) at the end of current period are as follows:
1.
2.
3.
4. Tax Planning Strategies
a. There is no financial impact of the Company's tax planning strategies.
b. Do the Company‘s tax-planning strategies include the use of reinsurance?
B.
As of End of Current Period 12/31/2018 Change
(1)
Ordinary
(2)
Capital
(3)(Col. 1 + 2)
Total
(4)
Ordinary
(5)
Capital
(6)(Col. 4 + 5)
Total
(7)(Col. 1 - 4)Ordinary
(8)(Col. 2 - 5)
Capital
(9)(Col. 7 + 8)
Total
(a) Gross Deferred Tax Assets $ - $ - $ - $ - $ - $ - $ - $ - $ -
(b) Statutory Valuation Allowance Adjustment $ - $ - $ - $ - $ - $ - $ - $ - $ -
(c) Adjusted Gross Deferred Tax Assets (1a - 1b) $ - $ - $ - $ - $ - $ - $ - $ - $ -
(d) Deferred Tax Assets Nonadmitted $ - $ - $ - $ - $ - $ - $ - $ - $ -
(e) Subtotal Net Admitted Deferred Tax Asset (1c - 1d) $ - $ - $ - $ - $ - $ - $ - $ - $ -
(f) Deferred Tax Liabilities $ - $ 15,160 $ 15,160 $ - $ 14,381 $ 14,381 $ - $ 779 $ 779
(g) Net Admitted Deferred Tax Asset/(Net Deferred Tax Liability)(1e - 1f) $ - $ (15,160) $ (15,160) $ - $ (14,381) $ (14,381) $ - $ (779) $ (779)
As of End of Current Period 12/31/2018 Change
(1)
Ordinary
(2)
Capital
(3)(Col. 1 + 2)
Total
(4)
Ordinary
(5)
Capital
(6)(Col. 4 + 5)
Total
(7)(Col. 1 - 4)Ordinary
(8)(Col. 2 - 5)
Capital
(9)(Col. 7 + 8)
Total
Admission Calculation ComponentsSSAP No. 101
(a) Federal Income Taxes Paid In PriorYears Recoverable Through LossCarrybacks $ - $ - $ - $ - $ - $ - $ - $ - $ -
(b) Adjusted Gross Deferred TaxAssets Expected To Be Realized(Excluding The Amount Of DeferredTax Assets From 2(a) above) AfterApplication of the Threshold Limitation.(The Lesser of 2(b)1 and 2(b)2 Below) $ - $ - $ - $ - $ - $ - $ - $ - $ -
1. Adjusted Gross Deferred TaxAssets Expected to be RealizedFollowing the Balance Sheet Date. $ - $ - $ - $ - $ - $ - $ - $ - $ -
2. Adjusted Gross Deferred TaxAssets Allowed per LimitationThreshold. XXX XXX $ 4,649,908 XXX XXX $ 4,657,667 XXX XXX $ (7,759)
(c) Adjusted Gross Deferred Tax Assets(Excluding The Amount Of Deferred TaxAssets From 2(a) and 2(b) above)Offset by Gross Deferred Tax Liabilities. $ - $ - $ - $ - $ - $ - $ - $ - $ -
(d) Deferred Tax Assets Admitted as the result of application of SSAP No. 101. Total (2(a) + 2(b) + 2(c)) $ - $ - $ - $ - $ - $ - $ - $ - $ -
2019 2018a. Ratio Percentage Used To Determine Recovery Period And Threshold Limitation Amount. 25913.000% 23158.000%
b. Amount Of Adjusted Capital And Surplus Used To Determine Recovery Period And Threshold Limitation In 2(b)2 Above. $ 30,999,387 $ 31,036,730
Yes [ ] No [X]
The Company does not have any deferred tax liabilities that are not recognized for amounts described in Accounting Standards Codification 740, Income Tax.
14.3

ANNUAL STATEMENT FOR THE YEAR 2019 OF THE HANOVER NEW JERSEY INSURANCE COMPANY
NOTES TO FINANCIAL STATEMENTS
C. Current income taxes incurred consist of the following major components:
1. Current Income Tax
(a) Federal
(b) Foreign
(c) Subtotal
(d) Federal income tax on net capital gains
(e) Utilization of capital loss carry-forwards
(f) Other
(g) Federal and foreign income taxes incurred
2. Deferred Tax Assets:
(a) Ordinary:
(1) Discounting of unpaid losses
(2) Unearned premium reserve
(3) Policyholder reserves
(4) Investments
(5) Deferred acquisition costs
(6) Policyholder dividends accrual
(7) Fixed Assets
(8) Compensation and benefits accrual
(9) Pension accrual
(10) Receivables - nonadmitted
(11) Net operating loss carry-forward
(12) Tax credit carry-forward
(13) Other (including items <5% of total ordinary tax assets)
(99) Subtotal
(b) Statutory valuation allowance adjustment
(c) Nonadmitted
(d) Admitted ordinary deferred tax assets (2a99 - 2b - 2c)
(e) Capital:
(1) Investments
(2) Net capital loss carry-forward
(3) Real estate
(4) Other (including items <5% of total ordinary tax assets)
(99) Subtotal
(f) Statutory valuation allowance adjustment
(g) Nonadmitted
(h) Admitted capital deferred tax assets (2e99 - 2f - 2g)
(i) Admitted deferred tax assets (2d + 2h)
3. Deferred Tax Liabilities:
(a) Ordinary:
(1) Investments
(2) Fixed Assets
(3) Deferred and uncollected premium
(4) Policyholder reserves
(5) Other (including items <5% of total ordinary tax liabilities)
(99) Subtotal
(b) Capital:
(1) Investments
(2) Real estate
(3) Other (including items <5% of total capital tax liabilities)
(99) Subtotal
(c) Deferred tax liabilities (3a99 + 3b99)
4. Net deferred tax assets/liabilities (2i - 3c)
The change in net deferred income taxes is comprised of the following, exclusive of non-admitted assets:
Total deferred tax liabilities
Net deferred tax assets (liabilities)
Tax effect of change in unrealized gains (losses)
Change in net deferred income tax
D.
The significant items causing a difference between the statutory federal income tax rate and the Company's effective income tax rate are as follows:
Tax provision at statutory rate
Tax exempt income deduction
Return to provision and other
Total
Federal income taxes incurred
Realized capital gains tax
Change in net deferred income taxes
Total statutory income taxes
(1)As of End of
Current Period
(2)
12/31/2018
(3)(Col. 1 - 2)
Change
$ 200,445 $ 198,889 $ 1,556
$ - $ - $ -
$ 200,445 $ 198,889 $ 1,556
$ 1,183 $ (61,977) $ 63,160
$ - $ - $ -
$ - $ - $ -
$ 201,628 $ 136,912 $ 64,716
$ - $ - $ -
$ - $ - $ -
$ - $ - $ -
$ - $ - $ -
$ - $ - $ -
$ - $ - $ -
$ - $ - $ -
$ - $ - $ -
$ - $ - $ -
$ - $ - $ -
$ - $ - $ -
$ - $ - $ -
$ - $ - $ -
$ - $ - $ -
$ - $ - $ -
$ - $ - $ -
$ - $ - $ -
$ - $ - $ -
$ - $ - $ -
$ - $ - $ -
$ - $ - $ -
$ - $ - $ -
$ - $ - $ -
$ - $ - $ -
$ - $ - $ -
$ - $ - $ -
$ - $ - $ -
$ - $ - $ -
$ - $ - $ -
$ - $ - $ -
$ - $ - $ -
$ - $ - $ -
$ 15,160 $ 14,381 $ 779
$ - $ - $ -
$ - $ - $ -
$ 15,160 $ 14,381 $ 779
$ 15,160 $ 14,381 $ 779
$ (15,160) $ (14,381) $ (779)
(1)As of End of
Current Period
(2)
12/31/2018
(3)(Col. 1 - 2)
Change
$ 15,160 $ 14,381 $ 779
$ (15,160) $ (14,381) $ (779)
$ -
$ (779)
Reconciliation of Federal Income Tax Rate to Actual Effective Tax Rate
As of End of Current Period
Tax Rate
$ 202,663 21.0%
$ (307) 0.0%
$ 51 0.0%
$ 202,407 21.0%
As of End of Current Period
Tax Rate
$ 200,445 20.8%
$ 1,183 0.1%
$ 779 0.1%
$ 202,407 21.0%
14.4

ANNUAL STATEMENT FOR THE YEAR 2019 OF THE HANOVER NEW JERSEY INSURANCE COMPANY
NOTES TO FINANCIAL STATEMENTS
E.
1.
2.
For the tax year 2018:
For the tax year 2019:
3.
F.
1.
440 Lincoln Street Holding Company LLC Hanover Texas Insurance Management Company, Inc.
AIX Holdings, Inc. Massachusetts Bay Insurance Company
AIX, Inc. NOVA American Group, Inc.
AIX Insurance Services of California, Inc. NOVA Casualty Company
AIX Specialty Insurance Company Opus Investment Management, Inc.
Allmerica Financial Alliance Insurance Company Professionals Direct, Inc.
Allmerica Financial Benefit Insurance Company Professionals Direct Insurance Services, Inc.
Allmerica Plus Insurance Agency, Inc. The Hanover American Insurance Company
Campania Holding Company, Inc. The Hanover Atlantic Insurance Company Ltd.
Campmed Casualty & Indemnity Company, Inc. The Hanover Casualty Company
Citizens Insurance Company of America The Hanover Insurance Company
Citizens Insurance Company of Illinois The Hanover Insurance Group, Inc.
Citizens Insurance Company of Ohio The Hanover National Insurance Company
Citizens Insurance Company of the Midwest VeraVest Investments, Inc.
Educators Insurance Agency, Inc. Verlan Fire Insurance Company
Hanover Specialty Insurance Brokers, Inc. Verlan Holdings, Inc.
2.
G.
H. Repatriation Transition Tax (RTT)
I. Alternative Minimum Tax (AMT) Credit
NOTE 10 Information Concerning Parent, Subsidiaries, Affiliates and Other Related Parties
A.
B.
C.
D.
E.
F.
G.
Operating Loss and Tax Credit Carryforwards
At the end of the current reporting period, the Company has no net operating loss carryforwards, no capital loss carryforwards, and no alternative minimum tax credits.
The Company has the following federal income taxes which are available for recoupment in the event of future losses:
$ 206,137
$ 176,539
At the end of the current reporting period, the Company has no deposits under section 6603 of the Internal Revenue Service Code.
Consolidated Federal Income Tax Return
The Company's Federal Income Tax Return is consolidated with the following affiliated companies:
The Board of Directors has delegated to Company Management, the development and maintenance of appropriate Federal Income Tax allocation policies and procedures, which are subject to written agreement between the companies. The Federal Income tax for all subsidiaries in the consolidated return of The Hanover Insurance Group, Inc. (“THG”) is calculated on a separate return basis. Any current tax liability is paid to THG. Tax benefits resulting from taxable operating losses or credits of THG’s subsidiaries are reimbursed to the subsidiary when such losses or credits can be utilized on a consolidated return basis.
The Company has no federal or foreign income tax loss contingencies, for which it is reasonably possible that the total liability will significantly increase within 12 months of the reporting date.
Not applicable
Not applicable
Nature of Relationships
The Company is a wholly-owned subsidiary of The Hanover Insurance Company (“Hanover”) which, in turn, is a wholly-owned subsidiary of Opus Investment Management, Inc. (“Opus”), which, in turn, is a wholly-owned non-insurance subsidiary of THG, a publicly traded company incorporated in Delaware.
Detail of Transactions Greater than 1/2% of Admitted Assets
The Company declared an ordinary dividend to Hanover on June 3, 2019 totaling $800,000, which was settled on June 19, 2019 by transferring bonds at fair value of $771,182, accrued interest of $4,881, and cash in the amount of $23,937. There were net realized gains in the amount of $20,023 as a result of this transaction.
Change in Terms of Intercompany Arrangements
Not applicable
Amounts Due to or from Related Parties
At the end of the current reporting period, the Company reported $3,105 as amounts payable to an affiliated company. These arrangements require that intercompany balances be settled within 30 days.
Guarantees or Contingencies for Related Parties
Not applicable
Management, Service Contracts, Cost Sharing Arrangements
Companies affiliated with Hanover have entered into an intercompany Consolidated Service Agreement. Under the agreement, legal entities will be charged the cost of the service provided or expenses paid by the entity providing the service or paying the expense. In addition, these entities will be charged a portion of the costs associated with activities that are performed for the good of THG legal entities.
Investment related services are provided by Opus pursuant to an intercompany Advisory Agreement.
Nature of Relationships that Could Affect Operations
All outstanding shares of the Company are owned by Hanover.
14.5

ANNUAL STATEMENT FOR THE YEAR 2019 OF THE HANOVER NEW JERSEY INSURANCE COMPANY
NOTES TO FINANCIAL STATEMENTS
H., I., J., K., L., M., N., O.
NOTE 11 Debt
NOTE 12
A., B., C., D., E., F., G., H., I.
NOTE 13 Capital and Surplus, Shareholders’ Dividend Restrictions and Quasi-Reorganizations
(1)
The Company has 10,000 shares of $500 par value common stock authorized and 10,000 shares issued and outstanding.
(2)
Not applicable
(3-6) Dividend Restrictions
(7)
Not applicable
(8)
Not applicable
(9)
Not applicable
(10)Changes in Unassigned Funds
Not applicable
(11)Surplus Notes
Not applicable
(12-13) Quasi Reorganizations
Not applicable
NOTE 14 Liabilities, Contingencies and Assessments
A., B., C., D., E., F.
G. All Other Contingencies
NOTE 15 Leases
The Company has no material lease obligations at this time.
NOTE 16
Not applicable
Not applicable
Retirement Plans, Deferred Compensation, Postemployment Benefits and Compensated Absences and OtherPostretirement Benefit Plans
The labor for the Company is provided and paid for by Hanover. As such, the Company is included in the benefit plans in force for Hanover. Charges for actual salary and benefit costs for services provided to the Company by Hanover employees are ceded 100% pursuant to the Company's Intercompany Reinsurance Agreement.
Not applicable
Outstanding Shares
Dividend Rate of Preferred Stock
Pursuant to New Hampshire’s statute, the maximum dividend and other distributions that an insurer may pay in any twelve-month period, without prior approval of the New Hampshire Insurance Commissioner, is limited to the lesser of 10% of statutory policyholder surplus as of the preceding December 31, or net income. The Company declared an ordinary dividend of $800,000 to Hanover on June 3, 2019. Accordingly, the maximum dividend that may be paid at January 1, 2020 without prior approval is $23,816. Subsequent to June 3, 2020, the maximum dividend payable without prior approval is $823,816.
Mutual Surplus Advances
Company Stock Held for Special Purposes
Changes in Special Surplus Funds
Not applicable
The Company routinely engages in various legal proceedings in the normal course of business, including claims for punitive damages. In the opinion of management, none of such contingencies are expected to have a material effect on the Company’s financial position, although it is possible that the results of operations in a particular quarter or annual period would be materially affected by an adverse development or unfavorable outcome.
Information About Financial Instruments With Off-Balance Sheet Risk and Financial Instruments With Concentrations ofCredit Risk
Not applicable
14.6

ANNUAL STATEMENT FOR THE YEAR 2019 OF THE HANOVER NEW JERSEY INSURANCE COMPANY
NOTES TO FINANCIAL STATEMENTS
NOTE 17 Sale, Transfer and Servicing of Financial Assets and Extinguishments of Liabilities
A., B.
Not applicable
C. Wash Sales
NOTE 18 Gain or Loss to the Reporting Entity from Uninsured Plans and the Uninsured Portion of Partially Insured Plans
Not applicable
NOTE 19 Direct Premium Written/Produced by Managing General Agents/Third Party Administrators
Not applicable
NOTE 20 Fair Value Measurements
A.
(1) Fair Value Measurements at Reporting Date
a. There were no assets carried at fair value at the end of the reporting period.
b. The Company does not have any liabilities measured at fair value at the end of the current reporting period.
(2) The Company does not have any Level 3 assets or liabilities measured at fair value at the end of the reporting period.
(3)
(4)
•
•
•
•
•
•
•
•
Generally, all prices provided by the pricing service, except actively traded securities with quoted market prices, are reported as Level 2.
(5)
B.
The Company generally does not sell and reacquire securities within 30 days of the sale date. There were no wash sale transactions with a NAIC designation of 3 or below in the current year.
The reporting entity's policy is to recognize transfers in and transfers out as of the actual date of the event or change in circumstances that caused the transfer.
For fair value measurements categorized within Level 2 of the fair value hierarchy, fair values of bonds are obtained by a quoted market price if available, otherwise, fair values are estimated using independent pricing sources or internally developed pricing models using discounted cash flow analyses.
The Company utilizes a third party pricing service for the valuation of the majority of its fixed maturity securities and receives one quote per security. When quoted market prices in an active market are available, they are provided by the pricing service as the fair value and such values are classified as Level 1. Since fixed maturities other than U.S. Treasury securities generally do not trade on a daily basis, the pricing service prepares estimates of fair value for those securities using pricing applications based on a market approach. Inputs into the fair value pricing applications which are common to all asset classes include benchmark U.S. Treasury security yield curves, reported trades of identical or similar fixed maturity securities, broker/dealer quotes of identical or similar fixed maturity securities and structural characteristics of the security, such as maturity date, coupon, mandatory principal payment dates, frequency of interest and principal payments and optional principal redemption features. Inputs into the fair value applications that are unique by asset class include, but are not limited to:
U.S. government – determination of direct versus indirect government support and whether any contingencies exist with respect to the timely payment of principal and interest.
All other governments – estimates of appropriate market spread versus underlying related sovereign treasury curves dependent on liquidity and direct or contingent support.
Corporate bonds, which are included in Industrial and miscellaneous bonds - overall credit quality, including assessments of the level and variability of: economic sensitivity; liquidity; corporate financial policies; management quality; regulatory environment; competitive position; ownership; restrictive covenants; and security or collateral.
Municipal bonds, which are included in States, territories and possessions; Political subdivisions of states, territories and possessions; and Special revenue and special assessment obligations - overall credit quality, including assessments of the level and variability of: sources of payment such as income, sales or property taxes, levies or user fees; credit support such as insurance; state or local economic and political base; natural resource availability; and susceptibility to natural or man-made catastrophic events such as hurricanes, earthquakes or acts of terrorism.
Residential mortgage-backed securities, U.S. agency pass-thrus and collateralized mortgage obligations (“CMOs”) which are included in U.S. governments and Special revenue and special assessment obligations - estimates of prepayment speeds based upon: historical prepayment rate trends; underlying collateral interest rates; geographic concentration; vintage year; borrower credit quality characteristics; interest rate and yield curve forecasts; government or monetary authority support programs; tax policies; and delinquency/default trends.
Residential mortgage-backed securities, non-agency CMOs, which are included in Industrial and miscellaneous - estimates of prepayment speeds based upon: historical prepayment rate trends; underlying collateral interest rates; geographic concentration; vintage year; borrower credit quality characteristics; interest rate and yield curve forecasts; government or monetary authority support programs; tax policies; delinquency/default trends; and severity of loss upon default and length of time to recover proceeds following default.
Commercial mortgage-backed securities, which are included in Industrial and miscellaneous bonds - overall credit quality, including assessments of the value and supply/demand characteristics of: collateral type such as office, retail, residential, lodging, or other; geographic concentration by region, state, metropolitan statistical area and locale; vintage year; historical collateral performance including defeasance, delinquency, default and special servicer trends; and capital structure support features.
Asset-backed securities, which are included in Industrial and miscellaneous bonds – overall credit quality, including assessments of the underlying collateral type such as credit card receivables, auto loan receivables and equipment lease receivables; geographic diversification; vintage year; historical collateral performance including delinquency, default and casualty trends; economic conditions influencing use rates and resale values; and contract structural support features.
The Company holds privately placed corporate bonds and certain other bonds that do not have an active market and for which the pricing service cannot provide fair values. The Company determines fair values for these securities using either matrix pricing or broker quotes. The Company will use observable market data to the extent it is available, but is also required to use a certain amount of unobservable judgment due to the illiquid nature of the securities involved. Additionally, the Company may obtain nonbinding broker quotes which are reported as Level 3.
Not applicable
Not applicable
14.7

ANNUAL STATEMENT FOR THE YEAR 2019 OF THE HANOVER NEW JERSEY INSURANCE COMPANY
NOTES TO FINANCIAL STATEMENTS
C. Aggregate fair value for all financial instruments and the level within the fair value hierarchy in which the fair value measurements in their entirety fall.
D., E.
NOTE 21 Other Items
A. Unusual or Infrequent Items
B. Troubled Debt Restructuring: Debtors
C. Other Disclosures
D. Business Interruption Insurance Recoveries
E. State Transferable and Non-transferable Tax Credits
F. Subprime Mortgage Related Risk Exposure
G. Insurance-Linked Securities (ILS) Contracts
H.
NOTE 22 Events Subsequent
NOTE 23 Reinsurance
Not applicable
NOTE 24 Retrospectively Rated Contracts & Contracts Subject to Redetermination
NOTE 25 Change in Incurred Losses and Loss Adjustment Expenses
NOTE 26 Intercompany Pooling Arrangements
NOTE 27 Structured Settlements
NOTE 28 Health Care Receivables
NOTE 29 Participating Policies
Type of Financial Instrument
AggregateFair Value Admitted Assets (Level 1) (Level 2) (Level 3)
Net Asset Value (NAV)
Not Practicable (Carrying Value)
Bonds $ 27,972,406 $ 27,035,930 $ 2,471,506 $ 25,500,900 $ - $ - $ -
Cash and Short-Term Investments $ 3,786,504 $ 3,786,504 $ 3,786,504 $ - $ - $ - $ -
Not applicable
Not applicable
Not applicable
IBNR loss and loss adjustment expense reserves are allocated to the Company based on the proportion of the Company’s earned premiums and case loss reserves relative to other affiliates in the Hanover Insurance Group. Fluctuations by affiliate and state may occur as a result of this re-estimation process.
The Company elected to use rounding to the nearest dollar in reporting amounts in the Statement, except as otherwise directed by instructions.
Not applicable
Not applicable
The Company has reviewed its investments in mortgage-backed securities and has determined that these investments are not subprime.
Not applicable
The Amount That Could Be Realized on Life Insurance Where the Reporting Entity is Owner and Beneficiary or Has Otherwise Obtained Rights to Controlthe Policy
Not applicable
Not applicable
Not applicable
Not applicable
Not applicable
Not applicable
Not applicable
Not applicable
14.8

ANNUAL STATEMENT FOR THE YEAR 2019 OF THE HANOVER NEW JERSEY INSURANCE COMPANY
NOTES TO FINANCIAL STATEMENTS
NOTE 30 Premium Deficiency Reserves
1. Liability carried for premium deficiency reserves
2. Date of the most recent evaluation of this liability
3. Was anticipated investment income utilized in the calculation?
NOTE 31 High Deductibles
NOTE 32 Discounting of Liabilities for Unpaid Losses or Unpaid Loss Adjustment Expenses
NOTE 33 Asbestos/Environmental Reserves
NOTE 34 Subscriber Savings Accounts
NOTE 35 Multiple Peril Crop Insurance
NOTE 36 Financial Guaranty Insurance
$ -
12/31/2019
Yes [X] No [ ]
Not applicable
Not applicable
Not applicable
Not applicable
Not applicable
Not applicable
14.9

ANNUAL STATEMENT FOR THE YEAR 2019 OF THE HANOVER NEW JERSEY INSURANCE COMPANY
GENERAL INTERROGATORIES
PART 1 - COMMON INTERROGATORIESGENERAL
1.1 Is the reporting entity a member of an Insurance Holding Company System consisting of two or more affiliated persons, one or more of which is an insurer? Yes [ X ] No [ ]If yes, complete Schedule Y, Parts 1, 1A and 2
1.2 If yes, did the reporting entity register and file with its domiciliary State Insurance Commissioner, Director or Superintendent, or with such regulatory official of the state of domicile of the principal insurer in the Holding Company System, a registration statement providing disclosure substantially similar to the standards adopted by the National Association of Insurance Commissioners (NAIC) in its Model Insurance Holding Company System Regulatory Act and model regulations pertaining thereto, or is the reporting entity subject to standards and disclosure requirements substantially similar to those required by such Act and regulations? Yes [ X ] No [ ] N/A [ ]
1.3 State Regulating? New Hampshire
1.4 Is the reporting entity publicly traded or a member of a publicly traded group? Yes [ X ] No [ ]
1.5 If the response to 1.4 is yes, provide the CIK (Central Index Key) code issued by the SEC for the entity/group. 0000944695
2.1 Has any change been made during the year of this statement in the charter, by-laws, articles of incorporation, or deed of settlement of the reporting entity? Yes [ ] No [ X ]
2.2 If yes, date of change:
3.1 State as of what date the latest financial examination of the reporting entity was made or is being made. 12/31/2019
3.2 State the as of date that the latest financial examination report became available from either the state of domicile or the reporting entity. This date should be the date of the examined balance sheet and not the date the report was completed or released. 12/31/2014
3.3 State as of what date the latest financial examination report became available to other states or the public from either the state of domicile or the reporting entity. This is the release date or completion date of the examination report and not the date of the examination (balance sheet date). 02/03/2016
3.4 By what department or departments?
New Hampshire Department of Insurance
3.5 Have all financial statement adjustments within the latest financial examination report been accounted for in a subsequent financial statement filed with Departments? Yes [ ] No [ ] N/A [ X ]
3.6 Have all of the recommendations within the latest financial examination report been complied with? Yes [ ] No [ ] N/A [ X ]
4.1 During the period covered by this statement, did any agent, broker, sales representative, non-affiliated sales/service organization or any combination thereof under common control (other than salaried employees of the reporting entity), receive credit or commissions for or control a substantial part (more than 20 percent of any major line of business measured on direct premiums) of:
4.11 sales of new business? Yes [ ] No [ X ]4.12 renewals? Yes [ ] No [ X ]
4.2 During the period covered by this statement, did any sales/service organization owned in whole or in part by the reporting entity or an affiliate, receive credit or commissions for or control a substantial part (more than 20 percent of any major line of business measured on direct premiums) of:
4.21 sales of new business? Yes [ ] No [ X ]4.22 renewals? Yes [ ] No [ X ]
5.1 Has the reporting entity been a party to a merger or consolidation during the period covered by this statement? Yes [ ] No [ X ]If yes, complete and file the merger history data file with the NAIC.
5.2 If yes, provide the name of the entity, NAIC Company Code, and state of domicile (use two letter state abbreviation) for any entity that has ceased to exist as a result of the merger or consolidation.
1Name of Entity
2NAIC Company Code
3State of Domicile
6.1 Has the reporting entity had any Certificates of Authority, licenses or registrations (including corporate registration, if applicable) suspended or revoked by any governmental entity during the reporting period? Yes [ ] No [ X ]
6.2 If yes, give full information:
7.1 Does any foreign (non-United States) person or entity directly or indirectly control 10% or more of the reporting entity? Yes [ ] No [ X ]
7.2 If yes,
7.21 State the percentage of foreign control; 0.0 %7.22 State the nationality(s) of the foreign person(s) or entity(s) or if the entity is a mutual or reciprocal, the nationality of its manager or
attorney-in-fact; and identify the type of entity(s) (e.g., individual, corporation or government, manager or attorney in fact).
1Nationality
2Type of Entity
15

ANNUAL STATEMENT FOR THE YEAR 2019 OF THE HANOVER NEW JERSEY INSURANCE COMPANY
GENERAL INTERROGATORIES
8.1 Is the company a subsidiary of a bank holding company regulated by the Federal Reserve Board? Yes [ ] No [ X ]8.2 If response to 8.1 is yes, please identify the name of the bank holding company.
8.3 Is the company affiliated with one or more banks, thrifts or securities firms? Yes [ X ] No [ ]8.4 If response to 8.3 is yes, please provide below the names and location (city and state of the main office) of any affiliates regulated by a federal
regulatory services agency [i.e. the Federal Reserve Board (FRB), the Office of the Comptroller of the Currency (OCC), the Federal Deposit Insurance Corporation (FDIC) and the Securities Exchange Commission (SEC)] and identify the affiliate's primary federal regulator.
1Affiliate Name
2Location (City, State)
3FRB
4OCC
5FDIC
6SEC
Opus Investment Management, Inc. Worcester, MA YES
9. What is the name and address of the independent certified public accountant or accounting firm retained to conduct the annual audit?
PricewaterhouseCoopers LLP, 101 Seaport Boulevard, Suite 500, Boston, MA 02210
10.1 Has the insurer been granted any exemptions to the prohibited non-audit services provided by the certified independent public accountant requirements as allowed in Section 7H of the Annual Financial Reporting Model Regulation (Model Audit Rule), or substantially similar state law or regulation? Yes [ ] No [ X ]
10.2 If the response to 10.1 is yes, provide information related to this exemption:
10.3 Has the insurer been granted any exemptions related to the other requirements of the Annual Financial Reporting Model Regulation as allowed for in Section 18A of the Model Regulation, or substantially similar state law or regulation? Yes [ ] No [ X ]
10.4 If the response to 10.3 is yes, provide information related to this exemption:
10.5 Has the reporting entity established an Audit Committee in compliance with the domiciliary state insurance laws? Yes [ X ] No [ ] N/A [ ]
10.6 If the response to 10.5 is no or n/a, please explain
11. What is the name, address and affiliation (officer/employee of the reporting entity or actuary/consultant associated with an actuarial consulting firm) of the individual providing the statement of actuarial opinion/certification?
Jonathan Blake, Vice President and Lead Reserving Actuary, FCAS, MAAA, 440 Lincoln Street, Worcester, MA 01653
12.1 Does the reporting entity own any securities of a real estate holding company or otherwise hold real estate indirectly? Yes [ ] No [ X ]
12.11 Name of real estate holding company
12.12 Number of parcels involved 0
12.13 Total book/adjusted carrying value $ 0
12.2 If, yes provide explanation:
13. FOR UNITED STATES BRANCHES OF ALIEN REPORTING ENTITIES ONLY:
13.1 What changes have been made during the year in the United States manager or the United States trustees of the reporting entity?
13.2 Does this statement contain all business transacted for the reporting entity through its United States Branch on risks wherever located? Yes [ ] No [ ]
13.3 Have there been any changes made to any of the trust indentures during the year? Yes [ ] No [ ]
13.4 If answer to (13.3) is yes, has the domiciliary or entry state approved the changes? Yes [ ] No [ ] N/A [ ]
14.1 Are the senior officers (principal executive officer, principal financial officer, principal accounting officer or controller, or persons performing similar functions) of the reporting entity subject to a code of ethics, which includes the following standards? Yes [ X ] No [ ]
a. Honest and ethical conduct, including the ethical handling of actual or apparent conflicts of interest between personal and professional relationships;
b. Full, fair, accurate, timely and understandable disclosure in the periodic reports required to be filed by the reporting entity;
c. Compliance with applicable governmental laws, rules and regulations;
d. The prompt internal reporting of violations to an appropriate person or persons identified in the code; and
e. Accountability for adherence to the code.
14.11 If the response to 14.1 is No, please explain:
14.2 Has the code of ethics for senior managers been amended? Yes [ X ] No [ ]
14.21 If the response to 14.2 is yes, provide information related to amendment(s).
The Hanover's Code of Conduct has been amended to remove references related to companies that are no longer with the group. The only other substantive updates were enhanced provisions about the company's inclusion and diversity efforts as well as workplace conduct and employee safety matters. The Code continues to be applicable to all directors, officers, senior financial officers, and employees, each of whom is accountable for adherence to the Code.
14.3 Have any provisions of the code of ethics been waived for any of the specified officers? Yes [ ] No [ X ]
14.31 If the response to 14.3 is yes, provide the nature of any waiver(s).
15.1

ANNUAL STATEMENT FOR THE YEAR 2019 OF THE HANOVER NEW JERSEY INSURANCE COMPANY
GENERAL INTERROGATORIES
15.1 Is the reporting entity the beneficiary of a Letter of Credit that is unrelated to reinsurance where the issuing or confirming bank is not on the SVO Bank List? Yes [ ] No [ X ]
15.2 If the response to 15.1 is yes, indicate the American Bankers Association (ABA) Routing Number and the name of the issuing or confirming bank of the Letter of Credit and describe the circumstances in which the Letter of Credit is triggered.
1American Bankers
Association (ABA) Routing
Number
2
Issuing or Confirming Bank Name
3
Circumstances That Can Trigger the Letter of Credit
4
Amount
0
BOARD OF DIRECTORS16. Is the purchase or sale of all investments of the reporting entity passed upon either by the board of directors or a subordinate committee
thereof? Yes [ X ] No [ ]
17. Does the reporting entity keep a complete permanent record of the proceedings of its board of directors and all subordinate committees thereof? Yes [ X ] No [ ]
18. Has the reporting entity an established procedure for disclosure to its board of directors or trustees of any material interest or affiliation on the part of any of its officers, directors, trustees or responsible employees that is in conflict with the official duties of such person? Yes [ X ] No [ ]
FINANCIAL19. Has this statement been prepared using a basis of accounting other than Statutory Accounting Principles (e.g., Generally Accepted
Accounting Principles)? Yes [ ] No [ X ]
20.1 Total amount loaned during the year (inclusive of Separate Accounts, exclusive of policy loans): 20.11 To directors or other officers $ 0
20.12 To stockholders not officers $ 0
20.13 Trustees, supreme or grand
(Fraternal Only) $ 0
20.2 Total amount of loans outstanding at the end of year (inclusive of Separate Accounts, exclusive of policy loans): 20.21 To directors or other officers $ 0
20.22 To stockholders not officers $ 0
20.23 Trustees, supreme or grand
(Fraternal Only) $ 0
21.1 Were any assets reported in this statement subject to a contractual obligation to transfer to another party without the liability for such obligation being reported in the statement? Yes [ ] No [ X ]
21.2 If yes, state the amount thereof at December 31 of the current year: 21.21 Rented from others $ 0
21.22 Borrowed from others $ 0
21.23 Leased from others $ 0
21.24 Other $ 0
22.1 Does this statement include payments for assessments as described in the Annual Statement Instructions other than guaranty fund or guaranty association assessments? Yes [ ] No [ X ]
22.2 If answer is yes: 22.21 Amount paid as losses or risk adjustment $ 0
22.22 Amount paid as expenses $ 0
22.23 Other amounts paid $ 0
23.1 Does the reporting entity report any amounts due from parent, subsidiaries or affiliates on Page 2 of this statement? Yes [ ] No [ X ]
23.2 If yes, indicate any amounts receivable from parent included in the Page 2 amount: $ 0
INVESTMENT
24.01 Were all the stocks, bonds and other securities owned December 31 of current year, over which the reporting entity has exclusive control, in the actual possession of the reporting entity on said date? (other than securities lending programs addressed in 24.03) Yes [ X ] No [ ]
24.02 If no, give full and complete information relating thereto
24.03 For security lending programs, provide a description of the program including value for collateral and amount of loaned securities, and whether collateral is carried on or off-balance sheet. (an alternative is to reference Note 17 where this information is also provided)
24.04 Does the Company's security lending program meet the requirements for a conforming program as outlined in the Risk-Based Capital Instructions? Yes [ ] No [ ] N/A [ X ]
24.05 If answer to 24.04 is yes, report amount of collateral for conforming programs. $ 0
24.06 If answer to 24.04 is no, report amount of collateral for other programs. $ 0
24.07 Does your securities lending program require 102% (domestic securities) and 105% (foreign securities) from the counterparty at the outset of the contract? Yes [ ] No [ ] N/A [ X ]
24.08 Does the reporting entity non-admit when the collateral received from the counterparty falls below 100%? Yes [ ] No [ ] N/A [ X ]
24.09 Does the reporting entity or the reporting entity ’s securities lending agent utilize the Master Securities lending Agreement (MSLA) to conduct securities lending? Yes [ ] No [ ] N/A [ X ]
15.2

ANNUAL STATEMENT FOR THE YEAR 2019 OF THE HANOVER NEW JERSEY INSURANCE COMPANY
GENERAL INTERROGATORIES
24.10 For the reporting entity’s security lending program state the amount of the following as December 31 of the current year:
24.101 Total fair value of reinvested collateral assets reported on Schedule DL, Parts 1 and 2. $ 0
24.102 Total book adjusted/carrying value of reinvested collateral assets reported on Schedule DL, Parts 1 and 2 $ 0
24.103 Total payable for securities lending reported on the liability page. $ 0
25.1 Were any of the stocks, bonds or other assets of the reporting entity owned at December 31 of the current year not exclusively under the control of the reporting entity, or has the reporting entity sold or transferred any assets subject to a put option contract that is currently in force? (Exclude securities subject to Interrogatory 21.1 and 24.03). Yes [ X ] No [ ]
25.2 If yes, state the amount thereof at December 31 of the current year: 25.21 Subject to repurchase agreements $ 0
25.22 Subject to reverse repurchase agreements $ 0
25.23 Subject to dollar repurchase agreements $ 0
25.24 Subject to reverse dollar repurchase agreements $ 0
25.25 Placed under option agreements $ 0 25.26 Letter stock or securities restricted as to sale -
excluding FHLB Capital Stock $ 0
25.27 FHLB Capital Stock $ 0
25.28 On deposit with states $ 104,260
25.29 On deposit with other regulatory bodies $ 0 25.30 Pledged as collateral - excluding collateral pledged to
an FHLB $ 0 25.31 Pledged as collateral to FHLB - including assets
backing funding agreements $ 0
25.32 Other $ 0
25.3 For category (25.26) provide the following:
1Nature of Restriction
2Description
3Amount
0
26.1 Does the reporting entity have any hedging transactions reported on Schedule DB? Yes [ ] No [ X ]
26.2 If yes, has a comprehensive description of the hedging program been made available to the domiciliary state? Yes [ ] No [ ] N/A [ X ]If no, attach a description with this statement.
LINES 26.3 through 26.5: FOR LIFE/FRATERNAL REPORTING ENTITIES ONLY:
26.3 Does the reporting entity utilize derivatives to hedge variable annuity guarantees subject to fluctuations as a result of interest rate sensitivity? Yes [ ] No [ ]
26.4 If the response to 26.3 is YES, does the reporting entity utilize:26.41 Special accounting provision of SSAP No. 108 Yes [ ] No [ ]26.42 Permitted accounting practice Yes [ ] No [ ]26.43 Other accounting guidance Yes [ ] No [ ]
26.5 By responding YES to 26.41 regarding utilizing the special accounting provisions of SSAP No. 108, the reporting entity attests to the following: Yes [ ] No [ ]
The reporting entity has obtained explicit approval from the domiciliary state.•
Hedging strategy subject to the special accounting provisions is consistent with the requirements of VM-21.•
Actuarial certification has been obtained which indicates that the hedging strategy is incorporated within the establishment of VM-21 •
reserves and provides the impact of the hedging strategy within the Actuarial Guideline Conditional Tail Expectation Amount.Financial Officer Certification has been obtained which indicates that the hedging strategy meets the definition of a Clearly Defined •
Hedging Strategy within VM-21 and that the Clearly Defined Hedging Strategy is the hedging strategy being used by the company in its actual day-to-day risk mitigation efforts.
27.1 Were any preferred stocks or bonds owned as of December 31 of the current year mandatorily convertible into equity, or, at the option of the issuer, convertible into equity? Yes [ ] No [ X ]
27.2 If yes, state the amount thereof at December 31 of the current year. $ 0
28. Excluding items in Schedule E - Part 3 - Special Deposits, real estate, mortgage loans and investments held physically in the reporting entity's offices, vaults or safety deposit boxes, were all stocks, bonds and other securities, owned throughout the current year held pursuant to a custodial agreement with a qualified bank or trust company in accordance with Section 1, III - General Examination Considerations, F. Outsourcing of Critical Functions, Custodial or Safekeeping Agreements of the NAIC Financial Condition Examiners Handbook? Yes [ X ] No [ ]
28.01 For agreements that comply with the requirements of the NAIC Financial Condition Examiners Handbook, complete the following:
1Name of Custodian(s)
2Custodian's Address
Bank of New York Mellon 225 Liberty Street, New York, NY 10286
15.3

ANNUAL STATEMENT FOR THE YEAR 2019 OF THE HANOVER NEW JERSEY INSURANCE COMPANY
GENERAL INTERROGATORIES
28.02 For all agreements that do not comply with the requirements of the NAIC Financial Condition Examiners Handbook, provide the name, location and a complete explanation:
1Name(s)
2Location(s)
3Complete Explanation(s)
28.03 Have there been any changes, including name changes, in the custodian(s) identified in 28.01 during the current year? Yes [ ] No [ X ]
28.04 If yes, give full and complete information relating thereto:
1Old Custodian
2New Custodian
3Date of Change
4Reason
28.05 Investment management – Identify all investment advisors, investment managers, broker/dealers, including individuals that have the authority to make investment decisions on behalf of the reporting entity. For assets that are managed internally by employees of the reporting entity, note as such. ["…that have access to the investment accounts"; "…handle securities"]
1Name of Firm or Individual
2Affiliation
Opus Investment Management, Inc. A
28.0597 For those firms/individuals listed in the table for Question 28.05, do any firms/individuals unaffiliated with the reporting entity (i.e. designated with a "U") manage more than 10% of the reporting entity’s invested assets? Yes [ ] No [ ]
28.0598 For firms/individuals unaffiliated with the reporting entity (i.e. designated with a "U") listed in the table for Question 28.05, does the total assets under management aggregate to more than 50% of the reporting entity’s invested assets? Yes [ ] No [ ]
28.06 For those firms or individuals listed in the table for 28.05 with an affiliation code of "A" (affiliated) or "U" (unaffiliated), provide the information for the table below.
1
Central Registration Depository Number
2
Name of Firm or Individual
3
Legal Entity Identifier (LEI)
4
Registered With
5Investment
Management Agreement (IMA) Filed
107569 Opus Investment Management, Inc.
Securities Exchange
Commission DS
29.1 Does the reporting entity have any diversified mutual funds reported in Schedule D, Part 2 (diversified according to the Securities and Exchange Commission (SEC) in the Investment Company Act of 1940 [Section 5(b)(1)])? Yes [ ] No [ X ]
29.2 If yes, complete the following schedule:
1
CUSIP #
2
Name of Mutual Fund
3Book/Adjusted Carrying Value
0 29.2999 - Total 0
29.3 For each mutual fund listed in the table above, complete the following schedule:
1
Name of Mutual Fund (from above table)
2
Name of Significant Holding of theMutual Fund
3Amount of Mutual
Fund's Book/Adjusted Carrying Value
Attributable to the Holding
4
Date of Valuation
0
15.4

ANNUAL STATEMENT FOR THE YEAR 2019 OF THE HANOVER NEW JERSEY INSURANCE COMPANY
GENERAL INTERROGATORIES
30. Provide the following information for all short-term and long-term bonds and all preferred stocks. Do not substitute amortized value or statement value for fair value.
1
Statement (Admitted) Value
2
Fair Value
3Excess of Statement over Fair Value (-), or
Fair Value over Statement (+)
30.1 Bonds 30,784,641 31,721,117 936,476
30.2 Preferred stocks 0 0 0
30.3 Totals 30,784,641 31,721,117 936,476
30.4 Describe the sources or methods utilized in determining the fair values:
Fair values are obtained by a quoted market price if available, otherwise, fair values are estimated using independent pricing sources or internally developed pricing models using discounted cash flow analysis.
31.1 Was the rate used to calculate fair value determined by a broker or custodian for any of the securities in Schedule D? Yes [ ] No [ X ]
31.2 If the answer to 31.1 is yes, does the reporting entity have a copy of the broker’s or custodian’s pricing policy (hard copy or electronic copy) for all brokers or custodians used as a pricing source? Yes [ ] No [ ]
31.3 If the answer to 31.2 is no, describe the reporting entity’s process for determining a reliable pricing source for purposes of disclosure of fair value for Schedule D:
32.1 Have all the filing requirements of the Purposes and Procedures Manual of the NAIC Investment Analysis Office been followed? Yes [ X ] No [ ]
32.2 If no, list exceptions:
33. By self-designating 5GI securities, the reporting entity is certifying the following elements of each self-designated 5GI security:
a. Documentation necessary to permit a full credit analysis of the security does not exist or an NAIC CRP credit rating for an FE or PL security is not available.
b. Issuer or obligor is current on all contracted interest and principal payments.
c. The insurer has an actual expectation of ultimate payment of all contracted interest and principal.
Has the reporting entity self-designated 5GI securities? Yes [ ] No [ X ]
34. By self-designating PLGI securities, the reporting entity is certifying the following elements of each self-designated PLGI security:
a. The security was purchased prior to January 1, 2018.
b. The reporting entity is holding capital commensurate with the NAIC Designation reported for the security.
c. The NAIC Designation was derived from the credit rating assigned by an NAIC CRP in its legal capacity as a NRSRO which is shown on a current private letter rating held by the insurer and available for examination by state insurance regulators.
d. The reporting entity is not permitted to share this credit rating of the PL security with the SVO.
Has the reporting entity self-designated PLGI securities? Yes [ ] No [ X ]
35. By assigning FE to a Schedule BA non-registered private fund, the reporting entity is certifying the following elements of each self-designated FE fund:
a. The shares were purchased prior to January 1, 2019.
b. The reporting entity is holding capital commensurate with the NAIC Designation reported for the security.
c. The security had a public credit rating(s) with annual surveillance assigned by an NAIC CRP in its legal capacity as an NRSRO prior to January 1, 2019.
d. The fund only or predominantly holds bonds in its portfolio.
e. The current reported NAIC Designation was derived from the public credit rating(s) with annual surveillance assigned by an NAIC CRP in its legal capacity as an NRSRO.
f. The public credit rating(s) with annual surveillance assigned by an NAIC CRP has not lapsed.
Has the reporting entity assigned FE to Schedule BA non-registered private funds that complied with the above criteria? Yes [ ] No [ X ]
OTHER
36.1 Amount of payments to trade associations, service organizations and statistical or rating bureaus, if any? $ 0
36.2 List the name of the organization and the amount paid if any such payment represented 25% or more of the total payments to trade associations, service organizations and statistical or rating bureaus during the period covered by this statement.
1Name
2Amount Paid
0
15.5

ANNUAL STATEMENT FOR THE YEAR 2019 OF THE HANOVER NEW JERSEY INSURANCE COMPANY
GENERAL INTERROGATORIES
37.1 Amount of payments for legal expenses, if any? $ 0
37.2 List the name of the firm and the amount paid if any such payment represented 25% or more of the total payments for legal expenses during the period covered by this statement.
1Name
2Amount Paid
0
38.1 Amount of payments for expenditures in connection with matters before legislative bodies, officers or departments of government, if any? $ 0
38.2 List the name of the firm and the amount paid if any such payment represented 25% or more of the total payment expenditures in connection with matters before legislative bodies, officers or departments of government during the period covered by this statement.
1Name
2Amount Paid
0
15.6

ANNUAL STATEMENT FOR THE YEAR 2019 OF THE HANOVER NEW JERSEY INSURANCE COMPANY
GENERAL INTERROGATORIES
PART 2 - PROPERTY AND CASUALTY INTERROGATORIES
1.1 Does the reporting entity have any direct Medicare Supplement Insurance in force? Yes [ ] No [ X ]
1.2 If yes, indicate premium earned on U. S. business only. $ 0
1.3 What portion of Item (1.2) is not reported on the Medicare Supplement Insurance Experience Exhibit? $ 0
1.31 Reason for excluding
1.4 Indicate amount of earned premium attributable to Canadian and/or Other Alien not included in Item (1.2) above. $ 0
1.5 Indicate total incurred claims on all Medicare Supplement Insurance. $ 0
1.6 Individual policies: Most current three years:
1.61 Total premium earned $ 0
1.62 Total incurred claims $ 0
1.63 Number of covered lives 0
All years prior to most current three years
1.64 Total premium earned $ 0
1.65 Total incurred claims $ 0
1.66 Number of covered lives 0
1.7 Group policies: Most current three years:
1.71 Total premium earned $ 0
1.72 Total incurred claims $ 0
1.73 Number of covered lives 0
All years prior to most current three years
1.74 Total premium earned $ 0
1.75 Total incurred claims $ 0
1.76 Number of covered lives 0
2. Health Test:
1Current Year
2Prior Year
2.1 Premium Numerator 0 0
2.2 Premium Denominator 0 0
2.3 Premium Ratio (2.1/2.2) 0.000 0.000
2.4 Reserve Numerator 0 0
2.5 Reserve Denominator 0 0
2.6 Reserve Ratio (2.4/2.5) 0.000 0.000
3.1 Does the reporting entity issue both participating and non-participating policies? Yes [ ] No [ X ]
3.2 If yes, state the amount of calendar year premiums written on:
3.21 Participating policies $ 0
3.22 Non-participating policies $ 0
4. For mutual reporting Entities and Reciprocal Exchanges Only:
4.1 Does the reporting entity issue assessable policies? Yes [ ] No [ ]
4.2 Does the reporting entity issue non-assessable policies? Yes [ ] No [ ]
4.3 If assessable policies are issued, what is the extent of the contingent liability of the policyholders? % 0.0
4.4 Total amount of assessments paid or ordered to be paid during the year on deposit notes or contingent premiums. $ 0
5. For Reciprocal Exchanges Only:
5.1 Does the Exchange appoint local agents? Yes [ ] No [ ]
5.2 If yes, is the commission paid:
5.21 Out of Attorney's-in-fact compensation Yes [ ] No [ ] N/A [ ]
5.22 As a direct expense of the exchange Yes [ ] No [ ] N/A [ ]
5.3 What expenses of the Exchange are not paid out of the compensation of the Attorney-in-fact?
5.4 Has any Attorney-in-fact compensation, contingent on fulfillment of certain conditions, been deferred? Yes [ ] No [ ]
5.5 If yes, give full information
16

ANNUAL STATEMENT FOR THE YEAR 2019 OF THE HANOVER NEW JERSEY INSURANCE COMPANY
GENERAL INTERROGATORIES
PART 2 - PROPERTY AND CASUALTY INTERROGATORIES
6.1 What provision has this reporting entity made to protect itself from an excessive loss in the event of a catastrophe under a workers’ compensation contract issued without limit of loss?Not applicable. The Company does not write worker's compensation coverage.
6.2 Describe the method used to estimate this reporting entity’s probable maximum insurance loss, and identify the type of insured exposures comprising that probable maximum loss, the locations of concentrations of those exposures and the external resources (such as consulting firms or computer software models), if any, used in the estimation process.The Company uses multiple models including RMS v18.1 and AIR Touchstone v5 Catastrophe Modeling software packages to estimate the Company's probable maximum loss. These exposures are a combination of personal and commercial property risks.
6.3 What provision has this reporting entity made (such as a catastrophic reinsurance program) to protect itself from an excessive loss arising from the types and concentrations of insured exposures comprising its probable maximum property insurance loss? The Company cedes 100% to Hanover. Hanover purchases catastrophe reinsurance in the amount of $900 million excess $200 million for all perils to protect itself, along with a top-and-agg ($75 million excess of $300 million aggregate layer, and $75 million excess of $1.1 billion occurrence layer) effective 07/01/2019.
6.4 Does the reporting entity carry catastrophe reinsurance protection for at least one reinstatement, in an amount sufficient to cover its estimated probable maximum loss attributable to a single loss event or occurrence? Yes [ ] No [ X ]
6.5 If no, describe any arrangements or mechanisms employed by the reporting entity to supplement its catastrophe reinsurance program or to hedge its exposure to unreinsured catastrophic loss.The Company cedes 100% of its business to Hanover.
7.1 Has this reporting entity reinsured any risk with any other entity under a quota share reinsurance contract that includes a provision that would limit the reinsurer's losses below the stated quota share percentage (e.g., a deductible, a loss ratio corridor, a loss ratio cap, an aggregate limit or any similar provisions)? Yes [ ] No [ X ]
7.2 If yes, indicate the number of reinsurance contracts containing such provisions: 0
7.3 If yes, does the amount of reinsurance credit taken reflect the reduction in quota share coverage caused by any applicable limiting provision(s)? Yes [ ] No [ ]
8.1 Has this reporting entity reinsured any risk with any other entity and agreed to release such entity from liability, in whole or in part, from any loss that may occur on this risk, or portion thereof, reinsured? Yes [ ] No [ X ]
8.2 If yes, give full information
9.1 Has the reporting entity ceded any risk under any reinsurance contract (or under multiple contracts with the same reinsurer or its affiliates) for which during the period covered by the statement: (i) it recorded a positive or negative underwriting result greater than 5% of prior year-end surplus as regards policyholders or it reported calendar year written premium ceded or year-end loss and loss expense reserves ceded greater than 5% of prior year-end surplus as regards policyholders; (ii) it accounted for that contract as reinsurance and not as a deposit; and (iii) the contract(s) contain one or more of the following features or other features that would have similar results:(a) A contract term longer than two years and the contract is noncancellable by the reporting entity during the contract term;
(b) A limited or conditional cancellation provision under which cancellation triggers an obligation by the reporting entity, or an affiliate of the reporting entity, to enter into a new reinsurance contract with the reinsurer, or an affiliate of the reinsurer;
(c) Aggregate stop loss reinsurance coverage;
(d) A unilateral right by either party (or both parties) to commute the reinsurance contract, whether conditional or not, except for such provisions which are only triggered by a decline in the credit status of the other party;
(e) A provision permitting reporting of losses, or payment of losses, less frequently than on a quarterly basis (unless there is no activity during the period); or
(f) Payment schedule, accumulating retentions from multiple years or any features inherently designed to delay timing of the reimbursement to the ceding entity. Yes [ ] No [ X ]
9.2 Has the reporting entity during the period covered by the statement ceded any risk under any reinsurance contract (or under multiple contracts with the same reinsurer or its affiliates), for which, during the period covered by the statement, it recorded a positive or negative underwriting result greater than 5% of prior year-end surplus as regards policyholders or it reported calendar year written premium ceded or year-end loss and loss expense reserves ceded greater than 5% of prior year-end surplus as regards policyholders; excluding cessions to approved pooling arrangements or to captive insurance companies that are directly or indirectly controlling, controlled by, or under common control with (i) one or more unaffiliated policyholders of the reporting entity, or (ii) an association of which one or more unaffiliated policyholders of the reporting entity is a member where:(a) The written premium ceded to the reinsurer by the reporting entity or its affiliates represents fifty percent (50%) or more of the entire direct
and assumed premium written by the reinsurer based on its most recently available financial statement; or(b) Twenty-five percent (25%) or more of the written premium ceded to the reinsurer has been retroceded back to the reporting entity or its
affiliates in a separate reinsurance contract. Yes [ ] No [ X ]
9.3 If yes to 9.1 or 9.2, please provide the following information in the Reinsurance Summary Supplemental Filing for General Interrogatory 9:
(a) The aggregate financial statement impact gross of all such ceded reinsurance contracts on the balance sheet and statement of income;
(b) A summary of the reinsurance contract terms and indicate whether it applies to the contracts meeting the criteria in 9.1 or 9.2; and
(c) A brief discussion of management’s principle objectives in entering into the reinsurance contract including the economic purpose to be achieved.
9.4 Except for transactions meeting the requirements of paragraph 37 of SSAP No. 62R, Property and Casualty Reinsurance, has the reporting entity ceded any risk under any reinsurance contract (or multiple contracts with the same reinsurer or its affiliates) during the period covered by the financial statement, and either:(a) Accounted for that contract as reinsurance (either prospective or retroactive) under statutory accounting principles (“SAP”) and as a
deposit under generally accepted accounting principles (“GAAP”); or(b) Accounted for that contract as reinsurance under GAAP and as a deposit under SAP? Yes [ ] No [ X ]
9.5 If yes to 9.4, explain in the Reinsurance Summary Supplemental Filing for General Interrogatory 9 (Section D) why the contract(s) is treated differently for GAAP and SAP.
9.6 The reporting entity is exempt from the Reinsurance Attestation Supplement under one or more of the following criteria:
(a) The entity does not utilize reinsurance; or, Yes [ ] No [ X ]
(b) The entity only engages in a 100% quota share contract with an affiliate and the affiliated or lead company has filed an attestation supplement; or Yes [ X ] No [ ]
(c) The entity has no external cessions and only participates in an intercompany pool and the affiliated or lead company has filed an attestation supplement. Yes [ ] No [ X ]
10. If the reporting entity has assumed risks from another entity, there should be charged on account of such reinsurances a reserve equal to that which the original entity would have been required to charge had it retained the risks. Has this been done? Yes [ ] No [ ] N/A [ X ]
16.1
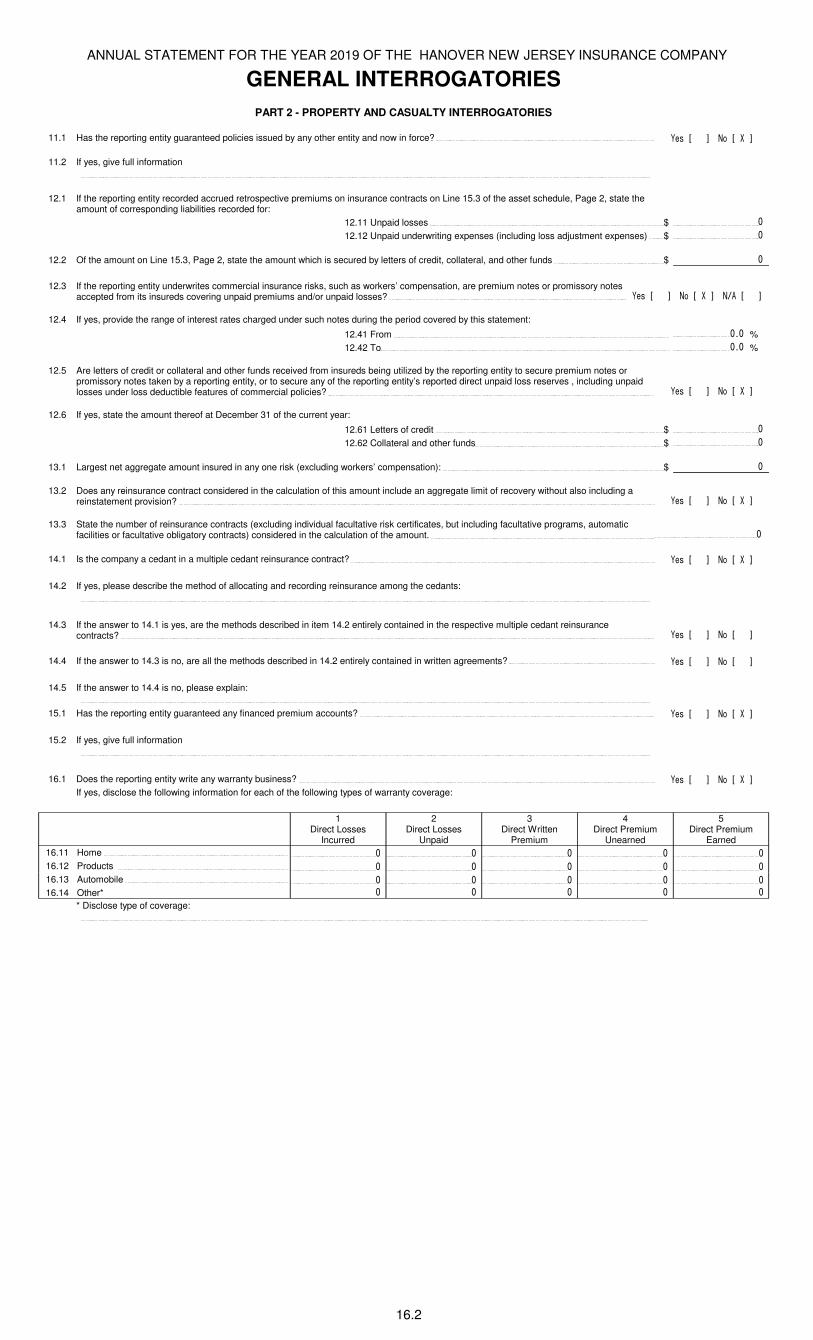
ANNUAL STATEMENT FOR THE YEAR 2019 OF THE HANOVER NEW JERSEY INSURANCE COMPANY
GENERAL INTERROGATORIES
PART 2 - PROPERTY AND CASUALTY INTERROGATORIES
11.1 Has the reporting entity guaranteed policies issued by any other entity and now in force? Yes [ ] No [ X ]
11.2 If yes, give full information
12.1 If the reporting entity recorded accrued retrospective premiums on insurance contracts on Line 15.3 of the asset schedule, Page 2, state the amount of corresponding liabilities recorded for:
12.11 Unpaid losses $ 0
12.12 Unpaid underwriting expenses (including loss adjustment expenses) $ 0
12.2 Of the amount on Line 15.3, Page 2, state the amount which is secured by letters of credit, collateral, and other funds $ 0
12.3 If the reporting entity underwrites commercial insurance risks, such as workers’ compensation, are premium notes or promissory notes accepted from its insureds covering unpaid premiums and/or unpaid losses? Yes [ ] No [ X ] N/A [ ]
12.4 If yes, provide the range of interest rates charged under such notes during the period covered by this statement:
12.41 From 0.0 %
12.42 To 0.0 %
12.5 Are letters of credit or collateral and other funds received from insureds being utilized by the reporting entity to secure premium notes or promissory notes taken by a reporting entity, or to secure any of the reporting entity’s reported direct unpaid loss reserves , including unpaid losses under loss deductible features of commercial policies? Yes [ ] No [ X ]
12.6 If yes, state the amount thereof at December 31 of the current year:
12.61 Letters of credit $ 0
12.62 Collateral and other funds $ 0
13.1 Largest net aggregate amount insured in any one risk (excluding workers’ compensation): $ 0
13.2 Does any reinsurance contract considered in the calculation of this amount include an aggregate limit of recovery without also including a reinstatement provision? Yes [ ] No [ X ]
13.3 State the number of reinsurance contracts (excluding individual facultative risk certificates, but including facultative programs, automatic facilities or facultative obligatory contracts) considered in the calculation of the amount. 0
14.1 Is the company a cedant in a multiple cedant reinsurance contract? Yes [ ] No [ X ]
14.2 If yes, please describe the method of allocating and recording reinsurance among the cedants:
14.3 If the answer to 14.1 is yes, are the methods described in item 14.2 entirely contained in the respective multiple cedant reinsurance contracts? Yes [ ] No [ ]
14.4 If the answer to 14.3 is no, are all the methods described in 14.2 entirely contained in written agreements? Yes [ ] No [ ]
14.5 If the answer to 14.4 is no, please explain:
15.1 Has the reporting entity guaranteed any financed premium accounts? Yes [ ] No [ X ]
15.2 If yes, give full information
16.1 Does the reporting entity write any warranty business? Yes [ ] No [ X ]
If yes, disclose the following information for each of the following types of warranty coverage:
1Direct Losses
Incurred
2Direct Losses
Unpaid
3Direct Written
Premium
4Direct Premium
Unearned
5Direct Premium
Earned
16.11 Home 0 0 0 0 0
16.12 Products 0 0 0 0 0
16.13 Automobile 0 0 0 0 0
16.14 Other* 0 0 0 0 0
* Disclose type of coverage:
16.2

ANNUAL STATEMENT FOR THE YEAR 2019 OF THE HANOVER NEW JERSEY INSURANCE COMPANY
GENERAL INTERROGATORIES
PART 2 - PROPERTY AND CASUALTY INTERROGATORIES
17.1 Does the reporting entity include amounts recoverable on unauthorized reinsurance in Schedule F - Part 3 that is exempt from the statutory provision for unauthorized reinsurance? Yes [ ] No [ X ]
Incurred but not reported losses on contracts in force prior to July 1, 1984, and not subsequently renewed are exempt from the statutory provision for unauthorized reinsurance. Provide the following information for this exemption:
17.11 Gross amount of unauthorized reinsurance in Schedule F - Part 3 exempt from the statutory provision for unauthorized reinsurance $ 0
17.12 Unfunded portion of Interrogatory 17.11 $ 0
17.13 Paid losses and loss adjustment expenses portion of Interrogatory 17.11 $ 0
17.14 Case reserves portion of Interrogatory 17.11 $ 0
17.15 Incurred but not reported portion of Interrogatory 17.11 $ 0
17.16 Unearned premium portion of Interrogatory 17.11 $ 0
17.17 Contingent commission portion of Interrogatory 17.11 $ 0
18.1 Do you act as a custodian for health savings accounts? Yes [ ] No [ X ]
18.2 If yes, please provide the amount of custodial funds held as of the reporting date. $ 0
18.3 Do you act as an administrator for health savings accounts? Yes [ ] No [ X ]
18.4 If yes, please provide the balance of funds administered as of the reporting date. $ 0
19. Is the reporting entity licensed or chartered, registered, qualified, eligible or writing business in at least two states? Yes [ X ] No [ ]
19.1 If no, does the reporting entity assume reinsurance business that covers risks residing in at least one state other than the state of domicile of the reporting entity? Yes [ ] No [ ]
16.3
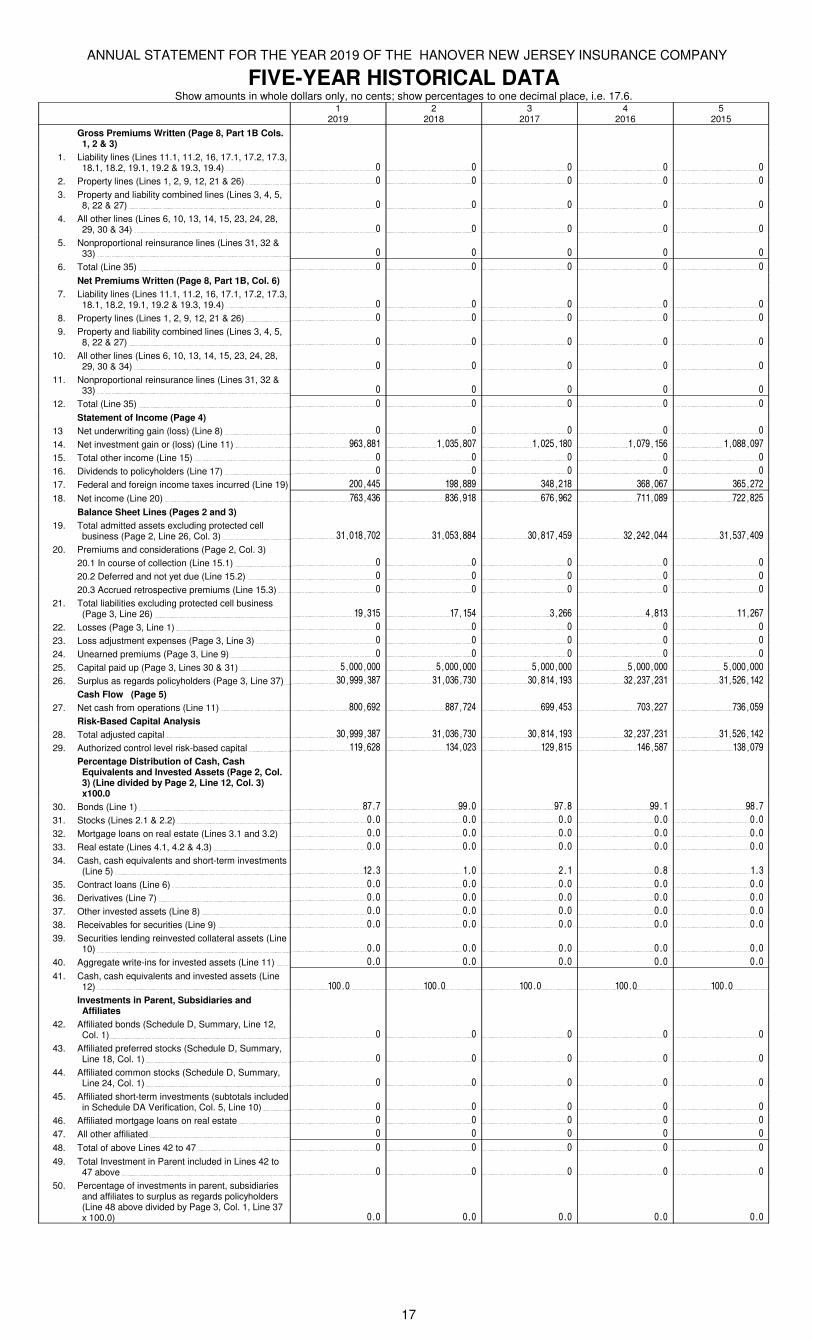
ANNUAL STATEMENT FOR THE YEAR 2019 OF THE HANOVER NEW JERSEY INSURANCE COMPANY
FIVE-YEAR HISTORICAL DATAShow amounts in whole dollars only, no cents; show percentages to one decimal place, i.e. 17.6.
12019
22018
32017
42016
52015
Gross Premiums Written (Page 8, Part 1B Cols. 1, 2 & 3)
1. Liability lines (Lines 11.1, 11.2, 16, 17.1, 17.2, 17.3, 18.1, 18.2, 19.1, 19.2 & 19.3, 19.4) 0 0 0 0 0
2. Property lines (Lines 1, 2, 9, 12, 21 & 26) 0 0 0 0 0
3. Property and liability combined lines (Lines 3, 4, 5, 8, 22 & 27) 0 0 0 0 0
4. All other lines (Lines 6, 10, 13, 14, 15, 23, 24, 28, 29, 30 & 34) 0 0 0 0 0
5. Nonproportional reinsurance lines (Lines 31, 32 & 33) 0 0 0 0 0
6. Total (Line 35) 0 0 0 0 0
Net Premiums Written (Page 8, Part 1B, Col. 6)
7. Liability lines (Lines 11.1, 11.2, 16, 17.1, 17.2, 17.3, 18.1, 18.2, 19.1, 19.2 & 19.3, 19.4) 0 0 0 0 0
8. Property lines (Lines 1, 2, 9, 12, 21 & 26) 0 0 0 0 0
9. Property and liability combined lines (Lines 3, 4, 5, 8, 22 & 27) 0 0 0 0 0
10. All other lines (Lines 6, 10, 13, 14, 15, 23, 24, 28, 29, 30 & 34) 0 0 0 0 0
11. Nonproportional reinsurance lines (Lines 31, 32 & 33) 0 0 0 0 0
12. Total (Line 35) 0 0 0 0 0
Statement of Income (Page 4)
13 Net underwriting gain (loss) (Line 8) 0 0 0 0 0
14. Net investment gain or (loss) (Line 11) 963,881 1,035,807 1,025,180 1,079,156 1,088,097
15. Total other income (Line 15) 0 0 0 0 0
16. Dividends to policyholders (Line 17) 0 0 0 0 0
17. Federal and foreign income taxes incurred (Line 19) 200,445 198,889 348,218 368,067 365,272
18. Net income (Line 20) 763,436 836,918 676,962 711,089 722,825
Balance Sheet Lines (Pages 2 and 3)
19. Total admitted assets excluding protected cell business (Page 2, Line 26, Col. 3) 31,018,702 31,053,884 30,817,459 32,242,044 31,537,409
20. Premiums and considerations (Page 2, Col. 3)
20.1 In course of collection (Line 15.1) 0 0 0 0 0
20.2 Deferred and not yet due (Line 15.2) 0 0 0 0 0
20.3 Accrued retrospective premiums (Line 15.3) 0 0 0 0 0
21. Total liabilities excluding protected cell business (Page 3, Line 26) 19,315 17,154 3,266 4,813 11,267
22. Losses (Page 3, Line 1) 0 0 0 0 0
23. Loss adjustment expenses (Page 3, Line 3) 0 0 0 0 0
24. Unearned premiums (Page 3, Line 9) 0 0 0 0 0
25. Capital paid up (Page 3, Lines 30 & 31) 5,000,000 5,000,000 5,000,000 5,000,000 5,000,000
26. Surplus as regards policyholders (Page 3, Line 37) 30,999,387 31,036,730 30,814,193 32,237,231 31,526,142
Cash Flow (Page 5)
27. Net cash from operations (Line 11) 800,692 887,724 699,453 703,227 736,059
Risk-Based Capital Analysis
28. Total adjusted capital 30,999,387 31,036,730 30,814,193 32,237,231 31,526,142
29. Authorized control level risk-based capital 119,628 134,023 129,815 146,587 138,079
Percentage Distribution of Cash, Cash Equivalents and Invested Assets (Page 2, Col. 3) (Line divided by Page 2, Line 12, Col. 3) x100.0
30. Bonds (Line 1) 87.7 99.0 97.8 99.1 98.7
31. Stocks (Lines 2.1 & 2.2) 0.0 0.0 0.0 0.0 0.0
32. Mortgage loans on real estate (Lines 3.1 and 3.2) 0.0 0.0 0.0 0.0 0.0
33. Real estate (Lines 4.1, 4.2 & 4.3) 0.0 0.0 0.0 0.0 0.0
34. Cash, cash equivalents and short-term investments (Line 5) 12.3 1.0 2.1 0.8 1.3
35. Contract loans (Line 6) 0.0 0.0 0.0 0.0 0.0
36. Derivatives (Line 7) 0.0 0.0 0.0 0.0 0.0
37. Other invested assets (Line 8) 0.0 0.0 0.0 0.0 0.0
38. Receivables for securities (Line 9) 0.0 0.0 0.0 0.0 0.0
39. Securities lending reinvested collateral assets (Line 10) 0.0 0.0 0.0 0.0 0.0
40. Aggregate write-ins for invested assets (Line 11) 0.0 0.0 0.0 0.0 0.0
41. Cash, cash equivalents and invested assets (Line 12) 100.0 100.0 100.0 100.0 100.0
Investments in Parent, Subsidiaries and Affiliates
42. Affiliated bonds (Schedule D, Summary, Line 12, Col. 1) 0 0 0 0 0
43. Affiliated preferred stocks (Schedule D, Summary, Line 18, Col. 1) 0 0 0 0 0
44. Affiliated common stocks (Schedule D, Summary, Line 24, Col. 1) 0 0 0 0 0
45. Affiliated short-term investments (subtotals included in Schedule DA Verification, Col. 5, Line 10) 0 0 0 0 0
46. Affiliated mortgage loans on real estate 0 0 0 0 0
47. All other affiliated 0 0 0 0 0
48. Total of above Lines 42 to 47 0 0 0 0 0
49. Total Investment in Parent included in Lines 42 to 47 above 0 0 0 0 0
50. Percentage of investments in parent, subsidiaries and affiliates to surplus as regards policyholders (Line 48 above divided by Page 3, Col. 1, Line 37 x 100.0) 0.0 0.0 0.0 0.0 0.0
17

ANNUAL STATEMENT FOR THE YEAR 2019 OF THE HANOVER NEW JERSEY INSURANCE COMPANY
FIVE-YEAR HISTORICAL DATA(Continued)
12019
22018
32017
42016
52015
Capital and Surplus Accounts (Page 4)
51. Net unrealized capital gains (losses) (Line 24) 0 0 0 0 0
52. Dividends to stockholders (Line 35) (800,000) (600,000) (2,100,000) 0 0
53. Change in surplus as regards policyholders for the year (Line 38) (37,343) 222,537 (1,423,038) 711,089 722,825
Gross Losses Paid (Page 9, Part 2, Cols. 1 & 2)
54. Liability lines (Lines 11.1, 11.2, 16, 17.1, 17.2, 17.3, 18.1, 18.2, 19.1, 19.2 & 19.3, 19.4) (18,223) (38,585) (130,139) 174,645 822,491
55. Property lines (Lines 1, 2, 9, 12, 21 & 26) (4,362) (621) (2,213) 5,274 6,271
56. Property and liability combined lines (Lines 3, 4, 5, 8, 22 & 27) 0 0 0 0 0
57. All other lines (Lines 6, 10, 13, 14, 15, 23, 24, 28, 29, 30 & 34) 0 0 0 0 0
58. Nonproportional reinsurance lines (Lines 31, 32 & 33) 0 0 0 0 0
59. Total (Line 35) (22,585) (39,206) (132,352) 179,919 828,762
Net Losses Paid (Page 9, Part 2, Col. 4)
60. Liability lines (Lines 11.1, 11.2, 16, 17.1, 17.2, 17.3, 18.1, 18.2, 19.1, 19.2 & 19.3, 19.4) 0 0 0 0 0
61. Property lines (Lines 1, 2, 9, 12, 21 & 26) 0 0 0 0 0
62. Property and liability combined lines (Lines 3, 4, 5, 8, 22 & 27) 0 0 0 0 0
63. All other lines (Lines 6, 10, 13, 14, 15, 23, 24, 28, 29, 30 & 34) 0 0 0 0 0
64. Nonproportional reinsurance lines (Lines 31, 32 & 33) 0 0 0 0 0
65. Total (Line 35) 0 0 0 0 0
Operating Percentages (Page 4) (Line divided by Page 4, Line 1) x 100.0
66. Premiums earned (Line 1) 100.0 100.0 100.0 100.0 100.0
67. Losses incurred (Line 2) 0.0 0.0 0.0 0.0 0.0
68. Loss expenses incurred (Line 3) 0.0 0.0 0.0 0.0 0.0
69. Other underwriting expenses incurred (Line 4) 0.0 0.0 0.0 0.0 0.0
70. Net underwriting gain (loss) (Line 8) 0.0 0.0 0.0 0.0 0.0
Other Percentages
71. Other underwriting expenses to net premiums written (Page 4, Lines 4 + 5 - 15 divided by Page 8, Part 1B, Col. 6, Line 35 x 100.0) 0.0 0.0 0.0 0.0 0.0
72. Losses and loss expenses incurred to premiums earned (Page 4, Lines 2 + 3 divided by Page 4, Line 1 x 100.0) 0.0 0.0 0.0 0.0 0.0
73. Net premiums written to policyholders’ surplus (Page 8, Part 1B, Col. 6, Line 35 divided by Page 3, Line 37, Col. 1 x 100.0) 0.0 0.0 0.0 0.0 0.0
One Year Loss Development ($000 omitted)
74. Development in estimated losses and loss expenses incurred prior to current year (Schedule P - Part 2 - Summary, Line 12, Col. 11) 0 0 0 0 0
75. Percent of development of losses and loss expenses incurred to policyholders’ surplus of prior year end (Line 74 above divided by Page 4, Line 21, Col. 1 x 100.0) 0.0 0.0 0.0 0.0 0.0
Two Year Loss Development ($000 omitted)
76. Development in estimated losses and loss expenses incurred two years before the current year and prior year (Schedule P, Part 2 - Summary, Line 12, Col. 12) 0 0 0 0 0
77. Percent of development of losses and loss expenses incurred to reported policyholders’ surplus of second prior year end (Line 76 above divided by Page 4, Line 21, Col. 2 x 100.0) 0.0 0.0 0.0 0.0 0.0
NOTE: If a party to a merger, have the two most recent years of this exhibit been restated due to a merger in compliance with the disclosure requirements of SSAP No. 3, Accounting Changes and Correction of Errors? Yes [ ] No [ ]
If no, please explain:
18

*11705201943030100*ANNUAL STATEMENT FOR THE YEAR 2019 OF THE HANOVER NEW JERSEY INSURANCE COMPANY
EXHIBIT OF PREMIUMS AND LOSSES (Statutory Page 14)NAIC Group Code 0088 BUSINESS IN THE STATE OF New Hampshire DURING THE YEAR 2019 NAIC Company Code 11705
Gross Premiums, IncludingPolicy and Membership Fees,
Less Return Premiums andPremiums on Policies not Taken
3
Dividends Paid
4 5 6 7 8
Direct Defense
9
Direct Defense
10
Direct Defenseand Cost
11 12
Line of Business
1Direct Premiums
Written
2Direct Premiums
Earned
or Credited to Policyholders
on Direct BusinessDirect Unearned
Premium ReservesDirect Losses Paid (deducting salvage)
Direct Losses Incurred
DirectLosses Unpaid
and Cost Containment Expense Paid
and Cost Containment
Expense Incurred
Containment ExpenseUnpaid
Commissionsand Brokerage
ExpensesTaxes, Licenses
and Fees
1. Fire 0 0 0 0 0 0 0 0 0 0 0 0
2.1 Allied lines 0 0 0 0 0 0 0 0 0 0 0 0
2.2 Multiple peril crop 0 0 0 0 0 0 0 0 0 0 0 0
2.3 Federal flood 0 0 0 0 0 0 0 0 0 0 0 0
2.4. Private crop 0 0 0 0 0 0 0 0 0 0 0 0
2.5 Private flood 0 0 0 0 0 0 0 0 0 0 0 0
3. Farmowners multiple peril 0 0 0 0 0 0 0 0 0 0 0 0
4. Homeowners multiple peril 0 0 0 0 0 0 0 0 0 0 0 0
5.1 Commercial multiple peril (non-liability portion) 0 0 0 0 0 0 0 0 0 0 0 0
5.2 Commercial multiple peril (liability portion) 0 0 0 0 0 0 0 0 0 0 0 0
6. Mortgage guaranty 0 0 0 0 0 0 0 0 0 0 0 0
8. Ocean marine 0 0 0 0 0 0 0 0 0 0 0 0
9. Inland marine 0 0 0 0 0 0 0 0 0 0 0 0
10. Financial guaranty 0 0 0 0 0 0 0 0 0 0 0 0
11. Medical professional liability 0 0 0 0 0 0 0 0 0 0 0 0
12. Earthquake 0 0 0 0 0 0 0 0 0 0 0 0
13. Group accident and health (b) 0 0 0 0 0 0 0 0 0 0 0 0
14. Credit accident and health (group and individual) 0 0 0 0 0 0 0 0 0 0 0 0
15.1 Collectively renewable accident and health (b) 0 0 0 0 0 0 0 0 0 0 0 0
15.2 Non-cancelable accident and health(b) 0 0 0 0 0 0 0 0 0 0 0 0
15.3 Guaranteed renewable accident and health(b) 0 0 0 0 0 0 0 0 0 0 0 0
15.4 Non-renewable for stated reasons only (b) 0 0 0 0 0 0 0 0 0 0 0 0
15.5 Other accident only 0 0 0 0 0 0 0 0 0 0 0 0
15.6 Medicare Title XVIII exempt from state taxes or fees 0 0 0 0 0 0 0 0 0 0 0 0
15.7 All other accident and health (b) 0 0 0 0 0 0 0 0 0 0 0 0
15.8 Federal employees health benefits plan premium (b) 0 0 0 0 0 0 0 0 0 0 0 0
16. Workers' compensation 0 0 0 0 0 0 0 0 0 0 0 400
17.1 Other Liability - occurrence 0 0 0 0 0 0 0 0 0 0 0 0
17.2 Other Liability - claims made 0 0 0 0 0 0 0 0 0 0 0 0
17.3 Excess workers' compensation 0 0 0 0 0 0 0 0 0 0 0 0
18. Products liability 0 0 0 0 0 0 0 0 0 0 0 0
19.1 Private passenger auto no-fault (personal injury protection) 0 0 0 0 0 0 0 0 0 0 0 0
19.2 Other private passenger auto liability 0 0 0 0 0 0 0 0 0 0 0 0
19.3 Commercial auto no-fault (personal injury protection) 0 0 0 0 0 0 0 0 0 0 0 0
19.4 Other commercial auto liability 0 0 0 0 0 0 0 0 0 0 0 0
21.1 Private passenger auto physical damage 0 0 0 0 0 0 0 0 0 0 0 0
21.2 Commercial auto physical damage 0 0 0 0 0 0 0 0 0 0 0 0
22. Aircraft (all perils) 0 0 0 0 0 0 0 0 0 0 0 0
23. Fidelity 0 0 0 0 0 0 0 0 0 0 0 0
24. Surety 0 0 0 0 0 0 0 0 0 0 0 0
26. Burglary and theft 0 0 0 0 0 0 0 0 0 0 0 0
27. Boiler and machinery 0 0 0 0 0 0 0 0 0 0 0 0
28. Credit 0 0 0 0 0 0 0 0 0 0 0 0
29. International 0 0 0 0 0 0 0 0 0 0 0 0
30. Warranty 0 0 0 0 0 0 0 0 0 0 0 0
34. Aggregate write-ins for other lines of business 0 0 0 0 0 0 0 0 0 0 0 0
35. TOTALS (a) 0 0 0 0 0 0 0 0 0 0 0 400
DETAILS OF WRITE-INS
3401.
3402.
3403.
3498. Summary of remaining write-ins for Line 34 from overflow page 0 0 0 0 0 0 0 0 0 0 0 0
3499. Totals (Lines 3401 thru 3403 plus 3498)(Line 34 above) 0 0 0 0 0 0 0 0 0 0 0 0
(a) Finance and service charges not included in Lines 1 to 35 $ 0
(b) For health business on indicated lines report: Number of persons insured under PPO managed care products 0 and number of persons insured under indemnity only products 0 .
19.N
H

*11705201943031100*ANNUAL STATEMENT FOR THE YEAR 2019 OF THE HANOVER NEW JERSEY INSURANCE COMPANY
EXHIBIT OF PREMIUMS AND LOSSES (Statutory Page 14)NAIC Group Code 0088 BUSINESS IN THE STATE OF New Jersey DURING THE YEAR 2019 NAIC Company Code 11705
Gross Premiums, IncludingPolicy and Membership Fees,
Less Return Premiums andPremiums on Policies not Taken
3
Dividends Paid
4 5 6 7 8
Direct Defense
9
Direct Defense
10
Direct Defenseand Cost
11 12
Line of Business
1Direct Premiums
Written
2Direct Premiums
Earned
or Credited to Policyholders
on Direct BusinessDirect Unearned
Premium ReservesDirect Losses Paid (deducting salvage)
Direct Losses Incurred
DirectLosses Unpaid
and Cost Containment Expense Paid
and Cost Containment
Expense Incurred
Containment ExpenseUnpaid
Commissionsand Brokerage
ExpensesTaxes, Licenses
and Fees
1. Fire 0 0 0 0 0 0 0 0 0 0 0 0
2.1 Allied lines 0 0 0 0 0 0 0 0 0 0 0 0
2.2 Multiple peril crop 0 0 0 0 0 0 0 0 0 0 0 0
2.3 Federal flood 0 0 0 0 0 0 0 0 0 0 0 0
2.4. Private crop 0 0 0 0 0 0 0 0 0 0 0 0
2.5 Private flood 0 0 0 0 0 0 0 0 0 0 0 0
3. Farmowners multiple peril 0 0 0 0 0 0 0 0 0 0 0 0
4. Homeowners multiple peril 0 0 0 0 0 0 0 0 0 0 0 0
5.1 Commercial multiple peril (non-liability portion) 0 0 0 0 0 0 0 0 0 0 0 0
5.2 Commercial multiple peril (liability portion) 0 0 0 0 0 0 0 0 0 0 0 0
6. Mortgage guaranty 0 0 0 0 0 0 0 0 0 0 0 0
8. Ocean marine 0 0 0 0 0 0 0 0 0 0 0 0
9. Inland marine 0 0 0 0 0 0 0 0 0 0 0 0
10. Financial guaranty 0 0 0 0 0 0 0 0 0 0 0 0
11. Medical professional liability 0 0 0 0 0 0 0 0 0 0 0 0
12. Earthquake 0 0 0 0 0 0 0 0 0 0 0 0
13. Group accident and health (b) 0 0 0 0 0 0 0 0 0 0 0 0
14. Credit accident and health (group and individual) 0 0 0 0 0 0 0 0 0 0 0 0
15.1 Collectively renewable accident and health (b) 0 0 0 0 0 0 0 0 0 0 0 0
15.2 Non-cancelable accident and health(b) 0 0 0 0 0 0 0 0 0 0 0 0
15.3 Guaranteed renewable accident and health(b) 0 0 0 0 0 0 0 0 0 0 0 0
15.4 Non-renewable for stated reasons only (b) 0 0 0 0 0 0 0 0 0 0 0 0
15.5 Other accident only 0 0 0 0 0 0 0 0 0 0 0 0
15.6 Medicare Title XVIII exempt from state taxes or fees 0 0 0 0 0 0 0 0 0 0 0 0
15.7 All other accident and health (b) 0 0 0 0 0 0 0 0 0 0 0 0
15.8 Federal employees health benefits plan premium (b) 0 0 0 0 0 0 0 0 0 0 0 0
16. Workers' compensation 0 0 0 0 0 0 0 0 0 0 0 0
17.1 Other Liability - occurrence 0 0 0 0 0 0 0 0 0 0 0 0
17.2 Other Liability - claims made 0 0 0 0 0 0 0 0 0 0 0 0
17.3 Excess workers' compensation 0 0 0 0 0 0 0 0 0 0 0 0
18. Products liability 0 0 0 0 0 0 0 0 0 0 0 0
19.1 Private passenger auto no-fault (personal injury protection) 0 0 0 0 (18,223) (28,627) 0 (3,149) (3,149) 0 0 0
19.2 Other private passenger auto liability 0 0 0 0 0 (143,408) 2,611 30,187 30,187 0 0 521
19.3 Commercial auto no-fault (personal injury protection) 0 0 0 0 0 0 0 0 0 0 0 0
19.4 Other commercial auto liability 0 0 0 0 0 0 0 0 0 0 0 0
21.1 Private passenger auto physical damage 0 0 0 0 (4,362) (4,362) 0 0 0 0 0 0
21.2 Commercial auto physical damage 0 0 0 0 0 0 0 0 0 0 0 0
22. Aircraft (all perils) 0 0 0 0 0 0 0 0 0 0 0 0
23. Fidelity 0 0 0 0 0 0 0 0 0 0 0 0
24. Surety 0 0 0 0 0 0 0 0 0 0 0 0
26. Burglary and theft 0 0 0 0 0 0 0 0 0 0 0 0
27. Boiler and machinery 0 0 0 0 0 0 0 0 0 0 0 0
28. Credit 0 0 0 0 0 0 0 0 0 0 0 0
29. International 0 0 0 0 0 0 0 0 0 0 0 0
30. Warranty 0 0 0 0 0 0 0 0 0 0 0 0
34. Aggregate write-ins for other lines of business 0 0 0 0 0 0 0 0 0 0 0 0
35. TOTALS (a) 0 0 0 0 (22,585) (176,397) 2,611 27,038 27,038 0 0 521
DETAILS OF WRITE-INS
3401.
3402.
3403.
3498. Summary of remaining write-ins for Line 34 from overflow page 0 0 0 0 0 0 0 0 0 0 0 0
3499. Totals (Lines 3401 thru 3403 plus 3498)(Line 34 above) 0 0 0 0 0 0 0 0 0 0 0 0
(a) Finance and service charges not included in Lines 1 to 35 $ 0
(b) For health business on indicated lines report: Number of persons insured under PPO managed care products 0 and number of persons insured under indemnity only products 0 .
19.N
J

*11705201943059100*ANNUAL STATEMENT FOR THE YEAR 2019 OF THE HANOVER NEW JERSEY INSURANCE COMPANY
EXHIBIT OF PREMIUMS AND LOSSES (Statutory Page 14)NAIC Group Code 0088 BUSINESS IN THE STATE OF Grand Total DURING THE YEAR 2019 NAIC Company Code 11705
Gross Premiums, IncludingPolicy and Membership Fees,
Less Return Premiums andPremiums on Policies not Taken
3
Dividends Paid
4 5 6 7 8
Direct Defense
9
Direct Defense
10
Direct Defenseand Cost
11 12
Line of Business
1Direct Premiums
Written
2Direct Premiums
Earned
or Credited to Policyholders
on Direct BusinessDirect Unearned
Premium ReservesDirect Losses Paid (deducting salvage)
Direct Losses Incurred
DirectLosses Unpaid
and Cost Containment Expense Paid
and Cost Containment
Expense Incurred
Containment ExpenseUnpaid
Commissionsand Brokerage
ExpensesTaxes, Licenses
and Fees
1. Fire 0 0 0 0 0 0 0 0 0 0 0 0
2.1 Allied lines 0 0 0 0 0 0 0 0 0 0 0 0
2.2 Multiple peril crop 0 0 0 0 0 0 0 0 0 0 0 0
2.3 Federal flood 0 0 0 0 0 0 0 0 0 0 0 0
2.4. Private crop 0 0 0 0 0 0 0 0 0 0 0 0
2.5 Private flood 0 0 0 0 0 0 0 0 0 0 0 0
3. Farmowners multiple peril 0 0 0 0 0 0 0 0 0 0 0 0
4. Homeowners multiple peril 0 0 0 0 0 0 0 0 0 0 0 0
5.1 Commercial multiple peril (non-liability portion) 0 0 0 0 0 0 0 0 0 0 0 0
5.2 Commercial multiple peril (liability portion) 0 0 0 0 0 0 0 0 0 0 0 0
6. Mortgage guaranty 0 0 0 0 0 0 0 0 0 0 0 0
8. Ocean marine 0 0 0 0 0 0 0 0 0 0 0 0
9. Inland marine 0 0 0 0 0 0 0 0 0 0 0 0
10. Financial guaranty 0 0 0 0 0 0 0 0 0 0 0 0
11. Medical professional liability 0 0 0 0 0 0 0 0 0 0 0 0
12. Earthquake 0 0 0 0 0 0 0 0 0 0 0 0
13. Group accident and health (b) 0 0 0 0 0 0 0 0 0 0 0 0
14. Credit accident and health (group and individual) 0 0 0 0 0 0 0 0 0 0 0 0
15.1 Collectively renewable accident and health (b) 0 0 0 0 0 0 0 0 0 0 0 0
15.2 Non-cancelable accident and health(b) 0 0 0 0 0 0 0 0 0 0 0 0
15.3 Guaranteed renewable accident and health(b) 0 0 0 0 0 0 0 0 0 0 0 0
15.4 Non-renewable for stated reasons only (b) 0 0 0 0 0 0 0 0 0 0 0 0
15.5 Other accident only 0 0 0 0 0 0 0 0 0 0 0 0
15.6 Medicare Title XVIII exempt from state taxes or fees 0 0 0 0 0 0 0 0 0 0 0 0
15.7 All other accident and health (b) 0 0 0 0 0 0 0 0 0 0 0 0
15.8 Federal employees health benefits plan premium (b) 0 0 0 0 0 0 0 0 0 0 0 0
16. Workers' compensation 0 0 0 0 0 0 0 0 0 0 0 400
17.1 Other Liability - occurrence 0 0 0 0 0 0 0 0 0 0 0 0
17.2 Other Liability - claims made 0 0 0 0 0 0 0 0 0 0 0 0
17.3 Excess workers' compensation 0 0 0 0 0 0 0 0 0 0 0 0
18. Products liability 0 0 0 0 0 0 0 0 0 0 0 0
19.1 Private passenger auto no-fault (personal injury protection) 0 0 0 0 (18,223) (28,627) 0 (3,149) (3,149) 0 0 0
19.2 Other private passenger auto liability 0 0 0 0 0 (143,408) 2,611 30,187 30,187 0 0 521
19.3 Commercial auto no-fault (personal injury protection) 0 0 0 0 0 0 0 0 0 0 0 0
19.4 Other commercial auto liability 0 0 0 0 0 0 0 0 0 0 0 0
21.1 Private passenger auto physical damage 0 0 0 0 (4,362) (4,362) 0 0 0 0 0 0
21.2 Commercial auto physical damage 0 0 0 0 0 0 0 0 0 0 0 0
22. Aircraft (all perils) 0 0 0 0 0 0 0 0 0 0 0 0
23. Fidelity 0 0 0 0 0 0 0 0 0 0 0 0
24. Surety 0 0 0 0 0 0 0 0 0 0 0 0
26. Burglary and theft 0 0 0 0 0 0 0 0 0 0 0 0
27. Boiler and machinery 0 0 0 0 0 0 0 0 0 0 0 0
28. Credit 0 0 0 0 0 0 0 0 0 0 0 0
29. International 0 0 0 0 0 0 0 0 0 0 0 0
30. Warranty 0 0 0 0 0 0 0 0 0 0 0 0
34. Aggregate write-ins for other lines of business 0 0 0 0 0 0 0 0 0 0 0 0
35. TOTALS (a) 0 0 0 0 (22,585) (176,397) 2,611 27,038 27,038 0 0 921
DETAILS OF WRITE-INS
3401.
3402.
3403.
3498. Summary of remaining write-ins for Line 34 from overflow page 0 0 0 0 0 0 0 0 0 0 0 0
3499. Totals (Lines 3401 thru 3403 plus 3498)(Line 34 above) 0 0 0 0 0 0 0 0 0 0 0 0
(a) Finance and service charges not included in Lines 1 to 35 $ 0
(b) For health business on indicated lines report: Number of persons insured under PPO managed care products 0 and number of persons insured under indemnity only products 0 .
19.G
T

ANNUAL STATEMENT FOR THE YEAR 2019 OF THE HANOVER NEW JERSEY INSURANCE COMPANY
Schedule F - Part 1 - Assumed Reinsurance
N O N E
Schedule F - Part 2 - Premium Portfolio Reinsurance Effected or (Canceled)
N O N E
20, 21

ANNUAL STATEMENT FOR THE YEAR 2019 OF THE HANOVER NEW JERSEY INSURANCE COMPANY
SCHEDULE F - PART 3Ceded Reinsurance as of December 31, Current Year ($000 Omitted)
1 2 3 4 5 6 Reinsurance Recoverable On 16 Reinsurance Payable 19 20
IDNumber
NAICCom-panyCode Name of Reinsurer
DomiciliaryJurisdiction
SpecialCode
Reinsurance Premiums
Ceded
7
PaidLosses
8
PaidLAE
9
KnownCase Loss Reserves
10
KnownCase LAE Reserves
11
IBNRLoss
Reserves
12
IBNRLAE
Reserves
13
Unearned Premiums
14
Contingent Commis-
sions
15
Columns7 through14 Totals
Amount in Dispute
included in Column 15
17
Ceded Balances Payable
18
Other AmountsDue to
Reinsurers
Net Amount Recoverable
From Reinsurers Cols. 15 -[17 + 18]
Funds Held by
Company Under
Reinsurance Treaties
13-5129825 22292 THE HANOVER INSURANCE COMPANY NH 0 0 0 3 0 0 0 0 0 3 0 0 0 3 0
0399999. Total Authorized - Affiliates - U.S. Non-Pool - Other 0 0 0 3 0 0 0 0 0 3 0 0 0 3 0
0499999. Total Authorized - Affiliates - U.S. Non-Pool 0 0 0 3 0 0 0 0 0 3 0 0 0 3 0
0799999. Total Authorized - Affiliates - Other (Non-U.S.) 0 0 0 0 0 0 0 0 0 0 0 0 0 0 0
0899999. Total Authorized - Affiliates 0 0 0 3 0 0 0 0 0 3 0 0 0 3 0
1499999. Total Authorized Excluding Protected Cells (Sum of 0899999, 0999999, 1099999, 1199999 and 1299999) 0 0 0 3 0 0 0 0 0 3 0 0 0 3 0
1899999. Total Unauthorized - Affiliates - U.S. Non-Pool 0 0 0 0 0 0 0 0 0 0 0 0 0 0 0
2199999. Total Unauthorized - Affiliates - Other (Non-U.S.) 0 0 0 0 0 0 0 0 0 0 0 0 0 0 0
2299999. Total Unauthorized - Affiliates 0 0 0 0 0 0 0 0 0 0 0 0 0 0 0
2899999. Total Unauthorized Excluding Protected Cells (Sum of 2299999, 2399999, 2499999, 2599999 and 2699999) 0 0 0 0 0 0 0 0 0 0 0 0 0 0 0
3299999. Total Certified - Affiliates - U.S. Non-Pool 0 0 0 0 0 0 0 0 0 0 0 0 0 0 0
3599999. Total Certified - Affiliates - Other (Non-U.S.) 0 0 0 0 0 0 0 0 0 0 0 0 0 0 0
3699999. Total Certified - Affiliates 0 0 0 0 0 0 0 0 0 0 0 0 0 0 0
4299999. Total Certified Excluding Protected Cells (Sum of 3699999, 3799999, 3899999, 3999999 and 4099999) 0 0 0 0 0 0 0 0 0 0 0 0 0 0 0
4399999. Total Authorized, Unauthorized and Certified Excluding Protected Cells (Sum of 1499999, 2899999 and 4299999) 0 0 0 3 0 0 0 0 0 3 0 0 0 3 0
4499999. Total Protected Cells (Sum of 1399999, 2799999 and 4199999) 0 0 0 0 0 0 0 0 0 0 0 0 0 0 0
9999999 Totals 0 0 0 3 0 0 0 0 0 3 0 0 0 3 0
22

ANNUAL STATEMENT FOR THE YEAR 2019 OF THE HANOVER NEW JERSEY INSURANCE COMPANY
SCHEDULE F - PART 3 (Continued)Ceded Reinsurance as of December 31, Current Year ($000 Omitted)
(Credit Risk)Collateral 25 26 27 Ceded Reinsurance Credit Risk
IDNumber
FromCol. 1
Name of ReinsurerFrom Col. 3
21
Multiple Beneficiary
Trusts
22
Letters of Credit
23
Issuing or Confirming
Bank Reference Number
24
Single Beneficiary
Trusts & Other
Allowable Collateral
Total Funds Held,
Payables & Collateral
Net Recoverable Net of Funds
Held & Collateral
Applicable Sch. F Penalty(Col. 78)
28
Total Amount Recoverable
from Reinsurers
Less Penalty (Cols. 15-27)
29
Stressed Recoverable
(Col. 28 * 120%)
30
Reinsurance Payable & Funds Held
(Cols. 17+18+20; but not in excess ofCol. 29)
31
Stressed Net Recoverable (Cols. 29-30)
32
Total Collateral
(Cols. 21+22 + 24, not in Excess of Col. 31)
33
Stressed Net Recoverable
Net of Collateral Offsets
(Cols. 31-32)
34
Reinsurer Designation Equivalent
35
Credit Risk on Collateralized Recoverables
(Col. 32 * Factor
Applicable to Reinsurer
Designation Equivalent in
Col. 34)
36Credit Risk
on Un-collateralized Recoverables
(Col. 33 * Factor
Applicable to Reinsurer
Designation Equivalent in
Col. 34)13-5129825 THE HANOVER INSURANCE COMPANY 0 0 0 0 3 0 XXX XXX XXX XXX XXX XXX XXX XXX XXX0399999. Total Authorized - Affiliates - U.S. Non-Pool - Other 0 0 XXX 0 0 3 0 XXX XXX XXX XXX XXX XXX XXX XXX XXX0499999. Total Authorized - Affiliates - U.S. Non-Pool 0 0 XXX 0 0 3 0 XXX XXX XXX XXX XXX XXX XXX XXX XXX0799999. Total Authorized - Affiliates - Other (Non-U.S.) 0 0 XXX 0 0 0 0 0 0 0 0 0 0 XXX 0 0
0899999. Total Authorized - Affiliates 0 0 XXX 0 0 3 0 0 0 0 0 0 0 XXX 0 0
1499999. Total Authorized Excluding Protected Cells (Sum of 0899999, 0999999, 1099999, 1199999 and 1299999) 0 0 XXX 0 0 3 0 0 0 0 0 0 0 XXX 0 0
1899999. Total Unauthorized - Affiliates - U.S. Non-Pool 0 0 XXX 0 0 0 0 XXX XXX XXX XXX XXX XXX XXX XXX XXX2199999. Total Unauthorized - Affiliates - Other (Non-U.S.) 0 0 XXX 0 0 0 0 0 0 0 0 0 0 XXX 0 0
2299999. Total Unauthorized - Affiliates 0 0 XXX 0 0 0 0 0 0 0 0 0 0 XXX 0 0
2899999. Total Unauthorized Excluding Protected Cells (Sum of 2299999, 2399999, 2499999, 2599999 and 2699999) 0 0 XXX 0 0 0 0 0 0 0 0 0 0 XXX 0 0
3299999. Total Certified - Affiliates - U.S. Non-Pool 0 0 XXX 0 0 0 0 XXX XXX XXX XXX XXX XXX XXX XXX XXX3599999. Total Certified - Affiliates - Other (Non-U.S.) 0 0 XXX 0 0 0 0 0 0 0 0 0 0 XXX 0 0
3699999. Total Certified - Affiliates 0 0 XXX 0 0 0 0 0 0 0 0 0 0 XXX 0 0
4299999. Total Certified Excluding Protected Cells (Sum of 3699999, 3799999, 3899999, 3999999 and 4099999) 0 0 XXX 0 0 0 0 0 0 0 0 0 0 XXX 0 0
4399999. Total Authorized, Unauthorized and Certified Excluding Protected Cells (Sum of 1499999, 2899999 and 4299999) 0 0 XXX 0 0 3 0 0 0 0 0 0 0 XXX 0 0
4499999. Total Protected Cells (Sum of 1399999, 2799999 and 4199999) 0 0 XXX 0 0 0 0 0 0 0 0 0 0 XXX 0 0
9999999 Totals 0 0 XXX 0 0 3 0 0 0 0 0 0 0 XXX 0 0
23

ANNUAL STATEMENT FOR THE YEAR 2019 OF THE HANOVER NEW JERSEY INSURANCE COMPANY
SCHEDULE F - PART 3 (Continued)Ceded Reinsurance as of December 31, Current Year ($000 Omitted)
(Aging of Ceded Reinsurance)Reinsurance Recoverable on Paid Losses and Paid Loss Adjustment Expenses 44 45 46 47 48 49 50 51 52 53
37 Overdue 43
IDNumber
FromCol. 1
Name of ReinsurerFrom Col. 3 Current
38
1 - 29Days
39
30 - 90Days
40
91 - 120Days
41
Over 120 Days
42
TotalOverdue
Cols. 38+39 +40+41
Total Due Cols. 37+42
(In total should equal Cols. 7+8)
Total Recoverable
on Paid Losses &
LAE Amounts in
Dispute Included in
Col. 43
Recoverable on Paid
Losses & LAE Over 90
Days Past Due Amounts
in Dispute Included in
Cols. 40 & 41
Total Recoverable
on Paid Losses &
LAE Amounts Not
in Dispute (Cols 43-44)
Recoverable on Paid
Losses & LAE Over 90
Days Past Due Amounts
Not in Dispute
(Cols. 40 + 41 - 45)
Amounts Received
Prior90 Days
Percentage Overdue Col.
42/Col. 43
Percentageof Amounts More Than
90 Days Overdue Not
in Dispute (Col.
47/[Cols. 46+48])
Percentage More Than 120 Days Overdue (Col. 41/Col. 43)
Is theAmount in
Col. 50 Less Than 20%?(Yes or No)
Amounts in Col. 47 for Reinsurers with Values Less Than
20% inCol. 50
13-5129825 THE HANOVER INSURANCE COMPANY 0 0 0 0 0 0 0 0 0 0 0 0 0.0 0.0 0.0 YES 0
0399999. Total Authorized - Affiliates - U.S. Non-Pool - Other 0 0 0 0 0 0 0 0 0 0 0 0 0.0 0.0 0.0 XXX 0
0499999. Total Authorized - Affiliates - U.S. Non-Pool 0 0 0 0 0 0 0 0 0 0 0 0 0.0 0.0 0.0 XXX 0
0799999. Total Authorized - Affiliates - Other (Non-U.S.) 0 0 0 0 0 0 0 0 0 0 0 0 0.0 0.0 0.0 XXX 0
0899999. Total Authorized - Affiliates 0 0 0 0 0 0 0 0 0 0 0 0 0.0 0.0 0.0 XXX 0
1499999. Total Authorized Excluding Protected Cells (Sum of 0899999, 0999999, 1099999, 1199999 and 1299999) 0 0 0 0 0 0 0 0 0 0 0 0 0.0 0.0 0.0 XXX 0
1899999. Total Unauthorized - Affiliates - U.S. Non-Pool 0 0 0 0 0 0 0 0 0 0 0 0 0.0 0.0 0.0 XXX 0
2199999. Total Unauthorized - Affiliates - Other (Non-U.S.) 0 0 0 0 0 0 0 0 0 0 0 0 0.0 0.0 0.0 XXX 0
2299999. Total Unauthorized - Affiliates 0 0 0 0 0 0 0 0 0 0 0 0 0.0 0.0 0.0 XXX 0
2899999. Total Unauthorized Excluding Protected Cells (Sum of 2299999, 2399999, 2499999, 2599999 and 2699999) 0 0 0 0 0 0 0 0 0 0 0 0 0.0 0.0 0.0 XXX 0
3299999. Total Certified - Affiliates - U.S. Non-Pool 0 0 0 0 0 0 0 0 0 0 0 0 0.0 0.0 0.0 XXX 0
3599999. Total Certified - Affiliates - Other (Non-U.S.) 0 0 0 0 0 0 0 0 0 0 0 0 0.0 0.0 0.0 XXX 0
3699999. Total Certified - Affiliates 0 0 0 0 0 0 0 0 0 0 0 0 0.0 0.0 0.0 XXX 0
4299999. Total Certified Excluding Protected Cells (Sum of 3699999, 3799999, 3899999, 3999999 and 4099999) 0 0 0 0 0 0 0 0 0 0 0 0 0.0 0.0 0.0 XXX 0
4399999. Total Authorized, Unauthorized and Certified Excluding Protected Cells (Sum of 1499999, 2899999 and 4299999) 0 0 0 0 0 0 0 0 0 0 0 0 0.0 0.0 0.0 XXX 0
4499999. Total Protected Cells (Sum of 1399999, 2799999 and 4199999) 0 0 0 0 0 0 0 0 0 0 0 0 0.0 0.0 0.0 XXX 0
9999999 Totals 0 0 0 0 0 0 0 0 0 0 0 0 0.0 0.0 0.0 XXX 0
24
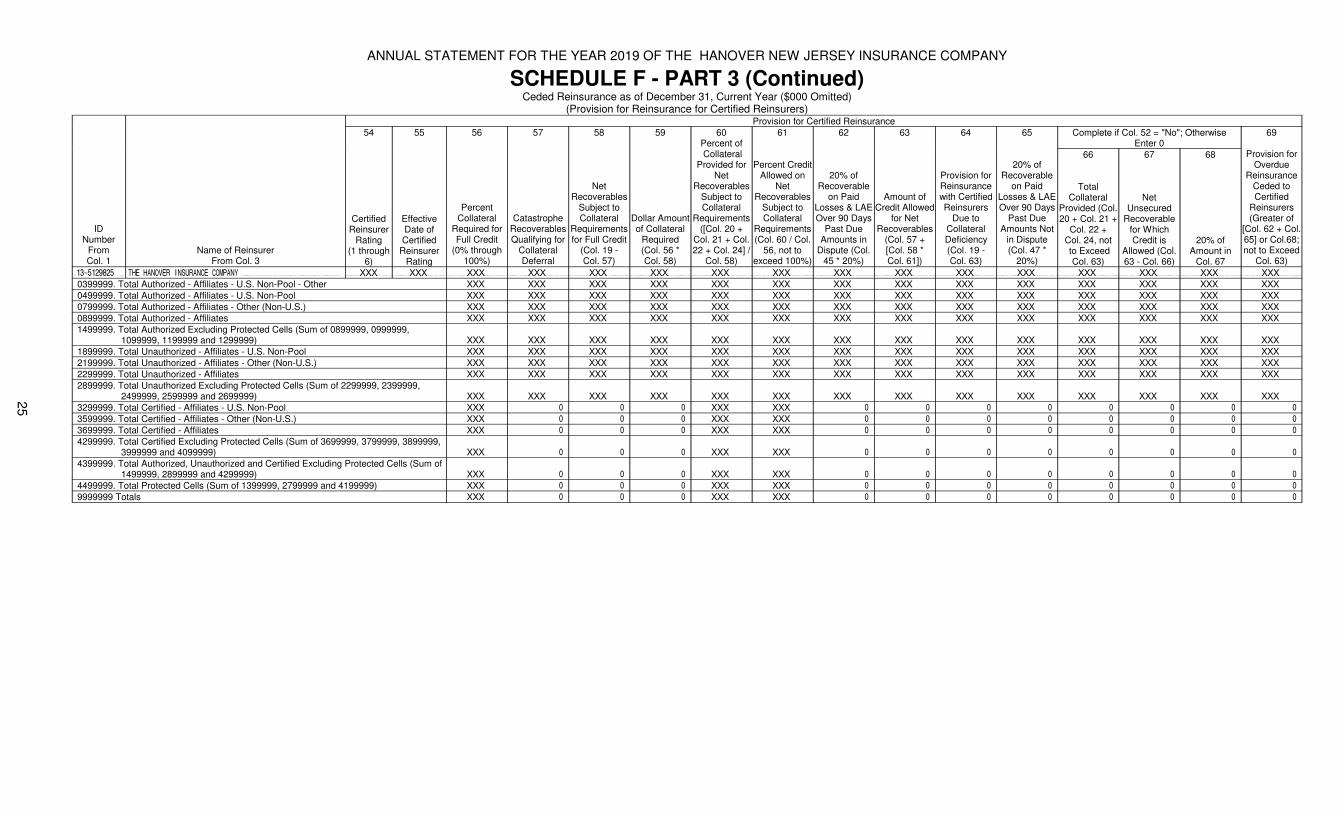
ANNUAL STATEMENT FOR THE YEAR 2019 OF THE HANOVER NEW JERSEY INSURANCE COMPANY
SCHEDULE F - PART 3 (Continued)Ceded Reinsurance as of December 31, Current Year ($000 Omitted)
(Provision for Reinsurance for Certified Reinsurers)Provision for Certified Reinsurance
54 55 56 57 58 59 60Percent of
61 62 63 64 65 Complete if Col. 52 = "No"; OtherwiseEnter 0
69
IDNumber
FromCol. 1
Name of ReinsurerFrom Col. 3
Certified Reinsurer
Rating(1 through
6)
Effective Date ofCertified
Reinsurer Rating
Percent Collateral
Required for Full Credit
(0% through 100%)
Catastrophe Recoverables Qualifying for
Collateral Deferral
Net Recoverables
Subject to Collateral
Requirements for Full Credit
(Col. 19 -Col. 57)
Dollar Amount of Collateral
Required(Col. 56 *Col. 58)
Collateral Provided for
Net Recoverables
Subject to Collateral
Requirements ([Col. 20 +
Col. 21 + Col. 22 + Col. 24] /
Col. 58)
Percent Credit Allowed on
Net Recoverables
Subject to Collateral
Requirements (Col. 60 / Col.
56, not to exceed 100%)
20% of Recoverable
on Paid Losses & LAE Over 90 Days
Past Due Amounts in
Dispute (Col. 45 * 20%)
Amount of Credit Allowed
for Net Recoverables
(Col. 57 + [Col. 58 *Col. 61])
Provision for Reinsurance with Certified Reinsurers
Due to Collateral Deficiency (Col. 19 -Col. 63)
20% of Recoverable
on Paid Losses & LAE Over 90 Days
Past Due Amounts Not
in Dispute (Col. 47 *
20%)
66
Total Collateral
Provided (Col. 20 + Col. 21 +
Col. 22 +Col. 24, not to Exceed
Col. 63)
67
Net Unsecured
Recoverable for Which Credit is
Allowed (Col. 63 - Col. 66)
68
20% of Amount in
Col. 67
Provision for Overdue
Reinsurance Ceded to Certified
Reinsurers (Greater of
[Col. 62 + Col. 65] or Col.68; not to Exceed
Col. 63)
13-5129825 THE HANOVER INSURANCE COMPANY XXX XXX XXX XXX XXX XXX XXX XXX XXX XXX XXX XXX XXX XXX XXX XXX0399999. Total Authorized - Affiliates - U.S. Non-Pool - Other XXX XXX XXX XXX XXX XXX XXX XXX XXX XXX XXX XXX XXX XXX0499999. Total Authorized - Affiliates - U.S. Non-Pool XXX XXX XXX XXX XXX XXX XXX XXX XXX XXX XXX XXX XXX XXX0799999. Total Authorized - Affiliates - Other (Non-U.S.) XXX XXX XXX XXX XXX XXX XXX XXX XXX XXX XXX XXX XXX XXX0899999. Total Authorized - Affiliates XXX XXX XXX XXX XXX XXX XXX XXX XXX XXX XXX XXX XXX XXX1499999. Total Authorized Excluding Protected Cells (Sum of 0899999, 0999999,
1099999, 1199999 and 1299999) XXX XXX XXX XXX XXX XXX XXX XXX XXX XXX XXX XXX XXX XXX1899999. Total Unauthorized - Affiliates - U.S. Non-Pool XXX XXX XXX XXX XXX XXX XXX XXX XXX XXX XXX XXX XXX XXX2199999. Total Unauthorized - Affiliates - Other (Non-U.S.) XXX XXX XXX XXX XXX XXX XXX XXX XXX XXX XXX XXX XXX XXX2299999. Total Unauthorized - Affiliates XXX XXX XXX XXX XXX XXX XXX XXX XXX XXX XXX XXX XXX XXX2899999. Total Unauthorized Excluding Protected Cells (Sum of 2299999, 2399999,
2499999, 2599999 and 2699999) XXX XXX XXX XXX XXX XXX XXX XXX XXX XXX XXX XXX XXX XXX3299999. Total Certified - Affiliates - U.S. Non-Pool XXX 0 0 0 XXX XXX 0 0 0 0 0 0 0 0
3599999. Total Certified - Affiliates - Other (Non-U.S.) XXX 0 0 0 XXX XXX 0 0 0 0 0 0 0 0
3699999. Total Certified - Affiliates XXX 0 0 0 XXX XXX 0 0 0 0 0 0 0 0
4299999. Total Certified Excluding Protected Cells (Sum of 3699999, 3799999, 3899999, 3999999 and 4099999) XXX 0 0 0 XXX XXX 0 0 0 0 0 0 0 0
4399999. Total Authorized, Unauthorized and Certified Excluding Protected Cells (Sum of 1499999, 2899999 and 4299999) XXX 0 0 0 XXX XXX 0 0 0 0 0 0 0 0
4499999. Total Protected Cells (Sum of 1399999, 2799999 and 4199999) XXX 0 0 0 XXX XXX 0 0 0 0 0 0 0 0
9999999 Totals XXX 0 0 0 XXX XXX 0 0 0 0 0 0 0 0
25

ANNUAL STATEMENT FOR THE YEAR 2019 OF THE HANOVER NEW JERSEY INSURANCE COMPANY
SCHEDULE F - PART 3 (Continued)Ceded Reinsurance as of December 31, Current Year ($000 Omitted)
(Total Provision for Reinsurance)70 Provision for Unauthorized Reinsurance Provision for Overdue Authorized Reinsurance Total Provision for Reinsurance
IDNumber
FromCol. 1
Name of ReinsurerFrom Col. 3
20% of Recoverable on Paid Losses & LAE Over90 Days past Due Amounts Not in
Dispute(Col. 47 * 20%)
71
Provision for Reinsurance with
Unauthorized Reinsurers Due to
Collateral Deficiency (Col. 26)
72
Provision for Overdue Reinsurance from
Unauthorized Reinsurers and
Amounts in Dispute(Col. 70 + 20% of the
Amount in Col. 16)
73Complete if
Col. 52 = "Yes"; Otherwise Enter 0
20% of Recoverableon Paid Losses &LAE Over 90 Days Past Due Amounts
Not in Dispute + 20%of Amounts in
Dispute([Col. 47 * 20%] +[Col. 45 * 20%])
74Complete if
Col. 52 = "No"; Otherwise Enter 0
Greater of 20% of Net Recoverable Net of
Funds Held & Collateral, or 20% of Recoverable on Paid
Losses & LAE Over 90 Days Past Due
(Greater of Col. 26 * 20% or
Cols. [40 + 41] * 20%)
75
Provision for Amounts Ceded to Authorized
Reinsurers(Cols. 73 + 74)
76
Provision for Amounts Ceded to Unauthorized
Reinsurers(Cols. 71 + 72 Not in Excess of Col. 15)
77
Provision for Amounts Ceded to Certified
Reinsurers(Cols. 64 + 69)
78
Total Provision for Reinsurance
(Cols. 75 + 76 + 77)13-5129825 THE HANOVER INSURANCE COMPANY 0 XXX XXX 0 0 0 XXX XXX 0
0399999. Total Authorized - Affiliates - U.S. Non-Pool - Other 0 XXX XXX 0 0 0 XXX XXX 0
0499999. Total Authorized - Affiliates - U.S. Non-Pool 0 XXX XXX 0 0 0 XXX XXX 0
0799999. Total Authorized - Affiliates - Other (Non-U.S.) 0 XXX XXX 0 0 0 XXX XXX 0
0899999. Total Authorized - Affiliates 0 XXX XXX 0 0 0 XXX XXX 0
1499999. Total Authorized Excluding Protected Cells (Sum of 0899999, 0999999, 1099999, 1199999 and 1299999) 0 XXX XXX 0 0 0 XXX XXX 0
1899999. Total Unauthorized - Affiliates - U.S. Non-Pool 0 0 0 XXX XXX XXX 0 XXX 0
2199999. Total Unauthorized - Affiliates - Other (Non-U.S.) 0 0 0 XXX XXX XXX 0 XXX 0
2299999. Total Unauthorized - Affiliates 0 0 0 XXX XXX XXX 0 XXX 0
2899999. Total Unauthorized Excluding Protected Cells (Sum of 2299999, 2399999, 2499999, 2599999 and 2699999) 0 0 0 XXX XXX XXX 0 XXX 0
3299999. Total Certified - Affiliates - U.S. Non-Pool XXX XXX XXX XXX XXX XXX XXX 0 0
3599999. Total Certified - Affiliates - Other (Non-U.S.) XXX XXX XXX XXX XXX XXX XXX 0 0
3699999. Total Certified - Affiliates XXX XXX XXX XXX XXX XXX XXX 0 0
4299999. Total Certified Excluding Protected Cells (Sum of 3699999, 3799999, 3899999, 3999999 and 4099999) XXX XXX XXX XXX XXX XXX XXX 0 0
4399999. Total Authorized, Unauthorized and Certified Excluding Protected Cells (Sum of 1499999, 2899999 and 4299999) 0 0 0 0 0 0 0 0 0
4499999. Total Protected Cells (Sum of 1399999, 2799999 and 4199999) 0 0 0 0 0 0 0 0 0
9999999 Totals 0 0 0 0 0 0 0 0 0
26

ANNUAL STATEMENT FOR THE YEAR 2019 OF THE HANOVER NEW JERSEY INSURANCE COMPANY
SCHEDULE F - PART 4Issuing or Confirming Banks for Letters of Credit from Schedule F, Part 3 ($000 Omitted)
1Issuing or Confirming
Bank Reference Number Usedin Col. 23 ofSch F Part 3
2
Letters ofCredit Code
3
American Bankers Association(ABA) Routing Number
4
Issuing or Confirming Bank Name
5
Letters of Credit Amount
Total
NONE
27

ANNUAL STATEMENT FOR THE YEAR 2019 OF THE HANOVER NEW JERSEY INSURANCE COMPANY
SCHEDULE F - PART 5Interrogatories for Schedule F, Part 3 (000 Omitted)
A. Report the five largest provisional commission rates included in the cedant's reinsurance treaties. The commission rate to be reported is by contract with ceded premium in excess of $50,000:
1Name of Reinsurer
2Commission Rate
3Ceded Premium
1. 0.000 0
2. 0.000 0
3. 0.000 0
4. 0.000 0
5. 0.000 0
B. Report the five largest reinsurance recoverables reported in Schedule F, Part 3, Column 15, due from any one reinsurer (based on the total recoverables, Schedule F, Part 3,Line 9999999, Column 15), the amount of ceded premium, and indicate whether the recoverables are due from an affiliated insurer.
1Name of Reinsurer
2Total Recoverables
3Ceded Premiums
4Affiliated
6. THE HANOVER INSURANCE COMPANY 3 0 Yes [ X ] No [ ]
7. 0 0 Yes [ ] No [ ]
8. 0 0 Yes [ ] No [ ]
9. 0 0 Yes [ ] No [ ]
10. 0 0 Yes [ ] No [ ]
NOTE: Disclosure of the five largest provisional commission rates should exclude mandatory pools and joint underwriting associations.
28

ANNUAL STATEMENT FOR THE YEAR 2019 OF THE HANOVER NEW JERSEY INSURANCE COMPANY
SCHEDULE F - PART 6Restatement of Balance Sheet to Identify Net Credit for Reinsurance
1As Reported
(Net of Ceded)
2RestatementAdjustments
3Restated
(Gross of Ceded)
ASSETS (Page 2, Col. 3)
1. Cash and invested assets (Line 12) 30,822,434 0 30,822,434
2. Premiums and considerations (Line 15) 0 0 0
3. Reinsurance recoverable on loss and loss adjustment expense payments (Line 16.1) 0 0 0
4. Funds held by or deposited with reinsured companies (Line 16.2) 0 0 0
5. Other assets 196,268 0 196,268
6. Net amount recoverable from reinsurers 0 3,000 3,000
7. Protected cell assets (Line 27) 0 0 0
8. Totals (Line 28) 31,018,702 3,000 31,021,702
LIABILITIES (Page 3)
9. Losses and loss adjustment expenses (Lines 1 through 3) 0 3,000 3,000
10. Taxes, expenses, and other obligations (Lines 4 through 8) 16,210 0 16,210
11. Unearned premiums (Line 9) 0 0 0
12. Advance premiums (Line 10) 0 0 0
13. Dividends declared and unpaid (Line 11.1 and 11.2) 0 0 0
14. Ceded reinsurance premiums payable (net of ceding commissions (Line 12) 0 0 0
15. Funds held by company under reinsurance treaties (Line 13) 0 0 0
16. Amounts withheld or retained by company for account of others (Line 14) 0 0 0
17. Provision for reinsurance (Line 16) 0 0 0
18. Other liabilities 3,105 0 3,105
19. Total liabilities excluding protected cell business (Line 26) 19,315 3,000 22,315
20. Protected cell liabilities (Line 27) 0 0 0
21. Surplus as regards policyholders (Line 37) 30,999,387 XXX 30,999,387
22. Totals (Line 38) 31,018,702 3,000 31,021,702
NOTE: Is the restatement of this exhibit the result of grossing up balances ceded to affiliates under 100 percent reinsurance or pooling arrangements? Yes [ X ] No [ ]
If yes, give full explanation: The Company ceded 100% of its insurance business to The Hanover Insurance Company, an affiliated insurer.
29

ANNUAL STATEMENT FOR THE YEAR 2019 OF THE HANOVER NEW JERSEY INSURANCE COMPANY
Schedule H - Part 1 - Analysis of Underwriting Operations
N O N E
Schedule H - Part 2 - Reserves and Liabilities
N O N E
Schedule H - Part 3 - Test of Prior Year's Claim Reserves and Liabilities
N O N E
Schedule H - Part 4 - Reinsurance
N O N E
Schedule H - Part 5 - Health Claims
N O N E
30, 31, 32

ANNUAL STATEMENT FOR THE YEAR 2019 OF THE HANOVER NEW JERSEY INSURANCE COMPANY
SCHEDULE P - ANALYSIS OF LOSSES AND LOSS EXPENSESSCHEDULE P - PART 1 - SUMMARY
($000 OMITTED)Premiums Earned Loss and Loss Expense Payments 12
Years inWhich
1 2 3Loss Payments
Defense and Cost Containment Payments
Adjusting and Other Payments
10 11Number of
Premiums Were Earned and
Losses Were Incurred
Direct and Assumed Ceded Net (1 - 2)
4
Direct and Assumed
5
Ceded
6
Direct and Assumed
7
Ceded
8
Direct and Assumed
9
Ceded
Salvage and Subrogation
Received
Total Net Paid Cols
(4 - 5 + 6 - 7 + 8 - 9)
Claims Reported Direct and Assumed
1. Prior XXX XXX XXX (23) (23) 26 26 0 0 0 0 XXX
2. 2010 22,097 22,097 0 11,324 11,324 595 595 1,626 1,626 0 0 XXX
3. 2011 2,011 2,011 0 863 863 36 36 240 240 0 0 XXX
4. 2012 (3) (3) 0 0 0 0 0 0 0 0 0 XXX
5. 2013 0 0 0 0 0 0 0 0 0 0 0 XXX
6. 2014 0 0 0 0 0 0 0 0 0 0 0 XXX
7. 2015 0 0 0 0 0 0 0 0 0 0 0 XXX
8. 2016 0 0 0 0 0 0 0 0 0 0 0 XXX
9. 2017 0 0 0 0 0 0 0 0 0 0 0 XXX
10. 2018 0 0 0 0 0 0 0 0 0 0 0 XXX
11. 2019 0 0 0 0 0 0 0 0 0 0 0 XXX
12. Totals XXX XXX XXX 12,164 12,164 657 657 1,866 1,866 0 0 XXX
Losses Unpaid Defense and Cost Containment Unpaid Adjusting and Other 23 24 25
Case Basis Bulk + IBNR Case Basis Bulk + IBNR Unpaid13
Directand
Assumed
14
Ceded
15
Directand
Assumed
16
Ceded
17
Directand
Assumed
18
Ceded
19
Directand
Assumed
20
Ceded
21
Directand
Assumed
22
Ceded
Salvage and
Subrog-ation
Anticipated
Total Net Losses
and Expenses
Unpaid
Numberof Claims Outstand-
ingDirect and Assumed
1. Prior 3 3 0 0 0 0 0 0 0 0 0 0 XXX
2. 2010 0 0 0 0 0 0 0 0 0 0 0 0 XXX
3. 2011 0 0 0 0 0 0 0 0 0 0 0 0 XXX
4. 2012 0 0 0 0 0 0 0 0 0 0 0 0 XXX
5. 2013 0 0 0 0 0 0 0 0 0 0 0 0 XXX
6. 2014 0 0 0 0 0 0 0 0 0 0 0 0 XXX
7. 2015 0 0 0 0 0 0 0 0 0 0 0 0 XXX
8. 2016 0 0 0 0 0 0 0 0 0 0 0 0 XXX
9. 2017 0 0 0 0 0 0 0 0 0 0 0 0 XXX
10. 2018 0 0 0 0 0 0 0 0 0 0 0 0 XXX
11. 2019 0 0 0 0 0 0 0 0 0 0 0 0 XXX
12. Totals 3 3 0 0 0 0 0 0 0 0 0 0 XXX
TotalLosses and Loss Expenses Incurred
Loss and Loss Expense Percentage (Incurred /Premiums Earned) Nontabular Discount
34 Net Balance Sheet Reserves After Discount
26
Directand
Assumed
27
Ceded
28
Net
29
Directand
Assumed
30
Ceded
31
Net
32
Loss
33
LossExpense
Inter-Company Pooling
ParticipationPercentage
35
Losses Unpaid
36
Loss Expenses
Unpaid
1. Prior XXX XXX XXX XXX XXX XXX 0 0 XXX 0 0
2. 2010 13,546 13,546 0 61.3 61.3 0.0 0 0 0.0 0 0
3. 2011 1,139 1,139 0 56.6 56.6 0.0 0 0 0.0 0 0
4. 2012 0 0 0 0.0 0.0 0.0 0 0 0.0 0 0
5. 2013 0 0 0 0.0 0.0 0.0 0 0 0.0 0 0
6. 2014 0 0 0 0.0 0.0 0.0 0 0 0.0 0 0
7. 2015 0 0 0 0.0 0.0 0.0 0 0 0.0 0 0
8. 2016 0 0 0 0.0 0.0 0.0 0 0 0.0 0 0
9. 2017 0 0 0 0.0 0.0 0.0 0 0 0.0 0 0
10. 2018 0 0 0 0.0 0.0 0.0 0 0 0.0 0 0
11. 2019 0 0 0 0.0 0.0 0.0 0 0 0.0 0 0
12. Totals XXX XXX XXX XXX XXX XXX 0 0 XXX 0 0
Note: Parts 2 and 4 are gross of all discounting, including tabular discounting. Part 1 is gross of only nontabular discounting, which is reported in Columns 32 and 33 of Part 1. The tabular discount, if any, is reported in the Notes to Financial Statements which will reconcile Part 1 with Parts 2 and 4.
33

ANNUAL STATEMENT FOR THE YEAR 2019 OF THE HANOVER NEW JERSEY INSURANCE COMPANY
Schedule P - Part 2 - Summary
N O N E
Schedule P - Part 3 - Summary
N O N E
Schedule P - Part 4 - Summary
N O N E
34

ANNUAL STATEMENT FOR THE YEAR 2019 OF THE HANOVER NEW JERSEY INSURANCE COMPANY
SCHEDULE P - PART 1A - HOMEOWNERS/FARMOWNERS($000 OMITTED)
Premiums Earned Loss and Loss Expense Payments 12Years inWhich
1 2 3Loss Payments
Defense and Cost Containment Payments
Adjusting and Other Payments
10 11Number of
Premiums Were Earned and
Losses Were Incurred
Direct and Assumed Ceded Net (1 - 2)
4
Direct and Assumed
5
Ceded
6
Direct and Assumed
7
Ceded
8
Direct and Assumed
9
Ceded
Salvage and Subrogation
Received
Total Net Paid Cols
(4 - 5 + 6 - 7 + 8 - 9)
Claims ReportedDirect and Assumed
1. Prior XXX XXX XXX XXX
2. 2010
3. 2011
4. 2012
5. 2013
6. 2014
7. 2015
8. 2016
9. 2017
10. 2018
11. 2019
12. Totals XXX XXX XXX XXX
Losses Unpaid Defense and Cost Containment Unpaid Adjusting and23 24 25
Case Basis Bulk + IBNR Case Basis Bulk + IBNR Other Unpaid13
Directand
Assumed
14
Ceded
15
Directand
Assumed
16
Ceded
17
Directand
Assumed
18
Ceded
19
Directand
Assumed
20
Ceded
21
Directand
Assumed
22
Ceded
Salvage and
Subrog-ation
Anticipated
Total Net Losses
and Expenses
Unpaid
Numberof Claims Outstand-
ingDirect and Assumed
1. Prior
2. 2010
3. 2011
4. 2012
5. 2013
6. 2014
7. 2015
8. 2016
9. 2017
10. 2018
11. 2019
12. Totals
TotalLosses and Loss Expenses Incurred
Loss and Loss Expense Percentage (Incurred /Premiums Earned) Nontabular Discount
34 Net Balance Sheet Reserves After Discount
26
Directand
Assumed
27
Ceded
28
Net
29
Directand
Assumed
30
Ceded
31
Net
32
Loss
33
LossExpense
Inter-Company Pooling
ParticipationPercentage
35
Losses Unpaid
36
Loss Expenses
Unpaid
1. Prior XXX XXX XXX XXX XXX XXX XXX
2. 2010
3. 2011
4. 2012
5. 2013
6. 2014
7. 2015
8. 2016
9. 2017
10. 2018
11. 2019
12. Totals XXX XXX XXX XXX XXX XXX XXX
NONE
35
NONE
NONE

ANNUAL STATEMENT FOR THE YEAR 2019 OF THE HANOVER NEW JERSEY INSURANCE COMPANY
SCHEDULE P - PART 1B - PRIVATE PASSENGER AUTO LIABILITY/MEDICAL($000 OMITTED)
Premiums Earned Loss and Loss Expense Payments 12Years inWhich
1 2 3Loss Payments
Defense and Cost Containment Payments
Adjusting and Other Payments
10 11Number of
Premiums Were Earned and
Losses Were Incurred
Direct and Assumed Ceded Net (1 - 2)
4
Direct and Assumed
5
Ceded
6
Direct and Assumed
7
Ceded
8
Direct and Assumed
9
Ceded
Salvage and Subrogation
Received
Total Net Paid Cols
(4 - 5 + 6 - 7 + 8 - 9)
Claims ReportedDirect and Assumed
1. Prior XXX XXX XXX (18) (18) 26 26 0 0 0 0 XXX
2. 2010 14,722 14,722 0 8,446 8,446 591 591 1,056 1,056 0 0 1,590
3. 2011 1,317 1,317 0 598 598 31 31 185 185 0 0 134
4. 2012 (3) (3) 0 0 0 0 0 0 0 0 0 0
5. 2013 (1) (1) 0 0 0 0 0 0 0 0 0 0
6. 2014 0 0 0 0 0 0 0 0 0 0 0 0
7. 2015 0 0 0 0 0 0 0 0 0 0 0 0
8. 2016 0 0 0 0 0 0 0 0 0 0 0 0
9. 2017 0 0 0 0 0 0 0 0 0 0 0 0
10. 2018 0 0 0 0 0 0 0 0 0 0 0 0
11. 2019 0 0 0 0 0 0 0 0 0 0 0 0
12. Totals XXX XXX XXX 9,026 9,026 648 648 1,241 1,241 0 0 XXX
Losses Unpaid Defense and Cost Containment Unpaid Adjusting and23 24 25
Case Basis Bulk + IBNR Case Basis Bulk + IBNR Other Unpaid13
Directand
Assumed
14
Ceded
15
Directand
Assumed
16
Ceded
17
Directand
Assumed
18
Ceded
19
Directand
Assumed
20
Ceded
21
Directand
Assumed
22
Ceded
Salvage and
Subrog-ation
Anticipated
Total Net Losses
and Expenses
Unpaid
Numberof Claims Outstand-
ingDirect and Assumed
1. Prior 3 3 0 0 0 0 0 0 0 0 0 0 1
2. 2010 0 0 0 0 0 0 0 0 0 0 0 0 0
3. 2011 0 0 0 0 0 0 0 0 0 0 0 0 0
4. 2012 0 0 0 0 0 0 0 0 0 0 0 0 0
5. 2013 0 0 0 0 0 0 0 0 0 0 0 0 0
6. 2014 0 0 0 0 0 0 0 0 0 0 0 0 0
7. 2015 0 0 0 0 0 0 0 0 0 0 0 0 0
8. 2016 0 0 0 0 0 0 0 0 0 0 0 0 0
9. 2017 0 0 0 0 0 0 0 0 0 0 0 0 0
10. 2018 0 0 0 0 0 0 0 0 0 0 0 0 0
11. 2019 0 0 0 0 0 0 0 0 0 0 0 0 0
12. Totals 3 3 0 0 0 0 0 0 0 0 0 0 1
TotalLosses and Loss Expenses Incurred
Loss and Loss Expense Percentage (Incurred /Premiums Earned) Nontabular Discount
34 Net Balance Sheet Reserves After Discount
26
Directand
Assumed
27
Ceded
28
Net
29
Directand
Assumed
30
Ceded
31
Net
32
Loss
33
LossExpense
Inter-Company Pooling
ParticipationPercentage
35
Losses Unpaid
36
Loss Expenses
Unpaid
1. Prior XXX XXX XXX XXX XXX XXX 0 0 XXX 0 0
2. 2010 10,093 10,093 0 68.6 68.6 0.0 0 0 0.0 0 0
3. 2011 814 814 0 61.8 61.8 0.0 0 0 0.0 0 0
4. 2012 0 0 0 0.0 0.0 0.0 0 0 0.0 0 0
5. 2013 0 0 0 0.0 0.0 0.0 0 0 0.0 0 0
6. 2014 0 0 0 0.0 0.0 0.0 0 0 0.0 0 0
7. 2015 0 0 0 0.0 0.0 0.0 0 0 0.0 0 0
8. 2016 0 0 0 0.0 0.0 0.0 0 0 0.0 0 0
9. 2017 0 0 0 0.0 0.0 0.0 0 0 0.0 0 0
10. 2018 0 0 0 0.0 0.0 0.0 0 0 0.0 0 0
11. 2019 0 0 0 0.0 0.0 0.0 0 0 0.0 0 0
12. Totals XXX XXX XXX XXX XXX XXX 0 0 XXX 0 0
36

ANNUAL STATEMENT FOR THE YEAR 2019 OF THE HANOVER NEW JERSEY INSURANCE COMPANY
Schedule P - Part 1C - Commercial Auto/Truck Liability/Medical
N O N E
Schedule P - Part 1D - Workers' Compensation (Excluding Excess Workers' Compensation)
N O N E
Schedule P - Part 1E - Commercial Multiple Peril
N O N E
Schedule P - Part 1F - Section 1 - Medical Professional Liability - Occurrence
N O N E
Schedule P - Part 1F - Section 2 - Medical Professional Liability - Claims-Made
N O N E
Schedule P - Part 1G - Special Liability (Ocean Marine, Aircraft (all perils), Boiler and Machinery)
N O N E
Schedule P - Part 1H - Section 1 - Other Liability - Occurrence
N O N E
Schedule P - Part 1H - Section 2 - Other Liability - Claims-Made
N O N E
Schedule P - Part 1I - Special Property (Fire, Allied Lines...)
N O N E
37, 38, 39, 40, 41, 42, 43, 44, 45

ANNUAL STATEMENT FOR THE YEAR 2019 OF THE HANOVER NEW JERSEY INSURANCE COMPANY
SCHEDULE P - PART 1J - AUTO PHYSICAL DAMAGE($000 OMITTED)
Premiums Earned Loss and Loss Expense Payments 12Years inWhich
1 2 3Loss Payments
Defense and Cost Containment Payments
Adjusting and Other Payments
10 11Number of
Premiums Were Earned and
Losses Were Incurred
Direct and Assumed Ceded Net (1 - 2)
4
Direct and Assumed
5
Ceded
6
Direct and Assumed
7
Ceded
8
Direct and Assumed
9
Ceded
Salvage and Subrogation
Received
Total Net Paid Cols
(4 - 5 + 6 - 7 + 8 - 9)
Claims ReportedDirect and Assumed
1. Prior XXX XXX XXX (4) (4) 0 0 0 0 0 0 XXX
2. 2018 0 0 0 0 0 0 0 0 0 0 0 0
3. 2019 0 0 0 0 0 0 0 0 0 0 0 0
4. Totals XXX XXX XXX (4) (4) 0 0 0 0 0 0 XXX
Losses Unpaid Defense and Cost Containment Unpaid Adjusting and23 24 25
Case Basis Bulk + IBNR Case Basis Bulk + IBNR Other Unpaid13
Directand
Assumed
14
Ceded
15
Directand
Assumed
16
Ceded
17
Directand
Assumed
18
Ceded
19
Directand
Assumed
20
Ceded
21
Directand
Assumed
22
Ceded
Salvage and
Subrog-ation
Anticipated
Total Net Losses
and Expenses
Unpaid
Numberof Claims Outstand-
ingDirect and Assumed
1. Prior 0 0 0 0 0 0 0 0 0 0 0 0 0
2. 2018 0 0 0 0 0 0 0 0 0 0 0 0 0
3. 2019 0 0 0 0 0 0 0 0 0 0 0 0 0
4. Totals 0 0 0 0 0 0 0 0 0 0 0 0 0
TotalLosses and Loss Expenses Incurred
Loss and Loss Expense Percentage (Incurred /Premiums Earned) Nontabular Discount
34 Net Balance Sheet Reserves After Discount
26
Directand
Assumed
27
Ceded
28
Net
29
Directand
Assumed
30
Ceded
31
Net
32
Loss
33
LossExpense
Inter-Company Pooling
ParticipationPercentage
35
Losses Unpaid
36
Loss Expenses
Unpaid
1. Prior XXX XXX XXX XXX XXX XXX 0 0 XXX 0 0
2. 2018 0 0 0 0.0 0.0 0.0 0 0 0.0 0 0
3. 2019 0 0 0 0.0 0.0 0.0 0 0 0.0 0 0
4. Totals XXX XXX XXX XXX XXX XXX 0 0 XXX 0 0
46

ANNUAL STATEMENT FOR THE YEAR 2019 OF THE HANOVER NEW JERSEY INSURANCE COMPANY
Schedule P - Part 1K - Fidelity/Surety
N O N E
Schedule P - Part 1L - Other (Including Credit, Accident and Health)
N O N E
Schedule P - Part 1M - International
N O N E
Schedule P - Part 1N - Reinsurance - Nonproportional Assumed Property
N O N E
Schedule P - Part 1O - Reinsurance - Nonproportional Assumed Liability
N O N E
Schedule P - Part 1P - Reinsurance - Nonproportional Assumed Financial Lines
N O N E
Schedule P - Part 1R - Section 1 - Products Liability - Occurrence
N O N E
Schedule P - Part 1R - Section 2 - Products Liability - Claims-Made
N O N E
Schedule P - Part 1S - Financial Guaranty/Mortgage Guaranty
N O N E
Schedule P - Part 1T - Warranty
N O N E
Schedule P - Part 2A - Homeowners/Farmowners
N O N E
Schedule P - Part 2B - Private Passenger Auto Liability/Medical
N O N E
Schedule P - Part 2C - Commercial Auto/Truck Liability/Medical
N O N E
Schedule P - Part 2D - Workers' Compensation (Excluding Excess Workers' Compensation)
N O N E
47, 48, 49, 50, 51, 52, 53, 54, 55, 56, 57
ANNUAL STATEMENT FOR THE YEAR 2019 OF THE HANOVER NEW JERSEY INSURANCE COMPANY
Schedule P - Part 2E - Commercial Multiple Peril
N O N E
Schedule P - Part 2F - Section 1 - Medical Professional Liability - Occurrence
N O N E
Schedule P - Part 2F - Section 2 - Medical Professional Liability - Claims-Made
N O N E
Schedule P - Part 2G - Special Liability (Ocean Marine, Aircraft (all perils), Boiler and Machinery)
N O N E
Schedule P - Part 2H - Section 1 - Other Liability - Occurrence
N O N E
Schedule P - Part 2H - Section 2- Other Liability - Claims-Made
N O N E
Schedule P - Part 2I - Special Property
N O N E
Schedule P - Part 2J - Auto Physical Damage
N O N E
Schedule P - Part 2K - Fidelity/Surety
N O N E
Schedule P - Part 2L - Other (Including Credit, Accident and Health)
N O N E
Schedule P - Part 2M - International
N O N E
Schedule P - Part 2N - Reinsurance - Nonproportional Assumed Property
N O N E
Schedule P - Part 2O - Reinsurance - Nonproportional Assumed Liability
N O N E
Schedule P - Part 2P - Reinsurance - Nonproportional Assumed Financial Lines
N O N E
57, 58, 59, 60

ANNUAL STATEMENT FOR THE YEAR 2019 OF THE HANOVER NEW JERSEY INSURANCE COMPANY
Schedule P - Part 2R - Section 1 - Products Liability - Occurrence
N O N E
Schedule P - Part 2R - Section 2 - Products Liability - Claims-Made
N O N E
Schedule P - Part 2S - Financial Guaranty/Mortgage Guaranty
N O N E
Schedule P - Part 2T - Warranty
N O N E
61

ANNUAL STATEMENT FOR THE YEAR 2019 OF THE HANOVER NEW JERSEY INSURANCE COMPANY
SCHEDULE P - PART 3A - HOMEOWNERS/FARMOWNERSCUMULATIVE PAID NET LOSSES AND DEFENSE AND COST CONTAINMENT EXPENSES REPORTED AT YEAR END
($000 OMITTED)11
Number of12
Number ofYears inWhichLossesWere
Incurred
1
2010
2
2011
3
2012
4
2013
5
2014
6
2015
7
2016
8
2017
9
2018
10
2019
ClaimsClosedWithLoss
Payment
ClaimsClosedWithout
LossPayment
1. Prior 000
2. 2010
3. 2011 XXX
4. 2012 XXX XXX
5. 2013 XXX XXX XXX
6. 2014 XXX XXX XXX XXX
7. 2015 XXX XXX XXX XXX XXX
8. 2016 XXX XXX XXX XXX XXX XXX
9. 2017 XXX XXX XXX XXX XXX XXX XXX
10. 2018 XXX XXX XXX XXX XXX XXX XXX XXX
11. 2019 XXX XXX XXX XXX XXX XXX XXX XXX XXX
SCHEDULE P - PART 3B - PRIVATE PASSENGER AUTO LIABILITY/MEDICAL1. Prior 000 0 0 0 0 0 0 0 0 0 547 0
2. 2010 0 0 0 0 0 0 0 0 0 0 1,063 527
3. 2011 XXX 0 0 0 0 0 0 0 0 0 89 45
4. 2012 XXX XXX 0 0 0 0 0 0 0 0 0 0
5. 2013 XXX XXX XXX 0 0 0 0 0 0 0 0 0
6. 2014 XXX XXX XXX XXX 0 0 0 0 0 0 0 0
7. 2015 XXX XXX XXX XXX XXX 0 0 0 0 0 0 0
8. 2016 XXX XXX XXX XXX XXX XXX 0 0 0 0 0 0
9. 2017 XXX XXX XXX XXX XXX XXX XXX 0 0 0 0 0
10. 2018 XXX XXX XXX XXX XXX XXX XXX XXX 0 0 0 0
11. 2019 XXX XXX XXX XXX XXX XXX XXX XXX XXX 0 0 0
SCHEDULE P - PART 3C - COMMERCIAL AUTO/TRUCK LIABILITY/MEDICAL1. Prior 000
2. 2010
3. 2011 XXX
4. 2012 XXX XXX
5. 2013 XXX XXX XXX
6. 2014 XXX XXX XXX XXX
7. 2015 XXX XXX XXX XXX XXX
8. 2016 XXX XXX XXX XXX XXX XXX
9. 2017 XXX XXX XXX XXX XXX XXX XXX
10. 2018 XXX XXX XXX XXX XXX XXX XXX XXX
11. 2019 XXX XXX XXX XXX XXX XXX XXX XXX XXX
SCHEDULE P - PART 3D - WORKERS' COMPENSATION(EXCLUDING EXCESS WORKERS’ COMPENSATION)
1. Prior 000
2. 2010
3. 2011 XXX
4. 2012 XXX XXX
5. 2013 XXX XXX XXX
6. 2014 XXX XXX XXX XXX
7. 2015 XXX XXX XXX XXX XXX
8. 2016 XXX XXX XXX XXX XXX XXX
9. 2017 XXX XXX XXX XXX XXX XXX XXX
10. 2018 XXX XXX XXX XXX XXX XXX XXX XXX
11. 2019 XXX XXX XXX XXX XXX XXX XXX XXX XXX
SCHEDULE P - PART 3E - COMMERCIAL MULTIPLE PERIL1. Prior 000
2. 2010
3. 2011 XXX
4. 2012 XXX XXX
5. 2013 XXX XXX XXX
6. 2014 XXX XXX XXX XXX
7. 2015 XXX XXX XXX XXX XXX
8. 2016 XXX XXX XXX XXX XXX XXX
9. 2017 XXX XXX XXX XXX XXX XXX XXX
10. 2018 XXX XXX XXX XXX XXX XXX XXX XXX
11. 2019 XXX XXX XXX XXX XXX XXX XXX XXX XXX
NONE
NONE
62
NONE
NONE

ANNUAL STATEMENT FOR THE YEAR 2019 OF THE HANOVER NEW JERSEY INSURANCE COMPANY
Schedule P - Part 3F - Section 1 - Medical Professional Liability - Occurrence
N O N E
Schedule P - Part 3F - Section 2 - Medical Professional Liability - Claims-Made
N O N E
Schedule P - Part 3G - Special Liability
N O N E
Schedule P - Part 3H - Section 1 - Other Liability - Occurrence
N O N E
Schedule P - Part 3H - Section 2 - Other Liability - Claims-Made
N O N E
Schedule P - Part 3I - Special Property
N O N E
Schedule P - Part 3J - Auto Physical Damage
N O N E
Schedule P - Part 3K - Fidelity/Surety
N O N E
Schedule P - Part 3L - Other (Including Credit, Accident and Health)
N O N E
Schedule P - Part 3M - International
N O N E
Schedule P - Part 3N - Reinsurance - Nonproportional Assumed Property
N O N E
Schedule P - Part 3O - Reinsurance - Nonproportional Assumed Liability
N O N E
Schedule P - Part 3P - Reinsurance - Nonproportional Assumed Financial Lines
N O N E
Schedule P - Part 3R - Section 1 - Product Liability - Occurrence
N O N E
63, 64, 65, 66

ANNUAL STATEMENT FOR THE YEAR 2019 OF THE HANOVER NEW JERSEY INSURANCE COMPANY
Schedule P - Part 3R - Section 2 - Product Liability - Claims-Made
N O N E
Schedule P - Part 3S - Financial Guaranty/Mortgage Guaranty
N O N E
Schedule P - Part 3T - Warranty
N O N E
Schedule P - Part 4A - Homeowners/Farmowners
N O N E
Schedule P - Part 4B - Private Passenger Auto Liability/Medical
N O N E
Schedule P - Part 4C - Commercial Auto/Truck Liability/Medical
N O N E
Schedule P - Part 4D - Workers' Compensation (Excluding Excess Workers' Compensation)
N O N E
Schedule P - Part 4E - Commercial Multiple Peril
N O N E
Schedule P - Part 4F - Section 1 - Medical Professional Liability - Occurrence
N O N E
Schedule P - Part 4F - Section 2 - Medical Professional Liability - Claims-Made
N O N E
Schedule P - Part 4G - Special Liability
N O N E
Schedule P - Part 4H - Section 1 - Other Liability - Occurrence
N O N E
Schedule P - Part 4H - Section 2 - Other Liability - Claims-Made
N O N E
Schedule P - Part 4I - Special Property
N O N E
66, 67, 68, 69

ANNUAL STATEMENT FOR THE YEAR 2019 OF THE HANOVER NEW JERSEY INSURANCE COMPANY
Schedule P - Part 4J - Auto Physical Damage
N O N E
Schedule P - Part 4K - Fidelity/Surety
N O N E
Schedule P - Part 4L - Other (Including Credit, Accident and Health)
N O N E
Schedule P - Part 4M - International
N O N E
Schedule P - Part 4N - Reinsurance - Nonproportional Assumed Property
N O N E
Schedule P - Part 4O - Reinsurance - Nonproportional Assumed Liability
N O N E
Schedule P - Part 4P - Reinsurance - Nonproportional Assumed Financial Lines
N O N E
Schedule P - Part 4R - Section 1 - Products Liability - Occurrence
N O N E
Schedule P - Part 4R - Section 2 - Products Liability - Claims-Made
N O N E
Schedule P - Part 4S - Financial Guaranty/Mortgage Guaranty
N O N E
Schedule P - Part 4T - Warranty
N O N E
Schedule P - Part 5A - Homeowners/Farmowners - Section 1
N O N E
Schedule P - Part 5A - Homeowners/Farmowners - Section 2
N O N E
Schedule P - Part 5A - Homeowners/Farmowners - Section 3
N O N E
69, 70, 71, 72

ANNUAL STATEMENT FOR THE YEAR 2019 OF THE HANOVER NEW JERSEY INSURANCE COMPANY
SCHEDULE P - PART 5B - PRIVATE PASSENGER AUTO LIABILITY/MEDICALSECTION 1
CUMULATIVE NUMBER OF CLAIMS CLOSED WITH LOSS PAYMENT DIRECT AND ASSUMED AT YEAR ENDYears in Which
PremiumsWere Earnedand Losses
Were Incurred
1
2010
2
2011
3
2012
4
2013
5
2014
6
2015
7
2016
8
2017
9
2018
10
2019
1. Prior 780 225 194 76 29 14 3 4 1 1
2. 2010 687 888 1,007 1,036 1,055 1,059 1,061 1,063 1,063 1,063
3. 2011 XXX 60 81 86 87 89 89 89 89 89
4. 2012 XXX XXX 0 0 0 0 0 0 0 0
5. 2013 XXX XXX XXX 0 0 0 0 0 0 0
6. 2014 XXX XXX XXX XXX 0 0 0 0 0 0
7. 2015 XXX XXX XXX XXX XXX 0 0 0 0 0
8. 2016 XXX XXX XXX XXX XXX XXX 0 0 0 0
9. 2017 XXX XXX XXX XXX XXX XXX XXX 0 0 0
10. 2018 XXX XXX XXX XXX XXX XXX XXX XXX 0 0
11. 2019 XXX XXX XXX XXX XXX XXX XXX XXX XXX 0
SECTION 2NUMBER OF CLAIMS OUTSTANDING DIRECT AND ASSUMED AT YEAR END
Years in Which Premiums
Were Earnedand Losses
Were Incurred
1
2010
2
2011
3
2012
4
2013
5
2014
6
2015
7
2016
8
2017
9
2018
10
2019
1. Prior 469 282 103 40 18 8 6 2 2 1
2. 2010 347 159 52 27 10 8 7 4 3 0
3. 2011 XXX 23 3 1 2 0 0 0 0 0
4. 2012 XXX XXX 0 0 0 0 0 0 0 0
5. 2013 XXX XXX XXX 0 0 0 0 0 0 0
6. 2014 XXX XXX XXX XXX 0 0 0 0 0 0
7. 2015 XXX XXX XXX XXX XXX 0 0 0 0 0
8. 2016 XXX XXX XXX XXX XXX XXX 0 0 0 0
9. 2017 XXX XXX XXX XXX XXX XXX XXX 0 0 0
10. 2018 XXX XXX XXX XXX XXX XXX XXX XXX 0 0
11. 2019 XXX XXX XXX XXX XXX XXX XXX XXX XXX 0
SECTION 3CUMULATIVE NUMBER OF CLAIMS REPORTED DIRECT AND ASSUMED AT YEAR END
Years in Which Premiums
Were Earnedand Losses
Were Incurred
1
2010
2
2011
3
2012
4
2013
5
2014
6
2015
7
2016
8
2017
9
2018
10
2019
1. Prior 455 106 51 26 9 6 1 0 1 0
2. 2010 1,396 1,531 1,568 1,580 1,586 1,589 1,590 1,590 1,590 1,590
3. 2011 XXX 123 129 132 134 134 134 134 134 134
4. 2012 XXX XXX 0 0 0 0 0 0 0 0
5. 2013 XXX XXX XXX 0 0 0 0 0 0 0
6. 2014 XXX XXX XXX XXX 0 0 0 0 0 0
7. 2015 XXX XXX XXX XXX XXX 0 0 0 0 0
8. 2016 XXX XXX XXX XXX XXX XXX 0 0 0 0
9. 2017 XXX XXX XXX XXX XXX XXX XXX 0 0 0
10. 2018 XXX XXX XXX XXX XXX XXX XXX XXX 0 0
11. 2019 XXX XXX XXX XXX XXX XXX XXX XXX XXX 0
73

ANNUAL STATEMENT FOR THE YEAR 2019 OF THE HANOVER NEW JERSEY INSURANCE COMPANY
Schedule P - Part 5C - Commercial Auto/Truck Liability/Medical - Section 1
N O N E
Schedule P - Part 5C - Commercial Auto/Truck Liability/Medical - Section 2
N O N E
Schedule P - Part 5C - Commercial Auto/Truck Liability/Medical - Section 3
N O N E
Schedule P-Part 5D-Workers' Compensation (Excluding Excess Workers' Compensation)-Section 1
N O N E
Schedule P-Part 5D-Workers' Compensation (Excluding Excess Workers' Compensation)-Section 2
N O N E
Schedule P-Part 5D-Workers' Compensation (Excluding Excess Workers' Compensation)-Section 3
N O N E
Schedule P - Part 5E - Commercial Multiple Peril - Section 1
N O N E
Schedule P - Part 5E - Commercial Multiple Peril - Section 2
N O N E
Schedule P - Part 5E - Commercial Multiple Peril - Section 3
N O N E
Schedule P - Part 5F - Medical Professional Liability - Occurrence - Section 1A
N O N E
Schedule P - Part 5F - Medical Professional Liability - Occurrence - Section 2A
N O N E
Schedule P - Part 5F - Medical Professional Liability - Occurrence - Section 3A
N O N E
Schedule P - Part 5F - Medical Professional Liability - Claims-Made - Section 1B
N O N E
Schedule P - Part 5F - Medical Professional Liability - Claims-Made - Section 2B
N O N E
74, 75, 76, 77, 78

ANNUAL STATEMENT FOR THE YEAR 2019 OF THE HANOVER NEW JERSEY INSURANCE COMPANY
Schedule P - Part 5F - Medical Professional Liability - Claims-Made - Section 3B
N O N E
Schedule P - Part 5H - Other Liability - Occurrence - Section 1A
N O N E
Schedule P - Part 5H - Other Liability - Occurrence - Section 2A
N O N E
Schedule P - Part 5H - Other Liability - Occurrence - Section 3A
N O N E
Schedule P - Part 5H - Other Liability - Claims-Made - Section 1B
N O N E
Schedule P - Part 5H - Other Liability - Claims-Made - Section 2B
N O N E
Schedule P - Part 5H - Other Liability - Claims-Made - Section 3B
N O N E
Schedule P - Part 5R - Products Liability - Occurrence - Section 1A
N O N E
Schedule P - Part 5R - Products Liability - Occurrence - Section 2A
N O N E
Schedule P - Part 5R - Products Liability - Occurrence - Section 3A
N O N E
Schedule P - Part 5R - Products Liability - Claims-Made - Section 1B
N O N E
Schedule P - Part 5R - Products Liability - Claims-Made - Section 2B
N O N E
Schedule P - Part 5R - Products Liability - Claims-Made - Section 3B
N O N E
Schedule P - Part 5T - Warranty - Section 1
N O N E
78, 79, 80, 81, 82, 83

ANNUAL STATEMENT FOR THE YEAR 2019 OF THE HANOVER NEW JERSEY INSURANCE COMPANY
Schedule P - Part 5T - Warranty - Section 2
N O N E
Schedule P - Part 5T - Warranty - Section 3
N O N E
Schedule P - Part 6C - Commercial Auto/Truck Liability/Medical - Section 1
N O N E
Schedule P - Part 6C - Commercial Auto/Truck Liability/Medical - Section 2
N O N E
Schedule P-Part 6D-Workers' Compensation (Excluding Excess Workers' Compensation)-Section 1
N O N E
Schedule P-Part 6D-Workers' Compensation (Excluding Excess Workers' Compensation)-Section 2
N O N E
Schedule P - Part 6E - Commercial Multiple Peril - Section 1
N O N E
Schedule P - Part 6E - Commercial Multiple Peril - Section 2
N O N E
Schedule P - Part 6H - Other Liability - Occurrence - Section 1A
N O N E
Schedule P - Part 6H - Other Liability - Occurrence - Section 2A
N O N E
Schedule P - Part 6H - Other Liability - Claims-Made - Section 1B
N O N E
Schedule P - Part 6H - Other Liability - Claims-Made - Section 2B
N O N E
Schedule P - Part 6M - International - Section 1
N O N E
Schedule P - Part 6M - International - Section 2
N O N E
83, 84, 85, 86
ANNUAL STATEMENT FOR THE YEAR 2019 OF THE HANOVER NEW JERSEY INSURANCE COMPANY
Schedule P - Part 6N- Reinsurance A - Nonproportional Assumed Property - Section 1
N O N E
Schedule P - Part 6N- Reinsurance A - Nonproportional Assumed Property - Section 2
N O N E
Schedule P - Part 6O - Reinsurance B - Nonproportional Liability - Section 1
N O N E
Schedule P - Part 6O - Reinsurance B - Nonproportional Assumed Liability - Section 2
N O N E
Schedule P - Part 6R - Products Liability - Occurrence - Section 1A
N O N E
Schedule P - Part 6R - Products Liability - Occurrence - Section 2A
N O N E
Schedule P - Part 6R - Products Liability - Claims-Made - Section 1B
N O N E
Schedule P - Part 6R - Products Liability - Claims-Made - Section 2B
N O N E
Schedule P - Part 7A - Section 1 - Primary Loss Sensitive Contracts
N O N E
Schedule P - Part 7A - Section 2 - Primary Loss Sensitive Contracts
N O N E
Schedule P - Part 7A - Section 3 - Primary Loss Sensitive Contracts
N O N E
Schedule P - Part 7A - Section 4 - Primary Loss Sensitive Contracts
N O N E
Schedule P - Part 7A - Section 5 - Primary Loss Sensitive Contracts
N O N E
Schedule P - Part 7B - Section 1 - Reinsurance Loss Sensitive Contracts
N O N E
87, 88, 89, 90, 91

ANNUAL STATEMENT FOR THE YEAR 2019 OF THE HANOVER NEW JERSEY INSURANCE COMPANY
Schedule P - Part 7B - Section 2 - Reinsurance Loss Sensitive Contracts
N O N E
Schedule P - Part 7B - Section 3 - Reinsurance Loss Sensitive Contracts
N O N E
Schedule P - Part 7B - Section 4 - Reinsurance Loss Sensitive Contracts
N O N E
Schedule P - Part 7B - Section 5 - Reinsurance Loss Sensitive Contracts
N O N E
Schedule P - Part 7B - Section 6 - Reinsurance Loss Sensitive Contracts
N O N E
Schedule P - Part 7B - Section 7 - Reinsurance Loss Sensitive Contracts
N O N E
91, 92

ANNUAL STATEMENT FOR THE YEAR 2019 OF THE HANOVER NEW JERSEY INSURANCE COMPANY
SCHEDULE P INTERROGATORIES
1. The following questions relate to yet-to-be-issued Extended Reporting Endorsements (EREs) arising from Death, Disability, or Retirement (DDR) provisions in Medical Professional Liability Claims Made insurance policies. EREs provided for reasons other than DDR are not to be included.
1.1 Does the company issue Medical Professional Liability Claims Made insurance policies that provide tail (also known as an extended reporting endorsement, or “ERE”) benefits in the event of Death, Disability, or Retirement (DDR) at a reduced charge or at no additional cost? Yes [ ] No [ X ]
If the answer to question 1.1 is “no”, leave the following questions blank. If the answer to question 1.1 is “yes”, please answer the following questions:
1.2 What is the total amount of the reserve for that provision (DDR Reserve), as reported, explicitly or not, elsewhere in this statement (in dollars)? $ 0
1.3 Does the company report any DDR reserve as Unearned Premium Reserve per SSAP #65? Yes [ ] No [ ]
1.4 Does the company report any DDR reserve as loss or loss adjustment expense reserve? Yes [ ] No [ ]
1.5 If the company reports DDR reserve as Unearned Premium Reserve, does that amount match the figure on the Underwriting and Investment Exhibit, Part 1A - Recapitulation of all Premiums (Page 7) Column 2, Lines 11.1 plus 11.2? Yes [ ] No [ ] N/A [ ]
1.6 If the company reports DDR reserve as loss or loss adjustment expense reserve, please complete the following table corresponding to where these reserves are reported in Schedule P:
DDR Reserve Included inSchedule P, Part 1F, Medical Professional Liability
Column 24: Total Net Losses and Expenses Unpaid
Years in Which Premiums Were Earned and Losses Were Incurred1
Section 1: Occurrence2
Section 2: Claims-Made
1.601 Prior 0 0
1.602 2010 0 0
1.603 2011 0 0
1.604 2012 0 0
1.605 2013 0 0
1.606 2014 0 0
1.607 2015 0 0
1.608 2016 0 0
1.609 2017 0 0
1.610 2018 0 0
1.611 2019 0 0
1.612 Totals 0 0
2. The definition of allocated loss adjustment expenses (ALAE) and, therefore, unallocated loss adjustment expenses (ULAE) was changed effective January 1, 1998. This change in definition applies to both paid and unpaid expenses. Are these expenses (now reported as “ Defense and Cost Containment” and “Adjusting and Other” ) reported in compliance with these definitions in this statement? Yes [ X ] No [ ]
3. The Adjusting and Other expense payments and reserves should be allocated to the years in which the losses were incurred based on the number of claims reported, closed and outstanding in those years. When allocating Adjusting and Other expense between companies in a group or a pool, the Adjusting and Other expense should be allocated in the same percentage used for the loss amounts and the claim counts. For reinsurers, Adjusting and Other expense assumed should be reported according to the reinsurance contract. For Adjusting and Other expense incurred by reinsurers, or in those situations where suitable claim count information is not available, Adjusting and Other expense should be allocated by a reasonable method determined by the company and described in Interrogatory 7, below. Are they so reported in this Statement? Yes [ X ] No [ ]
4. Do any lines in Schedule P include reserves that are reported gross of any discount to present value of future payments, and that are reported net of such discounts on Page 10? Yes [ ] No [ X ]
If yes, proper disclosure must be made in the Notes to Financial Statements, as specified in the Instructions. Also, the discounts must be reported in Schedule P - Part 1, Columns 32 and 33. Schedule P must be completed gross of non-tabular discounting. Work papers relating to discount calculations must be available for examination upon request.
Discounting is allowed only if expressly permitted by the state insurance department to which this Annual Statement is being filed.
5. What were the net premiums in force at the end of the year for:
(in thousands of dollars) 5.1 Fidelity 0
5.2 Surety 0
6. Claim count information is reported per claim or per claimant (Indicate which). per claimant
If not the same in all years, explain in Interrogatory 7.
7.1 The information provided in Schedule P will be used by many persons to estimate the adequacy of the current loss and expense reserves, among other things. Are there any especially significant events, coverage, retention or accounting changes that have occurred that must be considered when making such analyses? Yes [ ] No [ X ]
7.2 (An extended statement may be attached.)
93

ANNUAL STATEMENT FOR THE YEAR 2019 OF THE HANOVER NEW JERSEY INSURANCE COMPANY
SCHEDULE T - EXHIBIT OF PREMIUMS WRITTENAllocated by States and Territories
1 Gross Premiums, Including Policy and Membership Fees, Less Return Premiums and Premiums on Policies Not
Taken
4
DividendsPaid or
5
Direct
6 7 8
Finance and
9Direct
Premiums Written for
Federal
States, Etc.
ActiveStatus
(a)
2Direct
Premiums Written
3Direct
Premiums Earned
Credited to Policyholders
on Direct Business
LossesPaid
(DeductingSalvage)
DirectLosses Incurred
DirectLossesUnpaid
Service Charges Not Included in Premiums
Purchasing Groups
(Included in Column 2)
1. Alabama AL N 0 0 0 0 0 0 0 0
2. Alaska AK N 0 0 0 0 0 0 0 0
3. Arizona AZ N 0 0 0 0 0 0 0 0
4. Arkansas AR N 0 0 0 0 0 0 0 0
5. California CA N 0 0 0 0 0 0 0 0
6. Colorado CO N 0 0 0 0 0 0 0 0
7. Connecticut CT N 0 0 0 0 0 0 0 0
8. Delaware DE N 0 0 0 0 0 0 0 0
9. District of Columbia DC N 0 0 0 0 0 0 0 0
10. Florida FL N 0 0 0 0 0 0 0 0
11. Georgia GA N 0 0 0 0 0 0 0 0
12. Hawaii HI N 0 0 0 0 0 0 0 0
13. Idaho ID N 0 0 0 0 0 0 0 0
14. Illinois IL N 0 0 0 0 0 0 0 0
15. Indiana IN N 0 0 0 0 0 0 0 0
16. Iowa IA N 0 0 0 0 0 0 0 0
17. Kansas KS N 0 0 0 0 0 0 0 0
18. Kentucky KY N 0 0 0 0 0 0 0 0
19. Louisiana LA N 0 0 0 0 0 0 0 0
20. Maine ME N 0 0 0 0 0 0 0 0
21. Maryland MD N 0 0 0 0 0 0 0 0
22. Massachusetts MA N 0 0 0 0 0 0 0 0
23. Michigan MI N 0 0 0 0 0 0 0 0
24. Minnesota MN N 0 0 0 0 0 0 0 0
25. Mississippi MS N 0 0 0 0 0 0 0 0
26. Missouri MO N 0 0 0 0 0 0 0 0
27. Montana MT N 0 0 0 0 0 0 0 0
28. Nebraska NE N 0 0 0 0 0 0 0 0
29. Nevada NV N 0 0 0 0 0 0 0 0
30. New Hampshire NH L 0 0 0 0 0 0 0 0
31. New Jersey NJ L 0 0 0 (22,585) (176,397) 2,611 0 0
32. New Mexico NM N 0 0 0 0 0 0 0 0
33. New York NY N 0 0 0 0 0 0 0 0
34. North Carolina NC N 0 0 0 0 0 0 0 0
35. North Dakota ND N 0 0 0 0 0 0 0 0
36. Ohio OH N 0 0 0 0 0 0 0 0
37. Oklahoma OK N 0 0 0 0 0 0 0 0
38. Oregon OR N 0 0 0 0 0 0 0 0
39. Pennsylvania PA N 0 0 0 0 0 0 0 0
40. Rhode Island RI N 0 0 0 0 0 0 0 0
41. South Carolina SC N 0 0 0 0 0 0 0 0
42. South Dakota SD N 0 0 0 0 0 0 0 0
43. Tennessee TN N 0 0 0 0 0 0 0 0
44. Texas TX N 0 0 0 0 0 0 0 0
45. Utah UT N 0 0 0 0 0 0 0 0
46. Vermont VT N 0 0 0 0 0 0 0 0
47. Virginia VA N 0 0 0 0 0 0 0 0
48. Washington WA N 0 0 0 0 0 0 0 0
49. West Virginia WV N 0 0 0 0 0 0 0 0
50. Wisconsin WI N 0 0 0 0 0 0 0 0
51. Wyoming WY N 0 0 0 0 0 0 0 0
52. American Samoa AS N 0 0 0 0 0 0 0 0
53. Guam GU N 0 0 0 0 0 0 0 0
54. Puerto Rico PR N 0 0 0 0 0 0 0 0
55. U.S. Virgin Islands VI N 0 0 0 0 0 0 0 0
56. Northern Mariana Islands MP N 0 0 0 0 0 0 0 0
57. Canada CAN N 0 0 0 0 0 0 0 0
58. Aggregate other alien OT XXX 0 0 0 0 0 0 0 0
59. Totals XXX 0 0 0 (22,585) (176,397) 2,611 0 0
DETAILS OF WRITE-INS
58001. XXX58002. XXX58003. XXX58998. Summary of remaining
write-ins for Line 58 from overflow page XXX 0 0 0 0 0 0 0 0
58999. Totals (Lines 58001 through 58003 plus 58998)(Line 58 above) XXX 0 0 0 0 0 0 0 0
(a) Active Status Counts:
L - Licensed or Chartered - Licensed insurance carrier or domiciled RRG 2 R - Registered - Non-domiciled RRGs 0
E - Eligible - Reporting entities eligible or approved to write surplus lines in the state (other Q - Qualified - Qualified or accredited reinsurer 0
than their state of domicile - see DSLI) 0 N - None of the above - Not allowed to write
D - Domestic Surplus Lines Insurer (DSLI) - Reporting entities authorized to write surplus business in the state 55
lines in the state of domicile 0
(b) Explanation of basis of allocation of premiums by states, etc.Premiums are allocated to state based on place of principal garage.
94
ANNUAL STATEMENT FOR THE YEAR 2019 OF THE HANOVER NEW JERSEY INSURANCE COMPANY
SCHEDULE T - PART 2INTERSTATE COMPACT - EXHIBIT OF PREMIUMS WRITTEN
Allocated by States and TerritoriesDirect Business Only
States, Etc.
1
Life(Group and Individual)
2
Annuities(Group and Individual)
3Disability Income
(Group and Individual)
4Long-Term
Care(Group and Individual)
5
Deposit-Type Contracts
6
Totals
1. Alabama AL
2. Alaska AK
3. Arizona AZ
4. Arkansas AR
5. California CA
6. Colorado CO
7. Connecticut CT
8. Delaware DE
9. District of Columbia DC
10. Florida FL
11. Georgia GA
12. Hawaii HI
13. Idaho ID
14. Illinois IL
15. Indiana IN
16. Iowa IA
17. Kansas KS
18. Kentucky KY
19. Louisiana LA
20. Maine ME
21. Maryland MD
22. Massachusetts MA
23. Michigan MI
24. Minnesota MN
25. Mississippi MS
26. Missouri MO
27. Montana MT
28. Nebraska NE
29. Nevada NV
30. New Hampshire NH
31. New Jersey NJ
32. New Mexico NM
33. New York NY
34. North Carolina NC
35. North Dakota ND
36. Ohio OH
37. Oklahoma OK
38. Oregon OR
39. Pennsylvania PA
40. Rhode Island RI
41. South Carolina SC
42. South Dakota SD
43. Tennessee TN
44. Texas TX
45. Utah UT
46. Vermont VT
47. Virginia VA
48. Washington WA
49. West Virginia WV
50. Wisconsin WI
51. Wyoming WY
52. American Samoa AS
53. Guam GU
54. Puerto Rico PR
55. U.S. Virgin Islands VI
56. Northern Mariana Islands MP
57. Canada CAN
58. Aggregate Other Alien OT
59. Total
NONE
95

ANNUAL STATEMENT FOR THE YEAR 2019 OF THE HANOVER NEW JERSEY INSURANCE COMPANY
96

ANNUAL STATEMENT FOR THE YEAR 2019 OF THE HANOVER NEW JERSEY INSURANCE COMPANY
SCHEDULE YPART 1A - DETAIL OF INSURANCE HOLDING COMPANY SYSTEM
1
GroupCode
2
Group Name
3
NAICCompany
Code
4
IDNumber
5
Federal RSSD
6
CIK
7
Name of SecuritiesExchange
if Publicly Traded(U.S. or
International)
8
Names ofParent, Subsidiaries
Or Affiliates
9
Domi-ciliaryLoca-tion
10
Relation-ship to
ReportingEntity
11
Directly Controlled by(Name of Entity/Person)
12Type
of Control(Ownership,
Board,Management,
Attorney-in-Fact,Influence,
Other)
13If
Controlis
Owner-ship
ProvidePercen-
tage
14
Ultimate ControllingEntity(ies)/Person(s)
15
Is anSCA FilingRe-
quired? (Y/N)
16
* The Hanover Insurance Group 80-0266582 440 Lincoln Street Holding Company LLC MA NIA The Hanover Insurance Company Ownership, Board,Management 100.000 The Hanover Insurance Group, Inc. N
The Hanover Insurance Group 84-3300049 AIXHI LLC MA NIA Nova Casualty Company Ownership, Board,Management 100.000 The Hanover Insurance Group, Inc. N
The Hanover Insurance Group 27-1304098 AIX Insurance Services of California, Inc. CA NIA AIX, Inc. Ownership, Board,Management 100.000 The Hanover Insurance Group, Inc. N
0088 The Hanover Insurance Group 12833 20-5233538 AIX Specialty Insurance Company DE IA Nova Casualty Company Ownership, Board,Management 100.000 The Hanover Insurance Group, Inc. N
The Hanover Insurance Group 20-3051651 AIX, Inc. DE NIA The Hanover Insurance Company Ownership, Board,Management 100.000 The Hanover Insurance Group, Inc. Y
0088 The Hanover Insurance Group 10212 04-3272695 Allmerica Financial Alliance Insurance Co. NH IA The Hanover Insurance Company Ownership, Board,Management 100.000 The Hanover Insurance Group, Inc. N
0088 The Hanover Insurance Group 41840 23-2643430 Allmerica Financial Benefit Insurance Co. MI IA The Hanover Insurance Company Ownership, Board,Management 100.000 The Hanover Insurance Group, Inc. N
The Hanover Insurance Group 04-3194493 Allmerica Plus Insurance Agency, Inc. MA NIA The Hanover Insurance Company Ownership, Board,Management 100.000 The Hanover Insurance Group, Inc. N
The Hanover Insurance Group Allmerica Securities Trust MA NIA The Hanover Insurance Group, Inc. Management 100.000 The Hanover Insurance Group, Inc. N
The Hanover Insurance Group 54-1632456 Campania Holding Company, Inc. VA NIA The Hanover Insurance Group, Inc. Ownership, Board,Management 100.000 The Hanover Insurance Group, Inc. N
0088 The Hanover Insurance Group 12260 52-1827116 Campmed Casualty & Indemnity Co. Inc. NH IA The Hanover Insurance Company Ownership, Board,Management 100.000 The Hanover Insurance Group, Inc. N
0088 The Hanover Insurance Group 31534 38-0421730 Citizens Insurance Company of America MI IA The Hanover Insurance Company Ownership, Board,Management 100.000 The Hanover Insurance Group, Inc. N
0088 The Hanover Insurance Group 10714 36-4123481 Citizens Insurance Company of Illinois IL IA Opus Investment Management, Inc. Ownership, Board,Management 100.000 The Hanover Insurance Group, Inc. N
0088 The Hanover Insurance Group 10176 38-3167100 Citizens Insurance Company of Ohio OH IA The Hanover Insurance Company Ownership, Board,Management 100.000 The Hanover Insurance Group, Inc. N
0088 The Hanover Insurance Group 10395 35-1958418 Citizens Insurance Company of the Midwest IN IA The Hanover Insurance Company Ownership, Board,Management 100.000 The Hanover Insurance Group, Inc. N
The Hanover Insurance Group 27-1652700 CitySquare II Development Co., L.L.C MA NIA Opus Investment Management, Inc. Ownership, Board,Management 100.000 The Hanover Insurance Group, Inc. N
The Hanover Insurance Group 27-3626264 CitySquare II Investment Co., L.L.C MA NIA The Hanover Insurance Company Ownership, Board,Management 100.000 The Hanover Insurance Group, Inc. N
The Hanover Insurance Group 27-2400275 Educators Insurance Agency, Inc. MA NIA The Hanover Insurance Group, Inc. Ownership, Board,Management 100.000 The Hanover Insurance Group, Inc. N
The Hanover Insurance Group 38-4000989 Front Street Financing LLC MA NIA CitySquare II Investment Co. LLC Ownership, Board,Management 100.000 The Hanover Insurance Group, Inc. N
The Hanover Insurance Group 52-1172293 Hanover Specialty Insurance Brokers, Inc. VA NIA Verlan Holdings, Inc. Ownership, Board,Management 100.000 The Hanover Insurance Group, Inc. N
0088 The Hanover Insurance Group 22306 04-2217600 Massachusetts Bay Insurance Company NH IA The Hanover Insurance Company Ownership, Board,Management 100.000 The Hanover Insurance Group, Inc. N
The Hanover Insurance Group 84-3309673 NAG Merger LLC MA NIA AIXHI LLC Ownership, Board,Management 100.000 The Hanover Insurance Group, Inc. N
0088 The Hanover Insurance Group 42552 16-1140177 NOVA Casualty Company NY IA The Hanover Insurance Company Ownership, Board,Management 100.000 The Hanover Insurance Group, Inc. Y
The Hanover Insurance Group 04-2854021 Opus Investment Management, Inc. MA UIP The Hanover Insurance Group, Inc. Ownership, Board,Management 100.000 The Hanover Insurance Group, Inc. N
The Hanover Insurance Group 38-3383822 Professionals Direct Ins. Services, Inc. MI NIA Professionals Direct, Inc. Ownership, Board,Management 100.000 The Hanover Insurance Group, Inc. N
The Hanover Insurance Group 38-3324634 Professionals Direct, Inc. MI NIA The Hanover Insurance Company Ownership, Board,Management 100.000 The Hanover Insurance Group, Inc. N
0088 The Hanover Insurance Group 36064 04-3063898 The Hanover American Insurance Company NH IA The Hanover Insurance Company Ownership, Board,Management 100.000 The Hanover Insurance Group, Inc. N
The Hanover Insurance Group 98-1303999 The Hanover Atlantic Insurance Company Ltd. BMU IA The Hanover Insurance Company Ownership, Board,Management 100.000 The Hanover Insurance Group, Inc. Y
0088 The Hanover Insurance Group 41602 75-1827351 The Hanover Casualty Company TX IA The Hanover Insurance Company Ownership, Board,Management 100.000 The Hanover Insurance Group, Inc. N
0088 The Hanover Insurance Group 22292 13-5129825 The Hanover Insurance Company NH UDP Opus Investment Management, Inc. Ownership, Board,Management 100.000 The Hanover Insurance Group, Inc. N
0088 The Hanover Insurance Group 04-3263626 New York Stock Exchange The Hanover Insurance Group, Inc. DE UIP 0.000 N
0088 The Hanover Insurance Group 13147 74-3242673 The Hanover National Insurance Company NH IA The Hanover Insurance Company Ownership, Board,Management 100.000 The Hanover Insurance Group, Inc. N
0088 The Hanover Insurance Group 11705 86-1070355 The Hanover New Jersey Insurance Company NH RE The Hanover Insurance Company Ownership, Board,Management 100.000 The Hanover Insurance Group, Inc. N
The Hanover Insurance Group 04-2448927 VeraVest Investments, Inc. MA NIA The Hanover Insurance Group, Inc. Ownership, Board,Management 100.000 The Hanover Insurance Group, Inc. N
0088 The Hanover Insurance Group 10815 52-0903682 Verlan Fire Insurance Company NH IA The Hanover Insurance Company Ownership, Board,Management 100.000 The Hanover Insurance Group, Inc. N
The Hanover Insurance Group 52-2044133 Verlan Holdings, Inc. MD NIA The Hanover Insurance Group, Inc. Ownership, Board,Management 100.000 The Hanover Insurance Group, Inc. N
Asterisk ExplanationNONE
97

ANNUAL STATEMENT FOR THE YEAR 2019 OF THE HANOVER NEW JERSEY INSURANCE COMPANY
SCHEDULE YPART 2 - SUMMARY OF INSURER’S TRANSACTIONS WITH ANY AFFILIATES
1
NAICCompany
Code
2
IDNumber
3
Names of Insurers and Parent,Subsidiaries or Affiliates
4
ShareholderDividends
5
CapitalContributions
6
Purchases, Salesor Exchanges of
Loans, Securities,Real Estate,
Mortgage Loans or Other Investments
7Income/
(Disbursements)Incurred in
Connection withGuarantees or
Undertakings forthe Benefit of any
Affiliate(s)
8
ManagementAgreements andService Contracts
9
Income/(Disbursements)Incurred UnderReinsuranceAgreements
10
*
11
Any Other MaterialActivity Not in the
Ordinary Course ofthe Insurer’s
Business
12
Totals
13
ReinsuranceRecoverable/(Payable) on
Losses and/orReserve CreditTaken/(Liability)
12833 20-5233538 AIX Specialty Insurance Co. 0 0 0 0 0 0 0 0 269,667,361
20-2875170 AIX Holdings, Inc. (300,000) 0 0 0 0 0 0 (300,000) 0
10212 04-3272695 Allmerica Financial Alliance Ins Co. (400,000) 0 0 0 0 0 0 (400,000) 200,993,914
41840 23-2643430 Allmerica Financial Benefit Ins Co. 0 3,000,000 0 0 0 (68,370,702) 0 (65,370,702) 674,989,744
04-3194493 Allmerica Plus Insurance Agency, Inc. (200,000) 0 0 0 0 0 0 (200,000) 0
12260 52-1827116 Campmed Casualty & Indemnity Company,
Inc. (500,000) 0 0 0 0 0 0 (500,000) 13,257,580
31534 38-0421730 Citizens Insurance Co. of America (106,000,000) 0 (87,094,985) 0 160,083,279 (87,995,735) 0 (121,007,441) (165,159,317)
10714 36-4123481 Citizens Insurance Co. of Illinois 0 0 0 0 0 0 0 0 46,471,245
10176 38-3167100 Citizens Insurance Co. of Ohio (1,300,000) 0 0 0 0 0 0 (1,300,000) 16,930,325
10395 35-1958418 Citizens Insurance Co. of the Midwest 0 12,000,000 0 0 0 (105,181,977) 0 (93,181,977) 1,039,144,547
36064 04-3063898 The Hanover American Insurance Co. 0 1,000,000 0 0 0 (85,150,827) 0 (84,150,827) 419,640,349
98-1300399 The Hanover Atlantic Insurance Company 0 0 0 0 0 0 0 0 4,942,997
22292 13-5129825 The Hanover Insurance Company (25,600,000) (16,000,000) 17,495,094 0 (95,888,923) 519,793,556 (125,000,000) 274,799,727 (4,141,020,518)
11705 86-1070355 Hanover New Jersey Insurance Company (800,000) 0 0 0 0 0 0 (800,000) 3,108
41602 75-1827351 The Hanover Casualty Company (1,000,000) 0 0 0 0 0 0 (1,000,000) 75,959,220
22306 04-2217600 Massachusetts Bay Insurance Company (3,000,000) 0 0 0 0 (173,094,315) 0 (176,094,315) 906,727,359
42552 16-1140177 NOVA Casualty Co. 0 0 0 0 0 0 0 0 539,451,795
04-3263626 The Hanover Insurance Group, Inc. 140,000,000 0 69,599,891 0 (64,194,356) 0 125,000,000 270,405,535 0
13147 74-3242673 The Hanover National Insurance Company (300,000) 0 0 0 0 0 0 (300,000) 0
10815 52-0903682 Verlan Fire Insurance Co. (600,000) 0 0 0 0 0 0 (600,000) 98,000,291 9999999 Control Totals 0 0 0 0 0 0 XXX 0 0 0
98

ANNUAL STATEMENT FOR THE YEAR 2019 OF THE HANOVER NEW JERSEY INSURANCE COMPANY
SUPPLEMENTAL EXHIBITS AND SCHEDULES INTERROGATORIESThe following supplemental reports are required to be filed as part of your statement filing unless specifically waived by the domiciliary state. However, in the event that your domiciliary state waives the filing requirement, your response of WAIVED to the specific interrogatory will be accepted in lieu of filing a “NONE” report and a bar code will be printed below. If the supplement is required of your company but is not being filed for whatever reason enter SEE EXPLANATION and provide an explanation following the interrogatory questions.
ResponsesMARCH FILING
1. Will an actuarial opinion be filed by March 1? YES
2. Will the Supplemental Compensation Exhibit be filed with the state of domicile by March 1? YES
3. Will the confidential Risk-based Capital Report be filed with the NAIC by March 1? YES
4. Will the confidential Risk-based Capital Report be filed with the state of domicile, if required by March 1? YES
APRIL FILING
5. Will the Insurance Expense Exhibit be filed with the state of domicile and the NAIC by April 1? YES
6. Will Management’s Discussion and Analysis be filed by April 1? YES
7. Will the Supplemental Investment Risk Interrogatories be filed by April 1? YES
MAY FILING
8. Will this company be included in a combined annual statement which is filed with the NAIC by May 1? YES
JUNE FILING
9. Will an audited financial report be filed by June 1? YES
10. Will Accountant's Letter of Qualifications be filed with the state of domicile and electronically with the NAIC by June 1? YES
AUGUST FILING
11. Will the regulator-only (non-public) Communication of Internal Control Related Matters Noted in Audit be filed with the state of domicile and electronically with the NAIC (as a regulator-only non-public document) by August 1? YES
The following supplemental reports are required to be filed as part of your annual statement filing if your company is engaged in the type of business covered by the supplement. However, in the event that your company does not transact the type of business for which the special report must be filed, your response of NO to the specific interrogatory will be accepted in lieu of filing a “NONE” report and a bar code will be printed below. If the supplement is required of your company but is not being filed for whatever reason enter SEE EXPLANATION and provide an explanation following the interrogatory questions.
MARCH FILING12. Will Schedule SIS (Stockholder Information Supplement) be filed with the state of domicile by March 1? NO
13. Will the Financial Guaranty Insurance Exhibit be filed by March 1? NO
14. Will the Medicare Supplement Insurance Experience Exhibit be filed with the state of domicile and the NAIC by March 1? NO
15. Will Supplement A to Schedule T (Medical Professional Liability Supplement) be filed by March 1? NO
16. Will the Trusteed Surplus Statement be filed with the state of domicile and the NAIC by March 1? NO
17. Will the Premiums Attributed to Protected Cells Exhibit be filed by March 1? NO
18. Will the Reinsurance Summary Supplemental Filing for General Interrogatory 9 be filed with the state of domicile and the NAIC by March 1? NO
19. Will the Medicare Part D Coverage Supplement be filed with the state of domicile and the NAIC by March 1? NO
20. Will the confidential Actuarial Opinion Summary be filed with the state of domicile, if required, by March 15 (or the date otherwise specified)? YES
21. Will the Reinsurance Attestation Supplement be filed with the state of domicile and the NAIC by March 1? NO
22. Will the Exceptions to the Reinsurance Attestation Supplement be filed with the state of domicile by March 1? NO
23. Will the Bail Bond Supplement be filed with the state of domicile and the NAIC by March 1? NO
24. Will the Director and Officer Insurance Coverage Supplement be filed with the state of domicile and the NAIC by March 1? NO
25. Will an approval from the reporting entity’s state of domicile for relief related to the five-year rotation requirement for lead audit partner be filed electronically with the NAIC by March 1? NO
26. Will an approval from the reporting entity’s state of domicile for relief related to the one-year cooling off period for independent CPA be filed electronically with the NAIC by March 1? NO
27. Will an approval from the reporting entity’s state of domicile for relief related to the Requirements for Audit Committees be filed electronically with the NAIC by March 1? NO
28. Will the Supplemental Schedule for Reinsurance Counterparty Reporting Exception - Asbestos and Pollution Contracts be filed with the state of domicile and the NAIC by March 1? NO
APRIL FILING
29. Will the Credit Insurance Experience Exhibit be filed with the state of domicile and the NAIC by April 1? NO
30. Will the Long-term Care Experience Reporting Forms be filed with the state of domicile and the NAIC by April 1? NO
31. Will the Accident and Health Policy Experience Exhibit be filed by April 1? NO
32. Will the Supplemental Health Care Exhibit (Parts 1, 2 and 3) be filed with the state of domicile and the NAIC by April 1? NO
33. Will the regulator only (non-public) Supplemental Health Care Exhibit’s Expense Allocation Report be filed with the state of domicile and the NAIC by April 1? NO
34. Will the Cybersecurity and Identity Theft Insurance Coverage Supplement be filed with the state of domicile and the NAIC by April 1? NO
35. Will the Life, Health & Annuity Guaranty Association Model Act Assessment Base Reconciliation Exhibit be filed with the state of domicile and the NAIC by April 1? NO
36. Will the Adjustments to the Life, Health & Annuity Guaranty Association Model Act Assessment Base Reconciliation Exhibit (if required) be filed with the state of domicile and the NAIC by April 1? NO
AUGUST FILING
37. Will Management’s Report of Internal Control Over Financial Reporting be filed with the state of domicile by August 1? YES
Explanations:
12. 13. 14. 15. 16. 17. 18. 19. 21. 22. 23. 24. 25. 26. 27. 28. 29. 30. 31. 32. 33. 34 35. 36.
Bar Codes:12. SIS Stockholder Information Supplement [Document Identifier 420]
*11705201942000000*13. Financial Guaranty Insurance Exhibit [Document Identifier 240]
*11705201924000000*14. Medicare Supplement Insurance Experience Exhibit [Document Identifier 360]
*11705201936000000*15. Supplement A to Schedule T [Document Identifier 455]
*11705201945500000*16. Trusteed Surplus Statement [Document Identifier 490]
*11705201949000000*17. Premiums Attributed to Protected Cells Exhibit [Document Identifier 385]
*11705201938500000*18. Reinsurance Summary Supplemental Filing [Document Identifier 401]
*11705201940100000*
99

ANNUAL STATEMENT FOR THE YEAR 2019 OF THE HANOVER NEW JERSEY INSURANCE COMPANY
SUPPLEMENTAL EXHIBITS AND SCHEDULES INTERROGATORIES19. Medicare Part D Coverage Supplement [Document Identifier 365]
*11705201936500000*21. Reinsurance Attestation Supplement [Document Identifier 399]
*11705201939900000*22. Exceptions to the Reinsurance Attestation Supplement
[Document Identifier 400] *11705201940000000*23. Bail Bond Supplement [Document Identifier 500]
*11705201950000000*24. Director and Officer Insurance Coverage Supplement [Document Identifier 505]
*11705201950500000*25. Relief from the five-year rotation requirement for lead audit partner
[Document Identifier 224] *11705201922400000*26. Relief from the one-year cooling off period for independent CPA
[Document Identifier 225] *11705201922500000*27. Relief from the Requirements for Audit Committees [Document Identifier 226]
*11705201922600000*28. Reinsurance Counterparty Reporting Exception – Asbestos and Pollution
Contracts [Document Identifier 555] *11705201955500000*29. Credit Insurance Experience Exhibit [Document Identifier 230]
*11705201923000000*30. Long-Term Care Experience Reporting Forms [Document Identifier 306]
*11705201930600000*31. Accident and Health Policy Experience Exhibit [Document Identifier 210]
*11705201921000000*32. Supplemental Health Care Exhibit (Parts 1, 2 and 3) [Document Identifier 216]
*11705201921600000*33. Supplemental Health Care Exhibit's Expense Allocation Report
[Document Identifier 217] *11705201921700000*34. Cybersecurity and Identity Theft Insurance Coverage Supplement
[Document Identifier 550] *11705201955000000*35 Life, Health & Annuity Guaranty Association Model Act Assessment Base
Reconciliation Exhibit [Document Identifier 290] *11705201929000000*36 Adjustments to the Life, Health & Annuity Guaranty Association Model Act
Assessment Base Reconciliation Exhibit [Document Identifier 300] *11705201930000000*
99.1

ANNUAL STATEMENT FOR THE YEAR 2019 OF THE HANOVER NEW JERSEY INSURANCE COMPANY
OVERFLOW PAGE FOR WRITE-INS
NONE
100

ANNUAL STATEMENT FOR THE YEAR 2019 OF THE HANOVER NEW JERSEY INSURANCE COMPANY
SUMMARY INVESTMENT SCHEDULEGross Investment Holdings
Admitted Assets as Reportedin the Annual Statement
Investment Categories
1
Amount
2
Percentageof
Column 1Line 13
3
Amount
4Securities Lending
Reinvested CollateralAmount
5
Total(Col. 3 + 4)
Amount
6
Percentageof
Column 5Line 13
1. Long-Term Bonds (Schedule D, Part 1):
1.01 U.S. governments 2,409,693 7.818 2,409,693 0 2,409,693 7.818
1.02 All other governments 0 0.000 0 0 0 0.000
1.03 U.S. states, territories and possessions, etc. guaranteed 1,108,994 3.598 1,108,994 0 1,108,994 3.598
1.04 U.S. political subdivisions of states, territories, and possessions, guaranteed 1,850,235 6.003 1,850,235 0 1,850,235 6.003
1.05 U.S. special revenue and special assessment obligations, etc. non-guaranteed 6,931,166 22.487 6,931,166 0 6,931,166 22.487
1.06 Industrial and miscellaneous 14,735,842 47.809 14,735,842 0 14,735,842 47.809
1.07 Hybrid securities 0 0.000 0 0 0 0.000
1.08 Parent, subsidiaries and affiliates 0 0.000 0 0 0 0.000
1.09 SVO identified funds 0 0.000 0 0 0 0.000
1.10 Unaffiliated Bank loans 0 0.000 0 0 0 0.000
1.11 Total long-term bonds 27,035,930 87.715 27,035,930 0 27,035,930 87.715
2. Preferred stocks (Schedule D, Part 2, Section 1):
2.01 Industrial and miscellaneous (Unaffiliated) 0 0.000 0 0 0 0.000
2.02 Parent, subsidiaries and affiliates 0 0.000 0 0 0 0.000
2.03 Total preferred stocks 0 0.000 0 0 0 0.000
3. Common stocks (Schedule D, Part 2, Section 2):
3.01 Industrial and miscellaneous Publicly traded (Unaffiliated) 0 0.000 0 0 0 0.000
3.02 Industrial and miscellaneous Other (Unaffiliated) 0 0.000 0 0 0 0.000
3.03 Parent, subsidiaries and affiliates Publicly traded 0 0.000 0 0 0 0.000
3.04 Parent, subsidiaries and affiliates Other 0 0.000 0 0 0 0.000
3.05 Mutual funds 0 0.000 0 0 0 0.000
3.06 Unit investment trusts 0 0.000 0 0 0 0.000
3.07 Closed-end funds 0 0.000 0 0 0 0.000
3.08 Total common stocks 0 0.000 0 0 0 0.000
4. Mortgage loans (Schedule B):
4.01 Farm mortgages 0 0.000 0 0 0 0.000
4.02 Residential mortgages 0 0.000 0 0 0 0.000
4.03 Commercial mortgages 0 0.000 0 0 0 0.000
4.04 Mezzanine real estate loans 0 0.000 0 0 0 0.000
4.05 Total mortgage loans 0 0.000 0 0 0 0.000
5. Real estate (Schedule A):
5.01 Properties occupied by company 0 0.000 0 0 0 0.000
5.02 Properties held for production of income 0 0.000 0 0 0 0.000
5.03 Properties held for sale 0 0.000 0 0 0 0.000
5.04 Total real estate 0 0.000 0 0 0 0.000
6. Cash, cash equivalents and short-term investments:
6.01 Cash (Schedule E, Part 1) 35,004 0.114 35,004 0 35,004 0.114
6.02 Cash equivalents (Schedule E, Part 2) 3,751,500 12.171 3,751,500 0 3,751,500 12.171
6.03 Short-term investments (Schedule DA) 0 0.000 0 0 0 0.000
6.04 Total cash, cash equivalents and short-term investments 3,786,504 12.285 3,786,504 0 3,786,504 12.285
7. Contract loans 0 0.000 0 0 0 0.000
8. Derivatives (Schedule DB) 0 0.000 0 0 0 0.000
9. Other invested assets (Schedule BA) 0 0.000 0 0 0 0.000
10. Receivables for securities 0 0.000 0 0 0 0.000
11. Securities Lending (Schedule DL, Part 1) 0 0.000 0 XXX XXX XXX
12. Other invested assets (Page 2, Line 11) 0 0.000 0 0 0 0.000
13. Total invested assets 30,822,434 100.000 30,822,434 0 30,822,434 100.000
SI01

ANNUAL STATEMENT FOR THE YEAR 2019 OF THE HANOVER NEW JERSEY INSURANCE COMPANY
Schedule A - Verification - Real Estate
N O N E
Schedule B - Verification - Mortgage Loans
N O N E
SI02

ANNUAL STATEMENT FOR THE YEAR 2019 OF THE HANOVER NEW JERSEY INSURANCE COMPANY
SCHEDULE BA - VERIFICATION BETWEEN YEARSOther Long-Term Invested Assets
1. Book/adjusted carrying value, December 31 of prior year
2. Cost of acquired:
2.1 Actual cost at time of acquisition (Part 2, Column 8)
2.2 Additional investment made after acquisition (Part 2, Column 9)
3. Capitalized deferred interest and other:
3.1 Totals, Part 1, Column 16
3.2 Totals, Part 3, Column 12
4. Accrual of discount
5. Unrealized valuation increase (decrease):
5.1 Totals, Part 1, Column 13
5.2 Totals, Part 3, Column 9
6. Total gain (loss) on disposals, Part 3, Column 19
7. Deduct amounts received on disposals, Part 3, Column 16
8. Deduct amortization of premium and depreciation
9. Total foreign exchange change in book/adjusted carrying value:
9.1 Totals, Part 1, Column 17
9.2 Totals, Part 3, Column 14
10. Deduct current year’s other than temporary impairment recognized:
10.1 Totals, Part 1, Column 15
10.2 Totals, Part 3, Column 11
11. Book/adjusted carrying value at end of current period (Lines 1+2+3+4+5+6-7-8+9-10)
12. Deduct total nonadmitted amounts
13. Statement value at end of current period (Line 11 minus Line 12)
SCHEDULE D - VERIFICATION BETWEEN YEARSBonds and Stocks
1. Book/adjusted carrying value, December 31 of prior year 30,528,120
2. Cost of bonds and stocks acquired, Part 3, Column 7 3,259,909
3. Accrual of discount 20,426
4. Unrealized valuation increase (decrease):
4.1. Part 1, Column 12 0
4.2. Part 2, Section 1, Column 15 0
4.3. Part 2, Section 2, Column 13 0
4.4. Part 4, Column 11 0 0
5. Total gain (loss) on disposals, Part 4, Column 19 143
6. Deduction consideration for bonds and stocks disposed of, Part 4, Column 7 6,752,915
7. Deduct amortization of premium 25,388
8. Total foreign exchange change in book/adjusted carrying value:
8.1. Part 1, Column 15 0
8.2. Part 2, Section 1, Column 19 0
8.3. Part 2, Section 2, Column 16 0
8.4. Part 4, Column 15 0 0
9. Deduct current year’s other than temporary impairment recognized:
9.1. Part 1, Column 14 0
9.2. Part 2, Section 1, Column 17 0
9.3. Part 2, Section 2, Column 14 0
9.4. Part 4, Column 13 0 0
10. Total investment income recognized as a result of prepayment penalties and/or acceleration fees, Note 5Q, Line 2 5,635
11. Book/adjusted carrying value at end of current period (Lines 1+2+3+4+5-6-7+8-9+10) 27,035,930
12. Deduct total nonadmitted amounts 0
13. Statement value at end of current period (Line 11 minus Line 12) 27,035,930
NONE
SI03

ANNUAL STATEMENT FOR THE YEAR 2019 OF THE HANOVER NEW JERSEY INSURANCE COMPANY
SCHEDULE D - SUMMARY BY COUNTRYLong-Term Bonds and Stocks OWNED December 31 of Current Year
Description
1Book/Adjusted Carrying Value
2
Fair Value
3
Actual Cost
4
Par Value of Bonds
BONDS
Governments
(Including all obligations guaranteed by governments)
1. United States 2,409,693 2,471,506 2,391,628 2,450,000
2. Canada 0 0 0 0
3. Other Countries 0 0 0 0
4. Totals 2,409,693 2,471,506 2,391,628 2,450,000
U.S. States, Territories and Possessions
(Direct and guaranteed) 5. Totals 1,108,994 1,122,528 1,129,621 1,085,000
U.S. Political Subdivisions of States, Territories and Possessions (Direct and guaranteed)
6. Totals 1,850,235 1,868,918 1,851,040 1,850,000
U.S. Special Revenue and Special Assessment Obligations and all Non-Guaranteed Obligations of Agencies and Authorities of Governments and their Political Subdivisions 7. Totals 6,931,166 7,132,183 6,940,629 6,912,762
Industrial and Miscellaneous, SVO Identified Funds, Unaffiliated Bank Loans and Hybrid Securities (unaffiliated)
8. United States 12,536,720 13,101,334 12,530,096 12,538,637
9. Canada 454,061 466,745 457,436 450,000
10. Other Countries 1,745,061 1,809,192 1,744,132 1,750,000
11. Totals 14,735,842 15,377,271 14,731,664 14,738,637
Parent, Subsidiaries and Affiliates 12. Totals 0 0 0 0
13. Total Bonds 27,035,930 27,972,406 27,044,582 27,036,399
PREFERRED STOCKS
Industrial and Miscellaneous (unaffiliated)
14. United States 0 0 0
15. Canada 0 0 0
16. Other Countries 0 0 0
17. Totals 0 0 0
Parent, Subsidiaries and Affiliates 18. Totals 0 0 0
19. Total Preferred Stocks 0 0 0
COMMON STOCKS
Industrial and Miscellaneous (unaffiliated)
20. United States 0 0 0
21. Canada 0 0 0
22. Other Countries 0 0 0
23. Totals 0 0 0
Parent, Subsidiaries and Affiliates 24. Totals 0 0 0
25. Total Common Stocks 0 0 0
26. Total Stocks 0 0 0
27. Total Bonds and Stocks 27,035,930 27,972,406 27,044,582
SI04

ANNUAL STATEMENT FOR THE YEAR 2019 OF THE HANOVER NEW JERSEY INSURANCE COMPANY
SCHEDULE D - PART 1A - SECTION 1Quality and Maturity Distribution of All Bonds Owned December 31, at Book/Adjusted Carrying Values by Major Types of Issues and NAIC Designations
NAIC Designation
1
1 Year or Less
2Over 1 Year
Through 5 Years
3Over 5 Years
Through 10 Years
4Over 10 Years
Through 20 Years
5
Over 20 Years
6No Maturity
Date
7
Total Current Year
8Col. 7 as a % of
Line 11.7
9Total from Col. 7
Prior Year
10% From Col. 8
Prior Year
11Total Publicly
Traded
12Total Privately
Placed (a)
1. U.S. Governments
1.1 NAIC 1 450,175 988,942 970,576 0 0 XXX 2,409,693 7.8 2,402,604 7.8 2,409,693 0
1.2 NAIC 2 0 0 0 0 0 XXX 0 0.0 0 0.0 0 0
1.3 NAIC 3 0 0 0 0 0 XXX 0 0.0 0 0.0 0 0
1.4 NAIC 4 0 0 0 0 0 XXX 0 0.0 0 0.0 0 0
1.5 NAIC 5 0 0 0 0 0 XXX 0 0.0 0 0.0 0 0
1.6 NAIC 6 0 0 0 0 0 XXX 0 0.0 0 0.0 0 0
1.7 Totals 450,175 988,942 970,576 0 0 XXX 2,409,693 7.8 2,402,604 7.8 2,409,693 0
2. All Other Governments
2.1 NAIC 1 0 0 0 0 0 XXX 0 0.0 0 0.0 0 0
2.2 NAIC 2 0 0 0 0 0 XXX 0 0.0 0 0.0 0 0
2.3 NAIC 3 0 0 0 0 0 XXX 0 0.0 0 0.0 0 0
2.4 NAIC 4 0 0 0 0 0 XXX 0 0.0 0 0.0 0 0
2.5 NAIC 5 0 0 0 0 0 XXX 0 0.0 0 0.0 0 0
2.6 NAIC 6 0 0 0 0 0 XXX 0 0.0 0 0.0 0 0
2.7 Totals 0 0 0 0 0 XXX 0 0.0 0 0.0 0 0
3. U.S. States, Territories and Possessions etc., Guaranteed
3.1 NAIC 1 250,003 455,533 403,458 0 0 XXX 1,108,994 3.6 950,990 3.1 1,108,994 0
3.2 NAIC 2 0 0 0 0 0 XXX 0 0.0 0 0.0 0 0
3.3 NAIC 3 0 0 0 0 0 XXX 0 0.0 0 0.0 0 0
3.4 NAIC 4 0 0 0 0 0 XXX 0 0.0 0 0.0 0 0
3.5 NAIC 5 0 0 0 0 0 XXX 0 0.0 0 0.0 0 0
3.6 NAIC 6 0 0 0 0 0 XXX 0 0.0 0 0.0 0 0
3.7 Totals 250,003 455,533 403,458 0 0 XXX 1,108,994 3.6 950,990 3.1 1,108,994 0
4. U.S. Political Subdivisions of States, Territories and Possessions , Guaranteed
4.1 NAIC 1 0 1,000,235 600,000 250,000 0 XXX 1,850,235 6.0 2,223,767 7.2 1,850,235 0
4.2 NAIC 2 0 0 0 0 0 XXX 0 0.0 0 0.0 0 0
4.3 NAIC 3 0 0 0 0 0 XXX 0 0.0 0 0.0 0 0
4.4 NAIC 4 0 0 0 0 0 XXX 0 0.0 0 0.0 0 0
4.5 NAIC 5 0 0 0 0 0 XXX 0 0.0 0 0.0 0 0
4.6 NAIC 6 0 0 0 0 0 XXX 0 0.0 0 0.0 0 0
4.7 Totals 0 1,000,235 600,000 250,000 0 XXX 1,850,235 6.0 2,223,767 7.2 1,850,235 0
5. U.S. Special Revenue & Special Assessment Obligations, etc., Non-Guaranteed
5.1 NAIC 1 4,434,051 2,790,735 2,321,315 1,070,499 63,278 XXX 10,679,878 34.7 6,941,856 22.6 10,679,878 0
5.2 NAIC 2 0 0 0 0 0 XXX 0 0.0 0 0.0 0 0
5.3 NAIC 3 0 0 0 0 0 XXX 0 0.0 0 0.0 0 0
5.4 NAIC 4 0 0 0 0 0 XXX 0 0.0 0 0.0 0 0
5.5 NAIC 5 0 0 0 0 0 XXX 0 0.0 0 0.0 0 0
5.6 NAIC 6 0 0 0 0 0 XXX 0 0.0 0 0.0 0 0
5.7 Totals 4,434,051 2,790,735 2,321,315 1,070,499 63,278 XXX 10,679,878 34.7 6,941,856 22.6 10,679,878 0
SI0
5

ANNUAL STATEMENT FOR THE YEAR 2019 OF THE HANOVER NEW JERSEY INSURANCE COMPANY
SCHEDULE D - PART 1A - SECTION 1 (Continued)Quality and Maturity Distribution of All Bonds Owned December 31, at Book/Adjusted Carrying Values by Major Types of Issues and NAIC Designations
NAIC Designation
1
1 Year or Less
2Over 1 Year
Through 5 Years
3Over 5 Years
Through 10 Years
4Over 10 Years
Through 20 Years
5
Over 20 Years
6No Maturity
Date
7
Total Current Year
8Col. 7 as a % of
Line 11.7
9Total from Col. 7
Prior Year
10% From Col. 8
Prior Year
11Total Publicly
Traded
12Total Privately
Placed (a)
6. Industrial & Miscellaneous (Unaffiliated)
6.1 NAIC 1 2,283,158 4,292,296 3,085,536 0 0 XXX 9,660,990 31.4 10,262,049 33.3 7,955,187 1,705,803
6.2 NAIC 2 0 3,008,616 1,805,587 260,649 0 XXX 5,074,852 16.5 7,996,425 26.0 4,226,018 848,834
6.3 NAIC 3 0 0 0 0 0 XXX 0 0.0 0 0.0 0 0
6.4 NAIC 4 0 0 0 0 0 XXX 0 0.0 0 0.0 0 0
6.5 NAIC 5 0 0 0 0 0 XXX 0 0.0 0 0.0 0 0
6.6 NAIC 6 0 0 0 0 0 XXX 0 0.0 0 0.0 0 0
6.7 Totals 2,283,158 7,300,912 4,891,123 260,649 0 XXX 14,735,842 47.9 18,258,474 59.3 12,181,205 2,554,637
7. Hybrid Securities
7.1 NAIC 1 0 0 0 0 0 XXX 0 0.0 0 0.0 0 0
7.2 NAIC 2 0 0 0 0 0 XXX 0 0.0 0 0.0 0 0
7.3 NAIC 3 0 0 0 0 0 XXX 0 0.0 0 0.0 0 0
7.4 NAIC 4 0 0 0 0 0 XXX 0 0.0 0 0.0 0 0
7.5 NAIC 5 0 0 0 0 0 XXX 0 0.0 0 0.0 0 0
7.6 NAIC 6 0 0 0 0 0 XXX 0 0.0 0 0.0 0 0
7.7 Totals 0 0 0 0 0 XXX 0 0.0 0 0.0 0 0
8. Parent, Subsidiaries and Affiliates
8.1 NAIC 1 0 0 0 0 0 XXX 0 0.0 0 0.0 0 0
8.2 NAIC 2 0 0 0 0 0 XXX 0 0.0 0 0.0 0 0
8.3 NAIC 3 0 0 0 0 0 XXX 0 0.0 0 0.0 0 0
8.4 NAIC 4 0 0 0 0 0 XXX 0 0.0 0 0.0 0 0
8.5 NAIC 5 0 0 0 0 0 XXX 0 0.0 0 0.0 0 0
8.6 NAIC 6 0 0 0 0 0 XXX 0 0.0 0 0.0 0 0
8.7 Totals 0 0 0 0 0 XXX 0 0.0 0 0.0 0 0
9. SVO Identified Funds
9.1 NAIC 1 XXX XXX XXX XXX XXX 0 0 0.0 0 0.0 0 0
9.2 NAIC 2 XXX XXX XXX XXX XXX 0 0 0.0 0 0.0 0 0
9.3 NAIC 3 XXX XXX XXX XXX XXX 0 0 0.0 0 0.0 0 0
9.4 NAIC 4 XXX XXX XXX XXX XXX 0 0 0.0 0 0.0 0 0
9.5 NAIC 5 XXX XXX XXX XXX XXX 0 0 0.0 0 0.0 0 0
9.6 NAIC 6 XXX XXX XXX XXX XXX 0 0 0.0 0 0.0 0 0
9.7 Totals XXX XXX XXX XXX XXX 0 0 0.0 0 0.0 0 0
10. Unaffiliated Bank Loans
10.1 NAIC 1 0 0 0 0 0 XXX 0 0.0 0 0.0 0 0
10.2 NAIC 2 0 0 0 0 0 XXX 0 0.0 0 0.0 0 0
10.3 NAIC 3 0 0 0 0 0 XXX 0 0.0 0 0.0 0 0
10.4 NAIC 4 0 0 0 0 0 XXX 0 0.0 0 0.0 0 0
10.5 NAIC 5 0 0 0 0 0 XXX 0 0.0 0 0.0 0 0
10.6 NAIC 6 0 0 0 0 0 XXX 0 0.0 0 0.0 0 0
10.7 Totals 0 0 0 0 0 XXX 0 0.0 0 0.0 0 0
SI0
6

ANNUAL STATEMENT FOR THE YEAR 2019 OF THE HANOVER NEW JERSEY INSURANCE COMPANY
SCHEDULE D - PART 1A - SECTION 1 (Continued)Quality and Maturity Distribution of All Bonds Owned December 31, at Book/Adjusted Carrying Values by Major Types of Issues and NAIC Designations
NAIC Designation
1
1 Year or Less
2Over 1 Year
Through 5 Years
3Over 5 Years
Through 10 Years
4Over 10 Years
Through 20 Years
5
Over 20 Years
6No Maturity
Date
7
Total Current Year
8Col. 7 as a % of
Line 11.7
9Total from Col. 7
Prior Year
10% From Col. 8
Prior Year
11Total Publicly
Traded
12Total Privately
Placed (a)
11. Total Bonds Current Year
11.1 NAIC 1 (d) 7,417,387 9,527,741 7,380,885 1,320,499 63,278 0 25,709,790 83.5 XXX XXX 24,003,987 1,705,803
11.2 NAIC 2 (d) 0 3,008,616 1,805,587 260,649 0 0 5,074,852 16.5 XXX XXX 4,226,018 848,834
11.3 NAIC 3 (d) 0 0 0 0 0 0 0 0.0 XXX XXX 0 0
11.4 NAIC 4 (d) 0 0 0 0 0 0 0 0.0 XXX XXX 0 0
11.5 NAIC 5 (d) 0 0 0 0 0 0 (c) 0 0.0 XXX XXX 0 0
11.6 NAIC 6 (d) 0 0 0 0 0 0 (c) 0 0.0 XXX XXX 0 0
11.7 Totals 7,417,387 12,536,357 9,186,472 1,581,148 63,278 0 (b) 30,784,642 100.0 XXX XXX 28,230,005 2,554,637
11.8 Line 11.7 as a % of Col. 7 24.1 40.7 29.8 5.1 0.2 0.0 100.0 XXX XXX XXX 91.7 8.3
12. Total Bonds Prior Year
12.1 NAIC 1 3,062,916 10,515,626 7,685,821 1,328,116 188,787 0 XXX XXX 22,781,266 74.0 21,074,802 1,706,464
12.2 NAIC 2 1,350,065 2,561,353 3,602,284 261,010 221,713 0 XXX XXX 7,996,425 26.0 6,849,252 1,147,173
12.3 NAIC 3 0 0 0 0 0 0 XXX XXX 0 0.0 0 0
12.4 NAIC 4 0 0 0 0 0 0 XXX XXX 0 0.0 0 0
12.5 NAIC 5 0 0 0 0 0 0 XXX XXX (c) 0 0.0 0 0
12.6 NAIC 6 0 0 0 0 0 0 XXX XXX (c) 0 0.0 0 0
12.7 Totals 4,412,981 13,076,979 11,288,105 1,589,126 410,500 0 XXX XXX (b) 30,777,691 100.0 27,924,054 2,853,637
12.8 Line 12.7 as a % of Col. 9 14.3 42.5 36.7 5.2 1.3 0.0 XXX XXX 100.0 XXX 90.7 9.3
13. Total Publicly Traded Bonds
13.1 NAIC 1 6,867,460 8,828,289 6,924,461 1,320,499 63,278 0 24,003,987 78.0 21,074,802 68.5 24,003,987 XXX
13.2 NAIC 2 0 2,508,581 1,456,788 260,649 0 0 4,226,018 13.7 6,849,252 22.3 4,226,018 XXX
13.3 NAIC 3 0 0 0 0 0 0 0 0.0 0 0.0 0 XXX
13.4 NAIC 4 0 0 0 0 0 0 0 0.0 0 0.0 0 XXX
13.5 NAIC 5 0 0 0 0 0 0 0 0.0 0 0.0 0 XXX
13.6 NAIC 6 0 0 0 0 0 0 0 0.0 0 0.0 0 XXX
13.7 Totals 6,867,460 11,336,870 8,381,249 1,581,148 63,278 0 28,230,005 91.7 27,924,054 90.7 28,230,005 XXX
13.8 Line 13.7 as a % of Col. 7 24.3 40.2 29.7 5.6 0.2 0.0 100.0 XXX XXX XXX 100.0 XXX
13.9 Line 13.7 as a % of Line 11.7, Col. 7, Section 11 22.3 36.8 27.2 5.1 0.2 0.0 91.7 XXX XXX XXX 91.7 XXX
14. Total Privately Placed Bonds
14.1 NAIC 1 549,927 699,452 456,424 0 0 0 1,705,803 5.5 1,706,464 5.5 XXX 1,705,803
14.2 NAIC 2 0 500,035 348,799 0 0 0 848,834 2.8 1,147,173 3.7 XXX 848,834
14.3 NAIC 3 0 0 0 0 0 0 0 0.0 0 0.0 XXX 0
14.4 NAIC 4 0 0 0 0 0 0 0 0.0 0 0.0 XXX 0
14.5 NAIC 5 0 0 0 0 0 0 0 0.0 0 0.0 XXX 0
14.6 NAIC 6 0 0 0 0 0 0 0 0.0 0 0.0 XXX 0
14.7 Totals 549,927 1,199,487 805,223 0 0 0 2,554,637 8.3 2,853,637 9.3 XXX 2,554,637
14.8 Line 14.7 as a % of Col. 7 21.5 47.0 31.5 0.0 0.0 0.0 100.0 XXX XXX XXX XXX 100.0
14.9 Line 14.7 as a % of Line 11.7, Col. 7, Section 11 1.8 3.9 2.6 0.0 0.0 0.0 8.3 XXX XXX XXX XXX 8.3
(a) Includes $ 2,554,637 freely tradable under SEC Rule 144 or qualified for resale under SEC Rule 144A.
(b) Includes $ 0 current year of bonds with Z designations and $ 0 prior year of bonds with Z designations. The letter "Z" means the NAIC designation was not assigned by the Securities Valuation Office (SVO) at the date of the statement.
(c) Includes $ 0 current year, $ 0 prior year of bonds with 5GI designations and $ 0 current year, $ 0 prior year of bonds with 6* designations. "5GI" means the NAIC designation was assigned by the
(SVO) in reliance on the insurer's certification that the issuer is current in all principal and interest payments. "6*" means the NAIC designation was assigned by the SVO due to inadequate certification of principal and interest payments.
(d) Includes the following amount of short-term and cash equivalent bonds by NAIC designation: NAIC 1 $ 3,748,712 ; NAIC 2 $ 0 ; NAIC 3 $ 0 ; NAIC 4 $ 0 ; NAIC 5 $ 0 ; NAIC 6 $ 0
SI0
7
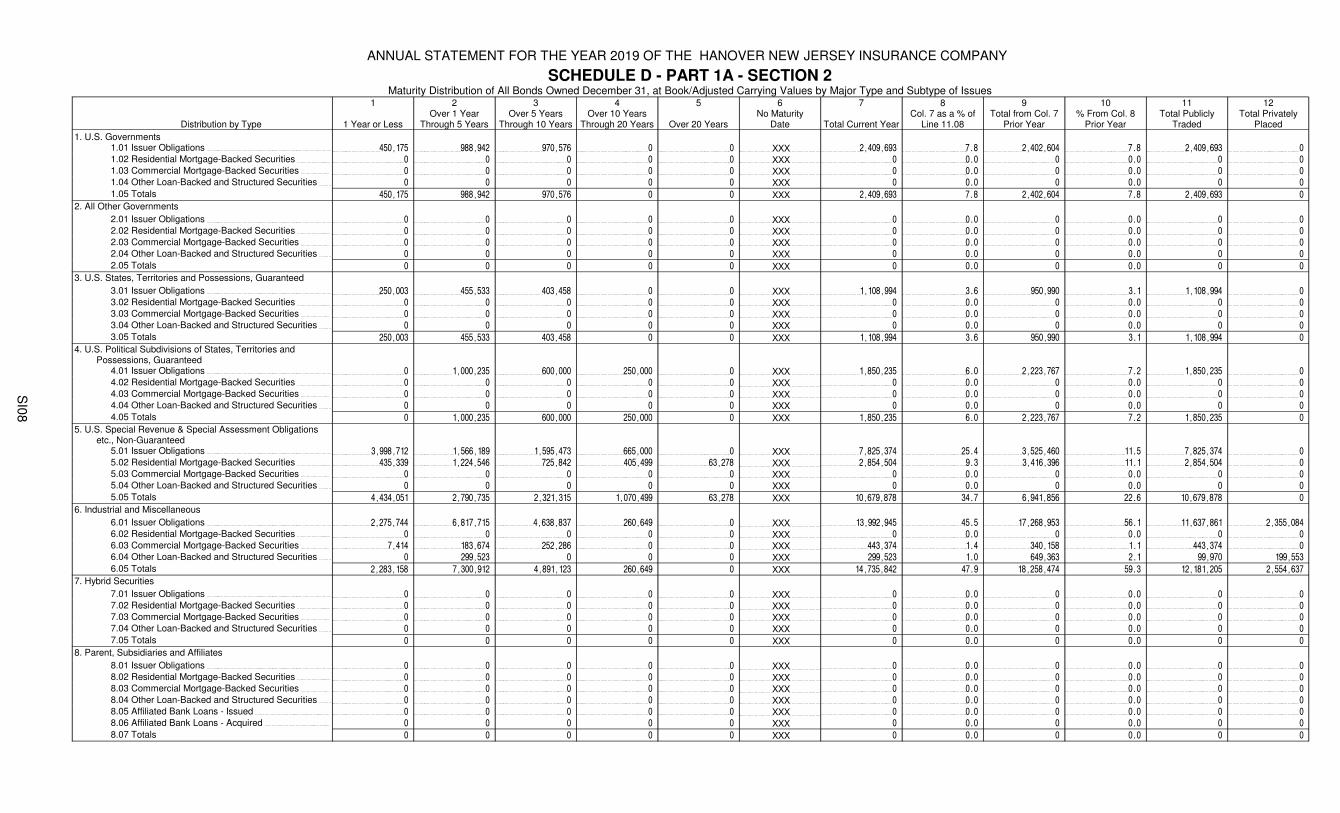
ANNUAL STATEMENT FOR THE YEAR 2019 OF THE HANOVER NEW JERSEY INSURANCE COMPANY
SCHEDULE D - PART 1A - SECTION 2Maturity Distribution of All Bonds Owned December 31, at Book/Adjusted Carrying Values by Major Type and Subtype of Issues
Distribution by Type
1
1 Year or Less
2Over 1 Year
Through 5 Years
3Over 5 Years
Through 10 Years
4Over 10 Years
Through 20 Years
5
Over 20 Years
6No Maturity
Date
7
Total Current Year
8Col. 7 as a % of
Line 11.08
9Total from Col. 7
Prior Year
10% From Col. 8
Prior Year
11Total Publicly
Traded
12Total Privately
Placed
1. U.S. Governments1.01 Issuer Obligations 450,175 988,942 970,576 0 0 XXX 2,409,693 7.8 2,402,604 7.8 2,409,693 0
1.02 Residential Mortgage-Backed Securities 0 0 0 0 0 XXX 0 0.0 0 0.0 0 0
1.03 Commercial Mortgage-Backed Securities 0 0 0 0 0 XXX 0 0.0 0 0.0 0 0
1.04 Other Loan-Backed and Structured Securities 0 0 0 0 0 XXX 0 0.0 0 0.0 0 0
1.05 Totals 450,175 988,942 970,576 0 0 XXX 2,409,693 7.8 2,402,604 7.8 2,409,693 0
2. All Other Governments
2.01 Issuer Obligations 0 0 0 0 0 XXX 0 0.0 0 0.0 0 0
2.02 Residential Mortgage-Backed Securities 0 0 0 0 0 XXX 0 0.0 0 0.0 0 0
2.03 Commercial Mortgage-Backed Securities 0 0 0 0 0 XXX 0 0.0 0 0.0 0 0
2.04 Other Loan-Backed and Structured Securities 0 0 0 0 0 XXX 0 0.0 0 0.0 0 0
2.05 Totals 0 0 0 0 0 XXX 0 0.0 0 0.0 0 0
3. U.S. States, Territories and Possessions, Guaranteed
3.01 Issuer Obligations 250,003 455,533 403,458 0 0 XXX 1,108,994 3.6 950,990 3.1 1,108,994 0
3.02 Residential Mortgage-Backed Securities 0 0 0 0 0 XXX 0 0.0 0 0.0 0 0
3.03 Commercial Mortgage-Backed Securities 0 0 0 0 0 XXX 0 0.0 0 0.0 0 0
3.04 Other Loan-Backed and Structured Securities 0 0 0 0 0 XXX 0 0.0 0 0.0 0 0
3.05 Totals 250,003 455,533 403,458 0 0 XXX 1,108,994 3.6 950,990 3.1 1,108,994 0
4. U.S. Political Subdivisions of States, Territories and Possessions, Guaranteed
4.01 Issuer Obligations 0 1,000,235 600,000 250,000 0 XXX 1,850,235 6.0 2,223,767 7.2 1,850,235 0
4.02 Residential Mortgage-Backed Securities 0 0 0 0 0 XXX 0 0.0 0 0.0 0 0
4.03 Commercial Mortgage-Backed Securities 0 0 0 0 0 XXX 0 0.0 0 0.0 0 0
4.04 Other Loan-Backed and Structured Securities 0 0 0 0 0 XXX 0 0.0 0 0.0 0 0
4.05 Totals 0 1,000,235 600,000 250,000 0 XXX 1,850,235 6.0 2,223,767 7.2 1,850,235 0
5. U.S. Special Revenue & Special Assessment Obligations etc., Non-Guaranteed
5.01 Issuer Obligations 3,998,712 1,566,189 1,595,473 665,000 0 XXX 7,825,374 25.4 3,525,460 11.5 7,825,374 0
5.02 Residential Mortgage-Backed Securities 435,339 1,224,546 725,842 405,499 63,278 XXX 2,854,504 9.3 3,416,396 11.1 2,854,504 0
5.03 Commercial Mortgage-Backed Securities 0 0 0 0 0 XXX 0 0.0 0 0.0 0 0
5.04 Other Loan-Backed and Structured Securities 0 0 0 0 0 XXX 0 0.0 0 0.0 0 0
5.05 Totals 4,434,051 2,790,735 2,321,315 1,070,499 63,278 XXX 10,679,878 34.7 6,941,856 22.6 10,679,878 0
6. Industrial and Miscellaneous
6.01 Issuer Obligations 2,275,744 6,817,715 4,638,837 260,649 0 XXX 13,992,945 45.5 17,268,953 56.1 11,637,861 2,355,084
6.02 Residential Mortgage-Backed Securities 0 0 0 0 0 XXX 0 0.0 0 0.0 0 0
6.03 Commercial Mortgage-Backed Securities 7,414 183,674 252,286 0 0 XXX 443,374 1.4 340,158 1.1 443,374 0
6.04 Other Loan-Backed and Structured Securities 0 299,523 0 0 0 XXX 299,523 1.0 649,363 2.1 99,970 199,553
6.05 Totals 2,283,158 7,300,912 4,891,123 260,649 0 XXX 14,735,842 47.9 18,258,474 59.3 12,181,205 2,554,637
7. Hybrid Securities
7.01 Issuer Obligations 0 0 0 0 0 XXX 0 0.0 0 0.0 0 0
7.02 Residential Mortgage-Backed Securities 0 0 0 0 0 XXX 0 0.0 0 0.0 0 0
7.03 Commercial Mortgage-Backed Securities 0 0 0 0 0 XXX 0 0.0 0 0.0 0 0
7.04 Other Loan-Backed and Structured Securities 0 0 0 0 0 XXX 0 0.0 0 0.0 0 0
7.05 Totals 0 0 0 0 0 XXX 0 0.0 0 0.0 0 0
8. Parent, Subsidiaries and Affiliates
8.01 Issuer Obligations 0 0 0 0 0 XXX 0 0.0 0 0.0 0 0
8.02 Residential Mortgage-Backed Securities 0 0 0 0 0 XXX 0 0.0 0 0.0 0 0
8.03 Commercial Mortgage-Backed Securities 0 0 0 0 0 XXX 0 0.0 0 0.0 0 0
8.04 Other Loan-Backed and Structured Securities 0 0 0 0 0 XXX 0 0.0 0 0.0 0 0
8.05 Affiliated Bank Loans - Issued 0 0 0 0 0 XXX 0 0.0 0 0.0 0 0
8.06 Affiliated Bank Loans - Acquired 0 0 0 0 0 XXX 0 0.0 0 0.0 0 0
8.07 Totals 0 0 0 0 0 XXX 0 0.0 0 0.0 0 0
SI0
8

ANNUAL STATEMENT FOR THE YEAR 2019 OF THE HANOVER NEW JERSEY INSURANCE COMPANY
SCHEDULE D - PART 1A - SECTION 2 (Continued)Maturity Distribution of All Bonds Owned December 31, at Book/Adjusted Carrying Values by Major Type and Subtype of Issues
Distribution by Type
1
1 Year or Less
2Over 1 Year
Through 5 Years
3Over 5 Years
Through 10 Years
4Over 10 Years
Through 20 Years
5
Over 20 Years
6No Maturity
Date
7
Total Current Year
8Col. 7 as a % of
Line 11.08
9Total from Col. 7
Prior Year
10% From Col. 8
Prior Year
11Total Publicly
Traded
12Total Privately
Placed
9. SVO Identified Funds9.01 Exchange Traded Funds Identified by the SVO XXX XXX XXX XXX XXX 0 0 0.0 0 0.0 0 0
9.02 Bond Mutual Funds Identified by the SVO XXX XXX XXX XXX XXX 0 0 0.0 0 0.0 0 0
9.03 Totals XXX XXX XXX XXX XXX 0 0 0.0 0 0.0 0 0
10. Unaffiliated Bank Loans10.01 Unaffiliated Bank Loans - Issued 0 0 0 0 0 XXX 0 0.0 0 0.0 0 0
10.02 Unaffiliated Bank Loans - Acquired 0 0 0 0 0 XXX 0 0.0 0 0.0 0 0
10.03 Totals 0 0 0 0 0 XXX 0 0.0 0 0.0 0 0
11. Total Bonds Current Year11.01 Issuer Obligations 6,974,634 10,828,614 8,208,344 1,175,649 0 XXX 27,187,241 88.3 XXX XXX 24,832,157 2,355,084
11.02 Residential Mortgage-Backed Securities 435,339 1,224,546 725,842 405,499 63,278 XXX 2,854,504 9.3 XXX XXX 2,854,504 0
11.03 Commercial Mortgage-Backed Securities 7,414 183,674 252,286 0 0 XXX 443,374 1.4 XXX XXX 443,374 0
11.04 Other Loan-Backed and Structured Securities 0 299,523 0 0 0 XXX 299,523 1.0 XXX XXX 99,970 199,553
11.05 SVO Identified Funds XXX XXX XXX XXX XXX 0 0 0.0 XXX XXX 0 0
11.06 Affiliated Bank Loans 0 0 0 0 0 XXX 0 0.0 XXX XXX 0 0
11.07 Unaffiliated Bank Loans 0 0 0 0 0 XXX 0 0.0 XXX XXX 0 0
11.08 Totals 7,417,387 12,536,357 9,186,472 1,581,148 63,278 0 30,784,642 100.0 XXX XXX 28,230,005 2,554,637
11.09 Line 11.08 as a % of Col. 7 24.1 40.7 29.8 5.1 0.2 0.0 100.0 XXX XXX XXX 91.7 8.3
12. Total Bonds Prior Year12.01 Issuer Obligations 3,623,559 11,420,966 10,194,526 911,010 221,713 XXX XXX XXX 26,371,774 85.7 23,817,551 2,554,223
12.02 Residential Mortgage-Backed Securities 300,154 1,155,760 1,093,579 678,116 188,787 XXX XXX XXX 3,416,396 11.1 3,416,396 0
12.03 Commercial Mortgage-Backed Securities 139,284 200,874 0 0 0 XXX XXX XXX 340,158 1.1 340,158 0
12.04 Other Loan-Backed and Structured Securities 349,984 299,379 0 0 0 XXX XXX XXX 649,363 2.1 349,949 299,414
12.05 SVO Identified Funds XXX XXX XXX XXX XXX 0 XXX XXX 0 0.0 0 0
12.06 Affiliated Bank Loans 0 0 0 0 0 XXX XXX XXX 0 0.0 0 0
12.07 Unaffiliated Bank Loans 0 0 0 0 0 XXX XXX XXX 0 0.0 0 0
12.08 Totals 4,412,981 13,076,979 11,288,105 1,589,126 410,500 0 XXX XXX 30,777,691 100.0 27,924,054 2,853,637
12.09 Line 12.08 as a % of Col. 9 14.3 42.5 36.7 5.2 1.3 0.0 XXX XXX 100 XXX 90.7 9.3
13. Total Publicly Traded Bonds
13.01 Issuer Obligations 6,424,707 9,828,680 7,403,121 1,175,649 0 XXX 24,832,157 80.7 23,817,551 77.4 24,832,157 XXX13.02 Residential Mortgage-Backed Securities 435,339 1,224,546 725,842 405,499 63,278 XXX 2,854,504 9.3 3,416,396 11.1 2,854,504 XXX13.03 Commercial Mortgage-Backed Securities 7,414 183,674 252,286 0 0 XXX 443,374 1.4 340,158 1.1 443,374 XXX13.04 Other Loan-Backed and Structured Securities 0 99,970 0 0 0 XXX 99,970 0.3 349,949 1.1 99,970 XXX13.05 SVO Identified Funds XXX XXX XXX XXX XXX 0 0 0.0 0 0.0 0 XXX13.06 Affiliated Bank Loans 0 0 0 0 0 XXX 0 0.0 0 0.0 0 XXX13.07 Unaffiliated Bank Loans 0 0 0 0 0 XXX 0 0.0 0 0.0 0 XXX13.08 Totals 6,867,460 11,336,870 8,381,249 1,581,148 63,278 0 28,230,005 91.7 27,924,054 90.7 28,230,005 XXX13.09 Line 13.08 as a % of Col. 7 24.3 40.2 29.7 5.6 0.2 0.0 100.0 XXX XXX XXX 100.0 XXX13.10 Line 13.08 as a % of Line 11.08, Col. 7, Section 11 22.3 36.8 27.2 5.1 0.2 0.0 91.7 XXX XXX XXX 91.7 XXX
14. Total Privately Placed Bonds
14.01 Issuer Obligations 549,927 999,934 805,223 0 0 XXX 2,355,084 7.7 2,554,223 8.3 XXX 2,355,084
14.02 Residential Mortgage-Backed Securities 0 0 0 0 0 XXX 0 0.0 0 0.0 XXX 0
14.03 Commercial Mortgage-Backed Securities 0 0 0 0 0 XXX 0 0.0 0 0.0 XXX 0
14.04 Other Loan-Backed and Structured Securities 0 199,553 0 0 0 XXX 199,553 0.6 299,414 1.0 XXX 199,553
14.05 SVO Identified Funds XXX XXX XXX XXX XXX 0 0 0.0 0 0.0 XXX 0
14.06 Affiliated Bank Loans 0 0 0 0 0 XXX 0 0.0 0 0.0 XXX 0
14.07 Unaffiliated Bank Loans 0 0 0 0 0 XXX 0 0.0 0 0.0 XXX 0
14.08 Totals 549,927 1,199,487 805,223 0 0 0 2,554,637 8.3 2,853,637 9.3 XXX 2,554,637
14.09 Line 14.08 as a % of Col. 7 21.5 47.0 31.5 0.0 0.0 0.0 100.0 XXX XXX XXX XXX 100.0
14.10 Line 14.08 as a % of Line 11.08, Col. 7, Section 11 1.8 3.9 2.6 0.0 0.0 0.0 8.3 XXX XXX XXX XXX 8.3
SI0
9

ANNUAL STATEMENT FOR THE YEAR 2019 OF THE HANOVER NEW JERSEY INSURANCE COMPANY
Schedule DA - Verification - Short-Term Investments
N O N E
Schedule DB - Part A - Verification - Options, Caps, Floors, Collars, Swaps and Forwards
N O N E
Schedule DB - Part B - Verification - Futures Contracts
N O N E
Schedule DB - Part C - Section 1 - Replication (Synthetic Asset) Transactions (RSATs) Open
N O N E
Schedule DB-Part C-Section 2-Reconciliation of Replication (Synthetic Asset) Transactions Open
N O N E
Schedule DB - Verification - Book/Adjusted Carrying Value, Fair Value and Potential Exposure of Derivatives
N O N E
SI10, SI11, SI12, SI13, SI14

ANNUAL STATEMENT FOR THE YEAR 2019 OF THE HANOVER NEW JERSEY INSURANCE COMPANY
SCHEDULE E - PART 2 - VERIFICATION BETWEEN YEARS(Cash Equivalents)
1
Total
2
Bonds
3Money MarketMutual funds
4
Other (a)
1. Book/adjusted carrying value, December 31 of prior year 252,303 249,571 2,732 0
2. Cost of cash equivalents acquired 37,866,353 37,866,297 56 0
3. Accrual of discount 32,375 32,375 0 0
4. Unrealized valuation increase (decrease) 0 0 0 0
5. Total gain (loss) on disposals (1) (1) 0 0
6. Deduct consideration received on disposals 34,399,530 34,399,530 0 0
7. Deduct amortization of premium 0 0 0 0
8. Total foreign exchange change in book/adjusted carrying value 0 0 0 0
9. Deduct current year’s other than temporary impairment recognized 0 0 0 0
10. Book/adjusted carrying value at end of current period (Lines 1+2+3+4+5-6-7+8-9) 3,751,500 3,748,712 2,788 0
11. Deduct total nonadmitted amounts 0 0 0 0
12. Statement value at end of current period (Line 10 minus Line 11) 3,751,500 3,748,712 2,788 0
(a) Indicate the category of such investments, for example, joint ventures, transportation equipment:
SI15
ANNUAL STATEMENT FOR THE YEAR 2019 OF THE HANOVER NEW JERSEY INSURANCE COMPANY
Schedule A - Part 1 - Real Estate Owned
N O N E
Schedule A - Part 2 - Real Estate Acquired and Additions Made
N O N E
Schedule A - Part 3 - Real Estate Disposed
N O N E
Schedule B - Part 1 - Mortgage Loans Owned
N O N E
Schedule B - Part 2 - Mortgage Loans Acquired and Additions Made
N O N E
Schedule B - Part 3 - Mortgage Loans Disposed, Transferred or Repaid
N O N E
Schedule BA - Part 1 - Other Long-Term Invested Assets Owned
N O N E
Schedule BA - Part 2 - Other Long-Term Invested Assets Acquired and Additions Made
N O N E
Schedule BA - Part 3 - Other Long-Term Invested Assets Disposed, Transferred or Repaid
N O N E
E01, E02, E03, E04, E05, E06, E07, E08, E09

ANNUAL STATEMENT FOR THE YEAR 2019 OF THE HANOVER NEW JERSEY INSURANCE COMPANY
SCHEDULE D - PART 1Showing All Long-Term BONDS Owned December 31 of Current Year
1 2 Codes 6 7 Fair Value 10 11 Change in Book/Adjusted Carrying Value Interest Dates3 4 5 8 9 12 13 14 15 16 17 18 19 20 21 22
CUSIP Identification Description
Code
Foreign
BondChar
NAICDesig-nation and
Admini-strative Symbol
ActualCost
Rate Used to Obtain
Fair Value
FairValue
ParValue
Book/AdjustedCarrying
Value
UnrealizedValuationIncrease/
(Decrease)
CurrentYear's(Amor-tization)
Accretion
CurrentYear'sOther-Than-
TemporaryImpairmentRecognized
TotalForeign
ExchangeChange
inBook/
AdjustedCarrying
ValueRate
of
EffectiveRate
ofWhenPaid
AdmittedAmountDue andAccrued
Amount Received
During Year Acquired
StatedContractual
MaturityDate
912828-5Q-9 U.S. Treasury Notes 1 200,328 100.9880 201,976 200,000 200,158 0 (167) 0 0 2.750 2.662 MN 481 5,500 12/21/2018 11/30/2020
912828-P3-8 U.S. Treasury Notes 1 487,559 100.4140 502,070 500,000 492,328 0 2,378 0 0 1.750 2.268 JJ 3,662 8,750 12/21/2017 01/31/2023
912828-U2-4 U.S. Treasury Notes 1 959,023 101.1600 1,011,600 1,000,000 970,576 0 3,879 0 0 2.000 2.468 MN 2,582 20,000 12/22/2016 11/15/2026
912828-UN-8 U.S. Treasury Notes 1 494,551 101.1720 505,860 500,000 496,614 0 1,036 0 0 2.000 2.226 FA 3,777 10,000 12/28/2017 02/15/2023
912828-XH-8 U.S. Treasury Notes 1 250,167 100.0000 250,000 250,000 250,017 0 (35) 0 0 1.625 1.611 JD 11 4,063 07/29/2015 06/30/2020
0199999. Subtotal - Bonds - U.S. Governments - Issuer Obligations 2,391,628 XXX 2,471,506 2,450,000 2,409,693 0 7,091 0 0 XXX XXX XXX 10,513 48,313 XXX XXX0599999. Total - U.S. Government Bonds 2,391,628 XXX 2,471,506 2,450,000 2,409,693 0 7,091 0 0 XXX XXX XXX 10,513 48,313 XXX XXX1099999. Total - All Other Government Bonds 0 XXX 0 0 0 0 0 0 0 XXX XXX XXX 0 0 XXX XXX649791-GW-4 New York State Taxable - G.O. 1FE 100,000 101.8440 101,844 100,000 100,000 0 0 0 0 3.000 3.000 JD 133 3,000 12/07/2011 12/15/2021
68608K-NE-4 Oregon State Taxable - G.O. 1 1FE 273,799 110.0960 258,726 235,000 253,987 0 (3,724) 0 0 5.742 3.804 FA 5,622 13,494 03/07/2014 08/01/2024
70914P-LY-6 Pennsylvania State Taxable - G.O. 1 1FE 250,192 100.2960 250,740 250,000 250,003 0 (24) 0 0 4.450 4.440 FA 4,203 11,125 01/14/2010 02/15/2020
76222R-YC-0 Rhode Island State Taxable - G.O. 1 1FE 101,770 103.9240 103,924 100,000 101,546 0 (224) 0 0 3.000 2.620 MN 500 1,508 04/17/2019 05/01/2024
76222R-YD-8 Rhode Island State Taxable - G.O. 1 1FE 203,860 104.3770 208,754 200,000 203,458 0 (402) 0 0 3.000 2.650 MN 1,000 3,017 04/17/2019 05/01/2025
880541-XZ-5 Tennessee State Taxable - G.O. 2 1FE 200,000 99.2700 198,540 200,000 200,000 0 0 0 0 2.166 2.166 FA 1,805 4,332 07/27/2016 08/01/2027
1199999. Subtotal - Bonds - U.S. States, Territories and Possessions - Issuer Obligations 1,129,621 XXX 1,122,528 1,085,000 1,108,994 0 (4,374) 0 0 XXX XXX XXX 13,263 36,476 XXX XXX
1799999. Total - U.S. States, Territories and Possessions Bonds 1,129,621 XXX 1,122,528 1,085,000 1,108,994 0 (4,374) 0 0 XXX XXX XXX 13,263 36,476 XXX XXX041431-GB-7 Arlington Cnty VA Taxable - G.O. 2 1FE 250,000 101.3920 253,480 250,000 250,000 0 0 0 0 3.993 3.993 FA 3,771 9,983 07/29/2010 08/15/2021
212204-JP-7 Contra Costa CA Cmnty Clg Dis. Taxable - G.O. 2 1FE 250,000 95.5820 238,955 250,000 250,000 0 0 0 0 2.563 2.563 FA 1,940 0 08/29/2019 08/01/2033
416848-VX-4 Hartland MI Con. School Dist. Taxable - G.O. 1FE 300,000 101.0960 303,288 300,000 300,000 0 0 0 0 2.478 2.478 MN 1,239 7,434 10/15/2015 05/01/2021
478449-6Q-9 Johnson Cnty KS Taxable - G.O. 2 1FE 275,000 101.5470 279,254 275,000 275,000 0 0 0 0 5.400 5.400 MS 4,950 14,850 11/20/2009 09/01/2029
64763F-PZ-6 New Orleans LA Taxable - G.O. 1 1FE 201,040 102.0700 204,140 200,000 200,235 0 (135) 0 0 3.392 3.319 MS 2,261 6,784 05/29/2013 09/01/2021
678519-C3-1 Oklahoma City OK Taxable - G.O. 1FE 45,000 103.5770 46,610 45,000 45,000 0 0 0 0 3.030 3.030 MS 455 432 04/17/2019 03/01/2027
678519-C4-9 Oklahoma City OK Taxable - G.O. 1FE 130,000 104.0800 135,303 130,000 130,000 0 0 0 0 3.120 3.120 MS 1,352 1,284 04/17/2019 03/01/2028
779240-GZ-7 Round Rock TX Sch. Dist. Taxable - G.O. 2 1FE 250,000 101.3590 253,398 250,000 250,000 0 0 0 0 4.158 4.158 FA 4,331 10,395 12/02/2010 08/01/2021
799017-UZ-9 San Mateo CA School District Taxable - G.O. 2 1FE 150,000 102.9930 154,490 150,000 150,000 0 0 0 0 2.979 2.979 MS 1,490 4,468 11/15/2017 09/01/2028
1899999. Subtotal - Bonds - U.S. Political Subdivisions - Issuer Obligations 1,851,040 XXX 1,868,918 1,850,000 1,850,235 0 (135) 0 0 XXX XXX XXX 21,789 55,630 XXX XXX2499999. Total - U.S. Political Subdivisions Bonds 1,851,040 XXX 1,868,918 1,850,000 1,850,235 0 (135) 0 0 XXX XXX XXX 21,789 55,630 XXX XXX051249-HB-9 Augusta GA Wtr & Swr Taxable - Revenue Bonds 1FE 300,000 105.0870 315,261 300,000 300,000 0 0 0 0 3.800 3.800 AO 2,850 11,400 07/17/2013 10/01/2023
052414-TD-1
Austin TX Electric Utility Taxable - Revenue Bonds
2 1FE 250,000 99.4150 248,538 250,000 250,000 0 0 0 0 2.685 2.685 MN 858 1,566 07/31/2019 11/15/2030
186352-SM-3
Cleveland OH Airport System Taxable - Revenue
Bonds 1 1FE 250,000 99.1220 247,805 250,000 250,000 0 0 0 0 2.792 2.792 JJ 1,745 0 09/18/2019 01/01/2029
20775C-W2-6
Connecticut Housing Fin. Auth. Taxable - Revenue
Bonds 1FE 130,000 102.6070 133,389 130,000 130,000 0 0 0 0 2.900 2.900 MN 482 1,948 04/24/2019 05/15/2024
20775C-W5-9
Connecticut Housing Fin. Auth. Taxable - Revenue
Bonds 1FE 165,000 104.6660 172,699 165,000 165,000 0 0 0 0 3.550 3.550 MN 748 3,026 04/24/2019 05/15/2030
259561-PH-5
Douglas WA Pub. Utility Dist. Taxable - Revenue
Bonds 1 1FE 250,000 117.5360 293,840 250,000 250,000 0 0 0 0 5.345 5.345 MS 4,454 13,363 08/20/2010 09/01/2030
270618-CK-5 East Baton Rouge LA Sewer Taxable - Revenue Bonds 2 1FE 250,000 100.2580 250,645 250,000 250,000 0 0 0 0 5.003 5.003 FA 5,211 12,508 05/21/2010 02/01/2024
3135G0-Q2-2 Fannie Mae Notes 1FE 286,920 99.8210 299,463 300,000 290,093 0 1,339 0 0 1.875 2.410 MS 1,516 5,625 08/04/2017 09/24/2026
451174-AD-8
Idaho Energy Resources Auth. Taxable - Revenue
Bonds 1 1FE 150,000 102.8200 154,230 150,000 150,000 0 0 0 0 2.952 2.952 MS 1,476 4,428 09/12/2017 09/01/2028
47770V-AY-6 Jobs OH Beverage Sys. Taxable - Revenue Bonds 1 1FE 211,096 108.5880 217,176 200,000 210,380 0 (715) 0 0 3.985 3.313 JJ 3,985 3,985 04/03/2019 01/01/2029
49130T-SK-3 Kentucky State Hsg Corp. Taxable - Revenue Bonds 1FE 250,000 102.5510 256,378 250,000 250,000 0 0 0 0 3.018 3.018 JJ 3,773 7,545 05/30/2014 07/01/2022
56045R-AK-5 Maine Muni Bond Bank Taxable - Revenue Bonds 1 1FE 250,000 101.7760 254,440 250,000 250,000 0 0 0 0 4.824 4.824 MS 4,020 12,060 11/19/2010 09/01/2020
63968A-L8-6
Nebraska Public Power Dist. Taxable - Revenue
Bonds 1 1FE 200,000 101.3120 202,624 200,000 200,000 0 0 0 0 2.752 2.752 JJ 2,752 5,504 10/19/2016 01/01/2026
64469N-AD-1
New Hampshire State Highway Taxable - Revenue Bonds
1 1FE 250,000 105.3500 263,375 250,000 250,000 0 0 0 0 4.334 4.334 MS 3,612 10,835 11/05/2010 09/01/2022
647200-V3-5
New Mexico Mtg Fin. Auth. Tax-Exempt - Revenue
Bonds 2 1FE 63,527 103.0690 61,841 60,000 61,189 0 (352) 0 0 3.750 3.088 MS 750 2,250 08/15/2012 03/01/2043
68607V-Z6-5 Oregon State Lottery Taxable - Revenue Bonds 1 1FE 50,000 101.1950 50,598 50,000 50,000 0 0 0 0 2.455 2.455 AO 307 580 03/28/2019 04/01/2023
68607V-Z9-9 Oregon State Lottery Taxable - Revenue Bonds 1 1FE 20,000 101.4500 20,290 20,000 20,000 0 0 0 0 2.715 2.715 AO 136 256 03/28/2019 04/01/2026
E10

ANNUAL STATEMENT FOR THE YEAR 2019 OF THE HANOVER NEW JERSEY INSURANCE COMPANY
SCHEDULE D - PART 1Showing All Long-Term BONDS Owned December 31 of Current Year
1 2 Codes 6 7 Fair Value 10 11 Change in Book/Adjusted Carrying Value Interest Dates3 4 5 8 9 12 13 14 15 16 17 18 19 20 21 22
CUSIP Identification Description
Code
Foreign
BondChar
NAICDesig-nation and
Admini-strative Symbol
ActualCost
Rate Used to Obtain
Fair Value
FairValue
ParValue
Book/AdjustedCarrying
Value
UnrealizedValuationIncrease/
(Decrease)
CurrentYear's(Amor-tization)
Accretion
CurrentYear'sOther-Than-
TemporaryImpairmentRecognized
TotalForeign
ExchangeChange
inBook/
AdjustedCarrying
ValueRate
of
EffectiveRate
ofWhenPaid
AdmittedAmountDue andAccrued
Amount Received
During Year Acquired
StatedContractual
MaturityDate
80168A-BY-2
Santa Clara Valley CA Water Taxable - Revenue
Bonds 1 1FE 25,000 102.5910 25,648 25,000 25,000 0 0 0 0 2.649 2.649 JD 55 397 04/10/2019 06/01/2024
80168A-BZ-9
Santa Clara Valley CA Water Taxable - Revenue
Bonds 1 1FE 50,000 102.9920 51,496 50,000 50,000 0 0 0 0 2.782 2.782 JD 116 835 04/10/2019 06/01/2025
80168A-CA-3
Santa Clara Valley CA Water Taxable - Revenue
Bonds 1 1FE 50,000 103.4250 51,713 50,000 50,000 0 0 0 0 2.852 2.852 JD 119 856 04/10/2019 06/01/2026
80168A-CB-1
Santa Clara Valley CA Water Taxable - Revenue
Bonds 1 1FE 25,000 103.5700 25,893 25,000 25,000 0 0 0 0 2.994 2.994 JD 62 449 04/10/2019 06/01/2027
80168A-CC-9
Santa Clara Valley CA Water Taxable - Revenue
Bonds 1 1FE 150,000 104.0910 156,136 150,000 150,000 0 0 0 0 3.114 3.114 JD 389 2,803 04/10/2019 06/01/2028
91412G-XB-6 University of CA Taxable - Revenue Bonds 1 1FE 200,000 105.2990 210,597 200,000 200,000 0 0 0 0 3.159 3.159 MN 807 6,318 03/13/2015 05/15/2025
914437-RC-4
University of MA Bldg Auth. Taxable - Revenue
Bonds 1 1FE 250,000 101.0300 252,574 250,000 250,000 0 0 0 0 2.666 2.666 MN 1,111 6,664 05/21/2014 11/01/2021
2599999. Subtotal - Bonds - U.S. Special Revenues - Issuer Obligations 4,076,543 XXX 4,216,649 4,075,000 4,076,662 0 272 0 0 XXX XXX XXX 41,334 115,201 XXX XXX196479-VN-6 Colorado State HFA Taxable - Revenue Bonds 2 1FE 80,000 99.4880 79,590 80,000 80,000 0 0 0 0 2.800 2.816 MON 187 2,240 04/15/2013 09/01/2041
3128MJ-WV-8 Freddie Mac FGG08659 4 1FE 304,328 104.4670 319,872 306,194 304,333 0 26 0 0 3.500 3.617 MON 893 10,717 05/02/2018 08/01/2045
3128MM-YP-2 Freddie Mac FGG18717 4 1FE 359,512 104.5180 367,937 352,032 359,666 0 170 0 0 4.000 3.241 MON 1,173 14,081 12/18/2018 12/01/2033
31335A-BE-7 Freddie Mac FGG60037 4 1FE 200,921 103.0750 213,024 206,669 201,043 0 104 0 0 3.000 3.453 MON 517 6,200 08/08/2018 10/01/2043
31335B-M6-0 Freddie Mac FGG61281 4 1FE 202,243 104.2740 211,548 202,877 202,259 0 11 0 0 3.500 3.555 MON 592 7,100 02/27/2018 01/01/2048
3136AA-EK-7 Fannie Mae FNR2012129TD 4 1FE 56,256 98.7910 55,089 55,763 56,337 0 (51) 0 0 2.000 1.777 MON 93 1,115 03/26/2013 05/25/2040
3137AH-2W-7 Freddie Mac FHR3936AB 4 1FE 290,748 101.5210 289,560 285,222 286,508 0 (734) 0 0 3.000 2.788 MON 713 8,557 01/18/2012 10/15/2026
3137AS-RZ-9 Freddie Mac FHR4099VB 4 1FE 261,250 101.0220 252,555 250,000 254,971 0 (1,294) 0 0 3.000 2.578 MON 625 7,500 10/05/2012 09/15/2033
3137FG-A5-4 Freddie Mac FHR4806AC 4 1FE 114,626 100.9620 115,104 114,007 114,362 0 (217) 0 0 3.500 3.179 MON 333 3,990 06/22/2018 06/15/2042
3138WE-6W-4 Fannie Mae FNAS5384 4 1FE 312,488 105.9650 314,470 296,769 313,215 0 (1,242) 0 0 4.000 2.933 MON 989 11,871 02/07/2017 07/01/2045
31394G-U9-2 Freddie Mac FHR2666BD 4 1FE 34,599 102.2670 34,562 33,796 33,976 0 (61) 0 0 4.500 4.007 MON 127 1,521 05/01/2009 08/15/2023
3140Q7-SL-2 Fannie Mae FNCA0522 4 1FE 413,692 100.6120 423,587 421,010 414,409 0 390 0 0 3.000 3.272 MON 1,053 12,630 01/26/2018 10/01/2047
92813T-EE-6
Virginia State Hsg Dev. Auth. Taxable - Revenue
Bonds 2 1FE 233,423 102.2330 238,636 233,423 233,425 0 0 0 0 3.250 3.272 MON 631 7,587 03/11/2013 08/25/2042
2699999. Subtotal - Bonds - U.S. Special Revenues - Residential Mortgage-Backed Securities 2,864,086 XXX 2,915,534 2,837,762 2,854,504 0 (2,898) 0 0 XXX XXX XXX 7,926 95,109 XXX XXX
3199999. Total - U.S. Special Revenues Bonds 6,940,629 XXX 7,132,183 6,912,762 6,931,166 0 (2,626) 0 0 XXX XXX XXX 49,260 210,310 XXX XXX00206R-AB-8 AT&T Inc. Senior Notes SD 1 2FE 105,591 130.6780 130,678 100,000 104,260 0 (144) 0 0 6.800 6.377 MN 869 6,800 10/03/2006 05/15/2036
00206R-AB-8 AT&T Inc. Senior Notes 1 2FE 158,387 130.6780 196,017 150,000 156,390 0 (217) 0 0 6.800 6.377 MN 1,303 10,200 10/03/2006 05/15/2036
012725-AC-1 Albemarle Corp. Senior Notes 2 2FE 152,982 107.1840 160,776 150,000 152,378 0 (456) 0 0 4.150 3.777 JD 519 6,225 08/23/2018 12/01/2024
02665W-CJ-8 American Honda Fin. Senior Notes 1 1FE 99,827 104.6930 104,693 100,000 99,874 0 33 0 0 3.450 3.488 JJ 1,600 3,431 07/11/2018 07/14/2023
035242-AL-0 Anheuser-Busch INBEV Senior Notes 2 2FE 178,322 103.6050 185,453 179,000 178,683 0 96 0 0 3.300 3.361 FA 2,461 5,907 01/13/2016 02/01/2023
037735-CU-9 Appalachian Power Co. Senior Notes 2 1FE 199,290 103.9570 207,914 200,000 199,588 0 68 0 0 3.400 3.442 JD 567 6,800 05/11/2015 06/01/2025
037833-CJ-7 Apple Inc. Senior Notes 2 1FE 200,000 106.5190 213,038 200,000 200,000 0 0 0 0 3.350 3.350 FA 2,643 6,700 02/02/2017 02/09/2027
040555-CS-1 Arizona Public Service Senior Notes 2 1FE 99,474 103.7030 103,703 100,000 99,696 0 51 0 0 3.150 3.212 MN 403 3,150 05/14/2015 05/15/2025
053611-AJ-8 Avery Dennison Corp. Senior Notes 2 2FE 149,250 113.2530 169,880 150,000 149,314 0 60 0 0 4.875 4.939 JD 508 7,313 11/29/2018 12/06/2028
05531F-BB-8 BB&T Corp. Senior Notes 2 1FE 99,918 103.3210 103,321 100,000 99,942 0 11 0 0 2.850 2.863 AO 515 2,850 10/23/2017 10/26/2024
06051G-FF-1 Bank of America Corp. Senior Notes 1FE 250,040 107.1080 267,770 250,000 250,019 0 (4) 0 0 4.000 3.998 AO 2,500 10,000 03/28/2014 04/01/2024
06406F-AB-9 Bank of NY Mellon Corp. Senior Notes 2 1FE 249,883 100.3180 250,795 250,000 249,967 0 24 0 0 2.050 2.060 MN 826 5,125 04/25/2016 05/03/2021
114259-AT-1 Brooklyn Union Gas Senior Notes 2 1FE 100,000 108.6000 108,600 100,000 100,000 0 0 0 0 3.865 3.865 MS 1,256 1,933 02/27/2019 03/04/2029
12189L-AM-3 Burlington North Santa Fe Senior Notes 2 1FE 150,000 102.7390 154,109 150,000 150,000 0 0 0 0 3.000 3.000 MS 1,325 4,500 03/06/2013 03/15/2023
12527G-AG-8 CF Industries Inc. Notes 1 2FE 49,564 102.5540 51,277 50,000 49,823 0 88 0 0 3.400 3.593 JD 142 1,700 12/08/2016 12/01/2021
126650-CT-5 CVS Health Corp. Senior Notes 2 2FE 249,303 100.1730 250,433 250,000 249,796 0 141 0 0 2.125 2.184 JD 443 5,313 05/16/2016 06/01/2021
14040H-BT-1 Capital One Financial Co. Senior Notes 2 2FE 149,564 104.1490 156,224 150,000 149,688 0 59 0 0 3.300 3.347 AO 839 4,950 10/26/2017 10/30/2024
14149Y-AV-0 Cardinal Health Inc. Senior Notes 1 2FE 199,758 102.4630 204,926 200,000 199,935 0 25 0 0 3.200 3.214 JD 284 6,400 05/16/2012 06/15/2022
14913Q-2S-7 Caterpillar Fin. Services Senior Notes 1 1FE 99,950 106.1360 106,136 100,000 99,960 0 9 0 0 3.650 3.661 JD 243 3,650 12/03/2018 12/07/2023
166764-AY-6 Chevron Corp. Senior Notes 2 1FE 250,000 100.4450 251,113 250,000 250,000 0 0 0 0 2.419 2.419 MN 739 6,048 11/09/2015 11/17/2020
16876A-AB-0 Children's Hospital Med Center Senior Notes 2 1FE 300,000 101.6420 304,926 300,000 300,000 0 0 0 0 2.853 2.853 MN 1,094 8,559 11/02/2016 11/15/2026
17275R-AX-0 Cisco Systems Inc. Senior Notes 1 1FE 249,663 100.2960 250,740 250,000 249,968 0 70 0 0 2.450 2.479 JD 272 6,125 06/10/2015 06/15/2020
172967-LQ-2 Citigroup Inc. Senior Notes 2 1FE 149,499 101.6650 152,498 150,000 149,709 0 98 0 0 2.700 2.772 AO 720 4,050 10/23/2017 10/27/2022
22822V-AG-6 Crown Castle Int'l Corp. Senior Notes 2 2FE 149,582 103.4460 155,169 150,000 149,716 0 55 0 0 3.200 3.244 MS 1,600 4,800 07/25/2017 09/01/2024
E10.1
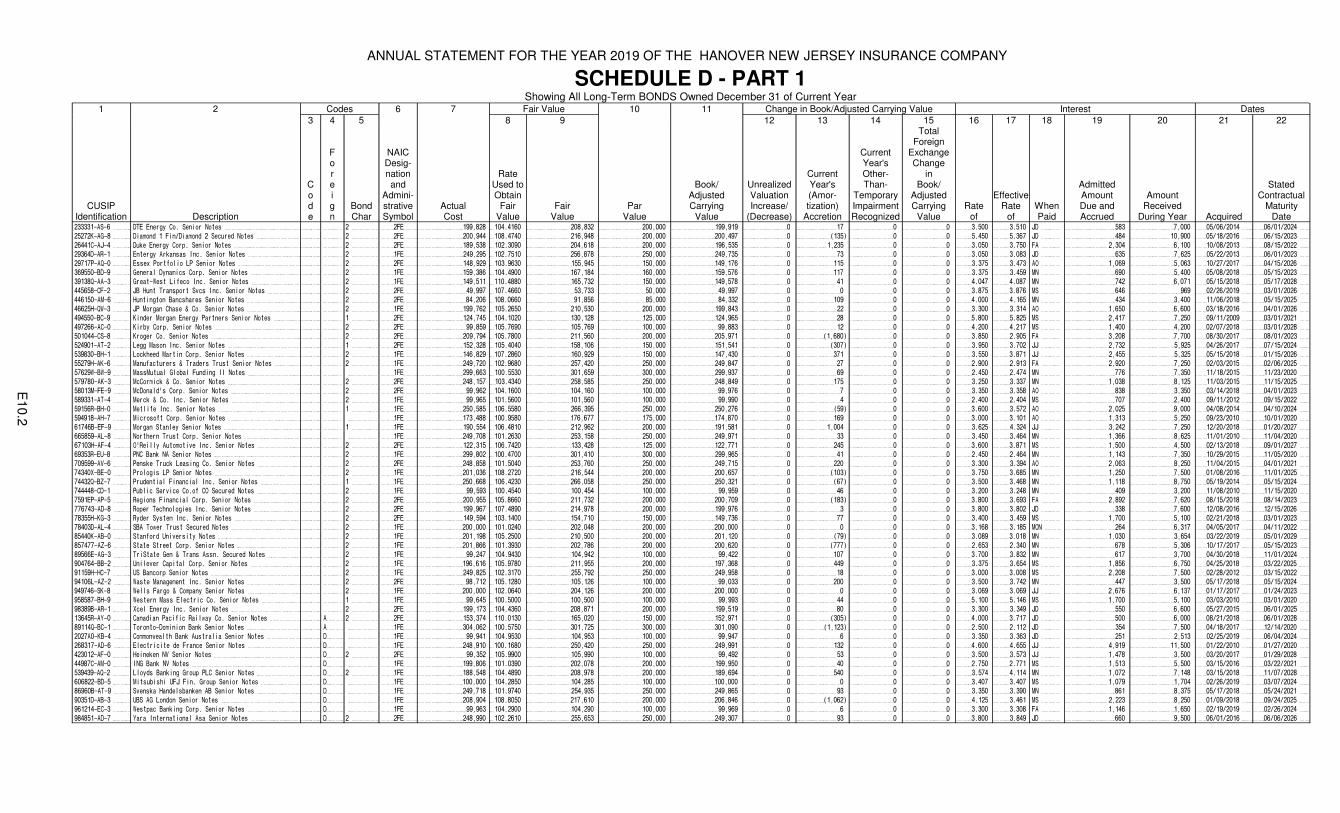
ANNUAL STATEMENT FOR THE YEAR 2019 OF THE HANOVER NEW JERSEY INSURANCE COMPANY
SCHEDULE D - PART 1Showing All Long-Term BONDS Owned December 31 of Current Year
1 2 Codes 6 7 Fair Value 10 11 Change in Book/Adjusted Carrying Value Interest Dates3 4 5 8 9 12 13 14 15 16 17 18 19 20 21 22
CUSIP Identification Description
Code
Foreign
BondChar
NAICDesig-nation and
Admini-strative Symbol
ActualCost
Rate Used to Obtain
Fair Value
FairValue
ParValue
Book/AdjustedCarrying
Value
UnrealizedValuationIncrease/
(Decrease)
CurrentYear's(Amor-tization)
Accretion
CurrentYear'sOther-Than-
TemporaryImpairmentRecognized
TotalForeign
ExchangeChange
inBook/
AdjustedCarrying
ValueRate
of
EffectiveRate
ofWhenPaid
AdmittedAmountDue andAccrued
Amount Received
During Year Acquired
StatedContractual
MaturityDate
233331-AS-6 DTE Energy Co. Senior Notes 2 2FE 199,828 104.4160 208,832 200,000 199,919 0 17 0 0 3.500 3.510 JD 583 7,000 05/06/2014 06/01/2024
25272K-AG-8 Diamond 1 Fin/Diamond 2 Secured Notes 2 2FE 200,944 108.4740 216,948 200,000 200,497 0 (135) 0 0 5.450 5.367 JD 484 10,900 05/18/2016 06/15/2023
26441C-AJ-4 Duke Energy Corp. Senior Notes 2 2FE 189,538 102.3090 204,618 200,000 196,535 0 1,235 0 0 3.050 3.750 FA 2,304 6,100 10/08/2013 08/15/2022
29364D-AR-1 Entergy Arkansas Inc. Senior Notes 2 1FE 249,295 102.7510 256,878 250,000 249,735 0 73 0 0 3.050 3.083 JD 635 7,625 05/22/2013 06/01/2023
29717P-AQ-0 Essex Portfolio LP Senior Notes 2 2FE 148,929 103.9630 155,945 150,000 149,176 0 115 0 0 3.375 3.473 AO 1,069 5,063 10/27/2017 04/15/2026
369550-BD-9 General Dynamics Corp. Senior Notes 2 1FE 159,386 104.4900 167,184 160,000 159,576 0 117 0 0 3.375 3.459 MN 690 5,400 05/08/2018 05/15/2023
39138Q-AA-3 Great-West Lifeco Inc. Senior Notes 2 1FE 149,511 110.4880 165,732 150,000 149,578 0 41 0 0 4.047 4.087 MN 742 6,071 05/15/2018 05/17/2028
445658-CF-2 JB Hunt Transport Svcs Inc. Senior Notes 2 2FE 49,997 107.4660 53,733 50,000 49,997 0 0 0 0 3.875 3.876 MS 646 969 02/26/2019 03/01/2026
446150-AM-6 Huntington Bancshares Senior Notes 2 2FE 84,206 108.0660 91,856 85,000 84,332 0 109 0 0 4.000 4.165 MN 434 3,400 11/06/2018 05/15/2025
46625H-QW-3 JP Morgan Chase & Co. Senior Notes 2 1FE 199,762 105.2650 210,530 200,000 199,843 0 22 0 0 3.300 3.314 AO 1,650 6,600 03/18/2016 04/01/2026
494550-BC-9 Kinder Morgan Energy Partners Senior Notes 1 2FE 124,745 104.1020 130,128 125,000 124,965 0 28 0 0 5.800 5.825 MS 2,417 7,250 09/11/2009 03/01/2021
497266-AC-0 Kirby Corp. Senior Notes 2 2FE 99,859 105.7690 105,769 100,000 99,883 0 12 0 0 4.200 4.217 MS 1,400 4,200 02/07/2018 03/01/2028
501044-CS-8 Kroger Co. Senior Notes 2 2FE 209,794 105.7800 211,560 200,000 205,971 0 (1,680) 0 0 3.850 2.905 FA 3,208 7,700 08/30/2017 08/01/2023
524901-AT-2 Legg Mason Inc. Senior Notes 1 2FE 152,328 105.4040 158,106 150,000 151,541 0 (307) 0 0 3.950 3.702 JJ 2,732 5,925 04/26/2017 07/15/2024
539830-BH-1 Lockheed Martin Corp. Senior Notes 2 1FE 146,829 107.2860 160,929 150,000 147,430 0 371 0 0 3.550 3.871 JJ 2,455 5,325 05/15/2018 01/15/2026
55279H-AK-6 Manufacturers & Traders Trust Senior Notes 2 1FE 249,720 102.9680 257,420 250,000 249,847 0 27 0 0 2.900 2.913 FA 2,920 7,250 02/03/2015 02/06/2025
57629W-BW-9 MassMutual Global Funding II Notes 1FE 299,663 100.5530 301,659 300,000 299,937 0 69 0 0 2.450 2.474 MN 776 7,350 11/18/2015 11/23/2020
579780-AK-3 McCormick & Co. Senior Notes 2 2FE 248,157 103.4340 258,585 250,000 248,849 0 175 0 0 3.250 3.337 MN 1,038 8,125 11/03/2015 11/15/2025
58013M-FE-9 McDonald's Corp. Senior Notes 2 2FE 99,962 104.1600 104,160 100,000 99,976 0 7 0 0 3.350 3.358 AO 838 3,350 03/14/2018 04/01/2023
589331-AT-4 Merck & Co. Inc. Senior Notes 2 1FE 99,965 101.5600 101,560 100,000 99,990 0 4 0 0 2.400 2.404 MS 707 2,400 09/11/2012 09/15/2022
59156R-BH-0 Metlife Inc. Senior Notes 1 1FE 250,585 106.5580 266,395 250,000 250,276 0 (59) 0 0 3.600 3.572 AO 2,025 9,000 04/08/2014 04/10/2024
594918-AH-7 Microsoft Corp. Senior Notes 1FE 173,488 100.9580 176,677 175,000 174,870 0 169 0 0 3.000 3.101 AO 1,313 5,250 09/23/2010 10/01/2020
61746B-EF-9 Morgan Stanley Senior Notes 1 1FE 190,554 106.4810 212,962 200,000 191,581 0 1,004 0 0 3.625 4.324 JJ 3,242 7,250 12/20/2018 01/20/2027
665859-AL-8 Northern Trust Corp. Senior Notes 1FE 249,708 101.2630 253,158 250,000 249,971 0 33 0 0 3.450 3.464 MN 1,366 8,625 11/01/2010 11/04/2020
67103H-AF-4 O'Reilly Automotive Inc. Senior Notes 2 2FE 122,315 106.7420 133,428 125,000 122,771 0 245 0 0 3.600 3.871 MS 1,500 4,500 02/13/2018 09/01/2027
69353R-EU-8 PNC Bank NA Senior Notes 2 1FE 299,802 100.4700 301,410 300,000 299,965 0 41 0 0 2.450 2.464 MN 1,143 7,350 10/29/2015 11/05/2020
709599-AV-6 Penske Truck Leasing Co. Senior Notes 2 2FE 248,858 101.5040 253,760 250,000 249,715 0 220 0 0 3.300 3.394 AO 2,063 8,250 11/04/2015 04/01/2021
74340X-BE-0 Prologis LP Senior Notes 2 1FE 201,036 108.2720 216,544 200,000 200,657 0 (103) 0 0 3.750 3.685 MN 1,250 7,500 01/08/2016 11/01/2025
74432Q-BZ-7 Prudential Financial Inc. Senior Notes 1 1FE 250,668 106.4230 266,058 250,000 250,321 0 (67) 0 0 3.500 3.468 MN 1,118 8,750 05/19/2014 05/15/2024
744448-CD-1 Public Service Co.of CO Secured Notes 2 1FE 99,593 100.4540 100,454 100,000 99,959 0 46 0 0 3.200 3.248 MN 409 3,200 11/08/2010 11/15/2020
7591EP-AP-5 Regions Financial Corp. Senior Notes 2 2FE 200,955 105.8660 211,732 200,000 200,709 0 (183) 0 0 3.800 3.693 FA 2,892 7,620 08/15/2018 08/14/2023
776743-AD-8 Roper Technologies Inc. Senior Notes 2 2FE 199,967 107.4890 214,978 200,000 199,976 0 3 0 0 3.800 3.802 JD 338 7,600 12/08/2016 12/15/2026
78355H-KG-3 Ryder System Inc. Senior Notes 2 2FE 149,594 103.1400 154,710 150,000 149,736 0 77 0 0 3.400 3.459 MS 1,700 5,100 02/21/2018 03/01/2023
78403D-AL-4 SBA Tower Trust Secured Notes 2 1FE 200,000 101.0240 202,048 200,000 200,000 0 0 0 0 3.168 3.185 MON 264 6,317 04/05/2017 04/11/2022
85440K-AB-0 Stanford University Notes 2 1FE 201,198 105.2500 210,500 200,000 201,120 0 (79) 0 0 3.089 3.018 MN 1,030 3,654 03/22/2019 05/01/2029
857477-AZ-6 State Street Corp. Senior Notes 2 1FE 201,866 101.3930 202,786 200,000 200,620 0 (777) 0 0 2.653 2.340 MN 678 5,306 10/17/2017 05/15/2023
89566E-AG-3 TriState Gen & Trans Assn. Secured Notes 2 1FE 99,247 104.9430 104,942 100,000 99,422 0 107 0 0 3.700 3.832 MN 617 3,700 04/30/2018 11/01/2024
904764-BB-2 Unilever Capital Corp. Senior Notes 2 1FE 196,616 105.9780 211,955 200,000 197,368 0 449 0 0 3.375 3.654 MS 1,856 6,750 04/25/2018 03/22/2025
91159H-HC-7 US Bancorp Senior Notes 2 1FE 249,825 102.3170 255,792 250,000 249,958 0 18 0 0 3.000 3.008 MS 2,208 7,500 02/28/2012 03/15/2022
94106L-AZ-2 Waste Management Inc. Senior Notes 2 2FE 98,712 105.1280 105,126 100,000 99,033 0 200 0 0 3.500 3.742 MN 447 3,500 05/17/2018 05/15/2024
949746-SK-8 Wells Fargo & Company Senior Notes 2 1FE 200,000 102.0640 204,126 200,000 200,000 0 0 0 0 3.069 3.069 JJ 2,676 6,137 01/17/2017 01/24/2023
958587-BH-9 Western Mass Electric Co. Senior Notes 1 1FE 99,645 100.5000 100,500 100,000 99,993 0 44 0 0 5.100 5.146 MS 1,700 5,100 03/03/2010 03/01/2020
98389B-AR-1 Xcel Energy Inc. Senior Notes 2 2FE 199,173 104.4360 208,871 200,000 199,519 0 80 0 0 3.300 3.349 JD 550 6,600 05/27/2015 06/01/2025
13645R-AY-0 Canadian Pacific Railway Co. Senior Notes A 2 2FE 153,374 110.0130 165,020 150,000 152,971 0 (305) 0 0 4.000 3.717 JD 500 6,000 08/21/2018 06/01/2028
89114Q-BC-1 Toronto-Dominion Bank Senior Notes A 1FE 304,062 100.5750 301,725 300,000 301,090 0 (1,123) 0 0 2.500 2.112 JD 354 7,500 04/18/2017 12/14/2020
2027A0-KB-4 Commonwealth Bank Australia Senior Notes D 1FE 99,941 104.9530 104,953 100,000 99,947 0 6 0 0 3.350 3.363 JD 251 2,513 02/25/2019 06/04/2024
268317-AD-6 Electricite de France Senior Notes D 1FE 248,910 100.1680 250,420 250,000 249,991 0 132 0 0 4.600 4.655 JJ 4,919 11,500 01/22/2010 01/27/2020
423012-AF-0 Heineken NV Senior Notes D 2 2FE 99,352 105.9900 105,990 100,000 99,492 0 53 0 0 3.500 3.573 JJ 1,478 3,500 03/20/2017 01/29/2028
44987C-AM-0 ING Bank NV Notes D 1FE 199,806 101.0390 202,078 200,000 199,950 0 40 0 0 2.750 2.771 MS 1,513 5,500 03/15/2016 03/22/2021
539439-AQ-2 Lloyds Banking Group PLC Senior Notes D 2 1FE 188,548 104.4890 208,978 200,000 189,694 0 540 0 0 3.574 4.114 MN 1,072 7,148 03/15/2018 11/07/2028
606822-BD-5 Mitsubishi UFJ Fin. Group Senior Notes D 1FE 100,000 104.2850 104,285 100,000 100,000 0 0 0 0 3.407 3.407 MS 1,079 1,704 02/26/2019 03/07/2024
86960B-AT-9 Svenska Handelsbanken AB Senior Notes D 1FE 249,718 101.9740 254,935 250,000 249,865 0 93 0 0 3.350 3.390 MN 861 8,375 05/17/2018 05/24/2021
90351D-AB-3 UBS AG London Senior Notes D 1FE 208,904 108.8050 217,610 200,000 206,846 0 (1,062) 0 0 4.125 3.461 MS 2,223 8,250 01/09/2018 09/24/2025
961214-EC-3 Westpac Banking Corp. Senior Notes D 1FE 99,963 104.2900 104,290 100,000 99,969 0 6 0 0 3.300 3.308 FA 1,146 1,650 02/19/2019 02/26/2024
984851-AD-7 Yara International Asa Senior Notes D 2 2FE 248,990 102.2610 255,653 250,000 249,307 0 93 0 0 3.800 3.849 JD 660 9,500 06/01/2016 06/06/2026
E10.2

ANNUAL STATEMENT FOR THE YEAR 2019 OF THE HANOVER NEW JERSEY INSURANCE COMPANY
SCHEDULE D - PART 1Showing All Long-Term BONDS Owned December 31 of Current Year
1 2 Codes 6 7 Fair Value 10 11 Change in Book/Adjusted Carrying Value Interest Dates3 4 5 8 9 12 13 14 15 16 17 18 19 20 21 22
CUSIP Identification Description
Code
Foreign
BondChar
NAICDesig-nation and
Admini-strative Symbol
ActualCost
Rate Used to Obtain
Fair Value
FairValue
ParValue
Book/AdjustedCarrying
Value
UnrealizedValuationIncrease/
(Decrease)
CurrentYear's(Amor-tization)
Accretion
CurrentYear'sOther-Than-
TemporaryImpairmentRecognized
TotalForeign
ExchangeChange
inBook/
AdjustedCarrying
ValueRate
of
EffectiveRate
ofWhenPaid
AdmittedAmountDue andAccrued
Amount Received
During Year Acquired
StatedContractual
MaturityDate
3299999. Subtotal - Bonds - Industrial and Miscellaneous (Unaffiliated) - Issuer Obligations 13,987,238 XXX 14,607,170 13,999,000 13,992,945 0 308 0 0 XXX XXX XXX 99,840 468,231 XXX XXX
12592M-BF-6 Comm. Mtg Trust COMM2014LC17A2 4 1FM 15,540 99.9350 15,078 15,088 15,175 0 61 0 0 3.164 2.505 MON 40 476 09/18/2014 10/10/2047
36252S-AU-1 GS Mtg Sec. Trust GSMS2019GC38A3 4 1FM 252,488 108.4330 271,083 250,000 252,286 0 (201) 0 0 3.703 3.597 MON 771 7,715 02/13/2019 02/10/2052
92930R-BB-7 WFRBS Comm. Mtg Trust WFRBS2012C9A3 4 1FM 177,147 101.5590 177,270 174,549 175,913 0 (392) 0 0 2.870 2.542 MON 417 5,356 03/29/2017 11/15/2045
3499999. Subtotal - Bonds - Industrial and Miscellaneous (Unaffiliated) - Commercial Mortgage-Backed Securities 445,175 XXX 463,431 439,637 443,374 0 (532) 0 0 XXX XXX XXX 1,228 13,547 XXX XXX
02582J-HU-7 American Express Cr. Acct. AMXCA20182A 4 1FE 99,954 103.3260 103,326 100,000 99,970 0 9 0 0 3.010 3.039 MON 134 3,010 03/15/2018 10/15/2025
126802-CL-9 Cabela's Master Credit Card CABMT20131AA 4 1FE 199,297 101.6720 203,344 200,000 199,553 0 135 0 0 2.710 2.801 MON 241 5,420 01/24/2018 02/17/2026
3599999. Subtotal - Bonds - Industrial and Miscellaneous (Unaffiliated) - Other Loan-Backed and Structured Securities 299,251 XXX 306,670 300,000 299,523 0 144 0 0 XXX XXX XXX 375 8,430 XXX XXX
3899999. Total - Industrial and Miscellaneous (Unaffiliated) Bonds 14,731,664 XXX 15,377,271 14,738,637 14,735,842 0 (80) 0 0 XXX XXX XXX 101,443 490,208 XXX XXX4899999. Total - Hybrid Securities 0 XXX 0 0 0 0 0 0 0 XXX XXX XXX 0 0 XXX XXX5599999. Total - Parent, Subsidiaries and Affiliates Bonds 0 XXX 0 0 0 0 0 0 0 XXX XXX XXX 0 0 XXX XXX6099999. Subtotal - SVO Identified Funds 0 XXX 0 0 0 0 0 0 0 XXX XXX XXX 0 0 XXX XXX6599999. Subtotal - Unaffiliated Bank Loans 0 XXX 0 0 0 0 0 0 0 XXX XXX XXX 0 0 XXX XXX7699999. Total - Issuer Obligations 23,436,070 XXX 24,286,771 23,459,000 23,438,529 0 3,162 0 0 XXX XXX XXX 186,739 723,851 XXX XXX7799999. Total - Residential Mortgage-Backed Securities 2,864,086 XXX 2,915,534 2,837,762 2,854,504 0 (2,898) 0 0 XXX XXX XXX 7,926 95,109 XXX XXX7899999. Total - Commercial Mortgage-Backed Securities 445,175 XXX 463,431 439,637 443,374 0 (532) 0 0 XXX XXX XXX 1,228 13,547 XXX XXX7999999. Total - Other Loan-Backed and Structured Securities 299,251 XXX 306,670 300,000 299,523 0 144 0 0 XXX XXX XXX 375 8,430 XXX XXX8099999. Total - SVO Identified Funds 0 XXX 0 0 0 0 0 0 0 XXX XXX XXX 0 0 XXX XXX8199999. Total - Affiliated Bank Loans 0 XXX 0 0 0 0 0 0 0 XXX XXX XXX 0 0 XXX XXX8299999. Total - Unaffiliated Bank Loans 0 XXX 0 0 0 0 0 0 0 XXX XXX XXX 0 0 XXX XXX8399999 - Total Bonds 27,044,582 XXX 27,972,406 27,036,399 27,035,930 0 (124) 0 0 XXX XXX XXX 196,268 840,937 XXX XXX
E10.3

ANNUAL STATEMENT FOR THE YEAR 2019 OF THE HANOVER NEW JERSEY INSURANCE COMPANY
Schedule D - Part 2 - Section 1 - Preferred Stocks Owned
N O N E
Schedule D - Part 2 - Section 2 - Common Stocks Owned
N O N E
E11, E12

ANNUAL STATEMENT FOR THE YEAR 2019 OF THE HANOVER NEW JERSEY INSURANCE COMPANY
SCHEDULE D - PART 3Showing All Long-Term Bonds and Stocks ACQUIRED During Current Year
1
CUSIP Identification
2
Description
3
Foreign
4
DateAcquired
5
Name of Vendor
6
Number of Sharesof Stock
7
Actual Cost
8
Par Value
9Paid for Accrued
Interest andDividends
76222R-YC-0 Rhode Island State Taxable - G.O. 3.000% 05/01/24 04/17/2019 Robert W. Baird 101,770 100,000 0
76222R-YD-8 Rhode Island State Taxable - G.O. 3.000% 05/01/25 04/17/2019 Robert W. Baird 203,860 200,000 0
1799999. Subtotal - Bonds - U.S. States, Territories and Possessions 305,630 300,000 0
212204-JP-7 Contra Costa CA Cmnty Clg Dis. Taxable - G.O. 2.563% 08/01/33 08/29/2019 Morgan Stanley 250,000 250,000 0
678519-C3-1 Oklahoma City OK Taxable - G.O. 3.030% 03/01/27 04/17/2019 JP Morgan 45,000 45,000 0
678519-C4-9 Oklahoma City OK Taxable - G.O. 3.120% 03/01/28 04/17/2019 JP Morgan 130,000 130,000 0
2499999. Subtotal - Bonds - U.S. Political Subdivisions of States, Territories and Possessions 425,000 425,000 0
052414-TD-1 Austin TX Electric Utility Taxable - Revenue Bonds 2.685% 11/15/30 07/31/2019 Goldman Sachs 250,000 250,000 0
186352-SM-3 Cleveland OH Airport System Taxable - Revenue Bonds 2.792% 01/01/29 09/18/2019 Raymond James Morgan Keegan 250,000 250,000 0
20775C-W2-6 Connecticut Housing Fin. Auth. Taxable - Revenue Bonds 2.900% 05/15/24 04/24/2019 JP Morgan 130,000 130,000 0
20775C-W5-9 Connecticut Housing Fin. Auth. Taxable - Revenue Bonds 3.550% 05/15/30 04/24/2019 JP Morgan 165,000 165,000 0
47770V-AY-6 Jobs OH Beverage Sys. Taxable - Revenue Bonds 3.985% 01/01/29 04/03/2019 Citigroup 211,096 200,000 2,080
68607V-Z6-5 Oregon State Lottery Taxable - Revenue Bonds 2.455% 04/01/23 03/28/2019 Goldman Sachs 50,000 50,000 0
68607V-Z9-9 Oregon State Lottery Taxable - Revenue Bonds 2.715% 04/01/26 03/28/2019 Goldman Sachs 20,000 20,000 0
80168A-BY-2 Santa Clara Valley CA Water Taxable - Revenue Bonds 2.649% 06/01/24 04/10/2019 Stifel Nicolaus & Co 25,000 25,000 0
80168A-BZ-9 Santa Clara Valley CA Water Taxable - Revenue Bonds 2.782% 06/01/25 04/10/2019 Stifel Nicolaus & Co 50,000 50,000 0
80168A-CA-3 Santa Clara Valley CA Water Taxable - Revenue Bonds 2.852% 06/01/26 04/10/2019 Stifel Nicolaus & Co 50,000 50,000 0
80168A-CB-1 Santa Clara Valley CA Water Taxable - Revenue Bonds 2.994% 06/01/27 04/10/2019 Stifel Nicolaus & Co 25,000 25,000 0
80168A-CC-9 Santa Clara Valley CA Water Taxable - Revenue Bonds 3.114% 06/01/28 04/10/2019 Stifel Nicolaus & Co 150,000 150,000 0
3199999. Subtotal - Bonds - U.S. Special Revenues 1,376,096 1,365,000 2,080
114259-AT-1 Brooklyn Union Gas Senior Notes 3.865% 03/04/29 02/27/2019 Bank of America 100,000 100,000 0
36252S-AU-1 GS Mtg Sec. Trust GSMS2019GC38A3 3.703% 02/10/52 02/13/2019 Goldman Sachs 252,488 250,000 669
445658-CF-2 JB Hunt Transport Svcs Inc. Senior Notes 3.875% 03/01/26 02/26/2019 SunTrust Capital Markets 49,997 50,000 0
85440K-AB-0 Stanford University Notes 3.089% 05/01/29 03/22/2019 JP Morgan 201,198 200,000 0
2027A0-KB-4 Commonwealth Bank Australia Senior Notes 3.350% 06/04/24 D 02/25/2019 Goldman Sachs 99,941 100,000 0
606822-BD-5 Mitsubishi UFJ Fin. Group Senior Notes 3.407% 03/07/24 D 02/26/2019 Morgan Stanley 100,000 100,000 0
961214-EC-3 Westpac Banking Corp. Senior Notes 3.300% 02/26/24 D 02/19/2019 Citigroup 99,962 100,000 0
3899999. Subtotal - Bonds - Industrial and Miscellaneous (Unaffiliated) 903,586 900,000 669
8399997. Total - Bonds - Part 3 3,010,312 2,990,000 2,749
8399998. Total - Bonds - Part 5 249,597 250,000 62
8399999. Total - Bonds 3,259,909 3,240,000 2,811
8999997. Total - Preferred Stocks - Part 3 0 XXX 0
8999998. Total - Preferred Stocks - Part 5 0 XXX 0
8999999. Total - Preferred Stocks 0 XXX 0
9799997. Total - Common Stocks - Part 3 0 XXX 0
9799998. Total - Common Stocks - Part 5 0 XXX 0
9799999. Total - Common Stocks 0 XXX 0
9899999. Total - Preferred and Common Stocks 0 XXX 0
9999999 - Totals 3,259,909 XXX 2,811
E13

ANNUAL STATEMENT FOR THE YEAR 2019 OF THE HANOVER NEW JERSEY INSURANCE COMPANY
SCHEDULE D - PART 4Showing All Long-Term Bonds and Stocks SOLD, REDEEMED or Otherwise DISPOSED OF During Current Year
1 2 3 4 5 6 7 8 9 10 Change In Book/Adjusted Carrying Value 16 17 18 19 20 21
CUSIPIdenti-fication Description
For-eign
DisposalDate
Nameof Purchaser
Number of Shares of
StockCon-
sideration Par Value Actual Cost
Prior YearBook/
Adjusted Carrying
Value
11
Unrealized Valuation Increase/Decrease
12
Current Year's (Amor-
tization)/Accretion
13
Current Year'sOther-Than-
Temporary Impairment Recognized
14
TotalChange in
Book/Adjusted Carrying
Value(11+12-13)
15Total
Foreign Exchange Change in
Book/ Adjusted Carrying
Value
Book/Adjusted Carrying Value at Disposal
Date
Foreign Exchange
Gain(Loss) on Disposal
Realized Gain (Loss) on Disposal
Total Gain (Loss) on Disposal
BondInterest/ Stock
Dividends Received
DuringYear
StatedCon-
tractualMaturity
Date
68608K-NE-4
Oregon State Taxable - G.O. 5.742%
08/01/24 08/01/2019 Call 100.0000 40,000 40,000 46,604 43,866 0 (367) 0 (367) 0 43,499 0 (3,499) (3,499) 2,297 08/01/2024
924258-TU-0
Vermont State Taxable - G.O. 4.375%
08/15/24 09/16/2019 Call 100.0000 100,000 100,000 98,675 99,385 0 69 0 69 0 99,454 0 546 546 4,752 08/15/2024
1799999. Subtotal - Bonds - U.S. States, Territories and Possessions 140,000 140,000 145,279 143,251 0 (298) 0 (298) 0 142,953 0 (2,953) (2,953) 7,049 XXX
425506-Y6-3
Hennepin Cnty MN Taxable - G.O. 5.200%
12/01/27 12/02/2019 Call 100.0000 250,000 250,000 248,843 249,294 0 59 0 59 0 249,353 0 647 647 13,036 12/01/2027
438670-Q4-6
Honolulu HI City & Cnty Taxable - G.O.
1.838% 11/01/19 11/01/2019 Various 300,000 300,000 293,286 298,954 0 1,046 0 1,046 0 300,000 0 0 0 5,514 11/01/2019
61334R-AL-3
Montgomery Cnty MD Taxable - G.O. 5.125%
11/01/25 11/01/2019 Call 100.0000 250,000 250,000 251,445 250,149 0 (149) 0 (149) 0 250,000 0 0 0 12,813 11/01/2025
2499999. Subtotal - Bonds - U.S. Political Subdivisions of States, Territories and Possessions 800,000 800,000 793,574 798,397 0 956 0 956 0 799,353 0 647 647 31,363 XXX
196479-VN-6
Colorado State HFA Taxable - Revenue Bonds
2.800% 09/01/41 11/01/2019 Paydown 25,000 25,000 25,000 25,000 0 0 0 0 0 25,000 0 0 0 525 09/01/2041
29270C-YM-1
Energy Northwest WA Elec. Rev. Taxable -
Revenue Bonds 2.197% 07/01/19 07/01/2019 Maturity 190,000 190,000 189,535 189,953 0 47 0 47 0 190,000 0 0 0 4,174 07/01/2019
3128MJ-WV-8 Freddie Mac FGG08659 3.500% 08/01/45 12/01/2019 Paydown 57,493 57,493 57,142 57,138 0 354 0 354 0 57,493 0 0 0 1,256 08/01/2045
3128MM-YP-2 Freddie Mac FGG18717 4.000% 12/01/33 12/01/2019 Paydown 143,869 143,869 146,927 146,920 0 (3,050) 0 (3,050) 0 143,869 0 0 0 3,606 12/01/2033
31335A-BE-7 Freddie Mac FGG60037 3.000% 10/01/43 12/01/2019 Paydown 25,693 25,693 24,978 24,981 0 712 0 712 0 25,693 0 0 0 445 10/01/2043
31335B-M6-0 Freddie Mac FGG61281 3.500% 01/01/48 12/01/2019 Paydown 30,319 30,319 30,224 30,225 0 94 0 94 0 30,319 0 0 0 685 01/01/2048
3133EH-TZ-6 FFCB Notes 2.950% 08/09/27 08/14/2019 Call 100.0000 200,000 200,000 200,000 200,000 0 0 0 0 0 200,000 0 0 0 5,982 08/09/2027
3136A0-YB-7 Fannie Mae FNR201176NK 3.500% 07/25/40 03/01/2019 Paydown 364 364 372 363 0 0 0 0 0 364 0 0 0 2 07/25/2040
3136AA-EK-7 Fannie Mae FNR2012129TD 2.000% 05/25/40 12/01/2019 Paydown 11,731 11,731 11,835 11,863 0 (132) 0 (132) 0 11,731 0 0 0 143 05/25/2040
3137AH-2W-7 Freddie Mac FHR3936AB 3.000% 10/15/26 12/01/2019 Paydown 14,778 14,778 15,064 14,883 0 (105) 0 (105) 0 14,778 0 0 0 431 10/15/2026
3137FG-A5-4 Freddie Mac FHR4806AC 3.500% 06/15/42 12/01/2019 Paydown 74,632 74,632 75,037 75,006 0 (374) 0 (374) 0 74,632 0 0 0 1,816 06/15/2042
3138WE-6W-4 Fannie Mae FNAS5384 4.000% 07/01/45 12/01/2019 Paydown 58,771 58,771 61,884 62,274 0 (3,503) 0 (3,503) 0 58,771 0 0 0 1,463 07/01/2045
31394G-U9-2 Freddie Mac FHR2666BD 4.500% 08/15/23 12/01/2019 Paydown 16,188 16,188 16,572 16,302 0 (114) 0 (114) 0 16,188 0 0 0 389 08/15/2023
3140Q7-SL-2 Fannie Mae FNCA0522 3.000% 10/01/47 12/01/2019 Paydown 56,640 56,640 55,656 55,700 0 941 0 941 0 56,640 0 0 0 1,137 10/01/2047
480780-AH-8
Jordan Valley UT Water Cons. Taxable -
Revenue Bonds 6.330% 10/01/34 10/01/2019 Call 100.0000 125,000 125,000 125,000 125,000 0 0 0 0 0 125,000 0 0 0 7,913 10/01/2034
647200-V3-5
New Mexico Mtg Fin. Auth. Tax-Exempt -
Revenue Bonds 3.750% 03/01/43 12/01/2019 Call 100.0000 25,000 25,000 26,470 25,642 0 (90) 0 (90) 0 25,552 0 (552) (552) 891 03/01/2043
919114-AE-8
Valdosta-Lowndes Cnty GA Taxable - Revenue
Bonds 6.950% 02/01/19 02/01/2019 Maturity 35,000 35,000 35,000 35,000 0 0 0 0 0 35,000 0 0 0 1,217 02/01/2019
92813T-EE-6
Virginia State Hsg Dev. Auth. Taxable -
Revenue Bonds 3.250% 08/25/42 12/01/2019 Paydown 38,340 38,340 38,340 38,340 0 0 0 0 0 38,341 0 0 0 748 08/25/2042
3199999. Subtotal - Bonds - U.S. Special Revenues 1,128,818 1,128,818 1,135,036 1,134,590 0 (5,220) 0 (5,220) 0 1,129,371 0 (552) (552) 32,823 XXX
00912X-AL-8
Air Lease Corp. Senior Notes 3.375%
01/15/19 01/15/2019 Maturity 200,000 200,000 199,716 199,998 0 2 0 2 0 200,000 0 0 0 3,375 01/15/2019
035242-AL-0
Anheuser-Busch INBEV Senior Notes 3.300%
02/01/23 04/25/2019 Call 102.3160 21,486 21,000 20,920 20,951 0 4 0 4 0 20,955 0 45 45 995 02/01/2023
06742L-AE-3
Barclay Dryrock Issuance Trust DROCK20143A
2.410% 07/15/22 09/15/2019 Paydown 250,000 250,000 249,931 249,990 0 10 0 10 0 250,000 0 0 0 4,519 07/15/2022
12527G-AG-8
CF Industries Inc. Notes 3.400% 12/01/21
12/13/2019 Call 102.7780 51,389 50,000 49,564 49,735 0 83 0 83 0 49,818 0 182 182 3,146 12/01/2021
12592M-BF-6
Comm. Mtg Trust COMM2014LC17A2 3.164%
10/10/47 09/01/2019 Paydown 123,953 123,953 127,668 124,170 0 (217) 0 (217) 0 123,953 0 0 0 2,229 10/10/2047
202795-JC-5
Commonwealth Edison Notes 2.150% 01/15/19
01/15/2019 Maturity 150,000 150,000 149,667 149,997 0 3 0 3 0 150,000 0 0 0 1,613 01/15/2019
22546Q-AN-7
Credit Suisse NY Senior Notes 2.300%
05/28/19 05/28/2019 Maturity 300,000 300,000 299,382 299,947 0 53 0 53 0 300,000 0 0 0 3,450 05/28/2019
277432-AQ-3
Eastman Chemical Co. Senior Notes 2.700%
01/15/20 12/16/2019 Call 100.0000 32,000 32,000 31,883 31,972 0 26 0 26 0 31,998 0 2 2 1,226 01/15/2020
278265-AE-3
Eaton Vance Corp. Senior Notes 3.500%
04/06/27 06/19/2019 Hanover 153,903 150,000 153,197 152,746 0 (140) 0 (140) 0 152,606 0 1,297 1,297 3,690 04/06/2027
316773-CQ-1
Fifth Third Bancorp Senior Notes 2.300%
03/01/19 03/01/2019 Maturity 250,000 250,000 248,740 249,956 0 44 0 44 0 250,000 0 0 0 2,875 03/01/2019
E14
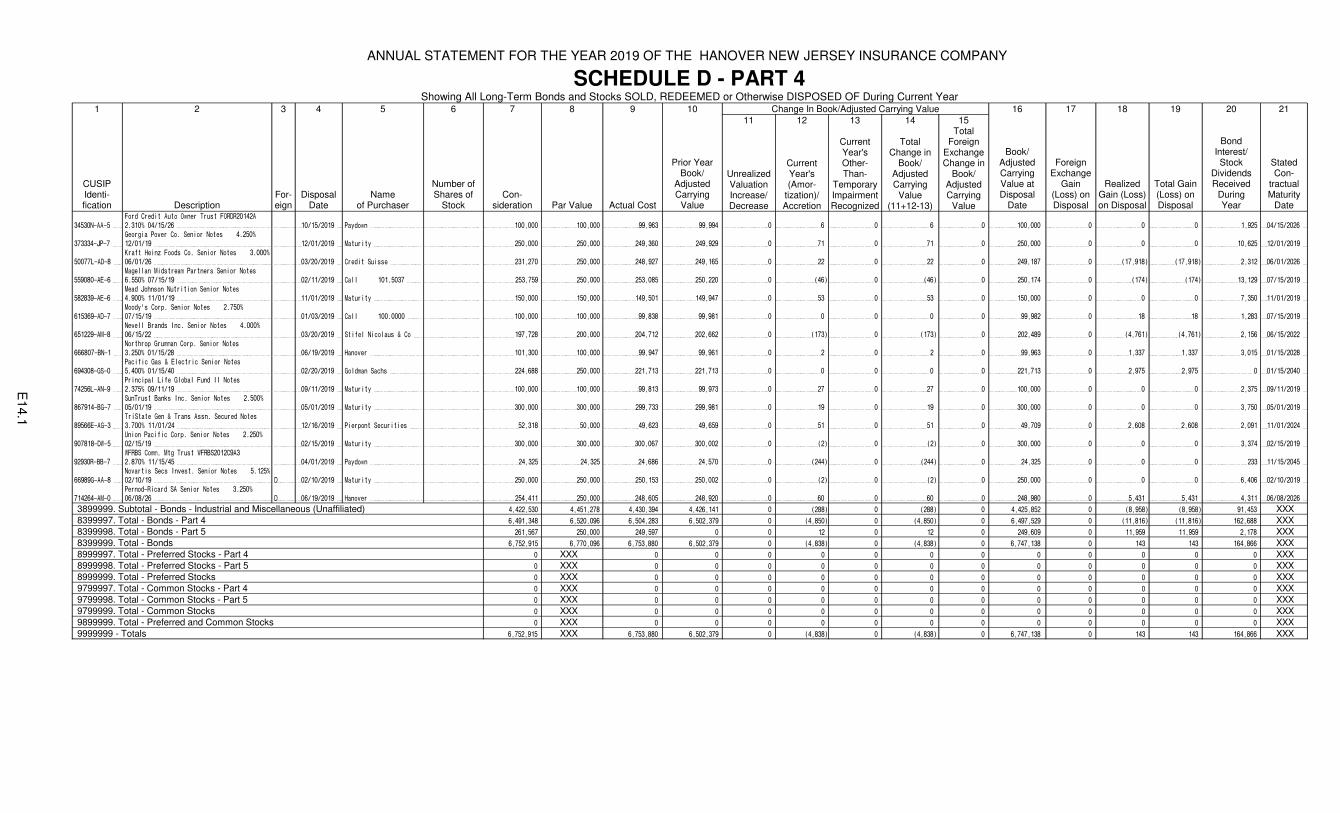
ANNUAL STATEMENT FOR THE YEAR 2019 OF THE HANOVER NEW JERSEY INSURANCE COMPANY
SCHEDULE D - PART 4Showing All Long-Term Bonds and Stocks SOLD, REDEEMED or Otherwise DISPOSED OF During Current Year
1 2 3 4 5 6 7 8 9 10 Change In Book/Adjusted Carrying Value 16 17 18 19 20 21
CUSIPIdenti-fication Description
For-eign
DisposalDate
Nameof Purchaser
Number of Shares of
StockCon-
sideration Par Value Actual Cost
Prior YearBook/
Adjusted Carrying
Value
11
Unrealized Valuation Increase/Decrease
12
Current Year's (Amor-
tization)/Accretion
13
Current Year'sOther-Than-
Temporary Impairment Recognized
14
TotalChange in
Book/Adjusted Carrying
Value(11+12-13)
15Total
Foreign Exchange Change in
Book/ Adjusted Carrying
Value
Book/Adjusted Carrying Value at Disposal
Date
Foreign Exchange
Gain(Loss) on Disposal
Realized Gain (Loss) on Disposal
Total Gain (Loss) on Disposal
BondInterest/ Stock
Dividends Received
DuringYear
StatedCon-
tractualMaturity
Date
34530N-AA-5
Ford Credit Auto Owner Trust FORDR20142A
2.310% 04/15/26 10/15/2019 Paydown 100,000 100,000 99,963 99,994 0 6 0 6 0 100,000 0 0 0 1,925 04/15/2026
373334-JP-7
Georgia Power Co. Senior Notes 4.250%
12/01/19 12/01/2019 Maturity 250,000 250,000 249,360 249,929 0 71 0 71 0 250,000 0 0 0 10,625 12/01/2019
50077L-AD-8
Kraft Heinz Foods Co. Senior Notes 3.000%
06/01/26 03/20/2019 Credit Suisse 231,270 250,000 248,927 249,165 0 22 0 22 0 249,187 0 (17,918) (17,918) 2,312 06/01/2026
559080-AE-6
Magellan Midstream Partners Senior Notes
6.550% 07/15/19 02/11/2019 Call 101.5037 253,759 250,000 253,085 250,220 0 (46) 0 (46) 0 250,174 0 (174) (174) 13,129 07/15/2019
582839-AE-6
Mead Johnson Nutrition Senior Notes
4.900% 11/01/19 11/01/2019 Maturity 150,000 150,000 149,501 149,947 0 53 0 53 0 150,000 0 0 0 7,350 11/01/2019
615369-AD-7
Moody's Corp. Senior Notes 2.750%
07/15/19 01/03/2019 Call 100.0000 100,000 100,000 99,838 99,981 0 0 0 0 0 99,982 0 18 18 1,283 07/15/2019
651229-AM-8
Newell Brands Inc. Senior Notes 4.000%
06/15/22 03/20/2019 Stifel Nicolaus & Co 197,728 200,000 204,712 202,662 0 (173) 0 (173) 0 202,489 0 (4,761) (4,761) 2,156 06/15/2022
666807-BN-1
Northrop Grumman Corp. Senior Notes
3.250% 01/15/28 06/19/2019 Hanover 101,300 100,000 99,947 99,961 0 2 0 2 0 99,963 0 1,337 1,337 3,015 01/15/2028
694308-GS-0
Pacific Gas & Electric Senior Notes
5.400% 01/15/40 02/20/2019 Goldman Sachs 224,688 250,000 221,713 221,713 0 0 0 0 0 221,713 0 2,975 2,975 0 01/15/2040
74256L-AN-9
Principal Life Global Fund II Notes
2.375% 09/11/19 09/11/2019 Maturity 100,000 100,000 99,813 99,973 0 27 0 27 0 100,000 0 0 0 2,375 09/11/2019
867914-BG-7
SunTrust Banks Inc. Senior Notes 2.500%
05/01/19 05/01/2019 Maturity 300,000 300,000 299,733 299,981 0 19 0 19 0 300,000 0 0 0 3,750 05/01/2019
89566E-AG-3
TriState Gen & Trans Assn. Secured Notes
3.700% 11/01/24 12/16/2019 Pierpont Securities 52,318 50,000 49,623 49,659 0 51 0 51 0 49,709 0 2,608 2,608 2,091 11/01/2024
907818-DW-5
Union Pacific Corp. Senior Notes 2.250%
02/15/19 02/15/2019 Maturity 300,000 300,000 300,067 300,002 0 (2) 0 (2) 0 300,000 0 0 0 3,374 02/15/2019
92930R-BB-7
WFRBS Comm. Mtg Trust WFRBS2012C9A3
2.870% 11/15/45 04/01/2019 Paydown 24,325 24,325 24,686 24,570 0 (244) 0 (244) 0 24,325 0 0 0 233 11/15/2045
66989G-AA-8
Novartis Secs Invest. Senior Notes 5.125%
02/10/19 D 02/10/2019 Maturity 250,000 250,000 250,153 250,002 0 (2) 0 (2) 0 250,000 0 0 0 6,406 02/10/2019
714264-AM-0
Pernod-Ricard SA Senior Notes 3.250%
06/08/26 D 06/19/2019 Hanover 254,411 250,000 248,605 248,920 0 60 0 60 0 248,980 0 5,431 5,431 4,311 06/08/2026
3899999. Subtotal - Bonds - Industrial and Miscellaneous (Unaffiliated) 4,422,530 4,451,278 4,430,394 4,426,141 0 (288) 0 (288) 0 4,425,852 0 (8,958) (8,958) 91,453 XXX8399997. Total - Bonds - Part 4 6,491,348 6,520,096 6,504,283 6,502,379 0 (4,850) 0 (4,850) 0 6,497,529 0 (11,816) (11,816) 162,688 XXX8399998. Total - Bonds - Part 5 261,567 250,000 249,597 0 0 12 0 12 0 249,609 0 11,959 11,959 2,178 XXX8399999. Total - Bonds 6,752,915 6,770,096 6,753,880 6,502,379 0 (4,838) 0 (4,838) 0 6,747,138 0 143 143 164,866 XXX8999997. Total - Preferred Stocks - Part 4 0 XXX 0 0 0 0 0 0 0 0 0 0 0 0 XXX8999998. Total - Preferred Stocks - Part 5 0 XXX 0 0 0 0 0 0 0 0 0 0 0 0 XXX8999999. Total - Preferred Stocks 0 XXX 0 0 0 0 0 0 0 0 0 0 0 0 XXX9799997. Total - Common Stocks - Part 4 0 XXX 0 0 0 0 0 0 0 0 0 0 0 0 XXX9799998. Total - Common Stocks - Part 5 0 XXX 0 0 0 0 0 0 0 0 0 0 0 0 XXX9799999. Total - Common Stocks 0 XXX 0 0 0 0 0 0 0 0 0 0 0 0 XXX9899999. Total - Preferred and Common Stocks 0 XXX 0 0 0 0 0 0 0 0 0 0 0 0 XXX9999999 - Totals 6,752,915 XXX 6,753,880 6,502,379 0 (4,838) 0 (4,838) 0 6,747,138 0 143 143 164,866 XXX
E14.1

ANNUAL STATEMENT FOR THE YEAR 2019 OF THE HANOVER NEW JERSEY INSURANCE COMPANY
SCHEDULE D - PART 5Showing All Long-Term Bonds and Stocks ACQUIRED During Year and Fully DISPOSED OF During Current Year
1 2 3 4 5 6 7 8 9 10 11 Change in Book/Adjusted Carrying Value 17 18 19 20 21
CUSIP Identi-fication Description
For-eign
Date Acquired Name of Vendor
DisposalDate
Name ofPurchaser
Par Value (Bonds)
orNumber of
Shares(Stock) Actual Cost
Consid-eration
Book/Adjusted CarryingValue at Disposal
12
Unrealized Valuation Increase/
(Decrease)
13
Current Year's (Amort-ization)/
Accretion
14
Current Year'sOther-Than-
Temporary Impairment Recognized
15
Total Change in
Book/Adjusted Carrying
Valu (12 + 13 - 14)
16Total
Foreign Exchange Change in
Book/Adjusted Carrying
Value
Foreign Exchange
Gain(Loss) onDisposal
Realized Gain
(Loss) on Disposal
Total Gain (Loss) on Disposal
Interestand
Dividends Received
DuringYear
Paid for Accrued Interest
and Dividends
74460D-AD-1
Public Storage Senior Notes 3.385%
05/01/29 04/10/2019 WFS 06/19/2019 Hanover 150,000 149,997 155,246 149,998 0 1 0 1 0 0 5,249 5,249 945 0
907818-FB-9
Union Pacific Corp. Senior Notes
3.700% 03/01/29 02/21/2019 Jefferies 06/19/2019 Hanover 100,000 99,600 106,321 99,611 0 11 0 11 0 0 6,710 6,710 1,233 62
3899999. Subtotal - Bonds - Industrial and Miscellaneous (Unaffiliated) 250,000 249,597 261,567 249,609 0 12 0 12 0 0 11,959 11,959 2,178 62
8399998. Total - Bonds 250,000 249,597 261,567 249,609 0 12 0 12 0 0 11,959 11,959 2,178 62
8999998. Total - Preferred Stocks 0 0 0 0 0 0 0 0 0 0 0 0 0
9799998. Total - Common Stocks 0 0 0 0 0 0 0 0 0 0 0 0 0
9899999. Total - Preferred and Common Stocks 0 0 0 0 0 0 0 0 0 0 0 0 0
9999999 - Totals 249,597 261,567 249,609 0 12 0 12 0 0 11,959 11,959 2,178 62
E15

ANNUAL STATEMENT FOR THE YEAR 2019 OF THE HANOVER NEW JERSEY INSURANCE COMPANY
Schedule D-Part 6-Section 1-Valuation of Shares of Subsidiary, Controlled or Affiliated Companies
N O N E
Schedule D - Part 6 - Section 2
N O N E
Schedule DA - Part 1 - Short-Term Investments Owned
N O N E
Schedule DB - Part A - Section 1 - Options, Caps, Floors, Collars, Swaps and Forwards Open
N O N E
Schedule DB - Part A - Section 2 - Options, Caps, Floors, Collars, Swaps and Forwards Terminated
N O N E
Schedule DB - Part B - Section 1 - Futures Contracts Open
N O N E
Schedule DB - Part B - Section 1B - Brokers with whom cash deposits have been made
N O N E
Schedule DB - Part B - Section 2 - Futures Contracts Terminated
N O N E
Schedule DB - Part D - Section 1 - Counterparty Exposure for Derivative Instruments Open
N O N E
Schedule DB - Part D-Section 2 - Collateral for Derivative Instruments Open - Pledged By
N O N E
Schedule DB - Part D-Section 2 - Collateral for Derivative Instruments Open - Pledged To
N O N E
Schedule DB - Part E - Derivatives Hedging Variable Annuity Guarantees as of December 31 of Current Year
N O N E
Schedule DL - Part 1 - Reinvested Collateral Assets Owned
N O N E
Schedule DL - Part 2 - Reinvested Collateral Assets Owned
N O N E
E16, E17, E18, E19, E20, E21, E22, E23, E24, E25, E26

ANNUAL STATEMENT FOR THE YEAR 2019 OF THE HANOVER NEW JERSEY INSURANCE COMPANY
SCHEDULE E - PART 1 - CASH1
Depository
2
Code
3
Rate ofInterest
4Amount of Interest Received During
Year
5Amount of Interest
Accrued December 31 of Current Year
6
Balance
7
*Bank of New York Mellon New York, NY 0.000 0 0 35,004 XXX0199998 Deposits in ... 0 depositories which do not exceed the allowable limit in any one depository (See instructions) - open depositories XXX XXX 0 0 0 XXX0199999. Totals - Open Depositories XXX XXX 0 0 35,004 XXX0299998 Deposits in ... 0 depositories which do not exceed the allowable limit in any one depository (See instructions) - suspended depositories XXX XXX 0 0 0 XXX0299999. Totals - Suspended Depositories XXX XXX 0 0 0 XXX0399999. Total Cash on Deposit XXX XXX 0 0 35,004 XXX0499999. Cash in Company's Office XXX XXX XXX XXX 0 XXX
0599999 Total - Cash XXX XXX 0 0 35,004 XXX
TOTALS OF DEPOSITORY BALANCES ON THE LAST DAY OF EACH MONTH DURING THE CURRENT YEAR1. January 31,942 4. April 37,396 7. July 29,912 10. October 32,224
2. February 50,376 5. May 1,127,710 8. August 88,070 11. November 39,616
3. March 48,908 6. June 39,301 9. September 41,377 12. December 35,004
E27

ANNUAL STATEMENT FOR THE YEAR 2019 OF THE HANOVER NEW JERSEY INSURANCE COMPANY
SCHEDULE E - PART 2 - CASH EQUIVALENTSShow Investments Owned December 31 of Current Year
1
CUSIP
2
Description
3
Code
4
Date Acquired
5
Rate of Interest
6
Maturity Date
7Book/AdjustedCarrying Value
8Amount of InterestDue and Accrued
9Amount Received
During Year
0599999. Total - U.S. Government Bonds 0 0 0
1099999. Total - All Other Government Bonds 0 0 0
1799999. Total - U.S. States, Territories and Possessions Bonds 0 0 0
2499999. Total - U.S. Political Subdivisions Bonds 0 0 0
FHLB Discount Notes 12/23/2019 1.450 01/09/2020 1,099,645 0 399
FHLB Discount Notes 12/19/2019 1.480 01/09/2020 2,249,260 0 1,202
FHLB Discount Notes 12/18/2019 1.450 01/13/2020 399,807 0 225
2599999. Subtotal - Bonds - U.S. Special Revenues - Issuer Obligations 3,748,712 0 1,826
3199999. Total - U.S. Special Revenues Bonds 3,748,712 0 1,826
3899999. Total - Industrial and Miscellaneous (Unaffiliated) Bonds 0 0 0
4899999. Total - Hybrid Securities 0 0 0
5599999. Total - Parent, Subsidiaries and Affiliates Bonds 0 0 0
6099999. Subtotal - SVO Identified Funds 0 0 0
6599999. Subtotal - Unaffiliated Bank Loans 0 0 0
7699999. Total - Issuer Obligations 3,748,712 0 1,826
7799999. Total - Residential Mortgage-Backed Securities 0 0 0
7899999. Total - Commercial Mortgage-Backed Securities 0 0 0
7999999. Total - Other Loan-Backed and Structured Securities 0 0 0
8099999. Total - SVO Identified Funds 0 0 0
8199999. Total - Affiliated Bank Loans 0 0 0
8299999. Total - Unaffiliated Bank Loans 0 0 0
8399999. Total Bonds 3,748,712 0 1,826
09658L-79-4 BMO Funds Gov Money Market Fund Class 1 12/31/2019 0.000 2,788 0 56
8699999. Subtotal - All Other Money Market Mutual Funds 2,788 0 56
8899999 - Total Cash Equivalents 3,751,500 0 1,882
E28
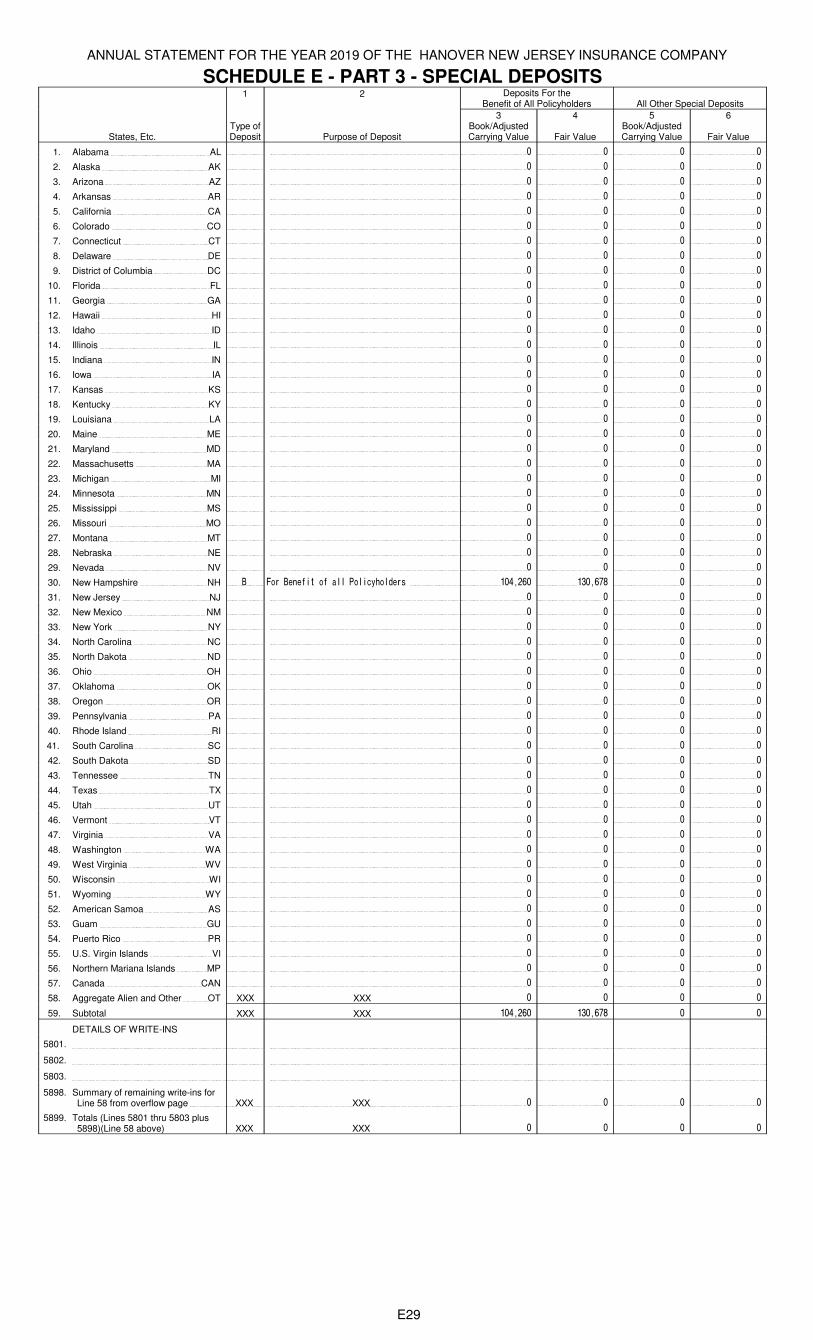
ANNUAL STATEMENT FOR THE YEAR 2019 OF THE HANOVER NEW JERSEY INSURANCE COMPANY
SCHEDULE E - PART 3 - SPECIAL DEPOSITS1 2 Deposits For the
Benefit of All Policyholders All Other Special Deposits
States, Etc.Type of Deposit Purpose of Deposit
3Book/Adjusted Carrying Value
4
Fair Value
5Book/Adjusted Carrying Value
6
Fair Value
1. Alabama AL 0 0 0 0
2. Alaska AK 0 0 0 0
3. Arizona AZ 0 0 0 0
4. Arkansas AR 0 0 0 0
5. California CA 0 0 0 0
6. Colorado CO 0 0 0 0
7. Connecticut CT 0 0 0 0
8. Delaware DE 0 0 0 0
9. District of Columbia DC 0 0 0 0
10. Florida FL 0 0 0 0
11. Georgia GA 0 0 0 0
12. Hawaii HI 0 0 0 0
13. Idaho ID 0 0 0 0
14. Illinois IL 0 0 0 0
15. Indiana IN 0 0 0 0
16. Iowa IA 0 0 0 0
17. Kansas KS 0 0 0 0
18. Kentucky KY 0 0 0 0
19. Louisiana LA 0 0 0 0
20. Maine ME 0 0 0 0
21. Maryland MD 0 0 0 0
22. Massachusetts MA 0 0 0 0
23. Michigan MI 0 0 0 0
24. Minnesota MN 0 0 0 0
25. Mississippi MS 0 0 0 0
26. Missouri MO 0 0 0 0
27. Montana MT 0 0 0 0
28. Nebraska NE 0 0 0 0
29. Nevada NV 0 0 0 0
30. New Hampshire NH B For Benefit of all Policyholders 104,260 130,678 0 0
31. New Jersey NJ 0 0 0 0
32. New Mexico NM 0 0 0 0
33. New York NY 0 0 0 0
34. North Carolina NC 0 0 0 0
35. North Dakota ND 0 0 0 0
36. Ohio OH 0 0 0 0
37. Oklahoma OK 0 0 0 0
38. Oregon OR 0 0 0 0
39. Pennsylvania PA 0 0 0 0
40. Rhode Island RI 0 0 0 0
41. South Carolina SC 0 0 0 0
42. South Dakota SD 0 0 0 0
43. Tennessee TN 0 0 0 0
44. Texas TX 0 0 0 0
45. Utah UT 0 0 0 0
46. Vermont VT 0 0 0 0
47. Virginia VA 0 0 0 0
48. Washington WA 0 0 0 0
49. West Virginia WV 0 0 0 0
50. Wisconsin WI 0 0 0 0
51. Wyoming WY 0 0 0 0
52. American Samoa AS 0 0 0 0
53. Guam GU 0 0 0 0
54. Puerto Rico PR 0 0 0 0
55. U.S. Virgin Islands VI 0 0 0 0
56. Northern Mariana Islands MP 0 0 0 0
57. Canada CAN 0 0 0 0
58. Aggregate Alien and Other OT XXX XXX 0 0 0 0
59. Subtotal XXX XXX 104,260 130,678 0 0
DETAILS OF WRITE-INS
5801.
5802.
5803.
5898. Summary of remaining write-ins for Line 58 from overflow page XXX XXX 0 0 0 0
5899. Totals (Lines 5801 thru 5803 plus 5898)(Line 58 above) XXX XXX 0 0 0 0
E29

ALPHABETICAL INDEXANNUAL STATEMENT BLANK
Assets 2
Cash Flow 5
Exhibit of Capital Gains (Losses) 12
Exhibit of Net Investment Income 12
Exhibit of Nonadmitted Assets 13
Exhibit of Premiums and Losses (State Page) 19
Five-Year Historical Data 17
General Interrogatories 15
Jurat Page 1
Liabilities, Surplus and Other Funds 3
Notes To Financial Statements 14
Overflow Page For Write-ins 100
Schedule A - Part 1 E01
Schedule A - Part 2 E02
Schedule A - Part 3 E03
Schedule A - Verification Between Years SI02
Schedule B - Part 1 E04
Schedule B - Part 2 E05
Schedule B - Part 3 E06
Schedule B - Verification Between Years SI02
Schedule BA - Part 1 E07
Schedule BA - Part 2 E08
Schedule BA - Part 3 E09
Schedule BA - Verification Between Years SI03
Schedule D - Part 1 E10
Schedule D - Part 1A - Section 1 SI05
Schedule D - Part 1A - Section 2 SI08
Schedule D - Part 2 - Section 1 E11
Schedule D - Part 2 - Section 2 E12
Schedule D - Part 3 E13
Schedule D - Part 4 E14
Schedule D - Part 5 E15
Schedule D - Part 6 - Section 1 E16
Schedule D - Part 6 - Section 2 E16
Schedule D - Summary By Country SI04
Schedule D - Verification Between Years SI03
Schedule DA - Part 1 E17
Schedule DA - Verification Between Years SI10
Schedule DB - Part A - Section 1 E18
Schedule DB - Part A - Section 2 E19
Schedule DB - Part A - Verification Between Years SI11
Schedule DB - Part B - Section 1 E20
Schedule DB - Part B - Section 2 E21
Schedule DB - Part B - Verification Between Years SI11
Schedule DB - Part C - Section 1 SI12
Schedule DB - Part C - Section 2 SI13
Schedule DB - Part D - Section 1 E22
Schedule DB - Part D - Section 2 E23
Schedule DB - Part E E24
Schedule DB - Verification SI14
Schedule DL - Part 1 E25
Schedule DL - Part 2 E26
Schedule E - Part 1 - Cash E27
Schedule E - Part 2 - Cash Equivalents E28
Schedule E - Part 2 - Verification Between Years SI15
Schedule E - Part 3 - Special Deposits E29
Schedule F - Part 1 20
Schedule F - Part 2 21
Schedule F - Part 3 22
Schedule F - Part 4 27
Schedule F - Part 5 28
Schedule F - Part 6 29
Schedule H - Accident and Health Exhibit - Part 1 30
Schedule H - Part 2, Part 3 and 4 31
Schedule H - Part 5 - Health Claims 32
Index 1

ANNUAL STATEMENT BLANK (Continued)
Schedule P - Part 1 - Summary 33
Schedule P - Part 1A - Homeowners/Farmowners 35
Schedule P - Part 1B - Private Passenger Auto Liability/Medical 36
Schedule P - Part 1C - Commercial Auto/Truck Liability/Medical 37
Schedule P - Part 1D - Workers’ Compensation (Excluding Excess Workers’ Compensation) 38
Schedule P - Part 1E - Commercial Multiple Peril 39
Schedule P - Part 1F - Section 1 - Medical Professional Liability - Occurrence 40
Schedule P - Part 1F - Section 2 - Medical Professional Liability - Claims-Made 41
Schedule P - Part 1G - Special Liability (Ocean, Marine, Aircraft (All Perils), Boiler and Machinery) 42
Schedule P - Part 1H - Section 1 - Other Liability-Occurrence 43
Schedule P - Part 1H - Section 2 - Other Liability - Claims-Made 44
Schedule P - Part 1I - Special Property (Fire, Allied Lines, Inland Marine, Earthquake, Burglary & Theft) 45
Schedule P - Part 1J - Auto Physical Damage 46
Schedule P - Part 1K - Fidelity/Surety 47
Schedule P - Part 1L - Other (Including Credit, Accident and Health) 48
Schedule P - Part 1M - International 49
Schedule P - Part 1N - Reinsurance - Nonproportional Assumed Property 50
Schedule P - Part 1O - Reinsurance - Nonproportional Assumed Liability 51
Schedule P - Part 1P - Reinsurance - Nonproportional Assumed Financial Lines 52
Schedule P - Part 1R - Section 1 - Products Liability - Occurrence 53
Schedule P - Part 1R - Section 2 - Products Liability - Claims-Made 54
Schedule P - Part 1S - Financial Guaranty/Mortgage Guaranty 55
Schedule P - Part 1T - Warranty 56
Schedule P - Part 2, Part 3 and Part 4 - Summary 34
Schedule P - Part 2A - Homeowners/Farmowners 57
Schedule P - Part 2B - Private Passenger Auto Liability/Medical 57
Schedule P - Part 2C - Commercial Auto/Truck Liability/Medical 57
Schedule P - Part 2D - Workers’ Compensation (Excluding Excess Workers’ Compensation) 57
Schedule P - Part 2E - Commercial Multiple Peril 57
Schedule P - Part 2F - Section 1 - Medical Professional Liability - Occurrence 58
Schedule P - Part 2F - Section 2 - Medical Professional Liability - Claims-Made 58
Schedule P - Part 2G - Special Liability (Ocean Marine, Aircraft (All Perils), Boiler and Machinery) 58
Schedule P - Part 2H - Section 1 - Other Liability - Occurrence 58
Schedule P - Part 2H - Section 2 - Other Liability - Claims-Made 58
Schedule P - Part 2I - Special Property (Fire, Allied Lines, Inland Marine, Earthquake, Burglary, and Theft) 59
Schedule P - Part 2J - Auto Physical Damage 59
Schedule P - Part 2K - Fidelity, Surety 59
Schedule P - Part 2L - Other (Including Credit, Accident and Health) 59
Schedule P - Part 2M - International 59
Schedule P - Part 2N - Reinsurance - Nonproportional Assumed Property 60
Schedule P - Part 2O - Reinsurance - Nonproportional Assumed Liability 60
Schedule P - Part 2P - Reinsurance - Nonproportional Assumed Financial Lines 60
Schedule P - Part 2R - Section 1 - Products Liability - Occurrence 61
Schedule P - Part 2R - Section 2 - Products Liability - Claims-Made 61
Schedule P - Part 2S - Financial Guaranty/Mortgage Guaranty 61
Schedule P - Part 2T - Warranty 61
Schedule P - Part 3A - Homeowners/Farmowners 62
Schedule P - Part 3B - Private Passenger Auto Liability/Medical 62
Schedule P - Part 3C - Commercial Auto/Truck Liability/Medical 62
Schedule P - Part 3D - Workers’ Compensation (Excluding Excess Workers’ Compensation) 62
Schedule P - Part 3E - Commercial Multiple Peril 62
Schedule P - Part 3F - Section 1 - Medical Professional Liability - Occurrence 63
Schedule P - Part 3F - Section 2 - Medical Professional Liability - Claims-Made 63
Schedule P - Part 3G - Special Liability (Ocean Marine, Aircraft (All Perils), Boiler and Machinery) 63
Schedule P - Part 3H - Section 1 - Other Liability - Occurrence 63
Schedule P - Part 3H - Section 2 - Other Liability - Claims-Made 63
Schedule P - Part 3I - Special Property (Fire, Allied Lines, Inland Marine, Earthquake, Burglary, and Theft) 64
Schedule P - Part 3J - Auto Physical Damage 64
Schedule P - Part 3K - Fidelity/Surety 64
Schedule P - Part 3L - Other (Including Credit, Accident and Health) 64
Schedule P - Part 3M - International 64
Schedule P - Part 3N - Reinsurance - Nonproportional Assumed Property 65
Schedule P - Part 3O - Reinsurance - Nonproportional Assumed Liability 65
Schedule P - Part 3P - Reinsurance - Nonproportional Assumed Financial Lines 65
Schedule P - Part 3R - Section 1 - Products Liability - Occurrence 66
Schedule P - Part 3R - Section 2 - Products Liability - Claims-Made 66
Schedule P - Part 3S - Financial Guaranty/Mortgage Guaranty 66
Schedule P - Part 3T - Warranty 66
Index 1.1

ANNUAL STATEMENT BLANK (Continued)
Schedule P - Part 4A - Homeowners/Farmowners 67
Schedule P - Part 4B - Private Passenger Auto Liability/Medical 67
Schedule P - Part 4C - Commercial Auto/Truck Liability/Medical 67
Schedule P - Part 4D - Workers’ Compensation (Excluding Excess Workers’ Compensation) 67
Schedule P - Part 4E - Commercial Multiple Peril 67
Schedule P - Part 4F - Section 1 - Medical Professional Liability - Occurrence 68
Schedule P - Part 4F - Section 2 - Medical Professional Liability - Claims-Made 68
Schedule P - Part 4G - Special Liability (Ocean Marine, Aircraft (All Perils), Boiler and Machinery) 68
Schedule P - Part 4H - Section 1 - Other Liability - Occurrence 68
Schedule P - Part 4H - Section 2 - Other Liability - Claims-Made 68
Schedule P - Part 4I - Special Property (Fire, Allied Lines, Inland Marine, Earthquake, Burglary and Theft) 69
Schedule P - Part 4J - Auto Physical Damage 69
Schedule P - Part 4K - Fidelity/Surety 69
Schedule P - Part 4L - Other (Including Credit, Accident and Health) 69
Schedule P - Part 4M - International 69
Schedule P - Part 4N - Reinsurance - Nonproportional Assumed Property 70
Schedule P - Part 4O - Reinsurance - Nonproportional Assumed Liability 70
Schedule P - Part 4P - Reinsurance - Nonproportional Assumed Financial Lines 70
Schedule P - Part 4R - Section 1 - Products Liability - Occurrence 71
Schedule P - Part 4R - Section 2 - Products Liability - Claims-Made 71
Schedule P - Part 4S - Financial Guaranty/Mortgage Guaranty 71
Schedule P - Part 4T - Warranty 71
Schedule P - Part 5A - Homeowners/Farmowners 72
Schedule P - Part 5B - Private Passenger Auto Liability/Medical 73
Schedule P - Part 5C - Commercial Auto/Truck Liability/Medical 74
Schedule P - Part 5D - Workers’ Compensation (Excluding Excess Workers’ Compensation) 75
Schedule P - Part 5E - Commercial Multiple Peril 76
Schedule P - Part 5F - Medical Professional Liability - Claims-Made 78
Schedule P - Part 5F - Medical Professional Liability - Occurrence 77
Schedule P - Part 5H - Other Liability - Claims-Made 80
Schedule P - Part 5H - Other Liability - Occurrence 79
Schedule P - Part 5R - Products Liability - Claims-Made 82
Schedule P - Part 5R - Products Liability - Occurrence 81
Schedule P - Part 5T - Warranty 83
Schedule P - Part 6C - Commercial Auto/Truck Liability/Medical 84
Schedule P - Part 6D - Workers’ Compensation (Excluding Excess Workers’ Compensation) 84
Schedule P - Part 6E - Commercial Multiple Peril 85
Schedule P - Part 6H - Other Liability - Claims-Made 86
Schedule P - Part 6H - Other Liability - Occurrence 85
Schedule P - Part 6M - International 86
Schedule P - Part 6N - Reinsurance - Nonproportional Assumed Property 87
Schedule P - Part 6O - Reinsurance - Nonproportional Assumed Liability 87
Schedule P - Part 6R - Products Liability - Claims-Made 88
Schedule P - Part 6R - Products Liability - Occurrence 88
Schedule P - Part 7A - Primary Loss Sensitive Contracts 89
Schedule P - Part 7B - Reinsurance Loss Sensitive Contracts 91
Schedule P Interrogatories 93
Schedule T - Exhibit of Premiums Written 94
Schedule T - Part 2 - Interstate Compact 95
Schedule Y - Information Concerning Activities of Insurer Members of a Holding Company Group 96
Schedule Y - Part 1A - Detail of Insurance Holding Company System 97
Schedule Y - Part 2 - Summary of Insurer’s Transactions With Any Affiliates 98
Statement of Income 4
Summary Investment Schedule SI01
Supplemental Exhibits and Schedules Interrogatories 99
Underwriting and Investment Exhibit Part 1 6
Underwriting and Investment Exhibit Part 1A 7
Underwriting and Investment Exhibit Part 1B 8
Underwriting and Investment Exhibit Part 2 9
Underwriting and Investment Exhibit Part 2A 10
Underwriting and Investment Exhibit Part 3 11
Index 1.2


