52
Geography CD-ROM for students Advice for students, questions and answers Cameron Dunn, David Holmes, Simon Oakes and Sue Warn Edexcel AS

GeographyCD-ROM for students
Advice for students, questionsand answers
Cameron Dunn, David Holmes, Simon Oakes and Sue Warn
Edexcel
AS
Contents
Advice for students . . . . . . . . . . . . . . . . . . . . . . . . . . . . . . . . . . . . . . . . . . . . . . . . . . . . . . . . . . . . . . . . . . . . . . . . . . . 2
The AS exams in brief . . . . . . . . . . . . . . . . . . . . . . . . . . . . . . . . . . . . . . . . . . . . . . . . . . . . . . . . . . . . . . . . . . . . . . . . . . 2
Exam technique . . . . . . . . . . . . . . . . . . . . . . . . . . . . . . . . . . . . . . . . . . . . . . . . . . . . . . . . . . . . . . . . . . . . . . . . . . . . . . . . . . . 2
Command words . . . . . . . . . . . . . . . . . . . . . . . . . . . . . . . . . . . . . . . . . . . . . . . . . . . . . . . . . . . . . . . . . . . . . . . . . . . . . . . . . 3
Key words . . . . . . . . . . . . . . . . . . . . . . . . . . . . . . . . . . . . . . . . . . . . . . . . . . . . . . . . . . . . . . . . . . . . . . . . . . . . . . . . . . . . . . . . . . . . 3
Dissecting exam questions . . . . . . . . . . . . . . . . . . . . . . . . . . . . . . . . . . . . . . . . . . . . . . . . . . . . . . . . . . . . . . . . . . 5
Using the exam resources . . . . . . . . . . . . . . . . . . . . . . . . . . . . . . . . . . . . . . . . . . . . . . . . . . . . . . . . . . . . . . . . . . . 6
Answer style . . . . . . . . . . . . . . . . . . . . . . . . . . . . . . . . . . . . . . . . . . . . . . . . . . . . . . . . . . . . . . . . . . . . . . . . . . . . . . . . . . . . . . 10
Locational knowledge . . . . . . . . . . . . . . . . . . . . . . . . . . . . . . . . . . . . . . . . . . . . . . . . . . . . . . . . . . . . . . . . . . . . . . . 10
Timing . . . . . . . . . . . . . . . . . . . . . . . . . . . . . . . . . . . . . . . . . . . . . . . . . . . . . . . . . . . . . . . . . . . . . . . . . . . . . . . . . . . . . . . . . . . . . . . 12
Key geographical terms . . . . . . . . . . . . . . . . . . . . . . . . . . . . . . . . . . . . . . . . . . . . . . . . . . . . . . . . . . . . . . . . . . . . . 12
Revision: the final piece of the jigsaw . . . . . . . . . . . . . . . . . . . . . . . . . . . . . . . . . . . . . . . . . . . . . . . 13
Questions and answers . . . . . . . . . . . . . . . . . . . . . . . . . . . . . . . . . . . . . . . . . . . . . . . . . . . . . . . . . . . . . . . . . . . 15
Introduction . . . . . . . . . . . . . . . . . . . . . . . . . . . . . . . . . . . . . . . . . . . . . . . . . . . . . . . . . . . . . . . . . . . . . . . . . . . . . . . . . . . . . . . 15
Unit 1 Global challenges . . . . . . . . . . . . . . . . . . . . . . . . . . . . . . . . . . . . . . . . . . . . . . . . . . . . . . . . . . . . . . . . . . . . 18
World at risk . . . . . . . . . . . . . . . . . . . . . . . . . . . . . . . . . . . . . . . . . . . . . . . . . . . . . . . . . . . . . . . . . . . . . . . . . . . . . . . . . . . . . . . 18
Going global . . . . . . . . . . . . . . . . . . . . . . . . . . . . . . . . . . . . . . . . . . . . . . . . . . . . . . . . . . . . . . . . . . . . . . . . . . . . . . . . . . . . . . 29
Unit 2 Geographical investigations . . . . . . . . . . . . . . . . . . . . . . . . . . . . . . . . . . . . . . . . . . . . . . . . . . . . 40
Extreme weather . . . . . . . . . . . . . . . . . . . . . . . . . . . . . . . . . . . . . . . . . . . . . . . . . . . . . . . . . . . . . . . . . . . . . . . . . . . . . . . 40
Crowded coasts . . . . . . . . . . . . . . . . . . . . . . . . . . . . . . . . . . . . . . . . . . . . . . . . . . . . . . . . . . . . . . . . . . . . . . . . . . . . . . . . . 43
Unequal spaces . . . . . . . . . . . . . . . . . . . . . . . . . . . . . . . . . . . . . . . . . . . . . . . . . . . . . . . . . . . . . . . . . . . . . . . . . . . . . . . . . 46
Rebranding places . . . . . . . . . . . . . . . . . . . . . . . . . . . . . . . . . . . . . . . . . . . . . . . . . . . . . . . . . . . . . . . . . . . . . . . . . . . . . 49
1Edexcel AS Geography © Philip Allan Updates
P011
78
For further questions and answers with examiner comments, and specific content guidance oneach unit, see our Student Unit Guides for Edexcel AS geography (available from autumn 2008).For more information and to order copies online, visit www.philipallan.co.uk , or contactBookpoint on 01235 827720.
978-0-340-94931-3 Edexcel AS Geography Student Unit Guide: Unit 1978-0-340-97109-3 Edexcel AS Geography Student Unit Guide: Unit 2 Geographical Investigations

Advice for students
The AS exams in briefThe Edexcel geography specification has two exams at AS. The format of the exams is shown inTable 1.
Table 1 AS exam formats
Exam techniqueGood exam technique is vital at AS.You should not be short of time in the exams, as the exampapers have been designed to fit the allocated time. However, you should still be careful not towaste precious minutes. Use revision and exam practice to develop your exam skills, so that youspend all the available time in the exam producing quality answers to the questions set.
Good exam technique is rather like a jigsaw of skills, as shown in Figure 1. Each skill needs to bedeveloped so that they all fit together perfectly in the exam itself.
Commandwords
Keywords Timing
Keygeographical
terms
Locationalknowledge
Use ofresources
Unit 2
Geographical investigations
Either Crowded coasts or Extremeweather (Section A in the exam)andEither Unequal spaces or Rebrandingplaces (Section B in the exam)
1 hour
40%
Students answer one question on eachof their two chosen options. This meansone question from Section A and onefrom Section B.
The questions require longer responses.There are data response resources.It is important to use information fromfieldwork, virtual fieldwork andresearch in your answers.
Unit 1
Global challenges
World at riskGoing global
1 hour 30 minutes
60%
Students answer all questions inSection A. These questions assess thebreadth of knowledge and understand-ing. They are short questions with dataresponse resources.
Students choose one question fromSection B. This section assesses depth ofknowledge and understanding. Thequestions are longer, with data stimulusresources.
Unit title
Topics
Exam length
Percentageof AS marks
Examdemands
2Edexcel AS Geography Advice for students © Philip Allan Updates
Figure 1
The exam skills
jigsaw

Command wordsCommand words are instructions that tell you how to answer a question. Examples are ‘describe’and ‘explain’. A common cause of under-performance in exams is misinterpreting a commandword. One of the most frequent errors is explaining something when the question has asked youto describe it — in other words, saying why, when you should have been saying what. This alsohappens in reverse — i.e. describing when you should have been explaining.
Command words that are used at AS are defined in Table 2.
Table 2 Command words
Key wordsKey words are instructions that tell you what to write your answer about. They provide you withthe focus of the question. They are often common words, but it can be difficult to explain theirmeaning. Some key words that are used at AS are defined in Table 3.
Meaning
Label a diagram, image or graphic. The labels should explain features, ratherthan just identify them.
Identify similarities and differences between items.
Describe, and give your views on a subject.
Point out the differences only between two or more items.
State the precise meaning of a concept.
Say what something is like, and how it works.
Give both sides of an argument (for and against), and come to a conclusion.
Investigate in detail, offering evidence for and against.
Provide a detailed set of reasons for something.
Find key relevant points and say what they are, briefly and clearly.
Use an example to show how a concept or process works, or to prove thesubject of the question.
Give reasons why something should be done, and why other optionsshould not.
Provide an explanation; say why.
Provide a brief overview of all the relevant information.
Command word
Annotate
Compare
Consider
Contrast
Define
Describe
Discuss
Examine
Explain
Identify/what/name
Illustrate
Justify
Suggest reasons
Summarise/outline/state
3Edexcel AS Geography Advice for students © Philip Allan Updates

Table 3 Key words
Some of these key words may seem rather broadly defined and do not give much away in termsof what you should be writing about. One tip is to remember that ‘results’ words, such as conse-quences and impacts, can be both positive and negative. Another is always to have a structure inmind when you are reading a question. For most geography topics, this will be based on theaspects shown in Table 4.
Meaning
A significant departure from an overall trend or pattern.
Solutions that are fit for purpose and realistic.
The advantages/positive impacts of something (social, economic,environmental).
The reasons why something happens.
Difficult, large-scale problems that require solutions.
Transformations that take place over time.
The key features of something.
Aspects of an issue or problem that are worrying.
Issues over which two or more groups disagree.
The results of a change or process; they can be positive or negative.
The disadvantages/negative impacts of something (social, economic,environmental).
The geographical pattern, most often on a map.
The results of a process (come after causes).
The underlying causes of a problem or process.
The results of a process or change on people and the environment. Theycan be positive or negative.
Links between two or more features, such that changing one feature leadsto changes in the others.
Concerns; problems that are worrying.
Using policies and strategies to minimise or reduce problems.
The distribution of something; where things are — most often on a map.
Issues that worry people; the negative results of a process or change.
A sequence of events that causes a change to take place.
Usually used to mean the link between a cause and its effects.
The size of a feature — local, regional, national, global.
Variation in space (across an area).
A method used to manage a problem.
How parts of something are arranged in relation to each other, and thelinks between the parts.
Over time — usually referring to change over time.
The general direction of a change — rising, falling, fluctuating.
How far something differs from the norm or the average.
Key word
Anomaly
Appropriate
Benefits
Causes
Challenges
Changes
Characteristics
Concerns
Conflicts
Consequences
Costs
Distribution
Effects
Factors
Impacts
Interrelationships
Issues
Management
Pattern(s)
Problems
Process
Relationships
Scale(s)
Spatial
Strategy
Structure
Temporal
Trend(s)
Variation
4Edexcel AS Geography Advice for students © Philip Allan Updates

Table 4 Aspects of geography topics
Many topics, when linked to key words such as problems, challenges, consequences, impacts,effects and issues, have social, economic and environmental aspects.
A further way to help you understand key words is to examine the geographical process.Many of the topics you study fit into a sequence. This is explained in Figure 2.
Figure 2 The geographical process
In the exam, it is important to recognise which part of the process the question is asking youabout. In general, the sequence of questions in an exam is logical.You may be asked to explaincauses, then to describe changes, next to identify problems, and finally to suggest solutions.
Dissecting exam questionsWhen you first read an exam question, you should dissect it — in other words, cut it up into itscomponent parts and try to understand each one.
It is a good idea to take highlighter pens into the exam. Highlight the command words in onecolour and the key words in another colour. This will focus your mind, first on spotting thesewords, and second on thinking about them.
As an example, consider the question in Figure 3.
Figure 3 How to dissect an exam question
The example shows how dissecting the question, and then thinking about the command andkey words, can help provide you with a structure for your answer. Knowing what ‘impacts’ meansshould help you to identify a range of possible impacts (perhaps one each from social, economicand environmental) and to write a balanced answer (i.e. including some positive and somenegative impacts).
Key word. Remember that impacts can be both positive and negative, and could be social, economic and environmental.
Key words. These give you the topic (global warming) and the location you must discuss.
Command word. It tells you to investigate in detail, and offer evidence for and against.
Examine some of the impacts of global warming in the Arctic.
Geographical issues begin with causes. Processes then occur which lead to…
…consequences; these can be positive or negative (problems) for people and/or the environment…
…changes taking place. These can be changes to natural or human systems. The changes often have…
…the problems and issues require management to find solutions and minimise conflict
To do with people, their quality of life, health, education and prosperity.
To do with money, work, industry, jobs and prospects.
To do with plants, animals, water, air and resources.
Social
Economic
Environmental
5Edexcel AS Geography Advice for students © Philip Allan Updates

To clarify the meaning of some exam questions, it can be helpful to try to replace a commandword with another similar word. If you do this and the question does not make sense with thenew word, you should think again.
Consider this question:Explain why earthquakes and volcanoes frequently occur in the same areas.
If we reword the question as:Suggest why earthquakes and volcanoes frequently occur in the same areas.
or:Why do earthquakes and volcanoes frequently occur in the same areas?
the question still makes sense. However, if we reword the question as:Describe why earthquakes and volcanoes frequently occur in the same areas.
it now does not make sense, because ‘describe why’ combines ‘what’ and ‘why’. If examiners wantyou to include ‘what’ and ‘why’, they usually word the question in this way:
Describe and explain the distribution of earthquakes.
A correct answer to this question would first say what the distribution of earthquakes is: mostoccur at tectonic plate boundaries, with a greater number at destructive boundaries comparedto constructive ones; mid-plate earthquakes are uncommon. It would then go on to say whythey occur in these places: friction is caused by the descending plate at a destructive plateboundary, and by the movement of magma and faulting at a constructive boundary.
Students often miss a command word when there are two in the question, as in the ‘describe andexplain’ example above.
Using the exam resourcesYou must take a structured and careful approach when using the resources you are asked tostudy in the exam. They contain key information that you will need to use to answer fully thequestions linked to them.
Resources are used in two main ways — as data response resources or as data stimulusresources:� Data response resources should be used directly in your answer. Usually, this means taking
information from the resource and incorporating it into your answer. Short questions areoften data response questions. Data response command words include ‘describe’,‘state’ and‘summarise’.
� Data stimulus resources can be used more indirectly.You might use the resource to get someideas, or to provide a structure for your answer. Data stimulus command words are moreopen, for example ‘examine’ or ‘discuss’.
The range of resources you could be asked to interpret and use is large.
PhotographsPhotographs are not just included on exam papers because they look good. The successful useof photographs involves examining them carefully, and either mentally, or better still, physically,noting all their key features. In Figure 4, the complex photograph has been broken down into itskey parts.
6Edexcel AS Geography Advice for students © Philip Allan Updates

Figure 4 Interpreting photographs
With any photograph, or pair of photographs, you should ask yourself: ‘why have I been giventhis?’ Photographs are commonly used to illustrate a process or a change. They may also beincluded to allow you to contrast or compare something. Examples would be a pair ofphotographs showing hurricane damage in the developed world versus the developing world,or a glacier in 1900 versus 2000 to show how global warming has led to glacial retreat.
MapsOrdnance Survey maps sometimes appear on exam papers, so it is important to brush up yourmap skills, including using grid references. All maps require a structured approach.You shouldlook carefully at the:� scale� orientation� key� annotations on the map� date(s)
Occasionally, world maps are used on exam papers. These demand a slightly different approachbecause they usually accompany questions on patterns and distributions. Figure 5 is an exampleof this type of map. It shows GNP per capita in 2006.
Figure 5 World map showing GNP per capita, 2006
10,001–90,0002,501–10,000501–2,5000–500No data
GNP per capita
Historicbuildings
Street café Pedestrianised area
Flagship store(NEXT)
Trees
7Edexcel AS Geography Advice for students © Philip Allan Updates

When studying Figure 5, it is important to consider overall patterns (e.g. the southernhemisphere has lower incomes than the northern hemisphere), but also to look in more detailfor less obvious patterns. For instance:� Most countries in South America have moderate GNPs per capita.� In Africa, there is much variation: many countries have low GNP per capita, but some have
higher GNP.� There is also variation in Asia, with south and west Asia being significantly poorer than east
Asia.� Some middle eastern countries have high GNPs per capita and are therefore anomalies
within the developing world.
Graphs and tablesOf all resources, graphs and tables generate the most errors of interpretation. This is partlybecause they contain a lot of information and can look ‘dull’. Equally, they often demandnumeracy skills, and mistakes in this area are common.
Figure 6 Trends in tropical cyclone (hurricane) energy in the Atlantic, 1979–2004
Figure 6 shows the annual total energy released (accumulated cyclone energy) by tropicalcyclones (hurricanes) in the Atlantic between 1979 and 2004. If you are asked to study a graphlike this, you should:� Examine both axes, to note the units of measurement that are used.� Look for variation and range. In this example, the lowest year was 1983, with an accumulated
cyclone energy of only 20. The highest year was 2004, with an accumulated cyclone energy ofaround 280. The range is therefore about 260.
� Look for a trend and any anomalies. In this example, the trend appears to be upward, but isvariable. The year 1994 might be considered an anomaly, as might 1996.
� Compared to ‘normal’ conditions, the left half of the graph shows activity that is mostly belownormal, whereas the right half shows activity that is usually above normal.
1980 1985 1990 1995 20000
50
100
150
200
250
300
Acc
um
ula
ted
cyc
lon
e en
erg
y (i
nd
ex)
Above normal
Near normal
Below normal
Year
8Edexcel AS Geography Advice for students © Philip Allan Updates

Table 5 shows the changing population size of the world’s megacities. To analyse a table such asthis, you could use a highlighter pen to pick out trends, patterns and anomalies.� A starting point might be to highlight developed world cities (i.e. Tokyo, New York, Los
Angeles, Osaka, Moscow).� Note that these cities have populations that are growing only slowly, or are projected to be
stable by 2015.� Cities in developing Asia (e.g. Mumbai, Delhi, Shanghai, Kolkata, Dhaka) are projected to grow
rapidly.� There are only two African cities in the list — Cairo and Lagos. Lagos has the most rapid
growth of any city listed.
Table 5 Population change in the world’s 20 largest cities, 1975–2015
Population (millions)Ranking Megacity 1975 2000 2005 2015
1 Tokyo 26.6 34.4 35.2 35.5
2 Mexico City 10.7 18.1 19.4 21.6
3 New York 15.9 17.8 18.7 19.9
4 São Paulo 9.6 17.1 18.3 20.5
5 Mumbai 7.1 16.1 18.2 21.9
6 Delhi 4.4 12.4 15.0 18.6
7 Shanghai 7.3 13.2 14.5 17.2
8 Kolkata 7.9 13.1 14.3 17.0
9 Jakarta 4.8 11.1 13.2 16.8
10 Buenos Aires 8.7 11.8 12.6 13.4
11 Dhaka 2.2 10.2 12.4 16.8
12 Los Angeles 8.9 11.8 12.3 13.1
13 Karachi 4.0 10.0 11.6 15.2
14 Rio de Janeiro 7.6 10.8 11.5 12.8
15 Osaka 9.8 11.2 11.3 11.3
16 Cairo 6.4 10.4 11.1 13.1
17 Lagos 1.9 8.4 10.9 16.1
18 Beijing 6.0 9.8 10.7 12.9
19 Manila 5.0 10.0 10.7 12.9
20 Moscow 7.6 10.1 10.7 11.0
Tables like Table 5 can be daunting.You should try to break them down into more manageablechunks.
Remember, with tables and graphs, it is always good practice to quote data (i.e. facts and figures)from the resource in your answer.
9Edexcel AS Geography Advice for students © Philip Allan Updates

DiagramsDiagrams can be confusing, and you should take your time when examining them. Look for:� Perspective. Is the diagram a section (i.e. from the side) or a plan (i.e. from above)? � Scale. Are there any features that can be used to work out the scale? � Key terms. Many diagrams are labelled with key terms and words. These often give clues to
help you understand the diagram.
Occasionally, you might be asked to annotate a diagram. This is a good skill to practise before theexams, using past papers.You need to make your annotations explanatory, rather than justdescriptive.
CartoonsCartoons are sometimes used on exam papers. The cartoon is often linked to a question alongthe lines of ‘state the message of the cartoon’. This is asking you to state in words what thecartoon is saying visually.
Answer styleExam questions should be written in a formal, precise style.You should write in continuous proseand use technical geographical terms as much as possible. Avoid informal words, slang andcolloquialisms. This is especially important for longer answers to questions worth 5 or moremarks. Bullet points and numbered points are acceptable in shorter answers. If you are asked todescribe the key features of a map or graph for 3 marks, bullets can be a useful way of makingsure you write three distinct points. However, in longer answers you should only use a list ofbullet points like this if you run short of time. To produce a top-level answer you need to linkideas, and lists of points work against this.
Locational knowledge It is important that you approach the exams as a geographer, i.e. an expert on places. Examquestions often ask for what can be termed ‘locational knowledge’. This could be about scale:� global (world, worldwide)� national (country or countries)� local (small area)
It could be about levels of development:� developed world (FCCs, MEDCs, G8 countries)� developing world (LDCs, LEDCs, RICs, NICs)
It could also be about type of place:� urban area, e.g. world city� rural area, e.g. remote rural locations
On this specification there are some compulsory case studies, so you should expect examquestions specifically about these. They include:� disaster hotspots: the Californian coast and the Philippines � climate impacts: the Arctic and Africa� EU migration from eastern Europe� EU migration to Mediterranean locations
Drawing maps and diagrams in your answersYou will be given credit for including maps and diagrams in your answers. These do not have tobe of artist quality but they do need to be clear. Ask yourself the following questions beforedeciding to include a map or diagram:� Will it provide better geography than using words?� Can I draw it more quickly than writing it?
10Edexcel AS Geography Advice for students © Philip Allan Updates

� Can I remember enough detail to make it worthwhile?� Will I refer to the map or diagram in my written answer?
If the answer is yes to all these questions a diagram or map may be useful as part of your answer.You should stick to a few basic rules:� Keep maps and diagrams simple.� Your diagram should take at most 1 or 2 minutes to draw.� Maps without scales and orientation arrows are next to useless.� Use the ‘three-lines’ rule: your map or diagram should be given its basic structure by three
quickly drawn lines.� Do not use colour but a black or blue pen.� Make sure you include a sentence in your answer that says something like,‘the map below
shows…’ to link your drawing to the rest of the answer. Figures 7 and 8 show a simple mapand diagram, suitable for exam conditions.
Figure 7 Map showing the California multiple hazard zone
Figure 8 Graph showing internet use in the developed and developing worlds
Examples and case studiesYou should take every opportunity to mention specific places in your answers.You could achievethis by using examples (which are relatively brief, perhaps a few lines) and case studies (whichare longer and more detailed) to illustrate and support your understanding of processes.
It is important that you do not wait to be asked to use examples.You should get into the habit ofusing them as a matter of course. For example, you could be asked a question such as:
Define the term megacity. (2 marks)
11Edexcel AS Geography Advice for students © Philip Allan Updates

You might answer,‘A megacity is a city with a population of over 10 million’, but you could alsoadd,‘New York is an example, with a population of 18.7 million in 2005.’ By using an example, youare ensuring that you get the full 2 marks.
Another question could be:Explain how Arctic warming will have consequences for the wider world. (4 marks)
A good answer might suggest that sea levels could rise as ice shelves and ice sheets melt, or thathabitats for key species might be lost. Using examples of threatened low-lying areas such asBangladesh or Florida, and naming endangered species such as polar bears and Arctic foxesprovides additional geographical detail that will make your answer stand out.
In the more extended writing sections of the exams (Section B on the Unit 1 exam, and acrossthe Unit 2 exam), you will need to use detailed locational evidence to access the top bands in themark scheme. This is where your case studies can be used to full effect.
When using case studies, you need to:� State the basic facts — where, when and what happened?� Establish the context of the case study — is it in a developing or developed country, is it
unusual, did it lead to changes in how the issue was dealt with later?� Use data and statistics to add weight to your case study.� Identify clearly the key points the case study illustrates.� Always be precise.You will need to learn key facts and figures, causal factors and short- and
long-term impacts and changes.
DiagramsYou can also use your own diagrams in your answers. These are especially useful in the moreextended writing questions, which are worth 10 or more marks. Try to design your diagrams to fitthe question, and keep them simple. They should be quick to draw and add something to youranswer, not just repeat what you have already written.
TimingYou should have enough time in the exams, but you can get into difficulties and be forced torush if you do not follow some guidelines:� Use past papers to practise timed exams. It is vital you understand fully the exam format and
have some experience of working under exam conditions.� If there is a choice of questions (as there is in Unit 1, Section B), read all the questions before
you choose which one to answer.� Be guided by the number of marks available for each question and the number of lines you
have to write on. Do not spend 10 minutes on a question worth 3 marks, or 3 minutes on aquestion worth 10 marks.
� As a guide, in Unit 1 there are 90 marks available, and you have 90 minutes in the exam. Thistranslates as 1 minute per mark. In Unit 2 there are 70 marks available and 60 minutes in theexam — a little less than 1 minute per mark.
Key geographical termsKey geographical terms are defined for you in the textbook.You should learn these and beprepared to use them. Key terms are important for two reasons:
(1) If your geographical vocabulary is poor, there is a danger that you will not understand somequestions.
(2) If you do not use geographical terminology, your answers may be imprecise and poorlyexpressed.You must avoid using words such as ‘bad’,‘nice’ and ‘a lot’, as these are vague andnon-geographical.
12Edexcel AS Geography Advice for students © Philip Allan Updates

Revision: the final piece of the jigsaw
Few students enjoy revision. However, it is vital that you review your work, learn it, and test yourunderstanding.
Every student has to decide his or her own revision strategy. However, there are a few rules thatwork for most students:
(1) Revise in short bursts. For most students 15–30 minutes is enough. Beyond this time, youcease to take much in.
(2) Try to do something active between revision sessions. Move into another room, take the dogfor a walk, make a cup of tea, have a dance! The more you can take your mind off revision, thefresher you will be when you go back to it.
(3) Just reading your class notes does not work.
(4) Try to revise using as many of your senses as possible. Reading only uses one sense — sight. Ifyou read and write, for instance making revision notes from your file, you are using sight andtouch. If you revise with a friend from your class and occasionally test each other or read outyour notes, you are also using hearing.You might think this is silly, but driving is a complexskill that most students of A-level age can master quickly — partly because it uses most ofyour senses, and your powerful brain quickly learns to assess all these signals, which helpsyou to learn.
(5) Revision involves taking the large volume of material from your course and condensing itinto a form you can more easily learn and recall in the exam.Your job is to identify strategiesthat will allow you to do this in the least painful way.
Some suggested revision strategies(1) Start by getting organised. Make sure your class notes are clearly sorted. This is a long-term
strategy, of course. If your file is poorly organised, and the exams are fast approaching, thenget help — borrow a friend’s file or ask your teacher for help.
(2) Plan your revision. Set aside days and times for all subjects that you need to study, and stickto your timetable. This will allow you to continue to do all the other things you enjoy, and fitin revision as well.
(3) Set yourself clear goals. For instance, you might allocate one revision session to revising thecauses of climate change. Do not just open your file anywhere and start revising — makeyour revision structured and logical.
(4) Make notes on your notes:� Use an exercise book or note pad — this will help keep things organised.� Break down your notes into bite-size chunks, using subheadings. This makes reviewing your
notes easier.� Use numbered or bullet points. Try to pare down the information in your file to key points
and important facts and figures.� Use several different coloured pens to identify patterns and links.� Pick out key words and process terms, and write down their definitions.� Redraw key diagrams in a simplified way.You may be able to use these in the exam.
(5) Make mind maps and spider diagrams:� Take a topic such as the impacts of climate change and make it the centre of a spider
diagram or mind map.� Use A3 paper to give you plenty of space with which to work.� Break impacts down into a structure, such as social, environmental and economic, or
developed world and developing world.� Next, use your file to add specific impacts to the structure, including examples, key facts
and figures.
13Edexcel AS Geography Advice for students © Philip Allan Updates

Spider diagrams can be a useful way to organise a mass of notes into something morecoherent from which it is easy to revise.You can use them as posters and put them up on thewall. Glancing at them repeatedly will help the visual ‘picture’ stick in your mind, and recallingit in the exam will be easier.
(6) Make your own flash cards:� You can use large Post-it notes or postcard-sized pieces of card.� Flash cards are ideal for key case studies, key processes, key terms and definitions, and
important diagrams.� Making flash cards forces you to include only key information, as you have limited space.
You will find you can condense your notes into something much easier to review.
(7) Use your teacher:� Teachers like nothing better than being asked questions. Make a note of any problem areas
as you revise, and ask your teacher to go over these in class.� Ask to do practice exam questions.You may not like these, but they are one of the best
ways to revise and practise your exam skills. Try to look at exam mark schemes so you canunderstand how marks are awarded.
� Ask to have regular key terms tests at the start and end of lessons. This will make you muchmore confident in using the technical language of geography. These can be done usingPost-it notes — for instance, matching key words to their definitions.
(8) Use your friends and family. Some students find they can revise with a friend, although thisdoes not work for everyone. Revising with someone else has some advantages:� If you get stuck your friend may be able to help.� You can ask each other questions and test each other. This uses more senses, which helps
you learn.� Forcing yourself to explain a process or case study to a friend is a good way to learn
yourself, and to highlight areas on which you need to work.� Working with someone else can be more motivating, and less lonely, than sitting on your
own trying to revise.� You can also ask your family to give you quick quizzes on key terms.
14Edexcel AS Geography Advice for students © Philip Allan Updates

15Edexcel AS Geography Questions and answers © Philip Allan Updates
Questions and answers
IntroductionIn this section of the CD-ROM there are sample questions for you to work on. They are similar instyle to those that will appear on the exam papers. The questions are based on the content inthe specification and your textbook.
The tables below show the questions, the time you should spend on each question, and themark allocation.
Unit 1 Global challengesThe total number of marks available for this unit is 90.
Section AIn the exam you will be required to answer all six questions in Section A. This section tests thebreadth of your knowledge and understanding. Each question is likely to be worth 1–6 marks.
The total number of marks available for this section is 65.
Question 1 13 marks 13 minutes World at risk
Question 2 10 marks 10 minutes World at risk
Question 3 10 marks 10 minutes World at risk
Question 4 10 marks 10 minutes Going global
Question 5 10 marks 10 minutes Going global
Question 6 12 marks 12 minutes Going global
Section BIn the exam you will be required to answer one question from Section B. This section tests thedepth of your knowledge and understanding, and your ability to produce structured, reasoned,longer responses.
The total number of marks available for this section is 25.
Question 7 25 marks 25 minutes Going global
Question 8 25 marks 25 minutes Going global
Question 9 25 marks 25 minutes World at risk
Question 10 25 marks 25 minutes World at risk
Unit 2 Geographical investigations
In the Unit 2 exam you must answer two questions: one from Section A and one from Section B.The questions will generally require longer answers, and will be worth 10 or 15 marks.
The total number of marks available for this unit is 70.

Section A: either Extreme weather or Crowded coastsThe total number of marks available for this section is 35.
Question 1 35 marks 30 minutes Extreme weather
Question 2 35 marks 30 minutes Crowded coasts
Section B: either Unequal spaces or Rebranding placesThe total number of marks available for this section is 35.
Question 3 35 marks 30 minutes Unequal spaces
Question 4 35 marks 30 minutes Rebranding places
About this section of the CD-ROMThe structure of this question and answer section of the CD-ROM is as follows:� The resource for the question.� The question itself.� The answers. For short answer questions, you will be shown how to achieve maximum marks.
For long answer questions, there are notes on each question, plus a detailed outline of whatexaminers might expect for each level of the mark scheme. These notes are not intended tobe model answers but to help you understand what would constitute a weak or stronganswer.
Examiners’ commentsThe answers are followed by examiners’ comments. These are indicated by the icon e. Thecomments highlight problem areas and common mistakes, as well as giving tips on examtechnique and understanding resources.
Mark schemeExaminers use a detailed mark scheme that has been agreed by senior examiners. This ensuresthat all examiners mark to the same standard. Note that responses which are correct butunusual, and therefore do not appear in the mark scheme, are still awarded marks.
Short answer questions, which are usually worth up to 4 or 5 marks, are point marked. Thismeans that examiners give you a mark for each correct point you make.You must bear this inmind when you are writing your answer, and you should try to make the same number ofdifferent points as there are marks available. Marks are often awarded for using an example, orfor writing a more extended point. If you make a relatively short, simple point, you should try toadd an example or go into more depth.
Long answer questions, which are generally worth 5 marks or more, are marked using levels.These take into account the quality of your written communication skills — your spelling,punctuation, grammar, style, clarity, organisation and correct use of geographical terms.Examiners read your answer and decide which level it is in, then decide on the exact mark withinthat level. Typical levels are shown below:� Level 1 Answers generally contain simple material. The points are stated, but not developed.
The examples used are vague and generalised, such as ‘in the Philippines’. Explanations areweak and often unclear. Geographical terms are used rarely, and there are frequent writtenlanguage errors. The response may not be logical or structured.
16Edexcel AS Geography Questions and answers © Philip Allan Updates

� Level 2 Answers contain more detail and have some structure and logic. The examples showsome depth, but could be developed further. There is more detailed explanation, with someclear reasoning. The answer may be unbalanced, addressing some parts of the question well,but other parts less effectively. Some geographical terms are used and there are a few writtenlanguage errors.
� Level 3 Answers are detailed and supported by ‘real world’ case studies and examples. Thereis depth of knowledge and understanding, but also breadth, which is shown through a rangeof points and examples. The answer is likely to provide an overview and to link differentaspects of the question. It is logical and structured. Geographical terms are used withaccuracy and confidence, and written language errors are rare.
Note that for longer questions worth 15 or 20 marks, there may be four levels in the markscheme.
17Edexcel AS Geography Questions and answers © Philip Allan Updates

18Edexcel AS Geography Questions and answers © Philip Allan Updates
Unit 1 Global challenges
World at risk
Question 1Study Figure 1, which shows climate change impacts on the continent of Africa.
Figure 1 Climate change impacts on the continent of Africa
a Describe the pattern of climate change impacts shown in Figure 1. (3 marks)
b Match the three measures of change to the most appropriate climate change impact, by putting the letters into the table provided. (2 marks)
Table 1 Measures of climate change
(x) Coral bleaching(y) Sea-level rise(z) Spread of malaria
c Explain how the impacts of climate change shown in Figure 1 could lead to a lower quality of life for vulnerable people in Africa. (4 marks)
d Explain how local sustainable strategies might reduce the negative impacts of climate change. (4 marks)
(Total: 13 marks)
(1) Coastal erosion rates
(2) Marine biodiversity losses
(3) Reduced average life expectancy
North Africa
West Africa
Central Africa East Africa
Southern Africa
Indian Ocean islands
N
0
Deforestation and loss of forest quality
Sea-level rise
Coral bleaching
Desertification
Spread of malaria
1000km

Answers to Question 1a � Desertification in a belt from west to east Africa (the Sahel)
� Deforestation in a central belt from coast to coast� Coral bleaching along the eastern coastline� Malaria spread concentrated in southern Africa� Sea-level rise lacks a pattern
e There is 1 mark available for each point, up to a maximum of 3 marks. Try to be preciseabout location, rather than stating ‘in the middle’ or ‘towards the top’.
b
e There are only 2 marks available here, rather than 3. This is because the task is relativelystraightforward.You can get either 1 out of 3 correct, or all 3 correct.
c � Food supply may be reduced, e.g. by extending deserts, destruction of fishinggrounds (coral bleaching), and direct loss of farmland through coastal erosion. Thiscan affect nutrition as well as income.
� People’s health can be affected, e.g. as malaria spreads, and food supply runs short.Reduced fresh water supplies could cause disease to spread and affect people’sability to grow crops.
� Incomes could be reduced, e.g. due to deforested land, loss of resources anddegraded farmland.
� There are also wider implications, such as conflict over resources and migration,which causes further pressure on resources.
e To answer this question, you could either make four distinct points or examine two pointsin depth, using examples and looking for a sequence of events that could lead to a lowerquality of life for vulnerable people in Africa.
d � Afforestation/forest management would help to maintain a key resource; replantingand soil conservation would manage desertification.
� Farming practices could be altered, such as planting drought-resistant crops, andharvesting and storing water.
� Increasing healthcare would help to deal with the malaria threat.� Small-scale energy developments (e.g. micro-hydro/biogas) would provide alternative
fuel sources to wood� NGOs could provide aid/technical help in low income areas.
e Again, basic points will gain 1 mark, and more extended points and examples will gain 2 marks.You should make the focus of your answer Africa, but you could use ideas fromthe rest of the developing world. Named examples would be particularly useful.
(y) sea-level rise
(x) coral bleaching
(z) spread of malaria
(1) Coastal erosion rates
(2) Marine biodiversity losses
(3) Reduced average life expectancy
19Edexcel AS Geography Questions and answers © Philip Allan Updates
Unit 1 Global challengesWorld at risk

Question 2
Study Figure 2, which shows how carbon dioxide emissions savings stack up.
Figure 2 Reducing carbon dioxide emissions
a In which sector of the economy can the greatest savings of carbon dioxide be achieved? (1 mark)
b From the list below, select the two gases that contribute to the enhanced greenhouse effect: (1 mark)
� oxygen� methane� nitrogen oxide� sulphur dioxide� argon
c Using a named example of a renewable energy source, suggest why its development is economically and environmentally controversial. (4 marks)
d Choose two economic sectors other than renewable energy from Figure 2.For each, explain how carbon dioxide emissions could be reduced. (4 marks)
(Total: 10 marks)
Answers to Question 2
a Industry.
e Remember to look carefully at graphs like Figure 2, as it is easy to make a simple mistake.
1980 1990 2000 2010 2020 20300
10
20
30
40
50C
arb
on d
ioxi
de
(bn
ton
nes
)
Industry savings 6.5 bn
Renewable energy 5.1 bn
Savi
ng
s b
y ec
on
om
ic s
ecto
r
Building cuts 4.4 bn
Agriculture savings 3.3 bn
Transport cuts 3.2 bn
Forestry savings 2.7 bn
Waste savings 2.7 bn
Total savings26.4 bn tonnes
43.7 bntonnes
2006:27.3 bntonnes
18.1 bn tonnes
Predictio
n
Year
20Edexcel AS Geography Questions and answers © Philip Allan Updates
Unit 1 Global challengesWorld at risk

b Methane and nitrogen oxide.
c Choices could include wind, solar, biogas, hydroelectric, wave power.A key issue is economic viability, as fossil fuels are still relatively cheap and the
technology used to generate power with them is simple. Some renewable energysources (e.g. solar) are expensive compared to other sources, and some do not have a constant supply (e.g. wind, solar). Some sources are relatively untested (e.g. wave)and others are currently small-scale (e.g. biogas). Land may be lost to some energydevelopments (e.g. hydroelectric, wind), and there are aesthetic objections to others(e.g. wind). Some people fear biodiversity could be harmed by wind turbines orflooding to create reservoirs.
e You will gain 1 mark for a basic point, and 2 marks for a more extended point. Note thatthe question contains two parts (economic and environmental controversies); you mustcover both equally to gain full marks.
d � Agriculture: cut methane emissions by farming fewer cattle or finding alternatives topaddy-field rice; make more efficient use of machinery; farm organically because ithas lower energy inputs, i.e. uses fewer chemical fertilisers and pesticides.
� Transport: use clean energy technologies, such as hybrid or electric cars; makegreater use of public transport; increase taxation on flights to discourage airline use.
� Waste: use methane produced from landfill sites as a fuel source; reduce waste bycutting down on packaging; reuse and recycle products.
� Forestry: reduce deforestation; practise afforestation and sustainable management offorests; recycle paper and cardboard to reduce demand for wood.
� Building: create energy-saving buildings and utilities (e.g. more efficient toilets, waterrecycled within buildings, energy-saving bulbs and grade A efficiency appliances);use recycled materials in construction.
� Industry: cut down on the use of fossil fuels; switch to alternative energy sources; fitscrubbers on power stations.
e You will gain 1 mark for a basic point, and 2 marks for a more extended explanation/useof examples. You should consider all of the economic sectors before choosing two ofthem. Give some thought to which you know most about, and whether you could useexamples for them.
21Edexcel AS Geography Questions and answers © Philip Allan Updates
Unit 1 Global challengesWorld at risk

Question 3
Study Figure 3, which shows global trends in reported natural disasters, 1980–2000.
Figure 3 Global trends in reported natural disasters, 1980–2000
a Which of the three types of natural disaster shown has the strongest upward trendbetween 1980 and 2000? (1 mark)
b Match the three hazards shown in Figure 3 to the most appropriate at-risk area. (2 marks)
Table 3 Hazards and at-risk areas
c Explain how improved data-collection and recording could affect hazard trends, such as those shown in Figure 3. (3 marks)
d Explain the contrasting impacts of cyclones in the developed and developing worlds. (5 marks)
(Total: 11 marks)
Answers to Question 3
a Floods.
e The trend for cyclones is upwards, but it is more variable than that for floods.Earthquakes show no clear trend.
Hazard At-risk area
Low-lying coastal land in the tropics
Urban areas with high building and road density
Mountainous areas close to plate margins
1980 1985 1990 1995 20000
50
100
150Floods
Cyclones
Earthquakes
200
Maj
or d
isas
ters
(rec
ord
ed n
um
ber
)
Year
22Edexcel AS Geography Questions and answers © Philip Allan Updates
Unit 1 Global challengesWorld at risk

b
e Identifying three correct hazards will gain 2 marks, and identifying one correct hazard willgain 1 mark. Note that the question asks for the ‘most appropriate’ hazard — whilecyclones can occur over urban areas, low-lying tropical areas are more at risk from them;flood risk is heightened in urban areas.
c � Technology such as satellites and remote sensing equipment may mean that moreevents are detected.
� Improved databases, such as CRED, mean that more events are recorded so that thequality of hazard data improves.
� As communication improves (e.g. the internet), collecting data from around theworld is now easier than it was in 1980.
e There is 1 mark available for each basic point, and an additional mark for the use ofexamples (such as types of technology or communication). Stating that the trends couldbe caused by a combination of natural variation, human influence and improvedrecording of events would show your understanding.
d � Cyclones in the developing world, in countries such as Bangladesh or Honduras, tendto have high human impacts (injuries and deaths).
� The recovery time in the developing world can be long, for instance if farmland hasbeen flooded. Food production and the basic subsistence economy suffer. Disease isfrequently an issue too.
� In the developed world, economic damage exceeds human impacts because peopleown more property. Insurance claims will be high. Better preparation and evacuationprocedures further reduce direct human impacts.
e This question is a perfect opportunity to use examples of named hurricanes/cyclones(e.g. Bhola, Mitch, Andrew, Katrina) to illustrate your points. Note that the question asksfor contrasting impacts, so you should try to use words such as ‘but’, ‘however’ and ‘incontrast’ in your answer.
Level Marks Descriptor
3 5 A range of clear economic and human contrasts explained, with examples.
2 3–4 Human and economic impacts clearly stated; some examples given.
1 1–2 A few impacts stated.
Hazard
Cyclones
Flooding
Earthquakes
At-risk area
Low-lying coastal land in the tropics
Urban areas with high building and road density
Mountainous areas close to plate margins
23Edexcel AS Geography Questions and answers © Philip Allan Updates
Unit 1 Global challengesWorld at risk

Question 4
Study Figure 4, which shows global risk of mortality and economic loss for all natural hazards.
Figure 4 (a) Global risk of mortality and (b) of economic loss owing to natural hazards
a Compare and contrast the global distribution of mortality risk (i.e. risk of death) andeconomic loss risk from all natural hazards. (10 marks)
b With reference to either the Philippines or California, explain why they are considered to be hazard hotspots. (15 marks)
(b) Risk of economic loss
High
Moderate
Low
Risk
(a) Risk of mortality
24Edexcel AS Geography Questions and answers © Philip Allan Updates
Unit 1 Global challengesWorld at risk

Answers to Question 4a � There are some areas where risk of mortality is low but risk of economic loss is high
(e.g. USA, EU countries). These are areas where hazard management systemsprevent high mortality rates, but cannot prevent loss of property, e.g. from hurricanesor tornadoes.
� In other regions, the reverse is true — the risk of economic loss is low, but the risk of mortality is high (e.g. sub-Saharan Africa). Here, the hazard management systemsand safety nets are virtually nonexistent, so the risk of death is high. Reliance onsubsistence crops makes people extremely vulnerable to drought and famine. Povertymeans that there is little in the way of economic damage.
� In areas where either or both risks are high, hazards are likely to be frequent andpotentially of high magnitude (e.g. earthquakes in Indonesia, hurricanes on the USA’seast coast, floods in India).
� Areas where both risks are high (e.g. China, parts of India and the Brazilian coast)are developing countries that have economic wealth to lose but do not have well-developed hazard protection systems.
� In some areas, the risk for both mortality and economic loss is low. This may be dueto low hazard frequency and magnitude.
Level Marks Descriptor
3 8–10 An accurate comparison across the whole map. Identifies located similarities anddifferences, and comments effectively on these. Uses named examples of hazards toillustrate. Geographical terminology used with accuracy; written language errors arerare.
2 5–7 Some comparison of areas on the map, but not in full. Some similarities anddifferences are identified; commentary is more descriptive. Some geographicalterminology is used with some accuracy; there are some written language errors.
1 1–4 Largely random in nature; identifies a few contrasts of a descriptive nature with littlefurther comment. May lack clarity on terminology such as ‘demography’. There arefrequent written language errors.
e The resource for this question is challenging, as you have to compare the maps. Start inone place (e.g. Europe) and work clockwise around the maps to look for patterns andcontrasts. Use a pen or highlighter to make notes on the map as you do so.This will helpyou to structure your final answer.You will not be able to make an accurate comparisonof the maps simply by glancing at them.
b Both locations are hotspots owing to the combination of natural hazards that mightoccur there, although the risks are different in each location.
Philippines
� Hazards are common. Since the Philippines is on a destructive plate margin, there isvolcanic activity, e.g. the eruption of Mt Pinatubo in 1991. This is damaging, becausevolcanic eruptions generate explosive activity, pyroclastic flows and lahars.
� The Philippines is in a tropical cyclone track; lahars can be mobilised by cyclonesand tropical storms. The young volcanic rock is prone to landslides, which can alsobe mobilised by heavy rain, and perhaps triggered by the frequent earthquakes.
� People’s vulnerability to hazards is high (because of poverty) and the country’scapacity to deal with hazards is typical of the developing world. The Philippines’numerous small islands make dealing with hazards problematic.
25Edexcel AS Geography Questions and answers © Philip Allan Updates
Unit 1 Global challengesWorld at risk

26Edexcel AS Geography Questions and answers © Philip Allan Updates
Unit 1 Global challengesWorld at risk
California
� Since California is on a conservative plate margin, volcanic activity does not occur.However, frequent, unpredictable earthquakes are common (the most severe onesbeing in 1906 and 1989) and potentially destructive in economic terms. Planning andconstruction methods reduce risk, but disaster can still strike and cause manydeaths. Liquefaction is a major problem on the coast.
� The coastline is in the path of tsunamis generated elsewhere in the Pacific.� The arid climate and steep coastal slopes, combined with seasonal rainfall, make the
area prone to flash floods, landslides and fires. This is particularly the case in an El Niño year, when climate norms are reversed.
Level Marks Descriptor
4 13–15 Wide-ranging explanation which refers to a range of hazards, using examples. Linksmade between hazards and risk explained for the chosen location. Geographicalterminology used with accuracy; written language errors are rare.
3 9–12 Some examples used to illustrate hazards in the chosen locations; explanations areclear but links are less common. Some geographical terminology is used with someaccuracy; there are some written language errors of a minor nature.
2 5–8 A general account, unbalanced and focusing on a particular hazard type, usingdescriptive examples. Geographical terminology is used infrequently and sometimesin error; there are some written language errors.
1 1–4 Basic description of one or two hazard events, without reference to the hotspotconcept.There are frequent written language errors.
e This question is on a compulsory case study. You need to learn these case studiesthoroughly, as you will be expected to show detailed knowledge and understanding whenanswering questions about them.

27Edexcel AS Geography Questions and answers © Philip Allan Updates
Question 5
Study Figure 5, which shows a typical UK house and garden in the year 2087.
Figure 5 The 2087 house and garden
a Explain how the house and garden address the challenges of climate change. (10 marks)
b With reference to examples, explain how climate change poses different challenges for different countries. (15 marks)
Answers to Question 5
a � The 2087 house and garden have been built under the assumption that the futureclimate will be warmer and drier.
� Various adaptations have been made to suit the new climate; these include the typesof trees and shrubs planted, the water recycling systems and the south-facingbalcony.
� The house utilises a range of technologies to reduce energy use (e.g. the insulating‘green’ roof and triple glazing) and to exploit renewable energy (solar and windpower). The house and garden contain recycled rubber, soil and other materials;water is also recycled. All of these help to reduce carbon dioxide output.
� The house reflects the new climate and the need to conserve energy and resources,and to minimise waste.
Level Marks Descriptor
3 8–10 Uses the resource in full, with a structured range of detailed explanations related toclimate change futures. Geographical terminology used with accuracy; writtenlanguage errors are rare.
2 5–7 Uses the resource effectively, but not in full.Variable detail and less structure, and theanswer is more of a list at the lower end of the mark band. Some geographicalterminology is used with some accuracy; there are some written language errors.
1 1–4 A few general points related to some aspects of the figure. Lacks any structure. Maylack clarity on terminology.There are frequent written language errors.
Solar panels
‘Green’ roof planted with moss and grasses
Small wind turbine
Balcony facing south
Wall made from compacted soil excavated from pond
Mediterranean trees and shrubs
Patio decking made from recycled materials
Underground tanks: collect rainwater and house waste water for recycling
Triple-glazedwindows
Compost bin
Walls made from 50% recycled rubble
Unit 1 Global challengesWorld at risk

e The resource for this question contains a good deal of text, so make sure you read itcarefully. You need to avoid simply listing each caption from the figure and thenexplaining it. Look for links between the captions, and structure your answer aroundoverall themes.
b � The challenges of climate change are related to the physical nature of countries, theirlevel of development, the availability of technologies, and the types of expectedimpacts.
� Coastal low-lying countries (e.g. Bangladesh, the Netherlands and the Maldives) willface a direct threat from rising sea levels. Both cities and farmland will be affected.
� Mountainous countries (e.g. India, Chile and Peru) may face reduced water supply asglaciers retreat. This could also affect tourism (e.g. skiing).
� Developing countries may face direct threats to farming as climate belts shift. Ifthese countries lack the capital to invest in new technologies, climate change couldpose a threat to human life. Developed countries are more able to adapt (they havethe wealth and technology to do so), but the costs could be high and hard choiceswill have to be made — for instance, whether to spend a greater proportion ofnational budgets on water supply and flood defences.
� The UK may face a more extreme climate, with more frequent gales and flooding, anddrier summers. All of these present challenges to insurers, builders, councils andindividuals. Australia is an example of a country that may be facing a drier climate inthe future, which presents significant challenges for its water supply.
Level Marks Descriptor
4 13–15 A structured response using a range of detailed, contrasting exemplar countries.A number of different challenges are considered; good awareness of the range ofclimate futures. Geographical terminology used with accuracy; written languageerrors are rare.
3 9–12 Some structure and some examples used. More variable detail, but some contrasts aremade. Some geographical terminology is used with some accuracy; there are someminor written language errors.
2 5–8 Response lacks structure. Examples are used but in isolation. Contrasts anddifferences are only implied. Geographical terminology is used infrequently andsometimes in error; there are some written language errors.
1 1–4 Outlines climate impacts for one or two places only.There are frequent writtenlanguage errors.
e Your use of examples in this question is crucial. The question instructs you to useexamples, so you must use a range — three would be ideal.Try to make these contrastingin terms of their level of development, physical geography and climate change impacts.
28Edexcel AS Geography Questions and answers © Philip Allan Updates
Unit 1 Global challengesWorld at risk
Going global
Question 6
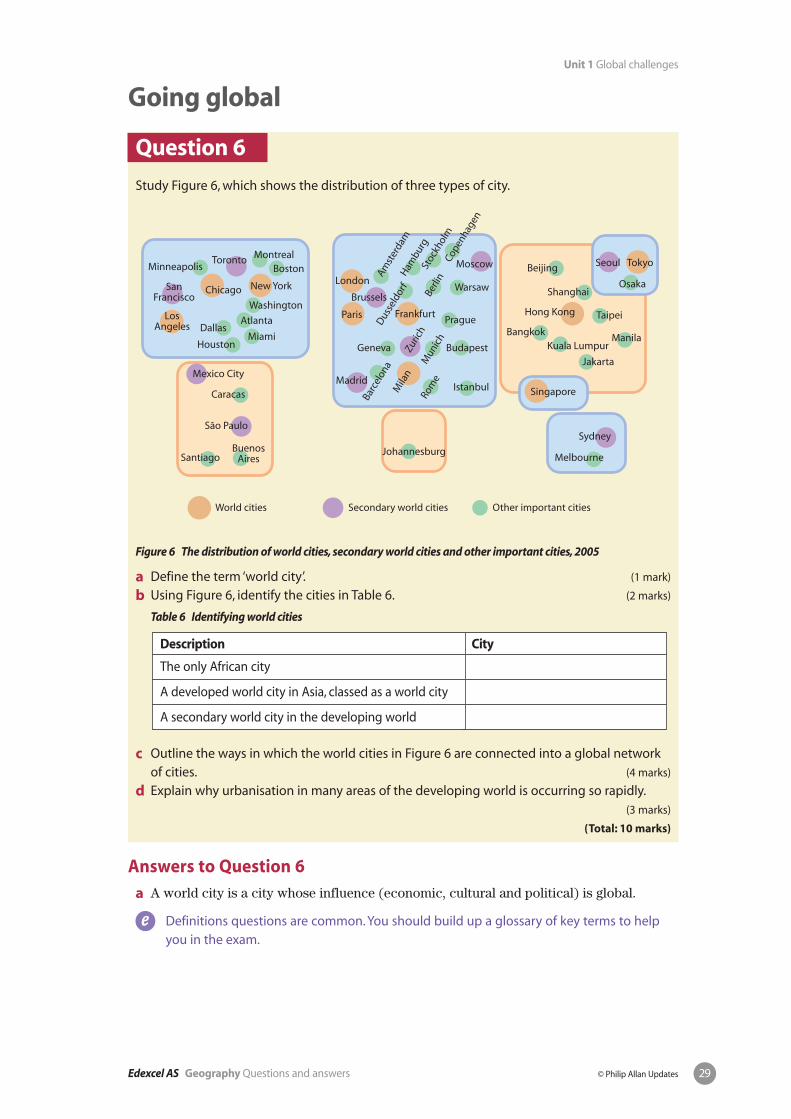
Study Figure 6, which shows the distribution of three types of city.
Figure 6 The distribution of world cities, secondary world cities and other important cities, 2005
a Define the term ‘world city’. (1 mark)
b Using Figure 6, identify the cities in Table 6. (2 marks)
Table 6 Identifying world cities
c Outline the ways in which the world cities in Figure 6 are connected into a global networkof cities. (4 marks)
d Explain why urbanisation in many areas of the developing world is occurring so rapidly.(3 marks)
(Total: 10 marks)
Answers to Question 6
a A world city is a city whose influence (economic, cultural and political) is global.
e Definitions questions are common. You should build up a glossary of key terms to helpyou in the exam.
CityDescription
The only African city
A developed world city in Asia, classed as a world city
A secondary world city in the developing world
SanFrancisco
Mexico City
BuenosAires
Caracas
Santiago
World cities Secondary world cities Other important cities
São Paulo
Madrid
Geneva
Paris
London
Brussels
Frankfurt
Minneapolis
LosAngeles
Chicago New York
BostonMontrealToronto
Washington
MoscowCope
nhag
en
Stoc
khol
m
Ham
burg
Amst
erda
m
Berli
n
Dus
seld
orf
Barc
elon
a
Zuric
h
Mila
n
Rom
eM
unic
h
Warsaw
Prague
Budapest
Istanbul
Johannesburg
Singapore
TokyoSeoulBeijing
Shanghai
Hong Kong
BangkokKuala Lumpur
Taipei
Manila
Jakarta
Osaka
Melbourne
Sydney
Atlanta
MiamiHouston
Dallas
29Edexcel AS Geography Questions and answers © Philip Allan Updates
Unit 1 Global challenges

b
e There is 1 mark for each correct answer. The resource for this question is a simple map,with one colour for the developing world and one for the developed world. You mightnot have spotted this at first glance. Remember to look at resources carefully, and, ifnecessary, several times.
c � World cities are connected by financial markets, such as the stock exchanges inLondon, New York and Tokyo, whose opening times overlap.
� Transnational company headquarters are often located in world cities, with keyregional offices located in other world cities. Key workers move between the citiesfrequently.
� The cities all have major airport hubs, and are connected directly to many otherworld cities by non-stop flights.
� Internet and satellite connections ensure cheap, rapid communication betweencities.
e You will gain 1 mark for a basic point, and 2 marks for an extended point or example.Thistype of question cries out for the use of examples, so try to name cities, stock exchanges,airlines and transnational companies to add weight to your answer.
d The urbanisation process is made up of two growth elements:� Rural–urban migration has a significant impact, and is often said to account for about
40% of growth. People are pushed from rural areas and pulled towards urban areas.Many of the reasons for this are economic.
� Within cities, internal growth occurs as a result of high birth rates, which are fuelledby a young immigrant population.
e There is 1 mark for a basic point, and 2 marks for an extended point (such as thepercentages) or example (for instance naming a developing world city). Both reasons —migration and internal growth — are required to gain maximum marks.
City
Johannesburg
Tokyo or Singapore
Mexico City or São Paulo
Description
The only African city
A developed world city in Asia, classed as a world city
A secondary world city in the developing world
30Edexcel AS Geography Questions and answers © Philip Allan Updates
Unit 1 Global challengesGoing global

Question 7
Study Figure 7, which shows the location of the highest concentration of post-accession eastEuropean migrants in the UK, 2006.
Source: ONS population trends, No. 129
Figure 7 The location of the highest concentration of post-accession east European migrants in
the UK, 2006
a Give an example of a likely source country for these migrants. (1 mark)
b Which one of the following types of migration does Figure 7 show? (1 mark)
� retirement migration� environmental refugees� economic migration� asylum seekers
c Briefly describe the location pattern of the highest concentration of migrants. (4 marks)
d Explain why many of the eastern European migrants are located in rural areas (4 marks)
(Total: 10 marks)
Areas of highest concentration of east European migrants as percentage of population
Edinburgh
Newcastle
Hull
Norwich
London
Birmingham
Cardiff
Liverpool
Manchester
Glasgow
31Edexcel AS Geography Questions and answers © Philip Allan Updates
Unit 1 Global challengesGoing global

Answers to Question 7
a Any one of: Latvia, Lithuania, Estonia, Poland, Czech Republic, Slovakia, Hungary andSlovenia.
e You will gain 1 mark from naming any one of the east European countries that joined theEU in 2004; Bulgaria and Romania cannot be accepted.
b Economic migration.
c � Migrants can be found throughout the UK. They are not concentrated in oneparticular location or region.
� Some of the areas with the highest number of migrants are cities, e.g. London, Cardiffand Birmingham.
� The northern parts of Scotland have high numbers of migrants, as do some otherrural areas, such as the Wash in East Anglia and the Midlands (Hereford andWorcester).
� There are some isolated pockets containing high numbers of migrants, such as theextreme west of Cornwall and west Wales.
e You will gain 1 mark for each accurate location given, plus 1 mark for the overall patterndescribed. Note that you are only asked to describe, not to explain, so take care not todrift into giving reasons.You will not gain any marks for doing so.
d � As these are economic migrants, they move to where jobs are available:� Many work in low-paid jobs linked to the farming industry, e.g. fruit and vegetable
picking or food processing. In the Highlands of Scotland many work as fishprocessors. The work is relatively low skilled and does not require language skills.
� The jobs in rural areas may be familiar; migrants might have done similar work intheir home countries.
� These jobs are generally available because the host population does not want to dothem.
� As the migrants are white Europeans, they may feel more comfortable in rural areasthan other migrant ethnic groups.
e You will gain 1 mark for each valid explanation and 2 marks for a more extendedexplanation which could use an example or explain a point in more depth.With shorterquestions which are point-marked, rather then level-marked, it is usual to be able to gain2 marks in this way.When answering a question like this, it is important that you read youranswer quickly to check that you have made four points, or at least two extended points.
32Edexcel AS Geography Questions and answers © Philip Allan Updates
Unit 1 Global challengesGoing global

Question 8
Study Figure 8, which shows Toyota’s global manufacturing operation.
Figure 8 Toyota’s global manufacturing operation
a Toyota is a car manufacturing transnational company (TNC). Give two characteristics of a TNC. (2 marks)
b In which continent does Toyota have the lowest presence? (1 mark)
c Explain briefly the role of technology in helping to connect Toyota’s global manufacturingnetwork. (3 marks)
d Outline the possible costs and benefits to developing countries when TNCs locate factories there. (6 marks)
(Total: 12 marks)
Answers to Question 8a Two from:
� company has global network/reach� large in terms of number of staff and turnover� present in many markets — a global brand� often involved in many market sectors
e You will gain 1 mark for each valid characteristic.
b Africa.
c � Communications technology (e.g. internet, satellites) allows Toyota’s head office tocommunicate with suppliers and branch plants, as well as customers.
� The global airline network allows people and small parts to be moved rapidlybetween locations.
� Shipping and ports (containers) are crucial for moving parts and final products tofactories and markets.
� The media, which are also global, help to maintain the company’s presence andbrand around the world.
50 plants in 26 countries264,000 employeesSells in 140 countries7 million vehicles per year
33Edexcel AS Geography Questions and answers © Philip Allan Updates
Unit 1 Global challengesGoing global

e You will gain 1 mark for each valid point linked to a technology (of any type), and 2 marksfor an extended point/use of an example. Most candidates would probably give theinternet as their answer; you need to go beyond this and think about other technologiesin transport and communication to get 3 marks.
d ‘Benefits and costs’ can be social, economic and environmental, as follows.
e Marks would be awarded as follows:
Level Marks Descriptor
3 5–6 A balance of costs and benefits, plus a range of impacts rather than a narrow focus;many examples used.
2 3–4 Less balance; may focus on one or two areas only, but there is some range of validpoints.
1 1–2 Unbalanced; one or two (probably very negative) points only.
Costs
Jobs may involve long workinghours and hard work.Traditional working patternsand family structures can belost.
Jobs may be low paid.Parts could be shipped in fromother countries, so spin-offlinks are limited.The company may move ascosts rise.
Factories may be set up with little regard for the environment,and may increase local pollutionlevels.
Benefits
As incomes grow, wealth canbring benefits in terms of housing, health and education.
Factories provide jobs; theymay also have spin-offs such aslocal parts suppliers.
Redevelopment of areas mayoccur to attract foreign businesses.
Social
Economic
Environmental
34Edexcel AS Geography Questions and answers © Philip Allan Updates
Unit 1 Global challengesGoing global

Question 9
Study Figure 9, which shows the global pattern of internet users.
Figure 9 Global distribution of internet users, 2007
a Give reasons for the global pattern of internet users shown. (10 marks)
b Explain some of the possible effects of globalisation on the lives of people living in poorercountries. (15 marks)
Answers to Question 9
a � Internet use is shown as the number of people using the internet in each country. It istherefore related to population.
� The highest numbers of users are in the USA (135 million) and the EU countries;these are the wealthiest nations, where computers are common and internetconnection is relatively cheap.
� These developed nations have access to technology and an extensive telecommunica-tions infrastructure. Consumers increasingly use the internet.
� Trade and business is dominated by the developed world; many internet users arelikely to be businesses and transnational companies.
� Internet use is relatively high in the rapidly developing newly industrialisingcountries (e.g. China, India and Brazil), as their economies are growing. Globalisationis strongly linked to internet use.
� In most of Africa, poverty and lack of infrastructure, as well as possibly a lack ofeducation, prevent widespread internet use. The continent is largely ‘switched off’.
� Some countries, such as China, Burma and North Korea, may deliberately discourageinternet use for political reasons.
Top 15 nations (numbers show millions of users)
Internet use growing
Internet use rare
10.6
11.6
5.29.0
17.95.4
19.1
8.1
15.8
6.6
14.826.9
6.5
135.7
15.2
35Edexcel AS Geography Questions and answers © Philip Allan Updates
Unit 1 Global challengesGoing global

Level Marks Descriptor
3 8–10 A wide range of reasons linked to technology, wealth and globalisation.The responseis structured, and ranges across the whole map. It uses examples and appropriategeographical terminology to show understanding. Minimal written language errors.
2 5–7 Some structure.A narrower range of reasons, perhaps focused on wealth more thanother factors.Covers different parts of the map but not in full.Becomes descriptive at thelower end but with some geographical terminology used.Some written language errors.
1 1–4 Little structure. Describes some uses of the internet without any real reference togeographical context or use of terminology. Frequent written language errors.
e World maps are common resources in exams. It is important to note whether you arebeing asked to describe the pattern, explain it, or both. In this example you have toexplain the pattern, but to do so successfully some description is inevitable. The bestanswers will quote data from the map.They will also use examples from the whole map,not just one part of it.
b The effects could be economic, social, environmental, cultural or political:� Positive effects of globalisation could be people having stable jobs and regular wages
while working for transnational companies, and the general benefits of urban living(education and healthcare). Many globalising countries have moved towards having ademocratic government.
� Negative effects of globalisation are that it can lead to poor conditions in urbancentres and exploitation of workers (e.g. long hours, lack of unions), environmentalproblems such as poor urban air quality in rapidly industrialising cities, and industrialdisasters such as Bhopal and Harbin. Major cultural changes can occur, for instancethe loss of traditions and the change to a more Western lifestyle and diet.
� The phrase ‘lives of people’ invites a consideration of who these people are so thisquestion encourages critical thinking. Are the lives of rural–urban migrants in poorcountries improved as a result of working for globalising TNCs, as opposed to a life ofsubsistence agriculture? Expect some consideration of these points at Levels 3 and 4.
Level Marks Descriptor
4 13–15 Structured, detailed account of a range of ways in which societies or social groups arechanged by globalisation over time. Uses appropriate terms and examples to showunderstanding. Likely to be evaluative in style.Written language errors are rare.
3 9–12 Structured analysis of the positive and negative effects of globalisation, but with lessbalance. Answer has variety (it either gives a range of effects or looks at differentgroups of people) and uses some examples with appropriate geographicalterminology to show understanding. Minimal written language errors.
2 5–8 Some structure. Makes the case that globalisation has largely positive or negativeeffects. Likely to lack range. May focus on urban effects of economic development orquality of life working for TNCs. Descriptive, but with some geographical terminologyused. Some written language errors evident.
1 1–4 Little structure.Describes one or two real or imagined changes without any real referenceto geographical context or use of terminology.Frequent written language errors.
e This question contains a potential trap, as it uses the key word ‘effect’. ‘Effects’ can bepositive or negative.This is also true of ‘impacts’. In the pressure of the exam, impacts andeffects are often seen as only negative, and this leads to unbalanced answers. Beware of making this mistake. With a longer question such as this, you have the opportunity to be evaluative — you could provide an overview at the end of your answer that brieflyconsiders whether the positives outweigh the negatives.
36Edexcel AS Geography Questions and answers © Philip Allan Updates
Unit 1 Global challengesGoing global

Question 10
Study Figure 10, which shows the results of a global survey by Zurich Insurance, 2007.One thousand people around the world were asked to state the population concern theythought would most affect our lives in the future.
Figure 10 Results of a global survey on population concerns, 2007
a Suggest reasons for the order of concerns in the survey results. (10 marks)
b Using examples, examine some of the economic and social consequences of recentmigrations within Europe. (15 marks)
Answers to Question 10
a � The survey results highlight an ageing population as the main concern, withmigration a close second. Birth rates rank as the lowest concern; healthcare is amoderate concern and might be linked to the issue of an ageing population.
� An ageing population is a concern because it leads to increased dependency levels,which leads to high healthcare/residential-care demands and costs (e.g. in the NHS).There is the possibility of skills shortages as the younger workforce shrinks, andincreases in the tax burden for the working population to pay for pensions and care.
� Changing services bring opportunities but also problems. People could beconcerned that their pensions will be too small. Strong candidates may link ageing tohealthcare.
0
5
10
15
20
25
30
35
Ageingpopulation
Migration Healthcare Birth rates
%
32%
28%
23%
17%
37Edexcel AS Geography Questions and answers © Philip Allan Updates
Unit 1 Global challengesGoing global

� Migration is second in the order of concerns because of the high costs of managing it(e.g. border controls) and fears of culture clashes due to lack of integration. Otherpossibilities include cheap migrant labour taking the host population’s jobs and thehigh costs of providing services (e.g. because of a high birth rate among immigrants).The position of migration as a lesser concern than an ageing population might beexplained by the perceived benefits it brings.
� Birth rates is a low concern; a low birth rate may be perceived in a positive way as itslows population growth, thus relieving pressure on resources. Some candidatesmight question the results of the survey, as a higher birth rate might reduce theproblem of an ageing population. Answers may focus on high birth rates being aproblem in the developing world.
Level Marks Descriptor
3 8–10 Structured, detailed account across the range of data, which is likely to be quoted butnot described. Range of reasons, including why birth rates is a lesser concern, andthese are exemplified. Better candidates will link ageing to healthcare concerns.Addresses the idea of ‘order of concerns’. Geographical terminology used withaccuracy; written language errors are rare.
2 5–7 Some structure. Some description but the answer does suggest reasons. Likely tofocus on ageing concerns and migration; somewhat unbalanced and may drift into amigration rant at the lower end. Some geographical terminology is used with someaccuracy; there are some written language errors.
1 1–4 No real structure; likely to describe the survey results and point out differences.Reasons, if present, are unclear. May lack clarity on terminology such as ‘demography’.There are frequent written language errors.
e This question contains the idea of ‘order of concerns’. To achieve Level 3, you need toexplain why some concerns are higher priorities for some people compared to others.
b � Answers should focus on movements within Europe, not migration into Europe.Examples include Poles and Czechs moving to the UK.
� For the host country, migrants fill a skills gap (e.g. plumbers) but also take low paid,unsociable jobs that are shunned by the host population (e.g. in the hotel industryand farming). Fears might be expressed that this depresses wages and puts othersout of work. The grey economy might lead to exploitation of migrants. Some areashave large concentrations of new migrants and little infrastructure to cope with this(e.g. Norfolk, western Scotland), so cultural tensions may emerge.
� For source countries, the negatives are a loss of skilled workers — usually youngpeople — which could alter dependency ratios and lead to an ageing population. Thepositives include remittances and reduced unemployment. Migrants’ skills could bedeveloped abroad and taken back home, thus benefiting the source country in thelong run.
� Migration of retired people to Mediterranean countries could be seen as economicallypositive for source countries (e.g. in the UK, care costs are lower and housing is freedup), or as economically negative (e.g. income is spent abroad). Social consequencesinclude a loss of family structure and the experience of older people.
� Host countries might worry about the migration of retired people overheating thehousing market, leading to a lack of affordable housing for local people. Concernshave also been expressed about sprawling ex-pat enclaves containing people who failto integrate with the local community. The costs of care and social infrastructure forthese people may be passed on to the host country.
38Edexcel AS Geography Questions and answers © Philip Allan Updates
Unit 1 Global challengesGoing global

Level Marks Descriptor
4 13–15 Structured, detailed examination with balance between economic and social factors.Has both positives and negatives for host and source countries, and illustrates eachwith examples. Geographical terminology used with accuracy; written languageerrors are rare
3 9–12 Some structure, in an account with some detail; there is a balance between economicand social consequences and some recognition of both positives and negatives;illustrated with examples. Some geographical terminology is used with someaccuracy; there are some written language errors of a minor nature.
2 5–8 Some examples given in an account with limited structure. Answer unbalanced andmay see the negative side only, but has some consequences. Recognises several typesof migration but descriptive. One example done well can be awarded a maximum 8 marks. Geographical terminology is used infrequently and sometimes in error; thereare some written language errors.
1 1–4 Descriptive account of migrations with no structure and one or two impacts. May lackclarity on terminology such as ‘social’ and ‘economic’. There are frequent writtenlanguage errors.
e Remember that ‘consequences’, like ‘impacts’ and ‘effects’, can be both positive andnegative.This question has a clear structure, which you could sketch out in your plan toensure that you cover all parts:� positive consequences for source countries� negative consequences for source countries� positive consequences for host countries� negative consequences for host countries
39Edexcel AS Geography Questions and answers © Philip Allan Updates
Unit 1 Global challengesGoing global

40Edexcel AS Geography Questions and answers © Philip Allan Updates
Unit 2 Geographical investigations
Extreme weather
Question 11Study Figure 11, which is a concept diagram illustrating ‘extreme weather’.
Figure 11 Local weather in the UK
a Why is the concept of ‘extreme weather’ difficult to define? (10 marks)
b Describe and explain the fieldwork and research you have used when completing yourpersonal weather diary. (15 marks)
c With reference to examples, examine the causes of risks presented by river flooding in the UK. (10 marks)
Very extreme — disastrous
Very extreme — disastrous
Extreme — hazardous
Extreme — hazardous
Noteworthy — potentially hazardous
Noteworthy — potentially hazardous
Not hazardousRange of normal variation
Ab
ove
ave
rag
eB
elo
w a
vera
ge
Time
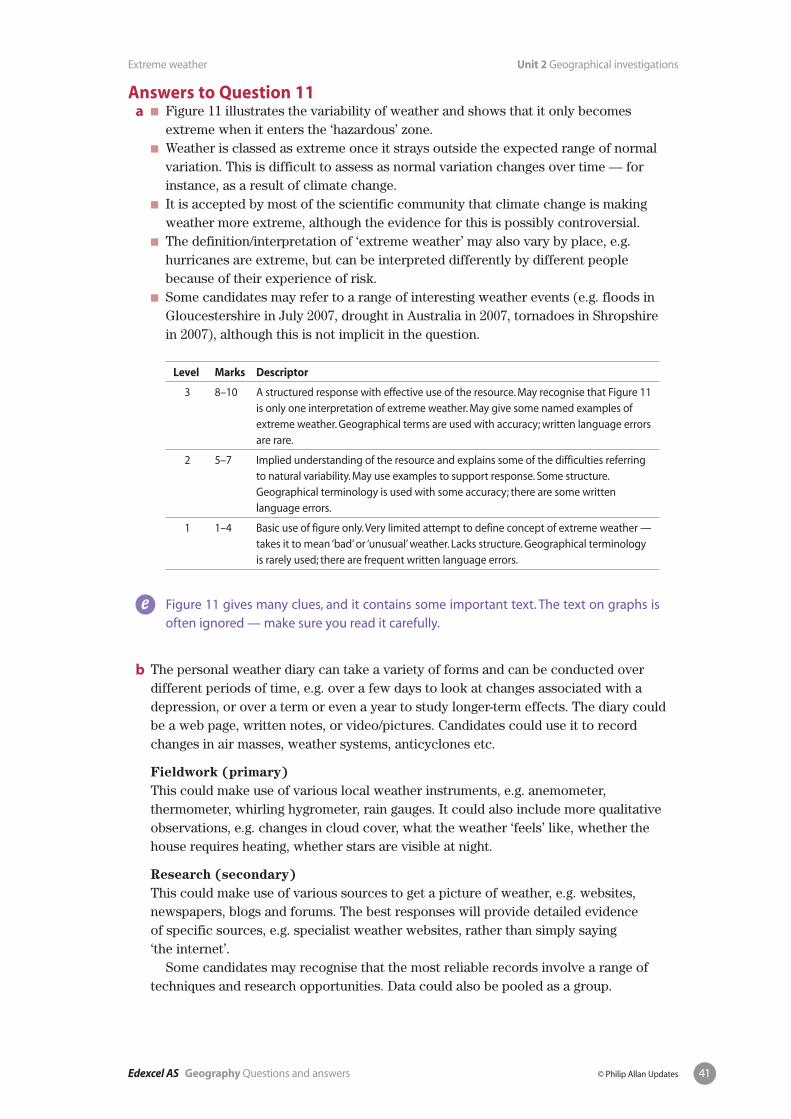
Answers to Question 11a � Figure 11 illustrates the variability of weather and shows that it only becomes
extreme when it enters the ‘hazardous’ zone.� Weather is classed as extreme once it strays outside the expected range of normal
variation. This is difficult to assess as normal variation changes over time — forinstance, as a result of climate change.
� It is accepted by most of the scientific community that climate change is makingweather more extreme, although the evidence for this is possibly controversial.
� The definition/interpretation of ‘extreme weather’ may also vary by place, e.g.hurricanes are extreme, but can be interpreted differently by different peoplebecause of their experience of risk.
� Some candidates may refer to a range of interesting weather events (e.g. floods inGloucestershire in July 2007, drought in Australia in 2007, tornadoes in Shropshire in 2007), although this is not implicit in the question.
Level Marks Descriptor
3 8–10 A structured response with effective use of the resource. May recognise that Figure 11is only one interpretation of extreme weather. May give some named examples ofextreme weather. Geographical terms are used with accuracy; written language errorsare rare.
2 5–7 Implied understanding of the resource and explains some of the difficulties referringto natural variability. May use examples to support response. Some structure.Geographical terminology is used with some accuracy; there are some writtenlanguage errors.
1 1–4 Basic use of figure only.Very limited attempt to define concept of extreme weather —takes it to mean ‘bad’ or ‘unusual’ weather. Lacks structure. Geographical terminologyis rarely used; there are frequent written language errors.
e Figure 11 gives many clues, and it contains some important text. The text on graphs isoften ignored — make sure you read it carefully.
b The personal weather diary can take a variety of forms and can be conducted overdifferent periods of time, e.g. over a few days to look at changes associated with adepression, or over a term or even a year to study longer-term effects. The diary couldbe a web page, written notes, or video/pictures. Candidates could use it to recordchanges in air masses, weather systems, anticyclones etc.
Fieldwork (primary)
This could make use of various local weather instruments, e.g. anemometer,thermometer, whirling hygrometer, rain gauges. It could also include more qualitativeobservations, e.g. changes in cloud cover, what the weather ‘feels’ like, whether thehouse requires heating, whether stars are visible at night.
Research (secondary)
This could make use of various sources to get a picture of weather, e.g. websites,newspapers, blogs and forums. The best responses will provide detailed evidence of specific sources, e.g. specialist weather websites, rather than simply saying ‘the internet’.
Some candidates may recognise that the most reliable records involve a range oftechniques and research opportunities. Data could also be pooled as a group.
41Edexcel AS Geography Questions and answers © Philip Allan Updates
Unit 2 Geographical investigationsExtreme weather

Level Marks Descriptor
4 13–15 Structured account that uses a balanced and wide range of fieldwork and researchtechniques. Likely to appreciate that the diary can take a variety of forms and isessentially a personalised record completed over time. Shows good use of ownfieldwork. Geographical terms are used with accuracy; written language errors arerare.
3 9–12 Explains a range of fieldwork and research approaches, but may lack balance.Response shows some structure. Makes reference to own fieldwork. Geographicalterminology is used with some accuracy; there are some written language errors.
2 5–8 Somewhat descriptive style, but with some clear statements as to either fieldwork orresearch approaches. Likely to be lacking balance. Expect limited use of terminology.Geographical terminology is used with some accuracy; there are some writtenlanguage errors.
1 1–4 Very descriptive ‘we did this’ approach, with little or no acknowledgement of apersonal approach. Very limited range of fieldwork and research described. Lacksstructure. Geographical terminology is rarely used; there are frequent writtenlanguage errors.
e Questions on your own fieldwork give you the opportunity to shine by using your ownexamples. Make sure you do not neglect your fieldwork notes, packs and books whenrevising. Fieldwork forms a key part of this unit and cannot be ignored.
c � Flooding can be defined in terms of physical impact (i.e. the inundation of land notnormally covered by water) or economic impact. Candidates may also refer todifferent types of flood, e.g. high-risk flash versus more predictable riverine flood.
� Different flood events will have different causes, although they will be associated withextreme precipitation (either in terms of intensity or duration) or rapid snowmelt.
� Another significant cause is the state of the ground before rainfall and antecedentconditions, which can raise risk.
� Cause and risk are also closely associated with human activities, e.g. development onfloodplains increases runoff and therefore the risk of flash flooding.
� Some candidates will distinguish between long-, medium- and short-term causes, e.g.climate change, a wet summer (like that of 2007) and severe storms.
� A range of UK examples can be used, e.g. the 2007 Gloucestershire floods, Boscastlein 2004 and Carlisle in 2005.
Level Marks Descriptor
3 8–10 A structured response with a genuine examination of the causes. Uses a contrastingrange of examples that are well selected and detailed. Recognises both human andphysical causes and links these to degree of risk. Geographical terms are used withaccuracy and written language errors are rare.
2 5–7 Some structure, but the response is descriptive rather than an examination. Makesreference to some examples and some reference to cause. Geographical terminologyis used with some accuracy; there are some written language errors.
1 1–4 Very limited focus.Tends to describe a limited range of flood events. Lacks detail andstructure. Geographical terminology is rarely used; there are frequent writtenlanguage errors.
e Note that this question does not simply ask ‘using examples, describe some floods’.Beware of drifting into a description of your case studies. Instead, look back constantly tothe question to make sure you are applying your facts to it.
42Edexcel AS Geography Questions and answers © Philip Allan Updates
Unit 2 Geographical investigationsExtreme weather

Crowded coasts
Question 12
a Describe and justify how you would plan the fieldwork and research to investigate thegrowth of a coastal resort. (15 marks)
b Study Figure 12, which shows the standard of coastal flood defences in the HumberEstuary. Using the figure, suggest reasons why coastal flood risk may increase in theHumber Estuary over the next 50 years. (10 marks)
Source: Humber Estuary Shoreline Management Plan (2006)
Figure 12 The standard of coastal flood defences in the Humber Estuary
c For a stretch of coastline you have studied, discuss the strengths and weaknesses of variouscoastal management strategies. (10 marks)
Answers to Question 12
a � Ideally, you should refer to your own fieldwork and research, as well as other namedcoastal resorts.
Coastal protection
Hull
Scunthorpe
Doncaster
Goole
Selby
Grimsby
Hull
Scunthorpe
Doncaster
Goole
Selby
Grimsby
Humber Estuary
Spurn Head
Humber Estuary
Spurn Head
0 km 10
SatisfactoryUnsatisfactoryBuilt-up area
N
(a) 2006
(b) 2056
43Edexcel AS Geography Questions and answers © Philip Allan Updates
Unit 2 Geographical investigations

� Research relating to growth might include using census data to identify populationtrends, plus old photographs and sequences of aerial photographs and OS maps toshow patterns of growth over time. Planning records could indicate the growth ofbusinesses and residential areas.
� Land-use mapping could be used to indicate growth by showing the ages of buildingsand types of development. Historic land-use maps could be compared to your ownmapping. Visitor surveys and questionnaires could be used to investigate localpeople’s opinions of growth and changes over time.
Level Marks Descriptor
4 13–15 Detailed programme with reference to fieldwork and research, linked to realexamples. Reasons for data collection are explained and linked to growth.Geographical terms are used with accuracy and show understanding; writtenlanguage errors are rare.
3 9–12 Some details from both research and fieldwork, but more unbalanced. Somereference to real examples, although less explanation. Geographical terminology isused with some accuracy; there are some written language errors.
2 5–8 Descriptive of some research and fieldwork, but less depth and more hypothetical.Geographical terminology is occasionally used; there are some written languageerrors.
1 1–4 A few fieldwork and research ideas only, with little realism. Geographical terminologyis rarely used; there are frequent written language errors.
e For a question that invites you to discuss you own fieldwork, try to avoid writing in thefirst person (‘I went to Hornsea, and I…’), as it is informal. Instead, write in a less personalway: ‘On a recent field visit to Hornsea, land-use mapping of the resort was completed…’
b � Some flood defences that are satisfactory now will be unsatisfactory in 50 years time,e.g. those west of Spurn Head, southeast of Grimsby and around Goole.
� Gaps in what are currently satisfactory flood defences will have appeared in 50 yearstime, e.g. around Immingham and southeast of Hull. This will weaken the flood-defence system as a whole.
� Sea levels are likely to rise over the next 50 years, putting pressure on existingdefences and increasing the risk of flooding.
� If defences remain as they are, their condition will have deteriorated in 50 years time.� Weather patterns may change, for instance bringing an increased frequency of strong
gales, due to global climate change. � Coastal populations may increase, putting more people and businesses at risk.
Level Marks Descriptor
3 8–10 Clear and accurate use of the figure, linked to a range of reasons and risk.Geographical terms are used with accuracy; written language errors are rare.
2 5–7 Some use of the figure. Several ideas on increasing risk but less depth and moreunbalanced. Geographical terminology is used with some accuracy; there are somewritten language errors.
1 1–4 Largely one idea, with limited use of the figure. Geographical terminology is rarelyused; there are frequent written language errors.
44Edexcel AS Geography Questions and answers © Philip Allan Updates
Unit 2 Geographical investigationsCrowded coasts

e To answer this question, you must compare the two maps in the figure. Use the placenames in your answer, as well as compass directions, to indicate to the examiner whichpart of the map you are referring to.
c � Many stretches of the UK coastline could be used to answer the question, e.g.Christchurch Bay, Holderness and north Norfolk.
� Coastal management strategies range from ‘do nothing’, through ‘managed retreat’, to‘hold the line’ that involves engineering of some sort. Cost–benefit analysis iscommonly used to determine which strategy should be used.
� The ‘do nothing’ options may be cheap, but often cause conflict with landowners,residents and businesses, and may result in compensation claims. While ‘natural’,they do involve risk and could potentially result in a hazardous coastal zone.
� Managed retreat gives residents time to adjust and allows plans to be made forrelocating them. However, this can incur costs, and some people may be unhappywith the relocation plans. This strategy often involves using natural buffers such assand dunes and salt marshes, and this can increase biodiversity value.
� ‘Hold the line’ options are costly: hard engineering is expensive and intrusive; ‘softer’options such as beach nourishment often require repeated implementation; localpopulations are likely to be satisfied, but defences have to be paid for by someone.Engineering often interferes with the sediment cell, so problems may be createdelsewhere.
Level Marks Descriptor
3 8–10 Uses detailed examples and a clear assessment of strengths and weaknesses for arange of strategies. Geographical terms are used with accuracy; written languageerrors are rare.
2 5–7 Less use of examples; some assessment, but unbalanced. Some range of strategies.Geographical terminology is used with some accuracy; there are some writtenlanguage errors.
1 1–4 Likely to focus on one strategy, and unbalanced in terms of strengths andweaknesses. Geographical terminology is used rarely; there are frequent writtenlanguage errors.
e This question lends itself to annotated diagrams, particularly those showing how somecoastal defences, such as groynes, interfere with longshore drift. You could alsocomplete a quick sketch map of your chosen example.
45Edexcel AS Geography Questions and answers © Philip Allan Updates
Unit 2 Geographical investigationsCrowded coasts

Unequal spaces
Question 13
a Outline a range of primary survey techniques that can be used to investigate inequality.Comment on their relative advantages and disadvantages. (15 marks)
b Study Figure 13, which shows contrasting deprivation profiles for an urban area and a ruralarea. Identify the key differences in the profiles. For one of the indicators shown, discussother possible sources of secondary research information. (10 marks)
Source: Office for National Statistics 2007
Figure 13 Contrasting deprivation levels for an urban area and a rural area
c With reference to either one named rural area or one named urban area, evaluate thesuccess of different schemes in reducing inequality. (10 marks)
Answers to Question 13
a � A range of primary survey techniques can be used, such as environmental quality,built environment/building quality, and neighbourhood surveys.
� These are often best done comparatively — for instance, in two contrasting wards orstreets.
� Services could be mapped using land-use maps. Transport accessibility could beassessed to determine access to healthcare, banks or parks.
� Questionnaires could be sent to residents asking for their opinions about localservices (i.e. whether they are improving or declining). Rural and urban areas couldbe studied and compared.
Incomedeprivation
Totaldeprivation
Urban Rural
Least Most Least Most
Employmentdeprivation
Healthdeprivation
Educationdeprivation
Barriers to housing and services
Crime
Living environmentdeprivation
46Edexcel AS Geography Questions and answers © Philip Allan Updates
Unit 2 Geographical investigations

� The design of a suitable questionnaire is crucial, and difficult. Inaccurate results canbe produced by the influence of people’s perceptions, and as a result of askingleading questions. However, questionnaires can reveal patterns that would otherwiseremain hidden.
� Environmental surveys also involve judgements, and may not be comparable. Land-use and service mapping is accurate, but has to be done carefully (i.e. including theground floor and first floor). Some services that are mobile could be missed.
Level Marks Descriptor
4 13–15 A range of appropriate primary surveys described in some depth and linked toinequality. Advantages and disadvantages are stated clearly. Geographical terms areused with accuracy and show understanding; written language errors are rare.
3 9–12 Some surveys described in variable depth; implied link to inequality. Advantages/disadvantages are present but may be unbalanced. Geographical terminology is usedwith some accuracy; there are some written language errors.
2 5–8 Some surveys described accurately, but link to inequality not made clear. May pointout disadvantages only. Geographical terminology is occasionally used; there aresome written language errors.
1 1–4 A few ideas on primary surveys; may drift into secondary data. Geographicalterminology is rarely used; there are frequent written language errors.
e Make sure you fully understand the difference between primary data collection andsecondary research sources.
b � In terms of total deprivation, urban areas are significantly worse off than rural areas. � In economic measures (income and employment) and some social measures (health
and education), urban areas are much more deprived than rural areas.� The largest difference is in crime, which is very low in rural areas, and at the
maximum in urban areas.� Barriers to housing and services is the highest indicator of deprivation in rural areas,
and the lowest indicator in urban areas. This suggests a significant differencebetween rural and urban areas.
� In urban areas living environment deprivation is high, whereas in rural areas this ismoderate.
� The census could be used to examine economic indicators of deprivation further, ascould the Multiple Deprivation Index. Crime statistics could also be used.
Level Marks Descriptor
3 8–10 Structured response identifying key differences with accuracy. Several secondary datasources are suggested, and linked to the chosen indicator. Geographical terms areused with accuracy; written language errors are rare.
2 5–7 Less structure; may provide an accurate list of differences. Some suggestion ofsecondary sources, but less depth. Geographical terminology is used with someaccuracy; there are some written language errors.
1 1–4 Points out one or two differences; may suggest the census for second part.Geographical terminology is rarely used; there are frequent written language errors.
e This question has two parts. Always read questions carefully and use a highlighter tomark double command words (in this case ‘identify’ and ‘discuss’), and to make sure youdo not miss key parts of the question.
47Edexcel AS Geography Questions and answers © Philip Allan Updates
Unit 2 Geographical investigationsUnequal spaces

c Answers should give:� a clearly located urban or rural area (the developed or developing world is
acceptable)� some brief details on existing inequality in this area� details of different schemes that address aspects of inequality, e.g. social, economic
and environmental� a weighing up of the named schemes
Level Marks Descriptor
3 8–10 Gives a located example, details of several different approaches, and a clearevaluation of extent of success. Geographical terms are used with accuracy; writtenlanguage errors are rare.
2 5–7 Gives a located example; details are more descriptive with only implied evaluation.May focus on one scheme only. Geographical terminology is used with someaccuracy; there are some written language errors.
1 1–4 Describes some schemes; sketchy descriptive detail only. Geographical terminology israrely used; there are frequent written language errors.
e How successful you are in responding to this question will depend on your chosenexamples. Note that the question asks for ‘schemes’.You should outline details of several,not just one, scheme within your chosen area, e.g. mobile services within a rural area, andattempts at farm diversification.
48Edexcel AS Geography Questions and answers © Philip Allan Updates
Unit 2 Geographical investigationsUnequal spaces

Rebranding places
Question 14
a Explain how you would plan a fieldwork and research programme to ‘profile’ an area inneed of rebranding. (15 marks)
b With reference to named examples, outline the reasons why rebranding is needed in eitherurban or rural places. (10 marks)
c Study Figure 14, which shows an online advert promoting ‘Rail-Ale Trails’ in southwestEngland. Using Figure 14, suggest how the use of ‘image’ can be used to promote ruraltourism.You should illustrate your answer with reference to named examples. (10 marks)
Figure 14 An online advert promoting ‘Rail-Ale Trails’ in southwest England
Answers to Question 14
a � Fieldwork activities could include quality surveys (e.g. shopping, residential, environ-mental) to assess the range of problems and opportunities in the area.
� Questionnaires could target residents and businesses to examine these areas andidentify issues.
� Photographs and videos can capture the area’s image.
49Edexcel AS Geography Questions and answers © Philip Allan Updates
Unit 2 Geographical investigations

� Surveys of litter, graffitti and vandalism could be carried out, including mappingditribution to identify problem locations.
� Census data allow an area to be profiled from an economic and social standpoint,and house prices may indicate economic trends.
� A geographic information system (GIS) such as Google Earth could be used toidentify services and their distribution. These include digitised health and crime maps.
� An archive search of local newspapers can be used to examine trends in the area, e.g.evidence of jobs losses and population change.
Level Marks Descriptor
4 13–15 Focuses on socioeconomic and environmental profiling. Gives a range of appropriatefieldwork options and outlines research sources in detail. Likely to refer to real places.Geographical terms are used with accuracy and show understanding; writtenlanguage errors are rare.
3 9–12 A range of appropriate fieldwork methods and research sources, with variable depth.Less strong link to profile. May use real places as examples. Geographical terminologyis used with some accuracy; there are some written language errors.
2 5–8 Limited link to profile, but some fieldwork and research outlines, which is appropriatebut unbalanced. Geographical terminology is occasionally used; there are somewritten language errors.
1 1–4 Lists a few fieldwork options and secondary sources only. Geographical terminologyis used rarely; there are frequent written language errors.
e Although the question does not ask for examples, strong candidates will use these tosupport their answer.This is a good opportunity to refer to your own fieldwork and research.
b � The need to rebrand is strongly linked to economic change. The loss of traditionalindustries can lead to a spiral of decline and the loss of an area’s identity.
� Areas with an image tarnished by decline need to rebrand to attract new businessesand put themselves back on the map. This frequently involves major environmentalimprovement, as the environment often deteriorates as economies decline (e.g. resulting in derelict land and brownfield sites).
� Rebranding can involve replacing a declining industry with a new one, such asoutdoor or heritage tourism, food, or hi-tech industry. This reflects changes in theglobal economy in developed countries.
� Population change, especially the loss of the young and skilled, can lead to a residualpopulation and lack of opportunity. This results in the need to attract new people toreinvigorate an area. Rebranding is then needed to improve the socioeconomicconditions of the area.
� Equally, population growth might mean an area requires a new image and newservices to meet the needs of a new population (e.g. a different ethnic group).
Level Mark Descriptor
3 8–10 Structured set of reasons, linked to detail on chosen area(s) and focusing onrebranding. Geographical terms are used with accuracy; written language errors arerare.
2 5–7 Some range of reasons, and some detail on chosen locations; describes problems butweaker link to rebranding. Geographical terminology is used with some accuracy;there are some written language errors.
1 1–4 One or two reasons; may simply outline some problems of an area. Geographicalterminology is rarely used; there are frequent written language errors.
50Edexcel AS Geography Questions and answers © Philip Allan Updates
Unit 2 Geographical investigationsRebranding places

e The structure for your answer could come from the key word ‘reasons’, as these could beenvironmental, social, cultural and economic.
c � The figure shows how two existing features of an area (in this case, railways and realale) are linked together to produce an ‘experience’, which is marketed at a particularage group and type of visitor.
� The image could produce spin-offs; for instance, special trains or microbreweriescould be set up to take advantage of the image.
� The historic nature of the area is emphasised in the photographs, ale logos and railposter — again appealing to a specific market.
� Many other rural areas have rebranded themselves in similar ways (‘Herriot Country’on the North York Moors, for instance). Most National Parks promote a particularimage through advertising and the provision of types of leisure activities and farmdiversification (e.g. speciality food or paintballing).
� The internet, television adverts and brochures are all types of media used to reinforcean area’s new image.
Level Marks Descriptor
3 8–10 The figure and examples are used to explore in detail how image can generatetourism. May comment that image is not everything. Geographical terms are usedwith accuracy; written language errors are rare.
2 5–7 Response is focused on image; likely to rely either on the figure or own examples.Descriptive rather than explanatory. Geographical terminology is used with someaccuracy; there are some written language errors.
1 1–4 One or two comments about the figure, or a brief description of tourism in a ruralarea. Geographical terminology is rarely used; there are frequent written languageerrors.
e Notice how the question asks you to ‘use’ Figure 14. Start by briefly describing the figureand the image it portrays, then use your own examples to reinforce your points.
51Edexcel AS Geography Questions and answers © Philip Allan Updates
Unit 2 Geographical investigationsRebranding places


