CHAPTER 3 SYSTEMS DEVELOPMENT and DOCUMENTATION TECHNIQUES Instructors Manual Learning Objectives: Prepare and use data flow diagrams to understand, evaluate and design information systems. Prepare and use flowcharts to understand, evaluate and design information systems. Questions to be addressed in this chapter include: What is the purpose of documentation? Why do accountants need to understand documentation? What documentation techniques are used in accounting systems? What are data flow diagrams and flowcharts? • How are they alike and different? • How are they prepared? Techniques used to document a system Narratives, flowcharts, diagrams and other written materials that explain how a system works. Documentation tools are important on one or more of the following levels: 1. At minimum, you must be able to read documentation to determine how the system works 2. You may be required to evaluate internal control systems documentation to identify control strengths and weaknesses and recommend improvements. Alternatively, you may have to evaluate the documentation for a proposed system to determine if the system meets the company’s needs Page 1 of 16 Introduction
Transcript
CHAPTER 3
SYSTEMS DEVELOPMENT and DOCUMENTATION TECHNIQUES
Instructors Manual
Learning Objectives:
Prepare and use data flow diagrams to understand, evaluate and design information systems.
Prepare and use flowcharts to understand, evaluate and design information systems.
Questions to be addressed in this chapter include:
What is the purpose of documentation?
Why do accountants need to understand documentation?
What documentation techniques are used in accounting systems?
What are data flow diagrams and flowcharts?
• How are they alike and different?
• How are they prepared?
Techniques used to document a system
Narratives, flowcharts, diagrams and other written materials that explain how a system works.
Documentation tools are important on one or more of the following levels:
1. At minimum, you must be able to read documentation to determine how the system works
2. You may be required to evaluate internal control systems documentation to identify control strengths and weaknesses and recommend improvements. Alternatively, you may have to evaluate the documentation for a proposed system to determine if the system meets the company’s needs
3. The greatest amount of skill is needed to prepare documentation. If you are a member of a team that is developing a new system, then you must prepare documentation to show how both the existing and the proposed systems operate.
This chapter discusses the following documentation tools:
Page 1 of 13
Introduction
1. Data flow diagram, a graphical description of the source and destination of data that shows data flow within an organization, the processes performed on the data, and how data are stored
2. Document flowchart, a graphical description of the flow of documents and information between departments or areas of responsibility within an organization
3. System flowchart, a graphical description of the relationship among the input, processing and output in an information system.
4. Program flowchart, a graphical description of the sequence of logical operations that a computer performs as it executes a program
Data Flow Diagrams
A data flow diagram (DFD) graphically describes the flow of data within an organization.
Elements in a Data Flow Diagram
Four Basic Elements:
(1) Data sources and destinations(2) Data flows(3) Transformation processes(4) Data stores
Data flow diagram symbols shown in Figure 3-1 on Page 64:
Data sources and destinations
Data flows
Transformation processes
Data stores
Figure 3-2 on Page 64 shows the basic data flow diagram elements.
Data Sources and Destinations
Page 2 of 13
Learning Objective One
Prepare and use data flow diagrams to understand, evaluate and design information systems.
Data sources and data destinations are represented by squares, as illustrated by items A (customer), J (bank) and K (credit manager) in Figure 3-3 on Page 65.
A data flow represents the flow of data between processes, data stores and data sources and destinations.
Processes represent the transformation of data. Figure 3-3 shows that process payment (c) takes the customer payment and splits it in to the remittance data and the deposit (which includes the checks and deposit slip created within process payment).
A data store is a temporary or permanent repository of data.
[Power point slide #16 marks the data sources and destinations in red. Power point slide #19 & #20 mark the data sources in red. Power point slide #26 marks the transformation process in red. Power point slide #28 marks the data store in red.]
Subdividing the Data Flow Diagram
The highest-level Data Flow Diagram is referred to as a context diagram. A context diagram provides the reader with a summary-level view of the system. A context diagram, about the payroll process, is provided in Figure 3-5 on Page 66. [Refer to power point slides #32 through #34]
Note in this payroll process that the timecard and proof of hiring (new employee form) is provided to support the payment to the employee.
Table 3-1 on Page 67 provides a narrative description of the same payroll process in Figure 3-5.
After reading this narrative, you should be able to answer the following two questions:
How many major data processing activities are involved?
What are the data inputs and outputs of each activity (ignoring all references to people, departments and document destinations)?
List of the activities:
1. Updating the employee/payroll master file
This includes new employees and changes to current employees’ status such as pay raises.
2. Handling employee compensation
Page 3 of 13
Paragraph 2 involves preparing a two-party check for employees from information received from the timecard and information from the employee’s data file.
Paragraph 5 involves preparing a two-party check for the total amount of the employee payroll.
Paragraph 6 involves Susan sending the two-party check to the total employee payroll to the bank and the individual two-party checks to the employees.
3. Managing management reports
Payroll summary report
4. Paying taxes
5. Posting entries to the general ledger
All data inflows and outflows, and the five activities, form the basis of the DFD as summarized in Table 3-2 on Page 68.
Using the narrative, the previous context diagram was extended with more detail shown in Figure 3-6 on Page 68. [Refer to power point slides #35 through #40 and #57]
Note that the five activities are now numbered in this diagram (1.0, 2.0, 3.0, 4.0 & 5.0)
Figure 3-7 on Page 70 provides more detail about the data processes involved in paying employees, and it includes the tax rates table and the payroll register data flow omitted from Figure 3-6.
Note to the Instructor: The importance for students to know the difference between a Level 0 DFD in Figure 3-6 and a Level 1 DFD in Figure 3-7 should be stressed.
Focus 3-1 on Page 69 Guidelines for Drawing a Data Flow Diagram
1. Understand the system
2. Ignore certain aspects of the system
Ignore all control processes & control actions
3. Determine system boundaries
4. Develop a context diagram
5. Identify data flows
6. Group data flows
7. Identify transformation processes
Page 4 of 13
8. Group transformation processes
9. Identify all files or data stores
10. Identify all data sources and destinations
11. Name all Data Flow Diagram elements
12. Subdivide the Data Flow diagram
13. Give each process a sequential number
14. Repeat the process
15. Prepare a final copy
[Refer to power point slides #42 through #46]
Multiple Choice #1
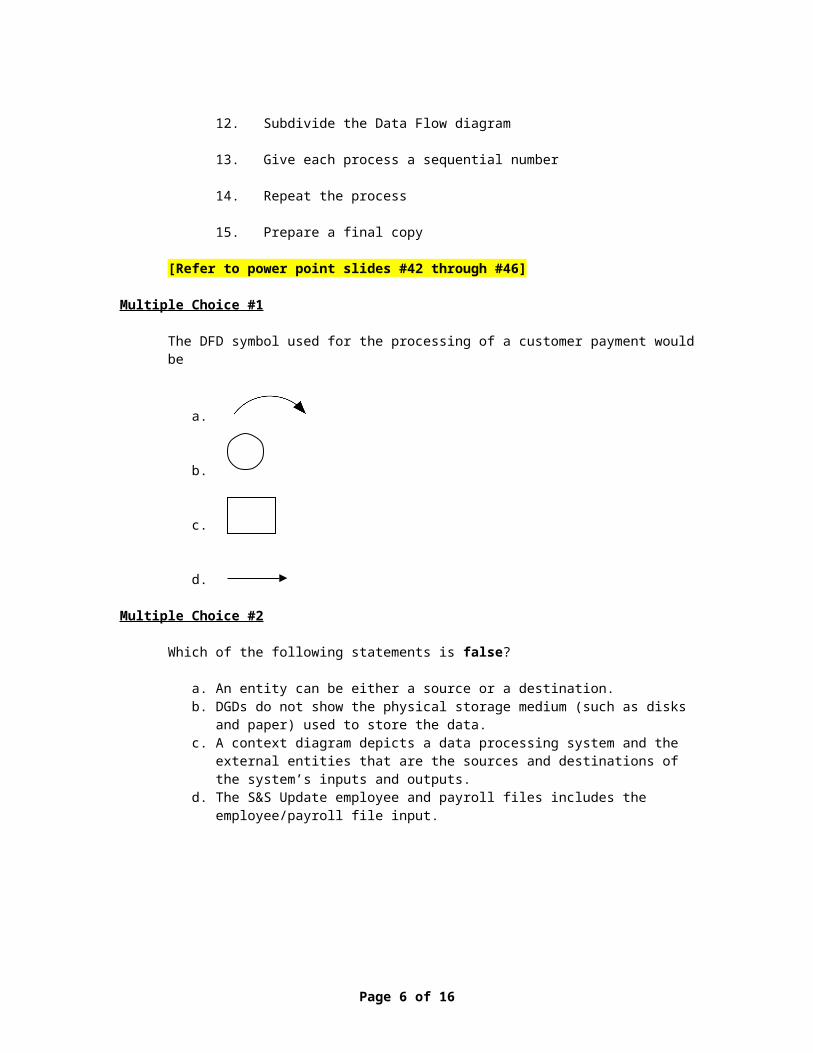
The DFD symbol used for the processing of a customer payment would be
a.
b.
c.
d.
Multiple Choice #2
Which of the following statements is false?
a. An entity can be either a source or a destination.b. DGDs do not show the physical storage medium (such as disks
and paper) used to store the data.c. A context diagram depicts a data processing system and the
external entities that are the sources and destinations of the system’s inputs and outputs.
d. The S&S Update employee and payroll files includes the employee/payroll file input.
Multiple Choice #3
Page 5 of 13
There were five data processing activities in Ashton’s description of S&S’s payroll processing activities. The second activity is
a. Posting entries to the general ledgerb. Updating the employee/payroll master filec. Generating management reportsd. Handling employee compensation
Multiple Choice #4
There are fifteen guidelines for drawing a DFD. Never combine unrelated items into a single transformation process are included in which of the 15 guidelines?
a. Group data flowsb. Group transformation processesc. Name all DFD elementsd. Determine system boundaries
Multiple Choice #5
Which of the following would be considered to be a data source?
a. Human resourcesb. Employeesc. Government agenciesd. All of the abovee. None of the above
A flowchart is an analytical technique used to describe some aspect of an information system in a clear, concise and logical manner. Flowcharts use a standard set of symbols to describe pictorially the transaction processing procedures a company uses and the flow of data through a system.
The Sarbanes-Oxley Act requires companies to document their business processes and internal controls.
Flowchart Symbols in Figure 3-8 on Pages 71 and 72
1. Input/output symbols . Input/output symbols represent devices or media that provide input to or record output from processing operations.
2. Processing symbols . Processing symbols either show what
Page 6 of 13
Flowcharts
Learning Objective Two
Prepare and use flowcharts to understand, evaluate and design information systems.
type of device is used to process data or indicate when processing is performed manually.
3. Storage symbols . Storage symbols represent the device used to store data that the system is not currently using.
4. Flow and miscellaneous symbols . Flow and miscellaneous symbols indicate the flow of data and goods. They also represent such operations as where flowcharts begin or end, where decisions are made and when to add explanatory notes to flowcharts.
Focus 3-2 on Page 73 provides the following guidelines for preparing flowcharts:
1 Understand a system before flowcharting it
11 Use on-page connectors to avoid excess flow lines
2 Identify the entities to be flowcharted
12 Use arrowhead on all flow lines
3 When several entities such as departments or functions are involved, divide the flowchart into columns
13 If a flowchart cannot fit on a single page, clearly label the pages
4 Flowchart only the normal flow of operations
14 Show documents or reports first in the column in which they are created then show them again in another column in which the documents are being processed
5 Design the flowchart so that flow proceeds from top to bottom and from left to right
15 Show all data entered into or retrieved from a computer file
6 Give the flowchart a clear beginning and ending
16 Draw a line from a document to a file to indicate that it is being filed
7 Use the standard flowcharting symbols
17 Draw a rough sketch of the flowchart as a first effort
8 Clearly label all symbols. Write a description of the input, process or output inside the symbol
18 Redesign the flowchart to avoid clutter
9 When using multiple documents, place document numbers in the top right-hand corner
19 Verify the flowchart’s accuracy
10 Each manual processing symbol should have an input and an output
20 Draw a final copy of the flowchart
[The following power point slides provide the same guidelines with additional detailed information: #92-#94, #96, #97, #105, #108, #110, #112, #114 and #116.]
Common flowcharting symbols are provided in Figure 3-8 on Pages 72 and 73.
Document Flowcharts
Page 7 of 13
A document flowchart illustrates the flow of documents and information among areas of responsibility within an organization.
Document flowcharts that describe and evaluate internal controls are often referred to as internal control flowcharts.
The document flowchart for the S&S payroll process, as described in Table 3-2 on Page 68, is now shown in Figure 3-9 on Pages 74 and 75.
Note that there are four areas of responsibility; payroll, accounts payable, management and general ledger.
Note that the solid lines represent the document or processing flow while the dashed lines represent the data/information flow.
[The following power point slides provide the inputs, processes, outputs, forwarding documents to the next department, on-page and off-page connectors marked in red: power point slide #91, #95, #98-#104, #106-#107, #109, #111, #113 and #115.]
System Flowcharts
System flowcharts depict the relationship among the input, processing and output of an Accounting Information System.
A systems flowchart for the sales processing at S&S is provided in Figure 3-10 on Page 76. [Refer to power point slide #122]
Note that there are two types of data storage used, magnetic disk and on-line storage.
Note the display output; customer account status, inventory status and sales analysis. Customer account status would advice the sales clerk on whether to approve credit for the customers’ purchase of merchandise. Also, inventory status would tell the sales clerk whether there the item that the customer wants to purchase is currently being stored in the warehouse.
Program Flowcharts
A program flowchart illustrates the sequence of logical operations performed by a computer in executing a program.
Some of the computer programs are COBOL (Common Business Language), FORTRAN, RPG from the old days. COBOL is still being used. Now, there is C Plus Plus and Java.
Page 8 of 13
Figure 3-11 on Page 77 shows the relationship between system and program flowcharts. [Refer to power point slides #124 through #126]
[Power point slides #128 through #134 show a comparison between DFDs and program flowcharts using an interesting illustration of a registrar’s office in a small college.]
Note to the Instructor: An example of using a program flowchart for COBOL programming for a payroll process is provided on the next page 9. This is provided solely for the student’s information and to familiarize the student with the basic program flowchart. It also provides another method, pseudocode, which is used instead of flowcharting for COBOL programming.
Page 9 of 13
Page 10 of 13
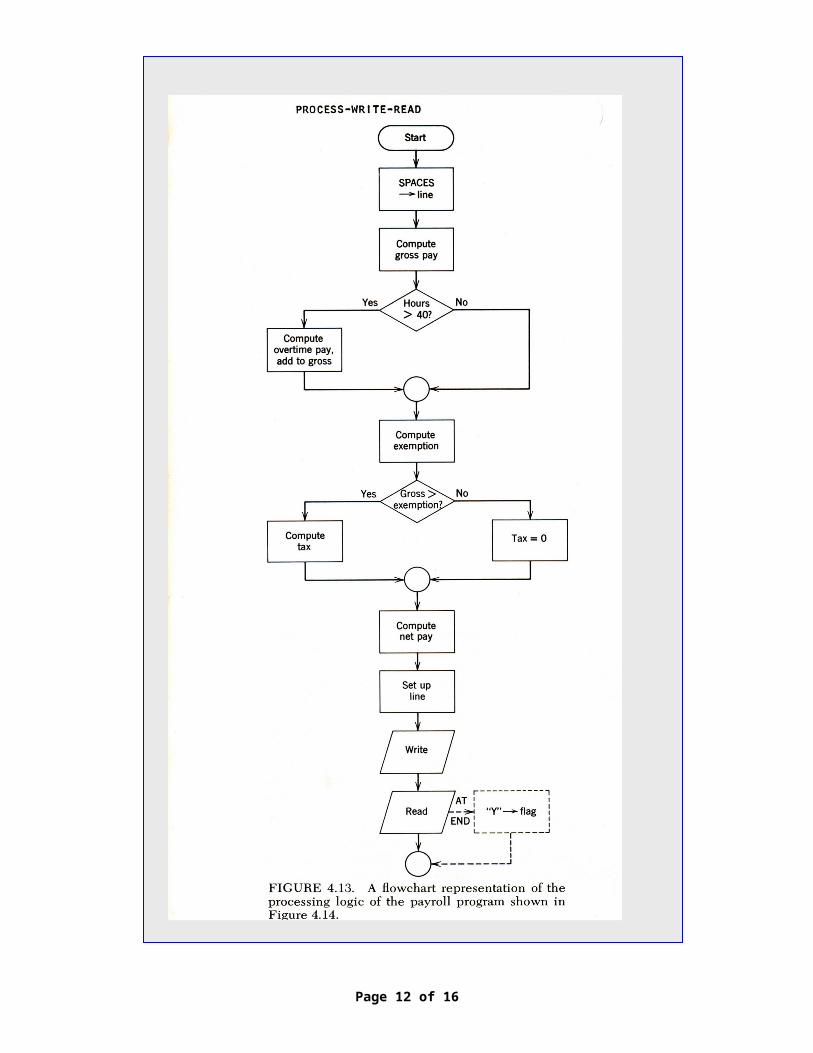
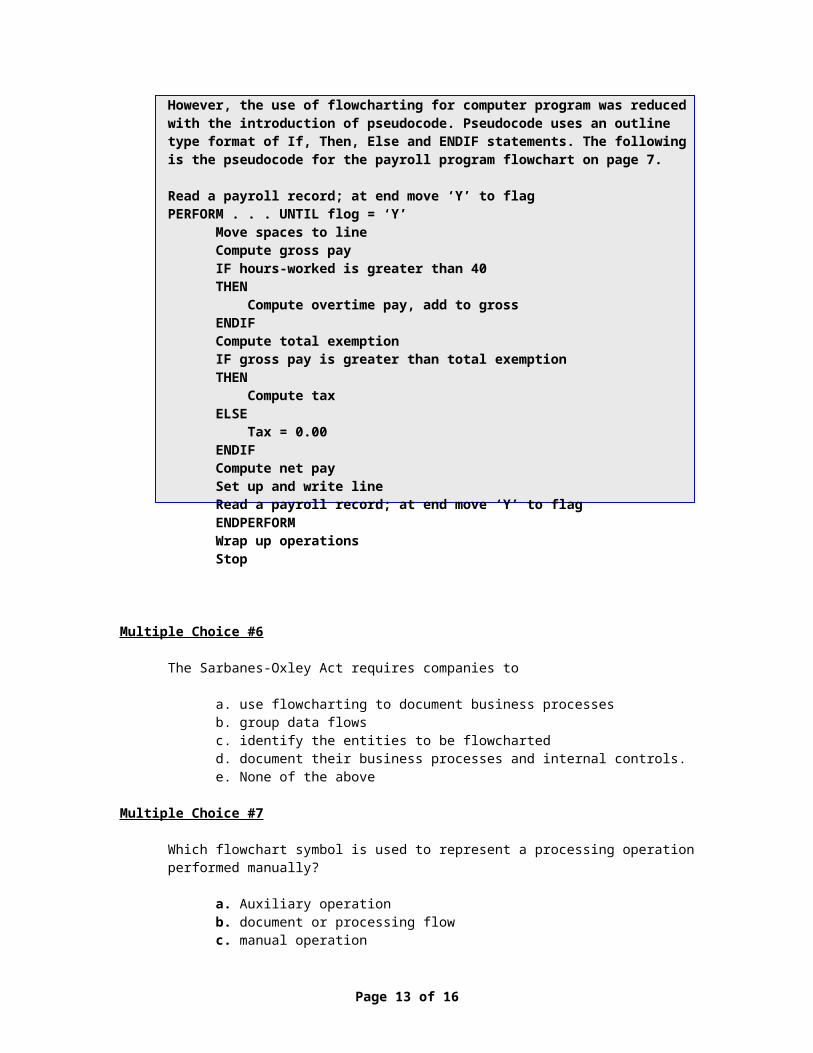
However, the use of flowcharting for computer program was reduced with the introduction of pseudocode. Pseudocode uses an outline type format of If, Then, Else and ENDIF statements. The following is the pseudocode for the payroll program flowchart on page 7.
Read a payroll record; at end move ‘Y’ to flagPERFORM . . . UNTIL flog = ‘Y’
Move spaces to lineCompute gross payIF hours-worked is greater than 40THEN Compute overtime pay, add to grossENDIF Compute total exemptionIF gross pay is greater than total exemptionTHEN Compute taxELSE Tax = 0.00ENDIFCompute net paySet up and write lineRead a payroll record; at end move ‘Y’ to flagENDPERFORMWrap up operationsStop
Multiple Choice #6
The Sarbanes-Oxley Act requires companies to
a. use flowcharting to document business processesb. group data flows c. identify the entities to be flowchartedd. document their business processes and internal controls.e. None of the above
Multiple Choice #7
Which flowchart symbol is used to represent a processing operation performed manually?
a. Auxiliary operationb. document or processing flowc. manual operationd. computer processing
Page 11 of 13
Multiple Choice #8
The flowchart that begins by identifying the inputs that enter the system and their origins is
a. system flowchartb. internal control flowchartc. document flowchartd. A and Ce. none of the above
Multiple Choice #9
In a document flowchart, a dotted line was be used for which of the following?
a. Using tax tables to prepare the payroll registerb. Filing the payroll registerc. Using new employee data to update employee/payroll
registerd. Using the payroll register to prepare payroll checks
Multiple Choice #10
Which of the following statement or statements is/are false?
a. System flowcharts depict the relationships among the input, processing, and output of an AIS.
b. A document flowchart illustrates the flow of data and information among areas of responsibility within an organization.
c. Internal control flowcharts describe and evaluate internal controls.
d. Program flowchart illustrates the sequence of logical operations performed by a computer in executing a program.
Multiple Choice Question AnswersNumber Answer Number Answer
1 B 6 D2 B 7 C3 A 8 A4 D 9 A5 B 10 B
Reference Used:
1 Parts of this discussion are based on Tom DeMarco, Structured Analysis and System Specification (Upper SaddleRiver, NJ: Prentice Hall, 1979). DeMarco has been at the forefront of structural analysis and design techniquesand is a well-respected authority on the subject.
Page 12 of 13
Note to Instructor: A number of students will most likely not have very much experience in completing flowcharts that are described in chapter three. Below are instructions for completing flowcharts using MS XL:
Flowcharting Using MX XL. Chapter three will require the use of flowcharts. The toolbar option for using MS XL flowcharts is provided in the XL software. To insert shapes go to the menu at the top of your XL computer screen; first left click on View, then left click on Toolbar and then left click on Drawing. Now you need to go to the menu at the bottom of your screen. Left click on AutoShapes and then left click on Flowchart. Click on the shape of your choice. Then go to the location on your XL spreadsheet where you want to put the shape, place your cursor there and left click at that position. To insert connectors between shapes you follow the same procedures, except instead of left clicking on Flowchart, you left click on Connectors. To add Text to a Shape, you right click inside the shape and start typing.


![Cn Chp3 [Compatibility Mode]](https://static.documents.pub/doc/80x56/577d37691a28ab3a6b95a0f4/cn-chp3-compatibility-mode.jpg)


