20
Korean Container Shipping Market Forecasts Web: www.alphaliner.com E-mail: [email protected] 1 November 2018 Busan Port International Passenger Terminal
Korean Container Shipping Market Forecasts
Web: www.alphaliner.com E-mail: [email protected]
1 November 2018Busan Port International Passenger Terminal

ALPHALINER
Container Shipping Market Forecast © Alphaliner 1999-2018 – Contents not to be reproduced without permission
1 November 2018Busan
Déjà vu - has anything changed in the last 40 years?
Page 1
Recurring themes :
• Overcapacity
• Shipping companies struggle to stay afloat
• Governments continue to support struggling lines
• Changing regulatory regimes
– 2020 Sulphur Cap
– Ballast Water Management

ALPHALINER
Container Shipping Market Forecast © Alphaliner 1999-2018 – Contents not to be reproduced without permission
1 November 2018Busan
True innovations remain elusive in container shipping
Page 2
Replace ‘Big Data’ with any of the latest innovation buzzwords in container shipping:-
• Digitization
• Blockchain
• Artificial Intelligence (AI)
• Predictive analytics
• Machine learning
Technology and innovations have so far failed to transform the shipping industry

ALPHALINER
Container Shipping Market Forecast © Alphaliner 1999-2018 – Contents not to be reproduced without permission
1 November 2018Busan
Industry consolidation – Last 10 years
Page 3
From 2008 To 2018
What has changed? ‘Global’ carriers down from 22 to 12 Scale of operations have increased by
2.0 X (Maersk) 2.2 X (MSC) 2.7 X (CMA CGM) 3.2 X (Hapag-Lloyd) 5.7 X (COSCO)
0.000.501.001.502.00
APM-Maersk
MSC
CMA CGM
Evergreen
Hapag-Lloyd
COSCO
APL
CSCL
NYK
MOL
Hanjin Shg
OOCL
K Line
Hamburg Süd
Yang Ming
CSAV
Zim
Hyundai M.M.
PIL
UASC
Wan Hai
MISC
Capacity Operated in TEU Millions (End 2008)
0.00 0.50 1.00 1.50 2.00 2.50 3.00 3.50 4.00
APM-Maersk
MSC
COSCO
CMA CGM
Hapag-Lloyd
ONE
Evergreen
Yang Ming
PIL
HMM
Zim
Wan Hai
Capacity Operated in TEU Millions (Nov 2018)

ALPHALINER
Container Shipping Market Forecast © Alphaliner 1999-2018 – Contents not to be reproduced without permission
1 November 2018Busan
Korean consolidation – no progress made
Page 4
From 2008 To 2018
What has changed? Fragmented market unchanged (11 carriers remain – SM Line replaced Hanjin Shg/Pan Ocean
replaced STX Pan Ocean). Only one carrier exited - Dongnama (C& Line) in 2008. Total capacity operated by Korean carriers increased by 7.6% between 2008 and 2018 But global capacity increased by 78.8% in the same period Korean carriers share have fallen behind global average by factor of 10 X
0.000.100.200.300.40
Hanjin Shg
Hyundai M.M.
KMTC
STX Pan Ocean
Sinokor
Heung-A Shg
Namsung Shg
CK Line
Pan Continental Shg
Dongjin Shg
Doowoo
Capacity Operated in TEU Millions (End 2008)
0.00 0.10 0.20 0.30 0.40
HMM
KMTC
Pan Ocean
Sinokor
Heung-A Shg
Namsung Shg
CK Line
Pan Continental Shg
Dongjin Shg
Doowoo
SM Line
Capacity Operated in TEU Millions (Nov 2018)
ALPHALINER
Container Shipping Market Forecast © Alphaliner 1999-2018 – Contents not to be reproduced without permission
1 November 2018Busan
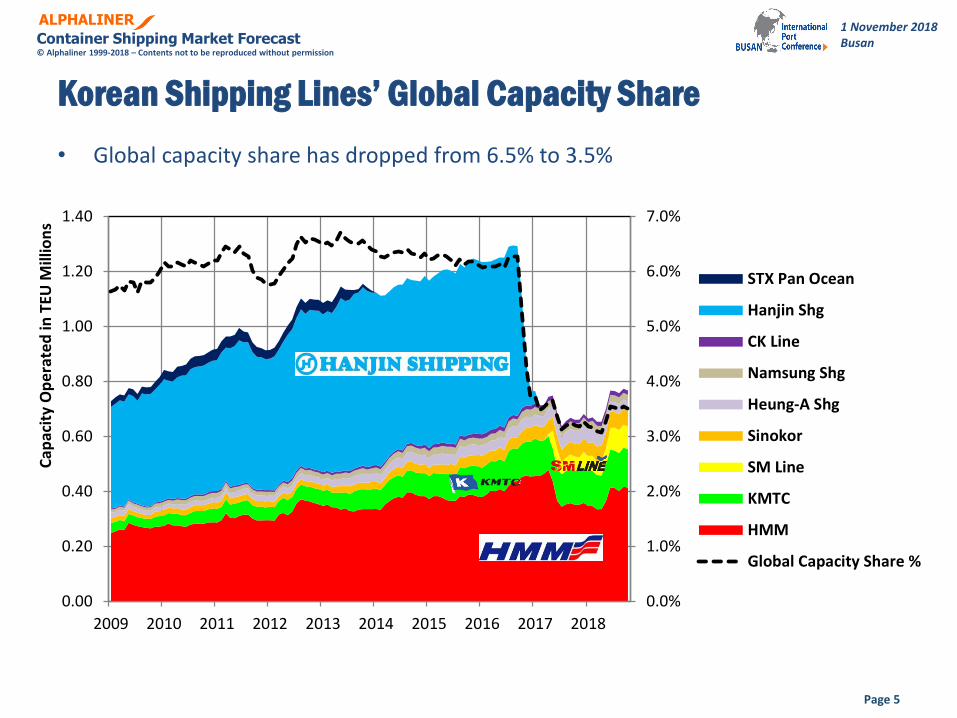
Korean Shipping Lines’ Global Capacity Share
Page 5
0.0%
1.0%
2.0%
3.0%
4.0%
5.0%
6.0%
7.0%
0.00
0.20
0.40
0.60
0.80
1.00
1.20
1.40
2009 2010 2011 2012 2013 2014 2015 2016 2017 2018
Cap
acit
y O
pe
rate
d in
TEU
Mill
ion
s
STX Pan Ocean
Hanjin Shg
CK Line
Namsung Shg
Heung-A Shg
Sinokor
SM Line
KMTC
HMM
Global Capacity Share %
• Global capacity share has dropped from 6.5% to 3.5%

ALPHALINER
Container Shipping Market Forecast © Alphaliner 1999-2018 – Contents not to be reproduced without permission
1 November 2018Busan
No simple fixes to complex problems
• Korea’s 100 Policy Tasks (Five-year Plan of the Moon Jae-In Administration)
– Task 80 : To make the nation a maritime power through the joint development of the shipping and shipbuilding industries
Korean’s five-year plan for the shipping industry is based on three major initiatives:
1. securing stable cargo bookings based on competitive services and freight,
2. constructing energy-efficient ships that operate at low costs, and
3. promoting stable management through continuous innovation.
But none of these initiatives address the fundamental problems that carriers face:
• Market fragmentation and excessive competition amongst Korean carriers
• Low operating margins
• Weak balance sheet and uncompetitive cost structure – especially HMM
• Over-supply of global containership fleet
When will Korean government support for shipping industry end?Page 6

ALPHALINER
Container Shipping Market Forecast © Alphaliner 1999-2018 – Contents not to be reproduced without permission
1 November 2018Busan
Page 7
HMM growth roadmap
• HMM capacity operated is expected to reach 940,000 teu in 2021 from 415,000 teu
• 2020 environmental regulations described as “golden opportunity for HMM’sresurgence” – but rapid expansion carries significant risks
0.00
0.10
0.20
0.30
0.40
0.50
0.60
0.70
0.80
0.90
1.00
20
09
20
10
20
11
20
12
20
13
20
14
20
15
20
16
20
17
20
18
20
19
20
20
20
21
20
22
Cap
acit
y O
pe
rate
d in
TEU
Mill
ion
s
HMM operated capacity evolution : 2009-2021
HMM Projections (2019-2021)
12 x 23,000 teu newbuildings to be delivered in 2Q 2020
9 x 10,000-13,000 teu to be redelivered from 2M in 2Q 2020
8 x 15,000 teu newbuildings
to be delivered in 3Q 2021

ALPHALINER
Container Shipping Market Forecast © Alphaliner 1999-2018 – Contents not to be reproduced without permission
1 November 2018Busan
Page 8
Korean carriers have consistently under-performed
• HMM operating margins the lowest amongst all main carriers since 2016
• Current HMM structure is set up to fail
• Future roadmap for HMM still unclear
– 2M/HMM – an unequal partnership
– New alliance partnership after 2020 still to be confirmed
– 2018 cost saving initiatives have not achieved desired results
• A complete restructuring of HMM is required – recapitalisation and removal of toxic assets together with onerous contracts
0.2%
5.5%
0.3%
-1.0%
4.7%
1.6%
-4.2%
-10.4%
3.5%
8.5%
6.8%
6.0%
5.9%
6.9%
0.4%
-8.6%
6.2%
10.0%
9.5%
4.1%
7.6%
10.5%
4.2%
-0.6%
5.4%
5.2%
4.5%
1.3%
3.3%
-1.9%
0.5%
-9.7%
2.1%
1.6%
1.2%
-2.3%
-0.3%
-2.3%
-6.5%
-15.6%
1.2%
1.2%
0.8%
0.5%
-0.5%
-4.6%
-5.8%
-10.7%
-16.4%
-20.0% -15.0% -10.0% -5.0% 0.0% 5.0% 10.0% 15.0%
Hapag-Lloyd
CMA CGM
Wan Hai
Maersk
Zim
Evergreen
ONE
Yang Ming
HMM
Operating Profit Margin % by Quarter
1Q172Q173Q174Q171Q182Q18
ALPHALINER
Container Shipping Market Forecast © Alphaliner 1999-2018 – Contents not to be reproduced without permission
1 November 2018Busan
Page 9
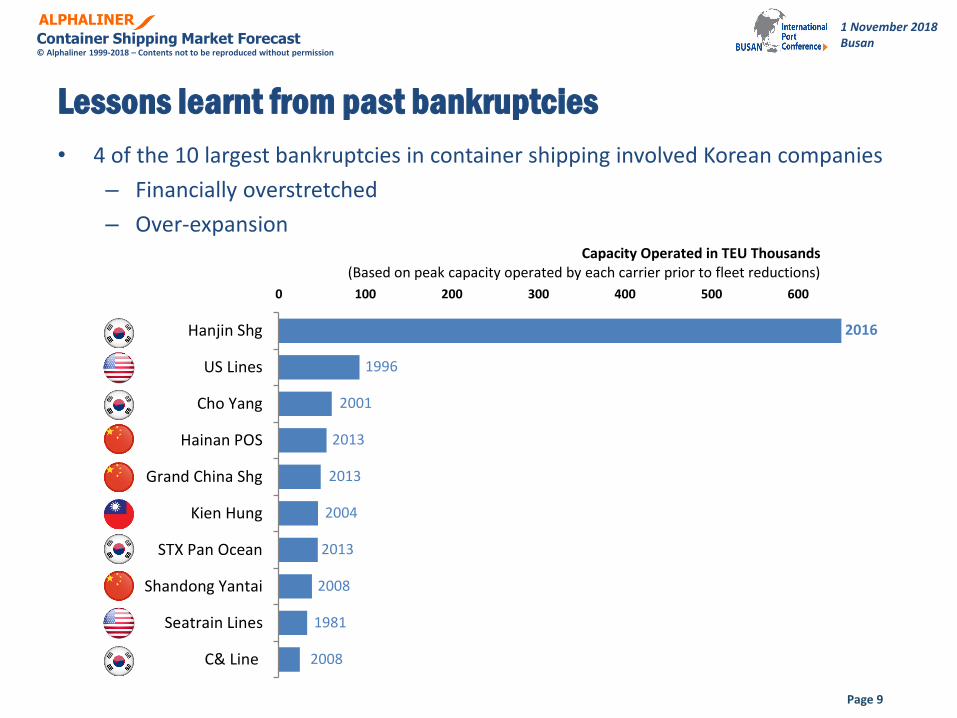
Lessons learnt from past bankruptcies
• 4 of the 10 largest bankruptcies in container shipping involved Korean companies
– Financially overstretched
– Over-expansion
0 100 200 300 400 500 600 700
Hanjin Shg
US Lines
Cho Yang
Hainan POS
Grand China Shg
Kien Hung
STX Pan Ocean
Shandong Yantai
Seatrain Lines
C& Line
Capacity Operated in TEU Thousands (Based on peak capacity operated by each carrier prior to fleet reductions)
2016
1996
2001
2013
2013
2004
2013
2008
1981
2008
ALPHALINER
Container Shipping Market Forecast © Alphaliner 1999-2018 – Contents not to be reproduced without permission
1 November 2018Busan
Page 10
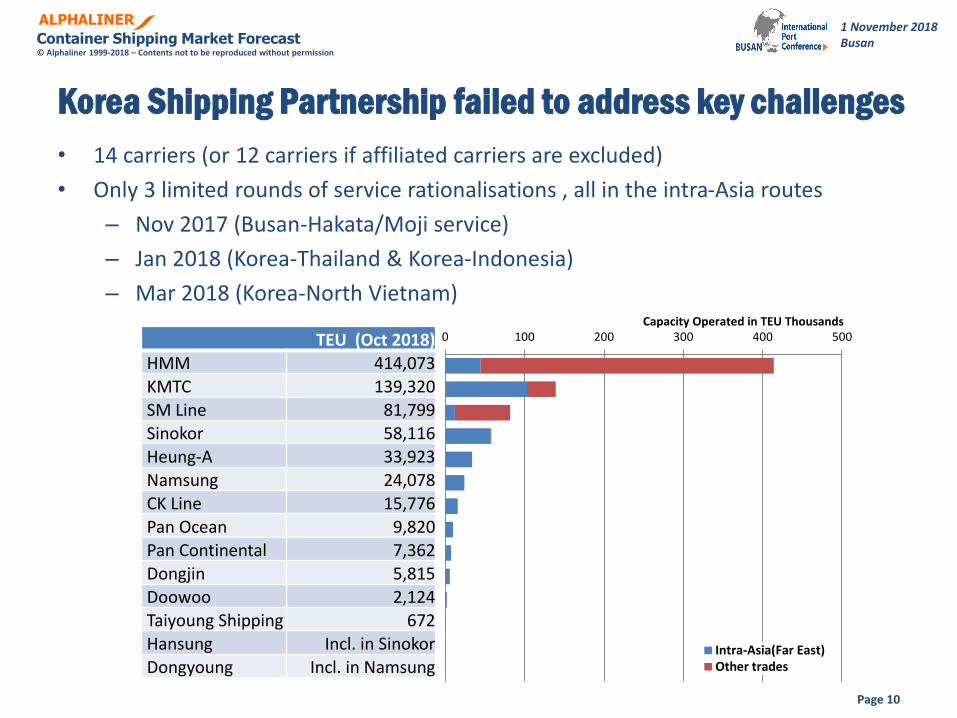
Korea Shipping Partnership failed to address key challenges
0 100 200 300 400 500Capacity Operated in TEU Thousands
Intra-Asia(Far East)Other trades
TEU (Oct 2018)
HMM 414,073
KMTC 139,320
SM Line 81,799
Sinokor 58,116
Heung-A 33,923
Namsung 24,078
CK Line 15,776
Pan Ocean 9,820
Pan Continental 7,362
Dongjin 5,815
Doowoo 2,124
Taiyoung Shipping 672
Hansung Incl. in Sinokor
Dongyoung Incl. in Namsung
• 14 carriers (or 12 carriers if affiliated carriers are excluded)
• Only 3 limited rounds of service rationalisations , all in the intra-Asia routes
– Nov 2017 (Busan-Hakata/Moji service)
– Jan 2018 (Korea-Thailand & Korea-Indonesia)
– Mar 2018 (Korea-North Vietnam)

ALPHALINER
Container Shipping Market Forecast © Alphaliner 1999-2018 – Contents not to be reproduced without permission
1 November 2018Busan
Page 11
Korean Intra-Asia carriers remains highly fragmented
• 7 of the Top 25 carriers in Intra-Asia (Far East) trades are Korean but none have the scale to dominate the market
Country No. of carriers (Top 25)
S. Korea 7
China 5
Taiwan 5
Denmark 1
France 1
Japan 1
Switzerland 1
Thailand 1
Singapore 1
Indonesia 1
Russia 1
0 100 200 300
COSCO/OOCL/Golden Sea/PuhaiMaersk/MCC(Sealand Asia)
CMA CGM/CNC/APLEvergreen
Wan HaiSITCONE
KMTCMSC
Yang MingSinokorTS Line
HMMHeung-A
SinotransRCLPIL
SamuderaNamsung
FESCOCK Line
Taicang Container LineInterasia Lines
Shanghai Jin JiangSM Line
Capacity in TEU Thousands
ALPHALINER
Container Shipping Market Forecast © Alphaliner 1999-2018 – Contents not to be reproduced without permission
1 November 2018Busan
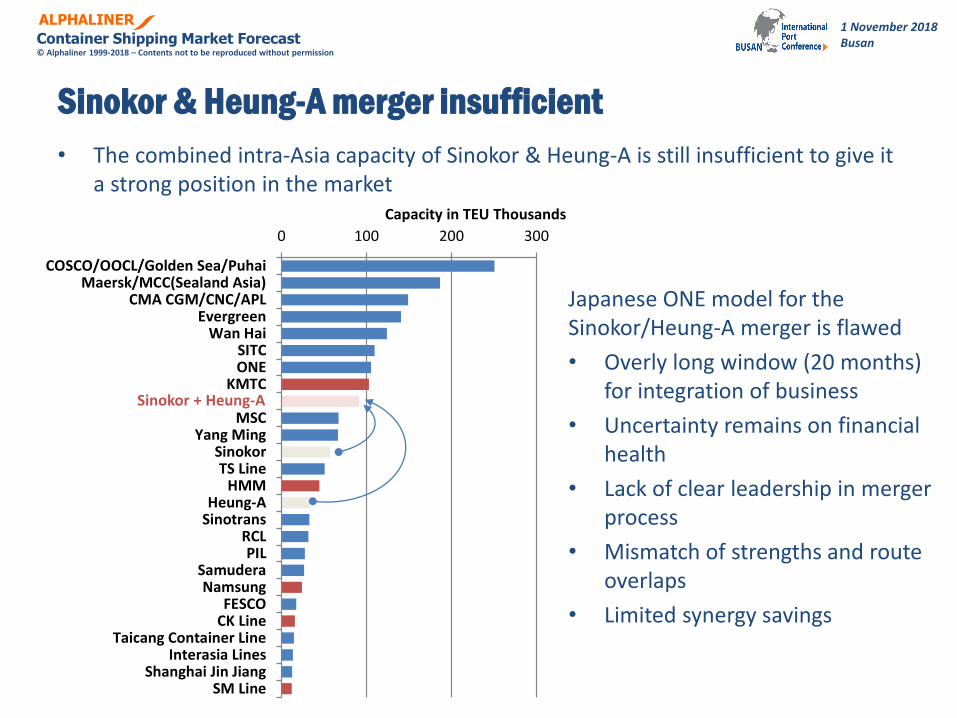
Sinokor & Heung-A merger insufficient
• The combined intra-Asia capacity of Sinokor & Heung-A is still insufficient to give it a strong position in the market
0 100 200 300
COSCO/OOCL/Golden Sea/PuhaiMaersk/MCC(Sealand Asia)
CMA CGM/CNC/APLEvergreen
Wan HaiSITCONE
KMTC
MSCYang Ming
SinokorTS Line
HMMHeung-A
SinotransRCLPIL
SamuderaNamsung
FESCOCK Line
Taicang Container LineInterasia Lines
Shanghai Jin JiangSM Line
Capacity in TEU Thousands
Sinokor + Heung-A
Japanese ONE model for the Sinokor/Heung-A merger is flawed
• Overly long window (20 months) for integration of business
• Uncertainty remains on financial health
• Lack of clear leadership in merger process
• Mismatch of strengths and route overlaps
• Limited synergy savings
ALPHALINER
Container Shipping Market Forecast © Alphaliner 1999-2018 – Contents not to be reproduced without permission
1 November 2018Busan
Page 13
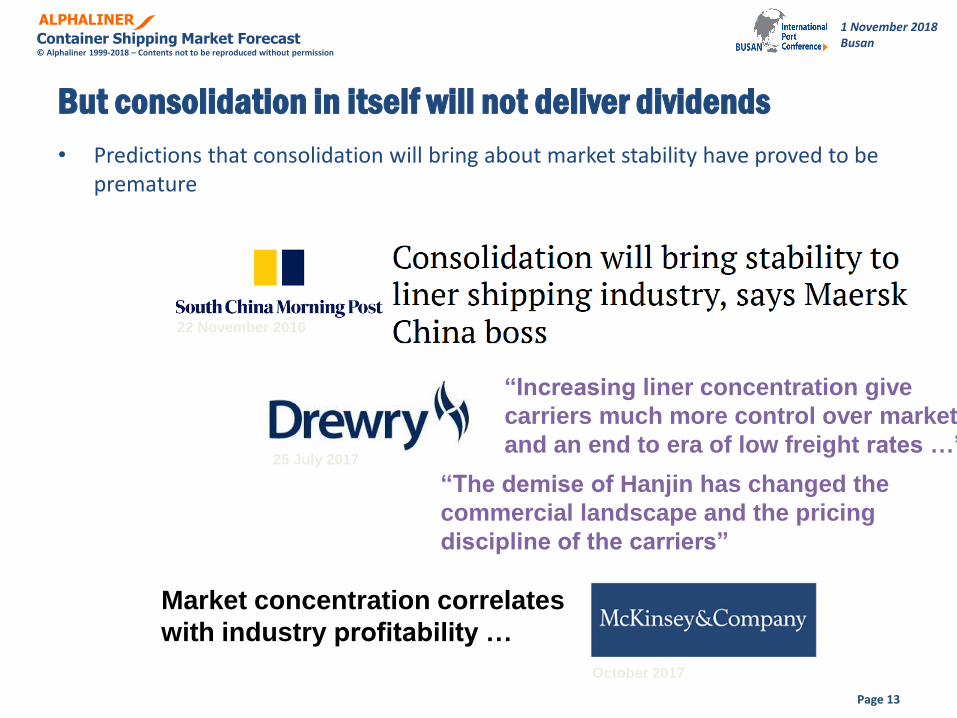
22 November 2016
Market concentration correlates
with industry profitability …
October 2017
“Increasing liner concentration give
carriers much more control over market
and an end to era of low freight rates …”25 July 2017
“The demise of Hanjin has changed the
commercial landscape and the pricing
discipline of the carriers”
But consolidation in itself will not deliver dividends
• Predictions that consolidation will bring about market stability have proved to be premature
ALPHALINER
Container Shipping Market Forecast © Alphaliner 1999-2018 – Contents not to be reproduced without permission
1 November 2018Busan
Page 14
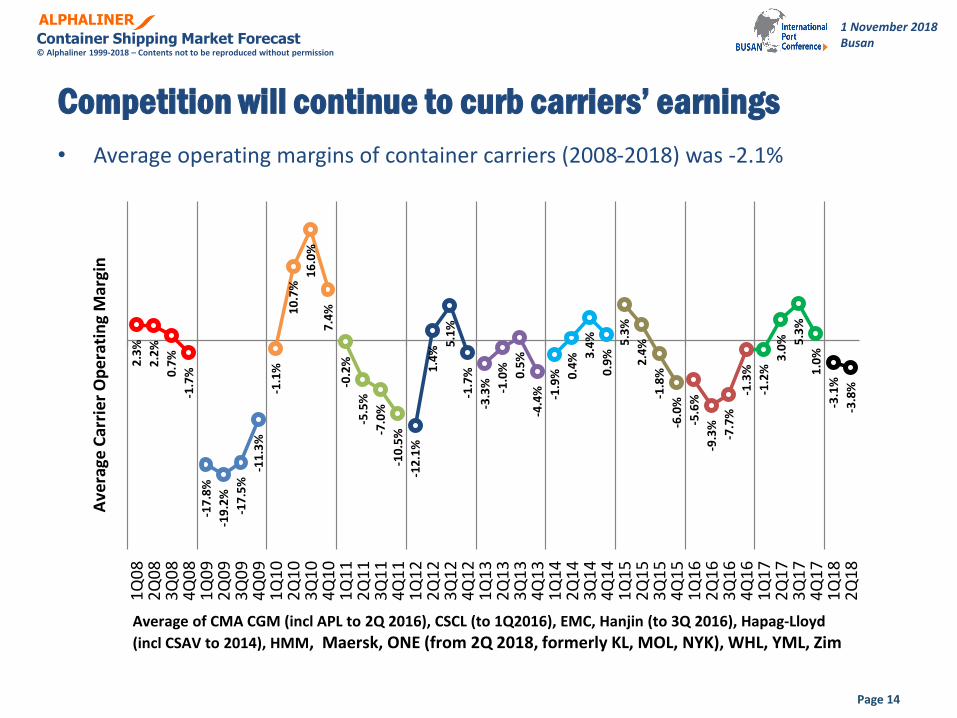
Competition will continue to curb carriers’ earnings2
.3%
2.2
%
0.7
%
-1.7
%
-17
.8%
-19
.2%
-17
.5%
-11
.3%
-1.1
%
10
.7%
16
.0%
7.4
%
-0.2
%
-5.5
%
-7.0
%
-10
.5%
-12
.1%
1.4
% 5.1
%
-1.7
%
-3.3
%
-1.0
%
0.5
%
-4.4
%
-1.9
%
0.4
% 3.4
%
0.9
% 5
.3%
2.4
%
-1.8
%
-6.0
%
-5.6
%
-9.3
%
-7.7
%
-1.3
%
-1.2
% 3
.0%
5.3
%
1.0
%
-3.1
%
-3.8
%
1Q0
82Q
08
3Q0
84Q
08
1Q0
92Q
09
3Q0
94Q
09
1Q1
02Q
10
3Q1
04Q
10
1Q1
12Q
11
3Q1
14Q
11
1Q1
22Q
12
3Q1
24Q
12
1Q1
32Q
13
3Q1
34Q
13
1Q1
42Q
14
3Q1
44Q
14
1Q1
52Q
15
3Q1
54Q
15
1Q1
62Q
16
3Q1
64Q
16
1Q1
72Q
17
3Q1
74Q
17
1Q1
82Q
18
Ave
rage
Car
rier
Op
erat
ing
Mar
gin
Average of CMA CGM (incl APL to 2Q 2016), CSCL (to 1Q2016), EMC, Hanjin (to 3Q 2016), Hapag-Lloyd
(incl CSAV to 2014), HMM, Maersk, ONE (from 2Q 2018, formerly KL, MOL, NYK), WHL, YML, Zim
• Average operating margins of container carriers (2008-2018) was -2.1%

ALPHALINER
Container Shipping Market Forecast © Alphaliner 1999-2018 – Contents not to be reproduced without permission
1 November 2018Busan
2019 will remain challenging with supply overhang to persist
• Supply-Demand imbalance not expected to be cleared, with idle capacity of >750,000 teu expected to be carried over to 2019
Page 15
0%
1%
2%
3%
4%
5%
6%
7%
8%
9%
10%
11%
12%
20
00
20
01
20
02
20
03
20
04
20
05
20
06
20
07
20
08
20
09
20
10
20
11
20
12
20
13
20
14
20
15
20
16
20
17
20
18
20
19
0
25
50
75
100
125
150
175
200
225
250
Idle
Fle
et a
s %
of
tota
l fle
et
Alp
hal
iner
Ch
arte
r In
dex
(Ja
n 2
00
0=1
00
)
Idle fleet as % of total fleet Alphaliner Charter Rate Index
ALPHALINER
Container Shipping Market Forecast © Alphaliner 1999-2018 – Contents not to be reproduced without permission
1 November 2018Busan
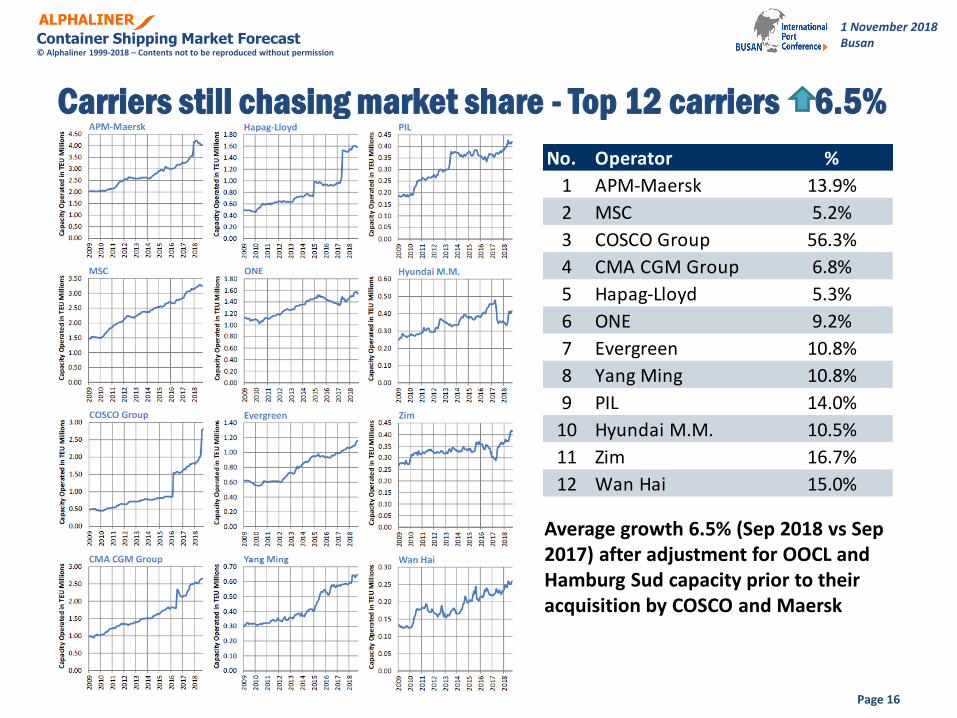
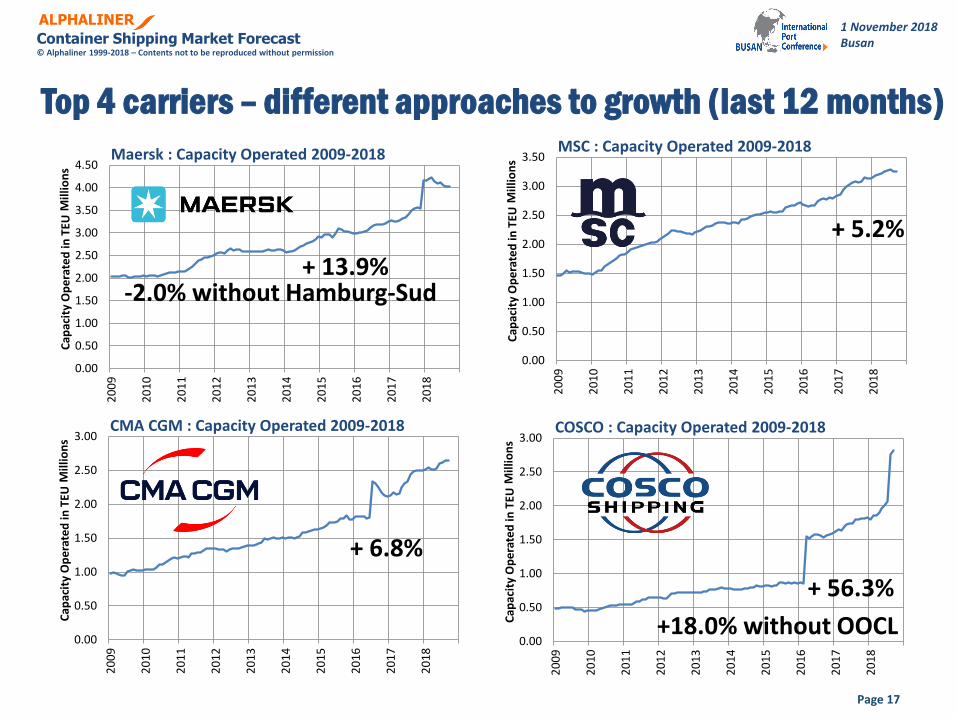
Carriers still chasing market share - Top 12 carriers 6.5%
Page 16
No. Operator %
1 APM-Maersk 13.9%
2 MSC 5.2%
3 COSCO Group 56.3%
4 CMA CGM Group 6.8%
5 Hapag-Lloyd 5.3%
6 ONE 9.2%
7 Evergreen 10.8%
8 Yang Ming 10.8%
9 PIL 14.0%
10 Hyundai M.M. 10.5%
11 Zim 16.7%
12 Wan Hai 15.0%
Average growth 6.5% (Sep 2018 vs Sep 2017) after adjustment for OOCL and Hamburg Sud capacity prior to their acquisition by COSCO and Maersk
ALPHALINER
Container Shipping Market Forecast © Alphaliner 1999-2018 – Contents not to be reproduced without permission
1 November 2018Busan
0.00
0.50
1.00
1.50
2.00
2.50
3.00
3.50
4.00
4.50
20
09
20
10
20
11
20
12
20
13
20
14
20
15
20
16
20
17
20
18
Cap
acit
y O
per
ated
in T
EU M
illio
ns
Maersk : Capacity Operated 2009-2018
0.00
0.50
1.00
1.50
2.00
2.50
3.00
3.50
20
09
20
10
20
11
20
12
20
13
20
14
20
15
20
16
20
17
20
18
Cap
acit
y O
per
ated
in T
EU M
illio
ns
MSC : Capacity Operated 2009-2018
0.00
0.50
1.00
1.50
2.00
2.50
3.00
20
09
20
10
20
11
20
12
20
13
20
14
20
15
20
16
20
17
20
18
Cap
acit
y O
per
ated
in T
EU M
illio
ns
COSCO : Capacity Operated 2009-2018
0.00
0.50
1.00
1.50
2.00
2.50
3.00
20
09
20
10
20
11
20
12
20
13
20
14
20
15
20
16
20
17
20
18
Cap
acit
y O
per
ated
in T
EU M
illio
ns
CMA CGM : Capacity Operated 2009-2018
Top 4 carriers – different approaches to growth (last 12 months)
Page 17
-2.0% without Hamburg-Sud+ 13.9%
+ 5.2%
+ 6.8%
+ 56.3%
+18.0% without OOCL

ALPHALINER
Container Shipping Market Forecast © Alphaliner 1999-2018 – Contents not to be reproduced without permission
1 November 2018Busan
COSCO - most aggressive growth
Page 18
COSCO SHIPPING
Deliveries in 2018
20K class – 11 ships (9 delivered)
14k class – 7 ships (5 delivered)
Deliveries in 2019
20K class – 6 ships
14k class – 4 ships
ALPHALINER
Container Shipping Market Forecast © Alphaliner 1999-2018 – Contents not to be reproduced without permission
1 November 2018Busan
End Please send any queries to [email protected]


