60
The full spectrum of cutting-edge applications and techniques Symposium Confocal Raman Imaging 12 th 28. – 30. Sep. 2015 | Ulm, Germany

The full spectrum of cutting-edge applications and techniques
Symposium Confocal Raman Imaging12
th
28. – 30. Sep. 2015 | Ulm, Germany

PIONEERS BY PROFESSIONPIONEERS BYPIONEERSPIONEERS BY
The Mars rover Spirit began automated analysis
of the planet‘s rocks and soil in January 2004.
CCl4 in an oil-water-alkane emulsionCCl4 in an oil-water-alkane emulsionCCl4 in an oil-water-alkane emulsion
• Absolute excitation Laser power determination in 0.1 mW steps (TruePower).
• High-res spectroscopy and imaging in parallel
• User-friendly access to industry- leading performance
www.witec.de
apyronAutomated Raman Imaging
The WITec apyron Raman system automates the exploration
of sample surfaces and chemical components. Software
controlled, self-adjusting measurement routines along with
TruePower and motorization bring a revelation in user-
friendliness to cutting edge Raman imaging.
Feel the spirit of exploration, automatically.WITec apyron – convenience meets performance.
Raman • AFM • SNOM • RISE
WITec HeadquartersWITec GmbH, Lise-Meitner-Str. 6, 89081 Ulm, Germany, phone +49 (0)731 140700, [email protected]

General Information
Abstracts Invited Talks
Abstracts
Contributed Posters
Abstracts
Contributed Talks


General Information


28. 09. – 30. 09. 2015 | Ulm, Germany
General Information
Locations
Conference Talks and Poster Sessions (28. and 29. September)
Stadthaus Ulm, Münsterplatz 50, 89073 Ulm
Dinner (29.September, 07:00 pm)
Restaurant “Ratskeller”, Marktplatz 1, 89073 Ulm
Equipment Demonstration (30.September)
WITec Headquarters, Lise-Meitner-Str. 6, 89081 Ulm
Please see the enclosed city map and directions for details.
Bus Shuttle
WITec provides a Bus Shuttle Service on 30.September to go from the city center
to the WITec headquarters in the morning and back to the city center in the
afternoon. Bus departure will be at the Bus Station City Center/Tourist-Bus
Parking Area at the corner of “Neue Straße”/”Glöcklerstraße” (please see enclosed
city map).
Departure City Center to WITec: 08:45 am
Departure WITec to Central Train Station & City Center: 03:30 pm
Meals
Lunch and dinner on 29.September as well as lunch on 30. September will be
provided by WITec.
WLAN
WLAN connection for guests is available in the WITec Headquarters building. WLAN Name: Pegasus WLAN Password: Goldwing4all!

Conference Program
Monday, 28. September 2015 Stadthaus Ulm, Münsterplatz 50, Ulm
14:30 – 15:00 Registration & Coffee
15:00 – 15:15 Welcome
15:15 – 16:15 Sebastian Schlücker The Principles of Raman Spectroscopy and its Application in Microscopy
16:15 – 16:30 Coffee
16:30 – 17:30 Olaf Hollricher 3D Confocal Raman Imaging: Instrumentation, Resolution, Configurations and Correlative
Techniques
17:30 – 19:00 Contributed Session - Posters Poster Session & Get-together with Beer & Wine Reception and Snacks
19:00 – 20:30 Sightseeing Tour Ulm Old Town – Meeting Point: Stadthaus Main Entrance
Tuesday, 29. September 2015 Stadthaus Ulm, Münsterplatz 50, Ulm
08:45 – 09:00 Coffee
Session I - Materials Sciences
09:00 – 09:30 José F. Fernández Resolving & Manipulating Ferroelectric Domains by Confocal Raman Microscopy
09:30 – 10:00 Mika Lindén Application of Raman Microscopy for the Study of Cementitious Materials
10:00 – 10:30 Ralph Seuwen Analysis of Gaseous Inclusions in Glass
10:30 – 11:00 Coffee
Session II - Life Sciences & Pharmaceutics
11:00 – 11:30 Halina Abramczyk Hope and Innovative Cancer Diagnostics by Raman Imaging
11:30 – 12:00 Dominique Jasmin Lunter Applications of Confocal Raman Microscopy in the Development of Dermal
Dosage Forms
12:00 – 13:00 Lunch & Poster Session (continued)
Session III - 2D Materials
13:00 – 13:30 Glen Birdwell Interlayer Interactions in Stacked 2D Atomic Layered Materials
13:30 – 14:00 Rodney S. Ruoff New Carbons on the Horizon
Session IV - Geosciences
14:00 – 14:30 Martin Hilchenbach Dusty Samples – Raman Microspectroscopy of Reference Materials for the
Rosetta Mission to Comet 67P/Churyumov-Gerasimenko
14:30 – 15:00 Frédéric Foucher Detection of Biosignatures in Silicified Rocks Using Raman Spectroscopy
15:00 - 15:30 Coffee
Contributed Session - Oral
15:30 - 15:50 Maria Sovago Molecular localization of Lipids in Emulsions by Spontaneous and Stimulated
Raman Microscopy
15:50 – 16:10 Samir El-Mashtoly Cellular Responses, Distribution & Metabolism of EGFR Inhibitors in Cancer Cells
16:10 – 16:30 Carmen Lawatscheck Specific Solubilization of Anti-Alzheimer Disease Drugs by Peptide-Polymer
Conjugates
19:00 Conference Dinner & Best Poster Award Ceremony
Wednesday, 30. September 2015 WITec Headquarters, Lise-Meitner-Str. 6, Ulm
08:45 Bus Shuttle from Ulm City Center to WITec Headquarters
09:15 - 09.45 Harald Fischer Confocal Raman Imaging System Configurations
09:45 - 12:15 Equipment Demonstration Confocal Raman Imaging & Automation; Combining AFM & Raman Imaging;
TrueSurface & Large Area Imaging; WITec Project FOUR Data Evaluation
Software; RISE Microscopy
12:15 - 13:15 Lunch
13:15 - 14:45 Equipment Demonstration Continued
14:45 Coffee & Wrap-Up
15:30 Bus Shuttle from WITec Headquarters to Ulm City Center

Invited Speakers
Prof. Dr. Sebastian Schlücker, University Duisburg-Essen, Physical Chemistry Department, Germany
Sebastian Schlücker is Professor of Physical Chemistry at the University of Duisburg-Essen. His research interests include the design,
synthesis and bioanalytical applications of SERS nanoparticle probes as well as the development and application of laser spectrosopic
techniques in biophysical chemistry.
Dr. Olaf Hollricher, WITec GmbH, Ulm, Germany
Dr. Hollricher is Managing Director at WITec and Head of Research & Development.
Prof. José F. Fernández, Instituto de Ceramica y Vidrio, CSIC, Madrid, Spain
Prof. José F. Fernandez is Deputy Director of the Instituto de Cerámica y Vidrio, CSIC, and leader of the Ceramic for Smart System Group.
His research interests include functional nanoparticles and nanostructured having unusual optical, magnetic, electric, dielectric and
ferroelectric properties. He is also actively involved in knowledge transfer and scale up activities.
Prof. Mika Lindén, University of Ulm, Inorganic Chemistry, Germany
Prof. Mika LIndén is Institute leader at the Institute of Inorganic Chemistry, Uni Ulm. The research interests include in situ
characterization of nucleation and growth processes, biomaterials for diagnosis and therapy, and synthesis and application of porous
oxides with controlled morphologies.
Dr. Ralph Seuwen, Schott AG, Melting - Glass Defect Diagnostic, Mainz, Germany
Dr. Seuwen is a Senior Scientist in the Department of Melting - Glass Defect Diagnostic at Schott AG. His research group analyzes
gaseous inclusions in glass by mass spectrometry and Raman spectroscopy to support production lines with hints for defect causes.
They provide data of gases in glasses for the scientific understanding of glass melting and simulation especially batch reactions, fining,
bubble behaviour.
Prof. Dr. Halina Abramczyk, Łódź University of Technology, Poland
Halina Abramczyk is a Professor of Chemistry and Director of the Laboratory of Laser Molecular Spectroscopy at the Łódź University of
Technology, Poland. In the period 2007-2009 she headed Marie Curie Chair at Max Born Institute, Berlin, Germany. Her research
activity in the last 10 years has focused on biospectroscopy, femtosecond spectroscopy and Raman spectroscopy and imaging in the
context of biological structures.
Dr. Dominique Jasmin Lunter, University Tuebingen, Pharmaceutical Technology, Germany
Dominique Lunter is a PostDoc fellow at the Department of Pharmaceutical Technology at the University of Tuebingen. Her field of
research is the development of innovative formulations for the topical treatment of skin diseases.
Dr. A. Glen Birdwell, Sensors and Electron Devices Directorate, US Army Research Laboratory, Adelphi, Maryland, USA
Dr. A. Glen Birdwell is a Research Physicist in the Electronics Technology Branch at the US Army Research Laboratory. He conducts
research and development on novel materials and device structures for the purpose of enabling new and improved electronic devices
that can meet the specialized needs of the Army.
Prof. Rodney S. Ruoff, Center for Multidimensional Carbon Materials, Ulsan National Institute of Science and Technology,
South-Korea
Prof. Rodney S. Ruoff is Director of the Center for Multidimensional Carbon Materials, an Institute of Basic Sciences Center located at
the Ulsan National Institute of Science and Technology, South-Korea. He is also UNIST Distinguished Professor with appointments in
the Department of Chemistry and the School of Materials Science at UNIST. His research interests include novel carbon and related
materials, 2D materials, and composites: their synthesis, structure, physical, chemical, and at times biological properties.
Dr. Martin Hilchenbach, Max Planck Institute for Solar System Research, Göttingen, Germany
Dr. Hilchenbach is a Staff Scientist in the Research Group 'Small Bodies and Comets' at the Max Planck Institute for Solar System
Research in Göttingen, Germany.
Dr. Frédéric Foucher, CNRS Orleans, Centre de Biophysique Moléculaire, France
Dr. Frédéric Foucher is research engineer at the Exobiology group of the Centre de Biophysique Moléculaire, Orléans, France. The
research interests include the study of old traces of life, origin of life and the search for extraterrestrial life, in particular on Mars. He is
in charge of the AFM/Raman facility of his laboratory and of the International Space Analogue Rockstore.

City Map and SymposiumLocations 2015
Dinner atRestaurant RatskellerMarktplatz 1
29. September, 7:00 pm
Conference LocationStadthausMünsterplatz 50
28. and 29. September
Shuttle Bus fromUlm City Centerto WITec Headquarters
30. September, 8:45 am


Abstracts
Invited Talks

Hope and Innovative Cancer Diagnostics by Raman
Halina Abramczyk1, Monika Kopeć2,
Beata Brozek-Pluska3 1Laboratory of Laser Molecular Spectroscopy, IARC, Lodz, Poland 2Laboratory of Laser Molecular Spectroscopy, IARC, Lodz, Poland 3 Laboratory of Laser Molecular Spectroscopy, IARC, Lodz, Poland
Looking inside the human body fascinated mankind for thousands of years. Current diagnostic and therapy methods are often limited by inadequate sensitivity, specificity and spatial resolution. Raman imaging may bring revolution in monitoring of disease and treatment. The main advantage of Raman imaging is that it gives spatial information about various chemical constituents in defined cellular organelles in contrast to conventional methods (liquid chromatography/mass spectrometry, NMR, HPLC) that rely on bulk or fractionated analyses of extracted components. We demonstrated how Raman imaging can drive the progress on breast cancer just unimaginable a few years ago. We looked inside human breast ducts answering fundamental questions about location and distribution of various biochemical components inside the lumen, epithelial cells of the duct and the stroma around the duct during cancer development. We have identified candidates for Raman diagnostic markers for breast cancer prognosis: carotenoids, mammaglobin, palmitic acid and sphingomyelin as key molecular targets in ductal breast cancer in situ. We have proposed molecular mechanisms linking the Raman markers with lipid metabolism.
Fig. 1: Raman image of the cancerous breast duct (ductal carcinoma in situ, G1 and G2, P115) (A)
compared with the microscopy image (B), H&E-stained histological image (C), and the characteristic
vibrational spectra for different areas of the tissue (D), the colours of the lines correspond to the
colours of the areas in Raman image (A).

Interlayer Interactions in Stacked 2D Atomic Layered Materials
A. Glen Birdwell and Frank J. Crowne US Army Research Laboratory, Adelphi, Maryland 20783, USA
Raman images of graphene/hexagonal boron nitride (hBN) heterostructures were obtained from samples fabricated by the dry-transfer method inspired by Zomer and co-workers.1 In-depth investigations into the regions shown in Figure 1 revealed the presence of subtle interlayer interactions between adjacent graphene layers, and between the graphene and hBN substrate. The behavior of Raman spectra taken from monolayer graphene bifolds is consistent with that of two distinct twisted-bilayer graphene superlattices. By combining information about the resonance properties of the G peak as a function of exciting laser energy with topographical data from atomic force microscopy, we have estimated the twist angles between the adjacent layers that make up the bifold. This information allowed us to compare the positions of the superlattice-related Raman modes with the existing theory. We observed additional evidence for the existence of interaction modes between the transferred graphene and hBN substrate in both monolayer and bilayer graphene regions. Careful examination of these Raman modes indicate behavior similar to the superlattice-related modes observed in twisted-bilayer graphene. An extension was made of existing twisted-bilayer graphene theory in order to account for the lattice mismatch between graphene and hBN, leading to a good match with the experimental findings. In this talk we will also describe in detail various phenomena due to device processing and variation of sample temperature, some of which we expected and others yet to be fully understood. These results provide a few modest examples of how Raman spectroscopy studies of 2D materials and their heterostructures continue to yield new physics, which in turn give rise to novel device concepts. 1 P. J. Zomer, S. P. Dash, N. Tombros, and B. J. van Wees, Appl. Phys. Lett. 99, 232104 (2011).
Fig. 1: Raman image of the graphene G peak intensity. Monolayer, bilayer, and
trilayer graphene regions are labeled 1L, 2L, and 3L, respectively.

Resolving and manipulating ferroelectric domains by Confocal Raman Microscopy
J. F. Fernández1,* A. Del Campo1, P. Marchet2 F. Rubio-Marcos1
1Electroceramic Department, Instituto de Cerámica y Vidrio, CSIC, Kelsen 5, 28049, Madrid, Spain.
2Laboratoire de Science des Procédés Céramiques et de Traitements de Surface, UMR 7315 CNRS, Université de Limoges, Centre Européen de la
Céramique, 12, rue Atlantis, 87068, Limoges Cedex, France *e-mail: [email protected]
Ferroelectric materials exhibit spontaneous and stable polarization, which can usually be reoriented by an applied external electric field. The electrically switchable nature of this polarization is at the core of various ferroelectric devices. The motion of the associated domain walls provides the basis for ferroelectric memory, in which the storage of data bits is achieved by driving domain walls that separate regions with different polarization directions.
The spatial resolved structure of the ferroelectric domain existing in (K,Na)NbO3 based ceramics is studied by confocal Raman microscopy (CRM) coupled with atomic force microscopy.1 In addition to the domain identification, CRM allows a determination of the nature of domain walls and correlation between the structure and piezoelectric properties. The tetragonal constraint for orthorhombic domain formations is demonstrated by this technique.
The surprising ability to move ferroelectric domain walls of a BaTiO3 single crystal by varying the polarization angle of a coherent light source is obtained by using in situ Confocal Raman microscopy.2 There is an unexpected coupling between polarized light and ferroelectric polarization that modifies the stress induced at the domain wall. This effect potentially leads to the non-contact remote control of ferroelectric domain walls by light. Rerences
1. F. Rubio-Marcos et al. J. Mater. Chem., 2012, 22, 9714–9720.
2. F. Rubio-Marcos et al., Nat. Commun., 2015,6:6594.
Figure: Mapping of the domain structure of the BTO single crystal through confocal Raman microscopy. (a) Optical micrograph of the BTO single crystal. The Raman image shows the domain distribution at the surface by colour code (b) as well as in the depth scan, cross section, (c). The Raman images resulted from the mapping of the different single Raman spectra collected in each pixel of the marked rectangle area in a. Scale bar, 20 µm.

The search for ancient life on Mars using Raman spectroscopy
F. Foucher1, M.-R. Ammar2, G. Lopez-Reyes3, N. Bost2, F. Rull-Pérez3, P. Rüßmann4, and F. Westall1
1CBM, CNRS, Orléans, France 2CEMHTI, CNRS, Orléans, France
3Unidad Asociada Universidad de Valladolid – CSIC – Centro de Astrobiologia, Valladolid, Spain
4Université d’Orléans, Orléans, France Early Mars was characterised by a dynamic environment dominated by volcanism and impacts with associated hydrothermal activity. Evidence for water on the surface of the planet during the Noachian (-4.5 to -3.9 Ga), together with the other necessary ingredients of life (carbon, nutrients and energy), supports the hypothesis that life could have appeared on the planet. One of the objectives of the future ExoMars 2018 (ESA/Roscosmos) and Mars 2020 (NASA) missions is to search for traces of microbial remains in Martian rocks. Since Raman spectroscopy is sensitive to both organic and mineral compounds, it will play a key role during the investigations [1,2]. Due to the heterogeneous distribution of the habitable conditions in time and space on the Martian surface, potential microbes are expected to have remained very primitive – and likely very small [3], similar to the oldest fossils found on Earth in 3.5 Ga old rocks from Australia and South Africa [3-5]. Even on Earth, due to the small size and simple shapes of these microfossils, their biotic origin and syngenecity are often difficult to demonstrate and require sophisticated instrumentation [4,5]. The detection and resolution limitations of space qualified instruments will make this demonstration all the more complicated on Mars during future in situ missions [1,2]. The aim of our work is to determine which biosignatures associated to microfossils could be detected by Raman spectroscopy. In order to facilitate the investigation, we studied relatively large microfossils (~10 µm) using mapping mode. We were thus able to detect different biosignatures associated with silicified microorganisms, in particular opaline silica and variations in the signal of carbonaceous matter (Fig. 1) [6,7].
References : [1] Foucher et al. (2013) J. Raman Spec. 44, 916-925. [2] Bost et al. (2015) Planet. Space Sci. 108, 87-97. [3] Westall F. et al. (2013) Astrobiology 13:9, 887-897. [4] Westall F. et al. (2011) Earth Planet. Sci. Lett. 310, 468-479. [5] Westall F. et al. (2011) Planet. Space Sci. 59, 1093-1106. [6] Foucher et al. (2013) Astrobiology 13:1, 57-67. [7] Foucher et al. (2015) J. Raman Spec., published online, doi:10.1002/jrs.4687.
Figure 1: Raman map of silicified planktonic
microorgansims from the 800 Ma old Draken
formation. (a) Optical microscopic view, (b)
Raman compositional map with quartz in orange,
the carbonaceous matter in green and the
opaline silica in purple and (c) ratio of the two
main peak intensities of the carbonaceous matter
spectrum.
Dusty Samples – Raman Microspectroscopy of reference materials for the Rosetta mission to comet 67P/ Churyumov-Gerasimenko
M. Hilchenbach, Max Planck Institute for Solar System Research,
Justus-von-Liebig-Weg 3, 37077 Göttingen, Germany Since August 2014, after a 10 year journey, the ESA Rosetta spacecraft travels along and around the nucleus of comet 67P/Churyumov-Gerasimenko. One of the onboard dust instruments is the COmetary Secondary Ion Mass Analyzer COSIMA which is collecting dust in the inner coma and, after imaging with a microscope, analyses the chemical composition of the dust particles with a secondary ion mass spectrometer (SIMS). In 2009, we started to apply the Raman technique with a WITEC alpha300 R confocal microscope for analyzing the COSIMA reference and calibration samples such as minerals from crashed rocks or meteorites prior to the SIMS measurement with the COSIMA ground reference instrument. The Raman technique has proven a very sensitive tool for spotting contaminations as well as mislabeled samples. We will discuss the Raman and SIMS cross calibration in view of the cometary dust analysis onboard Rosetta.
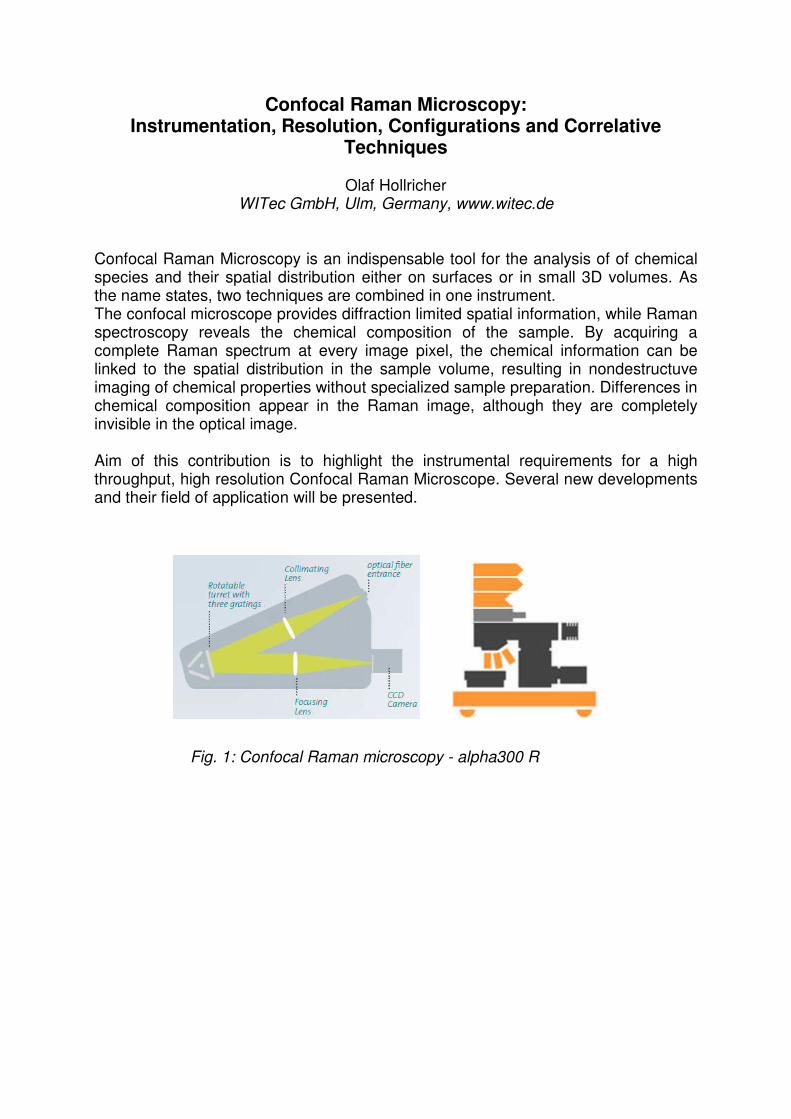
Confocal Raman Microscopy: Instrumentation, Resolution, Configurations and Correlative
Techniques
Olaf Hollricher WITec GmbH, Ulm, Germany, www.witec.de
Confocal Raman Microscopy is an indispensable tool for the analysis of of chemical species and their spatial distribution either on surfaces or in small 3D volumes. As the name states, two techniques are combined in one instrument. The confocal microscope provides diffraction limited spatial information, while Raman spectroscopy reveals the chemical composition of the sample. By acquiring a complete Raman spectrum at every image pixel, the chemical information can be linked to the spatial distribution in the sample volume, resulting in nondestructuve imaging of chemical properties without specialized sample preparation. Differences in chemical composition appear in the Raman image, although they are completely invisible in the optical image. Aim of this contribution is to highlight the instrumental requirements for a high throughput, high resolution Confocal Raman Microscope. Several new developments and their field of application will be presented.
Fig. 1: Confocal Raman microscopy - alpha300 R

Cement hydration studied by confocal Raman microscopy
Jonas Higl, and Mika Lindén1
1 Inorganic Chemistry II, Ulm Universtity, Albert-Einstein-Allee 11, 89075 Ulm,
Germany
Hydration of cement is a highly complex process involving many reactions that
proceed with different kinetics. A detailed understanding of these processes is key for
developing new cements, and also in order to understand how changes in klinker
processing influences cement reactivity and in the end hardness of the cement. C3S
(3 CaO·SiO2) is the principal component of ordinary Portland cement (OPC) and its
main hydration product, C-S-H, is responsible for the fundamental properties during
the hardening process of cement. C3S exists in three modifications (triclinic,
monoclinic and rhombohedral), from which the monoclinic C3S (m-C3S) is the chief
modification found in technical clinker where it is termed as alite. The reaction of m-
C3S with water leads to two hydration products, the already mentioned C-S-H and
CH (Ca(OH)2). A possible reaction of m-C3S with water can be written as follows:
2 (3 CaO·SiO2) + 6 H2O → 3 CaO·2 SiO2·3 H2O + 3 Ca(OH)2
2 C3S + 6 H → C3S2H3 + 3 CH
Although decades of research has been devoted to understanding cement hydration
several open questions still remain. This is especially true for the spatial distribution
of reaction products and the exact time-coarse of the different reactions. Most of the
current knowledge is based on results obtained by isothermal calorimetry in
combination with x-ray diffraction. Both methods reveal important bulk information
about the hydrating klinker, but do not reveal local information. Furthermore,
amorphous phases are also very difficult to study with this combination of techniques.
Recent developments in confocal Raman microscopy has made it possible to study
hydrating cements with little or no need for sample preparation with relatively good
time-resolution. The analysis reveals new information about the distribution and
relative crystallite sizes of key components in the hardening cement, and suggests
that confocal Raman microscopy is a very promising method for studying cementious
systems.

Applications of Confocal Raman Microscopy in the Development of Dermal Dosage Forms
D. Lunter
Pharmaceutical Technology, University of Tuebingen, Tuebingen, Germany
Confocal Raman microscopy (CRM) is increasingly used in the development of dermal dosage forms. Applications of CRM in this field include the characterization of formulations at early development stages as well as for quality control during shelf life. Furthermore, the tracking of ingredients (pharmaceutical actives or excipients) within the skin is gaining increasing attention. This presentation will give two examples of applications of CRM in the development of dermal dosage forms: 1) the characterization of formulations at an early stage of development and 2) the visualization of the penetration of a pharmaceutical active into the skin. The first part of the talk will outline how CRM was used in the development of a film forming sustained release dermal formulation. It will be shown that incompatibilities between various constituents of the formulations could be identified quickly and reliably. Furthermore, the investigation of the formulation in its native state as well as after film formation and in contact with the skin will be discussed. It will be shown that with the help of CRM the targeted mode of action could be achieved. CRM has also become an advancing technique in the characterization of drug absorption into the skin. Thus, the second part of the talk will focus on the investigation of the skin penetration of a local anesthetic from a semisolid preparation. Here, the effect of two chemical enhancers on skin penetration had been investigated. It will be shown that CRM is capable of providing detailed information on the penetration of pharmaceutical actives into the skin and may elucidate their distribution within the skin with high resolution.
Fig. 1: color coded CRM image of a film forming sustained release formulation on
epidermis; color code: ▪epidermis, ▪▪▪▪formulation; scale bar: 3 µm
Graphene, and Carbon Materials for the Future
R. S. Ruoff1,2 1Center for Multidimensional Carbon Materials (CMCM), Institute for Basic Science
(IBS) Center on the UNIST Campus 2Department of Chemistry and School of Materials Science, Ulsan National Institute
of Science & Technology (UNIST), Ulsan 689-798, Republic of Korea
I appreciate the opportunity to briefly introduce the Center for Multidimensional Carbon Materials, an Institute of Basic Science Center located at the Ulsan National Institute of Science and Technology. I would like to then discuss some of our work on graphene and some possible new directions for graphene research. A personal perspective of what new carbon and related materials might be achieved in the future will then be presented. These include ‘negative curvature carbons’, ‘diamane’ and related ultrathin sp3-bonded carbon films/foils, sp2/sp3-hybrid materials, and others. I expect to show a few examples of the use of Raman imaging and spectroscopy in our work on graphene. Of possible interest: 1. (a) Lu XK, Yu MF, Huang H, and Ruoff RS, Tailoring graphite with the goal of achieving single sheets, Nanotechnology, 10, 269-272 (1999). (b) Lu XK, Huang H, Nemchuk N, and Ruoff RS, Patterning of highly oriented pyrolytic graphite by oxygen plasma etching, Applied Physics Letters, 75, 193-195 (1999). 2. Zhu YW, Murali S, Stoller MD, Ganesh KJ, Cai WW, Ferreira PJ, Pirkle A, Wallace RM, Cychosz KA, Thommes M, Su D, Stach EA, Ruoff RS, Carbon-Based Supercapacitors Produced by Activation of Graphene. Science 332, 1537-1541 (2011). 3. Odkhuu D, Shin D, Ruoff RS, Park N, Conversion of Multilayer Graphene Into Continuous Ultrathin sp3-bonded Carbon Films on Metal Surfaces Density. Scientific Reports 3, 3276 (2013). 4. Ruoff RS, Personal perspectives on graphene: New graphene-related materials on the horizon. MRS Bulletin, 37, 1314-1318 (2012). Rodney S. Ruoff, Distinguished Professor, UNIST Department of Chemistry and the School of Materials Science and Engineering, is director of the Center for Multidimensional Carbon Materials (CMCM), an IBS Center located at the Ulsan National Institute of Science and Technology (UNIST) campus. Prior to joining UNIST he was the Cockrell Family Regents Endowed Chair Professor at the University of Texas at Austin from September, 2007. He earned his Ph.D. in Chemical Physics from the University of Illinois-Urbana in 1988, and he was a Fulbright Fellow in 1988-89 at the Max Planck Institute für Strömungsforschung in Göttingen, Germany. He was at Northwestern University from January 2000 to August 2007, where he was the John Evans Professor of Nanoengineering and director of NU’s Biologically Inspired Materials Institute. He has co-authored over 410 peer-reviewed publications related to chemistry, physics, materials science, mechanics, and biomedical science, current H-factor is 101, and he is a Fellow of the Materials Research Society, the American Physical Society, and the American Association for the Advancement of Science. He was recently awarded the 2014 MRS Turnbull Lectureship prize.

The Principle of Raman Spectroscopy and its Application in Microscopy
S. Schlücker
University of Duisburg-Essen, Germany This lecture gives an introduction into the principles of Raman spectroscopy and its applications in microscopy. First, both classical and quantum mechanical descriptions of the Raman effect are discussed. The latter (perturbation theory, Kramers-Heisenberg-Dirac dispersion formula) then serves as a starting point for introducing the concept of resonance Raman scattering (RRS). Several examples of RR (from diatomics to proteins) highlight the advantages of this Raman technique. In addition to the Raman effect, also fundamentals of molecular vibrations and their symmetry (basic group theory) are covered by using the water molecule as an example. We then make the transition to Raman microscopy, starting with the invention of the first Raman "microprobe" in the 1970s. Also other specialized Raman techniques such as surface-enhanced Raman scattering (SERS) and coherent-anti-Stokes Raman scattering (CARS) microscopy are briefly introduced and their specific advantages over conventional Raman spectroscopy are highlighted. Finally, quiz questions allow the participants to test their knowledge anonymously in an interactive format (feedback and discussion).
Gas Analysis in Glass Defects by Raman Imaging
Dr. Ralph Seuwen1, Thomas Korb2, Silke Krause3, Markus Stieglitz4, Lars Dohmen5 1,2,3,4, SCHOTT AG, Mainz, Germany
5 Steinmann-Institut, University of Bonn, Germany
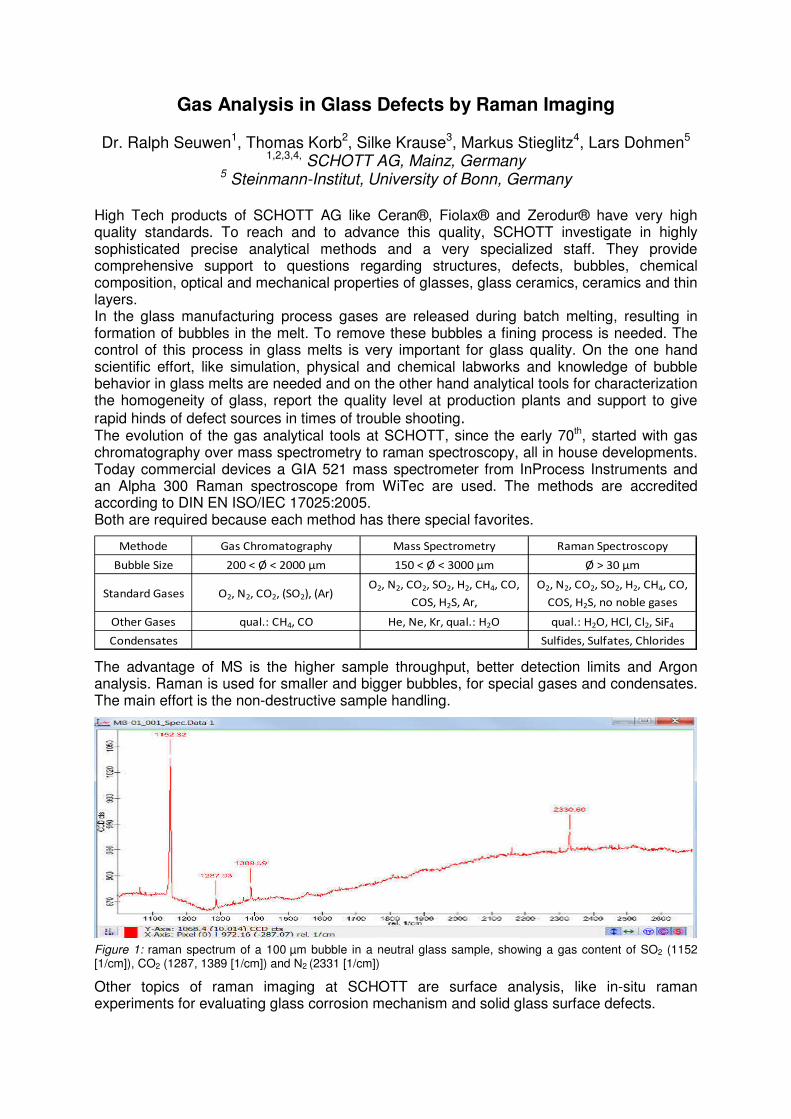
High Tech products of SCHOTT AG like Ceran®, Fiolax® and Zerodur® have very high quality standards. To reach and to advance this quality, SCHOTT investigate in highly sophisticated precise analytical methods and a very specialized staff. They provide comprehensive support to questions regarding structures, defects, bubbles, chemical composition, optical and mechanical properties of glasses, glass ceramics, ceramics and thin layers. In the glass manufacturing process gases are released during batch melting, resulting in formation of bubbles in the melt. To remove these bubbles a fining process is needed. The control of this process in glass melts is very important for glass quality. On the one hand scientific effort, like simulation, physical and chemical labworks and knowledge of bubble behavior in glass melts are needed and on the other hand analytical tools for characterization the homogeneity of glass, report the quality level at production plants and support to give
rapid hinds of defect sources in times of trouble shooting. The evolution of the gas analytical tools at SCHOTT, since the early 70th, started with gas chromatography over mass spectrometry to raman spectroscopy, all in house developments. Today commercial devices a GIA 521 mass spectrometer from InProcess Instruments and an Alpha 300 Raman spectroscope from WiTec are used. The methods are accredited according to DIN EN ISO/IEC 17025:2005. Both are required because each method has there special favorites.
Methode Gas Chromatography Mass Spectrometry Raman Spectroscopy
Bubble Size 200 < Ø < 2000 µm 150 < Ø < 3000 µm Ø > 30 µm
Standard Gases O2, N2, CO2, (SO2), (Ar) O2, N2, CO2, SO2, H2, CH4, CO,
COS, H2S, Ar,
O2, N2, CO2, SO2, H2, CH4, CO,
COS, H2S, no noble gases
Other Gases qual.: CH4, CO He, Ne, Kr, qual.: H2O qual.: H2O, HCl, Cl2, SiF4
Condensates Sulfides, Sulfates, Chlorides
The advantage of MS is the higher sample throughput, better detection limits and Argon analysis. Raman is used for smaller and bigger bubbles, for special gases and condensates. The main effort is the non-destructive sample handling.
Figure 1: raman spectrum of a 100 µm bubble in a neutral glass sample, showing a gas content of SO2 (1152 [1/cm]), CO2 (1287, 1389 [1/cm]) and N2 (2331 [1/cm])
Other topics of raman imaging at SCHOTT are surface analysis, like in-situ raman experiments for evaluating glass corrosion mechanism and solid glass surface defects.

Abstracts
Contributed Talks


Cellular responses, distribution and metabolism of EGFR inhibitors in cancer cells
Samir F. El-Mashtoly, Hesham K. Yosef, Wissam Alsaidi, Laven Mavarani, Dennis Petersen, Carsten Kötting, and Klaus Gerwert
Department of Biophysics, Ruhr-University Bochum, Bochum, Germany
Targeting epidermal growth factor receptor (EGFR) is one of the most effective strategies to suppress tumors in advanced stages due to its overexpression in many cancers. Panitumumab and erlotinib are EGFR inhibitors. Panitumumab blocks the extracellular domain of the receptor to prevent ligand binding, while erlotinib competes with the ATP binding site of the receptor intracellular tyrosine kinase (TK) domain. They disrupt downstream signaling cascade, which is responsible for tumor growth and progression. Here, we have investigated the effect of panitumumab and erlotinib on cellular components of colon cancer cells with and without K-RAS mutations using Raman spectral imaging. In case of cancer cells in which K-RAS is mutated, no significant alteration is observed in the Raman spectra of cells after incubation with panitumumab or erlotinib.1,2 In contrast, colon cancer cells with wild-type K-RAS showed large spectral changes that indicate changes in the biochemical composition of treated cells.1,2 This can be attributed to the therapeutic effect of panitumumab or erlotinib those prevent auto-phosphorylation of different downstream pathways and trigger the apoptotic state. These results are in agreement with the clinical studies, which have indicated that patients with K-RAS mutated colon cancer have a decreased response to panitumumab and erlotinib. In addition, we have shown the distribution of erlotinib and neratinib, TK inhibitors, in colon cancer cells. Raman results indicated that erlotinib and neratinib have strong C≡C and C≡N stretching vibrations, respectively, which are located in a Raman silent region of cells.3 Thus, they can be used as a label-free marker bands for drugs. The Raman results also indicated that these drugs are metabolized in cells. These results show the potential of Raman microspectroscopy as a non-invasive tool to investigate pharmacokinetics. Furthermore, we have established Raman spectral histopathology method, which is an automatic classification of the biochemical state of tissues. Excellent data quality is obtained and differentiates between healthy and cancerous tissues and resolves erythrocytes, lymphocytes and single cell nuclei in the tissue section. We also found that auto fluorescence is spatially overlapped with the fluorescence of antibodies against p53 that is used in a routine immunohistochemistry in surgical pathology.4 This fluorescence indicates nuclei of cancer cells with mutated p53 and allows label free assignment of cancer cells. These results open new avenues for medical diagnosis by Raman microscopy and auto fluorescence. 1. El-Mashtoly, S.F., Yosef, H.K., Petersen, D., Mavarani, L., Maghnouj, A., Hahn, S., Kötting, C.,
Gerwert, K. Anal. Chem. 2015, DOI: 10.1021/acs.analchem.5b01431. 2. Yosef, H.K., Mavarani, L., Maghnouj, A., Hahn, S., El-Mashtoly, S.F., and Gerwert, K. Anal Bioanal.
Chem. 2015, DOI: 10.1007/s00216-015-8875-z. 3. El-Mashtoly, S.F., Petersen, D., Yosef, H.K., Mosig, A., Reinacher-Schick, A., Kötting, C., and
Gerwert, K. Analyst, 2014, 139, 1155-1161. 4. Mavarani, L., Petersen, D., El-Mashtoly, S.F., Mosig, A., Tannapfel, A., Kötting, C., and Gerwert, K.
Analyst 2013, 138, 4035-9039.
Specific solubilization of anti-Alzheimer disease drugs by peptide-polymer conjugates
Carmen Lawatscheck1, Marcus Pickhardt2, Sebastian Wieczorek1,
Andrea Grafmüller3, Eckhard Mandelkow2, Hans G. Börner1
1Department of Chemistry, Humboldt-Universität zu Berlin – Brook-Taylor-Str. 2 -
12489, Berlin, Germany 2Deutsches Zentrum für neurodegenerative Erkrankungen (DZNE) and CAESAR
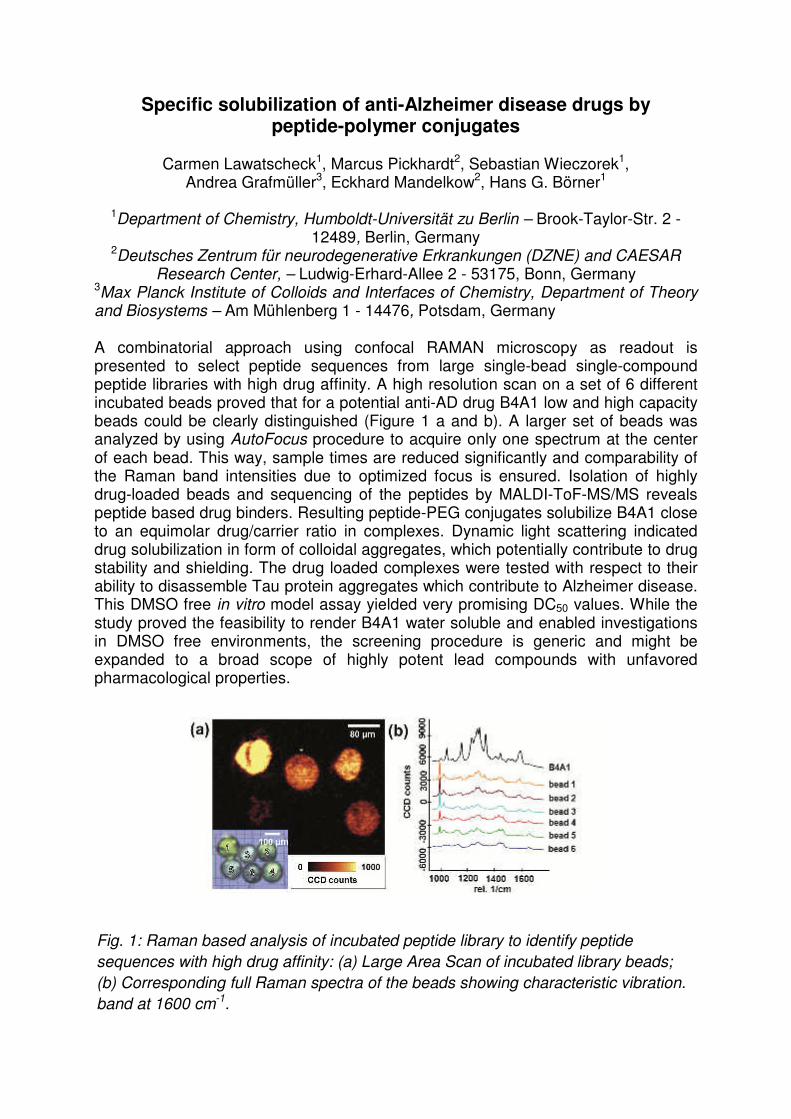
Research Center, – Ludwig-Erhard-Allee 2 - 53175, Bonn, Germany 3Max Planck Institute of Colloids and Interfaces of Chemistry, Department of Theory and Biosystems – Am Mühlenberg 1 - 14476, Potsdam, Germany A combinatorial approach using confocal RAMAN microscopy as readout is presented to select peptide sequences from large single-bead single-compound peptide libraries with high drug affinity. A high resolution scan on a set of 6 different incubated beads proved that for a potential anti-AD drug B4A1 low and high capacity beads could be clearly distinguished (Figure 1 a and b). A larger set of beads was analyzed by using AutoFocus procedure to acquire only one spectrum at the center of each bead. This way, sample times are reduced significantly and comparability of the Raman band intensities due to optimized focus is ensured. Isolation of highly drug-loaded beads and sequencing of the peptides by MALDI-ToF-MS/MS reveals peptide based drug binders. Resulting peptide-PEG conjugates solubilize B4A1 close to an equimolar drug/carrier ratio in complexes. Dynamic light scattering indicated drug solubilization in form of colloidal aggregates, which potentially contribute to drug stability and shielding. The drug loaded complexes were tested with respect to their ability to disassemble Tau protein aggregates which contribute to Alzheimer disease. This DMSO free in vitro model assay yielded very promising DC50 values. While the study proved the feasibility to render B4A1 water soluble and enabled investigations in DMSO free environments, the screening procedure is generic and might be expanded to a broad scope of highly potent lead compounds with unfavored pharmacological properties.
Fig. 1: Raman based analysis of incubated peptide library to identify peptide
sequences with high drug affinity: (a) Large Area Scan of incubated library beads;
(b) Corresponding full Raman spectra of the beads showing characteristic vibration.
band at 1600 cm-1.

Molecular localization of lipids in emulsions by Spontaneous and Stimulated Raman Microscopy
Maria Sovago1, Gerard van Dalen 1, Ewoud van Velzen1, Erik T. Garbacik 2, 3,
Herman L. Offerhaus 2, John van Duynhoven 1,4
Unilever R&D Vlaardingen, Olivier van Noortlaan 120, 3130 AC Vlaardingen, The Netherlands
2 University of Twente, Optical Sciences, Postbus 217, 7500 AE Enschede, The Netherlands
3 ICFO – The Institute of Photonic Sciences, Av. Carl Friedrich Gauss 3, 08860 Castelldefels (Barcelona), Spain
4 Laboratory of Biophysics and Wageningen NMR Centre, Wageningen University, Dreijenlaan 3, 6703 HA Wageningen, The Netherlands
Lipids are one of the major constituents of food products, like butter and margarine, milk products, meat and ice-cream. They are a major source of energy and essential for our daily nutrition. Many food products are emulsions, containing a mixture of water and oil, where lipids can act as emulsifiers keeping the emulsion stable in time. In order to understand lipids behavior and their role as emulsifiers, we investigate the structure of a water-in-oil emulsion at the micrometer-scale using spontaneous and coherent Raman Imaging. The combination of the two techniques together with hyperspectral data analysis, e.g. Multivariate Curve Resolution (MCR), allows us to determine the structure of the sample in a label-free, 3D and molecular specific manner. Raman Imaging and Coherent Anti-Stokes Raman Spectroscopy (CARS) are used as a molecular finger-print to determine the localization of molecules present in the emulsion: water, sunflower oil (containing mostly triglycerides in liquid phase), solid fat (tryglycerides in crystalline phase) and emulsifier (monoglycerides) (see Figure 1). Raman Imaging proves to be an attractive technique that can be further implemented for localization of other food ingredients, such as proteins, polysaccharides and carbohydrates.
Fig. 1: Molecular structure of water-in-oil emulsion. Left panel: Raman Imaging
showing water droplets in blue, solid fat in red and emulsifier in green. Middle
panel: 3D Raman Imaging scan, with water droplets shown in blue and solid fat in
yellow. Box size: 16.5 x 16.5 x 7 µm. Right panel: Forward CARS Imaging showing
a 3D reconstruction of 71.7 x 71.7 x 9.6 µm of C-H stretch signal centered at 2845
cm-1. Intensity bar for CARS scan is also shown.


Abstracts
Contributed Posters

Cellular responses to tyrosine kinase inhibitors by Raman spectral imaging
Wissam Alsaidi, Hesham K. Yosef, Samir F. El-Mashtoly, and Klaus Gerwert Department of Biophysics, Ruhr-University Bochum, Bochum, Germany
Molecularly targeted cancer therapies block cancer growth and spread using small molecules. First-generation tyrosine kinase inhibitors such as erlotinib compete with ATP to bind to intracellular tyrosine kinase domain of epidermal growth factor receptor (EGFR). EGFR is overexpressed in several tumors, such as those of the breast, head and neck, lung, bladder, colon, cervix, kidney, and brain, and it is one of the main strategic targets for systematic therapy. Erlotinib clinically approved by the US Food and Drug Administration and the European Medicines Agency for the treatment of advanced non-small-cell lung, and pancreatic cancers. It disrupts downstream signaling cascade, which is responsible for tumor growth and progression. However, clinical studies have shown that erlotinib therapy induces T790M mutation in EGFR that mediates resistance to first-generation EGFR inhibitors by inducing steric hindrance in the ATP binding pocket and preventing inhibitor binding. To overcome this problem, second-generation tyrosine kinase inhibitors such as neratinib are used. Neratinib (Figure 1A) binds irreversibly and form a covalent bond to a cysteine residue of EGFR. In the present study, we investigate the uptake, distribution, and metabolism of neratinib in cancer cells by Raman microscopy. In addition, we monitor the cellular responses to erlotinib and neratinib therapies in the presence and absence of EGFR T790M mutation. Figure 1B shows the results of the hierarchical cluster analysis (HCA) of the Raman hyperspectral dataset of cancer cells. Drug clusters are shown in green and red. Raman results indicate that neratinib has a clearly visible C≡N stretching vibration at 2209 cm-1 (Panel C (a)), which is located in a Raman silent region of cells (d). Thus, it can be used as a label-free marker band for neratinib. The Raman results also indicate that part of the drug in cells is metabolized (b, red). The determination of the metabolite is underway. Furthermore, the Raman results demonstrate that T790M mutation in EGFR has no significant effect on neratinib therapy, consistent with the clinical observation. These results indicate the potential of Raman microscopy a non-invasive tool to investigate pharmacokinetics and preclinical therapy evaluation.
Figure 1. (A) Chemical structure of neratinib. (B) HCA results based on the Raman dataset of colon
cancer cells showing nucleus (blue), and neratinib (green and red). (C) Raman spectra from free-
neratinib (a), neratinib within cells (b,c), and cells lacking drug (d).

Gold nanoparticles with surface enhanced Raman scattering capability for the detection and treatment of glioblastoma tumours.
Carlyn A Figueiredo1,2, Daniel Coluccia2,3, Amanda Luck2 , Christian A Smith2, James
T Rutka1,2. 1Laboratory Medicine and Pathobiology, University of Toronto, Toronto, Canada
2Labatt Brain Tumour Research Centre, Hospital for Sick Children, Toronto, Canada 3Kantonsspital Aarau, Department of Neurosurgery, Aarau, Switzerland
Glioblastoma multiforme (GBM) is the most common and lethal form of
primary brain tumour, categorized by the World Health Organization as a grade IV glioma. The median survival time following diagnosis is approximately 12-15 months, even after aggressive treatment, with fewer than 5% of patients surviving to 5 years. Given the infiltrative properties of GBM into microscopic regions of the brain parenchyma, neurosurgeons have been faced with a number of challenges with regards to access and visualization of tumour tissue for adequate resection. Residual tumour cell populations following surgery cannot be easily detected via Magnetic Resonance Imaging (MRI), and contributes to the 80-90% tumour recurrence rate, which is the primary cause of patient mortality. Novel strategies to visualize and target the cells responsible for metastatic recurrence of GBM is urgently needed.
Gold nanoparticles (GNPs) in cancer treatment are of particular interest due to their bio-inert and nontoxic properties. Gold atoms can be engineered to form a spherical structure onto which molecules can be conjugated for various purposes. We have demonstrated that GNPs conjugated with surface enhanced Raman scattering (SERS) reporter molecules allows for in vitro and in vivo detection of nanoparticles based on distinct spectral signatures, offering a novel imaging technique to adequately outline tumour boundaries. Furthermore, GNPs offer great potential for cancer therapeutics, given that drugs can be conjugated onto the surface together with specific tumour targeting moieties.
Armed with this technology, we hypothesize that SERS labelled GNPs can be specifically targeted towards GBM tumours in vivo. Translating our findings to the OR is one of our key interests, leading to collaboration with an engineering company on the design of an intra-operative Raman probe. This probe will serve as a robotic Raman scanner for better visualization of tumour tissue based on SERS GNPs spectra, thereby leading to optimal surgical resection. Furthermore, the addition of therapeutic moieties on the surface of these nanoparticles will provide methods to control tumour growth and proliferation, particularly in residual tissue that evades surgical resection.
Developing techniques to study GBM tumours in vivo is critical towards our understanding of how best to approach these tumours in the realm of nanoneurosurgery. GNPs in conjunction with Raman spectroscopy will help identify specific tumours cell markers within microscopic regions, enhancing our capabilities to target brain tumours without causing excessive damage to normal functioning tissue. This system shows promise for clinical implementation as a strategy to ensure maximum resection of the tumour margin, while also targeting cancer cells to prevent further GBM recurrence and improving patient outcome.

Identification of Microplastics in Sea Samples by Raman Microspectroscopy
D. Fischer, A. Käppler, K.-J. Eichhorn, B. Voit
Leibniz Institute of Polymer Research Dresden, Hohe Straße 6, 01069 Dresden, Germany
Microplastics are micro-sized particles of synthetic polymers in a size range from 5 mm down to 1 µm. They have been observed in marine ecosystems worldwide [1]. Because of their small size microplastics can be mistaken as food and ingested by a variety of organisms [2]. Not only microplastics themselves, but also contained additives (e.g. plasticizers, lubricants, pigments), adsorbed toxic contaminats (e.g. PAK, PCB) [3] or associated pathogenic microorganisms [4] pose a potential risk for the marine foodchain. For a risk assessment reliable data about the occurrence of microplastic particles in marine environments and valid analytical methods are necessary. The poster will show the excellent possibilities of Raman Microspectroscopy to identify microplastics in marine samples on the basis of the chemical structure without any visual presorting. Not only the manual preparation and step-by-step mapping measurement of bigger particles (5 – 0.5 mm), but also the self-acting Raman Imaging method are possible. Thereby the particles are extracted from the marine sample, enzymatically purified and finally filtered on a measurement substrate. With the Raman Imaging technique we get Raman spectra for each measurement “point” of an area up to 10 x 10 mm, which allow distinct identification of each particle. The space-resolved Raman Images are generated by choosing characteristic spectral bands of different synthetic polymers. In conclusion Raman Imaging is a very good automatic method to detect microplastic particles down to 500 nm. [1] V. Hidalgo-Ruz, L. Gutow, R. C. Thompson, M. Thiel, Environ. Sci. Technol., 2012, 46, 3060-75 [2] J. A. Ivar do Sul, M.F. Costa, Environ. Pollut., 2014, 185, 352-364 [3] L. M. Rios, P. R. Jones, C. Moore, U. V Narayan, J. Environ. Monit., 2010, 12, 2226-36 [4] E. R. Zettler, T. J. Mincer, L. A. Amaral-Zettler, Environ. Sci. Technol., 2013, 47, 7137-46
Fig. 1: Raman Image of microplastics particles of a sediment sample from the North Sea
A confocal Raman microscopy (CRM) and ATR-IR spectroscopy investigation of monoclinic C3S hydration
Jonas Higl1, Mika Lindén1
1 Institute of Inorganic Chemistry II, Albert-Einstein-Allee 11, Ulm, Germany
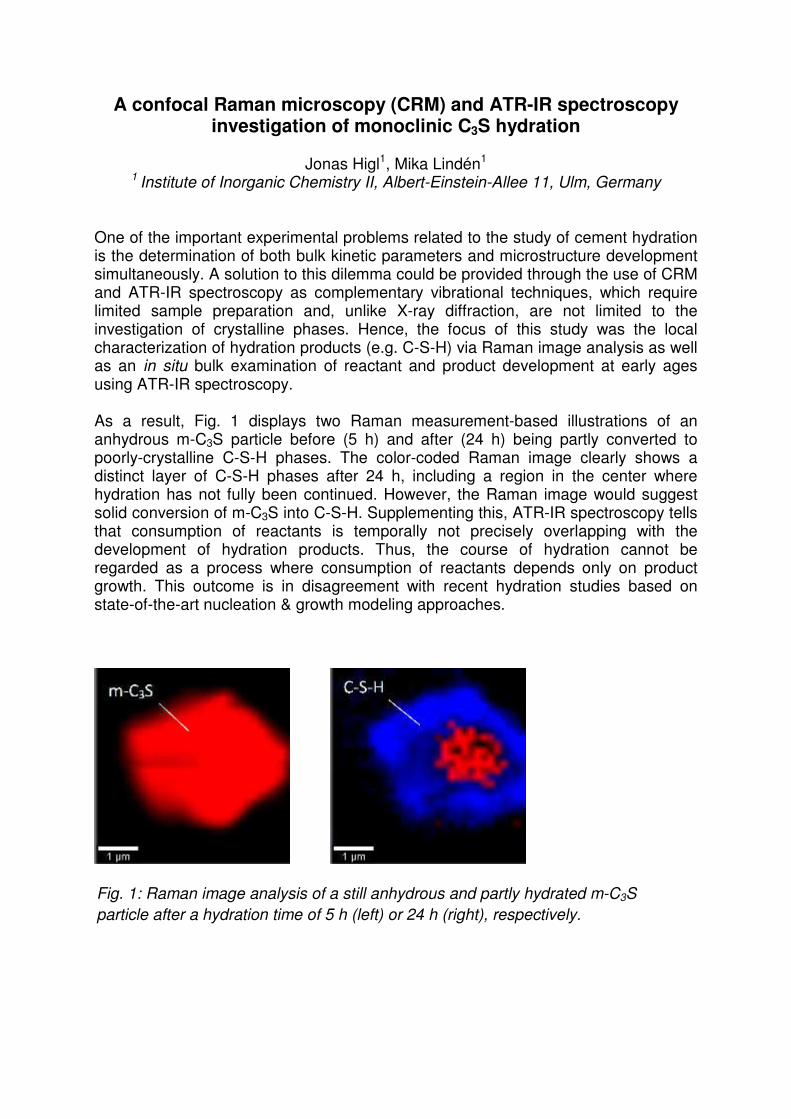
One of the important experimental problems related to the study of cement hydration is the determination of both bulk kinetic parameters and microstructure development simultaneously. A solution to this dilemma could be provided through the use of CRM and ATR-IR spectroscopy as complementary vibrational techniques, which require limited sample preparation and, unlike X-ray diffraction, are not limited to the investigation of crystalline phases. Hence, the focus of this study was the local characterization of hydration products (e.g. C-S-H) via Raman image analysis as well as an in situ bulk examination of reactant and product development at early ages using ATR-IR spectroscopy. As a result, Fig. 1 displays two Raman measurement-based illustrations of an anhydrous m-C3S particle before (5 h) and after (24 h) being partly converted to poorly-crystalline C-S-H phases. The color-coded Raman image clearly shows a distinct layer of C-S-H phases after 24 h, including a region in the center where hydration has not fully been continued. However, the Raman image would suggest solid conversion of m-C3S into C-S-H. Supplementing this, ATR-IR spectroscopy tells that consumption of reactants is temporally not precisely overlapping with the development of hydration products. Thus, the course of hydration cannot be regarded as a process where consumption of reactants depends only on product growth. This outcome is in disagreement with recent hydration studies based on state-of-the-art nucleation & growth modeling approaches.
Fig. 1: Raman image analysis of a still anhydrous and partly hydrated m-C3S
particle after a hydration time of 5 h (left) or 24 h (right), respectively.

PEGylated silver nanoplates as a molecular sieve for sensitive
detection of environmental contaminants
Tibebe Lemma 1,2, Alex Saliniemi1, Vesa Hytönen2, Jussi Toppari1
1NanoScience Center, Department of Physics, P.O. Box 35 (YN), FI-40014, University of Jyväskylä, Jyväskylä, Finland
2BioMediTech, University of Tampere and Fimlab Laboratories, FI-33014 Tampere,
Finland Drinking water contamination with antibiotics is a pressing public problem that needs to be fully addressed. Although microbial contamination remains the largest cause of waterborne outbreaks, antibiotics, such as sulfamethoxazole, ciprofloxacin and trimethoprim, are widely consumed as a medicine and their contaminations in our living environment may carry serious health hazards. In this study, different molecular weights of poly (ethylene glycol) (PEG) were utilized to synthesize sieve-like structure of surface enhanced Raman scattering (SERS)-active silver nanoplates to trap contaminants from dilute samples. PEG surface-antibiotics interactions were examined using Raman spectroscopy both as a function of length of PEG and variation in the size of the antibiotics. The morphology of the PEGylated Ag nanoplates as a function of the chain length was studied by transmission electron microscopy (TEM) imaging and revealed smooth, continuous films with stability towards imaging depending on the chain extender used. The SERS spectra indicated that the enhanced signal depend on the adsorption efficiency of antibiotics on these PEG-containing nanoplates. The results demonstrate that the environmentally-friendly PEGylated silver nanoplates can be potentially used for detection of traces of contaminants from drinking water.
Characterization of a zeolite-templated carbon by in situ Raman spectroscopy
Sarai Leyva-García1, Khanin Nueangnoraj2, Dolores Lozano-Castelló1, Hirotomo
Nishihara2, Takashi Kyotani2, Emilia Morallón3, Diego Cazorla-Amorós1 1 Departamento de Química Inorgánica e Instituto Universitario de Materiales,
Universidad de Alicante, Alicante, Spain 2 Institute of Multidisciplinary Research for Advanced Materials, Tohoku University,
Sendai, Japan
3 Departamento de Química Física e Instituto Universitario de Materiales, Universidad de Alicante, Alicante, Spain
Zeolite-templated carbon (ZTC) synthesized in the nanochannels of zeolite Y is a promising candidate as electrode for electric double-layer capacitors because of its unique structure consisting of buckybowl-like nanographenes assembled into a three-dimensional regular network with a well-defined pore size of 1.2 nm and large surface area (as high as 4000 m2 g-1). Recently, it has been observed that ZTC can be electrochemically oxidized because its framework provides a large amount of highly reactive sites, resulting in a specific capacitance values as high as 500 F g-1 in 1 M H2SO4 solution. The objective of the present work is to apply the in situ Raman spectroscopy technique to further understand the structural changes produced in ZTC during the electrochemical oxidation and to gain insights about the degradation process under different potential values. The potential was varied from 0.30 V to 1.10 V (where the electrochemical oxidation of the carbon material has been produced) and, then, returning to 0.30 V. It has been seen that the electrochemical oxidation of ZTC under anodic conditions produces structural changes that involve the degradation of the three-dimensional regular network, as demonstrated by the increase of the ID/IG (which indicates higher degree of disorder in the graphitic structure). Moreover, by increasing the potential to more positive values an intensity decrease of the band related to sp3-carbon content (D4) is observed, thus suggesting that sp3-carbon are reactive dangling carbon atoms where the initial electrochemical gasification of the carbon material occurs.

Raman study of Iron oxide Photoanode Prepared by Dip Coating
K. Maabong, A. G. Machatine and M. Diale
Department of Physics, University of Pretoria, Pretoria, 0002, Pretoria, South Africa
In searching for suitable semiconductor materials for hydrogen production via photoelectrochemical (PEC) water splitting, hematite (α-Fe2O3) has received a lot of attention as a promising photoactive material due to its band gap (~ 2.0 eV), good stability against dissolution in aqueous electrolyte, low cost, natural occurrence and nontoxicity. α-Fe2O3 crystallizes into corundum-like (α-Al2O3) crystal structure, and
belongs to the dihedral space group 6
3dD and R-3c point group. α-Fe2O3 thin films
were prepared by economic and facile dip coating method. Raman spectroscopy is a useful surface analysis tool and provides information on the degree of crystallinity of the samples.The effect of anodization and Ti doping concentration on α-Fe2O3 crystal structure were investigated using a Raman spectroscopy. Anodizing the films cause a broadening and shift to lower wavelengths of the peaks. The possible cause of the peak shift and broadening is discussed.

Label-free Multimodal Spectral Imaging for Biomedicine
Edwin Ostertag1, Rudolf W. Kessler2*, Karsten Rebner1 1Process Analysis and Technology, Reutlingen University,
Alteburgstr. 150, 72762 Reutlingen, Germany 2Steinbeis Transferzentrum Prozesskontrolle und Datenanalyse,
Herderstr. 47, 72762 Reutlingen, Germany *Emeritus Reutlingen University
Label-free spectroscopic characterization of biomedical samples in the micro and nanoscale is an emerging field in life sciences. At present, spectroscopic characterizations in this area are dominated by fluorescence techniques which require a specific staining of the sample. Multimodal spectroscopic imaging combines optical microscopy (also below the diffraction limit) with multimodal elastic light scattering and molecular spectroscopy. Thus laterally resolved information about morphology and chemistry of a sample is recorded from the same area of interest. The construction of a multimodal spectral imaging system (MSIS) is presented. The MSIS is based on a WITec Raman microscope. The following four extension modes are developed for the microscope: First, a dark field mode is adapted to the microscope for recording elastic light backscattering spectra to study morphology and texture. Second, the spatially offset Raman mode with its special case transmission allows an insight to the chemistry of hidden volumes from turbid samples. The third extension mode consists of a setup for enhanced backscattered Raman spectroscopy to enhance sensitivity. The fourth mode integrates a solid immersion lens for super-resolution Raman microscopy with a lateral resolution of approximately 180 nm. An application of the MSIS for the marker-free characterization of biological materials is the grading of astrocytic brain tumor cross-sections based on the scheme of the World Health Organization (WHO). The WHO system classifies tumors of the central nervous system into four categories from grade I to IV. The classical histopathological tumor grading analyzes the presence of necrosis, endothelial proliferation, nuclear pleomorphism and mitosis in a hematoxylin and eosin stained tissue sample. These tumor specific indicators are related to changes in tissue morphology and chemistry. The morphological changes are recorded with elastic light backscattering spectroscopy. The chemical changes are measured with Raman spectroscopy. The MSIS incorporates both spectroscopic techniques for a multimodal, label-free differentiation of astrocytomas according to the WHO system.
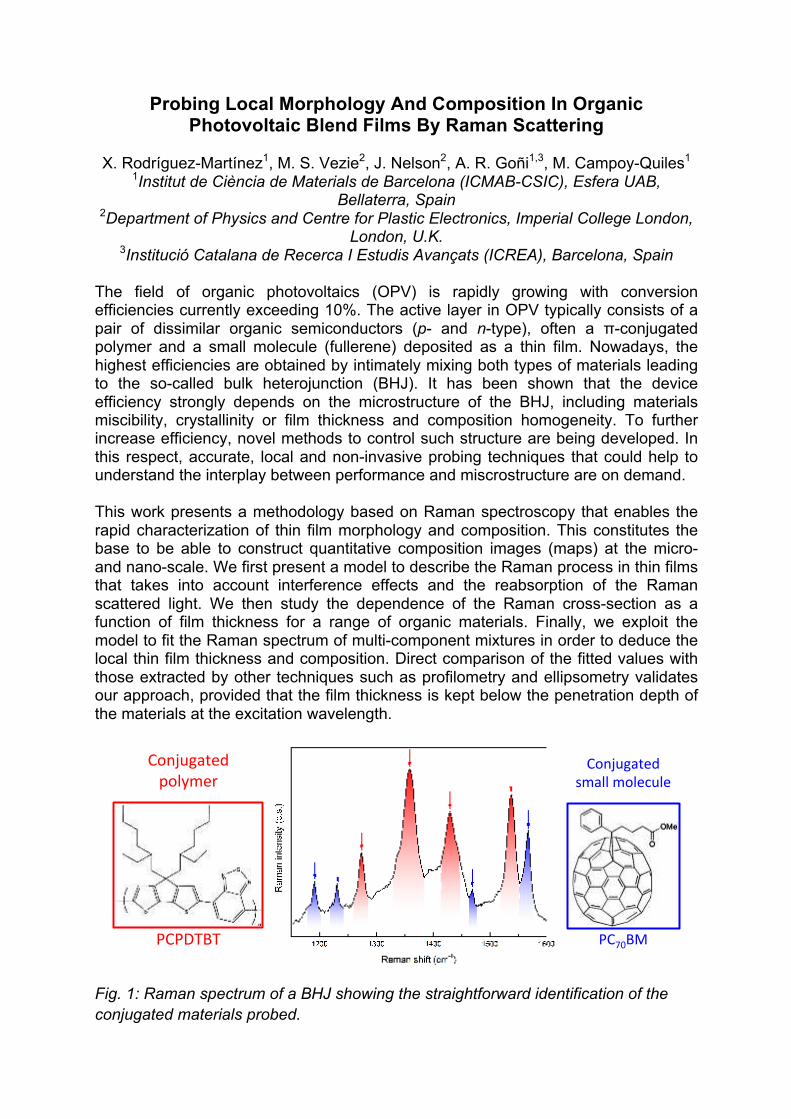
Probing Local Morphology And Composition In Organic Photovoltaic Blend Films By Raman Scattering
X. Rodríguez-Martínez1, M. S. Vezie2, J. Nelson2, A. R. Goñi1,3, M. Campoy-Quiles1
1Institut de Ciència de Materials de Barcelona (ICMAB-CSIC), Esfera UAB, Bellaterra, Spain
2Department of Physics and Centre for Plastic Electronics, Imperial College London, London, U.K.
3Institució Catalana de Recerca I Estudis Avançats (ICREA), Barcelona, Spain The field of organic photovoltaics (OPV) is rapidly growing with conversion efficiencies currently exceeding 10%. The active layer in OPV typically consists of a pair of dissimilar organic semiconductors (p- and n-type), often a π-conjugated polymer and a small molecule (fullerene) deposited as a thin film. Nowadays, the highest efficiencies are obtained by intimately mixing both types of materials leading to the so-called bulk heterojunction (BHJ). It has been shown that the device efficiency strongly depends on the microstructure of the BHJ, including materials miscibility, crystallinity or film thickness and composition homogeneity. To further increase efficiency, novel methods to control such structure are being developed. In this respect, accurate, local and non-invasive probing techniques that could help to understand the interplay between performance and miscrostructure are on demand. This work presents a methodology based on Raman spectroscopy that enables the rapid characterization of thin film morphology and composition. This constitutes the base to be able to construct quantitative composition images (maps) at the micro- and nano-scale. We first present a model to describe the Raman process in thin films that takes into account interference effects and the reabsorption of the Raman scattered light. We then study the dependence of the Raman cross-section as a function of film thickness for a range of organic materials. Finally, we exploit the model to fit the Raman spectrum of multi-component mixtures in order to deduce the local thin film thickness and composition. Direct comparison of the fitted values with those extracted by other techniques such as profilometry and ellipsometry validates our approach, provided that the film thickness is kept below the penetration depth of the materials at the excitation wavelength.
Conjugated+
polymer+Conjugated+
small+molecule+
PCPDTBT+ PC70BM+
Fig. 1: Raman spectrum of a BHJ showing the straightforward identification of the
conjugated materials probed.
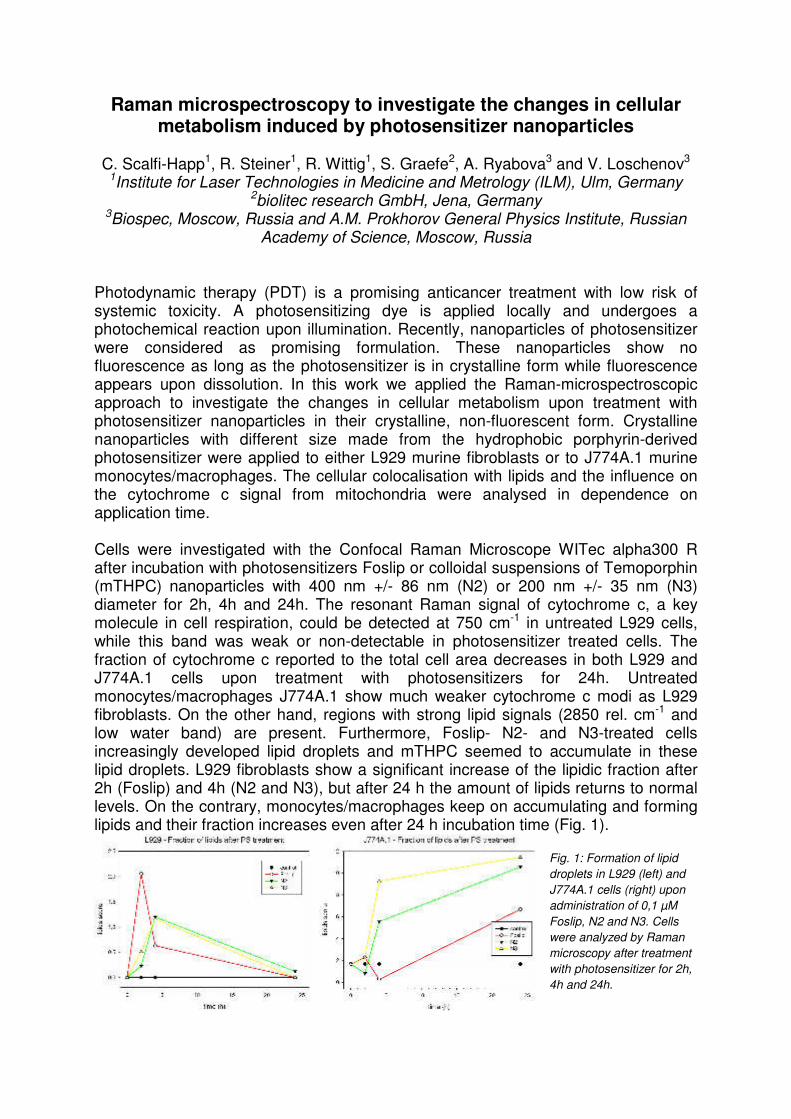
Raman microspectroscopy to investigate the changes in cellular metabolism induced by photosensitizer nanoparticles
C. Scalfi-Happ1, R. Steiner1, R. Wittig1, S. Graefe2, A. Ryabova3 and V. Loschenov3
1Institute for Laser Technologies in Medicine and Metrology (ILM), Ulm, Germany 2biolitec research GmbH, Jena, Germany
3Biospec, Moscow, Russia and A.M. Prokhorov General Physics Institute, Russian Academy of Science, Moscow, Russia
Photodynamic therapy (PDT) is a promising anticancer treatment with low risk of systemic toxicity. A photosensitizing dye is applied locally and undergoes a photochemical reaction upon illumination. Recently, nanoparticles of photosensitizer were considered as promising formulation. These nanoparticles show no fluorescence as long as the photosensitizer is in crystalline form while fluorescence appears upon dissolution. In this work we applied the Raman-microspectroscopic approach to investigate the changes in cellular metabolism upon treatment with photosensitizer nanoparticles in their crystalline, non-fluorescent form. Crystalline nanoparticles with different size made from the hydrophobic porphyrin-derived photosensitizer were applied to either L929 murine fibroblasts or to J774A.1 murine monocytes/macrophages. The cellular colocalisation with lipids and the influence on the cytochrome c signal from mitochondria were analysed in dependence on application time. Cells were investigated with the Confocal Raman Microscope WITec alpha300 R after incubation with photosensitizers Foslip or colloidal suspensions of Temoporphin (mTHPC) nanoparticles with 400 nm +/- 86 nm (N2) or 200 nm +/- 35 nm (N3) diameter for 2h, 4h and 24h. The resonant Raman signal of cytochrome c, a key molecule in cell respiration, could be detected at 750 cm-1 in untreated L929 cells, while this band was weak or non-detectable in photosensitizer treated cells. The fraction of cytochrome c reported to the total cell area decreases in both L929 and J774A.1 cells upon treatment with photosensitizers for 24h. Untreated monocytes/macrophages J774A.1 show much weaker cytochrome c modi as L929 fibroblasts. On the other hand, regions with strong lipid signals (2850 rel. cm-1 and low water band) are present. Furthermore, Foslip- N2- and N3-treated cells increasingly developed lipid droplets and mTHPC seemed to accumulate in these lipid droplets. L929 fibroblasts show a significant increase of the lipidic fraction after 2h (Foslip) and 4h (N2 and N3), but after 24 h the amount of lipids returns to normal levels. On the contrary, monocytes/macrophages keep on accumulating and forming lipids and their fraction increases even after 24 h incubation time (Fig. 1).
Fig. 1: Formation of lipid
droplets in L929 (left) and
J774A.1 cells (right) upon
administration of 0,1 µM
Foslip, N2 and N3. Cells
were analyzed by Raman
microscopy after treatment
with photosensitizer for 2h,
4h and 24h.

Ultrafast Raman Images of Skin without Scanning Procedure
Elmar Schmälzlin, Benito Moralejo, Martin M. Roth Leibniz Institute for Astrophysics, Potsdam, Germany
As of recently, Raman spectroscopy comes to be an established examination method to analyze the composition of skin. Meanwhile, first Raman spectroscopy-based medical devices are available, which allow the analyzation of potentially cancerous abnormalities in-vivo direct on the patient. However, these instruments can only measure the Raman signals at one single point, though areas of suspicious skin patches are usually in the range of some square millimeters. To receive spatially-resolved Raman images of a surface, until now a time-consuming point-by-point scanning of the sample was required. Here, we present a new technique that allows the capture of an entire Raman image with only one single exposure. The Raman scattering arising from some square millimeters surface was collected with a fiber-coupled multichannel high-performance astronomy spectrograph. The image acquisition unit consisted of an array of 20 × 20 multimode fibers located at the image plane of a custom optic device, which was developed to record the entire Raman signal of a 3 × 3 mm surface. On the spectrograph side, the fibers are re-arranged for a linear array that serves as a pseudo slit. Every fiber generates an individual spectral-dependent light path at a large-area CCD detector. A software package, which was initially developed for astronomical imaging, processes the raw CCD data to obtain a so-called data cube, which contains all spectral and spatial information. To demonstrate the high potential of this new concept, Raman images of porcine skin were recorded. To eliminate the interference of background fluorescence, shifted excitation Raman difference spectroscopy (SERDS) was applied. Entire chemical maps with high contrast were received without the need for a scanning procedure. Figure 1 shows the Raman image of a porcine skin sample and three of the corresponding SERDS spectra. The overall acquisition time was 2 × 60 s, which corresponds to only 2 × 150 ms for a single spectrum.
Fiber 1
Fiber 5
Fiber 11
1
5
11
Fig. 1 left: SERDS-Raman spectra of porcine skin. Right: Pseudo color image related
to the peak intensity at 1653 cm-1.

Raman imaging of MDCK cells expressing tumor biomarker CA IX
Marianna Sohová1,2, Michal Bodík1,2, Peter Šiffalovič2, Eva Majková2, Tibor Hianik1, Martina Labudová3, Silvia Pastoreková3
1Faculty of Mathematics, Physics and Informatics,Comenius University, Bratislava,
Slovakia 2 Institute of Physics,Slovak Academy of Science, Bratislava, Slovakia 3 Institute of Virology,Slovak Academy of Science, Bratislava, Slovakia
Raman imaging has become very popular in the last few years. Measurements with Raman spectroscopy are biologically friendly because of no water absorption. Living cells are our field of interest and Raman spectroscopy gives us a chance to see them in real time, without fixation. Early detection of cancer markers is crucial in the management of oncological diseases. CA IX (carbonic anhydrase IX) is a cell surface, hypoxia-inducible enzyme that is expressed in aggressive tumors and used as a tumor biomarker. Because detection of cancer is of urgent need, we decided to examine CA IX as a marker for Raman imaging in the cells. For our experiment we have used transfected MDCK cells (canine kidney epithelial cells) overexpressing human CA IX protein. At the beginning, fixed cells were stained with the CA IX-specific mouse monoclonal antibody. Then the secondary anti-mouse antibody labeled with the fluorescent dye with excitation at 532 nm was used. On such prepared cells we first performed fluorescence imaging and after that we increased the intensity of laser and measured a Raman signal of the same region. After we learned how the cells should look like, the Raman imaging of non-stained cells was performed. Our goal is to create a methodology of visualization of cells without staining, but using graphene oxide nanoparticles. Graphene oxide (GO) is one-atom thick material prepared from pristine graphite by chemical oxidation. Raman spectrum of GO is very unique in combination with biological samples. For measurements GO was deposited by so-called Langmuir-Blodgett technique on cover slips and analyzed on AFM to show required size (hundreds of nanometers). As a next step we want to analyze Raman imaging of GO without cells and later test GO distribution in MDCK cells, to see the subcellular localization of GO nanoparticles and to analyze their possible toxicity.
Fig. 1: Fluorescence of the MDCK cells expressing CA IX in the cell membrane.

Raman characterization of CVD Graphene for Molecular electronics and Electrical Metrology
Kishan Thodkar1, M. El Abbasi1, Cornelia Nef1, Christian Schönenberger1,
Michel Calame1
Felix Lüönd2, Frédéric Overney2, Blaise Jeanneret2 1Department of Physics, University of Basel,
Klingelbergstrasse 82, Basel 4056, Switzerland 2Federal Institute of Metrology, Lindenweg 50, 3003 Bern - Wabern, Switzerland
Graphene, a two dimensional material with sp2 hybridized carbon atoms arranged in a hexagonal lattice has been gathering immense interest from the research community due to its unique electrical and mechanical properties [1]. Raman spectroscopy has played a pivotal role in characterizing graphene. Using Raman technique it is possible to ascertain the thickness, doping levels, strain, type of defects in graphene which can occur during fabrication or can be induced during the growth [2]. In our poster we first show the detailed effects of temperature on CVD graphene nano-gap formation by observing the shifts in the position of graphene's 2D peaks (Fig. 1) [3]. We also show the effects of solvent cleaning on graphene field - effect transistors using large area scans of Raman imaging of graphene's D, G and 2D peaks (Fig 2.) to ascertain the impact of doping on electrical transport (Fig 2) [4].
Figure 1. a) Raman spectra around the graphene 2D peak recorded during electro-
burning process. The color code shows the increasing electrical power Pel. The
dashed line act as a guideline. 1 b) Raman spectra of graphene's G peak before and
after solvent cleaning. The figure depicts a redshift of wavenumber towards lower
values after solvent cleaning.
[1] K. S. Novoselov et. al, “Room-Temperature Quantum Hall Effect in Graphene,” Science, vol. 315, March, p. 1379, 2007. [2] A.C. Ferrari et al., "Raman spectrum of Graphene and Graphene layers" PRL 2006 [3] C. Nef et.al, "High yield fabrication of nm size gaps in monolayer CVD graphene", Nanoscale, 2014,6,7249 [4] K.Thodkar et. al, "CVD Graphene for Electrical Quantum Metrology", Digest CPEM 2014, 540 -541 (2014).

Multivariate SERS imaging of living cells with internal standard normalized quantification
Alexandra Walsh
1, Jonas Abrahamsson
2, Mats Josefson
3, Katarina Abrahamsson
1
1Department of Marine Sciences, University of Gothenburg, Gothenburg, Sweden
2 Department of Paediatrics, Sahlgrenska University Hospital, Göteborg University
3Pharmaceutical Development, AstraZeneca R&D, Mölndal, Sweden
For purposes of Raman imaging of living cells, SERS has proven to be an interesting complement to the technique as a whole, as it offers enhancement of the inherently weak Raman signal and a quenching of interfering fluorescence common in biological matrices. When SERS is used in small sample volumes, the magnitude of the signal may vary depending on the number of colloid particles present, causing a lower reproducibility. To handle this situation, it is possible to functionalize monodispersed gold nanoparticles with an internal standard (IS). In doing so, the enhanced signal from the analyte can be normalized, allowing for increased reproducibility between each measurement, and, possibly, for acquisition of quantitative information from samples. The information gathered from Raman measurements is notoriously abundant - the subsequent data interpretation can therefore prove a daunting task. To overcome this, we have been using various multivariate techniques in order to interpret the acquired data. In addition to already existing multivariate tools, such as PCA and OPLS, our group has developed an approach of our own called transposed orthogonal partial least squares (T-OPLS). This provides a tool for isolating and studying the relative distribution of analytes and the IS within complex spectral data. T-OPLS has been applied by us on a variety of spectroscopic data from in vivo measurements, enabling creation of hyperspectral images of cells such as monocytes, Tetrahymena pyriformis, and PC12, as well as a visual representation of the relative distribution of analytes of interest within those cells. In this poster we illuminate the advantages, the possibilities, and the challenges that come along with application of multivariate analysis for purpose of in vivo imaging, and substance identification and quantification.
Fig. 1: (From left to right) the relative distribution of adenine, dopamine, and
guanine in a PC12 cell in presence of gold nanoparticles.

Color-tunable upconversion luminescence of lanthanide doped ferroelectric BaTiO3 materials
Yang Zhang
IFW Dresden, Dresden, Germany
Near infrared to visible upconversion luminescence in lanthanide doped ferroelectric materials has shown great applications. Ferroelectric titanates, such as BaTiO3 (BTO) with perovskite ABO3 structure, have been involved in many important applications due to their excellent ferroelectric, dielectric, and electro-optic properties. These highly functional perovskite-type oxides are also recognized to be important host matrices for lanthanide ions due to their chemical and mechanical stability, as well as low vibrational frequency which makes them suitable as upconversion phosphor host matrices. Herein, we report the color-tunable upconversion luminescence of lanthanide doped BTO via solid-state reaction method. Tunable upconversion multicolor luminescence is observed from Yb3+, Er3+, and Tm3+ tri-doped BTO materials. By control of dopant concentrations, the lanthanide-doped BTO are capable of generating various upconversion spectra and color tunability. Yb3+ ions as sensitizer have a great influence on the upconversion emission spectra and color tuning. An optimal white-light emission with color coordinate (x=0.33, y=0.35) is achieved through adjusting the relative RGB intensities. Strong upconversion luminescence is also observed in the lanthanide doped BTO thin films grown on Pt/TiO2/SiO2/Si substrate, which can retain well-defined hysteresis loops with a remnant polarization (2Pr) of 17.8 µC/cm2. These findings open the possibility of lanthanide doped BTO as multifunctional materials in which both luminescent and ferroelectric properties co-exist.
Fig.1 (a) The upconversion spectrum of lanthanide doped BTO thin film grown on Pt-Si substrate. (b) The hysteresis loop of the lanthanide doped BTO thin film.


Application NotesOn the RISE: New Correlative Confocal Raman and Scanning Electron Microscopy
Highest Spectral and Spatial Resolution for Chemical Raman Imaging
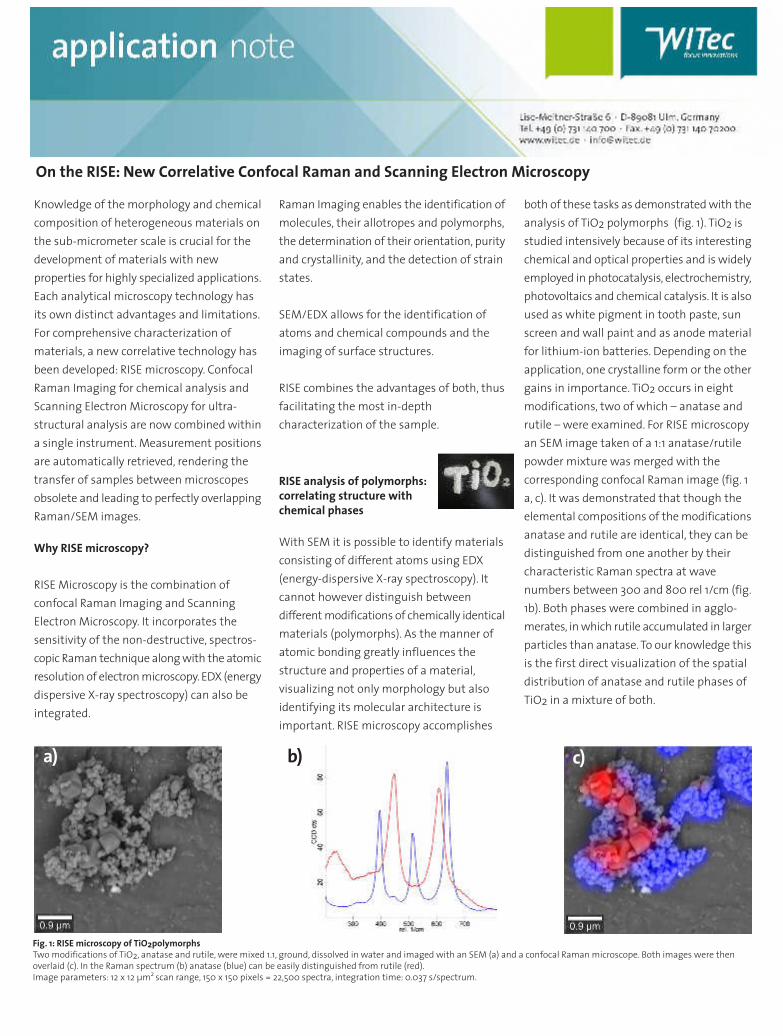
Raman Imaging enables the identification of
molecules, their allotropes and polymorphs,
the determination of their orientation, purity
and crystallinity, and the detection of strain
states.
SEM/EDX allows for the identification of
atoms and chemical compounds and the
imaging of surface structures.
RISE combines the advantages of both, thus
facilitating the most in-depth
characterization of the sample.
RISE analysis of polymorphs:correlating structure withchemical phases
With SEM it is possible to identify materials
consisting of different atoms using EDX
(energy-dispersive X-ray spectroscopy). It
cannot however distinguish between
different modifications of chemically identical
materials (polymorphs). As the manner of
atomic bonding greatly influences the
structure and properties of a material,
visualizing not only morphology but also
identifying its molecular architecture is
important. RISE microscopy accomplishes
both of these tasks as demonstrated with the
analysis of TiO2 polymorphs (fig. 1). TiO2 is
studied intensively because of its interesting
chemical and optical properties and is widely
employed in photocatalysis, electrochemistry,
photovoltaics and chemical catalysis. It is also
used as white pigment in tooth paste, sun
screen and wall paint and as anode material
for lithium-ion batteries. Depending on the
application, one crystalline form or the other
gains in importance. TiO2 occurs in eight
modifications, two of which – anatase and
rutile – were examined. For RISE microscopy
an SEM image taken of a 1:1 anatase/rutile
powder mixture was merged with the
corresponding confocal Raman image (fig. 1
a, c). It was demonstrated that though the
elemental compositions of the modifications
anatase and rutile are identical, they can be
distinguished from one another by their
characteristic Raman spectra at wave
numbers between 300 and 800 rel 1/cm (fig.
1b). Both phases were combined in agglo-
merates, in which rutile accumulated in larger
particles than anatase. To our knowledge this
is the first direct visualization of the spatial
distribution of anatase and rutile phases of
TiO2 in a mixture of both.
On the RISE: New Correlative Confocal Raman and Scanning Electron Microscopy
application note
Fig. 1: RISE microscopy of TiO2polymorphsTwo modifications of TiO2, anatase and rutile, were mixed 1.1, ground, dissolved in water and imaged with an SEM (a) and a confocal Raman microscope. Both images were thenoverlaid (c). In the Raman spectrum (b) anatase (blue) can be easily distinguished from rutile (red).Image parameters: 12 x 12 µm2 scan range, 150 x 150 pixels = 22,500 spectra, integration time: 0.037 s/spectrum.
Knowledge of the morphology and chemical
composition of heterogeneous materials on
the sub-micrometer scale is crucial for the
development of materials with new
properties for highly specialized applications.
Each analytical microscopy technology has
its own distinct advantages and limitations.
For comprehensive characterization of
materials, a new correlative technology has
been developed: RISE microscopy. Confocal
Raman Imaging for chemical analysis and
Scanning Electron Microscopy for ultra-
structural analysis are now combined within
a single instrument. Measurement positions
are automatically retrieved, rendering the
transfer of samples between microscopes
obsolete and leading to perfectly overlapping
Raman/SEM images.
Why RISE microscopy?
RISE Microscopy is the combination of
confocal Raman Imaging and Scanning
Electron Microscopy. It incorporates the
sensitivity of the non-destructive, spectros-
copic Raman technique along with the atomic
resolution of electron microscopy. EDX (energy
dispersive X-ray spectroscopy) can also be
integrated.
(a)
Raman Raman-SEM overlay
b) c)
b)a) c)

Fig 3: Three-dimensional RISE imaging of SWCNTs on a PE filterThe confocal setup of the Raman microscope allows the acquisition of 3D Raman images by moving the focus of theobjective through the sample. For this picture (b) 16 equidistant Raman images were taken while the focus wasshifted by 1 µm for each image.The individual images are displayed as RISE images in (a). The compiled 3D Ramanimage of the analyzed sample area shows the SWCNTs located on the top of the PE filter (b).Image parameters: 200 x 200 µm2 scan range, 70 x 70 pixels = 4,900 spectra, integration time: 0.037 s/spectrum.PE (red), SWCNTs (green), SEM images (grey).
Fig. 2: RISE imaging of SWCNTs on a PE filterCharacteristic Raman spectra of SWCNTs and PE (a), color-coded Raman image (b) and RISE image (c).Image Parameters: 150 x 150 µm2 scan range, 80 x 80 pixels = 6.400 spectra, integration time: 60 ms/spectrum.PE (red), SWCNTs (green), SEM image (grey).
RISE analysis of allotropes:Single-wall carbon nanotubes
Carbon nanotubes are cylindrical allotrope
modifications of carbon. Their special
properties such as high thermal conductivity
make them interesting for applications in
electronics, nanotechnology, optics and
materials science.
Single-wall carbon nanotubes (SWCNTs)
consist of a single atom thick, curved sheet
of carbon. Their unique electronic and
mechanical properties make them attractive
for electronics fabrication. The Raman spectrum identifies SWCNTs as
single-walled by the presence of their
characteristic RBM (radial breathing mode)
bands at low wave numbers (fig. 2a). The RISE
image of SWCNTs embedded in polythylene
(PE) (fig. 2c) was generated by merging the
Raman image (fig 2b) with the SEM image.
a)
a) b)
To explore the 3D structure of the material ,
16 Raman images were taken in the z-
direction intervals of 1 µm (fig. 3a) From these
data a 3D image was compiled. It illustrates
that the SWCNTs lie on top of the PE matrix
(fig. 3b).
b) c)a)
SWCNTRBM
PE
The RISE microscope above consists of a WITec confocalRaman microscope combined with a Tescan SEM.
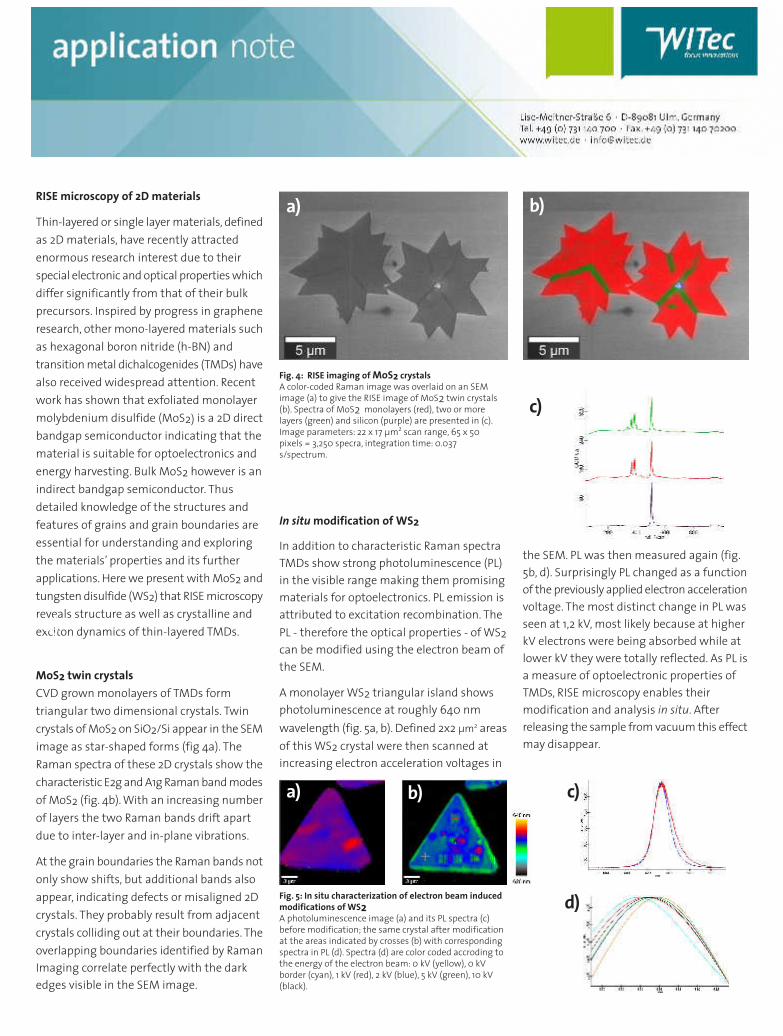
application note
Fig. 4: RISE imaging of MoS2 crystalsA color-coded Raman image was overlaid on an SEMimage (a) to give the RISE image of MoS2 twin crystals(b). Spectra of MoS2 monolayers (red), two or morelayers (green) and silicon (purple) are presented in (c).Image parameters: 22 x 17 µm2 scan range, 65 x 50pixels = 3,250 specra, integration time: 0.037s/spectrum.
Fig. 5: In situ characterization of electron beam inducedmodifications of WS2A photoluminescence image (a) and its PL spectra (c)before modification; the same crystal after modificationat the areas indicated by crosses (b) with correspondingspectra in PL (d). Spectra (d) are color coded accroding tothe energy of the electron beam: 0 kV (yellow), 0 kVborder (cyan), 1 kV (red), 2 kV (blue), 5 kV (green), 10 kV(black).
RISE microscopy of 2D materials
Thin-layered or single layer materials, defined
as 2D materials, have recently attracted
enormous research interest due to their
special electronic and optical properties which
differ significantly from that of their bulk
precursors. Inspired by progress in graphene
research, other mono-layered materials such
as hexagonal boron nitride (h-BN) and
transition metal dichalcogenides (TMDs) have
also received widespread attention. Recent
work has shown that exfoliated monolayer
molybdenium disulfide (MoS2) is a 2D direct
bandgap semiconductor indicating that the
material is suitable for optoelectronics and
energy harvesting. Bulk MoS2 however is an
indirect bandgap semiconductor. Thus
detailed knowledge of the structures and
features of grains and grain boundaries are
essential for understanding and exploring
the materials’ properties and its further
applications. Here we present with MoS2 and
tungsten disulfide (WS2) that RISE microscopy
reveals structure as well as crystalline and
exciton dynamics of thin-layered TMDs.
MoS2 twin crystals
CVD grown monolayers of TMDs form
triangular two dimensional crystals. Twin
crystals of MoS2 on SiO2/Si appear in the SEM
image as star-shaped forms (fig 4a). The
Raman spectra of these 2D crystals show the
characteristic E2g and A1g Raman band modes
of MoS2 (fig. 4b). With an increasing number
of layers the two Raman bands drift apart
due to inter-layer and in-plane vibrations.
At the grain boundaries the Raman bands not
only show shifts, but additional bands also
appear, indicating defects or misaligned 2D
crystals. They probably result from adjacent
crystals colliding out at their boundaries. The
overlapping boundaries identified by Raman
Imaging correlate perfectly with the dark
edges visible in the SEM image.
In situ modification of WS2
In addition to characteristic Raman spectra
TMDs show strong photoluminescence (PL)
in the visible range making them promising
materials for optoelectronics. PL emission is
attributed to excitation recombination. The
PL - therefore the optical properties - of WS2
can be modified using the electron beam of
the SEM.
A monolayer WS2 triangular island shows
photoluminescence at roughly 640 nm
wavelength (fig. 5a, b). Defined 2x2 µm2 areas
of this WS2 crystal were then scanned at
increasing electron acceleration voltages in
the SEM. PL was then measured again (fig.
5b, d). Surprisingly PL changed as a function
of the previously applied electron acceleration
voltage. The most distinct change in PL was
seen at 1,2 kV, most likely because at higher
kV electrons were being absorbed while at
lower kV they were totally reflected. As PL is
a measure of optoelectronic properties of
TMDs, RISE microscopy enables their
modification and analysis in situ. After
releasing the sample from vacuum this effect
may disappear.
a)
Raman
SEM
a)
SEM
Raman
a) b) c)
d)
a) b)
c)
WITec HeadquartersWITec GmbH, Lise-Meitner-Str. 6, 89081 Ulm, Germany, phone +49 (0)731 140700, [email protected] www.witec.de
alpha500 AR
First automated Raman/AFM system for large samples
alpha300 SR
First SNOM system usingpatented cantilever sensors
alpha300 AR+
First fully integrated Raman Imaging/AFM combination
PIONEERS BY PROFESSIONPIONEERS
alpha300 R
First 3D confocal Raman imaging system
3D Raman image of a diamond inclusion (red) in quartz (black) with impurities (blue)
WITec’s 3D Raman Imaging provides unprecedented depth
and lateral resolution for chemical imaging down to the 200 nm diffraction
limit. Our alpha300 and alpha500 series with optimized throughput and
sensitivity establishes the benchmark in ultrafast spectra acquisition and
low light-level microscopy.
Achieve a deeper understanding than ever before with WITec’s pioneering technology.
The Bathyscaph Trieste arrived at the Earth’s most extreme depth
on 23. January 1960.
5 µm

Highest Spectral and Spatial Resolution for Chemical Raman Imaging
The Resolution
The spectral and spatial microscope
resolutions are important factors for the
quality of the acquired measurements.
The spectral resolution of a confocal Raman
microscope is mainly defined by the individual
components of the spectroscopic system. The
focal lengths, the grating, the pinhole, the
pixel size of the CCD camera, and the imaging
quality of the spectrometer all contribute to
optimization.
In case of the spatial resolution of a confocal
Raman microscope the lateral (x- and y-
direction) and the depth resolution (z-
direction) can be distinguished. Besides the
fundamental laws of physics (e.g. the
diffraction limit), the spatial resolution is
defined by the mechanical and optical
microscope components which can influence
the sample position accuracy, aberration, and
beam path distortion.
In Figure 3 the experimental determination
of the lateral resolution of a confocal Raman
microscope is shown. The measurable lateral
dimensions of a carbon nanotube sample can
be determined via the FWHM (full width at
half maximum) and the lateral resolution can
be characterized at about 272nm. Furthermore
the depth resolution is an important
characteristic of a confocal system. The
instrument design and also the pinhole and
the sample illumination influence the depth
resolution. With the usage of proper
microscope components a depth resolution
below 750nm can be achieved.
application note
Raman microscopy is a high resolution
imaging technique that has become widely
used for the characterization of materials in
terms of their chemical composition. Through
the selection of optimized microscope
components it is possible to approach the
theoretical limit in spectral and spatial
resolution. In this way information on sample
properties can be obtained on the micro- and
even nano-scale.
Confocal Raman Microscopes
Confocal Raman microscopy combines
chemical sample characterization with the
imaging capabilities of an optical microscope
(Figure 1). Thereby a spatial resolution down
to 200nm can be achieved. In a confocal
microscope, only light from the focal plane is
detected while out of focus light is rejected,
thus providing depth resolution and a strongly
reduced background signal (Figure 2). Images
are recorded point by point and line by line
while scanning the sample through the
excitation focus. With this technique, the
specimen can be analyzed in steps along the
optical axis and even depth profiles or 3D
images can be generated.
Figure 3: a) Integrated intensity of the G-Band of acarbon nanotube with the cross section positionmarked in red and the cross-sectional intensityalong this line in (b). The lateral resolution of themicroscope system can be characterized by theFWHM and is about 272nm.
(a)
Figure 1: Beam path of a confocal Raman microscope
Figure 2: The basics of a confocal microscope: Onlylight from the focal plane is detected, while out offocus light is rejected.
a)
b)II)
High-resolution and large-area 3D image
acquisition
Figure 4 shows a large-area, high-resolution
image of the lotion, where the API is dissolved
in water. The large image is the result of an
evaluation of 4.194.304 complete Raman
spectra (raw data file: 12.5 Gbyte). Consecutive
zooms in the same dataset are presented in
Figure 4b and 4c. In all three images the water
and API containing phase is presented in blue
color, whereas with green color the oil-matrix
is presented. Beside the distribution of the
known materials, silicone based impurities
could be visualized (red color in the images).
The detection of such small impurities
requires such high resolution large area
Raman images. The volume of the impurities
can be determined from a stack of confocal
Raman images as presented in Figure 5. For
these measurements a volume of
25x25x20 µm3 was measured, using
200x200x50 pixels (total of 2 million spectra,
data file 6 Gbyte).
Conclusion
The spectral and spatial resolution of a
confocal Raman microscope setup can be
optimized by the usage of ideal optical and
mechanical microscope components. In this
way high-resolution depth scans and 3D
Raman images can be generated and
information about the chemical sample
composition can be obtained.
application note
Advantages and Benefits for your
Applications:
- outstanding imaging capabilities with an
exceptional performance in speed, sensitivity
and resolution
- highly confocal imaging system with an
excellent depth-resolution for 3D imaging
and depth profiles
- fiber based light transmission with up to
90% throughput of laser light
- ultra-fast Raman imaging with acquisition
times of only 0.76 ms per spectrum
- combinations of Raman with AFM, SNOM,
profilometry and many other imaging
techniques within one instrument
Figure 4: a): High-resolution, large-area Raman image of a lotion. Image parameter: 175x175 µm2,2048x2048 complete Raman spectra, integration time per spectrum: 0.002 s (total acquisition time of2h30min). b) and c): The zoom-ins demonstrate the high-resolution of the Raman image.
Figure 5: 3D confocal Raman image acquired fromthe lotion. Sample volume: 25x25x20 µm3; imagestack: 200x200x50 pixels (total of 2 millionspectra, data file 6 Gbyte).
a) b)
c)
alpha500 Raman AFM microscope


WITec HeadquartersWITec GmbH, Lise-Meitner-Str. 6, 89081 Ulm, Germany, phone +49 (0)731 140700, [email protected] www.witec.de
PIONEERS BYEERS BYPIONEERPIONEER PROFESSION PR
PIONEERS
AFM (left) and Raman (right) images of a graphene fl ake
3 µm
WITec‘s Raman AFM combines the materials analysis capability of
confocal Raman imaging with the ultra-high topographic and lateral resolution
of an AFM. These two complementary techniques are available in a single
instrument for more flexible and comprehensive sample characterization.
Combine techniques and the sky is no limit with WITec’s pioneering technology.
ocal Raman and AFM topography image Confocal Rf a polymer blend on glassof a polymer blend on glass
5 µm
The Apollo and Soyuz spacecraft met, combining their efforts for
the first time on 17 July 1975.
alpha500 AR
First automated Raman/AFM system for large samples
alpha300 SR
First SNOM system usingpatented cantilever sensors
alpha300 AR+
First fully integrated Raman Imaging/AFM combination
alpha300 AR
First fully integrated Raman Imaging/AFM combination


![Environmental Atomic Force and Confocal Raman Microscopies … · 2018-11-09 · Confocal Raman microscope [Witec GmbH; ] Confocal Raman microscopy: high resolution chemical mapping](https://static.documents.pub/doc/80x56/5fab2f45b37f971ef54300ff/environmental-atomic-force-and-confocal-raman-microscopies-2018-11-09-confocal.jpg)


