193 12. Recent trends in drug-related public expenditure and drug-related services in France This special issue is intended to look into how the recent 2008 economic crisis is affecting drug policy public spending and drug-related services in France. Firstly, we provide economic data on the factors that we believe to have started or explained the recent economic recession in France. Government expenditure series are also provided in order to assess the impact of the crisis on public finances. Secondly, estimates for the recent trends in drug-policy public spending have been provided. We deal with the methods used and their short fallings and with estimation problems arising from the reliability of collected data. The last part of the paper seeks to determine to what extent the crisis of 2008 has led to cuts or gradual reductions in drug policy public spending growth. We rely on available data on drug- related spending to determine austerity levels in French drug policy. 12.1. The 2007-2009 “Great Recession” The aim of this section is to examine recent trends in public expenditure in France, and to assess the impact of the “Great Recession” on French public finances. 12.1.1. The global economic slowdown In the late 2000s, advanced economies suffered the most severe world economic recession in five decades. According to the United States National Bureau of Economic Research, the “Great Recession” was caused by the U.S. housing market meltdown and the December 2007 financial bubble. The financial crisis spread across Europe rapidly. In the second quarter of 2008, the euro zone economy was reported to have shrunk by 0.2 percent. The economy of the “euro-bloc” saw a new decline in the third quarter of 2008 which put the euro zone in a technical recession. This was the first time since the bloc's creation in 1999 that its economy contracted for two consecutive quarters. France did not fall into recession then, but its economy also recorded a high rate of deceleration in the second quarter of 2008. In 2009, the French economy growth rate recorded a remarkable decrease. It dropped by -2.6 percent on average over 2009 after having recorded an annual growth rate of 0.2 percent in 2008.
Transcript
193
12. Recent trends in drug-related public expenditure and drug-related services in France
This special issue is intended to look into how the recent 2008 economic crisis is affecting drug policy public spending and drug-related services in France.
Firstly, we provide economic data on the factors that we believe to have started or explained the recent economic recession in France. Government expenditure series are also provided in order to assess the impact of the crisis on public finances.
Secondly, estimates for the recent trends in drug-policy public spending have been provided. We deal with the methods used and their short fallings and with estimation problems arising from the reliability of collected data.
The last part of the paper seeks to determine to what extent the crisis of 2008 has led to cuts or gradual reductions in drug policy public spending growth. We rely on available data on drug-related spending to determine austerity levels in French drug policy.
12.1. The 2007-2009 “Great Recession”
The aim of this section is to examine recent trends in public expenditure in France, and to assess the impact of the “Great Recession” on French public finances.
12.1.1. The global economic slowdown
In the late 2000s, advanced economies suffered the most severe world economic recession in five decades. According to the United States National Bureau of Economic Research, the “Great Recession” was caused by the U.S. housing market meltdown and the December 2007 financial bubble.
The financial crisis spread across Europe rapidly. In the second quarter of 2008, the euro zone economy was reported to have shrunk by 0.2 percent. The economy of the “euro-bloc” saw a new decline in the third quarter of 2008 which put the euro zone in a technical recession. This was the first time since the bloc's creation in 1999 that its economy contracted for two consecutive quarters.
France did not fall into recession then, but its economy also recorded a high rate of deceleration in the second quarter of 2008. In 2009, the French economy growth rate recorded a remarkable decrease. It dropped by -2.6 percent on average over 2009 after having recorded an annual growth rate of 0.2 percent in 2008.
Source: Statistical Annex of European Economy: Long-term macroeconomic series, EC (Spring 2011) from national sources.
Like every other industrial economy in the world, France experienced in 2008-2009 its most severe economic crisis since the end of World War II. The French economy has struggled in the past to overcome difficult situations (the first oil shock, the 1993 economic slump, the global deceleration of 1999, to name just a few), but the economic activity had never dropped so dramatically as it did during the recent crisis.
Graph 12-2: Growth of gross domestic product (GDP) in France since World War II
Source: Insee232, National Accounts, base 2005. Sluggish economic activity brought about a sharp rise in unemployment, especially affecting the non-agricultural market sectors.
232 Institute National de statistique et études économiques (National Institute for Statistics and Economic Studies).
195
Graph 12-3: Rate of unemployment (in percentage) in France
Source: Insee, Employment survey.
12.1.2. French governmental economic measures to fight recession: an increase in public expenditures to support activity
In December 2008, the French government launched an economic stimulus package to fight recession. Run out in 2009, the 26 billion-euro rescue plan included 11 billion euros to help businesses increase their cash-flow, 11 billion euros of direct state investment and 4 billion euros to improve infrastructure (modernizing rail infrastructure in particular) and public services (energy and postal service). The stimulus package amounted to 1.4 percent of the GDP.
Although recession was not avoided, public sector investments supported considerably the global activity. In 2009, government consumption accelerated by 2.7 percent after 1.7 percent in 2008. Private consumption performed reasonably well (0.6 percent of annual change in 2009 from a 0.5 percent in 2008).
The decline in activity in 2009 was mainly prompted by a very sharp fall of exports. In 2009, exports fell by 12.4 percent, mainly due to sluggish world trade. The deceleration of exports began in 2007 to record 2.5 percent on average in 2007 from 4.8 percent in 2006.
After considering exports, the contraction in activity reported in 2009 can be explained by a great reduction in investment by companies, mainly because of unavailability of investment funds in 2008 and low expectations about future business activity. The gross fixed capital formation (GFCF) –which indicates what share of the new value added in the economy is invested rather than consumed– fell by 7.1 percent in 2009, from a 0.4 percent average over 2008. The downturn in the total demand led to a substantial drop in imports.
196
Table 12-1: Annual percentage change from previous period (Trading days, seasonally-adjusted data)
2008 2009
Gross domestic product (GDP) +0.2 -2.6
Imports 0.6 -10.7
Government expenditure 1.7 2.7
Private consumption 0.5 0.6
Exports -0.5 -12.4
Gross fixed capital formation (GFCF) 0.4 -7.1
Source: Quarterly national accounts, INSEE
12.1.3. Threats posed by the sovereign debt crisis
Sluggish activity is causing government revenue to decrease. Revenue fell from 49.5 percent of GDP in 2008 to 48.7 percent of GDP in 2009. Notwithstanding this decrease, public expenditure has continued increasing (from 52.9 percent of GDP in 2008 to 56.2 percent in 2009) (INSEE official data). This revenue decrease is the result of a drop in personal as well as corporate tax collection and to a diminishing contribution by employers. The weakness of activity resulted in fewer available resources. The French government was left with no choice but to increase the sovereign debt. Prior to the crisis, the public debt233 amounted to 60 percent of GDP. Since the recession took place, it has gone up vigorously. It amounted to 78.3 percent of GDP in the fourth quarter of 2009, 81.7 percent one year later to reach 85.8 percent in the fourth quarter 2011. In 2011, France recorded a deficit above 7 percent of GDP, according to the INSEE.
Table 12-2: Quarterly public debt, as defined by the Maastricht Treaty by sub-sector (€billions) Q4 2010 Q1 2011 Q2 2011 Q3 2011 Q4 2011
Public Debt 1595,2 1650,0 1696,2 1692,5 1717,3
% of GDP 82.3% 84.7% 86.3% 85.5% 85.8%
of which, by sub-sector :
State 1245.0 1286.2 1338.7 1330.1 1335.2
Central administrations 14.1 11.0 9.8 9.9 10.4
Local administrations 161.1 157.2 154.3 153.4 166.3
Social Security Funds 175.0 195.7 193.4 199.1 205.4 Source: National Accounts - Insee, DGFiP, Banque de France
233 Gross debt
197
Graph 12-4: The Sovereign debt and expenditure share of the GDP in France since 2005
Source: Statistical Annex of European Economy: Long-term macroeconomic series, EC (Spring 2011). Figures for 2011 and 2012 are forecasts made by Commission staff using the definitions and latest figures available from national sources.
12.1.4. Public resources available to either consume or invest
After four negative quarters, France came out of the red. Since the beginning of the “Great Recession”, activity has picked up moderately. According to the INSEE, GDP in physical terms increased by +1.4 percent in 2010. Nevertheless, there was still a long way to go before the pre-crisis levels of growth (+2.4 percent in 2007) can be regained. Nominal GDP reached €1932.8 billion in 2010, slightly below GDP for 2008.
As to recent trends in public expenditure, it appears that the 2007-2009 “Great Recession” has not led to a reduction in public spending over the reference period (public spending figures for 2010 refer to the latest available data). However, the increase in public expenditure has clearly slowed down in 2010 (see graph 12-5). Before the crisis, annual public spending was approximately increasing at a rate of 4 percent. In 2010, public spending growing slowed down to 2 percent. Forecasts for 2011 and 2012 indicate a progressive deceleration in public expenditure: 1.8 percent in 2011 and 0.5 percent in 2012.
198
Graph 12-5: Public spending compared to GDP
Source: National accounts - Base 2005, Insee
12.2. Public expenditure in the main areas covered by drug interventions
This paper seeks to shed light on the question of whether deceleration in global public expenditure has any impact on drug-related public spending. The following section explores this issue.
12.2.1. Evolution and breakdown of drug-related total expenditure
In France, public expenditure on fighting, preventing and treating drug addiction has already been dealt with in previous studies (Ben Lakhdar 2007b). Kopp and Fénoglio estimated the public spending by French authorities on illicit drug-related policy at €729.62 million in 1995. This study also estimated the expenditure on alcohol-related policy, which in 1997 amounted to €128.45. Note that the estimates for tobacco-related costs are not available for 1995 and 1997. In 2003, public expenditure on licit and illicit drugs (excluding drug-related costs for treatments) was estimated at €1,159.12 millions (Kopp et al. 2006). In 2005, Ben Lakhdar provided a new up-dated estimate for illicit drugs using a different method (Ben Lakhdar 2007b). The latest estimate was approximately €1,169 million (drug-related costs for treatments excluded).
The present work takes an alternative approach, providing estimates for the 2008-2010 period. Figures for 2011 or 2012 are provided only when forecasts are available. Estimates for 2008-2010 show direct costs, defined as the sum of labelled and unlabeled drug-related expenditure. A breakdown of tobacco, alcohol and illicit drug-related expenditure is not provided: data are all-inclusive.
Labelled expenditures are those which are identified as such in the budget. Calculation methods are not required for labelled drug-related budgets. Time series data for this category of expenditure are provided on a regular basis. However, variations in components in labelled drug-related expenditures make comparison between 1995 and 2008-2010 difficult. Differences are mostly explained by changes in the origin of the funding. For example, between 1995 and 2009, the Justice and Health National Programme was financed by the MILDT. Since 2010, this programme has been financed by the Social security system and credits have been matched
199
with those applied to the drug abuse & harm reduction centres. In most cases, data breakdowns are not available, making comparison of data between 1995 and 2008 impossible.
Labelled expenditures are not the only drug-related direct costs. There also exists a large amount of non-labelled expenditure which clearly belongs in the category of drug-related policy. Since 2008, drug-related non-labelled spending can be directly traced back by reviewing drug policy reporting documents. By focusing on actions implemented within broader programmes in the field of drugs (alcohol, tobacco and illicit drugs as well as doping), these financial reporting documents provide estimates on unlabelled drug related expenditures. Methods of calculation are not homogenous across programmes. Estimates are calculated by the authority responsible for carrying out the programme. For some programmes, estimates on drug-related direct costs are based on a bottom-up approach, and for others, the method of calculation is based on a top-down approach. A detailed explanation of the calculation method is provided in section on unlabelled expenditures. Obvious methodological reasons (different approaches in modelling methods in unlabelled drug-related expenditure and in the selection of components) explain why this report does not undertake the task of comparing new and previous estimates (Ben Lakhdar 2007b; Kopp et al. 2006) but to identify recent comparable trends.
Labelled expenditures are presented initially, together with an overview of the unlabeled expenditures and a further explanation on the calculation methods used. The last section presents the general drug-related expenditures for the 2008-2010 period, and a final discussion.
Labelled expenditures: main categories of payments and detailed purposes
Drug related labelled expenditures in France are divided into two main categories of payments: the payments made by the social security system and those made by the Interministerial Mission for the fight against drugs and drug addiction. For each main category of payment, detailed purposes of the drug-related labelled expenditure are indicated below.
Labelled payments made by the social security system Providing drug abuse & harm reduction services has a direct cost borne in France by the social security system. The social security system pays out for the provision of services provided by the drug abuse & harm reduction centres (not only expenditures made for the provision of services related to illicit drug disorders, but also those related to alcohol abuse). It also contributes to funding a part of the direct costs of drug abuse services at hospitals. However, it is important to point out that it accounts for a very marginal part of the total drug related expenditures corresponding to health spending by hospitals (see section below dealing with unlabelled expenditures in health). Moreover, in France, the social security system also refunds part of the OST medicines.
Budget allocated by the social security system to providing drug abuse & harm reduction services in substance abuse centres In France, the drug abuse & harm reduction centres are free for clients. Their budgets are therefore fully financed by the public system.
Total expenditures for the provision of drug abuse & harm reduction services are the sum of regular expenditures to finance staff costs and other spending due to the regular working of these centres, and additionally, complementary budgets which are allocated in accordance with priorities stated by national strategies dealing specifically with overall public policy in the field of drug addiction and health, in general.
200
Over the 2007-2014 period, extra budgets devoted to drugs health policy have been stated in the following three national strategies:
- the 2007-2011 “Addictions” plan which aimed at developing prevention and healthcare for drug users in health public establishments
- the 2008-2011 “Governmental Drugs” plan whose main purpose was to facilitate access to housing, healthcare and social services by vulnerable groups (young users, women, prisoners)
- the 2011-2014 “Health in prison” plan, which seeks to guarantee prisoners’ access to healthcare under the same conditions as those affecting other vulnerable not-in-jail groups
Table 12-3: Labelled spending in substance abuse and harm reduction centres from the social security system (€ Million)
Social security funds (sector value234: s1314)
Cofog1 value235 Cofog2 value 2008 2009 2010
Cost of staff and spending due to regular working of substances abuse & harm reduction centres Gf07 - Health
Gf0702 - Outpatient services 271.27 283.10 304.71
Expenditures devoted to drugs centres to implement national priorities stated in the 2008-2011 “Governmental Drugs” plan Gf07 - Health
Gf0702 - Outpatient services 8.84 16.33 16.23
Expenditures devoted to drugs centres to carry out the Health/Justice programme (indicated prevention) Gf07 - Health
Gf0702 - Outpatient services (*) (*) 5.25(*)
Total amounts of expenditure Gf07 - Health
Gf0702 - Outpatient services 280.11 299.43 326.18
Source: ARS/DGS (credits allocated to the substance abuse & harm reduction centres by the Health Regional Authorities) (*) Such a budget was supported by the Interministerial mission for the fight of drugs and addictions until 2009. Since 2010, such expenditure has been supported by the Social security funds. Since 2011, these credits have been integrated as a part of the cost of staff and regular functioning of the substances abuse & harm reduction centres.
Over the 2008-2010 period, the expenditures devoted to providing drug abuse and harm reduction services appear to show an upward trend. Therefore, there is no evidence of any budget reductions. In the short-term, the 2008-2009 crisis does not seem to have had any negative impact in budgets for the provision of substance abuse & harm reduction services. Furthermore, according to official sources (National Health Directorate - DGS), no cuts or reductions in budgets allocated to substance abuse services are expected, even when official data for 2011 and 2012 are not yet available.
234 The “sector value” identifies the General Government Sector reporting the Expenditure (as defined by the European System of National and Regional Accounts). 235 COFOG stands for “Classification of the functions of Government”. It is 3-level classification with 10 “Divisions” at the first level (Cofog1) and 6 “groups” at the second level (Cofog2).
201
Budget allocated by the social security system to providing drug abuse & harm reduction services in hospitals In France, health public establishments are also financed by the social security funds to provide drug abuse services to patients. The 2007-2011 “Addictions” plan allocated a special financial contribution over its span-period intended to create and strengthen substances abuse care in public health establishments. This expenditure accounted approximately for €30-40 million per year. Up to 2011, only the adoption of future plans in the field could guarantee unchanged funding in drug-related healthcare services. The plan recently adopted for promoting health in prison should contribute to improving responses intended to drug users in prison. However, amounts allocated do not seem to be as large as in previous efforts made by the security social system to tackle drugs and drug addictions in the health public establishments.
202
Table 12-4: Labelled expenditure in preventing and treating addictions in hospitals from the social security system (€ Million)
Social security funds: contribution to implement priorities stated in the 2007-
2011 “Addictions” plan (sector value: s1314)
Cofog1 value Cofog2 value 2008 2009 2010 2011 2012
Funds for creating or strengthening substance abuse care and liaison teams
Gf07 - Health Gf0703 – Hospital services
2.31 4.62 4.62 3.33 1.53
Funds for carrying out hospital addiction consultations
Gf07 - Health Gf0703 – Hospital services
7.08 10.16 10.16 5.94 2.97
Funds for developing hospital facilities for preventing and treating substance abuse
Gf07 - Health Gf0703 – Hospital services
7.85 15.70 15.70 21.24 10.63
Hospitalisations for complex withdrawal Gf07 - Health Gf0703 – Hospital services
12.62 9.24 9.24 9.47 4.73
Funds for setting up weekly specialist consultations in the medical service for prison establishments
Gf07 - Health Gf0703 – Hospital services
0 0.60 0 0 1.06
Sub-total expenditure in hospital for carrying out drug related activities planned in the 2007-2011 Addictions Plan
Gf07 - Health Gf0703 – Hospital services
29.86 40.32 39.72 40.03 20.92
Social security funds: contribution to implement priorities stated in the 2011-
2014 “Health in prison” plan”
Cofog1 value Cofog2 value 2008 2009 2010 2011 2012
HIV and hepatitis detection in care units in prisons attached to hospitals units
Gf07 - Health Gf0703 – Hospital services
- - - 1.57 11.37
Therapeutic groups in care units in prisons attached to hospitals units
Gf07 - Health Gf0703 – Hospital services
- - - 1.26 3.74
Sub-total expenditure in hospital for carrying out drug related activities planned in “2011-2014 Health in prison plan”
Gf07 - Health Gf0703 – Hospital services
- - - 2.83 15.11
Total amount of expenditure (both public plans)
Gf07 - Health Gf0703 – Hospital services
29.86 40.32 39.72 42.87 36.03
Source: DGOS (credits allocated to the Public health establishments)
Budget allocated to financing expenditures in opioid substitution medicines from the social security system In addition, the social security system contributes to drug-related expenditure by refunding the cost of part of the price of sale of opioid substitution medicines. It represents the second major part of labelled public payments in France.
The OST market in France is divided into HDB and methadone. Latest available data on both molecules is 2009 (HDB and methadone) (see table 5).
203
Table 12-5: Labelled expenditure to refunds OST (€ Million)
Social security funds (sector value: s1314)
Cofog1 value Cofog2 value 2005 2006 2007 2008 2009 2010
HDB of which … 78.49 77.64 78.59 78.11 72.17 na
Subutex®
78.49 74.63 70.86 61.55 56.96 na
Generics
0 9.82 11.71 16.55 15.21 na
Methadone 8.41 9.82 11.71 14.41 16.70 na
Total OST Gf07 - Health
Gf0701 – Medical products,
appliances and equipment 86.90 87.45 90.30 92.52 88.87 na
Source: MEDICAM (ADELI) Figures for 2010 are not yet available (data release is expected for the end of 2012).
Before 2006, the Subutex® was the only medicine registered and for sale in France for the HDB molecule. In 2006, the French health authorities allowed to prescribe generic medicines for the HDB. The fact that generics are less expensive than their brand-name counterparts explain why the number of generic boxes sold has been on the increase since 2006, while Subutex® sales dropped. Therefore, the social security system has been paying out growing amounts of generics refunds since their market entry in 2006.
Latest available data (2009) suggests a change in recent trends for the HDB refunds. While total HDB has experienced a remarkable drop of €6 million in reimbursement over the period, in the case of methadone, reimbursements are on the increase. This drop in HDB reimbursement could be explained by the large share corresponding to methadone, which has been on the increase all over the period. In 2009, it accounts for 19% of the total OST from 10% in 2005. It may also be explained by the drop in clients’ demand, or the hypothetical larger availability of heroin, as reported in qualitative studies from 2007 to 2009 (Cadet-Taïrou et al. 2010b).
Labelled payments made by the Interministerial Mission for the fight against drugs and drug addiction
The other major category of expenditures clearly identified as “drug related” are those financed by the MILDT. The fact nevertheless remains that a major part of public expenditure is accounted for by the payments made by the social security system.
Compared to 2005, it should be highlighted that payments made by the MILDT have been reduced by about 15 percent in 2010. Ben Lakhdar (Ben Lakhdar 2007b) referred to €39.3 million while the MILDT’s expenditure appears to account for €33.10 euro five years later (see table 6a). This budget reduction in MILDT’s payments seems consistent with the transfer of €5.2 million paid out by the Social security system to finance Health and Justice’s programmes allocated to substance abuse & harm reduction centres (see section above dealing with payments made by the social security system). Therefore, such a decrease in payments cannot be considered as a net reduction in the total budget devoted to drugs, because of the transfer of payments from the MILDT to the Social security system.
204
Table 12-6: Total annual payments made by the MILDT (€ million)
2008 2009 2010
Total MILDT’s spending … of which ….
30.87 35.39 33.10
MILDT’s regular executed budget 27.38 29.00 22.00
MILDT’s executed budget coming from the “Narcotics” fund (*) 3.49 6.39 11.10
Source: RAP (Performance-related Annual Report) and “Drug policy” DPT (Transversal Drugs Policy Document). (*) These data have been calculated by the OFDT. “Narcotics” Fund figures has been calculated by comparing MILDT’s expenditure reported in the “Drug policy” DPT and total MILDT’s executed budget presented in the RAP. In fact, the credits reallocated effectively to ministries by the MILDT coming from the “Narcotics” fund can be solely retraced by data provided by the RAP.
Furthermore, fluctuations in the MILDT’s executed budget over the period of reference (2008-2010) are difficult to interpret. Figures on expenditures for 2011 are not yet available. It is important however to point out that the contribution of the “Narcotics” support fund to the MILDT’s budget is likely to continue increasing (see recent trends in table 6 above). This fund was created in 1995236. Since its creation, a growing share of the MILDT’s credits came from this support fund. The MILDT is responsible for allocating this support fund to ministries carrying out activities in the field of drug addiction. The budgetary share allocated to each administration was set at the time the “Narcotics” support fund was created, in 1995. Practical difficulties encountered by the courts handling the cases of drug seizures and confiscations have made that before 2008 the effective contribution of the “Narcotics” fund did not account for a large share in MILDT’s payments. The working of the fund has improved over the last few years. As a result, since 2008, the “Narcotics” fund has been steadily increasing its share in the MILDT’s budget. This evolution might be matched to an equivalent reduction in the proportion of current regular credits. On the opposite, this trend might be matched to an unchanged proportion of current regular credits, increasing, at any rate, the total MILDT’s credits.
Regarding the purposes of the MILDT’s payments, the budgetary contribution of the MILDT has a twofold mission (see tables 7 and 8 below).
MILDT’s expenditures to formulate and coordinate overall drug policy The MILDT’s budget is devoted to planning and coordinating the governmental priorities in the field of drug policy. It includes not only the missions of the MILDT itself concerning the formulation and coordination of the overall drug policy, but also the monitoring of the regular activities performed by the three following bodies: the French Monitoring Centre for Drugs and Drug Addictions (OFDT), the Inter-agency drug control training centre (CIFAD), and, finally, the Regional support devices on drugs and drug addiction (Dispositifs d’appui régionaux, DAR), responsible for providing assistance to the State government drugs national coordinators implementing the governmental priorities.
236 Décret n° 95-322 du 17 mars 1995 autorisant le rattachement par voie de fonds de concours du produit de cession des biens confisqués dans le cadre de la lutte contre les produits stupéfiants (NOR BUDB9560005D). Arrêté du 23 août 1995 fixant les modalités de rattachement par voie de fonds de concours du produit de cession des biens confisqués dans le cadre de la lutte contre les produits stupéfiants (NOR SANG9502738A).
205
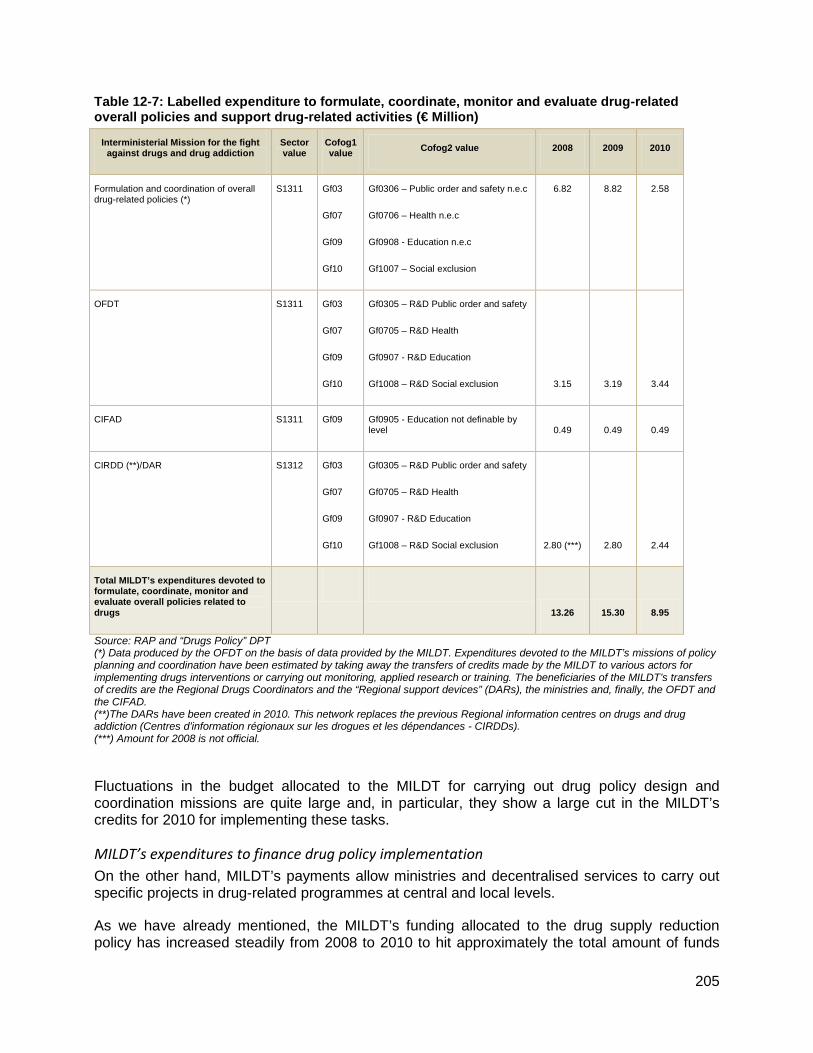
Table 12-7: Labelled expenditure to formulate, coordinate, monitor and evaluate drug-related overall policies and support drug-related activities (€ Million)
Interministerial Mission for the fight against drugs and drug addiction
Sector value
Cofog1 value Cofog2 value 2008 2009 2010
Formulation and coordination of overall drug-related policies (*)
S1311 Gf03
Gf07
Gf09
Gf10
Gf0306 – Public order and safety n.e.c
Gf0706 – Health n.e.c
Gf0908 - Education n.e.c
Gf1007 – Social exclusion
6.82 8.82 2.58
OFDT S1311 Gf03
Gf07
Gf09
Gf10
Gf0305 – R&D Public order and safety
Gf0705 – R&D Health
Gf0907 - R&D Education
Gf1008 – R&D Social exclusion 3.15 3.19 3.44
CIFAD S1311 Gf09 Gf0905 - Education not definable by level 0.49 0.49 0.49
CIRDD (**)/DAR S1312 Gf03
Gf07
Gf09
Gf10
Gf0305 – R&D Public order and safety
Gf0705 – R&D Health
Gf0907 - R&D Education
Gf1008 – R&D Social exclusion 2.80 (***) 2.80 2.44
Total MILDT’s expenditures devoted to formulate, coordinate, monitor and evaluate overall policies related to drugs
13.26 15.30 8.95
Source: RAP and “Drugs Policy” DPT (*) Data produced by the OFDT on the basis of data provided by the MILDT. Expenditures devoted to the MILDT’s missions of policy planning and coordination have been estimated by taking away the transfers of credits made by the MILDT to various actors for implementing drugs interventions or carrying out monitoring, applied research or training. The beneficiaries of the MILDT’s transfers of credits are the Regional Drugs Coordinators and the “Regional support devices” (DARs), the ministries and, finally, the OFDT and the CIFAD. (**)The DARs have been created in 2010. This network replaces the previous Regional information centres on drugs and drug addiction (Centres d’information régionaux sur les drogues et les dépendances - CIRDDs). (***) Amount for 2008 is not official.
Fluctuations in the budget allocated to the MILDT for carrying out drug policy design and coordination missions are quite large and, in particular, they show a large cut in the MILDT’s credits for 2010 for implementing these tasks.
MILDT’s expenditures to finance drug policy implementation On the other hand, MILDT’s payments allow ministries and decentralised services to carry out specific projects in drug-related programmes at central and local levels.
As we have already mentioned, the MILDT’s funding allocated to the drug supply reduction policy has increased steadily from 2008 to 2010 to hit approximately the total amount of funds
206
allocated to undertake projects in the area of drug demand reduction (€12.85 million in 2010). The key role played by the “Narcotics” fund since 2008 explains to a great extent the above-mentioned trend: according to the budgetary rule set when the “Narcotics” support fund was created, about 90% of the total amount is redistributed to the ministries to fund the acquisition of equipment or services responsible for fighting drug trafficking and for law enforcement. No more than the remaining 10% can be used to fund preventive activities carried out by the relevant ministries.
Table 12-8: Labelled expenditure to support drug-related activities (€ Million)
Interministerial Mission for the fight against drugs and drug addiction
Sector value Cofog1 value 2008 2009 2010
Transfer of credits to ministries to implement drug-related programmes in the area of order and safety (Funds from the “Narcotics” Fund)
S1311 Gf03 - Public order and safety 3.14 5.75 9.99
Transfer of credits to local governments for implementing drug-related programmes in the area of order and safety (Funds allocated to National Drug Coordinators)
S1312 Gf03 - Public order and safety 1.01 0.87 1.30
Total expenditure for financing drug supply reduction projects
Gf03 - Public order and safety 4.15 6.62 11.29
Source: Table elaborated by the OFDT using data from the RAP and DPT from 2010 to 2012.
207
Table 12-9: Labelled expenditure to fund drug-related activities (€ Million)
Interministerial Mission for the fight against drugs and drug addiction
Sector value Cofog1 value 2008 2009 2010
Transfer of credits to ministries to implement drug-related programmes in the area of education, health and social exclusion (Funds allocated to National Drug Coordinators)
S1311 Gf07– Health 0.35 0.64 1.11
Transfer of credits towards State government at local level for implementing drug-related programmes in the area of education (Funds allocated to National Drug Coordinators)
S1312 Gf09 - Education 9.11 7.83 11.74
Transfer of credits to local governments for implementing drug-related activities in the area of health and social exclusion (*)
S1312 Gf07– Health
Gf10 – Social Exclusion
4.00 5.00 Paid by the Social security
system
Total expenditure for financing drug demand reduction projects
13.46 13.47 12.85
Source: Table elaborated by the OFDT using data from the RAP and DPT from 2010 to 2012. (*): It concerns the “Health and Justice programmes”. Such a budget has been financed by the Interministerial Mission for the fight against drugs and drug addiction from 1993 to 2009. Since 2010, such expenditure is made by the Social security system.
Unlabelled expenditures: source of information used and main components
Unlabelled expenditures presented in this work have been estimated by the ministerial services involved in combating drugs and preventing drug use. Since 2009, such estimates are listed in a financial reporting document: Transversal Drugs Policy Document “Document de politique transversal: Politique de lutte contre les drogues et les toxicomanies” (“drugs policy” DPT) which focuses on drug activities undertaken by authorities during the reporting year. Such document is issued by the MILDT in collaboration with the ministries involved.
The “drugs policy” DPT compiles the main interventions carried out by ministries in the field of drugs and publishes amounts disbursed for implementing such interventions. Estimates are broken down by programme and actions. Programmes are promoted by the ministries responsible for fighting drugs and preventing drug use. Thirty ministerial programmes are listed. They involve several ministries and related services:
• The Ministry of the Economy, Finance and Industry contributes to fighting the black economy related to narcotics and legal drugs through the Directorate for French Customs and Indirect Taxes (Direction générale des douanes et droits indirects or “DGGDI”), which is dependent from this ministry.
• The Ministry of National Defence, the Ministry of Domestic Affairs and the Ministry of Justice also participate in drug-fighting activities. They are responsible for the activities of the army and the police and for the working of the legal system (law courts activities) and of prison services.
• The Ministry of Foreign Affairs is also involved in fighting illegal drugs through international cooperation seeking to fight international drug trade.
208
• The Ministry of National Education participates in activities aimed at preventing addictive behaviour through interventions at schools.
• Finally, the Ministry of Health and Solidarity is also involved in the prevention of drug abuse.
Table 12-10 shows detailed expenditures attributable to drugs policy in the area of drug supply and drug demand reduction.
As table 12-10 shows, 2008-2010 expenditure trends by area of intervention show a remarkable difference. While unlabeled expenditure for carrying out action in the area of drug prevention has fallen sharply between 2009 and 2010, public spending attributable to security and public order has strongly increased.
Table 12-10: Un-labelled expenditure devoted to drug supply reduction policy (€ Million)
Drug Supply Reduction Sector value
Cofog1 value
Cofog2 value 2008 2009 2010
Expenditure attributable to combat black economy related to narcotics and legal drugs (Customs Department)
S1311 S1312
Gf04- Economic Affairs
Gf0401 – General economic, commercial and labour affairs
193.50 191.00 240.00
Expenditure attributable to the Police related to narcotics and legal drugs offences
S1311 S1312
Gf03- Public order and safety
Gf0301- Police services
146.122 183.22 199.11
Expenditure attributable to the National Gendarmerie related to narcotics and legal drugs offences
S1311 S1312
Gf02- Defence
Gf0202-Civil defence
15.64 69.65 128.43
Expenditure attributable to combat international trafficking (Military defence)
S1311 S1312
Gf02- Defence
Gf0201-Military defence
32.16 22.35 14.55
Expenditure attributable to drug-related prosecution by law courts S1311 S1312
Gf03- Public order and safety
Gf0303-Law courts
- 67.85 92.17
Expenditure attributable to foreign economic aid
S1311 S1312
Gf01-General public services
Gf0102-Foreign economic aid
2.88 0.17 0.43
Total of amounts devoted to drug supply reduction interventions S1311 S1312
390.30 534.24 674.69
209
Drug Demand Reduction Sector value
Cofog1 value
Cofog2 value 2008 2009 2010
Expenditure attributable to communication campaigns S1311 Gf07-Health
Gf0704 Public health services-
4.19 6.75 5.64
Cost of staff and functioning of health ministerial services and health public services:
ADALIS - Drugs and alcohol addiction information service in charge of the national telephone helpline and internet counseling service on licit and illicit substances
INPES-National institute for prevention and health education
S1311 Gf07-Health
Gf0704 Public health services
21.01 39.72 30.75
Expenditure attributable to health services at school S1311 S1312
Gf07-Health
Gf0704 Public health services
37.05 34.40 28.67
Expenditure attributable to selective prevention S1311 S1312
Gf10-Social protection
Gf1004-Family and children
54.92 19.01 21.66
Expenditure attributable to universal prevention in school S1311 S1312
Gf07-Health
Gf1004-Family and children
324.85 348.46 233.41
Total of amounts devoted to drug demand reduction interventions S1311 S1312
444.38 449.77 323.76
210
Table 12-11 shows all categories of aggregated expenditures for unlabelled public spending.
Table 12-11: Unlabelled expenditure to fight drugs and prevent drug use (€ Million): evolution of main categories of expenditure (annual change)
Sector value Cofog1 value 2008 2009 2010
Unlabelled expenditure devoted to Defence, Public order & Safety and Customs’ action against narcotics and black economy
S1311 Gf02 - Defence
Gf03- Public order and safety
Gf04 – Economic affairs
390.30 534.24 674.69
Unlabelled expenditure devoted to prevention (universal, selected and indicated)
S1311 Gf09 - Education
Gf07 - Health
444.38 449.77 323.76
Unlabelled expenditure devoted to R&D (any area)
S1311 Gf07 - Health 12.07 14.84 11.47
Unlabelled expenditure devoted to Training (any area)
S1311 Gf09 - Education 10.75 10.59 11.02
Total 857.51 1009.45 1020.92
Annual change (%) na +17.7% +1.1%
Source: Table elaborated by the OFDT using data from the RAP and DPT of 2010, 2011 and 2012 Note: Doping-related expenditures have been excluded. The annual budget amounts to approximately €9 million.
Globally, data make appeared an upward increase in unlabelled public spending attributable to combating and preventing legal and illegal drugs consumption from €857 million in 2008 to €1 billion in 2010. Nevertheless, figures describing the annual change in unlabelled drug related expenditures show a sharp slowdown in such increase (+17 percent to +1 percent of annual change over the period following the “Great Recession”). Note however that this remark does not concern GP’s and hospital’s trends over the period in health expenditure related to drugs for which up-dated estimates do not exist for the study period of reference (see further explanations in section below dealing with main shortfalls of unlabelled expenditures) This evolution appears to be consistent with the global public spending deceleration described in the first part of this work. It is essential, however, to aggregate both budgets (labelled and unlabelled) in order to interpret the global trend in drug-related expenditure (see section below).
Methods used to determine unlabelled expenditures and their main shortfalls
The financial reporting documents for the period 2008-2010 describe rarely in detail the methods used to produce estimates. More detailed methodological information has been requested by the MILDT to ministries for the year 2013.
211
Estimation of direct costs of specific services or interventions referred to as “drug-related” It seems that the authorities responsible for the programmes have, at times, the possibility to identify clearly specific services and interventions. When ministerial services or activities which fall into broader programmes can be referred to as “drug-related”, expenditures are identified as such and listed as “drug-related”.
Some examples follow, by area of intervention:
• The implementation of a mass media campaign on drugs or the financing of ADALIS, the National Telephone helpline & Internet Counselling Service on licit and illicit drugs in the area of the drug demand reduction policy.
• The “police coordination units” for fighting drugs in the area of drug supply reduction policy.
Direct costs are easily determined. These items of expenditures include the costs of staff, regular functioning and equipments. This case may be assimilated to any other labelled expenditure (see the section above dealing with labelled expenditures). There is no specific calculation method required. The costs of activities or services compiled are just aggregated.
Methods of calculation relying on monitoring activity records When monitoring records are available for the service concerned, estimates may be based on a “top down” or “bottom up” approach. The estimation method can vary from one activity to another depending on the availability of records. The total expenditure for drug-related activities is aggregated by programme. Some explanation about both methods follows:
The top down approach In this case, the fraction of the overall activity which is devoted to drug use prevention or fighting drugs and drug addiction is known. The authorities can work out the expenditure attributable to the drugs policy even if they are not specifically “drug-related”. In order to calculate an estimate, this fraction is applied to the total cost of staff and regular functioning of the service concerned. For the year 2010, for example, ten percent of police affairs stood for narcotics affairs which involved sixty police units accounting for several hundreds of thousands of hours/police officers. In this example, police expenditures attributable to drug-related activities have been calculated by multiplying the total expenditure of the police services by the fraction of 10 percent.
The bottom up approach The work time spent by staff in charge of supporting drug-related activities or the equipments used have been recorded by the ministerial services. It is the case for example of the hours of prevention interventions in school or the alcohol tests conducted at the driving controls carried out by the Police corps or the National Gendarmerie.
The main methodological short falling worth discussing concerns the completeness of unlabelled expenditures compiled by the “drugs policy” DPT. It is important to note that several categories of drug-related expenditure cannot be identified in the above unlabelled figures:
• Major health expenditure
• Major prison services expenditure
• Expenditure by local administrations
212
Health expenditures
State expenditures in health The Ministry of Health participates in the drug policy by formulating, coordinating and evaluating health policy. It finances not only health central services, but also public institutions involved in the field of drugs (such as the budget allocated to the INPES and NGOs’ projects. These expenditures are included in the estimates presented in the table 10. The direct cost from the health regional services (decentralised health services) are not however taken into account in the estimation. This category of public expenditure does not seem to have been estimated in the past.
Expenditure attributable to the rest of decentralised ministerial services (Economy, Defence, Interior, Justice and Education) is contained in the financial reporting documents used for the present work.
General practitioners (GPs) and hospital expenditures for paying out the provision of drug abuse health services Because refunded by the social security system, financial reporting documents used do not include major categories of expenditures in health as the costs of treatments provided by the French GPs or in hospitals (see labelled expenditure in table 12-10). These categories of expenditures have been estimated for 2003 by Kopp and Fénoglio (Kopp et al. 2006). It was estimated at somewhere between €573 and €632 million for the illicit drugs. Expenditures for alcohol-related treatments were estimated between €5,467 million and €6,156 million in the study of 2003. Treatment costs of tobacco-related health problems were estimated in the range of €15,537 and €18,254.
Taking into account inflation since 2003, such estimates on expenditures in health-related problems would have reached €689.50 million for illicit drugs, €6 646.50 million for alcohol and €19,322.50 million for tobacco, in 2010.
Prisons service expenditures While estimates compiled in table 12-10 include the credits allocated by the prisons service to carry out selective prevention interventions which account for €2 million, the other items of expenditures have not been estimated, probably because of accounting difficulties. Kopp and Fénoglio (Kopp et al. 2006b) referred to €219.79 million in 2003, of which €200.49 accounts for illicit drug-related convictions, and €19.30 million for drink driving convictions.
After inflation since 2003, such estimates on incarceration spending would have reached €229 million and €22 million in 2010, respectively.
Drug-related expenditure by local administrations The “drugs policy” DPT depends entirely on the State budget. Budgets applied to fighting, prevention and treating drug addiction by the local administrations are not included. This category of drug-related expenditure does not seem to have been estimated in the past.
12.2.2. Total drug-related expenditures and final discussion
Table 12-12 shows total labelled and unlabelled expenditures for implementing the drugs policy for the three-year period of reference.
213
Table 12-12: Total expenditure to fight drugs and prevent drug use (€ Million)
Total expenditures Sector value Cofog1 value Cofog2 value 2008 2009 2010
Expenditure on Defence, Public order & Safety and Customs’ actions against narcotics and black economy
S1311 Gf02 - Defence
Gf03 – Public order and safety
Gf04 – Economic affairs
Gf0202-Civil defence
Gf0301- Police services
Gf0401- General economic, commercial and labour affairs
394.46 540.86 685.98
Expenditure on universal and selected prevention
S1311 Gf09 - Education
Gf07 - Health
Gf0704-Public health services
Gf1004-Family and children
452.22 456.80 332.97
Expenditure on indicated prevention and health (*)
S1311 Gf07 - Health Gf0704- Public health services
315.59 346.19 369.53
Expenditure on Research & Development (R&D)
S1311 Gf07 - Health Gf0705-R&D Health 12.07 14.84 11.47
Expenditure on training S1311 Gf09 - Education Gf0905- Education non
definable by level 11.24 11.08 11.51
Expenditure on overall coordination
S1311 Gf03 – Public order and safety
Gf07 - Health
Gf09 - Education
Gf10 – Social exclusion
Gf0306-– Public order and safety n.e.c
Gf0706- Health n.e.c
Gf0908-Education n.e.c
Gf1009-Social protection n.e.c
6.62 8.82 2.58
Expenditure on overall monitoring & evaluation (OFDT&DAR)
S1311 Gf03 – Public order and safety
Gf07 - Health
Gf09 - Education
Gf10 – Social protection
Gf0306-– Public order and safety n.e.c
Gf0706- Health n.e.c
Gf0908-Education n.e.c
Gf1009-Social protection n.e.c
6.15 5.99 5.88
Total 1198.35 1384.58 1419.93
Annual change (%) - +16% +3%
214
(Total expenditure Sector value
Cofog1 value
Cofog2 value 2008 2009 2010
Kopp and Fénoglio updated estimates on expenditure categories not included above (**)
Updated costs for treatment attributable to drug-related health problems
26 237 26 264 26 657
Tobacco 19 018 19 038 19 323
Alcohol 6 541 6 548 6 646
Illicit drugs 678 678 688
Prison expenditure updated cost of drug-related convictions
246 246 251
Incarceration costs of illicit drug-related convictions
225 225 229
Incarceration costs for drink driving convictions
21 21 22
Source: Table elaborated by the OFDT using data from the RAP and DPT of 2010, 2011 and 2012 (*) In order to make year-on-year comparisons easier, OST refund figures for 2008-2010 have been taken away. This item accounts for €90 million approximately. (**) The costs of treatment attributable to drug-related health problems were estimated at €21.58 billion in 2003 (Kopp and Fénoglio, 2006b). This study estimated prison expenditures at €219.79 million in 2003. The figures presented above show the evolution of drug fighting and prevention government expenditure from 2008 to 2010. Collected data may seem to indicate a rapid deceleration in public spending on fighting drugs. Between 2008 and 2009, drug-related expenditure has gone up by 16 percent. After the crisis, however, the annual increase has not been so great, recording 3 percent in 2010. This trend is consistent with the global austerity policy led by the French government in the recent past, and, particularly so, after the “Great recession”. Accordingly to the INSEE, after the recent crisis, public spending increase slowed down to 2 percent. Forecasts for 2011 and 2012 announce a progressive deceleration in public expenditure: 1.8 percent in 2011 and 0.5 percent in 2012. The rescue measures set in place by the government at the beginning of the crisis have indeed led the French economy to come out the red in 2009. In order to stimulate the economy, the government increased sharply public expenditure at the beginning of the “Great Recession”. However, the economy recovery has proved modest. Sluggish global economic activity has made it impossible to remove the threat posed by the spiral of a deeper sovereign debt crisis. The French government was left with the only choice of carrying out austere public policies. As above figures indicate, the drugs policy carried out by the State has not been the exception.
In conclusion, drug-related spending is addressed by the government scheme in the same way as any other category in French public expenditure at large. By area of intervention, some facts must be highlighted. Expenditure on universal and selective prevention interventions has been drastically reduced between 2009 and 2010. The modest deceleration in public spending affects interventions in the area of health and indicated prevention. As a matter of fact, expenditure in this area has slowed down from 9 percent in 2009 to 6 percent in 2010. The largest expenditure increase corresponds to drug supply reduction policy. Nevertheless, such increase has slowed down sharply between 2009 and 2010, from 37 percent to 27 percent.
We must remark the fact that we cannot rely on complete data to conduct such analysis. As we mentioned above, estimates from 2008 to 2010 for unlabelled expenditures in the area of health and in prison are not available.
215
Acknowledgements We would like to thank Marie-Claude Roisnard (OFDT), Jean Marie Bazile (MILDT) and Malisa Rattanatray (DGS) for valuable information and explanations concerning public accounting which they generously provided to us during the preparation of this study. Comments by Christian Ben Lakhdar and Christophe Palle were also much appreciated.