1.0 ECONOMIC OVERVIEW 1.1 GDP Growth and Retail Sales Singapore’s economy on a modest growth path Singapore’s economy expanded by 2.0% (1) y-o-y in 2015. This was a moderation from the 3.3% in 2014. All sectors grew in 2015, except manufacturing and transportation & storage. Wholesale & retail trade was one of the key contributors to growth in 2015. On a y-o-y basis, Real Gross Domestic Product (GDP) growth was 2.1% in both Q1 and Q2 2016, up from 1.8% in Q4 2015. Amid more cautious spending, retail sales moderated in 2015 and H1 2016 Lukewarm global demand and concerns over the mixed performances of various industries in Singapore have weighed down on overall consumer sentiment. Consumers were more cautious in discretionary spending e.g., telecommunications & computers, watches & jewellery, and optical goods & books. As such, non-motor vehicle retail sales (2) declined by 1.0% in 2015, following the 0.7% decline in 2014. Non-motor vehicle sales volume remained sluggish in H1 2016, declining by 4.0% and 3.9% y-o-y in Q1 and Q2 2016 respectively. Despite more Singapore residents spending overseas on the back of the stronger Singapore Dollar, majority still spend in-store The moderation in non-motor vehicle retail sales was partly attributed to the rise in residents’ expenditure abroad, which grew by 2.0% in 2015, up from 0.5% in 2014 (3) . This came alongside an increase in outbound departures of Singapore residents from 8.9 million in 2014 to 9.1 million in 2015. With the stronger Singapore Dollar, more Singapore residents are spending overseas. Google’s Consumer Barometer Survey 2014/15 showed Singapore as having the highest frequency (4) of online international purchases, driven by more appealing offers, a broader range of products and better payment and service conditions from overseas e-retailers. Meanwhile, VisaNet (5) highlighted that 20% of its e-commerce transactions in Singapore are cross- border transactions, with top corridors being US and UK. Notwithstanding, with the availability of well-located malls and both landlords and retailers constantly innovating their concepts, majority still spend in-store, as Singapore residents regard shopping as a leisure activity. 1.2 Tourism More opportunities in retail and medical services backed by resurgence of Mainland Chinese visitors International visitor arrivals increased by 0.9% to 15.2 million (6) in 2015, reversing the 3.0% decline in 2014, partly backed by Singapore Tourism Board (STB)’s initiatives aimed at boosting tourism. Some of the cornerstone initiatives included a S$20 million (7) global marketing campaign that leveraged on Singapore’s Golden Jubilee year (SG50), as well as a S$35 million joint marketing campaign between STB and Changi Airport Group to grow visitor arrivals by 3% to 4% per annum from 2015 to 2025. The increase in international visitors to Singapore was largely supported by a resurgence in the number of Mainland Chinese visitors, which reached 2.1 million in 2015, a 22.3% increase from 1.7 million in 2014. Notably, visitor arrivals from 12 secondary cities in Mainland China increased by 32% to 433,000 in 2015 due to increased flight connectivity and STB’s marketing campaign. From June 2015, the multiple-journey visa for Mainland Chinese visitors was extended to a maximum of 10 years, making return visits to Singapore convenient. Orchard Road is the most popular free-access destination for Mainland Chinese visitors. More importantly, they spend about twice as much on shopping compared to other visitors (8) . Riding on the trend, the Singapore Retailers Association also included Mainland China’s financial services firm UnionPay MARKET OVERVIEW Notes: (1) Ministry of Trade and Industry. (2) Based on the retail sales index (excluding motor vehicles) from the Department of Statistics Singapore (DOS). (3) Yearbook of Statistic 2016, DOS. (4) 67% of surveyed Internet users purchased products online from abroad at least once a year. (5) VisaNet data as of November and December 2015. (6) Based on STB’s International Visitor Arrivals statistics. (7) All currencies in this report are in SGD, unless stated otherwise. (8) Based on Channel News Asia’s interview with STB and Barclays. Chinese tourist arrivals in Singapore set to get boost, 22nd August 2015. SPH REIT ANNUAL REPORT 2016 48
Transcript
1.0 EConoMIC oVERVIEW
1.1 gdP growth and Retail SalesSingapore’s economy on a modest growth pathSingapore’s economy expanded by 2.0%(1) y-o-y in 2015. This was a moderation from the 3.3% in 2014. All sectors grew in 2015, except manufacturing and transportation & storage. Wholesale & retail trade was one of the key contributors to growth in 2015.
on a y-o-y basis, Real Gross Domestic Product (GDP) growth was 2.1% in both Q1 and Q2 2016, up from 1.8% in Q4 2015.
amid more cautious spending, retail sales moderated in 2015 and H1 2016Lukewarm global demand and concerns over the mixed performances of various industries in Singapore have weighed down on overall consumer sentiment. Consumers were more cautious in discretionary spending e.g., telecommunications & computers, watches & jewellery, and optical goods & books. As such, non-motor vehicle retail sales(2) declined by 1.0% in 2015, following the 0.7% decline in 2014. Non-motor vehicle sales volume remained sluggish in H1 2016, declining by 4.0% and 3.9% y-o-y in Q1 and Q2 2016 respectively.
despite more Singapore residents spending overseas on the back of the stronger Singapore dollar, majority still spend in-store The moderation in non-motor vehicle retail sales was partly attributed to the rise in residents’ expenditure abroad, which grew by 2.0% in 2015, up from 0.5% in 2014(3). This came alongside an increase in outbound departures of Singapore residents from 8.9 million in 2014 to 9.1 million in 2015.
With the stronger Singapore Dollar, more Singapore residents are spending overseas.
Google’s Consumer Barometer Survey 2014/15 showed Singapore as having the highest frequency(4) of online international purchases, driven by more appealing offers, a broader range of products and better payment and service conditions from overseas e-retailers. Meanwhile, VisaNet(5) highlighted that 20% of its e-commerce transactions in Singapore are cross-border transactions, with top corridors being uS and uK.
Notwithstanding, with the availability of well-located malls and both landlords and retailers constantly innovating their concepts, majority still spend in-store, as Singapore residents regard shopping as a leisure activity.
1.2 TourismMore opportunities in retail and medical services backed by resurgence of Mainland Chinese visitors International visitor arrivals increased by 0.9% to 15.2 million(6) in 2015, reversing the 3.0% decline in 2014, partly backed by Singapore Tourism Board (STB)’s initiatives aimed at boosting tourism. Some of the cornerstone initiatives included a S$20 million(7) global marketing campaign that leveraged on Singapore’s Golden Jubilee year (SG50), as well as a S$35 million joint marketing campaign between STB and Changi Airport Group to grow visitor arrivals by 3% to 4% per annum from 2015 to 2025.
The increase in international visitors to Singapore was largely supported by a resurgence in the number of Mainland Chinese visitors, which reached 2.1 million in 2015, a 22.3% increase from 1.7 million in 2014. Notably, visitor arrivals from 12 secondary cities in Mainland China increased by 32% to 433,000 in 2015 due to increased flight connectivity and STB’s marketing campaign.
From June 2015, the multiple-journey visa for Mainland Chinese visitors was extended to a maximum of 10 years, making return visits to Singapore convenient. orchard Road is the most popular free-access destination for Mainland Chinese visitors. More importantly, they spend about twice as much on shopping compared to other visitors(8). Riding on the trend, the Singapore Retailers Association also included Mainland China’s financial services firm unionPay
mARKET OvERvIEW
Notes:(1) Ministry of Trade and Industry.(2) Based on the retail sales index (excluding motor vehicles) from the Department of Statistics Singapore (DoS).(3) Yearbook of Statistic 2016, DoS.(4) 67% of surveyed Internet users purchased products online from abroad at least once a year.(5) VisaNet data as of November and December 2015.(6) Based on STB’s International Visitor Arrivals statistics.(7) All currencies in this report are in SGD, unless stated otherwise.(8) Based on Channel News Asia’s interview with STB and Barclays. Chinese tourist arrivals in Singapore set to get boost, 22nd August 2015.
S P h r e I TA N N u A L R E P o R T 2 0 1 648
International as transaction partner during the Great Singapore Sale 2016. According to unionPay International, the spending pattern of Mainland Chinese visitors has evolved with spending on tourism experience including hospitality, dining, airlines and non-luxury retail growing faster than luxury goods.
With the relaxation of visa requirements, other segments (including medical services) will benefit from affluent pat ients from Mainland China. Compared to competing medical destinations, lower language barrier and shorter flight distance make Singapore attractive.
The increase in Mainland Chinese visitorship was also supported by STB’s partnership with digital media platforms e.g., travel services (Alitrip and Tuniu) and social review websites (Dianping and Mafengwo). In April 2016, the orchard Road Business Association (oRBA) also set up a social media WeChat account to promote orchard Road to consumers in Mainland China directly.
With 40% of overall international arrivals, aSEan is regarded as a key source market Visitor arrivals from ASEAN and Australia moderated by 6.0% and 2.9% respectively in 2015, owing partly to the stronger Singapore Dollar. Nonetheless, the government continues to regard ASEAN as a key source market, as it accounted for almost 40% (5.75 million visitors) of overall international arrivals over the past decade. In addition to launching marketing campaigns in seven key markets – Australia, China,
India, Malaysia, Philippines, Indonesia and Vietnam, the official Singapore tourism website – YourSingapore.com was also revamped to feature more user-generated content and recommendations.
Business Travellers segment moderated, while the Leisure segment remained resilientAlthough there was an uplift in international visitor arrivals, tourism receipts declined by 7.6% from S$23.6 billion in 2014 to S$21.8 billion(9)
in 2015. The decline was primarily attributed to the impacted Business Travellers segment, given the cutback on corporate travel and trip budgets.
on a positive note, the number of leisure visitors to Singapore grew by 2.0% in 2015, while tourism receipts from leisure travellers fell by only 2%, performing more resiliently than other visitor segments. This came alongside increased investment in the cruise sector and more aggressive marketing efforts by the government and industry stakeholders to grow the cruise industry. For example, the Cruise Development Fund by STB is made available for cruise industry players to support the home-porting of new cruise ships or deployment out of Singapore.
Signs of improvement in the tourism sector in H1 2016Visitor arrivals for H1 2016 amounted to 8.2 million, up by 12.5% (7.3 million) from the same period in 2015. This was led mainly by the increased influx of visitors from Mainland China and ASEAN, as STB’s strategic partnerships and marketing campaigns launched in 2015 continued to lend support.
In Q1 2016, tourism receipts grew by 2% y-o-y (S$5.4 billion). Tourism receipts in shopping increased significantly by 25% y-o-y to S$1.2 billion, while that in Food & Beverages (F&B) rose by 14% y-o-y to S$606 million. STB forecasts overall visitor arrivals in Singapore to grow by up to 3% in 2016, while tourism receipts are expected to grow by up to 2%.
1.3 outlookSingapore’s real gdP growth in 2016 projected at 1.0% to 2.0%With increased uncertainty in the uK due mainly to its vote to leave the European union, as well as growing risks in Mainland China’s economy, global economic growth in 2016 is expected to slow. Nonetheless, the slowdown in growth is expected to be contained, with some major economies, e.g. uS, showing signs of strengthening.
The Ministry of Trade and Industry expects Singapore’s economy to grow by 1.0% to 2.0% in 2016, barring any external shocks (Table 1.1). Meanwhile, the growth of externally-oriented sectors such as finance & insurance and wholesale trade is expected to slow. The government expects tourism-related sectors to perform more positively, supported by the launch of new flights between Singapore and key inbound markets e.g., uS and Germany. Notwithstanding, the weak Sterling following Brexit could potentially divert some visitors away from Singapore to the uK, as well as cause leakage of shopping dollars through e-commerce from Singapore residents.
Note:(9) Based on STB Quarterly Tourism Receipts statistics.
T H E A R T o FP a r T n e r S h I P 49
Continued commitment by the government to drive tourism growth, which will benefit the retail industryTo ensure Singapore’s competitiveness as a vibrant tourism destination, the government allocated S$700 million as a third tranche of the Tourism Development Fund(11) for 2016 to 2020. Key areas of investment include the cruise industry, amid Asia’s emergence as a new growth frontier for cruise tourism and business development initiatives for business and leisure events.
In addition, plans are underway for the development of a new 126-ha wildlife and nature attraction at Mandai. Positioned as an eco-tourism hub, the area will house the Singapore Zoo, River Safari, Night Safari, Bird
Park (which will be relocated from Jurong) and a new Rainforest Park by 2020. The expected increase in visitor arrivals from these developments is likely to help bolster Singapore’s retail industry.
In-store sales to grow alongside e-commerce with emergence of bricks and clicksIn the short-term, retail spending is expected to remain weak amid softer consumer confidence. According to the MasterCard Index of Consumer Confidence, S ingapore’s score declined from 44.3 points in H2 2015 to 33.6 points in H1 2016.
Notw i ths tand ing , burgeon ing e-commerce is expected to mitigate the overall slowing retail sales. According to a joint study(12) by
Google and Temasek Holdings, Singapore’s e-commerce market is expected to grow more than five times from uS$1.0 (S$1.4) billion in 2015 to uS$5.4 (S$7.5) billion in 2025. In line with this expansion, e-commerce is expected to account for 6.7% of Singapore’s retail trade by 2025, up from 2.1% in 2015. The growth of omni-channel marketing is expected to boost in-store retailing, as companies integrating between online and offline presence, leading to more bricks and clicks. For example, shoppers can browse and experience products in store, while purchases can be made online through mobile devices at shoppers’ convenience.
mARKET OvERvIEW
Indicator 2015 2016f 2017f
Inflation -0.5% -1.0% to 0.0%(MAS)
0.1% to 2.0%(9)
Real gdP growth 2.0% 1.0% to 2.0%(MTI)
1.4% to 3.0%(10)
International Visitor arrivals 15.2 million 15.2 to 15.7 million(8.2 million in H1 2016)
NA
Tourism Receipts S$21.8 billion S$21.8 to S$22.2 billion NA
Population growth 1.2%(Mid-year estimate)
1.3% to 1.6%(Population White Paper)
Source: MTI, DoS, MAS, STB, August 2016.
table 1.1: keY econoMic indicators
Notes:(9) Based on STB Quarterly Tourism Receipts statistics.(10) Based on the Monetary Authority of Singapore’s Survey of Professional Forecasters as at June 2016. It reflects the views received from 22 economists
and analysts.(11) The Tourism Development Fund was introduced in 2005, with an initial S$2 billion. It was topped up with a second tranche of funding of S$905 million in 2015.(12) Google and Temasek Holdings, e-conomy SEA: unlocking the S$200 billion digital opportunity in Southeast Asia, May 2016.
S P h r e I TA N N u A L R E P o R T 2 0 1 650
In the mid-to long-term, retail sales in Singapore is primed for moderate growth. Based on forecasts by the Economist Intelligence unit(13), overall retail sales volume growth for Singapore is expected to range from 2.4% to 2.9% per annum from 2016 to 2018.
2.0 RETaIL PRoPERTY MaRKET(14)
2.1 Retail TrendsRise of omnichannel shoppersWith the rise of Millennials and the exponentia l growth of the e-commerce/ online retailing market, shopper dynamics are evolving. Traditional brick and mortar retailers are generally facing more competition from online shopping marketplaces, given Singapore’s high internet and smartphone penetration rates(15). While some consumers are taking a hybrid (online and offline) approach to shopping, many consumers continue to value the experience of shopping at the physical store.
According to a survey by Nielsen(16), 41% of the respondents (mainly M i l l enn ia l s and Genera t ion-X Singaporeans) were omnichannel shoppers who purchase through both online and offline retail channels, while 12% were shoppers who gather information from online and offline sources, but shop at brick and mortar stores. only 17% of the respondents were fully dependent on online platforms for browsing and purchasing, and their top categories of purchases were fashion, travel and IT mobile gadgets.
a focus on digital marketing and experiential retail conceptsWith the emergence of more omnichannel shoppers, mall landlords and retailers are incorporating digital touch points into their Business
to Consumer (B2C) processes to provide consumers with seamless and unique shopping experiences. Mobile commerce is also emerging as a key channel for retailers, with half of online shoppers surveyed by Visa(17) in 2015 preferring to make their purchases via mobile devices.
New schemes implemented by retailers include the “Click and Collect” services, which allows customers to make online purchases and collect them at nearby malls (e.g. Marina Bay Sands and Courts Singapore) and “iBeacon”, which allows retailers to engage in location-based marketing and promotion (e.g. EpiCentre). Despite the focus on digital marketing and e-commerce, many landlords and retailers continued to enhance their mall/ in-store experiences to remain competitive. For example, Funan DigitaLife Mall is redeveloping into an integrated development that will be an aspirational lifestyle destination and an experiential creative hub which will enable shoppers to enjoy retail in
a technology-enabled environment. This exemplifies the paradigm shift towards experiential retail.
F&B establishments are also adapting, amid the drive towards productivity and evolving consumer preferences. For instance, Rong Heng Seafood restaurant and Chilli Padi Nonya Café are using robots to serve and entertain their diners.
Luxury/high-end brands strengthened their presence at orchard RoadWith one of the highest GDP (at purchasing power parity) per capita globally, a high concentration of high-net worth individuals, a safe and secure environment as well as its strong global connectivity and status as a gateway to Asia, Singapore has established itself as a regional hub for luxury and designer retail brands. Despite the challenging market conditions, some luxury/high-end brands strengthened their presence, particularly at retail hotspots such as orchard Road and Marina Bay (Table 2.1).
Malls new tenantsExisting tenants expanding space
Paragon Loewe, Marc Jacobs, Mulberry, Emporio
Armani, Liu Jo
Givenchy, Cortina Watch, Café&Meal MuJI
Ion orchard Moncler, Tiffany & Co., Van Cleef & Arpels
Dior, Dolce & Gabbana, Louis Vutton,
Patek Philippe and Saint Laurent
Liat Towers Audemars Piguet, Hermes
–
Marina Bay Sands Braun Buffel, Valentino –
Source: REITs, Mall owners, August 2016.
table 2.1: selected new tenants and retail expansion
Notes:(13) Frost & Sullivan, Whitepaper: overview of the Retail Sector in ASEAN – Focus on companies listed on SGX, June 2016.(14) Figures in this section take into account both private and public retail spaces, unless otherwise stated.(15) Resident household access to internet in Singapore is at 88% as at end 2015 (Source: Infocomm Development Authority), while smartphone penetration
rate is at 88% as at end 2015 and 91% as at end July 2016 (Source: Google’s Consumer Barometer and The Connected Consumer Survey).(16) Nielsen, Bricks and Clicks Shopper Trends, August 2015. The survey polled 1,639 responses from Singaporeans in April and May 2015.(17) Visa’s 2015 Consumer Payment Attitudes Survey.
T H E A R T o FP a r T n e r S h I P 51
In Q3 2016, uniqlo opened in orchard Central, its first Global Flagship Store in Southeast Asia and Singapore. Going forward, Apple will open its first store at Knightsbridge by end 2016, the first Apple Store in Southeast Asia and Singapore as well. These new openings are expected to inject more vibrancy in orchard Road.
2.2 Existing Supply(18)
Limited completions in orchard/Scotts RoadAs at end Q2 2016, islandwide public and private retail stock was 64.8 million sq ft.
only some 12% (7.6 million sq ft) was in orchard/Scotts Road where Paragon is located. There is limited new supply in orchard/Scotts Road e.g. the asset enhancement initiatives in Claymore Connect (10,000 sq ft) in Q4 2015. Park Mall at Penang Road (which is next to orchard Road) closed in September 2016, as it is being redeveloped into an office development (345,000 sq ft) with ancillary retail (20,000 sq ft).
Some 7.7% (5.0 million sq ft) of retail stock was in Clementi (where The Clementi Mall is located), and neighbouring Jurong East and Queenstown Planning Areas. Between Q3 2015 and Q2 2016, completions were mainly outside the abovementioned planning areas and they include asset enhancement initiatives in Viva Business Park (150,000 sq ft) and Compass one (282,000 sq ft).
2.3 Potential Supply Some 4.0 million sq ft of retail nLa in the pipeline from Q3 2016 to 2020, mainly in the Suburban areasApproximately 7.6 million sq ft of retail GFA is expected to complete between Q3 2016 and 2020, of which 81% (6.2 million sq ft) is private retail space. We estimate that this translates to about 4.0 million sq ft of retail Net Lettable Area (NLA).
Majority of the pipeline supply between Q3 2016 and 2020 (71%; 2.8 million
sq ft) will be in the Suburban Areas, followed by 28%, or some 1.1 million sq ft in the other City Areas. In particular, the expected annual completions from 2016 to 2018 is likely to be similar to that in 2015 (1.5 million sq ft) (Figure 2.1).
Majority of suburban retail developments completing in H2 2016 are below 50,000 sq ftupcoming retail supply in H2 2016 is mostly in the other City Areas, given the completion of several large-scale mixed-use projects in the city centre. While there are some expected completions in the Suburban Areas, they are mostly small (below 50,000 sq ft) and are either Additions & Alterations (A&A) or ancillary retail amenities.
Pipeline supply in the Suburban Areas from 2017 onwards is mainly in the North and East Planning Regions, with many
mARKET OvERvIEW
Note:(18) Retail supply, demand and occupancy figures in this report are based on uRA’s statistics, unless stated otherwise.
Figure 2.1: pipeline supplY(million sq ft)
2.3
2.7
1.5 1.51.4
0.40.2
1.2
2013 2017F2015 2019F2014 2018F 2020F
Source: uRA, Edmund Tie & Co Consulting, August 2016.
Completed orchard/Scotts Road other City Areas Suburban Areas
2016F
S P h r e I TA N N u A L R E P o R T 2 0 1 652
near growth areas such as Woodlands Regional Centre, Paya Lebar Central and Changi Airport (Table 2.2).
Project Jewel is a joint development by Changi Airport Group and CapitaLand Mall Asia. As it is mainly targeted at transit shoppers and residents in the East, impact on overall retail scene is expected to be limited when it opens in 2018.
no major upcoming malls in the vicinity of Paragon and The Clementi MallPotential supply in the vicinity of Paragon and The Clementi Mall are not significant malls (Table 2.2). From H2 2016 to 2020, there will be less than 20,000 sq ft of NLA scheduled
Estimated Year of Completion development Location
Estimated nLa (sq ft)
H2 2016 Tanjong Pagar Centre
Wallich Street 100,000
H2 2016 Duo Galleria Fraser Street 56,000
H2 2016 our Tampines Hub
Tampines Avenue/ Tampines Street 82
77,000
H2 2016 NEWest West Coast Drive 64,000
2017 Singapore Post Centre (A&A)
Eunos Road 188,000
2017 Hillion Mall Jelebu Road 168,000
2017 Changi Airport Terminal 4
Airport Boulevard 183,000
2018 Project Jewel Airport Boulevard 576,000
2018 Paya Lebar Quarter
Paya Lebar Road/ Sims Avenue
340,000
2018 Northpoint City Yishun Central 1 290,000
Source: uRA, Edmund Tie & Co Consulting, August 2016.
table 2.2: Major retail projects in the pipeline
for completion in the orchard Road Planning Area, where Paragon is located. over the same period, three retail developments of less than 65,000 sq ft each are scheduled to complete in the Clementi, Jurong East and Queenstown Planning Areas, which is in the vicinity of The Clementi Mall.
2.4 demand and occupancydemand for retail space remained softAmid structural challenges in retailing such as labour constraints and competition from e-commerce, as well as moderating growth in retail sales, there were several store closures and retailers consolidating.
The opening of several flagship stores in orchard Road and other City Areas also
bolstered demand. Notwithstanding, islandwide occupancy moderated by 0.5%-points to 92.2% as at end Q2 2016.
While orchard/Scotts Road was more affected by the fall in discretionary spending, with occupancy in the area (90.8%) falling below islandwide levels, performance among shopping malls was relatively mixed. While older and strata-titled retail malls experienced a rise in vacancies, well positioned malls with good accessibility continued to maintain high occupancies of above 95%. Notably, Paragon and Ngee Ann City were fully occupied as at end Q2 2016, attracting both local shoppers and visitors alike.
Meanwhile, suburban malls enjoyed the highest occupancy rate at 93.2% as at end Q2 2016. In particular, many suburban malls under REITs remained fully occupied (e.g., The Clementi Mall) or experienced an uptick in occupancy in recent quarters.
2.5 RentsRents in orchard/Scotts Road and Suburban areas are more resilient Islandwide average fixed monthly gross retail rents for prime(19) first-storey retail units fell by 5.7% in 2015, resulting from the challenging conditions faced by retailers and the rise in vacancies. Among the retail areas, prime rents in the other City Areas declined the most in 2015, by 6.9%, while those in orchard/Scotts Road and the Suburban Areas were more resilient and fell by 5.0% and 5.7% respectively.
This trend prevailed in H1 2016, with prime rents in orchard/Scotts Road and Suburban Areas falling by 2.2% and 2.0% respectively, while those in the other City Areas fell by 5.0% (Figure 2.2).
Note:(19) Refers to the average gross rents (excluding turnover rents) of prime specialty retail shops with good frontage or pedestrian footage.
T H E A R T o FP a r T n e r S h I P 53
mix of international luxury labels. Notwithstanding, Paragon – together with other established malls in orchard Road – remain attractive to shoppers with its diverse shopping, dining, entertainment and hospitality options. orchard Road is expected to remain as the premier shopping street due to its strong clustering and variety of shopping, dining, entertainment and hospitality options available.
As for The Clementi Mall, the upcoming retail spaces in Clementi, as well as the neighbouring Jurong East and Queenstown Planning Areas are not direct competitors. Located in an integrated transit-oriented development, The Clementi Mall will continue to perform well.
In the next twelve months, while rents in orchard/Scotts Road and the
Suburban Areas including Clementi Planning Area are expected to soften, the decline is likely to be contained.
2.7 Implications on Paragonorchard/Scotts Road to remain a leading shopping and leisure destinationSigns of improvement in the tourism sector in H1 2016 and the government’s continued focus on revitalising orchard/Scotts Road (through STB’s Envisioning orchard Road exercise), are expected to help allay the moderation in rents in the area. In particular, well-positioned malls with proven track record and strong centre management are expected to be more resilient.
orchard/Scotts Road is expected to remain as the premier shopping, leisure and entertainment destination. With a total of 7.6 million sq ft of retail space in close to 70 retail developments (of which over 40 are shopping malls), supported by over 12,500 hotel rooms and serviced apartments in the vicinity, orchard/Scotts Road is the most popular shopping and free-access attraction in Singapore. Some 1,392 new hotel rooms and 318 serviced apartments are expected to complete in orchard/Scotts Road from Q2 2016 to 2020. over the same period, some 499 private residential units (e.g. Cairnhill Nine, The Biltmore) are scheduled to complete in the orchard Planning Area. The completion of these new developments will enhance the primary catchment of orchard/Scotts Road.
While occupancy rate in orchard/Scotts Road has been moderating since 2013, Paragon has maintained full occupancy, reflecting its position as one of the top shopping malls in Singapore. Rents in established premier shopping malls, which also enjoy strong centre management, are likely to hold up relatively well, as retailers adopt a flight-to-quality strategy.
2.6 outlookRents anticipated to face downward pressureThe ongoing economic uncertainty in major global economies is expected to further dampen growth and employment prospects. This has affected consumer confidence, which is also expected to remain muted in the short-term. Meanwhile, more retailers are restrategising and evaluating their physical space needs amid the adoption of e-commerce and digital marketing. Alongside landlords being more open to negotiation and focused on tenant retention, retail rents are expected to remain under pressure in the short term.
The Shoppes at Marina Bay Sands in the Marina Bay area is emerging as an alternative destination for luxury shopping, with an attractive
mARKET OvERvIEW
45.0
40.0
35.0
30.0
25.0
20.0
Figure 2.2: average priMe First-storeY Fixed gross rents(S$ per sq ft per month)
Source: Edmund Tie & Co Consulting, August 2016.
38.05
31.70
21.80
37.65
31.40
21.35
37.20
31.10
20.70
20
05
20
06
20
07
20
08
20
09
20
10
20
11
20
12
20
13
20
14
20
15 Q1
20
16 Q2
2
016
orchard/Scotts Road Suburban Areas other City Areas
S P h r e I TA N N u A L R E P o R T 2 0 1 654
2.8 Implications on The Clementi MallRental resilience in the suburban areas, including ClementiSuburban malls have traditionally been more resilient during challenging market conditions compared with other areas, given their strong primary catchments. They are expected to continue to exhibit resilience, especially for those that are well-connected to transport nodes. In particular, rents in Clementi Planning Area, where potential supply is limited, are expected to remain relatively stable.
The Clementi Mall has excellent connectivity, with its co-location with a bus interchange and connection to the Clementi MRT station. It is strategically located at the heart of Clementi Planning Area(20) and enjoys a strong catchment. Apart from serving about 92,000 residents(21) in the Clementi Planning Area and about 173,000 residents in the neighbouring Bukit Timah and Queenstown Planning Areas, The Clementi Mall is supported by more than 60,000 students from tertiary institutions in the area, as well as the working population at Buona Vista.
In the next three years, some 2,348 private residential units (e.g. The Trilinq, Parc Riviera) will be completed in the Clementi Planning Area. The Clementi Mall is well-positioned to cater to this growing catchment, given its variety of offerings and strategic location.
3.0 MEdICaL SUITE PRoPERTY MaRKET
3.1 Healthcare Services Industry Trendsaging population increases local demand for healthcare The number of Singapore residents aged 65 years and older is expected
Notes:(20) Based on the uRA’s planning boundaries.(21) Source: DoS Singapore’s Population Statistics for 2015 (mid-year estimates).(22) Speech by Mr Gan Kim Yong, Minister for Health, at the SG50 Scientific Conference on Ageing, 19 March 2015.(23) VISA and oxford Economics, Mapping the Future of Global Travel and Tourism, January 2016.(24) Based on cross-border spending for medical services in more than 176 countries.(25) Canada, u.K. and Israel were the top three medical tourism destinations.(26) Assesses the attractiveness of a country as a medical tourist destination.(27) Singapore Tourist Spending H1 2016 by Global Blue.
to double from 430,000 in 2016 to more than 900,000 in 2030(22).
In November 2015, MediShield Life, a basic national health insurance plan, was reviewed to provide Singapore residents with more comprehensive hospital insurance coverage, in line with improving accessibility, quality and affordability of healthcare services under the Healthcare 2020 Masterplan. The Pioneer Generation Package introduced in 2014 for Singapore citizens aged 65 and above further provides subsidies for treatment at specialist outpatient clinics. Meanwhile, Medisave, a national medical savings scheme, helps individuals meet medical expenses and pay for medical insurance premiums. Such schemes introduced have made treatment by private doctors more affordable and this is expected to bode well for Paragon Medical.
Singapore is well-established to tap on growth in medical tourism The global medical tourism industry has expanded significantly in recent years, and is estimated to be worth uS$439 (S$615) billion in 2015, according to VISA(23). The industry is projected to grow by an average 25% per annum till 2025, with an estimated 3% to 4% of global population travelling abroad to receive medical services.
While VISA(24) found that the uS had the largest market share in terms of medical tourism spend in 2015, it noted that Singapore, Thailand and Korea are quickly catching up, amid the growth momentum in Asia’s healthcare landscape.
Singapore was ranked 4th globally(25) and 1st in Asia by the International Healthcare Research Center in the Medical Tourism Index™(26) , excelling in
country environment (e.g., safety, image and culture) and facility and services (e.g., quality of care, reputation and patient experience). According to Frost & Sullivan in 2015, the private hospital market in Singapore is forecast to grow at 13% per annum from 2015 to 2020, driven by factors such as urbanisation, increasing private healthcare insurance coverage and growing awareness on health management.
Already renowned for providing medical services to both local and foreign clients, Paragon Medical is at the forefront of growing medical tourism.
Stronger competition from medical destinations in Malaysia and Thailand Latest statistics from STB showed that medical tourism receipts grew by 19% to about S$1.0 billion in 2014, following a 25% decline in 2013. While there are no official statistics on medical tourism in 2015, some 76% (S$756 million) of medical tourism receipts in 2014 was from South East Asia, mainly Indonesia (64%) and Malaysia (7%).
According to Global Blue(27), tourist’s spending on health and social work was about 4% of total spending in H1 2016. Singapore continues to face strong competition from other medical tourism destinations, in terms of affordable medical offerings. For example, the 2016 Medical Tourism Index by the International Health Research Centre ranked India, Malaysia and Thailand more attractively than Singapore, in terms of destination attractiveness and medical tourism costs. These destinations also are gaining ground in terms of their quality of healthcare and medical services.
T H E A R T o FP a r T n e r S h I P 55
Type Units Remarks
Hospital-supported medical suites
1,012 (61%)For lease 132 (13%)
Strata-titled for sale 880 (87%)
Medical suites in standalone developments
647 (39%)For lease 436 (70%)
Strata-titled for sale 211 (30%)
Total 1,659 (100%) –
Source: uRA, Edmund Tie & Co Consulting, August 2016.
table 3.1: Medical suites stock (islandwide)
Road/Tanglin area. This brought total islandwide stock to an estimated 1.7 million sq ft, as at end Q2 2016.
Raffles Medical Group (RMG) opened its new mall at Holland Village, Raffles Holland V, in Q1 2016, which also houses RMG’s integrated medical centre (9,000 sq ft) that offers health screening, family medicine, dental care, traditional Chinese medicine and specialist services.
Q2 2016 saw the completion of SBF Center, an office building at Robinson Road. The development has 48 medical suites, ranging from 678 to 1,302 sq ft, which are strata-titled for sale. As at end August 2016, majority (47 units) of the medical suites have been sold.
Close to 1,700 medical suites islandwideWe estimate that there were 1,659 medical suites in Singapore, as at August 2016. Majority were hospital-
Singapore’s medical industry riding the technology wave Notwithstanding increased competition, Singapore remains a world-class healthcare hub that offers a complete spectrum of medical services. Given its strong links with industry partners and medical research organisations, Singapore has embraced technologies in the medical sector e.g., telemedicine, image-guided and robotic-assisted surgery, as well as healthcare through Internet of Things (IoT). This has helped the city-state to cement its positioning for high-quality and sophisticated medical surgical procedures and services, that are sought after by more affluent target markets.
one of the key growth areas in the medical industry is telemedicine. While there are no industry-dominant plays in the telehealth market in Singapore, the government’s Infocomm Media 2025 Masterplan envisages the wider adoption of telemedicine in the future. Telemedicine is expected to complement existing face-to-face medical consultation, especially for non-critical follow up appointments.
Initial industry findings show that the greater adoption of telemedicine is likely to increase the demand for healthcare services, as patients’ access to medical practitioners improves.
3.2 Existing Supplyno new medical suite completions in the orchard Road/Tanglin areaTwo medical suite developments with total space close to 60,000 sq ft were completed from Q3 2015 to Q2 2016. Both are located outside the orchard
mARKET OvERvIEW
supported medical suites, while the remaining were medical suites in standalone developments (Table 3.1).
of the medical suites in standalone developments, approximately 70% (436 units) are for lease only. Medical suites such as Paragon Medical, Camden Medical Centre and Scotts Medical Center, which are professionally managed by REITs or dedicated property management teams, remain limited, especially in orchard/Scotts Road (Table 3.2). Such developments are generally more popular among medical practitioners and command premium rents.
The orchard Road/Tanglin area is the most established with the largest medical suite clusterDespite the government earmarking Novena (Health City Novena) as a major medical precinct and the emergence of new medical clusters e.g., Farrer Park, the orchard Road/Tanglin area continues to be the most established. It is the largest medical suite cluster in Singapore and the preferred choice for many affluent local and foreign medical clients alike (Table 3.3).
Around half of the stock in the orchard Road/Tanglin area (396 units) are hospital-supported.
S P h r e I TA N N u A L R E P o R T 2 0 1 656
Type Units Remarks
for lease only 259 (35%) –
Strata-titled for sale
482 (65%)–
Total 741 (100%) 45% of medical suite stock in Singapore
Source: uRA, Edmund Tie & Co Consulting, August 2016.
table 3.3: Medical suites stock(orchard road/tanglin area)
Type Units
orchard Road/Tanglin area 741 (45%)
novena/Thomson area 493 (30%)
farrer Park area 189 (11%)
other areas 236 (14%)
Total 1,659 (100%)
Source: uRA, Edmund Tie & Co Consulting, August 2016.
table 3.2: Medical suites stock (bY areas)
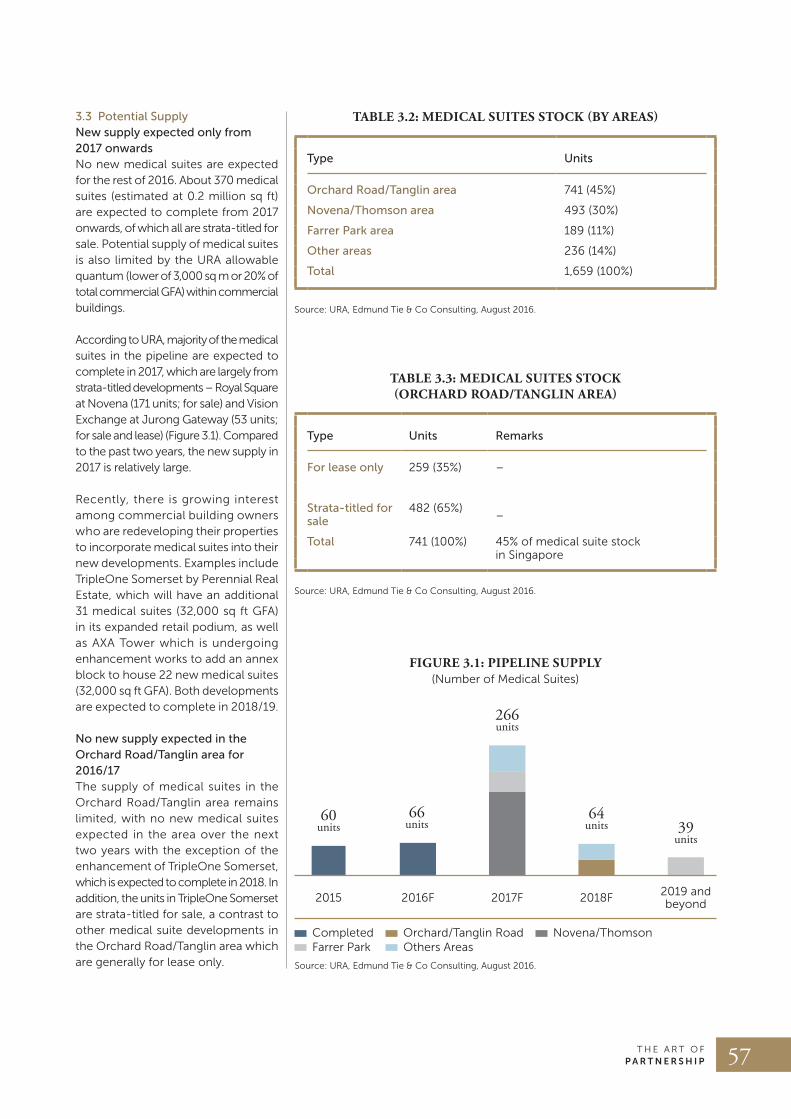
Figure 3.1: pipeline supplY(Number of Medical Suites)
60 units
66 units
64 units 39
units
266 units
Source: uRA, Edmund Tie & Co Consulting, August 2016.
Completed orchard/Tanglin Road Novena/Thomson Farrer Park others Areas
2017F2015 2019 and beyond2018F2016F
3.3 Potential Supplynew supply expected only from 2017 onwardsNo new medical suites are expected for the rest of 2016. About 370 medical suites (estimated at 0.2 million sq ft) are expected to complete from 2017 onwards, of which all are strata-titled for sale. Potential supply of medical suites is also limited by the uRA allowable quantum (lower of 3,000 sq m or 20% of total commercial GFA) within commercial buildings.
According to uRA, majority of the medical suites in the pipeline are expected to complete in 2017, which are largely from strata-titled developments – Royal Square at Novena (171 units; for sale) and Vision Exchange at Jurong Gateway (53 units; for sale and lease) (Figure 3.1). Compared to the past two years, the new supply in 2017 is relatively large.
Recently, there is growing interest among commercial building owners who are redeveloping their properties to incorporate medical suites into their new developments. Examples include Tripleone Somerset by Perennial Real Estate, which will have an additional 31 medical suites (32,000 sq ft GFA) in its expanded retail podium, as well as AXA Tower which is undergoing enhancement works to add an annex block to house 22 new medical suites (32,000 sq ft GFA). Both developments are expected to complete in 2018/19.
no new supply expected in the orchard Road/Tanglin area for 2016/17 The supply of medical suites in the orchard Road/Tanglin area remains limited, with no new medical suites expected in the area over the next two years with the exception of the enhancement of Tripleone Somerset, which is expected to complete in 2018. In addition, the units in Tripleone Somerset are strata-titled for sale, a contrast to other medical suite developments in the orchard Road/Tanglin area which are generally for lease only.
T H E A R T o FP a r T n e r S h I P 57
3.5 RentsRents in the orchard Road/Tanglin area held up relatively well While office and retail rents in orchard Road moderated in 2015 and H1 2016, medical suite rents in the area were resilient. In particular, the asking gross rents of some standalone medical suite developments in 2015 were higher than that in 2014.
The range of asking monthly rents in standalone developments in the orchard Road/Tanglin area was about S$10 - S$15 per sq ft as at August 2016, slightly higher than the S$9 - S$14 per sq ft in August 2015. This is reflection of the continued attractiveness of the orchard Road/Tanglin area as a premier healthcare and medical tourism destination. The location appeals to medical clients as the orchard Road/Tanglin area is convenient with its wide range of amenities.
on the other hand, there was a marked decline (from 6% to almost 30%) in the asking gross rents for areas outside the orchard Road/Tanglin area e.g., Farrer Park and Novena, which are expected to see more new supply in 2017.
3.6 outlookRents may moderate slightly, given the larger supply in 2017The subdued demand for healthcare and medical tourism in Singapore is expected to continue in the short-term, given the weak economic prospects and growing regional competition. Coupled with the significant supply
in 2017, medical suite rents are likely to be under pressure.
Nonetheless, medical suite rents in the orchard Road/Tanglin area are expected to be more resilient. Apart from being a well-sought after location by private medical practitioners, there is no new supply expected in the area over the next two years. As such, we expect rents for medical suites in the orchard Road/Tanglin area to remain relatively stable over the next four quarters.
3.7 Implications on Paragon MedicalParagon Medical a leading medical venue in the orchard Road/Tanglin areaHigher arrival of medical tourists is expected with STB cultivating new collaborations with overseas market intermediaries(29) to promote Singapore as an advanced medical care destination.
Already popular among the local affluent medical clients, Paragon Medical (75 units), being the largest standalone medical centre in the orchard Road/Tanglin area, is well-poised to capitalise on medical tourists, who also form the catchment for Paragon. Paragon Medical has maintained a strong competitive advantage over other medical suites in the area, given its proximity to renowned Mount Elizabeth orchard Hospital and Medical Centre (orchard) and easy access to the wide range of amenities in the vicinity. With supply in the orchard Road/Tanglin area expected to remain relatively tight, well-managed developments like Paragon Medical are well-positioned for future rental growth opportunities.
The pipeline supply outside the orchard Road/Tanglin area is not expected to have an impact on the area. All the medical suites in the pipeline are strata-titled for sale, which are generally smaller. They also lack the strong branding and positioning seen in medical suites in the orchard Road/Tanglin area, which are mostly professionally managed.
3.4 demand and occupancydespite subdued healthcare demand in the short-term, established medical suite clusters are well-positioned and relatively resilientMedical tourists are increasingly discerning and well-informed, with greater access to the different quality and costs of various medical tourism destinations. Growing competition for medical tourism, coupled with the more measured economic growth in Singapore may have a dampening effect on overall healthcare demand. Notwithstanding, the number of private doctors and dentists(28) in Singapore continued to grow at a relatively healthy rate, at 4.4% in 2015, higher than the 2.7% increase in 2014 and in line with the past five-year average (4.7%). This is expected to lend some support to the demand for medical suites.
Based on our primary survey, medical suite developments along orchard/Scotts Road continued to remain well-occupied as at end Q2 2016, especially for well-located (e.g., close to established hospitals) and well-positioned medical suites such as Paragon Medical.
mARKET OvERvIEW
Notes:(28) DoS Yearbook of Statistics 2016. Excludes other health personnel types e.g., oral health therapists, traditional Chinese medicine physicians due to
data unavailability.(29) Market intermediaries include ANZ Bank, Hong Leong Bank, Standard Chartered Bank, Myanmar Women Entrepreneurs Association, Cebu Pacific,
Jetstar Airways, Tiger Airways, Nikon (Korea) and Thomas Cook (uK).
S P h r e I TA N N u A L R E P o R T 2 0 1 658
Limiting Conditions
Where it is stated in the report that information has been supplied to us in the preparation of this report by the sources listed, this information is believed to be reliable and we will accept no responsibility if this should be otherwise. All other information stated without being attributed directly to another party is obtained from our searches of records, examination of documents or enquiries with relevant government authorities.
The forward statements in this report are based on our expectations and forecasts for the future. These statements should be regarded as our assessment of the
future, based on certain assumptions on variables which are subject to changing conditions. Changes in any of these variables may significantly affect our forecasts.
utmost care and due diligence has been taken in the preparation of this report. We believe that the contents are accurate and our professional opinion and advice are based on prevailing market conditions as at the date of the report. As market conditions do change, we reserve the right to update our opinion and forecasts based on the latest market conditions.
Edmund Tie & Company (SEA) Pte Ltd gives no assurance that the forecasts
and forward statements in this report will be achieved and undue reliance should not be placed on them.
Edmund Tie & Company (SEA) Pte Ltd or persons involved in the preparation of this report disclaims all responsibility and will accept no liability to any other party. Neither the whole nor any part, nor reference thereto may be published in any document, statement or circular, nor in any communications with third parties, without our prior written consent of the form or context in which it will appear.
by edmund Tie & company (Sea) Pte Ltd September 2016