82
0 Investor Day November 6, 2013

0
Investor Day November 6, 2013

1
Forward-Looking Statements The following information contains forward-looking statements within the meaning of the Private Securities Litigation Reform Act of
1995, including statements about the Company’s plans, strategies and prospects as well as future volume and earnings trends and
expectations. These forward-looking statements are based on management’s current expectations and beliefs, as well as a number of
assumptions concerning future events. These forward-looking statements are subject to risks, uncertainties, assumptions and other
important factors. You are cautioned not to put undue reliance on such forward-looking statements because actual results may vary
materially from those expressed or implied. The reports filed by the Company pursuant to United States securities laws contain
discussions of these risks and uncertainties, which include, but are not limited to, competition from other weight management industry
participants or the development of more effective or more favorably perceived weight management methods; the Company’s ability to
continue to develop innovative new services and products and enhance its existing services and products, or the failure of its services
and products to continue to appeal to the market; the effectiveness of the Company’s marketing and advertising programs; the impact
on the Weight Watchers brand of actions taken by the Company’s franchisees, licensees and suppliers; risks and uncertainties
associated with the Company’s international operations, including economic, political and social risks and foreign currency risks; the
Company’s ability to successfully make acquisitions or enter into joint ventures, including its ability to successfully integrate, operate or
realize the projected benefits of such businesses; uncertainties related to a downturn in general economic conditions or consumer
confidence; the seasonal nature of the Company’s business; the impact of events that discourage or impede people from gathering
with others or accessing resources; the Company’s ability to enforce its intellectual property rights both domestically and internationally,
as well as the impact of its involvement in any claims related to intellectual property rights; uncertainties regarding the satisfactory
operation of the Company’s information technology or systems; the impact of security breaches or privacy concerns; the impact of
disputes with the Company’s franchise operators; the impact of existing and future laws and regulations; the impact of the Company’s
debt service obligations and restrictive debt covenants; the possibility that the interests of the Company’s majority owner will conflict
with other holders of its common stock; and other risks and uncertainties, including those detailed from time to time in the Company’s
periodic reports filed with the Securities and Exchange Commission. The Company assumes no obligation to, and expressly disclaims
any obligation to, update or revise any forward-looking statements, whether as a result of new information, future events or otherwise,
except as required by law.
Non-GAAP Financial Statements In this presentation, we may refer to some non-GAAP financial measures, including, among others, EBITDAS. Please see Appendix
for reconciliation to appropriate GAAP financial measures.

2
Objectives (Agenda)
• Share our situation assessment
• Outline our strategic agenda
Pillar 1: Drive immediate performance improvements
Pillar 2: Re-imagine the core offering
Pillar 3: Grow the healthcare business
Pillar 4: Strengthen the organization
• Discuss financial aspirations and business model

3
Business Overview
• Who we serve
Globally, 3.5M+ active members
Age skews 50+; household income slightly higher than average; ethnically under-developed
• Who we are
Global leader in commercial weight management
50 years of history
Revenue by geography: 63% US / 37% international
Presence in 23 countries
• What we offer
Meetings
• Multi-modal behavior modification with service providers playing key role
• $42.95 per month (Monthly Pass in the US)
• 70% of revenue
Weight Watchers Online
• Pure self-help delivered digitally
• $18.95 per month (in the US)
• 30% of revenue
Source: Internal satisfaction studies
4
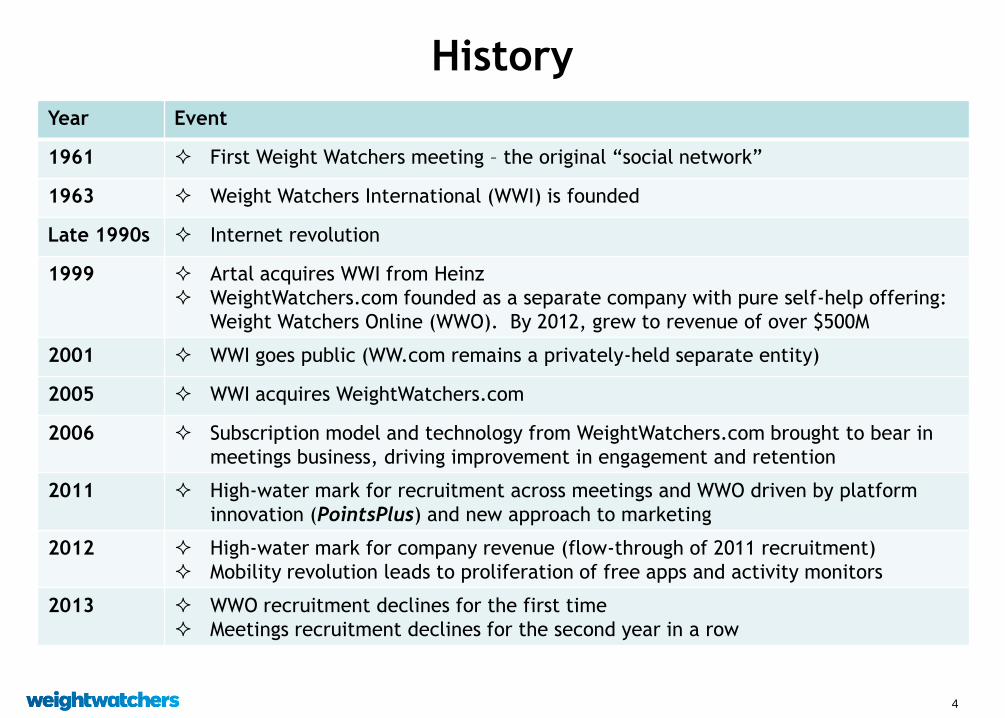
History
Year Event
1961 First Weight Watchers meeting – the original “social network”
1963 Weight Watchers International (WWI) is founded
Late 1990s Internet revolution
1999 Artal acquires WWI from Heinz
WeightWatchers.com founded as a separate company with pure self-help offering:
Weight Watchers Online (WWO). By 2012, grew to revenue of over $500M
2001 WWI goes public (WW.com remains a privately-held separate entity)
2005 WWI acquires WeightWatchers.com
2006 Subscription model and technology from WeightWatchers.com brought to bear in
meetings business, driving improvement in engagement and retention
2011 High-water mark for recruitment across meetings and WWO driven by platform
innovation (PointsPlus) and new approach to marketing
2012 High-water mark for company revenue (flow-through of 2011 recruitment)
Mobility revolution leads to proliferation of free apps and activity monitors
2013 WWO recruitment declines for the first time
Meetings recruitment declines for the second year in a row
5
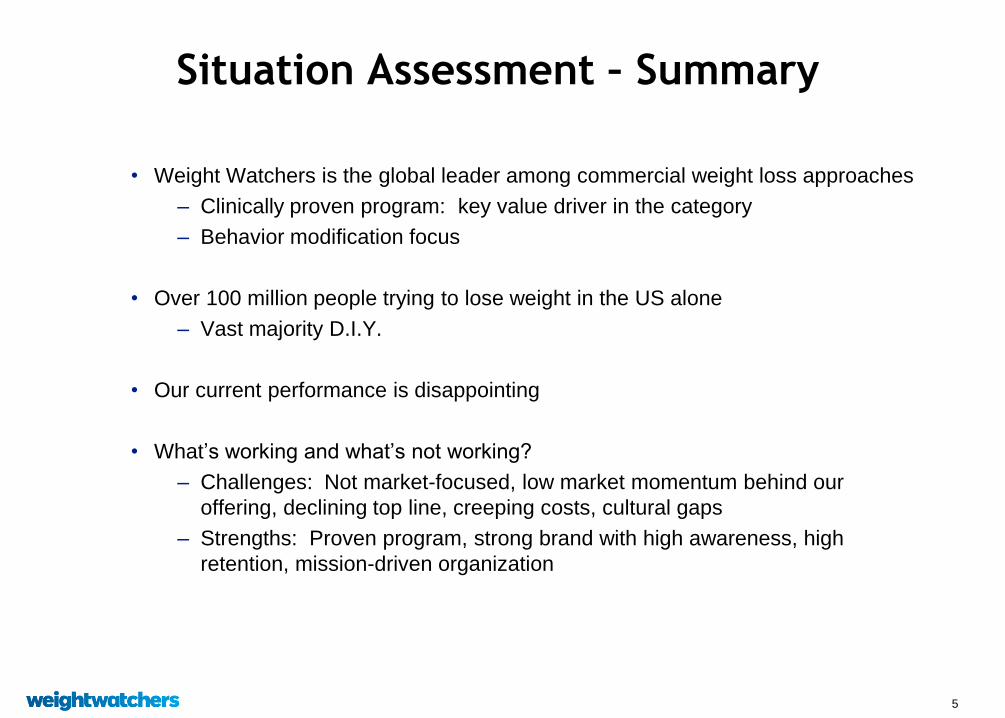
Situation Assessment – Summary
• Weight Watchers is the global leader among commercial weight loss approaches
– Clinically proven program: key value driver in the category
– Behavior modification focus
• Over 100 million people trying to lose weight in the US alone
– Vast majority D.I.Y.
• Our current performance is disappointing
• What’s working and what’s not working?
– Challenges: Not market-focused, low market momentum behind our
offering, declining top line, creeping costs, cultural gaps
– Strengths: Proven program, strong brand with high awareness, high
retention, mission-driven organization

6
Large and growing market $60B+ spent on weight-related products and services in the US alone
US Market Size, 2008 through 2013E
Market Size
($B)
Source: MarketData Enterprises, “The U.S. Weight Loss & Diet Control Market” (12th Edition, March 2013).
Note: Includes diet beverages, artificial sweeteners, health clubs, commercial weight loss approaches, OTC and prescription
drugs, diet foods and meal replacements, surgery, books and videos.
56.5
58.0 58.4
60.6 61.6
63.6
52.0
54.0
56.0
58.0
60.0
62.0
64.0
66.0
2008 2009 2010 2011 2012 2013E

Traditional View of Commercial Weight
Management Market
Dieting (alone or combined with exercise)
Exercise alone
Apps
44%
13% 87%
12%
Own Plan
71%
Book/Mag Plan
4%
Pills
2%
Commercial Plans
5%
Other
7%
Total US adults trying to lose weight (August 2013)
7 Source: Internal research

8
Support-seeking 22%
Shortcutters11%
Empowered 15%
Complacent18%
Depleted 18%
Systematic 17%
Broader market opportunity revealed with attitudinal
segmentation: 68% of US women in primary target segments
• Seeking structured, proven
plans
• Focus on long-term goals
• Expects tools/accountability for
healthy disciplined approach
• Often burdened by multiple
health conditions
• Requires more active
intervention often healthcare
professional
• Privacy critical
• Seeking clear
direction/frequent touch
points
• Many have also gotten
professional support
• Has tried multiple weight
loss plans
• Time-pressed
• Seeking short-term, quick
fix
Source: Internal research; women who want to lose 11+ pounds
9
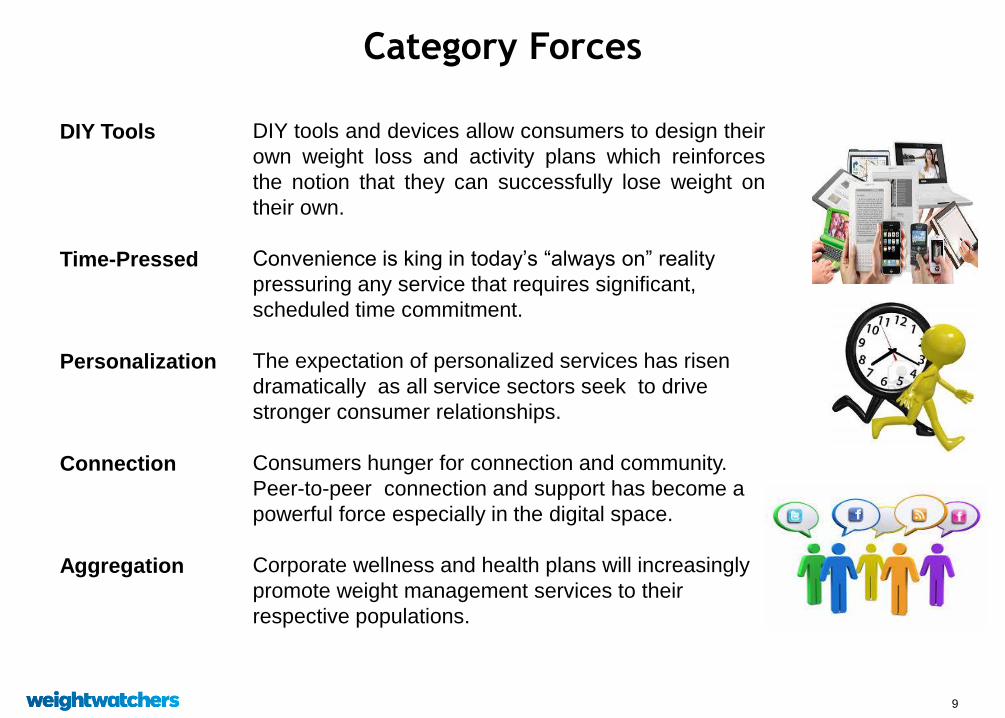
Category Forces
DIY Tools
Time-Pressed
Personalization
Connection
Aggregation
DIY tools and devices allow consumers to design their
own weight loss and activity plans which reinforces
the notion that they can successfully lose weight on
their own.
Convenience is king in today’s “always on” reality
pressuring any service that requires significant,
scheduled time commitment.
The expectation of personalized services has risen
dramatically as all service sectors seek to drive
stronger consumer relationships.
Consumers hunger for connection and community.
Peer-to-peer connection and support has become a
powerful force especially in the digital space.
Corporate wellness and health plans will increasingly
promote weight management services to their
respective populations.

10
Science: What drives weight loss
• Tracking of intake, activity and weight
• Engagement
Attendance at group support sessions
Use of digital tools
• Weight loss in the first month
• Higher initial weight

11
Unpacking 2013 revenue performance Flow-through of worsening WWO recruitment trend to negative double digits
results in paid weeks decline vs. prior in Q3
2013 vs. 2012 (%)
Q1 Q2 Q3
Weight Watchers Online (Global)
Paid Weeks 10% 4% -3%
Revenue 11% 7% 1%
Weakening WWO paid weeks drives weakening
revenue: expectation of mid-single-digit revenue
decline in Q4

12
Key revenue driver: paid weeks In 2013, meetings paid weeks continue to decline, while WWO paid
weeks turned negative for the first time in Q3
Global Paid Weeks by Year, 2007 through 2013E (M)
0
20
40
60
80
100
120
2007 2008 2009 2010 2011 2012 2013
Meetings
WWO
E*
*Based on expectations that meetings paid weeks down low double digits and WWO paid weeks down mid-single digits in Q4 2013 vs. the prior year period.

13
Marketing: 2013 spend levels roughly right
• This category is very responsive to marketing
• Uneven investment levels over the last few years driven by
strategic shifts
• Latest internal analysis suggests that 2013 spend levels are
about right and provide key learnings related to mix
• We will continue to evaluate
Source: Internal tracking study Q3 2013
14
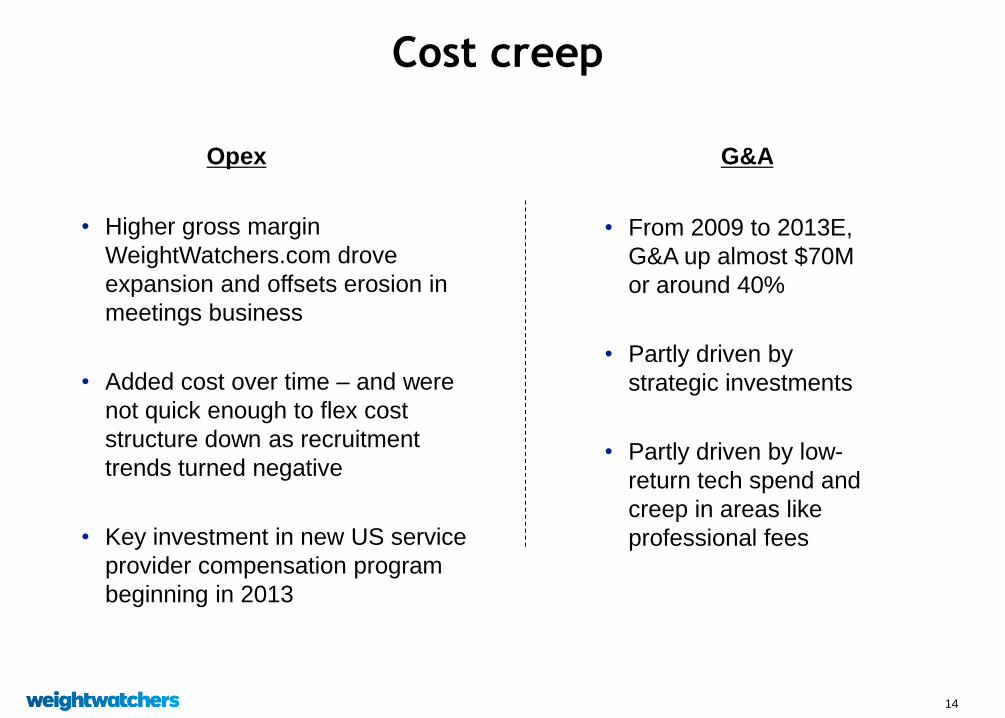
Cost creep
• Higher gross margin
WeightWatchers.com drove
expansion and offsets erosion in
meetings business
• Added cost over time – and were
not quick enough to flex cost
structure down as recruitment
trends turned negative
• Key investment in new US service
provider compensation program
beginning in 2013
• From 2009 to 2013E,
G&A up almost $70M
or around 40%
• Partly driven by
strategic investments
• Partly driven by low-
return tech spend and
creep in areas like
professional fees
Opex G&A

15
Profit reflects revenue volatility and cost creep Operating Income, 2008 through 2012
Operating
Income
($M’s)
444
395 388
546
496
-
100
200
300
400
500
600
2008 2009 2010 2011 2012 2013E*
*Based on expectation of full year 2013 EPS of $3.85-$3.95.
Notes:
See Appendix for a reconciliation of non-GAAP financial measures to the most comparable GAAP measures.
-2008 Operating Income excludes negative impact of UK VAT ruling of $18.7M related to prior years.
-2009 Operating Income excludes impact of UK Self-employment ruling of $32.5M (pretax) related to prior years and also excludes restructuring charges of $5.5M .
-2010 Operating Income excludes the benefit of a $2.0M increase in revenues for the reversal of an over-accrual related to the UK VAT ruling .
-2012 Operating Income excludes the benefit of a $14.5 million over-accrual reversal associated with the UK Self-employment ruling.
~460

16
• Our online offer is under pressure
Missed mobility revolution
Over-estimated technology-based competitive insulation
Lower level of support
Low level of differentiation / declining value proposition
• Low level of innovation on meetings business
Added digital tools, but…
Low level of personalization
• Strong brand, but seen as judgmental, tied to perfection
• Complexity… “like a maze”
• Under-leveraged community
Key challenges flow from the bifurcation of our
offerings and our organization

17
• Clear global market leader in commercial weight loss
Scale
Scope
Profitability
• Powerful brand
High awareness
Trust
Efficacy
• Proven program
Scientifically supported
Multi-modal… in person, online, mobile
Leaders
• Large multi-tiered community
Active members
Lapsed
Favorables
Strengths to build on

18
1. Drive immediate performance improvement
2. Re-imagine the core offering
3. Grow the healthcare business
4. Strengthen the organization
The Four Strategic Pillars
19
Objectives (Agenda)
• Share our situation assessment
• Outline our strategic agenda
Pillar 1: Drive immediate performance improvement
Pillar 2: Re-imagine the core offering
Pillar 3: Grow the healthcare business
Pillar 4: Strengthen the organization
• Discuss financial aspirations and business model

20
Driving immediate performance improvement Cost, also part of Pillar 1, will be discussed later in presentation
Initiative Description
Product
Enhancements
Increase differentiation of the Online product

21
Driving immediate performance improvement Cost, also part of Pillar 1, will be discussed later in presentation
Initiative Description
Product
Enhancements
Increase differentiation of the online product
January
Enrollment
Insight-driven program news:
• Created specifically to resonate with the January consumer
mindset
• Anxious, overwhelmed, fear of failing
• New beginning as the point of inspiration
• Innovative on-ramp to the Weight Watchers experience

22
Driving immediate performance improvement Cost, also part of Pillar 1, will be discussed later in presentation
Initiative Description
Product
Enhancements
Increase differentiation of the online product
January
Enrollment
Insight-driven program news:
• Created specifically to resonate with the January consumer
mindset
• Anxious, overwhelmed, fear of failing
• New beginning as the point of inspiration
• Innovative on-ramp to the Weight Watchers experience
First Four
Weeks
Driving engagement by focusing on early tenures - insights:
• Our leaders are more comfortable providing support to
members several months into their journeys, while…
• …our members want more help early on than we give them
• At the end of the first month, the propensity of a meeting
enrollment attending in any given week is in the mid 60’s. At
the end of the second month, it is in the mid 40’s.

23
Driving immediate performance improvement Cost, also part of Pillar 1, will be discussed later in presentation
Initiative Description
Product
Enhancements
Increase differentiation of the online product
January
Enrollment
Insight-driven program news:
• Created specifically to resonate with the January consumer
mindset
• Anxious, overwhelmed, fear of failing
• New beginning as the point of inspiration
• Innovative on-ramp to the Weight Watchers experience
First Four
Weeks
Driving engagement by focusing on early tenures - insights:
• Our leaders are more comfortable providing support to
members several months into their journeys, while…
• …our members want more help early on than we give them
• At the end of the first month, the propensity of a meeting
enrollment attending in any given week is in the mid 60’s. At
the end of the second month, it is in the mid 40’s.
Consumer
Activation
Compelling advertising – strong investment, optimized mix
Leverage large community for brand advocacy to drive recruitment
24
Objectives (Agenda)
• Share our situation assessment
• Outline our strategic agenda
Pillar 1: Drive immediate performance improvement
Pillar 2: Re-imagine the core offering
Pillar 3: Grow the healthcare business
Pillar 4: Strengthen the organization
• Discuss financial aspirations and business model

25
Re-imagine the core offering
• Create a new portfolio of consumer offerings
• Break free from divide between online and meetings
• Leverage a deeper understanding of consumer needs…
• What drives value in the category
• Solve for the consumer’s weight management needs on the
consumer’s terms
• Build a leading-edge test-and-learn model
• Better read, faster entry
• Evolve brand positioning in concert with offering
26
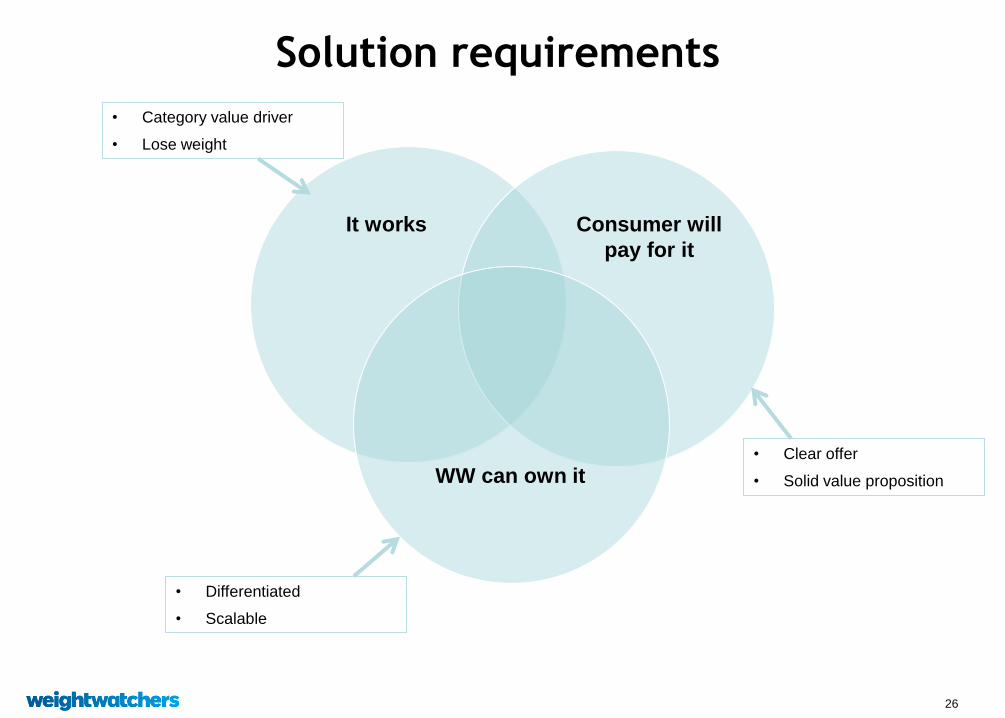
Solution requirements
It works Consumer will
pay for it
WW can own it
• Category value driver
• Lose weight
• Differentiated
• Scalable
• Clear offer
• Solid value proposition
27
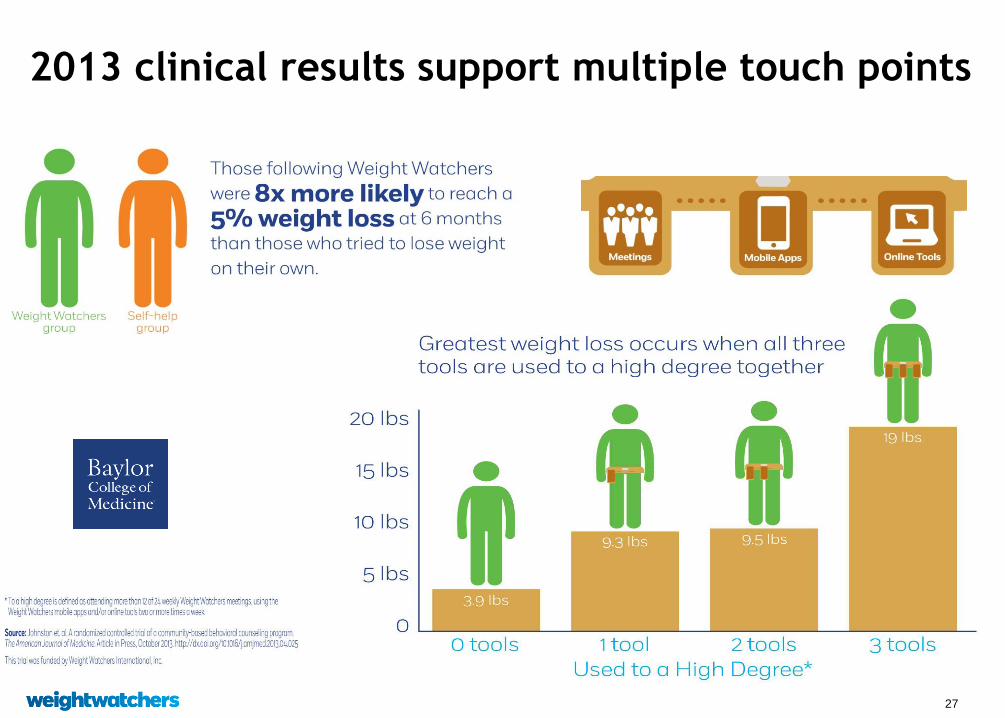
2013 clinical results support multiple touch points

28
Insights drive exploration
Example insight Exploration
• Consumers actively seeking less judgmental support
for their journey
• Support
• Popularity of D-I-Y is evidence that consumers seek a
program that ‘fits my goals & preferences’ • Personalization
• Time scarcity demands a more flexible experience
that allows users to follow WW on their terms
• On demand
• Gameful engagement is a powerful currency for
creating stickier experiences
• Immersion
• Weight-conscious consumers have varied goals
• Success
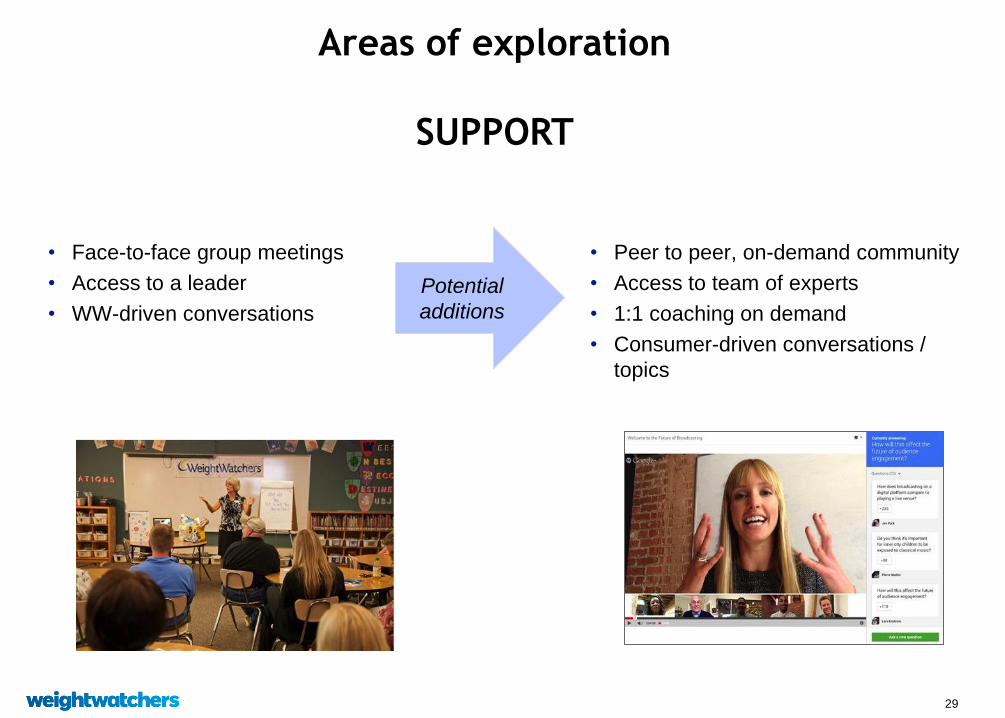
29
• Face-to-face group meetings
• Access to a leader
• WW-driven conversations
Areas of exploration
SUPPORT
• Peer to peer, on-demand community
• Access to team of experts
• 1:1 coaching on demand
• Consumer-driven conversations /
topics
Potential
additions
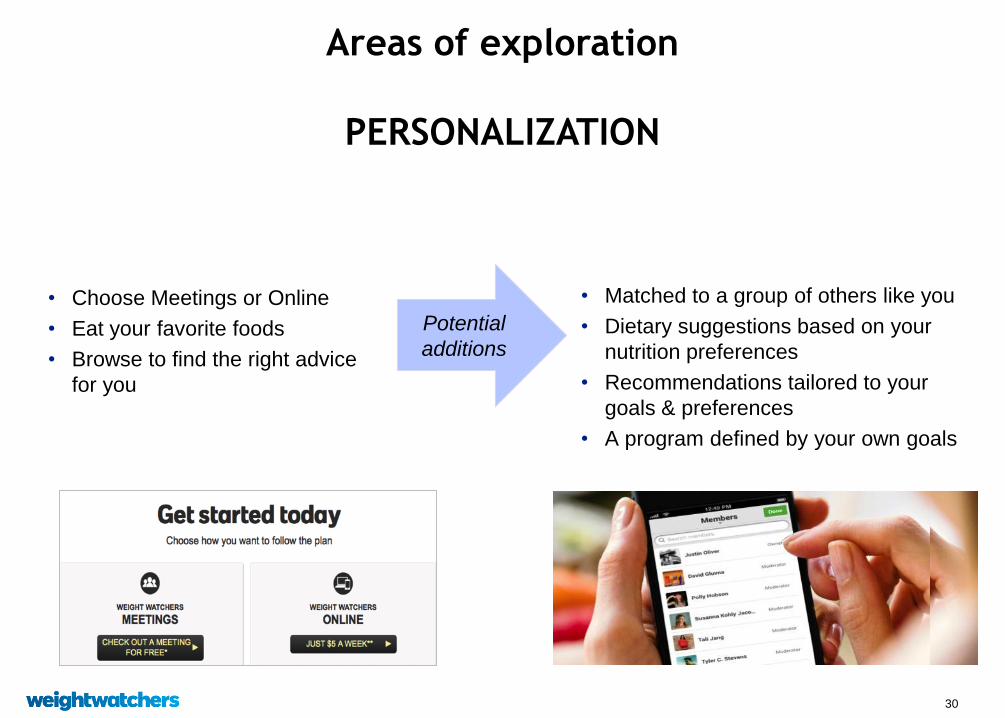
30
• Choose Meetings or Online
• Eat your favorite foods
• Browse to find the right advice
for you
Areas of exploration
PERSONALIZATION
• Matched to a group of others like you
• Dietary suggestions based on your
nutrition preferences
• Recommendations tailored to your
goals & preferences
• A program defined by your own goals
Potential
additions
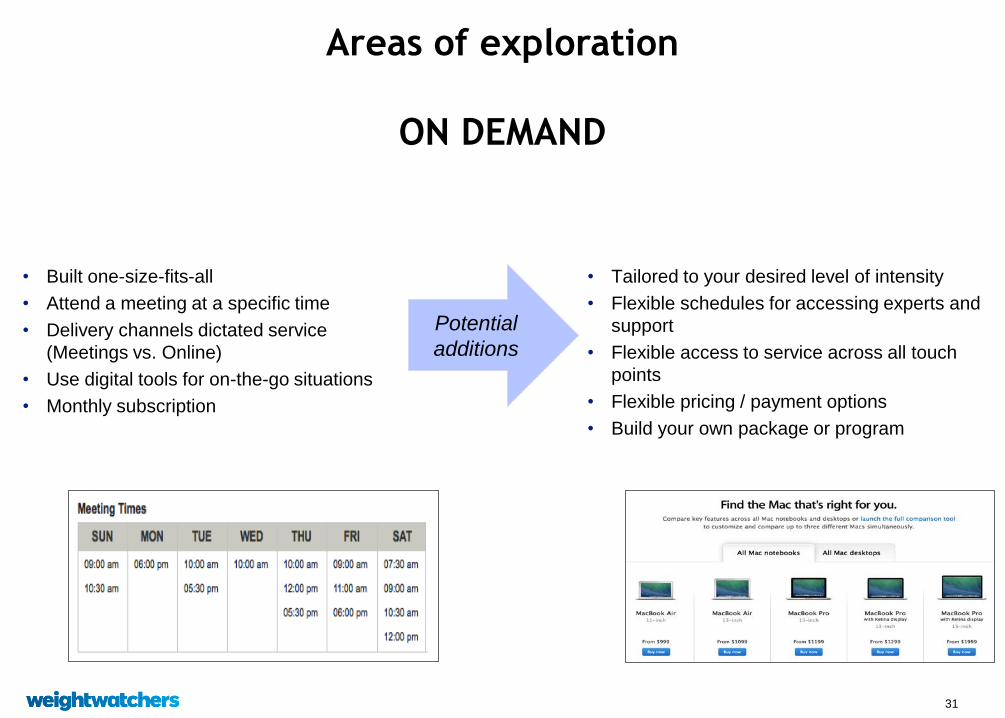
31
• Built one-size-fits-all
• Attend a meeting at a specific time
• Delivery channels dictated service
(Meetings vs. Online)
• Use digital tools for on-the-go situations
• Monthly subscription
Areas of exploration
ON DEMAND
• Tailored to your desired level of intensity
• Flexible schedules for accessing experts and
support
• Flexible access to service across all touch
points
• Flexible pricing / payment options
• Build your own package or program
Potential
additions

32
• Tracking tokens
• New topics each week
• Weight goal milestones
• Community and access to a leader
• Closed WW platform
Areas of exploration
IMMERSION
• Compelling incentives and rewards
• Crowd-sourced topics / format
• Game-like experiences
• Social / Community Challenges
• Relevant 3rd party partnerships
Potential
additions
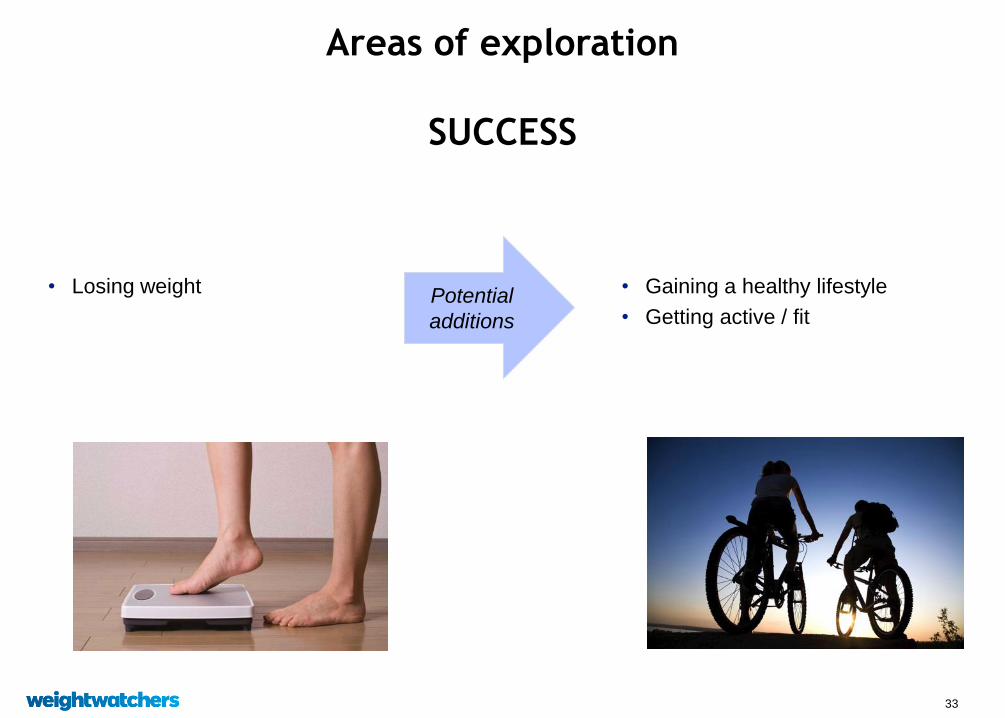
33
• Losing weight
Areas of exploration
SUCCESS
• Gaining a healthy lifestyle
• Getting active / fit
Potential
additions
34
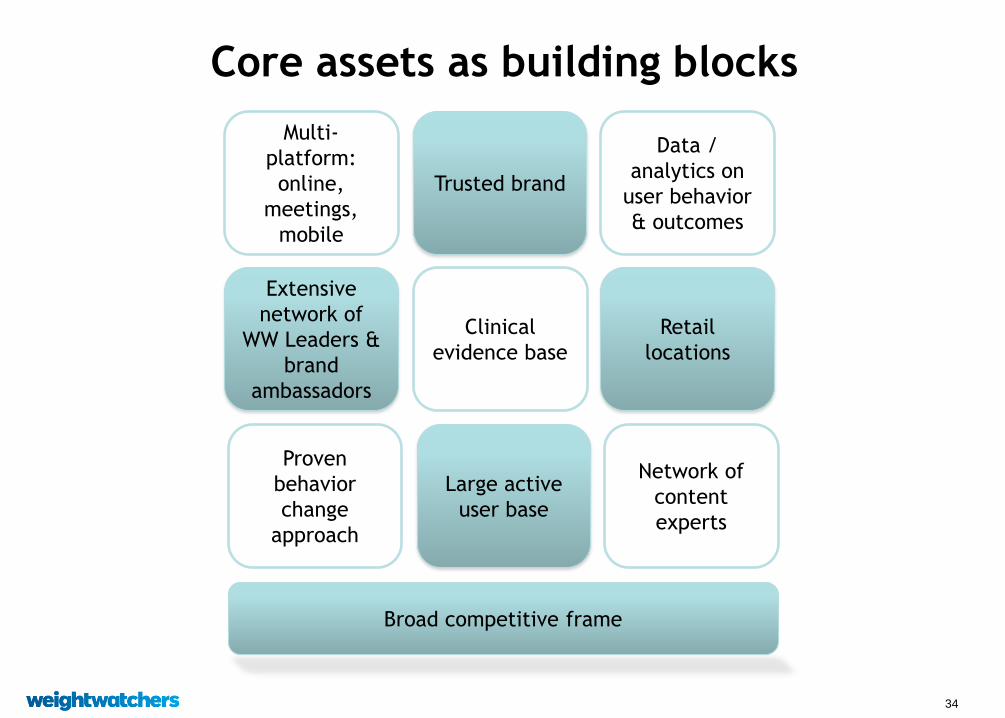
Core assets as building blocks
Extensive
network of
WW Leaders &
brand
ambassadors
Clinical
evidence base
Retail
locations
Multi-
platform:
online,
meetings,
mobile
Trusted brand
Data /
analytics on
user behavior
& outcomes
Proven
behavior
change
approach
Large active
user base
Network of
content
experts
Broad competitive frame

35
Consumer validation engine
Ideas / Insights
Concept optimization
Product Development
CONCEPT
1
CONCEPT
2
• Shortens cycle time
• Improves validity
• Leverages richness of asset base and community
• Integrated with product development

36
Building discipline and filling the pipeline
Timing
• Definition
• Ability to implement
Ideas / Insights
Concept optimization
Product Development
CONCEPT
1
CONCEPT
2

37
Evolve the brand positioning in concert with
offering
Current
Strengths Inclusiveness
“Support”
38
Objectives (Agenda)
• Share our situation assessment
• Outline our strategic agenda
Pillar 1: Drive immediate performance improvement
Pillar 2: Re-imagine the core offering
Pillar 3: Grow the healthcare business
Pillar 4: Strengthen the organization
• Discuss financial aspirations and business model

39
Weight Watchers Health Solutions Agenda
I. Overview
II. The B2B/Healthcare Market – Recent Trends
III. Sizing the Opportunity
IV. Our Strategy to Compete
V. Requirements to Compete

40
Weight Watchers Health Solutions Overview / Investment Thesis
• Clear market opportunity
Obesity drives significant cost for employers, health plans, providers and employees
• Growing emphasis on prevention driven by regulatory changes and focus on corporate
wellness
Mitigate exploding cost of chronic disease treatment
• WWHS is well-positioned to serve this market based on our assets
Strong Science and clinical proof, face-to-face, brand, market presence
Existing foothold in 200+ blue chip clients
$75M business today, split between small and large employers
• Identified what has been missing – in the process of putting those capabilities in place
HIPAA, Systems, Data capture, Dedicated team with healthcare experience
• Financially: significant, incremental and profitable (margins similar to traditional B2C)
• Option value beyond ‘base’ opportunity

41
We are mapping our plan against the US
healthcare ecosystem
Payor
Intermediary
Provider
Patient /
Consumer
Employers Government
Health
Plans
Benefit
Consultants TPAs PBMs
Health Systems
Physician
Networks
(PPOs)
Wellness
Vendors
Consumers
Consumers
Where we play today
Consumers

42
Obesity is the largest preventable condition
driving healthcare systems costs (US)
Excess weight drives 10% of healthcare costs (Harvard)
Obesity raises annual medical costs by $2,741/adult (Jnl Health Economics)
http://www.hsph.harvard.edu/obesity-prevention-source/obesity-consequences/economic/
Finkelstein EA, Trogdon JG, Cohen JW, Dietz W. Annual medical spending attributable to obesity:
Medical Care Costs of Obesity – Cawley, Jnl Health Economics 2012
payer- and service-specific estimates. Health Aff (Millwood). 2009;28(5):w822–w831.
http://www.teachade.com/resources/support/5035b250c0cd6.pdf
Increased cost to private insurers
$443 per
inpatient
stay
$398 per
outpatient
stay $284
in
prescription
benefits
$160B cost to payers
$140B cost to
individuals
$130B cost to
employers
$20B other
80% of diabetes cases
attributable to obesity
Heart disease is the
cause of death in 68%
of adults with
diabetes; stroke,16%
Diabetes accounts for 45%
of kidney disease
cases
70% of hypertension cases are attributable to
obesity
79M Americans suffer
from pre-Diabetes for
which the CDC recommended
treatment is intensive
behavioral therapy for obesity

43
Healthcare reform has dramatically
increased focus on prevention services
Access and
Reimbursement of
Counseling for
Obesity and Obesity-
Related conditions
will increase over the
next several years
ACA - required essential health benefits include all
USPSTF A and B-rated preventive care - Obesity
Allows Health Plans to use “reasonable management techniques”
to determine coverage and institute alternative IBT approaches
Weight Watchers has been clinically proven to meet the
Intensive Behavioral Therapy requirements and is the only
program available on a national basis
Change in orientation toward consumerism
Increase in demand for consumer choice and creating relationships with
members as consumers
Benefit design shift toward consumer accountability
is further encouraged in health care reform
Incentive designs and variable premiums to encourage personal
responsibility for health and wellness
44
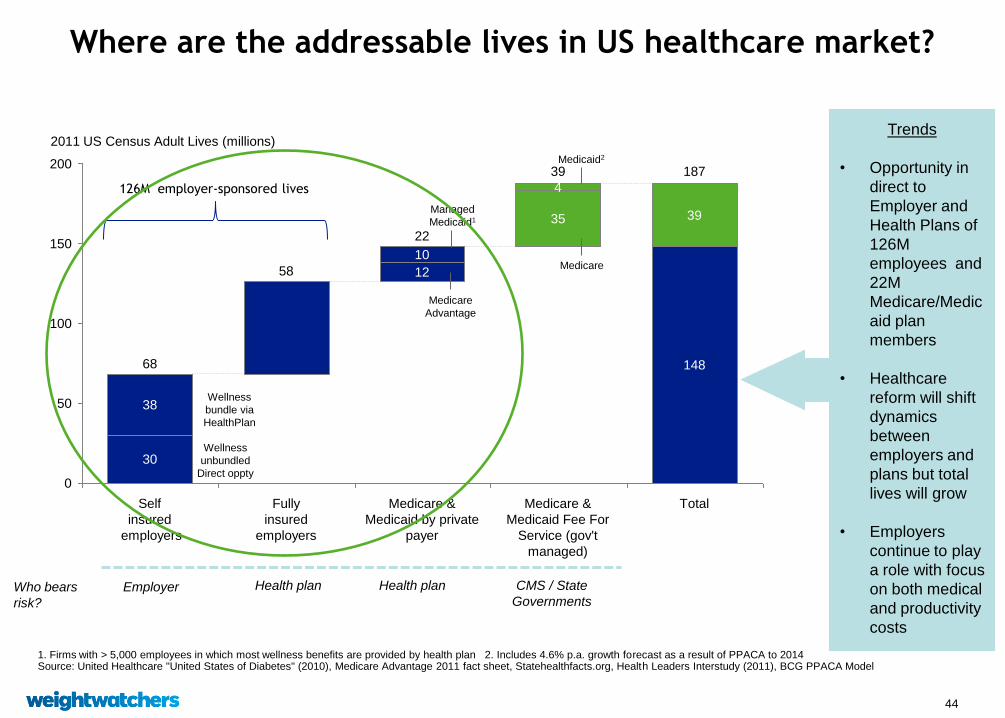
Where are the addressable lives in US healthcare market?
Trends
• Opportunity in
direct to
Employer and
Health Plans of
126M
employees and
22M
Medicare/Medic
aid plan
members
• Healthcare
reform will shift
dynamics
between
employers and
plans but total
lives will grow
• Employers
continue to play
a role with focus
on both medical
and productivity
costs
2011 US Census Adult Lives (millions)
200
150
100
50
0
Total
187
148
39
Medicare &
Medicaid Fee For
Service (gov't
managed)
39
12
10
Fully
insured
employers
58
Self
insured
employers
68
30
38
35
22
Medicare &
Medicaid by private
payer
4 126M employer-sponsored lives
Wellness
bundle via
HealthPlan
Wellness
unbundled
Direct oppty
Medicare
Advantage
Managed
Medicaid1
Medicare
Medicaid2
1. Firms with > 5,000 employees in which most wellness benefits are provided by health plan 2. Includes 4.6% p.a. growth forecast as a result of PPACA to 2014 Source: United Healthcare "United States of Diabetes" (2010), Medicare Advantage 2011 fact sheet, Statehealthfacts.org, Health Leaders Interstudy (2011), BCG PPACA Model
Who bears
risk?
Employer Health plan Health plan CMS / State
Governments

45
How our Weight Watchers Health Solutions Model Works
Today + Tomorrow
• Product/Service Scope
• Client Customization
• Client Subsidy/
Reimbursement
• Pricing
Employer Direct Sales
Health Plan
Benefit Consultant Via Intermediary Client Sales Call
Client – Sell-in
Member - Pull-through
• Enrollment
• Subsidy/
Reimbursement level
• Employee Co-Pay
• Engagement
Employee direct marketing
Health Plan Wellness Via Other Direct to member
WWHS
Sales Team
WWHS
Marketing/Acct Mgmt
Team
46
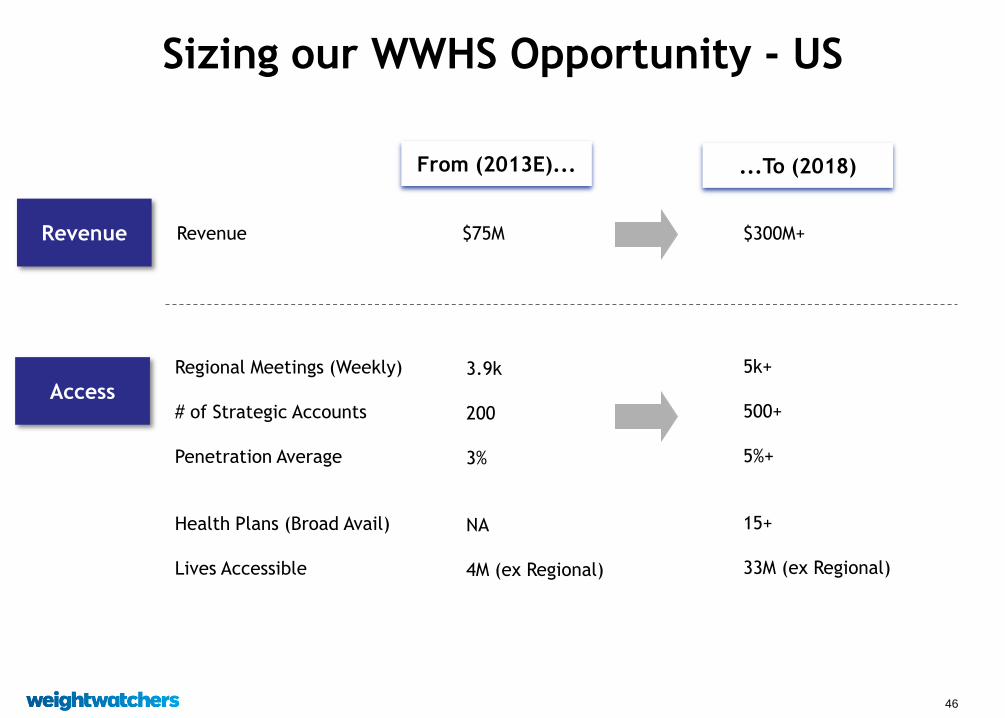
Sizing our WWHS Opportunity - US
From (2013E)... ...To (2018)
Access
Regional Meetings (Weekly)
# of Strategic Accounts
Penetration Average
Health Plans (Broad Avail)
Lives Accessible
Revenue Revenue $75M
3.9k
200
3%
NA
4M (ex Regional)
5k+
500+
5%+
15+
33M (ex Regional)
$300M+

47
US Market Opportunity Market share based approach
Obesity and Weight
Management
Potential Weight
Watchers Share
Accessible Market
Share
Revenue
Total Preventive
Health & Wellness
Market Size
(1) Analysis of preventive health and wellness services market and segments (KFF 2013, US census 2012,Towers Watson 2012, Willis Survey 2011). Employer
incentives for wellness related behavior change have doubled to $561M since 2009 (Fidelity Investments and NBGH Report 2013)
(2) Analysis of obesity and weight management services market. 30-60% of employers offer weight management programs (KFF 2013, Towers Watson 2012,
SHRM 2012).
$6 – 10 Billion
20 - 25%
$300 – 500 Million
• Large and growing size of
Preventive Health and Wellness
market (1)
• Obesity and weight
management programs are
growing focus of preventive
health (2)
• Market leaders in other
healthcare services have
achieved 20% - 30% share
$1.2 – 2 Billion
48
✔
✔
✔
✔
✔
✔
✔
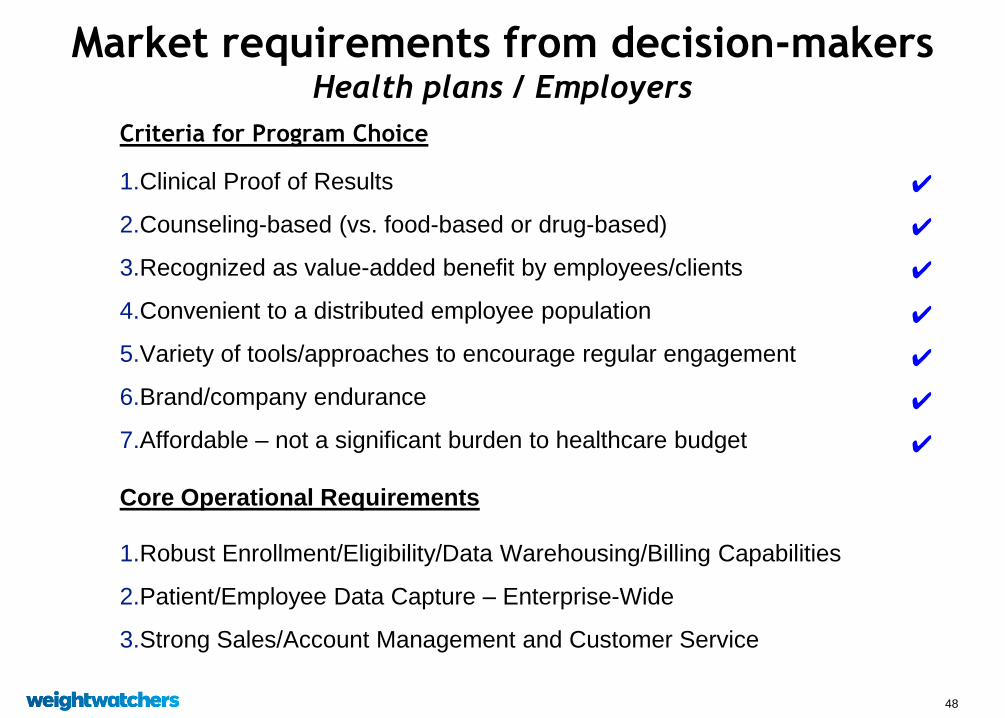
Market requirements from decision-makers Health plans / Employers
Criteria for Program Choice
1.Clinical Proof of Results
2.Counseling-based (vs. food-based or drug-based)
3.Recognized as value-added benefit by employees/clients
4.Convenient to a distributed employee population
5.Variety of tools/approaches to encourage regular engagement
6.Brand/company endurance
7.Affordable – not a significant burden to healthcare budget
Core Operational Requirements
1.Robust Enrollment/Eligibility/Data Warehousing/Billing Capabilities
2.Patient/Employee Data Capture – Enterprise-Wide
3.Strong Sales/Account Management and Customer Service

49
Survey of Corporate Wellness Decision Makers
WEIGHT WATCHERS SURVEY AMONG CORPORATE HR & BENEFITS DECISION MAKERS Q32. If you could only offer one of these programs at your place of work, which one would it be? *Not asked if not aware of any of the programs listed Q33. Why this program? (open end – not coded)
Preference Among Workplace Obesity Programs
58% NET
7% NET
2% NET
5% NET
Open Ended Response - Why Weight Watchers?
• Popular among employees
• Teaches lifestyle change
• Best reputation and gimmick-free
• Employees want it
• I think it is more practical and easy to follow
• It works and is cost-effective
• The support system is better and more user-friendly
50
✔
✔
✔
✔
✔
✔
✔
✖
✖
✖
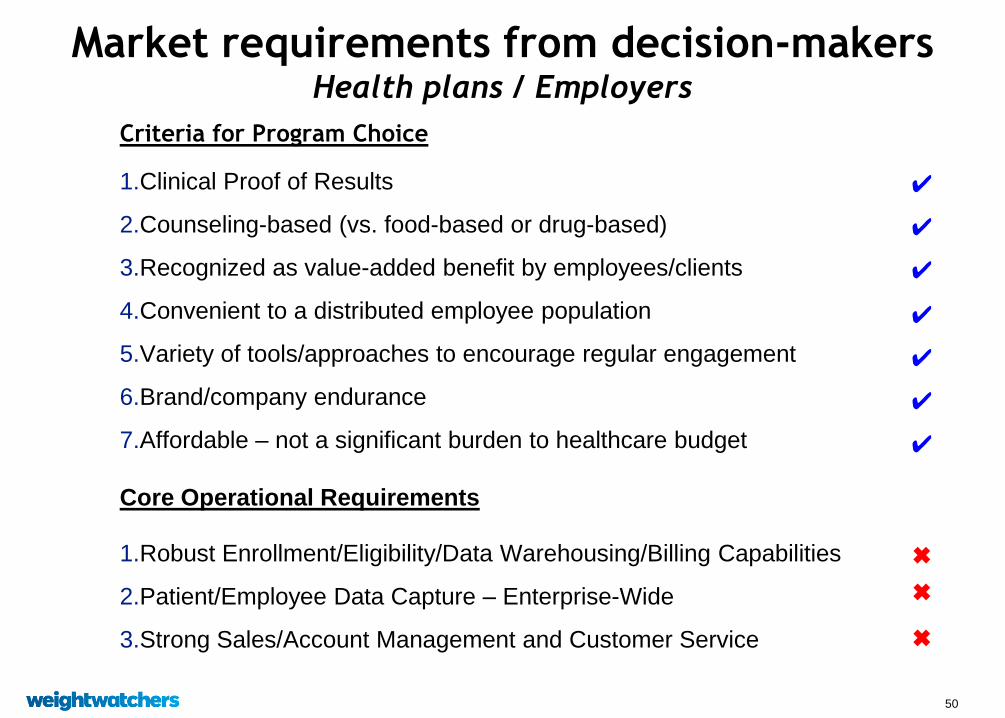
Market requirements from decision-makers Health plans / Employers
Criteria for Program Choice
1.Clinical Proof of Results
2.Counseling-based (vs. food-based or drug-based)
3.Recognized as value-added benefit by employees/clients
4.Convenient to a distributed employee population
5.Variety of tools/approaches to encourage regular engagement
6.Brand/company endurance
7.Affordable – not a significant burden to healthcare budget
Core Operational Requirements
1.Robust Enrollment/Eligibility/Data Warehousing/Billing Capabilities
2.Patient/Employee Data Capture – Enterprise-Wide
3.Strong Sales/Account Management and Customer Service

51
Weight Watchers Health Solutions: The Team
Executive Role Background Start Date
Colin Watts President Johnson & Johnson, Walgreens, Campbells,
Nabisco
1/2012
Heidi Bowman VP, Operations &
Healthcare Strategy
Medco (Express Scripts), Schering-Plough
(Merck)
9/2012
Peter Dunphy VP,
Commercialization
ActiveHealth, Aetna, Quest Diagnostic,
Best Doctors
9/2013
Susan
Fanciullo
National Sales
Director
Wellpoint, Anthem BCBS, UHC 4/2013
Cecile Johnson Senior Director,
Client Operations
Medco, US Homecare, WellChoice 1/2013
Key dedicated WWHS executives:
Complemented by strong cross-functional members in key areas
52
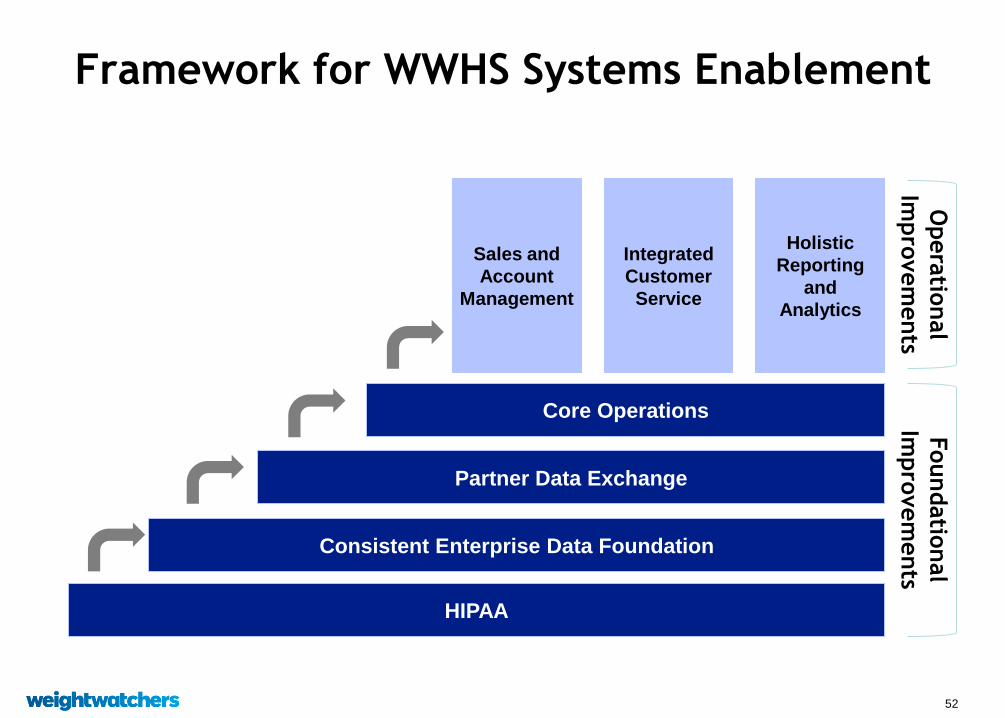
Framework for WWHS Systems Enablement
HIPAA
Foundatio
nal
Impro
vem
ents
Consistent Enterprise Data Foundation
Partner Data Exchange
Core Operations
Holistic
Reporting
and
Analytics
Integrated
Customer
Service
Sales and
Account
Management
Opera
tional
Impro
vem
ents

53
Strengthen HIPAA Compliance Key Areas of Focus
People
Process
Privacy Capabilities
&
HIPAA Controls
People Stream
Responsible for remediation efforts
related to training and awareness,
communication, policy development,
governance
Process Stream
Responsible for standard operating
procedures, vendor management, surveys,
monitoring, retention, and hardcopy PHI
Technology
Technology Stream
Responsible for information security,
websites, applications and systems,
tools, and electronic PHI

54
Bringing together the meeting & digital experiences into the hands of our service providers
– A technology platform for meeting room automation: healthcare data capture, better member experience
– Ensure “single-member view” across all key Weight Watchers channels with HIPAA compliance
– Deploy hardware solution that can be used in all types of meetings (traveler, @work, stores)
500 Champ-units deployed at @work locations in 2013 to capture key requirements
Preparing for Phase II pilot of new units and begin deployment in our US meeting rooms in 2014/2015
Data capture: next generation of meeting room technology
2013 2014
Q4 Q1 Q2 Q3 Q4
Tech architecture
definition
Prototype
Pilot
Product Discovery
Delivery POC
Begin national deployment
Product Discovery
Delivery
55
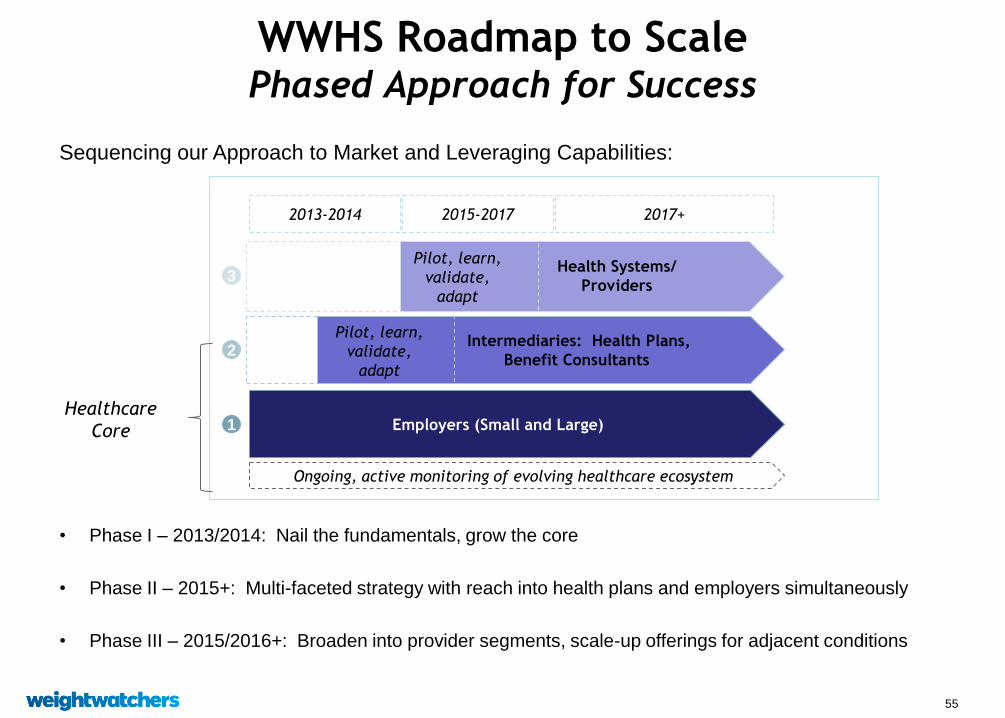
WWHS Roadmap to Scale Phased Approach for Success
Sequencing our Approach to Market and Leveraging Capabilities:
• Phase I – 2013/2014: Nail the fundamentals, grow the core
• Phase II – 2015+: Multi-faceted strategy with reach into health plans and employers simultaneously
• Phase III – 2015/2016+: Broaden into provider segments, scale-up offerings for adjacent conditions
Ongoing, active monitoring of evolving healthcare ecosystem
Employers (Small and Large) 1
Intermediaries: Health Plans,
Benefit Consultants 2
Health Systems/
Providers
Pilot, learn,
validate,
adapt
3
2013-2014 2015-2017 2017+
Healthcare
Core
Pilot, learn,
validate,
adapt

56
Select WWHS Relationships
Employers Health Plans Providers
57
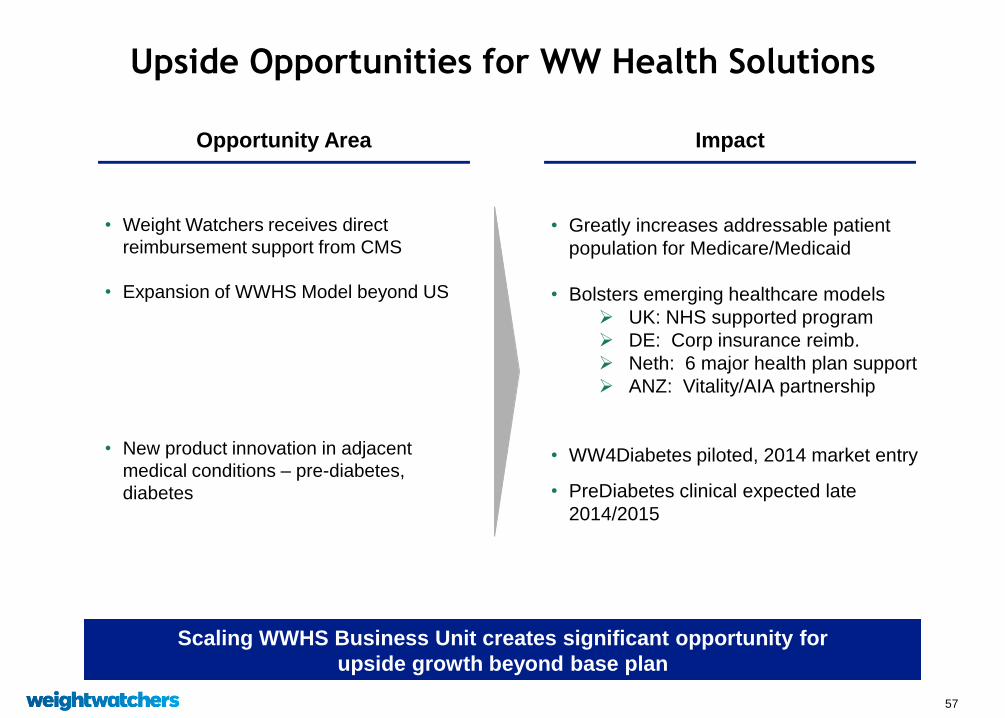
Upside Opportunities for WW Health Solutions
Opportunity Area
• Weight Watchers receives direct
reimbursement support from CMS
• Expansion of WWHS Model beyond US
• New product innovation in adjacent
medical conditions – pre-diabetes,
diabetes
Impact
• Greatly increases addressable patient
population for Medicare/Medicaid
• Bolsters emerging healthcare models
UK: NHS supported program
DE: Corp insurance reimb.
Neth: 6 major health plan support
ANZ: Vitality/AIA partnership
• WW4Diabetes piloted, 2014 market entry
• PreDiabetes clinical expected late
2014/2015
Scaling WWHS Business Unit creates significant opportunity for
upside growth beyond base plan

58
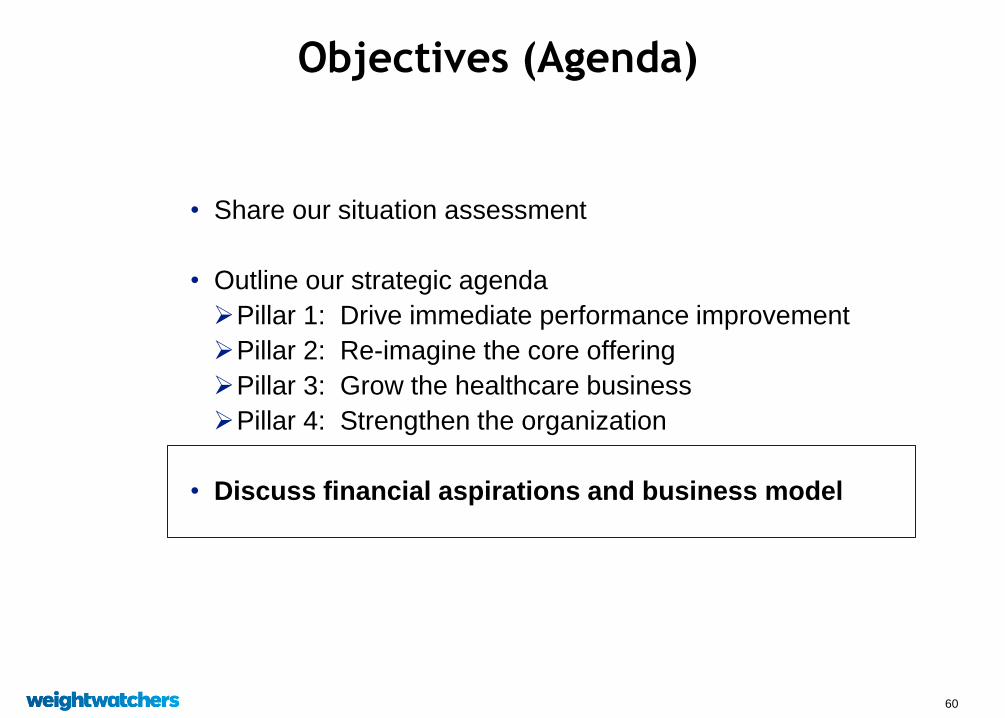
Objectives (Agenda)
• Share our situation assessment
• Outline our strategic agenda
Pillar 1: Drive immediate performance improvement
Pillar 2: Re-imagine the core offering
Pillar 3: Grow the healthcare business
Pillar 4: Strengthen the organization
• Discuss financial aspirations and business model
59
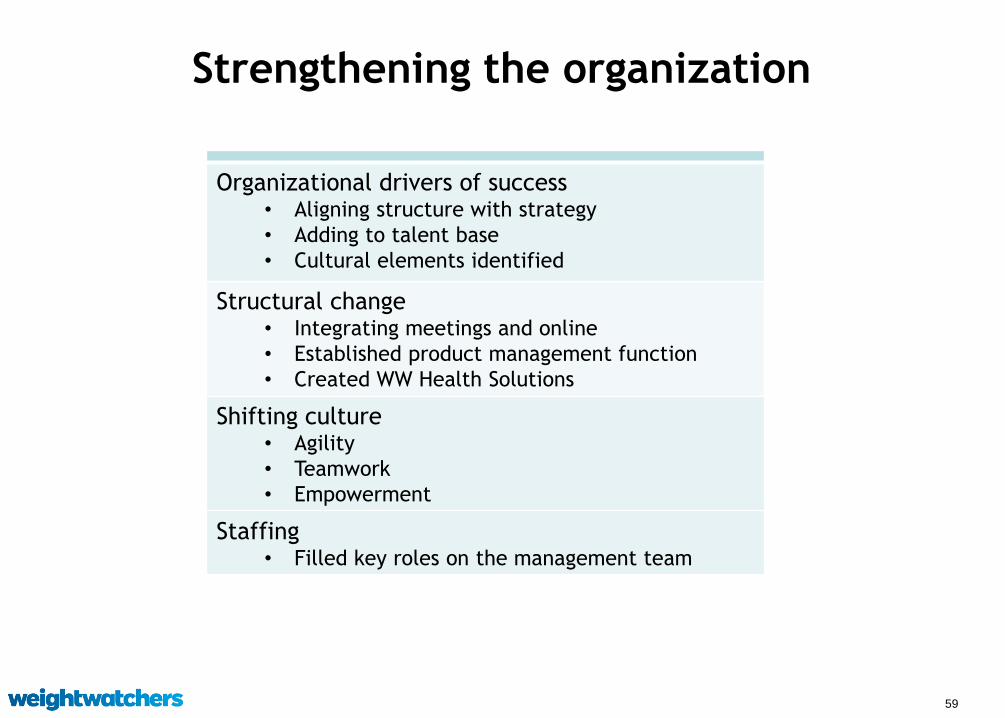
Organizational drivers of success • Aligning structure with strategy
• Adding to talent base
• Cultural elements identified
Structural change • Integrating meetings and online
• Established product management function
• Created WW Health Solutions
Shifting culture • Agility
• Teamwork
• Empowerment
Staffing • Filled key roles on the management team
Strengthening the organization
60
Objectives (Agenda)
• Share our situation assessment
• Outline our strategic agenda
Pillar 1: Drive immediate performance improvement
Pillar 2: Re-imagine the core offering
Pillar 3: Grow the healthcare business
Pillar 4: Strengthen the organization
• Discuss financial aspirations and business model

61
Financial aspirations
• Multi-year transformation
Path to recovery likely not linear
– 2014 challenging year
• Five-year aspiration: $2B+ in revenues by 2018
Revenue growth not expected in 2014
Expect to see positive recruitment trends in 2015 benefitting from strategic initiatives, but
revenue growth may not be until FY2016 and beyond
• Transformation will reinvent B2C which will remain biggest part of business for foreseeable
future, though B2B increasingly important
B2C returns to growth after reinvigorating core initiatives implemented
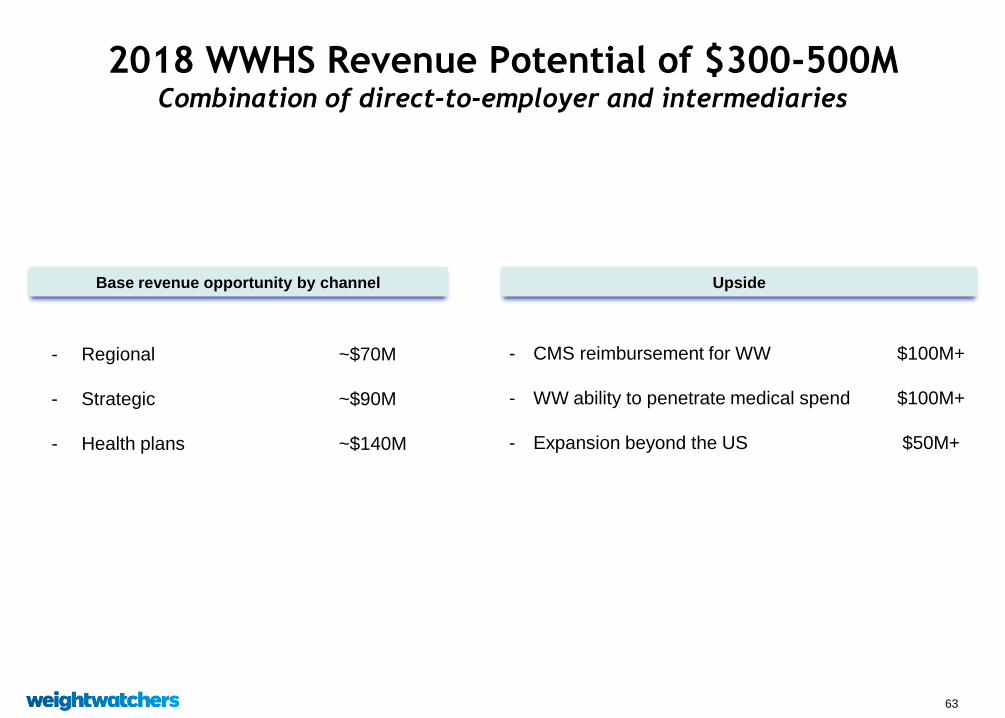
B2B expected to represent 15-25% or $300-500M by 2018
• Targeting 2013-2015 annualized gross cost savings of $150M
$90M achieved to date
• Manage margins so earnings grow faster than sales
• Clear capital priorities: Fund the business and reduce debt towards approximately 3X
leverage
62
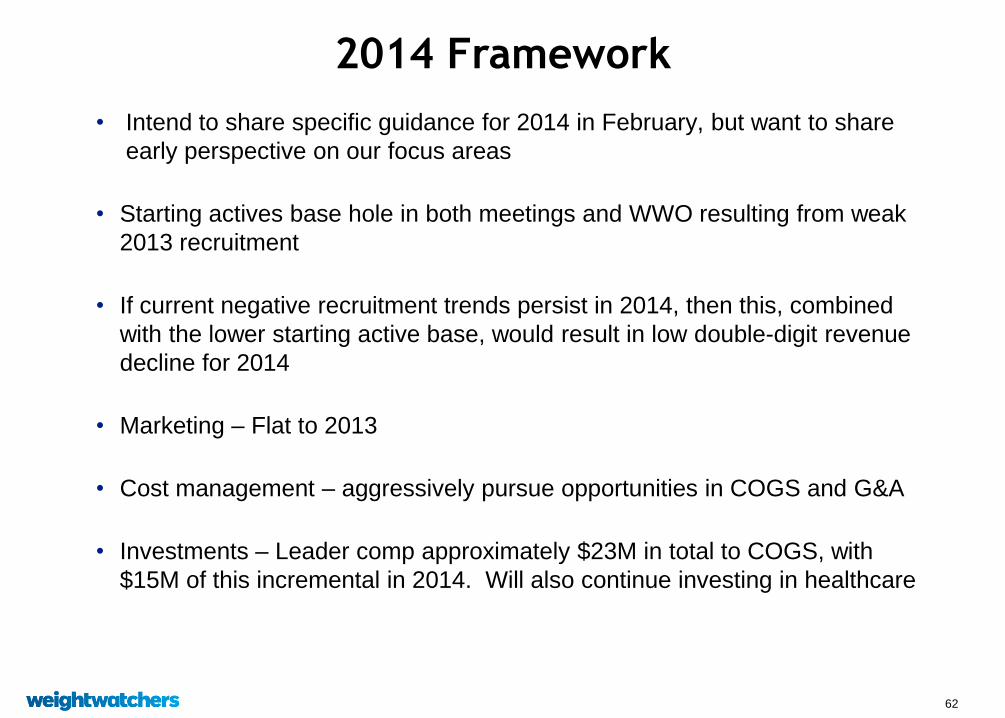
2014 Framework
• Intend to share specific guidance for 2014 in February, but want to share
early perspective on our focus areas
• Starting actives base hole in both meetings and WWO resulting from weak
2013 recruitment
• If current negative recruitment trends persist in 2014, then this, combined
with the lower starting active base, would result in low double-digit revenue
decline for 2014
• Marketing – Flat to 2013
• Cost management – aggressively pursue opportunities in COGS and G&A
• Investments – Leader comp approximately $23M in total to COGS, with
$15M of this incremental in 2014. Will also continue investing in healthcare
63
2018 WWHS Revenue Potential of $300-500M Combination of direct-to-employer and intermediaries
Base revenue opportunity by channel
- CMS reimbursement for WW $100M+
- WW ability to penetrate medical spend $100M+
- Expansion beyond the US $50M+
Upside
- Regional ~$70M
- Strategic ~$90M
- Health plans ~$140M

64
Targeting $150M gross annualized savings run rate
over 2013-15
• On track to deliver ~$90M gross annualized savings from FY13 initiatives ~$60M Marketing
~$30M G&A and COGS
• Targeting incremental $60M beyond wave 1
• Further marketing cuts not expected in 2014; expected to be flat on $ basis Will continue to evaluate mix and productivity
• Savings will come from G&A and COGS; committed to right-sizing
business and improving meetings margin
• Cost savings will more than fund investments

65
Notes:
See Appendix for a reconciliation of non-GAAP financial measures to the most comparable GAAP measures.
-2008 Revenue & Gross Profit M argin exclude negative impact of UK VAT ruling of $18.7M related to prior years.
-2009 Gross Profit M argin excludes impact of UK Self-employment ruling of $32.5M (pretax) related to prior years.
-2010 Revenue & Gross Profit M argin exclude the benefit of a $2.0M increase in revenues for the reversal of an over-accrual related to the UK VAT ruling .
-2012 Gross Profit M argin excludes the benefit of a $14.5 million over-accrual reversal associated with the UK Self-employment ruling.
Consolidated Revenue + Gross Profit Margin
1,555
1,399
1,819 1,827
1,450
54.9%
57.6%
57.5%
54.4%
58.5%
54.4%
1,000
1,100
1,200
1,300
1,400
1,500
1,600
1,700
1,800
1,900
2008 2009 2010 2011 2012 2013E
52.0%
53.0%
54.0%
55.0%
56.0%
57.0%
58.0%
59.0%
Global Revenue
GM %
Overall Gross Margin Trend
in $Ms
*
*Based on expectations that Q4 2013 global revenue down low double digits versus the prior year period and 2013 full-year total-company gross margin will be down 100bps versus the prior year.
66
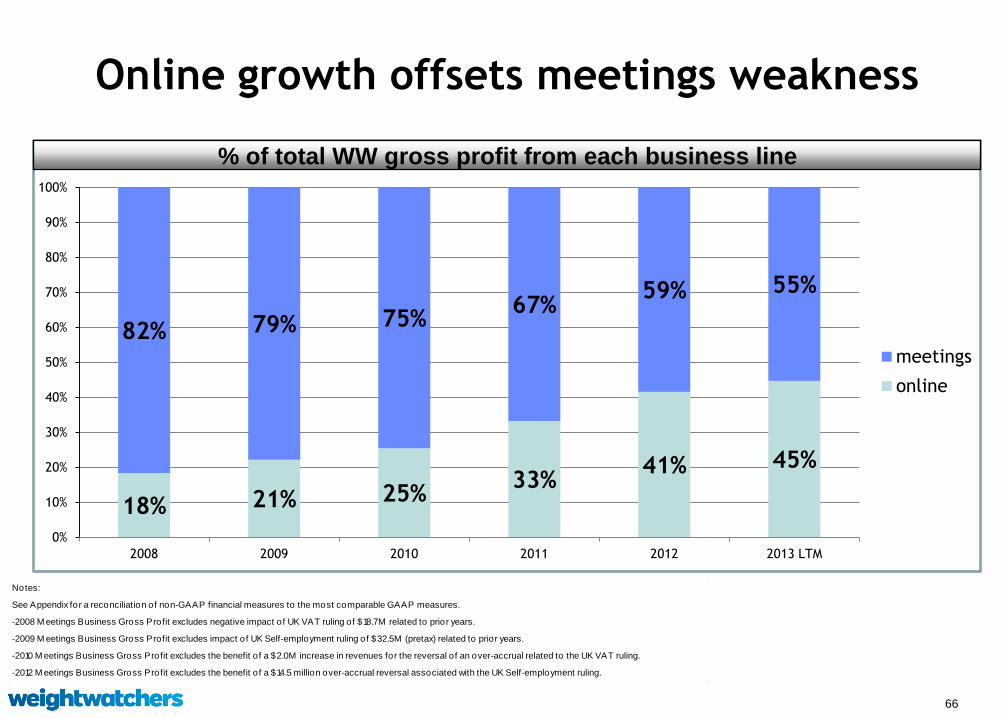
Online growth offsets meetings weakness
18% 21% 25% 33%
41% 45%
82% 79% 75% 67%
59% 55%
0%
10%
20%
30%
40%
50%
60%
70%
80%
90%
100%
2008 2009 2010 2011 2012 2013 LTM
meetings
online
% of total WW gross profit from each business line
Notes:
See Appendix for a reconciliation of non-GAAP financial measures to the most comparable GAAP measures.
-2008 M eetings Business Gross Profit excludes negative impact of UK VAT ruling of $18.7M related to prior years.
-2009 M eetings Business Gross Profit excludes impact of UK Self-employment ruling of $32.5M (pretax) related to prior years.
-2010 M eetings Business Gross Profit excludes the benefit of a $2.0M increase in revenues for the reversal of an over-accrual related to the UK VAT ruling.
-2012 M eetings Business Gross Profit excludes the benefit of a $14.5 million over-accrual reversal associated with the UK Self-employment ruling.
67
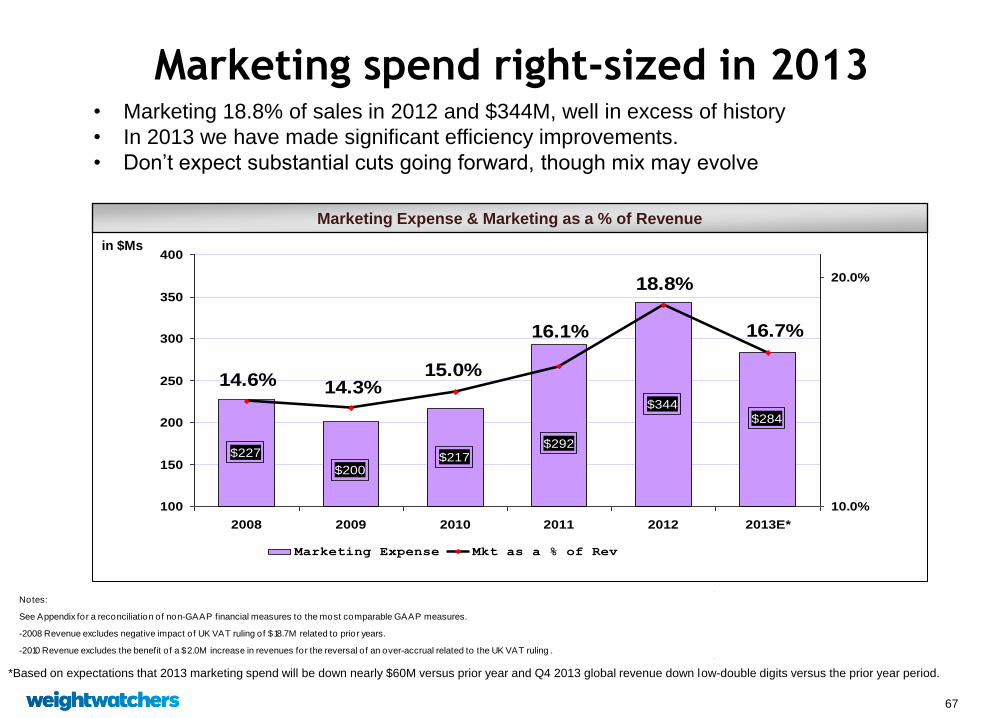
Marketing spend right-sized in 2013
$227 $217
$344
$284
$200
$292
14.6%
16.1%
15.0%14.3%
16.7%
18.8%
100
150
200
250
300
350
400
2008 2009 2010 2011 2012 2013E*
10.0%
20.0%
Marketing Expense Mkt as a % of Rev
in $Ms
Marketing Expense & Marketing as a % of Revenue
• Marketing 18.8% of sales in 2012 and $344M, well in excess of history
• In 2013 we have made significant efficiency improvements.
• Don’t expect substantial cuts going forward, though mix may evolve
*Based on expectations that 2013 marketing spend will be down nearly $60M versus prior year and Q4 2013 global revenue down low-double digits versus the prior year period.
Notes:
See Appendix for a reconciliation of non-GAAP financial measures to the most comparable GAAP measures.
-2008 Revenue excludes negative impact of UK VAT ruling of $18.7M related to prior years.
-2010 Revenue excludes the benefit of a $2.0M increase in revenues for the reversal of an over-accrual related to the UK VAT ruling .

68
Notes:
See Appendix for a reconciliation of non-GAAP financial measures to the most comparable GAAP measures.
-2008 Revenue excludes negative impact of UK VAT ruling of $18.7M related to prior years.
-2010 Revenue excludes the benefit of a $2.0M increase in revenues for the reversal of an over-accrual related to the UK VAT ruling .
$182 $183
$228
$238
$171$208
11.7% 11.5%
12.6%12.2%
14.0%
12.5%
100
120
140
160
180
200
220
240
260
280
2008 2009 2010 2011 2012 2013E*
10.0%
G&A Expense G&A as a % of Rev
G&A has increased
in $Ms G&A Expense & G&A as a % of Revenue
• G&A has ballooned relative to sales over the past several years
• Some warranted for growth investments, e.g., healthcare
• Some initial success and several opportunities for further cost action
in $M’s
*Based on expectations that 2013 G&A spend will be up no more than $10M versus the prior year and Q4 2013 global revenue down low-double digits versus the prior year period.
15.0%

69
6%
20%
13%
10% 4%
46%
2013E
B2B
Other Tech
Tech Prof Fees
Non-Tech Prof Fees
Other G&A
Salaries & Benefits
2013 mix shift in G&A driven by investments
in tech and Healthcare
0.5%
19%
6%
7%
16%
52%
2009
Note: % based on unallocated G&A; portion of technology costs are allocated to online COS
Healthcare

70
Professional Fees ~$100M
Big opportunity as they are not only in G&A
Professional fee mix % total
53%
20%
26%
G&A
COGS
Marketing
Note: Total is not 100% due to rounding

71
Cash flow priorities
• Fund the business
• Pay down debt
• Make selective acquisitions
72
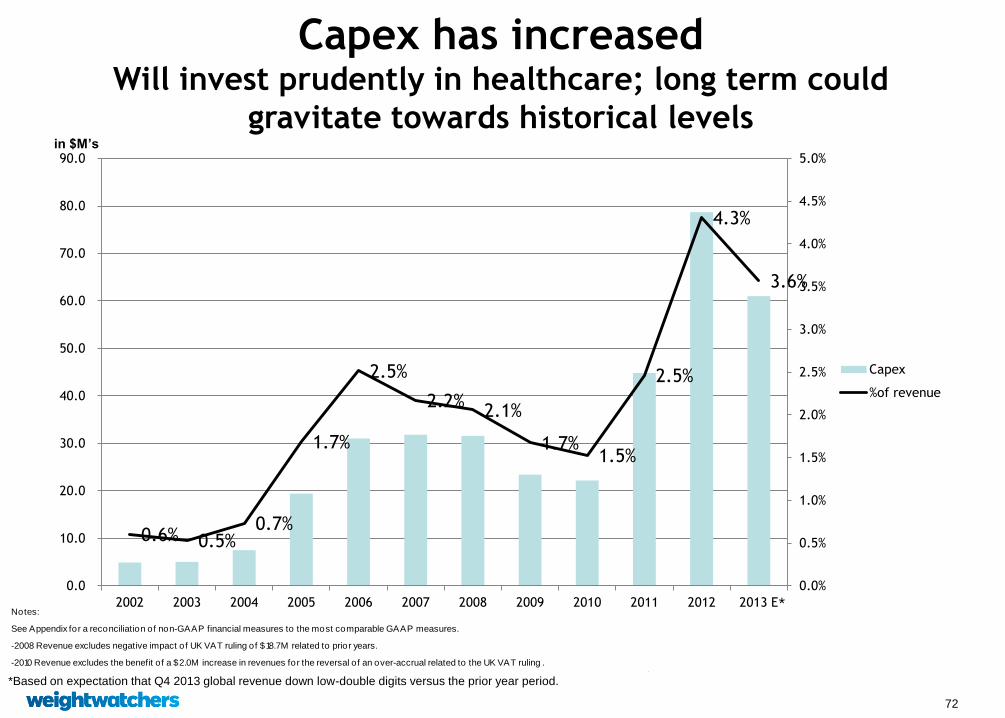
Capex has increased Will invest prudently in healthcare; long term could
gravitate towards historical levels in $M’s
Notes:
See Appendix for a reconciliation of non-GAAP financial measures to the most comparable GAAP measures.
-2008 Revenue excludes negative impact of UK VAT ruling of $18.7M related to prior years.
-2010 Revenue excludes the benefit of a $2.0M increase in revenues for the reversal of an over-accrual related to the UK VAT ruling .
0.6% 0.5% 0.7%
1.7%
2.5%
2.2% 2.1%
1.7% 1.5%
2.5%
4.3%
3.6%
0.0%
0.5%
1.0%
1.5%
2.0%
2.5%
3.0%
3.5%
4.0%
4.5%
5.0%
0.0
10.0
20.0
30.0
40.0
50.0
60.0
70.0
80.0
90.0
2002 2003 2004 2005 2006 2007 2008 2009 2010 2011 2012 2013 E
Capex
%of revenue
*
*Based on expectation that Q4 2013 global revenue down low-double digits versus the prior year period.

73
Debt reduction is a clear priority
2.0x
3.4x 3.3x 3.2x
3.1x
1.7x
4.3x 4.2x
~3x
0.0x
0.5x
1.0x
1.5x
2.0x
2.5x
3.0x
3.5x
4.0x
4.5x
5.0x
0
500
1000
1500
2000
2500
2006 2007 2008 2009 2010 2011 2012 3Q13 2018E
Net Debt
Net Debt/EBITDAS
in $Ms
See Appendix for a reconciliation of non-GAAP financial measures to the most comparable GAAP measures.
-2008 EBITDAS excludes negative impact of UK VAT ruling of $18.7M related to prior years.
-2009 EBITDAS excludes impact of UK Self-employment ruling of $32.5M (pretax) related to prior years. EBITDAS also excludes restructuring charges of $5.5M.
-2010 EBITDAS excludes the benefit of a $2.0M increase in revenues for the reversal of an over-accrual related to the UK VAT ruling.
-2012 EBITDAS excludes the benefit of a $14.5 million over-accrual reversal associated with the UK Self-employment ruling.
EBITDAS = earnings before interest, taxes, depreciation, amortization, and stock-based compensation expense.
Target

74
Effective Q1 2014, revising operating structure Full P&L accountability is being rolled into the geographies: our WW.com
business will no longer be a separate business unit
Implications for reporting:
• No change in income statement in earnings press release financials
• Commitment to sharing volume and revenue for Online
May re-evaluate when hybrid model is fully in place
• Will still report meetings COGS and cost of Internet revenues on a
consolidated basis
• Will report segment profitability for regions
Intend to provide revised historical segment geographic
data before reporting Q1 2014

75
We are committed to an open dialogue and
sharing of milestones
• In addition to continued reporting of paid weeks (our best volume
metric), we’re introducing the total active member base (Monthly Pass
+ WWO) quarterly
In combination, they provide good visibility into our progress
• On a periodic basis, we will update other metrics that we shared today
• We will also share WWHS progress
76
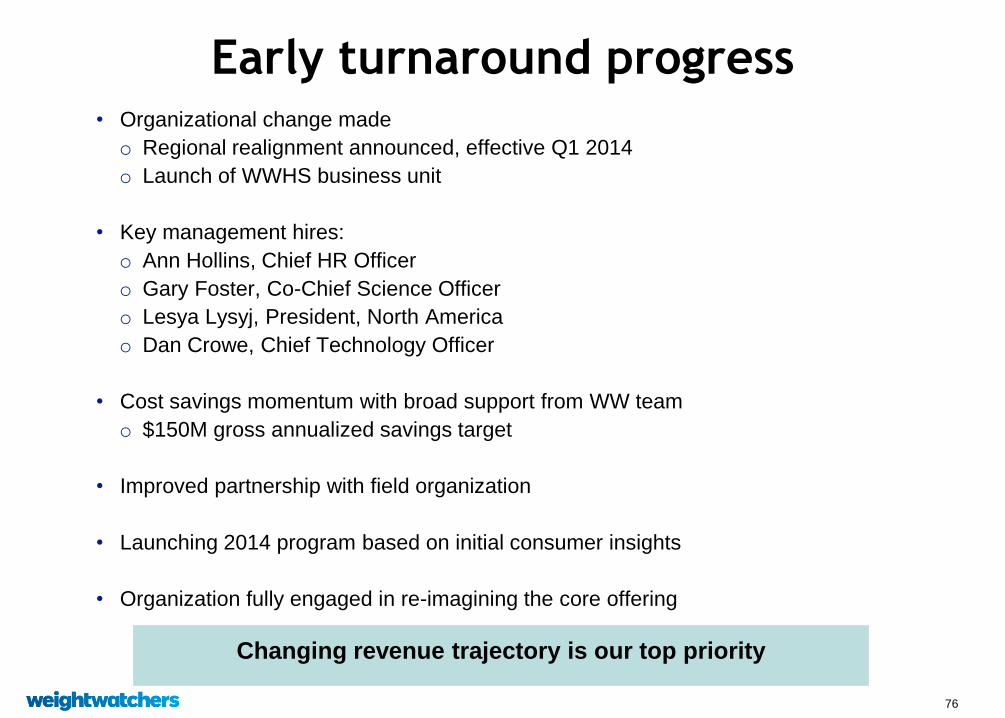
Early turnaround progress • Organizational change made
o Regional realignment announced, effective Q1 2014
o Launch of WWHS business unit
• Key management hires:
o Ann Hollins, Chief HR Officer
o Gary Foster, Co-Chief Science Officer
o Lesya Lysyj, President, North America
o Dan Crowe, Chief Technology Officer
• Cost savings momentum with broad support from WW team
o $150M gross annualized savings target
• Improved partnership with field organization
• Launching 2014 program based on initial consumer insights
• Organization fully engaged in re-imagining the core offering
Changing revenue trajectory is our top priority

77
Investment thesis
• Seasoned management team driving a multi-year transformation
o Realistic about the environment
o Sense of urgency
• Clear pathway to rejuvenated B2C business
• Mobilizing resources to accelerate healthcare growth
• Aggressive cost structure management
• Debt pay-down is a priority
Successful execution yields $2B+ revenue by
2018 with earnings growing faster than sales

78
Appendix – Non-GAAP Reconciliations
79
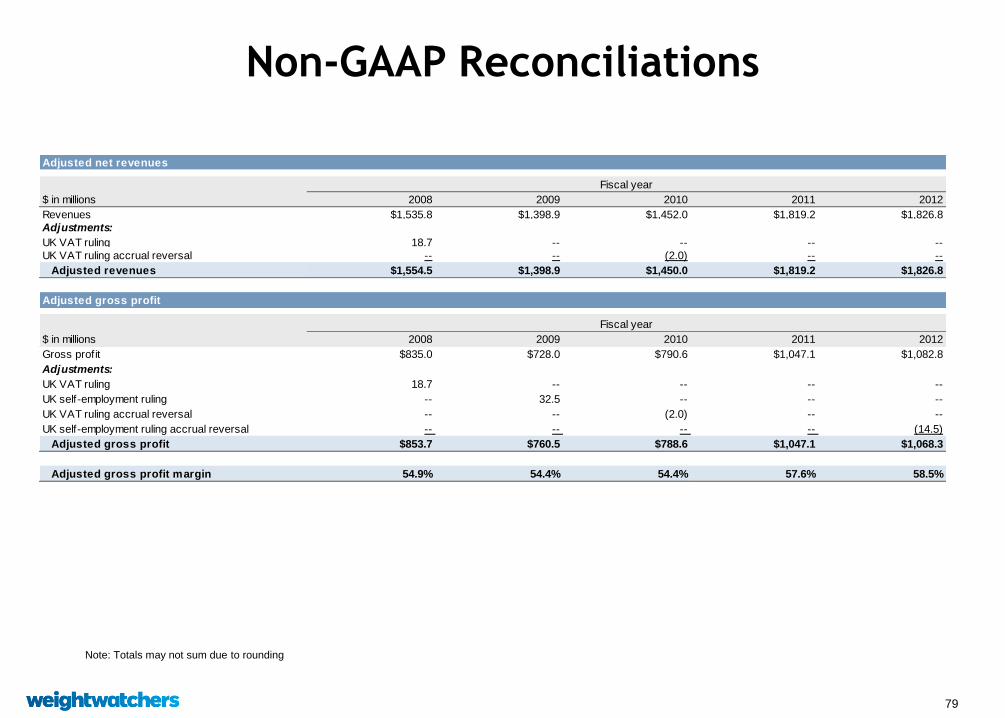
Non-GAAP Reconciliations
Note: Totals may not sum due to rounding
Adjusted net revenues
Fiscal year
$ in millions 2008 2009 2010 2011 2012
Revenues $1,535.8 $1,398.9 $1,452.0 $1,819.2 $1,826.8
Adjustments:
UK VAT ruling 18.7 -- -- -- --
UK VAT ruling accrual reversal -- -- (2.0) -- --
Adjusted revenues $1,554.5 $1,398.9 $1,450.0 $1,819.2 $1,826.8
Adjusted gross profit
Fiscal year
$ in millions 2008 2009 2010 2011 2012
Gross profit $835.0 $728.0 $790.6 $1,047.1 $1,082.8
Adjustments:
UK VAT ruling 18.7 -- -- -- --
UK self-employment ruling -- 32.5 -- -- --
UK VAT ruling accrual reversal -- -- (2.0) -- --
UK self-employment ruling accrual reversal -- -- -- -- (14.5)
Adjusted gross profit $853.7 $760.5 $788.6 $1,047.1 $1,068.3
Adjusted gross profit margin 54.9% 54.4% 54.4% 57.6% 58.5%

80
Non-GAAP Reconciliations (continued)
Note: Totals may not sum due to rounding
Adjusted operating income
Fiscal year
$ in millions 2008 2009 2010 2011 2012
Operating income $425.0 $356.7 $390.3 $546.3 $510.8
Adjustments:
UK VAT ruling 18.7 -- -- -- --
Restructuring -- 5.5 -- -- --
UK self-employment ruling -- 32.5 -- -- --
UK VAT ruling accrual reversal -- -- (2.0) -- --
UK self-employment ruling accrual reversal -- -- -- -- (14.5)
Adjusted operating income $443.7 $394.7 $388.3 $546.3 $496.3
Adjusted EBITDAS
$ in millions 2006 2007 2008 2009 2010 2011 2012 3Q 2013
Net Income $209.8 $201.2 $204.3 $177.3 $194.2 $304.9 $257.4 $231.9
Interest 49.5 109.3 92.7 66.7 76.2 59.9 90.5 106.7
Taxes 120.8 125.3 132.0 115.6 120.7 178.7 159.5 143.6
EBIT $380.1 $435.8 $429.0 $359.6 $391.1 $543.5 $507.4 $482.2
Depreciation and amortization 13.4 19.0 24.5 27.9 29.0 31.0 36.6 43.1
Stock-based compensation 11.8 11.8 11.3 8.8 8.6 9.1 8.8 5.5
EBITDAS $405.3 $466.6 $464.8 $396.3 $428.7 $583.6 $552.8 $530.7
Adjustments:
UK VAT ruling -- -- 18.7 -- -- -- -- --
Restructuring -- -- -- 5.5 -- -- -- --
UK self-employment ruling -- -- -- 32.5 -- -- -- --
UK VAT ruling accrual reversal -- -- -- -- (2.0) -- -- --
UK self-employment ruling accrual reversal -- -- -- -- -- -- (14.5) 0.0
Adjusted EBITDAS $405.3 $466.6 $483.5 $434.3 $426.7 $583.6 $538.3 $530.7
Cash and cash equivalents $37.5 $39.8 $47.3 $48.7 $43.3 $53.2 $70.2 $181.3
Total debt 849.2 1,648.1 1,647.5 1,453.0 1,365.1 1,051.8 2,406.4 2,394.0
Net debt / Adjusted EBITDAS 2.0 X 3.4 X 3.3 X 3.2 X 3.1 X 1.7 X 4.3 X 4.2 X
Fiscal year
81
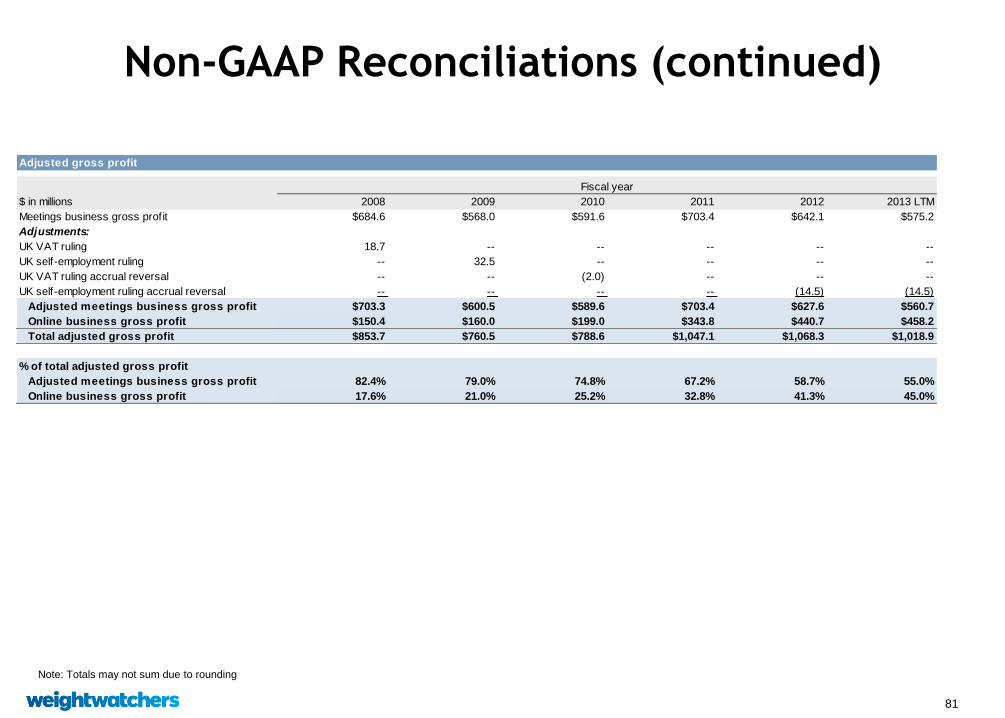
Non-GAAP Reconciliations (continued)
Note: Totals may not sum due to rounding
Adjusted gross profit
Fiscal year
$ in millions 2008 2009 2010 2011 2012 2013 LTM
Meetings business gross profit $684.6 $568.0 $591.6 $703.4 $642.1 $575.2
Adjustments:
UK VAT ruling 18.7 -- -- -- -- --
UK self-employment ruling -- 32.5 -- -- -- --
UK VAT ruling accrual reversal -- -- (2.0) -- -- --
UK self-employment ruling accrual reversal -- -- -- -- (14.5) (14.5)
Adjusted meetings business gross profit $703.3 $600.5 $589.6 $703.4 $627.6 $560.7
Online business gross profit $150.4 $160.0 $199.0 $343.8 $440.7 $458.2
Total adjusted gross profit $853.7 $760.5 $788.6 $1,047.1 $1,068.3 $1,018.9
% of total adjusted gross profit
Adjusted meetings business gross profit 82.4% 79.0% 74.8% 67.2% 58.7% 55.0%
Online business gross profit 17.6% 21.0% 25.2% 32.8% 41.3% 45.0%


