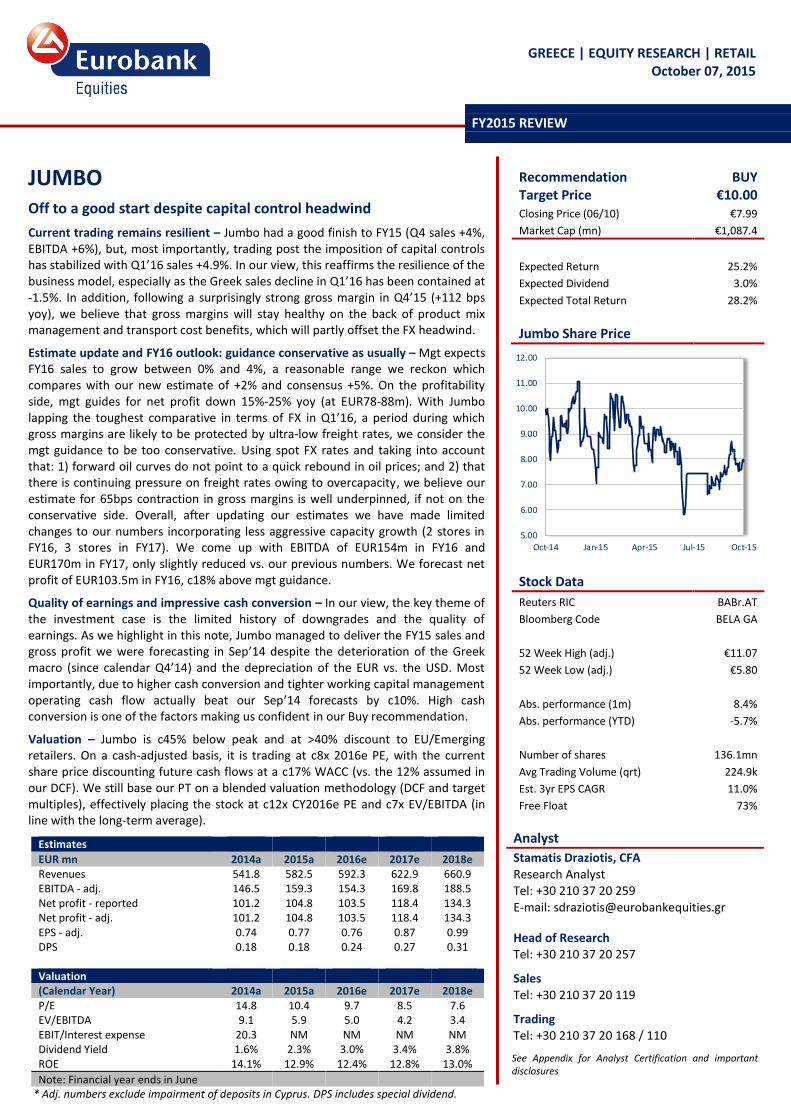
GREECE | EQUITY RESEARCH | RETAIL October 07, 2015 Recommendation BUY Target Price €10.00 Closing Price (06/10) €7.99 Market Cap (mn) €1,087.4 Expected Return 25.2% Expected Dividend 3.0% Expected Total Return 28.2% Jumbo Share Price 5.00 6.00 7.00 8.00 9.00 10.00 11.00 12.00 Oct-14 Jan-15 Apr-15 Jul-15 Oct-15 Stock Data Reuters RIC BABr.AT Bloomberg Code BELA GA 52 Week High (adj.) €11.07 52 Week Low (adj.) €5.80 Abs. performance (1m) 8.4% Abs. performance (YTD) -5.7% Number of shares 136.1mn Avg Trading Volume (qrt) 224.9k Est. 3yr EPS CAGR 11.0% Free Float 73% Analyst Stamatis Draziotis, CFA Research Analyst Tel: +30 210 37 20 259 E-mail: [email protected]Head of Research Tel: +30 210 37 20 257 Sales Tel: +30 210 37 20 119 Trading Tel: +30 210 37 20 168 / 110 See Appendix for Analyst Certification and important disclosures JUMBO Off to a good start despite capital control headwind Current trading remains resilient – Jumbo had a good finish to FY15 (Q4 sales +4%, EBITDA +6%), but, most importantly, trading post the imposition of capital controls has stabilized with Q1’16 sales +4.9%. In our view, this reaffirms the resilience of the business model, especially as the Greek sales decline in Q1’16 has been contained at -1.5%. In addition, following a surprisingly strong gross margin in Q4’15 (+112 bps yoy), we believe that gross margins will stay healthy on the back of product mix management and transport cost benefits, which will partly offset the FX headwind. Estimate update and FY16 outlook: guidance conservative as usually – Mgt expects FY16 sales to grow between 0% and 4%, a reasonable range we reckon which compares with our new estimate of +2% and consensus +5%. On the profitability side, mgt guides for net profit down 15%-25% yoy (at EUR78-88m). With Jumbo lapping the toughest comparative in terms of FX in Q1’16, a period during which gross margins are likely to be protected by ultra-low freight rates, we consider the mgt guidance to be too conservative. Using spot FX rates and taking into account that: 1) forward oil curves do not point to a quick rebound in oil prices; and 2) that there is continuing pressure on freight rates owing to overcapacity, we believe our estimate for 65bps contraction in gross margins is well underpinned, if not on the conservative side. Overall, after updating our estimates we have made limited changes to our numbers incorporating less aggressive capacity growth (2 stores in FY16, 3 stores in FY17). We come up with EBITDA of EUR154m in FY16 and EUR170m in FY17, only slightly reduced vs. our previous numbers. We forecast net profit of EUR103.5m in FY16, c18% above mgt guidance. Quality of earnings and impressive cash conversion – In our view, the key theme of the investment case is the limited history of downgrades and the quality of earnings. As we highlight in this note, Jumbo managed to deliver the FY15 sales and gross profit we were forecasting in Sep’14 despite the deterioration of the Greek macro (since calendar Q4’14) and the depreciation of the EUR vs. the USD. Most importantly, due to higher cash conversion and tighter working capital management operating cash flow actually beat our Sep’14 forecasts by c10%. High cash conversion is one of the factors making us confident in our Buy recommendation. Valuation – Jumbo is c45% below peak and at >40% discount to EU/Emerging retailers. On a cash-adjusted basis, it is trading at c8x 2016e PE, with the current share price discounting future cash flows at a c17% WACC (vs. the 12% assumed in our DCF). We still base our PT on a blended valuation methodology (DCF and target multiples), effectively placing the stock at c12x CY2016e PE and c7x EV/EBITDA (in line with the long-term average). FY2015 REVIEW Estimates EUR mn 2014a 2015a 2016e 2017e 2018e Revenues 541.8 582.5 592.3 622.9 660.9 EBITDA - adj. 146.5 159.3 154.3 169.8 188.5 Net profit - reported 101.2 104.8 103.5 118.4 134.3 Net profit - adj. 101.2 104.8 103.5 118.4 134.3 EPS - adj. 0.74 0.77 0.76 0.87 0.99 DPS 0.18 0.18 0.24 0.27 0.31 Valuation (Calendar Year) 2014a 2015a 2016e 2017e 2018e P/E 14.8 10.4 9.7 8.5 7.6 EV/EBITDA 9.1 5.9 5.0 4.2 3.4 EBIT/Interest expense 20.3 NM NM NM NM Dividend Yield 1.6% 2.3% 3.0% 3.4% 3.8% ROE 14.1% 12.9% 12.4% 12.8% 13.0% Note: Financial year ends in June * Adj. numbers exclude impairment of deposits in Cyprus. DPS includes special dividend.
Transcript
GREECE | EQUITY RESEARCH | RETAIL October 07, 2015
See Appendix for Analyst Certification and important disclosures
JUMBO
Off to a good start despite capital control headwind
Current trading remains resilient – Jumbo had a good finish to FY15 (Q4 sales +4%, EBITDA +6%), but, most importantly, trading post the imposition of capital controls has stabilized with Q1’16 sales +4.9%. In our view, this reaffirms the resilience of the business model, especially as the Greek sales decline in Q1’16 has been contained at -1.5%. In addition, following a surprisingly strong gross margin in Q4’15 (+112 bps yoy), we believe that gross margins will stay healthy on the back of product mix management and transport cost benefits, which will partly offset the FX headwind.
Estimate update and FY16 outlook: guidance conservative as usually – Mgt expects FY16 sales to grow between 0% and 4%, a reasonable range we reckon which compares with our new estimate of +2% and consensus +5%. On the profitability side, mgt guides for net profit down 15%-25% yoy (at EUR78-88m). With Jumbo lapping the toughest comparative in terms of FX in Q1’16, a period during which gross margins are likely to be protected by ultra-low freight rates, we consider the mgt guidance to be too conservative. Using spot FX rates and taking into account that: 1) forward oil curves do not point to a quick rebound in oil prices; and 2) that there is continuing pressure on freight rates owing to overcapacity, we believe our estimate for 65bps contraction in gross margins is well underpinned, if not on the conservative side. Overall, after updating our estimates we have made limited changes to our numbers incorporating less aggressive capacity growth (2 stores in FY16, 3 stores in FY17). We come up with EBITDA of EUR154m in FY16 and EUR170m in FY17, only slightly reduced vs. our previous numbers. We forecast net profit of EUR103.5m in FY16, c18% above mgt guidance.
Quality of earnings and impressive cash conversion – In our view, the key theme of the investment case is the limited history of downgrades and the quality of earnings. As we highlight in this note, Jumbo managed to deliver the FY15 sales and gross profit we were forecasting in Sep’14 despite the deterioration of the Greek macro (since calendar Q4’14) and the depreciation of the EUR vs. the USD. Most importantly, due to higher cash conversion and tighter working capital management operating cash flow actually beat our Sep’14 forecasts by c10%. High cash conversion is one of the factors making us confident in our Buy recommendation.
Valuation – Jumbo is c45% below peak and at >40% discount to EU/Emerging retailers. On a cash-adjusted basis, it is trading at c8x 2016e PE, with the current share price discounting future cash flows at a c17% WACC (vs. the 12% assumed in our DCF). We still base our PT on a blended valuation methodology (DCF and target multiples), effectively placing the stock at c12x CY2016e PE and c7x EV/EBITDA (in line with the long-term average).
Note: Financial year ends in June * Adj. numbers exclude impairment of deposits in Cyprus. DPS includes special dividend.
JUMBO
October 07, 2015
2
Investment case
Jumbo is one of the largest retailers in Greece, with its product offering covering almost all retail sub-segments except for food. With c75% of its sales stemming from the domestic market, Jumbo’s growth profile is primarily dependent on the Greek consumer. Despite the prolonged period of political uncertainty and the new wave of austerity measures in Greece, we believe the low-ticket nature of the product offering will protect Jumbo’s LFL sales growth to a great extent, underpinning our low single and mid-single digit sales growth estimate over 2016 and 2017-18e respectively. For 2016 in particular, we model a mid-single digit LFL decline in Greece more than offset by double-digit growth in Bulgaria (LFL), mid-single digit sales increase in Cyprus, and doubling of sales in Romania boosted by the contribution of two stores. We remind investors that in the last period of severe recession in Greece (2011-12) Jumbo’s group sales growth remained positive, with Greece down just 1-3% (mid to high-single digit LFL decline). In our view, the table below clearly depicts the main merits of the investment case, namely the limited history of negative earnings surprises and the quality of earnings. As can be seen, Jumbo managed to deliver the FY15 sales and gross profit we were forecasting in September 2014 despite the deterioration of the Greek macro (from calendar Q4 2014 onwards) and the depreciation of the EUR vs. the USD. The latter was offset by the lower transport costs (due to lower oil and overcapacity in the freight industry) and positive mix (rising penetration of seasonal/home items). Most importantly, the miss vs. our EBITDA forecast was just 3% while due to higher cash conversion and tighter working capital management operating cash flow actually beat our Sep-2014 forecasts by c10%. High cash conversion is one of the key themes associated with the investment thesis and what makes us more confident regarding our forecasts.
Limited history of downgrades EURmn Eurobank Equities FY15
forecasts, Sep 2014 FY15 actual variation % variation
With capital commitments not likely to exceed EUR40mn p.a., and most likely to be limited to cEUR20mn in FY16, we estimate Jumbo’s annual FCF will amount to cEUR90-130mn over FY16-18e, leaving scope for increased shareholder returns. We consider mgt’s decision to propose the postponement of dividend distributions “until the Greek economy stabilizes” an action of prudence of temporary nature rather than a reflection of future shareholder policy. In addition, we note that mgt tends to be predisposed to distributing special dividends rather than committing to a higher ordinary dividend payout. Assuming that the Greek economy does indeed stabilize in the coming months, we would anticipate Jumbo to resume dividend payments or pay out a special dividend similar to the EUR 0.18 per share paid in January 2015 (decided in December 2014). Jumbo has significant property asset holdings, owning the freehold of around half of its outlets. The book value of the group’s owned property assets (land and buildings) is cEUR455mn, namely >40% of the current market cap. With such a significant asset base and an under-leveraged balance sheet, we believe that Jumbo has numerous options to extract
Sales to be protected by value
customer proposition
Consistent cash generation
and room for cash returns
Property backing
Limited history of downgrades
JUMBO
October 07, 2015
3
value from its property portfolio at some point in the future (though this is not part of mgt’s near-term plans). In any case, the property-backing should provide valuation support to the stock even during periods of high risk attached to Greek equities. Jumbo’s gross margins depend primarily on three factors: FX (EUR/USD), transport costs and product mix. The first two factors are out of Jumbo’s control, with the former having turned into a headwind since mid 2014. On the other hand, transport costs remain a tailwind given the low oil price environment and the overcapacity in the freight market. As for the last factor, Jumbo has been increasingly using product mix to defend – and expand – margins, since its product mix has evolved from being toy-focused (50% of the sales mix in 2005) to one focused on seasonal/home products (c53% of the sales mix in 2015). We consider mix benefits sustainable in the long run, and as a result we believe Jumbo will keep its gross margins at levels higher than 50% in the medium term. We estimate that for every 0.05 change in the EUR/USD rate, our EBITDA estimates would change by c5%. For modeling purposes, we continue to use a rate near 1.13. Jumbo is c45% below peak and at >40% discount to EU and Emerging retailers. On a cash-adjusted basis, it is trading at c8x 2016e PE, with the current price discounting future cash flows at c17% WACC (vs. 12% assumed in our DCF). We continue to base our PT on a blended valuation methodology using a combination of DCF and target earnings multiples effectively placing the stock at c12x CY2016e PE and c7x EV/EBITDA, in line with the long-term average.
Jumbo market cap (in EURmn) and PE (1-year forward) Jumbo EV (in EURmn) and EV/EBITDA (1-year forward)
Source: Bloomberg, Eurobank Equities Research
2) … and quite compelling relative to peers given the growth outlook
Jumbo and EU retail peers 2015 valuation against 3-year growth Jumbo and Emerging peers 2015 valuation against 3-year growth
Source: Bloomberg, Eurobank Equities Research
We continue to base our PT on a blended valuation methodology using a combination of DCF and target earnings multiples, as per the table below. At our PT Jumbo would trade at CY2016e PE of 12x, still >30% discount vs. EU retailers.
PE 9.5 € 12.5x 2016 PE, c25% discount to the average of EU and Emerging retailers
EV/EBITDA 9.9 € 7x 2016e EV/EBITDA, c25% discount to the average of EU and Emerging retailers
Average June 2016e fair price 9.7 €
12-month Price Target 10.0 €
Source: Eurobank Equities Research
In more detail, our DCF assumes WACC 12%, medium term EBIT CAGR (years 2015-2024) of 3.7% and long-term growth rate of 1%. It incorporates sustainable NOPAT margins of c15% from c20% in 2019e, as we expect gross margins to trend down towards c50% (albeit still above management’s long-term guidance of 48%). Our DCF assumes cash conversion
Target mcap
PE = 18
PE = 16
PE = 12
PE = 8
PE = 4 Current mcap
0
500
1,000
1,500
2,000
2,500
3,000
Sep-06 Sep-08 Sep-10 Sep-12 Sep-14 Sep-16 Sep-18
Target EV
EV/EBITDA = 12
EV/EBITDA = 10
EV/EBITDA = 8
EV/EBITDA = 6
EV/EBITDA = 3 Current EV
0
500
1,000
1,500
2,000
2,500
Sep-06 Sep-08 Sep-10 Sep-12 Sep-14 Sep-16 Sep-18
Mothercare
WH Smith
Debenhams
Next
M&S
EU retail
Jumbo
Adidas
Carrefour
Colruyt Halfords
Kering
Puma
4.0
5.0
6.0
7.0
8.0
9.0
10.0
11.0
12.0
13.0
14.0
0%
5%
10
%
15
%
20
%
25
%
EV/E
BIT
DA
20
16
e
EBITDA CAGR (3-year)
Teknosa
Lojas Americ. Magnit
Eurocash Fawaz Abdulaziz
Jarir Marketing
Woolworths
Marisa Lojas
Lojas Renner
Grupo Sanborns
Jumbo
4.0
6.0
8.0
10.0
12.0
14.0
16.0
18.0
-10
%
-5%
0%
5%
10
%
15
%
20
%
25
%
30
%
EV/E
BIT
DA
20
16
e
EBITDA CAGR (3-year)
JUMBO
October 07, 2015
5
(OCF/EBITDA) of c73% in the medium term, somewhat lower than the 2014-15 levels (>80%). A summary of our DCF can be seen below:
Jumbo’s results were a bit above our and consensus at operating level with Q4 EBITDA at EUR47m compared with our estimate of EUR42.7m (consensus at EUR44.2mn). This was driven by a 4.2% sales increase (pre-announced) and an impressive 112bps gross margin expansion (EEe -120bps) driven by lower transport costs and positive mix. Overall, for FY15 Jumbo reported sales EUR582.5m (+7.5% yoy) and EBITDA EUR159.3m (+8.7% yoy). Net profit reached EUR104.8m (+3.5% yoy), in line with consensus. Note that this includes a EUR2.7m charge related to the loss from the valuation of corporate bonds at fair value. Excluding this, net profit would have amounted to EUR107.4m, bang in line with our estimate. Regarding Q4 in more detail, sales rose 4% mostly driven by the new capacity. Greece sales were down 0.5%, with store density falling c1.5% yoy (EE -0.5%). Cyprus, Bulgaria and Romania remain on a positive trajectory, with reported sales up 6% in Cyprus and 8% in Bulgaria. On profitability, gross margins rose 112bps in Q4 vs. our expectation for c120bps dilution, with the FX headwind (EUR depreciated c19% vs. the USD) more than offset by the transport cost benefit (SCFI index c36% lower yoy). Product mix was also a tailwind for margins, with seasonal/home items +8% yoy. On the opex side, SG&A in Q4 were up cEUR1.1m yoy, driven by the extra capacity.
Cash generation remained impressive, with Jumbo delivering OCF of EUR138m in FY15 (EEe EUR127m), i.e. c87% of EBITDA. FCF amounted to EUR76m (8% yield). As of end June 2015, Jumbo’s net cash position was EUR158m vs. EUR131m in the same period last year.
JUMBO
October 07, 2015
7
Feedback from the analyst meeting
Current trading: Q1 trading has been quite resilient with group sales +4.9% and with Greece experiencing a mild drop (-1.5%).
Sales guidance: Management expects FY16 sales to grow between 0% and 4%. This is a reasonable range and compares with our current estimate of +4% and consensus +5%. The range is wide given the low visibility in Greece and the uncertainty regarding capacity growth this year (mgt has so far decided on the opening of just one store in Romania). Mgt sees Greek sales between -5% and flat, expects Cyprus to grow 5-8%, Bulgaria 10-12% and Romania c100%.
Profit guidance: As usually, net profit guidance is very conservative with management anticipating net profit to drop 15%-25% yoy, i.e. come in between EUR78m and EUR88m. Although mgt did not elaborate on the exact gross margin assumption it is laboring under, it suggested that it anticipates higher interest rates in the US to push the value of the dollar higher while it considers the low freight rates to be unsustainable.
Our view remains that freight rates will remain a significant tailwind in FY16, and although this positive impact is likely to dissipate over the course of the year, so will the headwind from currency. As a result, our forecast calls for a limited gross margin contraction (65 bps) and net profit declining only marginally yoy. We also remind investors that a year ago mgt was forecasting net profit of EUR90-95m for the 2015 financial year, with the actual number coming in c10% above the upper range of the guidance.
Capital controls: Mgt sounded relaxed about the impact of capital controls on the day-to-day business, but did stress its belief that the restrictions will remain in place “in the foreseeable future”.
Network: Mgt has decided on the opening of one store in Romania for 2016, pointing out that the capacity expansion plan is yet to be finalized and may be modified depending on the situation in Greece. For FY16, most of the focus will be on the optimization of the store network with store closures/replacements/refurbishments etc. As a result, assuming no further store rollouts, capex is not likely to be significantly higher than the EUR15-20m annual maintenance capex. In the medium term, Romania will be the main driver of capacity expansion with management aiming to increase the store network to 12-16 POS vs. 6 stores currently.
Shareholder returns: Mgt reiterated its commitment to distribute 1/3 of profits to shareholders in the form of ordinary dividends. That said, it pointed out that the decision to propose a zero dividend out of FY15 profits is entirely due to the uncertainty in Greece. On our understanding, mgt left open the possibility of a double dividend/capital return after the situation normalizes. It also hinted to increased shareholder returns if it sees that investing in store openings does not yield attractive returns.
JUMBO
October 07, 2015
8
Estimates and assumptions
We have edged down our sales estimates by c2% over FY16-17e mainly on the back of more conservative estimates regarding store roll-outs. - For FY16e, we are now laboring under the assumption of no new capacity in Greece and 2
new stores in Romania (Jumbo has committed to opening one store in Pitesti). The more conservative roll-out plan for FY16 drives down our sales estimates but also lowers the associated opex, with the overall impact on EBITDA being marginal. We still expect gross margins to contract 65bps.
- For FY17e, we assume Jumbo adds 3 new stores (2 leased), largely driving the 5% growth in reported sales. We have assumed limited variation in gross margins in FY17-18e. Our FY17 EBITDA estimate has been lowered by c1%, as we are now somewhat more conservative on the cost side.
Estimate changes
FY16e FY17e
New Sales 592.3 622.9
EBITDA 154.3 169.8
PBT 136.7 154.2
Net profit adj. 103.5 118.4
Previous Sales 605.3 638.3
EBITDA 153.8 172.3
PBT 139.6 160.0
Net profit adj. 105.5 122.4
% change Sales -2% -2%
EBITDA 0% -1%
PBT -2% -4%
Net profit adj. -2% -3%
Source: Company, Eurobank Equities Research
Our detailed estimates by country are presented at the table below:
Jumbo estimates by country EURmn FY'14 FY'15 FY'16e FY'17e FY'18e
Romania Sales 8.8 24.3 47.0 63.1 70.7 % change NA 175% 94% 34% 12% Number of stores 2 6 8 9 10 EBITDA 2.3 6.7 13.0 19.3 22.0 margin 26.0% 27.4% 27.7% 30.5% 31.1%
Source: Company, Eurobank Equities Research. EBITDA is pre-central costs.
JUMBO
October 07, 2015
9
With regard to our assumptions, we would point out the following:
- As far as the Greek business is concerned, we assume flat same-store sales in FY17 (after -6% in FY16) and c3% growth thereafter, well below the historic average (double-digit) given the persistently high unemployment rate in Greece. This will lead to sales per store c20% lower than pre-crisis levels in FY19e. Similarly, we still assume that store profitability will stand c25% lower than pre-crisis levels in FY19e. Having said that, one might think of several cost-saving initiatives such as further rent renegotiations, staff mobility/flexibility, self-service checkouts common in other countries etc., all of which could improve profitability per store.
Jumbo Greece – sales and profit per store (rebased)
Source: Bloomberg, Eurobank Equities Research
- In the short-term, there is clear correlation between Jumbo’s sales and consumer
confidence levels. The latter has clearly been on a downward trajectory since March 2015, having deteriorated markedly in Q2’2015. The stabilization of the respective index in September is a positive sign which might point to trough levels for consumer spending.
- Jumbo Greece – sales per store and consumer confidence (calendar quarters)
Source: Bloomberg, Eurobank Equities Research
60
65
70
75
80
85
90
95
1002
00
9
20
10
20
11
20
12
20
13
20
14
20
15
20
16
20
17
20
18
20
19
Sales per store EBITDA per store
-90.0
-80.0
-70.0
-60.0
-50.0
-40.0
-30.0
-15.0%
-10.0%
-5.0%
0.0%
5.0%
10.0%
Q3
'11
Q4
'11
Q1
'12
Q2
'12
Q3
'12
Q4
'12
Q1
'13
Q2
'13
Q3
'13
Q4
'13
Q1
'14
Q2
'14
Q3
'14
Q4
'14
Q1
'15
Q2
'15
Q3
'15
Sales per store yoy change (left) Consumer confidence (right)
Jumbo is Greece’s largest retailer of toys, baby items, seasonal and decoration items, books and stationery. It operates 53 shops in Greece, 5 in Cyprus, 8 in Bulgaria and another 6 in Romania. Having started as a specialist of toy products in 1986, Jumbo has evolved into more than simply a specialist retailer of toys and baby products. The group has now become one of the biggest retail chains in Greece and is considered to be a “one‐stop” destination for consumers, who can also find books and stationery as well as seasonal and household products in its shops. Jumbo generated c75% of sales in Greece in FY15, though this figure is likely to fall to less than 70% by 2017, on our estimates.
JUMBO
October 07, 2015
12
Group Financial Statements
Balance Sheet
FY to end June (EUR mn) 2014a 2015a 2016e 2017e 2018e
Total Non-current Assets 482.4 533.1 532.7 536.6 533.8
Inventories 186.2 197.8 199.1 207.3 219.9
Trade Receivables 30.7 15.5 15.8 16.6 17.6
Other Receivables 38.5 39.1 39.7 39.7 40.0
Cash & Equivalents 287.6 298.9 410.7 466.9 560.2
Securities 8.6 5.9 0.3 0.0 0.0
Current assets 551.5 557.2 665.6 730.5 837.8
Total Assets 1,033.9 1,090.3 1,198.3 1,267.1 1,371.6
Share Capital & Premium 169.5 169.5 169.5 169.5 169.5
Reserves 575.0 627.7 731.2 817.5 915.1
Minority Interest 0.0 0.0 0.0 0.0 0.0
Total Equity 744.5 797.2 900.7 987.0 1,084.6
LT Loans 143.7 143.9 142.6 141.2 139.9
Provisions 12.4 25.7 25.7 25.7 25.7
Long Term Liabilities 156.1 169.6 168.3 166.9 165.6
ST Loans 21.4 2.9 0.0 1.1 2.4
Trade Payables 52.2 51.4 59.3 68.5 72.7
Other Payables 59.7 69.2 70.0 43.6 46.3
Current liabilities 133.3 123.5 129.3 113.2 121.4
Total Equity & Liabilities 1,033.9 1,090.3 1,198.3 1,267.1 1,371.6
Source: Company, Eurobank Equities Research
JUMBO
October 07, 2015
13
P&L
FY to end June (EUR mn) 2014a 2015a 2016e 2017e 2018e
Turnover 541.8 582.5 592.3 622.9 660.9
change 7.9% 7.5% 1.7% 5.2% 6.1%
Gross Profit 287.8 309.7 311.1 327.5 347.9
Gross margin 53.1% 53.2% 52.5% 52.6% 52.6%
Selling, Administrative & Other Expenses 139.7 148.1 155.7 157.6 159.8
Other Income (net) -1.6 -2.4 -1.0 0.0 0.5
EBITDA - adjusted 146.5 159.3 154.3 169.8 188.5
change 9.3% 8.7% -3.1% 10.1% 11.0%
EBITDA margin 27.0% 27.3% 26.1% 27.3% 28.5%
Depreciation 19.4 21.2 21.4 21.9 22.7
EBIT 127.1 138.0 132.9 147.9 165.9
change 10.4% 8.6% -3.7% 11.3% 12.2%
EBIT margin 23.5% 23.7% 22.4% 23.7% 25.1%
Net Financial Expense / Income 2.9 -1.0 3.8 6.3 8.6
Extraordinary 0.0 0.0 0.0 0.0 0.0
Earnings Before Tax 130.0 137.0 136.7 154.2 174.4
change 35.8% 5.4% -0.2% 12.8% 13.2%
EBT margin 24.0% 23.5% 23.1% 24.7% 26.4%
Recurring tax 28.7 32.1 33.2 35.7 40.1
Recurring Tax Rate 22.1% 23.4% 24.3% 23.2% 23.0%
Corporate levy 0.0 0.0 0.0 0.0 0.0
Earnings After Tax - reported 101.2 104.8 103.5 118.4 134.3
Minorities 0.0 0.0 0.0 0.0 0.0
Net Profit - adjusted 101.2 104.8 103.5 118.4 134.3
change 3.8% 3.5% -1.3% 14.4% 13.4%
Net Profit margin 18.7% 18.0% 17.5% 19.0% 20.3%
EPS - adjusted 0.74 0.77 0.76 0.87 0.99
DPS 0.18 0.18 0.24 0.27 0.31
Source: Company, Eurobank Equities Research
* Extraordinary impact relates to Cyprus deposit levy hit in 2013. DPS includes special dividend in FY15.
JUMBO
October 07, 2015
14
Cash Flow Statement
FY to end June (EUR mn) 2014a 2015a 2016e 2017e 2018e
EBIT 127.1 138.0 132.9 147.9 165.9
Depreciation and Amortization 19.4 21.2 21.4 21.9 22.7
Changes in Working Capital 0.8 8.2 6.5 -26.2 -7.1
Net Interest 1.3 2.3 3.8 6.3 8.6
Tax -18.3 -31.7 -33.2 -35.7 -40.1
Other -0.5 0.2 2.4 4.3 3.4
Net Inflows (Outflows) from Operating Activities 129.8 138.2 133.8 118.5 153.2
Capex -35.9 -59.1 -23.4 -30.2 -23.3
Other investing inflow (outflow) 6.2 -3.4 0.0 0.0 0.0
Net Inflows (Outflows) from Investing Activities -29.7 -62.5 -23.4 -30.2 -23.3
Free Cash Flow 100.1 75.7 110.4 88.3 130.0
Free Cash Flow (adj.) 93.9 79.1 110.4 88.3 130.0
Net dividends paid 0.0 -45.8 0.0 -32.1 -36.7
Net debt (cash) -131.0 -158.0 -268.4 -324.6 -417.9
Source: Company, Eurobank Equities Research
Ratios
Calendar year 2014a 2015a 2016e 2017e 2018e
P/E 14.8 10.4 9.7 8.5 7.6
P/BV 1.7 1.3 1.2 1.1 1.0
P/Sales 2.3 1.9 1.8 1.7 1.6
EV/EBITDA 9.1 5.9 5.0 4.2 3.4
EV/Sales 2.2 3.0 2.1 1.5 1.3
EBIT/Interest expense 20.3 NM NM NM NM
Net Debt/EBITDA (net cash) -0.9 -1.4 -1.8 -2.1 -2.4
Dividend Yield 1.6% 2.3% 3.0% 3.4% 3.8%
ROE 14.1% 12.9% 12.4% 12.8% 13.0%
Free Cash Flow yield 6.7% 8.7% 9.1% 10.0% 12.7%
Dividend payout ratio 24.2% 31.0% 31.0% 31.0% 31.0%
Source: Company, Eurobank Equities Research
JUMBO
October 07, 2015
15
IMPORTANT DISCLOSURES This report has been issued by Eurobank Equities Investment Firm S.A., a member of the Athens Exchange, a member of the Cyprus Stock Exchange and a member of Eurobank Ergasias S.A. Eurobank Equities Investment Firm S.A.. is regulated by the Hellenic Capital Markets Commission (HCMC) with authorization number 6/149/12.1.1999.This report may not be reproduced in any manner or provided to any other persons. Each person that receives a copy by acceptance thereof represents and agrees that it will not distribute or provide it to any other person. This report is not an offer to buy or sell or a solicitation of an offer to buy or sell securities mentioned herein. The investments discussed in this report may be unsuitable for investors, depending on their specific investment objectives and financial position. The investments discussed in this report are subject to risks and in respect of some investments there is risk for multiplied losses to be caused in respect to the capital invested.
The information on this research report is only intended to be available to non U.S. investors and/or residents outside of the United States, Australia, Canada, Japan and South Africa. In certain jurisdictions, including but not limited to the United States, Australia, Canada, Japan and South Africa, the furnishing of such information may be restricted or prohibited by applicable laws. Potential users of the information are requested to inform themselves about and observe any such restrictions, and if you are not permitted to view material on this report or are in any doubt as to whether you are permitted to view these material, please discard/ignore this report.
By reading this research report, you warrant that you are not located in the United States or in any other jurisdiction in which the furnishing of such information may be restricted or prohibited and you agree that you will not transmit or otherwise send any information contained in this report to any person in the United States or to publications with a general circulation in the United States or any other restricted jurisdiction.
Any information provided on this report does not constitute or implicitly substitutes a recommendation for the purchase, sale, subscription, redemption, exchange, retention of a specific financial instrument or the exercise of any right a specific financial instrument grants for the purchase, sale, subscription, exchange or redemption of a financial instrument and thus, it cannot be considered as provision of investment advice or as any solicitation whatsoever.
The information contained herein has been obtained from sources believed to be reliable but it has not been verified by Eurobank Equities Investment Firm S.A.. The opinions expressed herein may not necessarily coincide with those of any member of the Eurobank Group. No representation or warranty (express or implied) is made as to the accuracy, completeness, correctness, timeliness or fairness of the information or opinions herein, all of which are subject to change without notice. No responsibility of liability whatsoever or howsoever arising is accepted in relation to the contents hereof by Eurobank Equities Investment Firm S.A. or any of its directors, officers or employees.
Eurobank Equities Investment Firm S.A. follows procedures under Eurobank Group policies that set up Chinese Walls, restricting communication between Research and other Departments of the Group so that Eurobank Equities Investment Firm S.A. complies with regulations on confidential information and market abuse. Eurobank Equities Investment Firm S.A., or any of its related legal persons, does not hold shareholdings exceeding 5% of the total issued share capital in Jumbo. None of the subject companies mentioned in this report holds shareholdings exceeding 5% of the total issued share capital of Eurobank Equities Investment Firm S.A., or any of its related legal persons. Eurobank Equities Investment Firm S.A., or any of its related legal persons, is a market maker of Jumbo. Eurobank Equities Investment Firm S.A., or any of its related legal persons, is not a party to an agreement relating to the production of this report with Jumbo. EUROBANK Equities Investment Firm S.A, or any of its related investment banking services’ legal persons, has not received compensation for investment banking services provided within the last twelve months from Jumbo. EUROBANK Equities Investment Firm S.A. occasionally trades for own account on investment instruments related to Jumbo.
Analyst Certification: This report has been written by Stamatis Draziotis, CFA (Equity Analyst).
Analyst Compensation: The remuneration of Stamatis Draziotis, CFA is not tied to the investment banking services performed by Eurobank Equities Investment Firm S.A. or any of its related legal persons. Stamatis Draziotis, CFA did not receive or purchase the shares of Jumbo S.A. prior to a public offering of such shares. Stamatis Draziotis, CFA does not have a significant financial interest in one or more of the financial instruments which are the subject of this report or a significant conflict of interest with respect to the subject companies mentioned in this report a) that are accessible or reasonably expected to be accessible to the persons involved in the preparation of this report or b) known to persons who, although not involved in the preparation of this report, had or could reasonably be expected to have access to this report prior to its dissemination to customers or the public. Planned Frequency of Updates: Eurobank Equities Investment Firm S.A. provides daily and monthly updates as well as updates on companies based on company-specific developments or quarterly financial results announcements or any other publicly available information.
Buy: Based on a current 12-month view of total shareholder return (percentage change in share price to projected target price plus projected dividend yield), we recommend that investors buy the stock.
Hold: We adopt a neutral view on the stock 12-months out and, on this time horizon, do not recommend either Buy or Sell.
Sell: Based on a current 12-month view of total shareholder return, we recommend that investors sell the stock.
Restricted: Under Eurobank Group policy and / or regulations which do not allow ratings
Under Review: Our estimates, target price and recommendation are currently under review
Eurobank Equities Investment Firm S.A. Member of Athens Exchange, Cyprus Stock Exchange and Eurobank Group. Regulated by the Hellenic Capital Markets Commission Authorization No: 6/149/12.1.1999 VAT No: 094543092, General Commercial Reg. Num 003214701000