35
2013-14 GRADUATE PROFILE AND TREND REPORT Tim escue, research analyst JULY 2015 1
| Date post: | 28-May-2018 |
| Category: |
Documents |
| Upload: | vuongquynh |
| View: | 213 times |
| Download: | 0 times |

2013-14 GRADUATE PROFILE AND TREND REPORT
Tim escue, research analyst
JULY 2015
1

2013-14 GRADUATE PROFILE AND TREND REPORT CONTENTS
Topic Page Summary of the 2013-14 Graduate Profile and Trend Report ..................................................... 3-6 Report of the 2013-14 Graduates ............................................................................................... 6-35
Table 1 – Graduates by Year and Degree ............................................................................7 Chart 1 – Graduates by Year and Degree ............................................................................7 Table 2A -2B – Top Ten Degree Programs .........................................................................8 Table 3 – Graduates by School ...................................................................................... 9-10 Table 4 – Graduate Ratio ...................................................................................................10 Table 5 – Ethnicity .............................................................................................................11 Table 6 – Graduates by Gender and Degree Type ...................................................... 11-12 Table 7 – Average Age by Degree Type ...........................................................................13 Table 8 – Graduates Who Completed At Least One Academic Skills Advancement Course ................................................................................................................................13 Table 9 – Average Elapsed Time to Completion, by Degree ............................................14 Table 10 – Average and Median GPA, by Degree ............................................................15 Chart 2 – Online Distance Education – Graduates by Year 2003-04 to 2013-14 ……..15 Chart 3 – Percent Change in Graduates 2009-10 to 2012-13 ............................................16 Table 11 – Graduates by Year, Campus, and Region – 2006-07 to 2013-14 ....................17
Appendices ......................................................................................................................................... Appendix 1 – Credentials by Division, Degree, and Program – Total ........................ 18-20 Appendix 1-A – Credentials by Division, Degree, and Program – AAS .................... 21-22 Appendix 1-B – Credentials by Division, Degree, and Program – AS ........................ 23-24 Appendix 1-C – Credentials by Division, Degree, and Program – TC ........................ 25-26 Appendix 1-D – Credentials by Division, Degree, and Program – AA .............................27 Appendix 1-E – Credentials by Division, Degree, and Program – AFA ...........................27 Appendix 1-F – Credentials by Division, Degree, and Program – AGS ...........................27 Appendix 1-G – Credentials by Division, Degree, and Program – CT ....................... 28-29 Appendix 2 – Counties of Residence ........................................................................... 30-32 Appendix 3 – Ratio of Credentials to Enrollment by Division .................................... 33-35
2

JULY 2015
Background: This report provides a statewide descriptive profile and summary of Ivy Tech Community College Credentials in the most recent year for which data are complete – 2013-14 –and three year trends by program and degree. Details by region are available on the infonet. This includes data from summer, fall and spring and data was run on July 3, 2014. Total awards increased 114 percent, from 7,938 to 19,184, in the seven years shown in this report. The 19,184 credentials were awarded to 13,929 unique students. Associate of General Studies (AGS) degrees increased the most followed Technical Certificates (TC).
2,213 2,027 2,252 2,843 3,317 4,6406,5143,253 3,168 3,686
4,5865,184
5,210
5,045
2,098 2,5472,900
3,2183,241
3,266
3,483
25 2335
157490
578292
348 483542
1,264
3,2573,090
3,217198
614
0
2,000
4,000
6,000
8,000
10,000
12,000
14,000
16,000
18,000
20,000
07‐08 08‐09 09‐10 10‐11 11‐12 12‐13 13‐14
AGS
CT
AFA
AA
AS
AAS
TC
2013-14 Graduate Profile and Trend Report Synopsis
3

Graduate Profile & Trend Report – By School, Program and Degree 2013-14 Credentials The chart below shows the trend in awards by school. Note the growth in liberal arts (up 774 percent) and public and social services (up 312 percent) from 2008-09 to 2013-14. In 2013-14, Nursing (both AS and Practical Nursing) comprised just under 8 percent of total awards statewide.
TOP DEGREE PROGRAMS 2013-14
Program Statewide 2013-14
Credentials Percent of 2013-14
Statewide Total General Education Transfer Core(TC) 1,140 6% Nursing(AS) 1,110 6% Business Administration(TC) 989 5% General Studies(AGS) 603 3% Business Administration(AAS) 544 3% Medical Assisting(AAS) 506 3% Medical Assisting(TC) 424 2% Health Care Support(AAS) 384 2% Sub-total 5,700 30%
2,050 2,4503,429
5,106 5,268 5,067272 305
437
554 784 845
120120
136
168 207 347
3,2783,582 1,920
2,5682,917 2,949
267340 561
7531,145
2,333
1,947
1,8351,523
1,465
639699
1,046
1,298
2,076
2,633
1,5851,863
2,461
3,027
2,846
3,238
0
5000
10000
15000
20000
25000
08-09 09-10 10-11 11-12 1213 1314
Ivy Institute
Technology
PublicServicesNursing
Liberal Arts
HealthSciencesFine Arts
Education
Business
AppliedSciences
4

Graduate Profile & Trend Report – By Program and Degree 2013-14 Credentials The programs with 30 or more Credentials state-wide in 2012-13 that showed the most significant growth in 2013-14. These programs include the following:
Programs (With 30 or more grads in 2012-13)
Statewide 2013-14 Credentials
% Change in Statewide Credentials Since 2012-
13
General Education Transfer Core 1,174 796% Engine Performance 157 214% Medical Office Administration 226 115% Outpatient Insurance Coding 132 110% Automotive Electrical/Electronics 99 106% Bldg. Appr. - Ironworker 225 105% Heating and Air Conditioning 301 79% Criminal Justice 800 75% Visual Communications 294 66% Human Services 819 57%
The programs with 30 or more Credentials state-wide in 2012-13 that showed a noteworthy decline in Credentials include the following:
Programs (With 30 or more grads in 2012-13)
Statewide 2013-14 Credentials
% Change in Statewide Credentials Since 2012-13
Bldg. Appr. - Heat Frost Asbestos 12 -71% Culinarian 97 -47% Basic Emergency Medical Skills 60 -44% Bldg. Appr. - Plumber & Pipefitter 75 -42% Health Information Technology 29 -37% Mortuary Science 27 -31% Bldg. Appr. - Sheet Metal Worker 47 -30% Certified Pastry Culinarian 70 -27% Brakes and Suspension 45 -24%
Graduate Characteristics: • Credentials came from every county in Indiana; most frequently from Marion (9 percent), Allen (6 percent) and Lake (5 percent). • The 2013-14 Credentials were predominantly Caucasian (82 percent). African-Americans represented 8 percent of the Credentials and 3 percent described themselves as Latino. • Nearly two-thirds of the 2013-14 Credentials were women (61 percent). • The average age of the 2013-14 Credentials was 33.1 years, while the median age was 30 years. • The percentage of recent Credentials who completed at least one academic skills advancement course increased slightly to 62 percent (from 61 percent in 2012-13).
5

• The average elapsed time from start to completion varied by degree type: (note chart below) The elapsed terms include summer, fall and spring.
Degree Average Elapsed Terms Years Elapsed Time
Average of Actual Terms Enrolled
AAS 18 6 9 AS 18 6 9 AA 18 6 8 AFA 18 6 8 AGS 17 More than 5 8 Technical Certificates 17 More than 5 8 Career Certificates 17 More than 5 8 All 18 6 8
Unduplicated Headcount of Credentials 2008-09 2009-10 2010-11 2011-12 2012-13 2013-14
Headcount 8,252 9,421 10,325 12,324 13,118 13,929
Associate Degree Trend
2008-09 2009-10 2010-11 2011-12 2012-13 2013-14 Headcount 5,740 6,625 7,969 8,939 9,265 9,453
For more information, contact: Tim Escue [email protected]
Ivy Tech Community College of Indiana Institutional Research
50 West Fall Creek Parkway North Drive Indianapolis, Indiana 46208
6

REPORT OF THE 2013-14 CREDENTIALS CREDENTIALS BY YEAR AND DEGREE During the summer, fall, and spring terms of 2013-14, Ivy Tech issued 19,184 credentials, an increase of 2,189 (13 percent) from 2012-13. (Table 1). Technical Certificates (TC) (34 percent of the total) increased 40 percent. Career Certificates (CT), representing between 16 and 27 credit hours, increased by 4 percent and now constitute nearly 17 percent of all completers. Associate degrees (49 percent of the total) were up 4 percent.
o AS (Associate of Science) degrees grew 7 percent to 3,483. o AA (Associate of Arts) degrees decreased 49 percent to 292. o AAS (Associate of Applied Science) degrees decreased 3 percent to 5,045. o AFA (Associate of Fine Arts), degrees increased 46 percent to 19. o AGS (Associate of General Study) increased by 210% to 614.
TABLE 1
Credentials by Year and Degree % of % of
% of Total
% of Total
% of Total
% of Total
% of Total
Total % Change
Year TC Total AAS Total AS AA AFA AGS CT Associate Credentials 2002-03 1,793 33% 3,024 56% 632 12% NA NA NA NA NA NA NA NA 3,656 5,449 19%
2003-04 1,999 34% 3,146 53% 778 13% NA NA NA NA NA NA NA NA 3,924 5,923 9%
2004-05 1,916 30% 3,374 53% 1,025 16% NA NA NA NA NA NA NA NA 4,399 6,315 7%
2005-06 2,084 30% 3,436 49% 1,431 21% 25 0.4% NA NA NA NA NA NA 4,892 6,976 10%
2006-07 2,234 30% 3,311 45% 1,761 24% 27 0% 1 0% NA NA NA NA 5,100 7,334 5%
2007-08 2,213 30% 3,253 44% 2,098 29% 25 0% 1 0% NA NA 348 5% 5,377 7,938 8%
2008-09 2,027 25% 3,168 38% 2,547 31% 23 0% 2 0% NA NA 483 6% 5,740 8,250 4%
2009-10 2,252 27% 3,686 45% 2,900 35% 35 0% 4 0% NA NA 542 7% 6,625 9,419 14%
2010-11 2,843 24% 4,586 38% 3,218 27% 157 1% 8 0% NA NA 1,264 10% 7,969 12,077 28%
2011-12 3,317 21% 5,184 33% 3,241 21% 490 3% 24 0% NA NA 3,257 21% 8,939 15,513 28%
2012-13 4,640 27% 5,210 31% 3,266 19% 578 3% 13 0% 198 1% 3,090 18% 9,265 16,995 10%
2013-14 6,514 34% 5,045 26% 3,483 18% 292 2% 19 0% 614 3% 3,217 17% 9,453 19,184 13%
% Change 40% -3% 7% 49% 46% 210% 4% 4% 13%
CHART 1
0
5,000
10,000
15,000
20,000
25,000
91‐92
92‐93
93‐94
94‐95
95‐96
96‐97
97‐98
98‐99
99‐00
00‐01
01‐02
02‐03
03‐04
04‐05
05‐06
06‐07
07‐08
08‐09
09‐10
10‐11
11‐12
12‐13
13‐14
TotalGraduates
Associate
TechnicalCertificate
Certificates
7

TOP TEN PROGRAMS (All Credential Types)
The top ten degree programs, in terms of total credentials awarded, where all credential types are considered, accounted for 48 percent of all Ivy Tech credentials in 2013-14.
TABLE 2-A Top Ten Programs (All Credential Types)
2008-09 Credentials
2009-10 Credentials
2010-11 Credentials
2011-12 Credentials
2012-13 Credentials
2013-14 Credentials
Percent of Total
Program
1 Business Administration 912 1,038 1,314 1,448 1,753 1,866 10%
2 General Education Transfer Core N/A N/A N/A N/A 131 1,174 6%
3 AS Nursing 1,312 1,520 1,444 1,314 1,149 1,110 6%
4 Medical Assistant 772 837 1,102 1,277 1,219 930 5%
5 General Studies 176 257 467 617 784 852 4%
6 Human Services 177 221 341 376 488 772 4%
7 Criminal Justice 194 207 293 372 456 757 4%
8 Accounting 351 396 517 667 710 626 3%
9 Industrial Technology 365 389 496 588 627 600 3%
10 Computer Information Tech. 123 238 353 507 700 583 3%
Total 4,641 5,395 6,744 7,635 8,363 9,270
Percent of Total 56% 57% 56% 49% 49% 48%
*Top Ten based off credentials awarded in 2013-14
1,039 1,312 1,520 1,444 1,314 1,149 1,140163
228 238 394 531 897 1,110444 485 655 661 614989
330
328352
447 616 605603
466575
676 675 565544
00
109413 453
506
111150
221306 390
424
755
629630
503521 374
384
1749
87
166 365
355
174160
259
276 345
344
0
1000
2000
3000
4000
5000
6000
7000Industrial Technology
Practical Nursing
Health Care Support
Medical Assisting
Medical Assisting
Business Administration
General Studies
Business Administration
Nursing
General Education TransferCor
8

TOP TEN DEGREE PROGRAMS BY SPECIFIC CREDENTIAL
The top ten programs by specific credential accounted for 33 percent of all Ivy Tech credentials in 2013-14, down from the 34 percent of the total they collectively represented in 2012-13
Practical Nursing (TC) was the largest single award-granting program in the college from 2004-07, but declined each year. Since 2007, the AS in Nursing overtook the technical certificate as the largest program.
TABLE 2-B Top Ten Programs by Specific Credentials
2008-09 Credentials
2009-10 Graduates
2010-11 Graduates
2011-12 Graduates
2012-13 Graduates
2013-14 Graduates
Percent of Total Degree Program
1
TC General Education Transfer Core
1,312 1,520 1,444 1,314 1,149 1,140 6%
2 AS Nursing 228 238 394 531 897 1,110 6%
3
TC Business Administration
444 485 655 661 614 989 5%
4 AGS General Studies 328 352 447 616 605 603 3%
5
AAS Business Administration
466 575 676 675 565 544 3%
6 AAS Medical Assisting N/A N/A 109 413 453 506 3%
7 TC Medical Assisting 111 150 221 306 390 424 2%
8 AAS Health Care Support 629 630 503 521 374 384 2%
9 TC Practical Nursing 17 49 87 166 365 355 2%
10
TC Industrial Technology
174 160 259 276 345 344 2%
Total 3,709 4,159 4,795 5,479 5,757 6,399
Percent of Total 45% 44% 40% 35% 34% 33%
CREDENTIALS BY SCHOOL
The 10 percent growth in Credentials overall was driven predominantly by the smaller School of Liberal Arts and the larger schools of Public Services, and Health Sciences.
Percent of Total Percent Change vs. Prior Year
Liberal Arts 17% 104%
Fine Arts 1% 68% In the 2010-11 year, the College created the School of Nursing and moved AS in Nursing
and Practical Nursing from Health Sciences.
9

TABLE 3 Credentials by School
2010-11 2011-12 2012-13 2013-14 12-13 to 13-14 08-09 to 13-14
% of Total
% of Total
% of Total
% of Total
% %
School of Grad Grad Grad Grad Change Change Change Change
Applied Sciences 140 1% 204 1% 186 1% 238 1% 52 28% 199 510% Business 3,429 36% 5,106 33% 5,268 31% 5,067 30% -201 -4% 3,017 147%
Education 437 5% 554 4% 784 5% 845 5% 61 8% 573 211% Fine Arts 136 1% 168 1% 207 1% 347 2% 140 68% 227 189%
Health Sciences 1,920 20% 2,568 17% 2,917 17% 2,949 17% 32 1% -329 -10% Liberal Arts 561 6% 753 5% 1,145 7% 2,333 14% 1,188 104% 2,066 774%
Nursing 1,947 21% 1,835 12% 1,523 9% 1,465 9% -58 -4% N/A N/A Public Services 1,046 11% 1,298 8% 2,076 12% 2,633 15% 557 27% 1,994 312%
Technology 2,461 26% 3,027 20% 2,846 17% 3,238 19% 392 14% 1,653 104% Ivy Institute 43 0% 69 0% 26 60% N/A N/A
Total 12,077 15,513 16,995 19,184 2,189 13% 10,934 106%
TABLE 4 Ratio of Credentials to Enrollment by Division
Fall 2013 End of Term 2013-14 Credential as a percent of
Enrollees Division Total Degree-seeking
Enrollment Graduates Business and Public Service 20,469 5,184 25% Health Science** 21,762 3,637 17% Technology 11,581 2,260 20% University and Transfer 30,642 3,271 11% Undeclared * 2,892 0 0% Total Degree-seeking Enrollment
(Excludes Courses Only Students)
87,346
14,352
16%
* Note: No credentials are shown for "undeclared" category as they have to declare a major in one of the schools in order to graduate. Some programs benefit from undeclared students moving into that course of study. Regional breakdown can be found in the appendix 3. **AS in Nursing and Practical Nursing counted in Health Science.
10

ETHNICITY OF CREDENTIALS Demographically, Credentials can be described as predominately Caucasian, as 82
percent of all Credentials reported this ethnicity. o 68 percent of students enrolled in the fall of 2013 were Caucasian1.
The number of minority Credentials (2,804) increased over the prior year by 338 Credentials.
o Minority Credentials currently account for 14 percent of the total Credentials. Table 5
Ethnicity 2012-13 % of Total 2013-14 % of Total #
Change Year to Year %
Change
White 13,932 82% 15,663 82% 1,731 12% Black or African American 1,376 8% 1,641 9% 265 19%
Hispanic or Latino 533 3% 589 3% 56 11%
Asian 173 1% 183 1% 10 6%
Two or more races 211 1% 310 2% 99 47% Native Hawaiian or Other Pacific Islander 0 0% 9 0% 9 N/A American Indian or Alaska Native 69 0% 72 0% 3 4%
Not Reported 701 4% 717 4% 16 10%
Total 16,995 19,184 2,180 13%
Total Minority Credentials 2,457 14% 2,804 14% 338 14%
CREDENTIALS BY GENDER AND DEGREE TYPE
Nearly two-thirds of Ivy Tech’s Credentials were female (61 percent). o 58 percent of students enrolled in the fall 7of 2013 were female1. o The degree types most predominantly female include:
AS: 74 percent Females vs. 26 percent Males. TC: 60 percent Females vs. 40 percent Males.
o Female Credentials earning an AS degree represented a quarter of the total Credentials (13 percent).
o Students who earned a Career Certificate were likely to be females, 58 percent, compared to 42 percent female Credentials.
o Male and female Credentials earning an AAS degree were more evenly split (45 percent Males and 55 percent Females).
1 Enrollment data are based on End of Term counts.
11

TABLE 6 Credentials by Gender and Degree Type
Gender Degree 2011-12
% of Degree Total 2012-13
% of Degree Total 2013-14
% of Degree Total Change
% Change
Female AFA 13 54% 7 54% 14 74% 7 100%Male AFA 11 46% 6 46% 5 26% -1 -17%
Female AS 2,478 76% 2,461 75% 2,591 74% 130 5%Male AS 763 24% 805 25% 892 26% 87 11%
Female AA 358 73% 406 70% 194 70% -212 -52%Male AA 132 27% 172 30% 98 30% -74 -43%
Female AAS 2,659 51% 2,841 55% 2,784 55% -57 -2%Male AAS 2,525 49% 2,369 45% 2,261 45% -108 -5%
Female AGS 139 70% 411 70% 272 196%Male AGS 59 30% 203 30% 144 244%
Female TC 2,266 68% 2,782 60% 3,741 60% 959 34%Male TC 1,051 32% 1,858 40% 2,773 40% 915 49%
Female CT 1,689 52% 17,88 58% 1,758 58% -30 -2%Male CT 1,568 48% 1,302 42% 1,459 42% 157 12%
Female Total 9,463 61% 10,424 61% 11,493 61% 1,069 10%Male Total 6,050 39% 6,571 39% 7,691 39% 1,120 17%
Total 15,513 16,995 19,184 2,189 13%
PERCENTAGE OF CREDENTIALS BY RACE AND GENDER
45%
55%
40%
60%
45%
55%
42%
58%
48%52%
44%
56%
40%
60%
38%
62%
41%
59%
43%
57%51% 49%
40%
60%
0%
10%
20%
30%
40%
50%
60%
70%
White M
ale
White Female
African
American
Male
African
American
Fem
ale
Hispanic M
ale
Hispanic Fem
ale
Asian
or Pacific Islander M
ale
Asian
or Pacific Islander Fem
ale
American
Indian or Alaskan
Nat
Male
American
Indian or Alaskan
Nat
Female
Male
Female
Percentage of Credentials by Race and Gender
2013‐14 Annual Enrollment 2013‐14 Credentials
12

AVERAGE AGE BY DEGREE TYPE
The average age of an Ivy Tech graduate was 33.1 years, an increase of 2.0 years from the prior year. Small differences in average age exist by degree type (Table 8).
TABLE 7
Average Age by Degree Type
Average Age
Average
Age
Average
Age
Average
Age
Average
Age
Average
Age
Average
Age
Average
Age
Average
Age
Change 2012-13
to 2013-14
Degree 2005-06 2006-07 2007-08 2008-09 2009-10 2010-11 2011-12 2012-13 2013-14 AA 28.5 28.4 26.9 28.7 28.4 29.5 30.1 29.3 29.8 0.5AAS 31.6 31.5 31.4 32.4 31.2 33.5 34.0 33.6 33.5 -0.1AS 31.3 31.3 31.7 32.4 31.0 32 32.6 32.4 32.6 0.2AFA N/A 30.0 25.0 26.0 30.5 34.2 27.2 25.9 39.4 13.5AGS N/A N/A N/A N/A N/A N/A N/A 28.9 30.1 1.2TC 32.7 32.6 32.4 33.0 32.3 34.8 34.6 33.7 32.8 -0.9CT N/A N/A 30.9 31.0 33.6 34.9 34.9 33.9 34.6 0.7
All Degrees
31.9 31.8 31.7 32.4 31.6 33.5 33.9 31.1 33.1 2.0
Age Range by Gender
Gender 18-19 20-24 25-29 30-39 40-49 50-5960 and Older Unknown Totals
Female 47 2,704 2,326 3,103 2,091 955 163 5 11,394Male 47 1,997 1,732 2,201 1,092 490 120 12 7,691Not Reported 4 28 22 14 17 11 1 2 99Totals 98 4,729 4,080 5,318 3,200 1,456 284 19 19,184
CREDENTIALS WHO COMPLETED AT LEAST ONE ACADEMIC SKILLS ADVANCEMENT COURSE
Table 10 shows that 61 percent of all Credentials completed at least one academic skills advancement (remedial math, reading and/or writing) course while at Ivy Tech. This is slightly higher than the nearly 59 percent of Credentials from 2011-12.
TABLE 8
Unique Credentials who completed at least one
Academic Skills Advancement Course
Basic Skills Course 2012-13
% of Total 2013-14 % of Total
No 5,132 39% 5,272 38%
Yes 7,986 61% 8,657 62%
Total 13,118 13,929
13

AVERAGE ELAPSED TIME TO COMPLETION BY DEGREE
Two measures that help define Ivy Tech Credentials are average elapsed number of terms and average actual number of terms attended. Using all types of credentials, on average it took more than 5 years (18 terms) of elapsed terms from start to finish, with students actually attending an average of 9 terms. The terms included are summer, fall and spring.
TABLE 9 Average Time to Completion, by Degree
*Career certificates are newer offerings, and this data may reflect efforts to award CTs as intermediate credentials to students who earned them while pursuing a credential that requires more credit hours.
Degree
Avg. 1st Term of Attendance
Avg. Term of Grad.
Avg. # of Elapsed Terms
Average # of Terms
Enrolled
Avg. # of Missed Terms as % of Elapsed Terms
Sample Size
AAS Summer 2008 (081)
Spring 2014 (133)
18 9 50% 5,045
AS Summer 2008 (081)
Spring 2014 (133)
18 9 50% 3,483
AA Summer 2008 (081)
Spring 2014 (133)
18 8 50% 292
AFA Summer 2008 (081)
Spring 2014 (133)
18 8 50% 19*
AGS Fall 2008 (082) Spring 2014 (133)
17 8 53% 614
TC Fall 2008 (082) Spring 2014 (133)
17 8 53% 6,514
CT Fall 2008 (082) Spring 2014 (133)
17 8 53% 3,217
All Summer 2008 (081)
Spring 2014 (133)
18 8 50%
*Caution: Small sample sizes may result in volatility of measures such as this. AFA degrees have only been awarded in the 4 most recent academic years, and AAs only in the last 5 years which reduced the averages cited.
What this description does not include is detailed information about the number and pattern of missed terms and what proportion of the total terms attended included remedial courses.
14

AVERAGE AND MEDIAN GPA, BY DEGREE
Ivy Tech students graduated with an average grade point average (GPA) of 3.231. This average varied by degree type, however, the average was above 3.0, for all degree types. Table 12 shows the average GPA and median GPA by degree.
TABLE 10
Average/Median GPA, by Degree Average GPA Median GPA
Degree 2009-
10 2010-
11 2011-
12 2012-
13 2013-
14
2009-10
2010-11
2011-12
2012-13
2013-14
AAS 3.246 3.337 3.375 3.266 3.248 3.29 3.4 3.485 3.307 3.288AS 3.288 3.298 3.273 3.306 3.269 3.338 3.343 3.315 3.363 3.305AA 3.436 3.124 3.203 3.088 3.075 3.543 3.156 3.307 3.118 3.098AFA 3.168 3.361 3.358 3.114 3.516 3.168 3.455 3.359 3.25 3.528AGS 3.143 3.085 3.191 3.113TC 3.187 3.279 3.252 3.188 3.188 3.216 3.307 3.3 3.223 3.222CT 3.177 3.254 2.228 3.188 3.206 3.232 3.307 3.375 3.25 3.238
3.242 3.302 3.303 3.231 3.217
3.284 3.347 3.337 3.288 3.257 All Degrees
ONLINE DISTANCE EDUCATION CREDENTIALS BY YEAR – 2003-04 to 2013-14
Programs offered predominantly through distance education classes are a relatively new phenomenon. Online Distance Education Credentials went from 303 to 358, an increase of 18 percent in the most recent year. As the chart below shows, online Credentials have risen considerably since 2003-04.
10 14 20 22 22 27 23 50 5180 80
3 6 8 12 12 1715 25
35 47
414
20
2331
3
619
2328
5 7
1817
1917
1 4
1117
3043
1 1 14
12
13
1712
7 8 9 15 6 35
10
11
26
39
13
7
8
22
24
1
3
2
11
13
0
0
1
13
17
0
100
200
300
400
2003‐04 2004‐05 2005‐06 2006‐07 2007‐08 2008‐09 2009‐10 2010‐11 2011‐12 2012‐13 2013‐14
Online Credentials
Paralegal Studies Human ServicesBusiness Administration AccountingLibrary Technician Criminal JusticeComputer Information Systems Early Childhood Education
15

CREDENTIALS BY YEAR, REGION, AND CAMPUS
The regions with the largest percentage increase in Credentials from the prior year were:
Percent Change vs. Prior Year Region 2 – North Central +89% Region 1 - Northwest +26% Region 14- Bloomington +21%
The campuses with the strongest growth in Credentials were: Percent Change vs. Prior Year Elkhart +100% Warsaw +88% South Bend +87% The campuses with the sharpest decline were: Percent Change vs. Prior Year Logansport -12% Lafayette -10%
CHART 4 PERCENT CREDENTIALS BY REGION
‐10%0%10%20%30%40%50%60%70%80%90%
26%
89%
16%
‐10%
13% 20%7%
‐5%
7% 6% 10%
‐5%
12%21%
16

TABLE 11 Credentials by Year, Region and Campus - 2007-08 to 2013-14
2012-13 to 2013-14 Campus 07-08 08-
09 09-10
10-11 11-12 12-13 13-14 Change %Change
Gary 217 239 235 371 399 545 659 114 21% Valparaiso 227 179 246 276 508 658 909 251 38% East Chicago 56 38 81 99 217 271 359 88 32% Michigan City 70 84 63 60 134 193 178 -15 -8% Total-Region 1 570 540 625 806 1,258 1,667 2,105 438 26% South Bend 397 448 539 685 766 682 1,275 593 87% Warsaw 52 42 70 85 122 112 210 98 88% Elkhart 52 44 105 106 155 168 336 168 100% Total-Region 2 501 534 714 876 1,043 962 1,821 859 89% Total-Region 3 (Fort Wayne) 959 884 908 1,156 1,739 1,471 1,701 230 16% Total-Region 4 (Lafayette) 662 674 893 1,247 1,362 1,350 1,220 -130 -10% Kokomo 292 397 485 753 707 767 898 131 17% Logansport 46 65 61 130 126 129 114 -15 -12% Total-Region 5 338 462 546 883 833 896 1,012 116 13% Muncie 375 474 560 589 952 1,006 1,120 114 11% Anderson 188 158 225 237 283 399 505 106 27% Marion 87 88 90 113 172 213 324 111 52% Total-Region 6 650 720 875 939 1,407 1,618 1,949 331 20% Total-Region 7 (Terre Haute) 615 546 520 669 846 908 975 67 7% Total-Region 8 (Indianapolis) 999 1,161 1,232 1,471 1,819 2,459 2,328 -131 -5% Total-Region 9 (Richmond) 301 374 464 590 762 786 843 57 7% Total-Region 10 (Columbus) 365 404 591 647 803 1,015 1,077 62 6% Madison 138 109 138 225 238 270 247 -23 -9% Lawrenceburg 116 126 153 260 341 356 441 85 24% Total-Region 11 254 235 291 485 579 626 688 62 10% Total-Region 12 (Evansville) 568 632 681 740 1,342 1,320 1,251 -69 -5% Total-Region 13 (Sellersburg) 539 524 577 815 870 1,018 1,140 122 12% Total-Region 14 (Bloomington) 579 554 482 729 826 876 1,060 184 21% Distance Appr 38 6 21 24 24 23 14 -9 -39% Total-College 7,938 8,250 9,420 12,077 15,513 16,995 19,184 2,189 13%
17

Program 07-08 08-09 09-10 10-11 11-12 12-13 13-14 Change % ChangeSchool of Applied Science and Engineering
Agriculture N/A N/A 15 38 73 88 93 5 6%Biotechnology 35 32 24 40 35 38 39 1 3%Chemical Technology 7 4 7 6 5 0 5 5 500%Computer Science N/A N/A N/A N/A N/A N/A 1 1 100%Electrical Engineering Technology 1 0 1 11 6 22 20 -2 -9%Engineering Technology N/A N/A N/A N/A N/A 11 29 18 164%Mechanical Engineering Technology N/A N/A N/A 7 19 23 35 12 52%Nanotechnology N/A N/A N/A N/A N/A N/A 4 4 400%Pre-Engineering 2 3 2 6 5 4 11 7 175%
46 39 49 140 143 186 237 51 27%
Accounting 403 351 396 517 686 733 654 -79 -11%Advanced Forensics N/A N/A N/A N/A N/A N/A 3 N/A N/ABookkeeper 98 92 119 211 678 343 281 -62 -18%Business Administration 748 912 1,038 1,314 1,468 1,776 1,897 121 7%Computer Information Systems 287 200 211 302 391 482 398 -84 -17%Computer Information Technology 53 123 238 353 507 700 583 -117 -17%Database N/A N/A 2 4 2 8 8 0 0%Data Security N/A N/A N/A N/A 1 2 5 3 150%Enrolled Agent N/A N/A N/A N/A N/A N/A 3 3 N/AFundamental Payroll 36 65 90 140 529 254 276 22 9%Human Resources Management N/A 1 7 16 50 55 61 6 11%Information Security N/A N/A 2 2 3 15 26 11 73%Java N/A N/A 3 7 19 15 21 6 40%Microsoft Office Specialist N/A 2 3 12 15 15 23 8 53%Transportation, Distribution and Logistics 1 4 5 1 3 0 0 0 0%Network Administration 9 16 13 32 78 75 73 -2 -3%Network Penetration Testing N/A N/A N/A N/A N/A N/A 3 3 N/ANetwork Security N/A N/A N/A 1 1 5 2 -3 -60%Office Administration 371 253 289 408 450 493 403 -90 -18%PC Support and Administration 17 9 12 52 83 247 283 36 15%Routing and Switching 44 7 1 21 26 13 25 12 92%Supply Chain Management N/A N/A N/A N/A N/A 3 5 2 67%Systems Security N/A 3 5 7 38 9 17 8 89%Visual Programming 12 9 7 13 52 18 5 -13 -72%Web Management 5 3 9 16 26 7 12 5 71%
2,084 2,050 2,450 3,429 5,106 5,268 5,067 -125 -4%
Chidhood Development Associate N/A N/A N/A 17 27 113 25 -88 -78%
Early Childhood Administration N/A N/A N/A N/A N/A 3 6 3 100%
Early Childhood Education 266 247 222 286 343 485 578 93 19%Early Child Ed CDA Process N/A N/A N/A N/A N/A N/A 39 39 N/AEdcuation 7 25 83 134 184 183 195 12 7%Indiana Youth Development Prof N/A N/A N/A N/A N/A N/A 2 2 N/A
273 272 305 437 554 784 845 61 8%
Environmental (Interior) Design 18 23 19 18 19 17 31 14 82%Fine Arts 1 2 3 6 20 13 17 4 31%Landscape Technician N/A N/A N/A N/A N/A N/A 5 5 N/AVisual Communications 109 95 98 112 129 177 294 117 66%
128 120 120 136 168 207 347 140 68%
Basic Emergency Medical Skills N/A N/A N/A 57 81 108 60 -48 -44%Dental Assistant 65 69 79 82 81 90 76 -14 -16%Dental Hygiene N/A N/A 13 28 27 26 27 1 4%Direct Support Professional N/A N/A N/A N/A 1 0 0 0 0%Electrocardiography Technician N/A N/A N/A 1 23 55 57 2 4%Electroneurodiagnostics N/A N/A N/A 2 0 0 0 0 0%Health Care Support N/A N/A N/A 3 112 255 388 133 52%Health Information Technology 8 14 10 26 34 46 29 -17 -37%
School of Business
School of Fine Arts and Design
APPENDIX 1
Total School of Edcuation
School of Health Sciences
Total School of Applied Science and Engineering Technology
Total School of Business
Total School of Fine Arts and Design
School of Education
18

Program 07-08 08-09 09-10 10-11 11-12 12-13 13-14 Change % ChangeAPPENDIX 1
Imaging Sciences 56 66 42 67 78 70 83 13 19%Kinesiology 1 0 2 6 0 5 5 0 0%Medical Assistant 747 772 837 1102 1277 1219 930 -289 -24%Medical Laboratory Technician 23 28 28 28 48 39 47 8 21%Medical Office Administration N/A N/A N/A N/A N/A 105 226 121 115%Neurodiagnostics Technology N/A N/A N/A N/A N/A 2 3 1 50%Outpatient Insurance Coding N/A N/A N/A N/A N/A 63 132 69 110%Paramedic Science 58 62 82 101 84 99 110 11 11%Patient Care N/A N/A N/A N/A N/A 8 11 3 38%Pharmacy Technician N/A N/A N/A 43 59 109 88 -21 -19%Phlembotomy Technician N/A N/A N/A 68 325 254 284 30 12%Physical Therapist Assistant 32 44 43 37 45 55 55 0 0%Polysomnography N/A N/A N/A N/A N/A 4 9 5 125%Radiation Therapy 8 8 31 8 5 6 8 2 33%Respiratory Care 108 139 121 130 136 137 129 -8 -6%Surgical Technology 107 120 121 112 117 112 124 12 11%Therapeutic Massage 44 15 25 25 33 50 68 18 36%
1,256 1,337 1,432 1,920 2,566 2,917 2,949 32 1%
General Liberal Studies - VU 0 0 0 0 0 0 0 0 0%General Education Transfer CoreStudies N/A N/A N/A N/A N/A 131 1,174 1,043 796%General Studies 127 176 257 467 619 795 865 70 9%General Technical Studies 0 0 0 0 1 0 0 0 0%Liberal Arts 104 86 78 85 120 213 284 71 33%Professional Communication 0 5 5 9 13 6 11 5 83%
231 267 340 561 753 1,145 2,334 1,189 104%
AS in Nursing 1,039 1,312 1,520 1,444 1,314 1,149 1,110 -39 -3%Practical Nursing 755 629 630 503 521 374 355 -19 -5%
1,794 1,941 2,150 1,947 1,835 1,523 1,465 -58 -4%
Addiction Studies N/A N/A N/A N/A N/A 10 19 9 90%Certified Pastry Culinarian N/A N/A N/A N/A 11 96 70 -26 -27%Community Emergency Prep N/A N/A N/A N/A N/A 1 0 -1 -100%Criminal Justice 175 194 207 293 372 456 800 344 75%Culinarian N/A N/A N/A 8 29 183 97 -86 -47%Dietary Management N/A N/A N/A N/A N/A 2 0 -2 -100%Direct Support Professional N/A N/A N/A N/A N/A 1 0 -1 -100%Driver/Operator N/A N/A N/A 1 0 3 4 1 33%Elder Care Profressional N/A N/A N/A N/A 1 1 5 4 400%Fire Prevention/Investigation N/A N/A N/A N/A 3 5 6 1 20%Homeland Security/Emergency N/A N/A N/A N/A N/A 7 12 5 71%Hospitality Administration 94 90 85 149 215 330 361 31 9%Hospitality Management N/A N/A N/A N/A N/A 100 115 15 15%Human Services 170 177 221 341 376 523 819 296 57%Library Technical Assistant N/A 5 7 18 17 19 17 -2 -11%Mortuary Science 13 16 17 22 22 39 27 -12 -31%Paralegal Studies 114 127 108 158 171 219 215 -4 -2%Public Safety 19 30 54 47 71 62 59 -3 -5%Substance Abuse N/A N/A N/A 9 12 19 8 -11 -58%
585 639 699 1,046 1,300 2,076 2,634 558 27%
Advanced Manufacturing N/A N/A 2 10 13 13 30 17 131%Alternative Fuels N/A N/A N/A 3 0 0 0 0 0%Automation Controls N/A N/A N/A N/A 1 0 3 3 300%Automotive Electrical/Electronics 19 59 41 51 187 48 99 51 106%Automotive Technology 155 132 113 120 149 198 213 15 8%Aviation Technology/Avionics 0 0 1 2 0 5 11 6 120%Brakes and Suspension 35 55 42 60 75 59 45 -14 -24%Building Construction Management 5 6 1 10 12 7 10 3 43%Construction Technology 87 80 86 142 99 102 82 -20 -20%Construction Technician N/A N/A 1 4 13 40 34 -6 -15%Design Technology 199 146 179 203 190 230 197 -33 -14%Diesel Electronic Controls N/A N/A N/A N/A 7 1 0 -1 -100%Electric and Hybrid Vehicle N/A N/A N/A 5 0 0 0 0 0%Electronics and Computer Technology 63 37 46 46 47 43 45 2 5%
School of Technology
Total School of Nursing
Total School of Health SciencesSchool of Liberal Arts and Sciences
Total School of Liberal Arts and SciencesSchool of Nursing
Total School of Public and Social Services
School of Public and Social Services
19

Program 07-08 08-09 09-10 10-11 11-12 12-13 13-14 Change % ChangeAPPENDIX 1
Energy Technology N/A N/A N/A N/A 9 68 90 22 32%Sustainable Energy N/A N/A 7 21 58 24 4 -20 -83%Engine Performance 27 38 30 30 177 50 157 107 214%Fluid Power N/A 2 9 16 103 54 59 5 9%Heating and Air Conditioning 23 55 77 197 272 168 301 133 79%Industrial Electrician 1 0 25 44 25 31 38 7 23%Industrial Machining N/A N/A N/A N/A 5 2 17 15 750%Machine Tool 1 1 4 12 24 5 1 -4 -80%Machine Tool Technology 6 2 3 2 4 5 39 34 680%Manufacturing Production and Oper N/A N/A N/A 8 4 14 18 4 29%Industrial Technology 398 365 389 568 628 648 591 -57 -9%Power Train 21 47 25 57 54 52 52 0 0%Structural Welding N/A 4 1 40 116 84 77 -7 -8%Substation Mechanic 1 0 0 0 0 0 0 0 0%Truck Chassis Systems N/A N/A N/A N/A 1 0 0 0 0%
1,541 1,585 1,870 2,486 3,085 2,846 3,235 389 21%
Advanced Manufacturing N/A N/A N/A N/A N/A N/A 11 11 N/AAutomotive Technology N/A N/A N/A N/A N/A N/A 21 21 N/AHVAC N/A N/A N/A N/A N/A 3 10 7 233%Industrial Technology N/A N/A N/A N/A N/A N/A 16 16 N/AMachine Tool Technology N/A N/A N/A N/A N/A 22 11 -11 -50%Mechatronics N/A N/A N/A N/A 3 0 1 1 100%Welding N/A N/A N/A N/A N/A 18 1 -17 -94%
N/A N/A N/A N/A N/A 43 71 28 65%7,938 8,250 9,415 12,102 15,510 16,995 19,184 2,189 18%Total Degrees Awarded
Ivy InstitueTotal School of Technology
Total School of Technology
20

Program 06-07 07-08 08-09 09-10 10-11 11-12 12-13 13-14 Change % Change
Agriculture N/A N/A N/A 14 32 65 70 68 -2 -3%
Biotechnology 11 21 7 5 12 9 10 9 -1 -10%Chemical Technology 3 7 4 7 6 5 0 5 5 500%
14 28 11 26 50 79 80 82 2 3%
Accounting 228 245 228 225 272 348 300 270 -30 -10%Business Administration 404 400 466 575 676 675 584 567 -17 -3%Computer Information Systems 320 235 148 145 183 227 170 187 17 10%Computer Information Technology 10 46 106 189 266 341 334 320 -14 -4%Information Security N/A N/A N/A 2 2 3 8 21 13 163%Office Administration 273 245 190 202 283 269 212 178 -34 -16%
1,235 1,171 1,138 1,338 1,682 1,863 1,608 1,543 -65 -4%
Early Childhood Education 127 143 107 95 99 126 180 173 -7 -4%127 143 107 95 99 126 180 173 -7 -4%
Environmental Design 21 18 22 18 18 18 16 11 -5 -31%Visual Communications 77 102 91 96 108 120 173 150 -23 -13%
98 120 113 114 126 138 189 161 -28 -15%
Electroneurodiagnostics N/A N/A N/A N/A 2 0 0 0 0 0%Health Care Support N/A N/A N/A N/A 3 112 253 386 133 53%Medical Assistant 295 331 328 352 447 616 605 506 -99 -16%Medical Laboratory Technician 19 23 28 28 28 48 39 47 8 21%Neurodiagnostics Technology N/A N/A N/A N/A N/A N/A 2 3 1 50%Paramedic Science 9 15 20 8 9 3 1 31 30 3000%Imaging Sciences 0 0 0 0 0 0 0 4 4 400%Respiratory Care 0 0 0 0 0 0 0 0 0 0%Surgical Technology 114 97 112 116 103 12 0 3 3 300%Therapeutic Massage 12 23 11 11 15 14 13 22 9 69%
449 489 499 515 607 805 913 1,002 89 10%
Criminal Justice 61 87 105 121 175 223 261 273 12 5%Hospitality Administration 66 82 74 78 121 141 228 251 23 10%Human Services 28 32 47 59 92 107 148 143 -5 -3%Mortuary Science 18 13 16 17 22 22 39 27 -12 -31%Paralegal Studies 77 85 84 75 110 134 174 154 -20 -11%Public Safety 27 19 29 46 46 63 55 48 -7 -13%
277 318 355 396 566 690 905 896 -9 -1%
Advanced Manufacturing N/A N/A N/A 2 10 13 11 16 5 45%
Automotive Technology 94 91 75 67 63 81 107 100 -7 -7%Aviation Technology/Avionics 3 0 0 1 2 0 5 11 6 120%Bldg. Appr. - Boilermaker 5 0 4 1 8 20 15 8 -7 -47%Bldg. Appr. - Bricklayer 8 11 0 17 8 23 7 13 6 86%Bldg. Appr. - Carpenter 42 53 61 135 124 146 109 70 -39 -36%Bldg. Appr. - Electrical Lineman 10 11 1 9 9 19 19 27 8 42%Bldg. Appr. - Electrician 229 161 233 262 239 248 193 196 3 2%Bldg. Appr. - Elevator Constructor 34 17 8 17 19 12 15 7 -8 -53%Bldg. Appr. - Floor Layers N/A N/A N/A 1 1 1 2 1 -1 -50%Bldg. Appr. - Glaziers N/A N/A N/A N/A N/A N/A 1 0 -1 -100%Bldg. Appr. - Heat Frost Asbestos N/A N/A N/A 5 13 3 42 7 -35 -83%
School of Fine Arts and Design
School of Applied Science and Engineering Technology
Total School of Applied Science and Engineering Technology
Total School of Business School of Education
Appendix 1-AAssociate of Applied Science
School of Business
School of Health Sciences
School of Public and Social Services
Total School of Education
Total School of Fine Arts and Design
Total School of Health Sciences
Total School of Public and Social ServicesSchool of Technology
21

Program 06-07 07-08 08-09 09-10 10-11 11-12 12-13 13-14 Change % Change
Appendix 1-AAssociate of Applied Science
Bldg. Appr. - Ironworker 39 14 18 87 146 75 76 123 47 62%Bldg. Appr. - Millwright 11 4 10 16 37 48 26 15 -11 -42%Bldg. Appr. - Operating Engineers 0 0 0 1 0 0 0 0 0 0%Bldg. Appr. - Painter N/A N/A 2 0 5 4 2 3 1 50%Bldg. Appr. - Plumber & Pipefitter 141 134 116 109 164 130 79 30 -49 -62%Bldg. Appr. - Plumber & Steamfitter N/A N/A N/A N/A N/A 27 21 14 -7 -33%Bldg. Appr. - Sheet Metal Worker 33 31 10 23 26 22 44 24 -20 -45%Bldg. Appr. – Telecommunications Tech 2 2 12 17 13 0 2 5 3 150%Building Construction Mamagement 5 5 5 1 10 11 5 10 5 100%Construction Technology 41 49 47 43 65 56 46 27 -19 -41%Design Technology 110 132 109 116 126 105 105 93 -12 -11%Electronics and Computer Technology 63 48 31 37 39 43 37 24 -13 -35%Energy Technology N/A N/A N/A N/A N/A 5 21 32 11 52%Sustainable Energy N/A N/A N/A 3 10 26 17 4 -13 -76%Heating/Ventilation N/A N/A N/A N/A N/A 2 9 63 54 600%Indust. Appr.-Electrician 7 7 0 9 3 2 3 10 7 233%Indust. Appr.-Facilities Maintenance 0 1 0 0 0 0 0 0 0 0%Indust. Appr.-Htg./Vent./Air. 0 0 0 0 1 0 0 0 0 0%Indust. Appr.-Industrial Mechanic 0 1 16 0 0 0 0 0 0 0%Indust. Appr.-Machine Repair 7 4 3 0 3 1 1 0 -1 -100%Indust. Appr.-Mech-Gas/Elec 0 0 0 0 0 0 0 0 0 0%Indust. Appr.-Millwright 3 1 0 3 1 1 0 2 2 200%Indust. Appr.-Mold/Die Maker 2 1 0 0 0 0 0 0 0 0%Indust. Appr.-Pattern Repair 1 0 0 0 0 0 0 0 0 0%Indust. Appr.-Plumber/Pipefitter 0 0 0 0 0 0 0 0 0 0%Indust. Appr.-Power Plant Operator 0 0 0 0 0 0 0 0 0 0%Indust. Appr.-Sheet Metal Worker 0 1 0 0 0 0 0 0 0 0%Indust. Appr.-Tool Maker 10 3 3 4 0 4 2 0 -2 -100%Machine Tool Technology 3 6 2 3 2 4 4 11 7 175%Manufacturing & Industrial Technology 207 195 179 213 309 351 301 232 -69 -23%Manufacturing Prod, Operation N/A N/A N/A N/A N/A N/A 8 10 2 25%Quality Science 0 0 0 0 0 0 0 0 0 0%Substation Mechanic 1 1 0 0 0 0 0 0 0 0%
1,111 984 945 1,200 1,456 1,483 1,335 1,188 -147 -11%3,311 3,253 3,168 3,684 4,586 5,184 5,210 5,045 -165 -3%Total AAS Degrees Awarded
Total School of Technology
22

Program 06-07 07-08 08-09 09-10 10-11 11-12 12-13 13-14 Change % Change
Agriculture N/A N/A N/A 1 6 8 18 25 7 39%Biotechnology 7 14 25 19 28 26 28 30 2 7%Computer Science N/A N/A N/A N/A N/A N/A N/A 1 N/A N/AElectrical Engineering Technology N/A 1 0 1 11 6 22 20 -2 -9%Engineering Technology N/A N/A N/A N/A N/A N/A 11 29 18 164%Mechanical Engineering Technology N/A N/A N/A N/A 7 19 23 35 12 52%Nanotechnology N/A N/A N/A N/A N/A N/A N/A 4 N/A N/APre-Engineering 1 2 3 2 6 5 4 11 7 175%
8 18 28 23 64 64 106 155 44 46%
Accounting 14 21 12 21 24 32 43 51 8 19%Business Administration 147 185 218 225 244 262 291 336 45 15%Computer Information Systems 5 16 13 12 12 22 33 33 0 0%Transportation, Distribution and Logistics 1 1 4 5 1 3 3 4 1 33%Office Administration 2 1 0 0 0 0 1 0 -1 -100%
169 224 247 263 281 319 371 424 53 14%
Early Childhood Education 76 71 83 70 83 118 97 113 16 16%Education N/A 7 25 83 134 184 183 194 11 6%
76 78 108 153 217 302 280 307 27 10%
Interior Design N/A N/A 1 1 0 1 1 0 -1 -100%Visual Communications 2 7 4 1 2 5 4 10 6 150%
2 7 5 2 2 6 5 10 5 100%
Dental Hygiene N/A N/A N/A 13 28 27 26 27 1 4%Health Information Technology N/A 8 14 10 26 34 46 29 -17 -37%Kinesiology N/A 1 0 2 6 0 5 5 0 0%Paramedic Science 26 43 42 74 92 81 98 79 -19 -19%Physical Therapy Assistant 41 32 44 43 37 45 55 55 0 0%Radiation Therapy N/A 8 8 31 8 5 6 8 2 33%Imaging Science 58 56 66 42 67 78 70 79 9 13%Respiratory Care 109 108 139 121 130 136 137 129 -8 -6%Surgical Technology 10 10 8 5 9 105 112 121 9 8%
244 265 321 341 403 511 555 532 -23 -4%
General Studies 125 127 175 257 358 206 144 66 -78 -54%Liberal Arts 61 79 63 43 37 43 88 182 94 107%Professional Communications 3 0 5 5 9 13 6 5 -1 -17%
189 206 243 305 404 262 238 253 15 6%
AS in Nursing 772 1,039 1,312 1,520 1,444 1,314 1,149 1,110 -39 -3%772 1,039 1,312 1,520 1,444 1,314 1,149 1,110 -39 -3%
Community Emergency Prep N/A N/A N/A N/A N/A N/A 8 12 4 50%Criminal Justice 91 88 89 86 118 149 195 231 36 18%Hospitality Administration N/A N/A 2 0 2 2 1 3 2 200%Human Services 146 113 113 138 198 228 260 346 86 33%Liberary Technical Assistant N/A N/A 5 7 18 17 19 17 -2 -11%Paralegal Studies 42 29 43 33 48 37 45 61 16 36%
279 230 252 264 384 433 528 670 142 27%
Automotive Technology 0 0 0 0 1 1 1 1 0 0%Building Construction Management N/A N/A 1 0 0 1 2 0 -2 -100%Bldg. Appr. – Carpenters N/A N/A N/A 1 0 0 0 0 0 0%Bldg. Appr. – Electricians N/A N/A 2 0 0 0 0 0 0 0%Bldg. Appr. – Ironworkers N/A N/A 2 0 0 1 0 0 0 0%Bldg. Appr. – Millwrights N/A N/A N/A N/A N/A N/A 1 0 -1 -100%Bldg. Appr. – Plumber/Pipefitter N/A N/A N/A N/A 2 0 0 0 0 0%Bldg. Appr. – Sheet Metal Workers 1 3 0 0 0 0 0 0 0 0%
Appendix 1-BAssociate of Science
Total School of Applied Science and Engineering Technology
School of Education
School of Business
Total School of EducationSchool of Fine Arts and Design
Total School of Public and Social Services
School of Applied Science and Engineering Technology
Total School of Liberal Arts and Sciences
Total School of Business
School of Liberal Arts and Sciences
School of Nursing
Total School of Fine Arts and DesignSchool of Health Sciences
School of Public and Social Services
School of Technology
Total School of Health Sciences
Total School of Nursing
23

Program 06-07 07-08 08-09 09-10 10-11 11-12 12-13 13-14 Change % Change
Appendix 1-BAssociate of Science
Design Technology 14 13 19 19 15 22 25 20 -5 -20%Electronics and Computer Tech 7 15 6 9 7 4 5 1 -4 -80%Manufact & Industrial Technology 0 0 1 0 0 1 0 0 0 0%
22 31 31 29 25 30 34 22 -12 -35%1,761 2,098 2,547 2,900 3,224 3,241 3,266 3,483 217 7%
Total School of TechnologyTotal AS Degrees Awarded
24

Program 06-07 07-08 08-09 09-10 10-11 11-12 12-13 13-14 Change % Change
Sustainable Energy N/A N/A N/A 4 11 32 7 0 -7 -100%
Accounting 74 137 111 150 221 306 390 333 -57 -15%Business Administration 73 163 228 238 394 531 901 994 93 10%Computer Information Systems 56 36 39 54 107 141 286 176 -110 -38%Computer Information Technology 1 7 17 49 87 166 365 268 -97 -27%Office Administration 93 125 63 87 125 179 272 211 -61 -22%
297 468 458 578 934 1,323 2,214 1,982 -232 -10%
Early Childhood Education 58 52 57 57 104 99 201 278 77 38%
Environmental Design N/A N/A N/A N/A N/A N/A N/A 20 N/A N/AVisual Communications N/A N/A N/A N/A N/A N/A N/A 132 N/A N/A
0 0 0 0 0 0 0 152 152 N/A
General Studies 1 0 1 0 0 1 0 1 1 100%Genderal Education Transfer Core N/A N/A N/A N/A N/A N/A N/A 1,140 1,140 N/A
Dental Assistant 66 65 69 79 82 81 90 76 -14 -16%Medical Assistant 376 416 444 485 655 661 614 424 -190 -31%Therapeutic Massage 9 21 4 14 9 14 18 28 10 56%
451 502 517 578 746 756 722 528 -194 -27%
Practical Nursing 1,088 755 629 630 503 521 374 355 -19 -5%
Criminal Justice N/A N/A N/A N/A N/A N/A N/A 296 296 N/AHospitality Administration 11 12 14 7 26 55 101 106 5 5%Human Services 8 25 17 24 51 41 115 330 215 187%Public Safety 1 0 1 8 1 8 7 11 4 57%
20 37 32 39 78 104 223 743 520 233%
Advanced Manufacturing N/A N/A N/A N/A N/A N/A 2 14 12 600%Automotive Technology 43 64 57 46 56 67 89 112 23 26%Bldg. Appr. - Heat Frost Insulatr N/A N/A N/A N/A N/A N/A N/A 5 N/A N/ABldg. Appr. - Boilermaker 0 0 0 0 0 0 5 0 -5 -100%Bldg. Appr. - Bricklayer 12 6 0 26 2 4 12 16 4 33%Bldg. Appr. – Carpenter 0 0 0 0 0 0 16 71 55 344%Bldg. Appr. – Cement Mason N/A N/A N/A N/A N/A 1 0 0 0 0%Bldg. Appr. – Electrician 6 14 16 5 4 0 81 173 92 114%Bldg. Appr. – Glaziers N/A N/A N/A 1 0 0 1 0 -1 -100%Bldg. Appr. - Ironworker 0 5 10 14 0 3 34 102 68 200%Bldg. Appr. - Millwright 0 0 0 0 0 0 1 12 11 1100%Bldg. Appr. – Operating Engineer 0 0 1 3 2 10 7 12 5 71%Bldg. Appr. – Painters 1 1 2 0 1 5 0 3 3 300%Bldg. Appr. – Plumber & Pipefitter 1 10 15 17 0 1 51 45 -6 -12%Bldg. Appr. - Sheet Metal Worker 0 0 0 0 0 0 23 23 0 0%Bldg. Appr. – Telecommunications Tech 0 2 0 0 0 0 2 5 3 150%Construction Technology 35 38 33 43 77 43 56 55 -1 -2%Design Technology 27 54 18 44 62 63 100 84 -16 -16%Electronics Technology N/A N/A N/A N/A N/A N/A 1 20 19 1900%Energy Technology N/A N/A N/A N/A N/A 4 47 58 11 23%
Appendix 1-CTechnical Certificates
School of Applied Science and Engineering Technology
School of Education
Total School of Health Sciences
Total School of Public and Social Services
School of Business
Total School of Business
School of Technology
School of Nursing
School of Fine Arts and Design
Total School of Fine Arts and DesignSchool of Liberal Arts and Sciences
School of Health Sciences
School of Public and Social Services
25
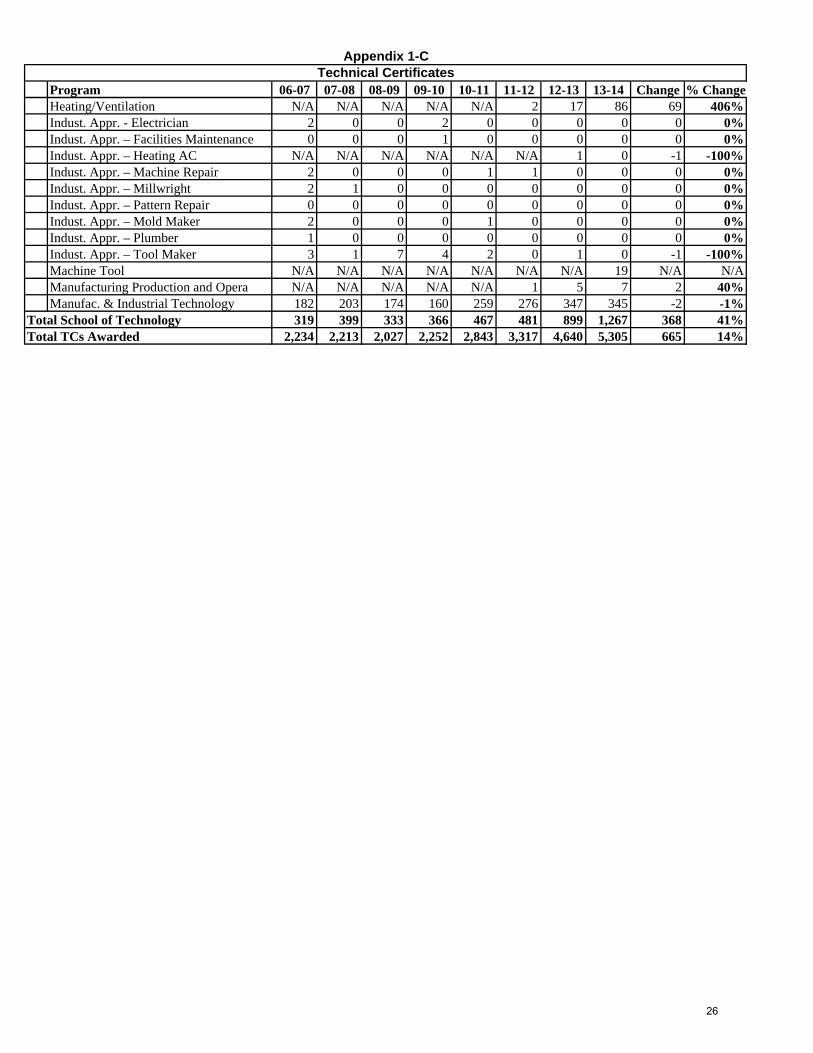
Program 06-07 07-08 08-09 09-10 10-11 11-12 12-13 13-14 Change % Change
Appendix 1-CTechnical Certificates
Heating/Ventilation N/A N/A N/A N/A N/A 2 17 86 69 406%Indust. Appr. - Electrician 2 0 0 2 0 0 0 0 0 0%Indust. Appr. – Facilities Maintenance 0 0 0 1 0 0 0 0 0 0%Indust. Appr. – Heating AC N/A N/A N/A N/A N/A N/A 1 0 -1 -100%Indust. Appr. – Machine Repair 2 0 0 0 1 1 0 0 0 0%Indust. Appr. – Millwright 2 1 0 0 0 0 0 0 0 0%Indust. Appr. – Pattern Repair 0 0 0 0 0 0 0 0 0 0%Indust. Appr. – Mold Maker 2 0 0 0 1 0 0 0 0 0%Indust. Appr. – Plumber 1 0 0 0 0 0 0 0 0 0%Indust. Appr. – Tool Maker 3 1 7 4 2 0 1 0 -1 -100%Machine Tool N/A N/A N/A N/A N/A N/A N/A 19 N/A N/AManufacturing Production and Opera N/A N/A N/A N/A N/A 1 5 7 2 40%Manufac. & Industrial Technology 182 203 174 160 259 276 347 345 -2 -1%
319 399 333 366 467 481 899 1,267 368 41%2,234 2,213 2,027 2,252 2,843 3,317 4,640 5,305 665 14%
Total School of TechnologyTotal TCs Awarded
26

Program 05-06 06-07 07-08 08-09 09-10 10-11 11-12 12-13 13-14 Change% Change
General Studies 1 0 0 0 0 109 413 453 184 -269 -59%Liberal Arts 24 27 25 23 35 48 77 125 108 -17 -14%
25 27 25 23 35 157 490 578 292 -286 -49%25 27 25 23 35 157 490 578 292 -286 -49%
Program 05-06 06-07 07-08 08-09 09-10 10-11 11-12 12-13 13-14 Change% Change
Visual Communication 0 1 0 0 1 2 2 0 2 2 200.0%Fine Arts N/A N/A 1 2 3 6 6 13 17 4 30.8%
0 1 1 2 4 8 8 13 19 6 46.2%0 1 1 2 4 8 8 13 19 6 46.2%
Program 05-06 06-07 07-08 08-09 09-10 10-11 11-12 12-13 13-14 Change% Change
General Studies N/A N/A N/A N/A N/A N/A N/A 198 614 416 210%N/A N/A N/A N/A N/A N/A N/A 198 614 416 210%N/A N/A N/A N/A N/A N/A N/A 198 614 416 210%Total AGSs Awarded
Appendix 1-FAssociate ot General Studies
Total School of Fine Arts and DesignTotal AFAs Awarded
Appendix 1-EAssociate ot Fine Arts
School of Liberal Arts and Sciences
Total Liberal Arts and Sciences
Total AAs Awarded
School of Liberal Arts and Sciences
Total School of Liberal Arts and Sciences
Appendix 1-DAssociate ot Arts
School of Fine Arts and Design
27

Program 06-07 07-08 08-09 09-10 10-11 11-12 12-13 13-14 Change % Change
Bookkeeper N/A 98 92 119 211 678 343 281 -62 -18%Computer Information Systems N/A N/A N/A N/A N/A 1 1 2 1 100%Data Security N/A N/A N/A N/A N/A 1 2 5 3 150%Database N/A N/A N/A 2 4 2 8 8 0 0%Enrolled Agent N/A N/A N/A N/A N/A N/A N/A 3 3 N/AFundamental Payroll N/A 36 65 90 140 529 254 276 22 9%Human Resources Management N/A N/A 1 7 16 50 55 61 6 11%Java Programming N/A N/A N/A 3 7 19 15 21 6 40%Landscape Technician N/A N/A N/A N/A N/A N/A N/A 5 5 N/AMicrosoft Cert Applicatn Specialists N/A N/A N/A N/A 8 0 0 0 0 #DIV/0!Microsoft Office Specialists N/A N/A 2 3 4 15 15 23 8 53%Network Administration N/A 9 16 13 32 78 75 73 -2 -3%Network Penetration Testing N/A N/A N/A N/A N/A N/A N/A 3 3 N/ANetwork Security N/A N/A N/A N/A 1 1 5 2 -3 -60%Office Administration N/A N/A N/A N/A N/A 2 8 14 6 75%PC Support and Administration N/A 17 9 12 52 83 247 283 36 15%Routing and Switching N/A 44 7 1 21 26 13 25 12 92%Supply Chain Management N/A N/A N/A N/A N/A N/A N/A 1 1 N/ASystems Security N/A N/A 3 5 7 38 9 17 8 89%Visual Programming N/A 12 9 7 13 52 18 5 -13 -72%Web Management N/A 5 3 9 16 26 7 12 5 71%
0 221 207 271 532 1,601 1,075 1,120 45 4%
Child Development Associate N/A N/A N/A N/A 17 27 86 25 -61 -71%Early Childhood Administration N/A N/A N/A N/A N/A N/A 3 6 3 100%Early Childhood Education N/A N/A N/A N/A N/A N/A 7 15 8 114%Early Childhood Ed CDA Process N/A N/A N/A N/A N/A N/A 27 39 12 44%Indiana Youth Development Prof N/A N/A N/A N/A N/A N/A N/A 2 2 N/A
N/A N/A N/A N/A 17 27 123 87 -36 -29%
Basic Emergency Medical Studies N/A N/A N/A N/A 57 81 108 60 -48 -44%Electrocardiography Tech N/A N/A N/A N/A 1 23 55 57 2 4%Health Care Support N/A N/A N/A N/A N/A N/A 2 2 0 0%Medical Office Administration N/A N/A N/A N/A N/A N/A 105 226 121 115%Outpatient Insurance Coding N/A N/A N/A N/A N/A N/A 63 132 69 110%Patient Care N/A N/A N/A N/A N/A N/A 8 11 3 38%Pharmacy Technician N/A N/A N/A N/A 43 59 109 88 -21 -19%Phlebotomy Technician N/A N/A N/A N/A 68 325 254 284 30 12%Polysomography N/A N/A N/A N/A N/A N/A 4 9 5 125%Therapeutic Massage N/A N/A N/A N/A 1 5 19 18 -1 -5%
N/A N/A N/A N/A 170 493 727 887 160 22%
General Education Transfer Core N/A N/A N/A N/A N/A N/A 131 34 -97 -74%0 0 0 0 0 0 131 34 -97 -74%
Addiction Studies N/A N/A N/A N/A N/A N/A 10 19 9 90%Certified Pastry Culinarian N/A N/A N/A N/A N/A 11 96 70 -26 -27%Culinarian N/A N/A N/A N/A 8 29 183 97 -86 -47%Dietary Management N/A N/A N/A N/A N/A N/A 2 0 -2 -100%Direct Support Professional N/A N/A N/A N/A N/A 1 1 0 -1 -100%Driver/Operator N/A N/A N/A N/A 1 0 3 4 1 33%Elder Care Support N/A N/A N/A N/A N/A 1 1 5 4 400%Fire Prevention N/A N/A N/A N/A N/A 3 5 6 1 20%Hospitality Administration N/A N/A N/A N/A N/A N/A N/A 1 1 N/AHospitality Management N/A N/A N/A N/A N/A 17 100 115 15 15%Substance Abuse N/A N/A N/A N/A 9 12 19 8 -11 -58%
Total School of Education
Appendix 1-GCareer Certificates
School of Business
Total School of Business School of Education
School of Health Sciences
Total School of Health Sciences
School of Public and Social Services
School of Liberal Arts and Sciences
Total School of Liberal Arts and Sciences
28

Program 06-07 07-08 08-09 09-10 10-11 11-12 12-13 13-14 Change % Change
Appendix 1-GCareer Certificates
N/A N/A N/A N/A 18 74 420 325 -95 -23%
Alternative Fuels N/A N/A N/A N/A 3 0 0 3 3 300%Automation Controls N/A N/A N/A N/A N/A 1 0 3 3 300%Automotive Electrical/Electronics N/A 19 59 41 51 187 48 99 51 106%Automotive Technology N/A N/A N/A N/A N/A N/A 1 0 -1 -100%Brakes and Suspension N/A 35 55 42 60 75 59 45 -14 -24%Construction Technician N/A N/A N/A 1 4 13 40 34 -6 -15%Diesel Electronic Controls N/A N/A N/A N/A N/A 7 1 0 -1 -100%Engine Performance N/A 27 38 30 30 177 50 157 107 214%Fluid Power N/A N/A 2 9 16 103 54 59 5 9%Heating and Air Conditioning N/A 23 55 77 197 268 142 150 8 6%Industrial Electrician N/A 1 4 25 44 25 31 38 7 23%Industrial Machining N/A N/A N/A N/A N/A 5 2 17 15 750%Industrial Technology N/A N/A N/A 16 0 0 0 14 14 1400%Machine Tool N/A 1 1 4 12 24 6 1 -5 -83%Manufacturing Operations N/A N/A N/A N/A 8 3 1 1 0 0%Mechatronics N/A N/A N/A N/A N/A 3 0 1 1 100%Power Train N/A 21 47 25 57 54 52 52 0 0%Structural Welding N/A N/A 15 1 40 116 84 77 -7 -8%Truck Chassis Systems N/A N/A N/A N/A N/A 1 0 0 0 0%
0 127 276 271 522 1,062 571 751 180 32%
HVAC N/A N/A N/A N/A N/A N/A 3 2 -1 -33%Machine Tool Technology N/A N/A N/A N/A N/A N/A 22 10 -12 -55%Welding N/A N/A N/A N/A N/A N/A 18 1 -17 -94%
N/A N/A N/A N/A N/A N/A 43 13 -30 -70%0 348 483 542 1,259 3,257 3,090 3,217 127 4%
Total School of Technology
Total School of Public and Social ServicesSchool of Technology
Total School of Technology
Total CTs Awarded
Ivy Institue
29

County 2006-07 2007-08 2008-09 2009-10 2010-11 2011-12 2012-13 2013-14 % of TotalAdams 47 49 30 37 65 86 57 65 0.3%Allen 427 490 358 491 634 1,010 919 1,125 5.9%
Bartholomew 101 108 96 139 169 225 250 290 1.5%Benton 21 10 15 31 33 46 46 33 0.2%
Blackford 26 22 22 37 22 39 36 54 0.3%Boone 33 47 41 49 71 58 103 89 0.5%Brown 35 31 24 19 35 36 48 59 0.3%Carroll 40 29 31 40 95 76 73 69 0.4%Cass 99 77 59 67 122 121 137 142 0.7%Clark 118 157 123 174 244 277 350 399 2.1%Clay 55 73 46 45 50 77 93 93 0.5%
Clinton 52 64 43 72 133 117 128 101 0.5%Crawford 9 25 9 10 9 7 15 16 0.1%Daviess 6 6 3 2 6 7 20 8 0.0%
Dearborn 51 72 67 94 161 190 207 103 0.5%Decatur 47 39 28 55 95 102 124 216 1.1%Dekalb 63 70 56 73 104 118 103 81 0.4%
Delaware 184 189 150 260 274 395 546 597 3.1%Dubois 9 17 17 35 18 50 41 40 0.2%Elkhart 142 124 88 156 209 263 291 485 2.5%Fayette 43 62 79 118 104 88 136 141 0.7%Floyd 77 109 81 107 146 176 191 209 1.1%
Fountain 15 21 10 44 48 35 42 39 0.2%Franklin 18 21 27 32 48 88 69 89 0.5%Fulton 18 19 15 38 37 33 52 51 0.3%Gibson 46 39 50 41 55 104 102 81 0.4%Grant 194 96 82 133 149 196 217 267 1.4%
Greene 63 89 52 54 85 85 95 93 0.5%Hamilton 113 98 124 136 244 297 386 422 2.2%Hancock 59 40 50 76 86 127 142 125 0.7%Harrison 64 89 35 62 86 69 84 89 0.5%
Hendricks 87 111 102 159 142 186 216 278 1.4%County 2006-07 2007-08 2008-09 2009-10 2010-11 2011-12 2012-13 2013-14 % of TotalHenry 48 62 58 113 119 232 181 199 1.0%
Howard 134 118 127 221 320 364 348 396 2.1%Huntington 54 68 63 54 41 66 59 78 0.4%
Jackson 50 48 38 97 79 96 154 133 0.7%Jasper 27 33 25 63 51 72 95 102 0.5%
Jay 28 33 24 31 35 52 65 66 0.3%Jefferson 61 67 54 82 129 125 141 139 0.7%Jennings 49 34 28 29 56 98 99 118 0.6%Johnson 114 145 139 234 237 299 372 404 2.1%
Knox 9 10 1 5 15 14 12 9 0.0%Kosciusko 68 88 63 102 115 155 99 207 1.1%La Grange 10 12 6 23 21 38 34 333 1.7%La Porte 94 119 195 122 107 187 266 32 0.2%
Lake 283 263 70 315 385 599 738 978 5.1%Lawrence 91 112 120 119 209 136 131 155 0.8%Madison 178 205 141 265 246 309 370 465 2.4%Marion 569 650 628 749 856 1,193 1,520 1,696 8.8%
Counties of Residence
30

Marshall 24 25 19 34 63 64 58 77 0.4%Martin 3 9 1 8 1 4 6 7 0.0%Miami 68 63 56 90 158 133 169 201 1.0%
Monroe 221 271 246 251 310 454 456 567 3.0%Montgomery 42 43 43 66 90 87 112 113 0.6%
Morgan 79 89 75 110 126 160 168 163 0.8%Newton 14 11 20 30 22 22 24 33 0.2%Noble 56 54 28 49 85 127 94 91 0.5%Ohio 2 4 1 11 31 20 32 34 0.2%
Orange 17 23 30 20 34 33 45 42 0.2%Owen 43 52 34 36 46 59 58 66 0.3%Parke 21 32 20 24 34 33 31 36 0.2%Perry 18 12 10 21 20 40 39 29 0.2%Pike 8 3 2 4 16 11 11 9 0.0%
Porter 181 159 109 186 243 377 475 588 3.1%Posey 42 60 36 39 55 100 103 84 0.4%
Pulaski 14 15 15 14 14 42 35 34 0.2%Putnam 78 76 48 55 62 95 64 93 0.5%
Randolph 53 49 45 58 70 87 103 95 0.5%Ripley 42 49 37 52 85 121 130 114 0.6%Rush 23 16 20 37 49 52 45 55 0.3%Scott 40 54 195 51 82 78 62 95 0.5%
County 2006-07 2007-08 2008-09 2009-10 2010-11 2011-12 2012-13 2013-14 % of TotalShelby 34 45 50 59 78 81 113 117 0.6%Spencer 15 11 44 25 21 44 32 43 0.2%
St. Joseph 239 229 14 299 372 478 463 813 4.2%Starke 17 18 14 28 31 42 52 58 0.3%
Steuben 19 37 17 40 44 82 57 47 0.2%Sullivan 38 45 30 44 52 66 61 77 0.4%
Switzerland 6 10 9 15 19 21 29 29 0.2%Tippecanoe 344 405 300 404 604 705 684 651 3.4%
Tipton 5 11 14 22 44 44 34 34 0.2%Union 12 18 14 27 31 22 35 39 0.2%
Vanderburgh 275 319 241 350 349 671 670 703 3.7%Vermillion 19 25 19 34 35 44 49 62 0.3%
Vigo 186 207 137 180 252 333 380 418 2.2%Wabash 51 51 49 83 120 76 92 103 0.5%Warren 8 15 9 12 27 30 29 21 0.1%Warrick 100 81 68 119 88 168 167 160 0.8%
Washington 45 47 49 54 112 137 115 82 0.4%Wayne 112 121 165 157 275 452 377 425 2.2%Wells 32 50 19 37 43 81 49 55 0.3%White 53 38 44 43 64 94 82 73 0.4%
Whitley 40 43 26 78 48 103 61 79 0.4%Kentucky-Adair 0 0 40 0 0 0 0 0 0.0%Kentucky-Boone 0 0 1 3 3 3 12 5 0.0%Kentucky-Boyd 0 0 7 1 0 1 0 0 0.0%
entucky-Breckinrid 0 1 1 0 0 0 0 6 0.0%Kentucky-Butler 0 0 2 0 0 0 0 0 0.0%
Kentucky-Cambell 0 0 1 0 0 0 0 3 0.0%Kentucky-Carroll 1 1 1 2 3 3 7 7 0.0%Kentucky-Casey 0 0 3 0 0 2 0 0 0.0%
31

Kentucky-Clark 0 0 7 0 0 0 0 0 0.0%Kentucky-Daviess 6 4 9 7 11 7 6 7 0.0%Kentucky-Gallatin 0 0 0 0 0 0 0 0 0.0%Kentucky-Hancock 1 1 1 0 1 1 1 2 0.0%Kentucky-Hardin 0 0 0 0 3 0 4 10 0.1%
Kentucky-Henderso 12 10 3 10 25 45 44 22 0.1%Kentucky-Hopkins 1 0 0 0 0 0 2 3 0.0%Kentucky-Jefferson 61 29 8 45 71 52 93 139 0.7%Kentucky-McLean 2 0 0 0 2 0 1 1 0.0%
County 2006-07 2007-08 2008-09 2009-10 2010-11 2011-12 2012-13 2013-14 % of TotalKentucky-Meade 2 0 0 2 1 0 10 0 0.0%
Kentucky-Oldham 0 6 1 3 10 5 4 3 0.0%Kentucky-Owen 0 1 0 0 0 2 0 0 0.0%
Kentucky-Trimble 6 7 0 3 9 18 18 10 0.1%Kentucky-Union 1 2 0 1 2 6 2 4 0.0%
Kentucky-Webster 1 0 0 1 2 0 4 3 0.0%Ohio - Butler 1 0 0 5 7 0 5 7 0.0%Ohio - Darke 8 2 14 9 8 17 19 14 0.1%Ohio - Preble 10 17 13 34 40 34 45 30 0.2%
Ohio - Van Wert 0 1 0 3 0 5 2 6 0.0%Out of State 100 98 60 178 320 351 418 480 2.5%
Foreign 6 3 0 1 0 0 0 0 0.0%Unknown 128 153 1842 168 354 169 344 248 1.3%
Total 7,334 7,938 8,250 9,419 12,077 15,513 16,995 19,184
32

Northwest Business and Public Service 2,075 533 25.7%Northwest Health Science 2,625 332 12.6%Northwest Technology 1,845 422 22.9%Northwest University and Transfer 2,373 169 7.1%Northwest Other 127 0 0.0%
9,045 1,456 16.1% North Central Business and Public Service 2,032 561 27.6%North Central Health Science 1,873 295 15.8%North Central Technology 846 244 28.8%North Central University and Transfer 1,646 208 12.6%North Central Other 240 0 0.0%
6,637 1,308 19.7% Northeast Business and Public Service 2,146 465 21.7%Northeast Health Science 1,883 329 17.5%Northeast Technology 1,208 225 18.6%Northeast University and Transfer 2,765 213 7.7%Northeast Other 334 0 0.0%
8,336 1,232 14.8% Lafayette Business and Public Service 1,155 278 24.1%Lafayette Health Science 1,118 217 19.4%Lafayette Technology 772 207 26.8%Lafayette University and Transfer 2,228 220 9.9%Lafayette Other 142 0 0.0%
5,415 922 17.0% Kokomo Business and Public Service 951 222 23.3%Kokomo Health Science 1,076 198 18.4%Kokomo Technology 428 75 17.5%Kokomo University and Transfer 1,155 181 15.7%Kokomo Other 93 0 0.0%
3,703 676 18.3% East Central Business and Public Service 1,432 547 38.2%East Central Health Science 2,382 450 18.9%East Central Technology 452 120 26.5%East Central University and Transfer 2,398 435 18.1%East Central Other 78 0 0.0%
6,742 1,552 23.0% Wabash Valley Business and Public Service 781 234 30.0%Wabash Valley Health Science 1,428 260 18.2%Wabash Valley Technology 809 149 18.4%Wabash Valley University and Transfer 1,145 137 12.0%Wabash Valley Other 154 0 0.0%
4,317 780 18.1%
North Central Total
Northeast Total
Lafayette Total
Kokomo Total
Total
Wabash Valley Total
Region Division
Fall 2013 End of Term Total
Degree-seeking Enrollment
2013-14 Graduates
Graduates as a percent of Enrolless
Northwest Total
33

Region Division
Fall 2013 End of Term Total
Degree-seeking Enrollment
2013-14 Graduates
Graduates as a percent of Enrolless
Central Indiana Business and Public Service 3,924 711 18.1%Central Indiana Health Science 3,531 415 11.8%Central Indiana Technology 1,906 248 13.0%Central Indiana University and Transfer 9,658 758 7.8%Central Indiana Other 1,034 0 0.0%
20,053 2,132 10.6% Richmond Business and Public Service 595 193 32.4%Richmond Health Science 946 222 23.5%Richmond Technology 281 71 25.3%Richmond University and Transfer 615 93 15.1%Richmond Other 118 0 0.0%
2,555 579 22.7% Columbus Business and Public Service 1,144 350 30.6%Columbus Health Science 891 172 19.3%Columbus Technology 209 50 23.9%Columbus University and Transfer 1,197 219 18.3%Columbus Other 148 0 0.0%
3,589 791 22.0% Southeast Business and Public Service 499 155 31.1%Southeast Health Science 788 188 23.9%Southeast Technology 145 34 23.4%Southeast University and Transfer 850 134 15.8%Southeast Other 123 0 0.0%
2,405 511 21.2% Southwest Business and Public Service 1,361 349 25.6%Southwest Health Science 1,081 190 17.6%Southwest Technology 1,294 208 16.1%Southwest University and Transfer 1,256 146 11.6%Southwest Other 41 0 0.0%
5,033 893 17.7% Southern Indiana Business and Public Service 935 287 30.7%Southern Indiana Health Science 1,245 226 18.2%Southern Indiana Technology 1,092 156 14.3%Southern Indiana University and Transfer 1,061 154 14.5%Southern Indiana Other 123 0 0.0%
4,456 823 18.5% Bloomington Business and Public Service 1,265 299 23.6%Bloomington Health Science 895 143 16.0%Bloomington Technology 250 51 20.4%Bloomington University and Transfer 2,178 204 9.4%Bloomington Other 137 0 0.0%
4,725 697 14.8%
Bloomington Total
Central Indiana Total
Richmond Total
Columbus Total
Southeast Total
Southwest Total
Southern Indiana Total
34

Region Division
Fall 2013 End of Term Total
Degree-seeking Enrollment
2013-14 Graduates
Graduates as a percent of Enrolless
Ivy Tech Ohio OnlineBusiness and Public Service 174 0 0.0%Ivy Tech Ohio OnlineHealth Science 0 0 0.0%Ivy Tech Ohio OnlineTechnology 3 0 0.0%Ivy Tech Ohio OnlineUniversity and Transfer 117 0 0.0%Ivy Tech Ohio OnlineOther 0 0 0.0%
294 0 0.0%Ivy Tech Ohio Online Total
35


