13 ASSESSING AND EVALUATING WORKFORCE CHALLENGES Sheryl A. Larson,Traci L. LaLiberte, and Patricia Salmi This chapter offers practical suggestions for organizations about how to develop an in- ternal system for monitoring interventions that address workforce challenges. For- mulas for measuring turnover rates and tenure are provided. Strategies to assess re- cruitment success, staff satisfaction, organizational commitment, and other important outcomes are described. In addition, feedback processes such as surveys, focus groups, and exit interviews are discussed. Sample surveys are provided at the end of the chapter. This chapter focuses on the assessment of the problem or challenge in an organ- ization, the selection and use of measurement methods or tools, and the evaluation of progress and success. Other stages are briefly outlined to put the assessment informa- tion into context. Chapter 14 provides a more in-depth look at identifying a specific problem or challenge and choosing the appropriate intervention with which to address that problem. TARGETED FRONT-LINE SUPERVISOR COMPETENCIES The front-line supervisor (FLS) competencies addressed in this chapter focus on per- sonnel management skills needed to assess turnover rates, vacancy rates, consumer sat- isfaction and other workforce outcomes. Effective FLSs and managers assess challenges and evaluate organizational outcomes on an ongoing basis using the following skills: Primary Skills FLSs know the annual turnover and vacancy rate at the sites for which they have direct responsibility and how these compare with those for the organi- zation as a whole. FLSs monitor turnover, recruitment success, and employee satisfaction and use the results to improve personnel practices. Related Skills FLSs maintain regular contacts with and follow up with supported individ- uals and their family members and support team members regarding com- plaints and issues. FLSs design, implement, and develop strategies to address issues identified in satisfaction surveys completed by individuals receiving supports. 287 5 3
Transcript
13ASSESSING AND EVALUATING
WORKFORCE CHALLENGES
Sheryl A. Larson,Traci L. LaLiberte,and Patricia Salmi
This chapter offers practical suggestions for organizations about how to develop an in-ternal system for monitoring interventions that address workforce challenges. For-mulas for measuring turnover rates and tenure are provided. Strategies to assess re-cruitment success, staff satisfaction, organizational commitment, and other importantoutcomes are described. In addition, feedback processes such as surveys, focus groups,and exit interviews are discussed. Sample surveys are provided at the end of the chapter.
This chapter focuses on the assessment of the problem or challenge in an organ-ization, the selection and use of measurement methods or tools, and the evaluation ofprogress and success. Other stages are briefly outlined to put the assessment informa-tion into context. Chapter 14 provides a more in-depth look at identifying a specificproblem or challenge and choosing the appropriate intervention with which to addressthat problem.
TARGETED FRONT-LINE SUPERVISOR COMPETENCIES
The front-line supervisor (FLS) competencies addressed in this chapter focus on per-sonnel management skills needed to assess turnover rates, vacancy rates, consumer sat-isfaction and other workforce outcomes. Effective FLSs and managers assess challengesand evaluate organizational outcomes on an ongoing basis using the following skills:
Primary SkillsFLSs know the annual turnover and vacancy rate at the sites for which theyhave direct responsibility and how these compare with those for the organi-zation as a whole.
FLSs monitor turnover, recruitment success, and employee satisfaction anduse the results to improve personnel practices.
Related SkillsFLSs maintain regular contacts with and follow up with supported individ-uals and their family members and support team members regarding com-plaints and issues.
FLSs design, implement, and develop strategies to address issues identifiedin satisfaction surveys completed by individuals receiving supports.
287
5
3
UNDERSTANDING THE PROBLEM
Throughout this book, a host of strategies for addressing recruitment, retention, andtraining challenges have been described. To devise effective solutions for those chal-lenges, it is essential to have a clear idea of the size and nature of the problems in theorganization. Organizations need a baseline of their current status so that they canmeasure whether a selected intervention actually makes a difference. A study examin-ing more than 1,000 organizations found that those that conduct formal job analysesfor all positions and administer attitude surveys on a regular basis have lower turnover,improved productivity, and improved corporate financial performance (Huselid, 1995).Up-to-date information about organizational outcomes such as turnover rates, em-ployee satisfaction, and satisfaction of supported individuals is also important when anorganization is deciding which problem is most important to address first. Further-more, assessment and evaluation are important to identify strategies that work andthose that do not so that changes can be made.
RESEARCH SUPPORT FOR SOLUTIONS
Many research textbooks describe how to use a scientific approach to identify chal-lenge, create a hypothesis or idea about why the challenge exists, and test whether thehypothesis or idea is true (e.g., Cook & Campbell, 1990; Cozby, 2004). This chapterdescribes this approach in nontechnical terms to assist FLSs to use the scientificmethod to define a problem, select a solution, and test whether the solution has actu-ally remedied workforce challenges. In this chapter, we describe tools that supervisorscan use in this process, along with the scientific or research support for these tools.
STRATEGIES FOR RESPONDING TO THE PROBLEM
Jeremy’s Story: A Template for Assessment and EvaluationThe following fictional example of Jeremy and his approach to his weight problem isa simplified version of an approach that organizations can use when assessing work-force issues.
Identify the ProblemLike many other Americans, on New Year’s Day, Jeremy made several resolutions toimprove his life. One of his challenges was to identify the problem he most wanted toovercome. This decision was complicated because he had several top priorities. Hewanted to improve his health by stopping smoking, limiting his alcohol intake, and re-ducing his weight. He also wanted to spend more time with his children. He realized,however, that trying to make all of those changes at once could be a formula for fail-ure. So he decided his top priority would be to lose some weight.
In this illustration, Jeremy first identified his concerns and then selected the issuemost important to him. It is much the same in an organization. To make positivechanges, an organization must first identify the most important problems or issues andthen prioritize them, selecting the most pressing issue(s) first.
288 • Larson, LaLiberte, and Salmi
Assess the Problem
Once Jeremy has decided that the goal of weight loss was most important, several re-lated questions remain. For example, how does Jeremy know that he should loseweight? His doctor once told him that losing some weight would help to reduce hisrisk of diabetes. Also, Jeremy struggles to walk up a flight of stairs at his current weightbut remembers that he didn’t have any trouble with that when he was thinner. In ad-dition, Jeremy realizes that none of his clothes fit anymore. Weight problems, likeworkforce challenges, can present themselves in a variety of ways. It is important to useavailable information to assess whether a problem exists.
Once a problem has been identified, the next step is to determine the size of theproblem, and, if possible, its cause. In this example, Jeremy needs to find out howmuch a person of his age and height should weigh so that he can compare that with hisweight. After weighing himself, Jeremy learns that he is 20 pounds heavier than therecommended weight for a person of his age and height. This information provides Je-remy with a starting point, or a baseline measurement.
Another part of the assessment is to determine why Jeremy weighs too much. Heneeds to learn where the problem really lies. Is he eating too much at each meal? Is heskipping breakfast, then gulping down a huge lunch because he is too hungry to worryabout how much he is eating? Is he eating the wrong types of food (e.g., too much fastfood)? Does he need to add exercise to his life? It would be foolish to make an actionplan without knowing the real cause of the problem. Jeremy needs to gather informa-tion about his behavior and then compare his information with some kind of standard.Keeping a food diary would help Jeremy compute his calorie intake for the day. Thenhe could use a reference book or his doctor’s guidelines to see how many calories heshould be eating for a person of his age and height. If his total calorie intake exceedsthe recommendations for his age and height, he would know that reducing the amounthe eats or changing the types of foods he is eating could help him come closer to thestandard. If he learns that his calorie intake is about right compared with the standard,however, he would have to continue his assessment to identify another possible reasonfor his problem. Perhaps tracking how many minutes per week spent exercising wouldreveal that Jeremy is not getting the recommended amount of exercise.
Through these assessments, Jeremy learns that although his food intake is rea-sonable, he only gets 15 minutes of exercise per week. His doctor recommended atleast 20 minutes per day, 4 or more days per week. Jeremy’s assessment has helped himidentify the likely source of the problem and also points to a possible solution. The les-son is the same when evaluating problems in the workplace. A thoughtful assessmenthelps in identifying the extent of the problem, and it can often highlight a problem’scauses or related issues. If the goal is to make a plan and take action, a solid under-standing of the nature of the problem is critical to the process. Without this under-standing, an organization could end up spinning its wheels while going nowhere.
Select an Intervention StrategyHaving identified and assessed the problem, Jeremy’s next step is to decide on a planof action and to implement that plan. He has to choose one intervention from themany available (e.g., working out at a gym, buying a treadmill, swimming at the local
Assessing and Evaluating Workforce Challenges • 289
pool). After considering the alternatives, he decides to start walking with his childrenfor 20 minutes, 4 days per week. This plan meets his need to increase his exercise andhis desire to spend more time with his children. Similarly, in addressing workforcechallenges, an intervention that is appropriate for the problem should be identifiedand put into place. Chapter 14 describes how to select interventions based on assess-ment results and reviews available alternatives.
Set Goals and Measure ProgressJeremy set a goal of losing 20 pounds in 6 months by increasing his level of exercise.In measuring his progress, Jeremy has several choices. As mentioned earlier, Jeremytook a baseline measurement by weighing himself at the beginning of his weight-lossplan. He could also have chosen to measure various points on his body or to assess hisbody fat percentage. Regardless of the method, Jeremy needs to use the same tool orassessment procedure again to accurately measure any change. By weighing himself,Jeremy would obtain accurate information on the impact of his weight loss program.If he were to use the same measurement tool in the beginning and at the end, he wouldaccurately measure his progress. Likewise, when creating workforce interventions, ac-curate assessment of the impact of the intervention can best be made by obtaining abaseline measurement and then assessing progress by utilizing the same measurementtool used in the initial evaluation.
Establish a Time Frame for the InterventionThe next step for Jeremy is to decide how and when to evaluate his progress. His ini-tial assessment of the problem (i.e., his baseline) revealed that he was 20 pounds heav-ier than his desired goal. To evaluate his progress, he needs to measure any change inweight as a result of implementing the intervention. He needs to decide the time framein which the evaluation would occur.
Jeremy has several choices with regard to time frames. In the beginning, Jeremychose walking for his exercise (intervention) because he was overweight (identifiedproblem). He decided to walk four times per week for 6 months (duration). Finally, Je-remy decided to check his progress by using a scale to weigh himself (measurementtool). However, he has one last decision before implementing his weight-loss program:He has to decide the points in time that he wants to weigh himself to check hisprogress. He could weigh himself once at the beginning and once at the end of the 6months. He also could weigh himself once per week. Sometimes people want to mea-sure at the beginning, in the middle, and at the end, so he could weigh himself at thebeginning, at the third month, and at the end of the 6 months. He could also track hisprogress in a journal or on a wall chart.
Jeremy realizes that weighing himself on a scale every day is not an efficient useof his time. Instead, he decided to weigh himself once each week. It is the same in theworkplace. The measurement intervals should be an effective use of the time, money,and energy available for the project. For an evaluation that is shorter in duration, onebaseline measurement and one final measurement are adequate. In a longer timeframe, additional measurement times may be useful.
290 • Larson, LaLiberte, and Salmi
Evaluate Success
Jeremy began to exercise with his children. He soon found that they grew bored walk-ing the same route each day, so to keep things interesting he had his children select theroute two days a week and he selected the route twice a week. He and the children puta check on the calendar each day they walked and celebrated each week’s progress byrenting a video. After 3 months, Jeremy and his children averaged 3.5 walks per weekand Jeremy had lost 10 pounds. He had developed plans to walk at an enclosed shop-ping mall on days when the weather was bad. By the end of 6 months, Jeremy hadachieved his goal of losing 20 pounds and felt more energetic. Similarly, when organi-zations implement interventions to reduce turnover or improve training, evaluatingwhether those interventions were successful is critical. By checking success against thegoal at least twice during the intervention, an organization can learn whether the in-tervention is working.
Summary of the Assessment and Evaluation StepsAlthough workforce issues can often appear more complicated and involved than aweight problem, by following the six steps just outlined, dealing with such workforceissues should be no more intimidating or difficult than Jeremy’s task. In the followingsections, the six assessment and evaluation steps are discussed as they relate to creat-ing change within a community human services organization.
Identify the ProblemOrganizations often realize that problems exist in their workplace. Often, however,there are so many concerns or problems that knowing which problem to address firstcan be difficult. Or, the opposite might be true: The organization understands thatproblems exist but is not quite sure what those problems are. Often, the issues or con-cerns center on recruitment and retention of staff members. Although an organizationmight understand the overall issues, it may have difficulty pinpointing the exact natureof the problem. Common workforce challenges include the following:• The organization has trouble finding new employees.• The organization has difficulty recruiting individuals who are qualified to take open
positions.• New hires quit in the first 6 months.• Supervisors are constantly hiring new employees to replace those who have left the
organization.• New employees are unsure of their job roles and functions.• The organization has difficulty finding training that addresses the skills needed by
employees.• Training does not produce desired results. Employees display poor skills on the job.• Co-workers do not get along.• There is conflict between employees and supervisors or managers.• Employees complain about the supervision they get.• Supervisors report being overwhelmed or do not know how to do their job.
Assessing and Evaluating Workforce Challenges • 291
• Employees have morale problems.• Long-term employees are dissatisfied with or quit their jobs.• Employees have inadequate wages or benefits.The first step in assessing challenges and evaluating outcomes is to select a specificchallenge as the focus. The challenges just listed are common, but an organization mayidentify another problem that is not on this list at all.
Assess the ProblemKnowing that a challenge exists is often one of the easiest parts of developing an or-ganizational change plan. Challenges are the things that make daily work life unpleas-ant. Once a specific challenge has been identified, the next step is to assess the natureand extent of challenge. Questions to answer include:• What exactly is the challenge?• How big is the challenge?• How costly is the challenge?• Whom does the challenge affect the most?To accurately and efficiently assess the problem or challenge, an organization needs toselect a measurement tool or method. This measurement tool will also be used to eval-uate progress at the end of the determined time frame. (See Table 13.1 for a summaryof common workforce challenges and ways of assessing them.) Both general and spe-cific assessments may be needed. General assessments are those that all organizationsshould conduct at least annually.
Baselines are critical to defining the challenge. Baseline information can be fromnumerical data, such as turnover, vacancy, and tenure rates. Calculating these ratesboth at the organizational level and at the program or work-site level offers the mostcomplete picture of the organization’s experiences with staff transitions. It is also im-portant to gather other types of baseline information. For example, if high turnover isone of the organization’s biggest challenges, then turnover, tenure, and vacancy ratesare of great importance, but so are exit interviews, which can provide a clearer pictureof why people are leaving. Calculating the costs of turnover in terms of money and ser-vice outcomes is crucial. Depending on the challenge identified, the organization maybenefit from consumer satisfaction surveys, which can identify training needs; job sat-isfaction surveys, which can identify challenges related to benefits, the work environ-ment, or supervision; and/or an assessment of recruitment sources and strategies,which can identify challenges in finding qualified applicants. Baseline data can becompared with benchmarks in other organizations (see Chapter 1) and with future an-nual assessments for the organization itself.
The baseline assessment should allow the organization to determine if the challengeis systemwide or if it is isolated to particular work sites or programs. For example, ifhigher staff turnover or lower staff satisfaction exists only at some locations, a targetedintervention can be more effective than an intervention designed to blanket the entireorganization. It may be that certain supervisors have not been adequately trained fortheir roles and responsibilities or that a new program has just begun at one location.
Although identifying the challenge is important, it is easy to fall into the trap ofspending an inordinate amount of time and resources studying a challenge without
292 • Larson, LaLiberte, and Salmi
taking any action to address the challenge. To avoid that trap, an organization shoulddetermine ahead of time what information will be sought, develop an assessment strat-egy, and stick to the assessment plans and time lines.
Specific follow-up assessments should be used as needed to measure the nature,extent, and cause of specific problems. In many cases, instruments or strategies to con-duct the suggested specific assessment are included in earlier chapters of this book.There are many types of specialized workforce assessment strategies, including stan-dardized and nonstandardized instruments and other methods. The following sectionsdescribe general and specialized workforce development assessments and review fac-tors that should be considered in selecting or constructing an assessment.
Assessing and Evaluating Workforce Challenges • 293
Table 13.1. Workforce challenges and ways to assess them
Challenge Assessment measures or strategies
The organization has trouble finding newemployees.
The organization has difficulties recruitingqualified individuals.
Wage–benefit market analysisRecruitment and hiring bonuses effectiveness
analysis
New hires quit in the first 6 months.Supervisors are constantly hiring new employ-
ees to replace those who have left the or-ganization.
Turnover (crude separation rate)Tenure of current employees (stayers)Tenure of leaversStaff satisfaction survey (given to new hires)New staff surveyExit interview or survey
New employees are unsure of their job rolesand functions.
Job description reviewTraining needs assessment (given to new hires)
The organization has difficulty finding trainingthat addresses the skills needed by employees.
Training needs assessmentInventory of current employee skills
Training does not produce desired results.Employees display poor skills on the job.
Competency assessmentsPerformance review system
Co-workers do not get along. Teamwork assessmentStaff satisfaction surveyPersonality or style inventories
There is conflict between employees and su-pervisors or managers.
Employees complain about the supervisionthey get.
Supervisors report being overwhelmed or donot know how to do their job.
Teamwork assessmentSupervisor training needs assessmentStaff satisfaction survey
Employees have morale problems. Staff satisfaction surveyOrganizational commitment survey
Long-term staff are dissatisfied with or quittheir jobs.
Staff satisfaction survey (given to current andexiting long-term employees)
Training needs assessmentExit interviews or survey
General Workforce Development Assessments
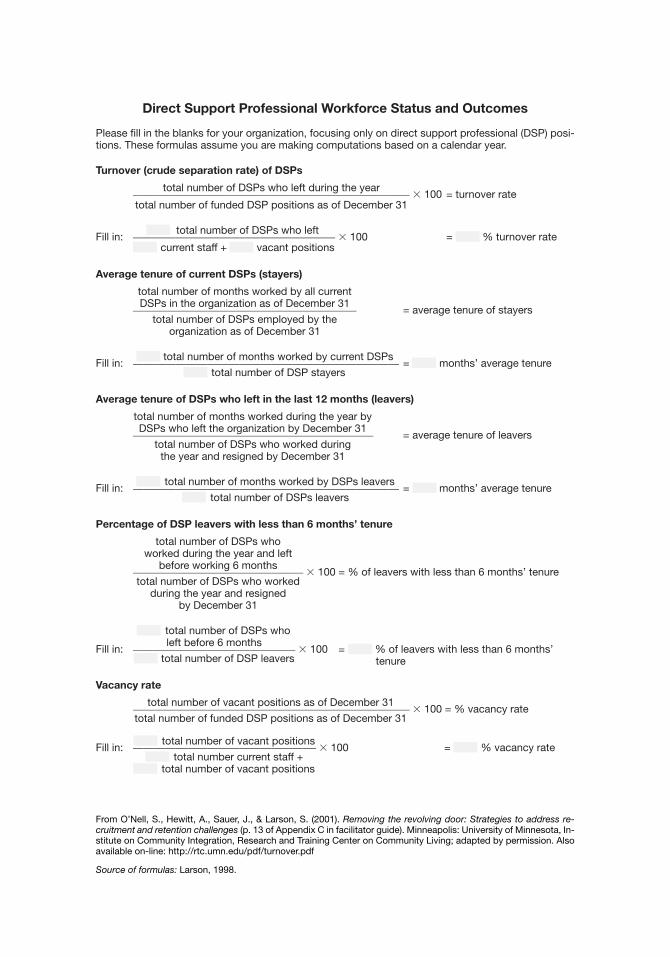
Several general workforce development assessments can help organizations under-stand the challenges they face and select the most important challenge for interven-tion. To establish a baseline, the organization must clearly define who is considered adirect support professional (DSP) and how employees performing job duties at mul-tiple sites or only serving as on-call staff will be counted. It is most efficient if the samedefinitions and formulas are used for all sites and services within the organization. Re-tention outcomes for DSPs and FLSs that should be assessed at baseline and again atleast annually include the following:• Turnover (crude separation rate)• Average tenure (months worked)• Percentage of employees who leave the organization within 6 months of hire
(tenure category of leavers)• Vacancy rate (percentage of positions vacant on a specific day)A worksheet with the formulas (Larson, 1998) used in these general computations ap-pears at the end of this chapter.
It is also helpful to identify factors that may have contributed to the turnoverrates in each site and differences in rates between sites. This includes gathering infor-mation about positive and negative job features and describing any changes or specialincentives that may have influenced retention outcomes. Establishing benchmarkrates and goals for each site and for the organization as a whole allows the organiza-tion to identify sites that are struggling and those that are doing well. This can helpthe organization to identify why recruitment outcomes differ across sites. It is also im-portant to understand turnover differences in new programs, in programs located inareas of low unemployment, in programs in which wages compare unfavorably withprevailing wages, and so forth.
Turnover (Crude Separation Rate)
Turnover, or the crude separation rate, compares the number of people who left theorganization with the number of positions in a site or organization. Turnover is a con-venient measure to compare retention problems across sites within an organization orto compare an organization with similar organizations. To compute the turnover ratein a particular site, count the number of employees in a particular category (e.g.,DSPs) who left the site within the last 12 months (leavers). Include all employees wholeft or were fired, even if they quit 1 day after hire or were hired but never showed upfor work. Divide this number by the average number employees at the site during thelast 12 months. Multiply the result by 100. The resulting percentage (which may behigher than 100%) reflects the annual crude separation rate for that category of em-ployees. Turnover rates can be compared across sites and can be computed for the or-ganization as a whole.
number of leavers in 12 months at the site (or in the organization)
turnover (crude separation rate) = —————————————————— � 100number of positions at the site
(or in the organization)
294 • Larson, LaLiberte, and Salmi
Tenure of Current Employees (Stayers)
Tenure is the length of time an employee has worked for a site or organization. Liketurnover, the average tenure of current employees (stayers) is a convenient measure touse when comparing retention success for sites within an organization or to comparean organization’s retention success with that of similar organizations. To compute theaverage tenure of employees at a particular site (or across the organization), list eachemployee and the number of months the employee has been at the site (or in the or-ganization). Add the number of months for all employees at the site (or in the organ-ization) and divide by the total number of employees. This calculation will yield theaverage number of months employees have been at the site (or in the organization). Besure to consider the number of months the site has been open when evaluating the re-sults. Separate computations for DSPs and FLSs can be helpful.
total number of months’ tenure of current staff at the site (or in the organization)
average tenure of current employees (stayers) = ——————————————total number of staff at the site
(or in the organization)
Tenure of Leavers
To compute the average tenure of people who have left a site or an organization(leavers), identify all those who have left in the past 12 months. For each leaver, notethe total number of months worked before leaving the organization. Sum the numberof months for all leavers and divide the total by the number of leavers. The result is theaverage number of months the employees stayed before leaving. Computing separatenumbers for employees who were fired and for those who left voluntarily may be help-ful. Be sure to include all employees who were paid for 1 or more hours of work, eventhose who quit after training or in their first few days.
total number of months worked by all leaversaverage tenure of leavers = ————————————————————
total number of leavers
Tenure Category (of Stayers or Leavers)
Examining tenure in more detail can assist organizations in targeting interventions foremployees at a particular point in their career. For example, when many leavers have6 or fewer months’ tenure, intervention strategies that address the needs of recruitsand new hires are likely to be helpful, such as using inside sources to refer potentialnew hires, providing realistic job previews (RJPs; see Chapter 3), providing mentor-ing for new hires, and conducting socialization interventions. Conversely, if most ofthe leavers have 2 or more years’ tenure, a different set of interventions may be calledfor. To compute tenure category, divide stayers or leavers into groups according to thenumber of months they have worked. For example, to compute the proportion ofleavers who stayed less than 6 months, count the number of employees who left in thelast 12 months. Then count the number of employees in that group who stayed less
Assessing and Evaluating Workforce Challenges • 295
than 6 months before leaving. Divide this number by the total number of employeeswho left, and multiply the result by 100.
total number of leavers with less than
6 months’ tenurepercentage of leavers with less than 6 months’ tenure = —————————— � 100
total number of leavers
This same formula can be used to compute the proportion of leavers who stayed 6–12months, 12–24 months, and more than 2 years.
Vacancy Rates
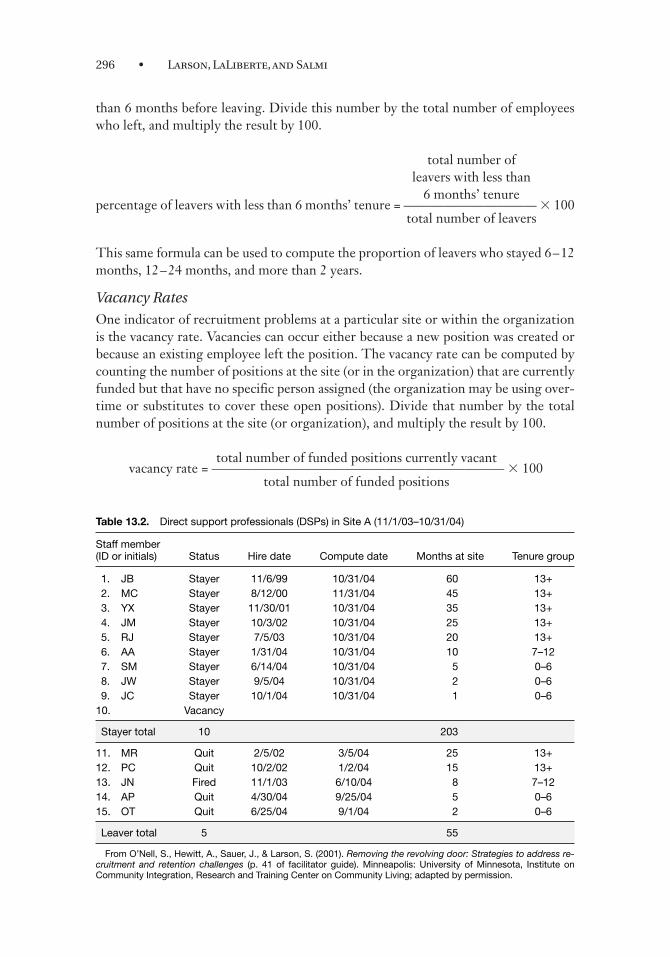
One indicator of recruitment problems at a particular site or within the organizationis the vacancy rate. Vacancies can occur either because a new position was created orbecause an existing employee left the position. The vacancy rate can be computed bycounting the number of positions at the site (or in the organization) that are currentlyfunded but that have no specific person assigned (the organization may be using over-time or substitutes to cover these open positions). Divide that number by the totalnumber of positions at the site (or organization), and multiply the result by 100.
total number of funded positions currently vacantvacancy rate = —————————————————————— � 100
total number of funded positions
296 • Larson, LaLiberte, and Salmi
Table 13.2. Direct support professionals (DSPs) in Site A (11/1/03–10/31/04)
Staff member(ID or initials) Status Hire date Compute date Months at site Tenure group
From O’Nell, S., Hewitt, A., Sauer, J., & Larson, S. (2001). Removing the revolving door: Strategies to address re-cruitment and retention challenges (p. 41 of facilitator guide). Minneapolis: University of Minnesota, Institute onCommunity Integration, Research and Training Center on Community Living; adapted by permission.
Examining Retention Outcomes: An Example
The following is an example of how these general retention measures were calculatedfor one particular site. Table 13.2 shows the information needed to compute the val-ues for the baseline, and Figure 13.1 shows the computations. Included in Table 13.2are all of the current employees at the site (stayers), positions that have been fundedbut are currently not filled (vacancies), the employees from this site who have left(leavers), and whether each person who left did so voluntarily or was fired. Data are in-cluded for every person who worked at this site in a 12-month period.
Tenure for stayers at the site, recorded in terms of months and rounded to thenearest month, was calculated by using each person’s start date and the date the analy-
Assessing and Evaluating Workforce Challenges • 297
Turnover (crude separation rate)
5 leavers in the last 12 months ____________________________ � 100 = 50% turnover rate10 funded positions
Average tenure of current employees (stayers)
203 months ___________ = 22.6 months per stayer9 stayers
Tenure category of stayers
3 stayers have 0–6 months’ tenure 0–6 months _______________________________ � 100 = 33% have 0–6 months’ tenure
9 total stayers
1 stayer has 7–12 months’ tenure 7–12 months ______________________________ � 100 = 11% have 7–12 months’ tenure
9 total stayers
5 stayers have 13+ months’ tenure 13+ months _______________________________ � 100 = 56% have 13+ months’ tenure
9 total stayers
Average tenure of leavers
55 months __________ = 11 months per leaver5 leavers
Tenure category of leavers
2 left with 0–6 months’ tenure 0–6 months ____________________________ � 100 = 40% left in first 6 months
5 left during the last 12 months
1 left with 7–12 months’ tenure 7–12 months ____________________________ � 100 = 20% left after 7–12 months
5 left during the last 12 months
2 left with more than 12 months’ tenure 13+ months ___________________________________ � 100 = 40% left after 12 months
5 left during the last 12 months
Vacancy rate
1 funded position is vacant ________________________ � 100 = 10% vacancy rate10 funded positions
Figure 13.1. Computation summary of turnover, tenure, and vacancy of direct support professionals (DSPs) in SiteABC (11/1/03–10/31/04). (From O’Nell, S., Hewitt, A., Sauer, J., & Larson, S. [2001]. Removing the revolving door:Strategies to address recruitment and retention challenges [p. 42 of facilitator guide]. Minneapolis: University of Min-nesota, Institute on Community Integration, Research and Training Center on Community Living; adapted by per-mission. Source of formulas used as basis for these calculations: Larson, 1998.)
sis was conducted as the reference points. At the time of the analysis, current employ-ees had been at Site ABC for an average of 22.6 months. Among the stayers, 33% hadbeen at the site for less than 6 months, 11% had been at the site 7–12 months, and 56%had been in the home for more than 1 year.
Employees who left Site ABC during the last 12 months had worked at the site anaverage of 11 months before quitting. The turnover rate was 50% for the last 12months. Among the people who left, 40% left in the first 6 months after hire, 20% left7–12 months after hire, and 40% had been with the home for more than a year beforethey left. Four of five of the leavers left voluntarily. The fifth was fired (20% of allleavers were fired). The vacancy rate in this home was 10%.
This site has two distinct groups of employees, long-term staff and new hires. In-terventions such as RJPs (see Chapter 3) or improved orientation practices (see Chap-ter 5) designed to reduce the number of employees who leave early in their employ-ment will be helpful. In addition, this organization needs to consider the needs oflong-term employees. Perhaps interventions for this group might include enhancedtraining or career development opportunities (see Chapters 6 and 7). Using other spe-cialized assessments could help the organization to understand these issues more fullyand could point to particular intervention strategies.
Specific Workforce Development AssessmentsMany different types of workforce assessments can be used to learn more about thespecific types of challenges an organization is facing. These assessments can be usedperiodically to measure the general status or health of an organization or to assess aparticular problem that has emerged. Specific assessments include measures of job sat-isfaction, organizational commitment, leadership, socialization, opinions of exitingemployees, skills or competency assessments for employees, and so forth.
One specific assessment that should be used periodically (every 1–2 years) is asurvey or assessment of employee job satisfaction. Regular assessments of job satisfac-tion show how employees feel about their job. Using such indexes over time allows theorganization to identify areas of relative weakness within the organizational cultureand to monitor changes that might be associated with positive initiatives (e.g., a train-ing program for supervisors) or with changing contextual factors (e.g., decreasing realdollar wages). Another area for ongoing evaluation is the extent to which the expecta-tions of new hires were met during their first few months on the job. The results ofsuch evaluations can be used to improve the information provided to recruits beforethey are hired.
The Gallup Organization evaluated responses to hundreds of questions obtainedfrom more than 1 million employees on different aspects of the workplace (Bucking-ham & Coffman, 1999). Buckingham and Coffman identified the top 12 questions thatpredicted productivity, profit, employee retention, and improved customer service:
• Do I know what is expected of me at work?• Do I have the materials and equipment I need to do my work right?• At work, do I have the opportunity to do what I do best every day?• In the last 7 days, have I received recognition or praise for good work?• Does my supervisor, or someone at work, seem to care about me as a person?• Is there someone at work who encourages my development?• At work, do my opinions seem to count?
298 • Larson, LaLiberte, and Salmi
• Do the mission and/or purpose of my company make me feel like my work is important?• Are my co-employees committed to doing quality work?• Do I have a best friend at work?• In the last 6 months, have I talked with someone about my progress?• At work, have I had opportunities to learn and grow? (1999, p. 28)
These questions can help an organization decide what questions to include in a staffsatisfaction survey. For further guidance, an organization may want to consult theMinnesota Satisfaction Questionnaire (Griffin & Bateman, 1986; discussed later in thischapter) and the satisfaction survey that appears at the end of this chapter. It includesseveral of the items just listed, as well as other items that may be helpful.
The following sections describe some existing standardized and nonstandardizedassessment instruments that can be used to examine a specific challenge that an or-ganization is dealing with.
Standardized Specific Assessment InstrumentsCareful consideration should be given to the type of instrument to be used based onwhat information the organization hopes to obtain. One type of measurement tool isa standardized instrument, which is a survey or a questionnaire that has been tested forvalidity and reliability.
Validity is the degree to which a measure accurately captures the concept it is in-tending to measure (Babbie, 1990; Price, 1997). In other words, does the question askwhat it is supposed to ask, and how well does it do this? Validity plays an importantrole in the quality of a question (Price, 1997). Reliability looks at the quality of an in-strument by examining the extent to which it produces the same results when used re-peatedly (Price, 1997). For example, “Did you fill out a report in the last week?” wouldyield higher reliability than the question “How many times in the last year have youfilled out a report?” Most respondents would remember whether they filled out a re-port for the last week but might struggle to recall the reporting events for the last yearand may therefore give different answers on different days or at different times. Valid-ity and reliability can be relatively difficult to establish, which is why many organiza-tions use measurement instruments that are standardized rather than create their ownand test them for validity and reliability.
Many standardized instruments have been constructed to measure the workforcechallenges mentioned in Table 13.1. Only a few of the thousands of instruments mea-suring workforce issues and outcomes are profiled here.
Minnesota Satisfaction Questionnaire
The Minnesota Satisfaction Questionnaire (MSQ) is one of three widely acceptedmeasures of job satisfaction (Griffin & Bateman, 1986). The MSQ measures satisfac-tion with several different aspects of the work environment (Weiss, Dawis, England,& Lofquist, 1967). The short form contains 20 items that measure satisfaction with thepresent job on a scale of 1 (very dissatisfied ) to 5 (very satisfied ). For example, one itemasks, “On my present job, this is how I feel about the chance to do things for otherpeople.” The MSQ yields three scale scores: intrinsic satisfaction, extrinsic satisfac-tion, and general satisfaction. Intrinsic satisfaction includes items such as the chanceto do things for other people and the chance for a person to do something that makesuse of his or her abilities and that focuses on internal factors the person values. Ex-
Assessing and Evaluating Workforce Challenges • 299
trinsic satisfaction focuses on items that describe things other people do to recognizea person’s value and work, such as the pay for the amount of work the person does.Other standardized assessments of job satisfaction include the Job Description Index(Smith, Kendall, & Hulin, 1969) and the Michigan Measure of Facet Satisfaction(Quinn & Staines, 1979).
Organizational Commitment Questionnaire
Organizational commitment is “the relative strength of an individual’s identificationwith and involvement in a particular organization” (Mowday, Porter, & Steers, 1982,p. 226) and is characterized by a strong belief in and acceptance of the organization’sgoals and values, a willingness to exert considerable effort for the organization, and astrong desire to maintain membership in the organization. Although several instru-ments measure organizational commitment, the most commonly used scale is the Or-ganizational Commitment Questionnaire (OCQ; Mowday, Steers, & Porter, 1979).This 15-item scale has been normed on 2,563 employees in nine different occupations,including psychiatric technicians working with people with intellectual disabilities.The items ask employees to rate items on a scale of 1 (strongly disagree) to 7 (stronglyagree). For example, one item states, “I am proud to tell others that I am part of thisorganization.” Several studies document that the OCQ has adequate reliability and va-lidity (e.g., Ferris & Aranya, 1983; Sullivan, 1982).
Leader Behavior Descriptive Questionnaire
The extent to which a supervisor is considerate of the people he or she supervises is apredictor of turnover identified by Michaels and Spector (1982). Perception by theDSPs of their supervisors can be assessed using the Leader Behavior DescriptiveQuestionnaire (College of Administrative Science, 1957). Respondents rate the fre-quency that their supervisors engage in specific behaviors on a 5-point Likert scalewith 1 meaning always and 5 meaning never. This instrument rates supervisors on ini-tiating structure and consideration. For example, one of the items is “makes his/herattitudes clear to the group.”
Organizational Socialization Scale
A scale by Jones (1986) measures organizational socialization, the manner in which aperson new to the job is taught the customary and desirable behavior and perspectivesfor a particular role within the work setting (Bachelder & Braddock, 1994). Items arerated on a scale of 1 (strongly disagree) to 7 (strongly agree). For example, one item is“This organization puts all newcomers through the same set of learning experiences.”
Nonstandardized Specific Assessment InstrumentsAlthough using a standardized instrument is beneficial for collecting valid and reliabledata, it can also be potentially limiting. A standardized instrument may not ask ques-tions or collect data on issues that are important to an organization. Furthermore,there is often a cost associated with using a standardized instrument.
Modifying an existing standardized instrument allows an organization to captureadditional information specific to that organization. A modified instrument, however,may not be as valid or reliable as the original standardized version.
300 • Larson, LaLiberte, and Salmi
If no existing survey is found that fits the organization’s needs, a tool may need tobe designed. In creating an instrument, validity and reliability are important. Al-though an organization may choose to test an instrument prior to its actual use, nu-merous repeat trials will probably not occur. Therefore, it is vital to build an instru-ment based on carefully thought-out questions. Poorly written questions will yieldpoor data.
Before designing a survey, the organization should ask, “What do we want tomeasure?” The organization needs to prepare a clear, detailed statement of the pur-pose of the survey and the type of information to be obtained. Do one or two key is-sues such as recruitment and/or retention seem most important? The organization canlimit the scope of the survey by addressing the most pressing concerns.
The next step is to construct specific questions. There are two types of questions:open-ended and closed. In open-ended questions respondents provide their own an-swers to the questions (Babbie, 2001). Responses to open-ended questions must be cat-egorized for analysis. This involves transcribing all of the responses, grouping similarresponses together, and naming each group. This is time-consuming and costly (Sin-gleton, Straits, & Straits, 1993). In contrast, closed-ended questions require that re-spondents select an answer from a list. This type of question is popular in surveys be-cause it can provide greater uniformity of responses and is more easily processed. Adisadvantage of this type of question is that it forces the respondent to select an answerthat may not be a good fit. In general, response choices should include all possible re-sponses to be expected and should be mutually exclusive; respondents should not feelcompelled to select more than one answer for each question (Singleton et al., 1993).
Both open-ended and closed-ended questions should have the following features:• Questions should be clear and unambiguous. The organization should avoid ques-
tions that ask about two things. The use of the word and in a question can signalthat the designer should take a second look at the question. For example, if re-spondents are asked to agree or disagree with the statement “DSPs are not paidenough, and the state government should do something about this,” it will be diffi-cult to know if they are responding to the statement that DSPs aren’t paid enough,the suggestion that states should help increase DSP wages, or both. It might beclearer to ask respondents to disagree or agree with the statement “DSPs aren’tpaid enough” and then ask them to disagree or agree with the statement “State gov-ernments should help increase DSP wages.” In addition, the organization shouldavoid using indefinite words such as usually, seldom, many, few, here, and there, whichcan have different meanings to different people (Singleton et al., 1993).
• Questions should be relevant to most respondents. If not, respondents might makeup answers on the spot to questions they have never really thought about. Respon-dents should be able to understand the connection between the questions, the pur-pose of the survey, and their role as respondents.
• Questions should use vocabulary that is appropriate to the respondents. The wordsshould be understandable and should be culturally relevant and sensitive.
• Questions should be short. Respondents should be able to read each questionquickly, understand its intent, and select an answer without difficulty (Babbie, 2001).
• Negative items should be avoided. Negation in a questionnaire item can lead tomisinterpretation. For example, asking respondents to agree or disagree with the
Assessing and Evaluating Workforce Challenges • 301
statement “FLSs should not have to provide direct support” could be confusing.Too often, readers misinterpret the question to mean the opposite of its intendedmeaning.
• Biased items and terms should be avoided. Biased questions or terms such as“Don’t you agree that . . . ” should instead be phrased as “Do you agree or disagreethat. . . . ” The first question is an example of a leading question. This type of ques-tion suggests a possible answer or makes some responses seem more acceptablethan others (Babbie, 2001; Singleton et al., 1993).
• Include a complete listing of alternatives. For closed-ended questions, give a com-plete listing of alternatives to a question, representing both moderate attitudes andextreme attitudes in each direction (Singleton et al., 1993).Several different types of questions can be used on a survey. Rating scales that
convert respondents’ reactions to a numerical rating can prove useful. For example, aLikert scale uses numbers representing degrees of liking something; such as 1 = dislikevery much, 2 = dislike somewhat, 3 = like somewhat, 4 = like very much. It is the most com-monly used question type in surveys (Babbie, 1990; Singleton et al., 1993).
Another type of scale is the behaviorally anchored rating scale. In this type ofscale, skills needed to function in a job are anchored around a midpoint. For example,on a scale of 1–5, the midpoint would be described as the level of skill required to per-form the job competently. A rating of five would be considered ideal; conversely, ascore of one would represent a severe deficiency. To create a rating scale that can beused objectively and uniformly, it is helpful to attach a behavior to each score (Barn-hart, 2002). This type of rating scale is often used in structured interviews (see Table4.2 in Chapter 4 for an example).
Asking respondents to rank questions is also useful. Pretesting with open-endedquestions, however, should be done to ensure that the items chosen are inclusive andmeaningful to respondents (Singleton et al., 1993). For example, employees may beasked to select the top three reasons they want to leave their job. The first 50 to 100respondents may be asked to answer an open-ended question. Those first responseswould be used to establish a set of categories that reflect common responses to thequestion. The question can then be converted to a ranking question by listing all ofthe responses given by three or more people and leaving a space for people to enter re-sponses that are not on the list.
Instructions at the beginning of any survey should inform the participant howmany questions are included and should estimate the length of time it will take to com-plete the survey. Demographic questions at the beginning or the end of the survey canbe used to learn whether certain groups of employees have better outcomes (e.g., lowerturnover, greater job satisfaction) than others (e.g., FLSs versus DSPs). A set of sampledemographic questions are included at the end of this chapter. As with any other typeof question, only include demographic items that are directly related to the purpose ofthe survey. Each organization using a survey or other assessment technique should be careful to comply with legal requirements such as managing private informa-tion as mandated by the Health Insurance Accountability and Portability Act of 1996 (PL 104-191). In some organizations, a human subjects review board will also need tobe consulted.
302 • Larson, LaLiberte, and Salmi
A cover letter should point out the purpose of the study. The cover letter shouldalso explain how confidentiality will be handled. A coding system on each survey couldbe used to protect the identity of the participants yet allow those conducting the sur-vey to distinguish between respondents. Some organizations hire an independent con-sultant to design, administer, and analyze survey results. This lends additional objec-tivity to the survey and has the added advantage of discreetness. Respondents feelmore secure in giving an honest response when they know that a disinterested party isreviewing their written reactions. Other organizations have the human resources de-partment handle the survey and present only aggregate responses to supervisors andmanagers. Maintaining confidentiality is critical to avoid retaliation against respon-dents who report a negative reaction to a question. Furthermore, respondents who donot trust that their responses will be treated confidentially are less likely to answertruthfully and are more likely to avoid responding at all. Such a problem can make itvery difficult to accurately assess the extent and nature of concerns.
Once the questions for a survey have been drafted, it is helpful to have a smallgroup of employees complete the survey to test the questions. This test group can beasked to report how long it took them to complete the survey and if any of the ques-tions were confusing, difficult to understand, ambiguous, and/or unclear. The feed-back can then be used to refine the survey before it is used with the rest of the em-ployees (Babbie, 2001). This testing can help the organization to avoid irritatingemployees with instructions that are unclear, questions that are difficult to answer, orsurveys that take too long to complete.
Sometimes surveys are given to all possible respondents (the whole population).Other times, only a sample of respondents is used. A sample is a subset of respondentsthat represents a larger group. An adequate sample can allow an organization to learnabout the total population without having to ask everyone to participate (Babbie,1990). With organizations of fewer than 100 employees, it is often advisable to surveyall appropriate staff members. In larger organizations, however, it is often possible toselect a sample of the target population to survey.
In selecting a sample, the objective is to obtain a representation of a particulargroup of employees, also known as the sample frame. For example, an organization in-terested in learning more about its 500 DSPs would select participants from this sampleframe. To achieve this, the basic principle of probability sampling must be applied. Thatis, all members of a particular group should have an equal chance of being included in thesample (Babbie, 1990). One approach is to employ systematic sampling, in which everynth person is selected from a list. For example, in a list of 500 people, every fifth personis selected to be in the sample, for a total sample of 100 (20% of the total population).
The question of size of sample depends on how the answers will be used. For pur-poses of grouping the answers by division, unit, or manager, it is important to get sur-veys back from at least 10–20 people per division, unit, or manager. This number isusually large enough for a statistical test of differences to detect true differences thatexist between groups. Another consideration is the extent of involvement or propor-tion of the organization to be involved in the survey. If at least 20% involvement is de-sired, and there are 600 people at the organization, the sample size should be at least120 participants.
Assessing and Evaluating Workforce Challenges • 303
Another factor in deciding on how many people to survey is the proportion ofpeople who actually return the survey. This proportion is called the response rate. Thegoal should be to get surveys back from at least 50%–80% of respondents. If 120people receive surveys and 60 people return them, the response rate is 50% (60 dividedby 120 times 100). If 96 people return surveys, the response rate is 80%. Responserates can be increased with encouragement from supervisors who emphasize the im-portance of the feedback that is obtained from the survey. Also, higher response ratescan be obtained by preliminary notification of the survey and its importance (Single-ton et al., 1993). Once staff members understand that the organization is interested inissues of concern to the staff and is looking to make necessary changes, the participa-tion rate usually increases. Response rates are also often higher when responses areanonymous or when another trusted mechanism to ensure confidentiality is used.
Several assessment instruments (described next) are included at the end of thischapter. They were developed for research purposes by the University of Minnesota.Other examples can be found at the ends of other chapters in this book.
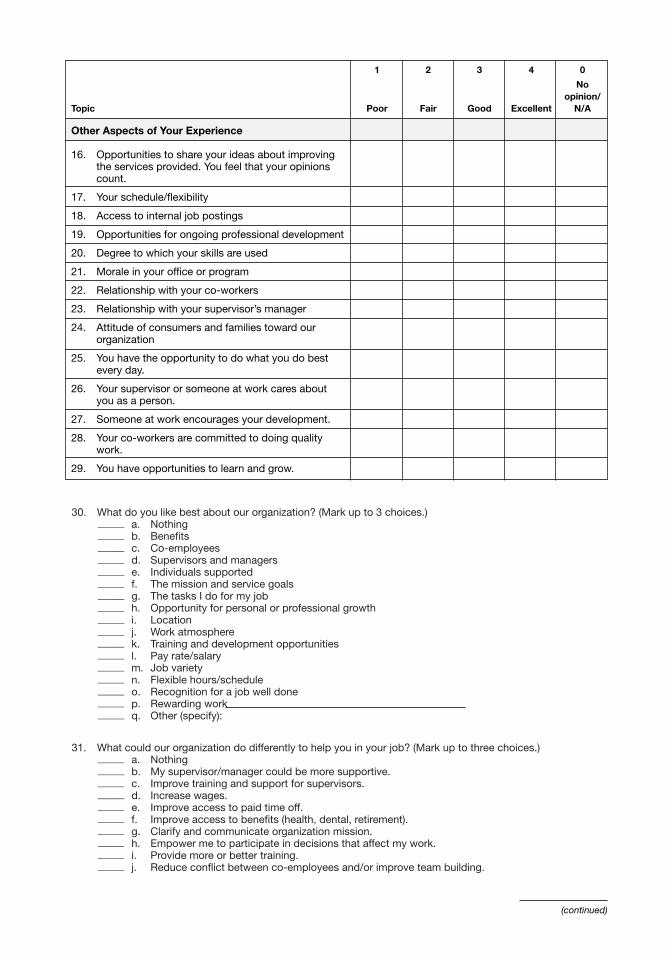
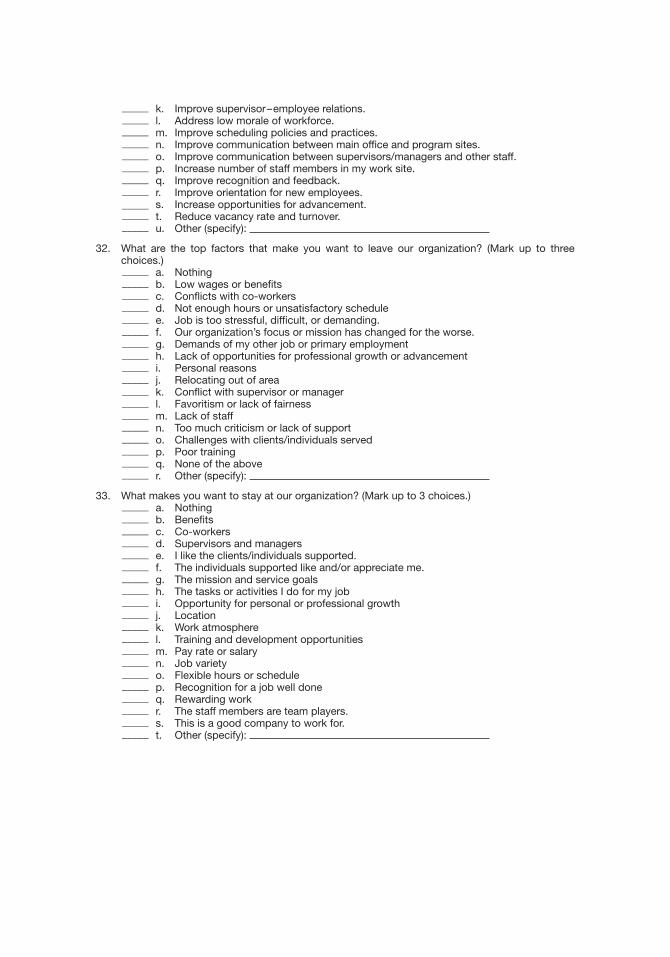
Staff Satisfaction Survey
The Staff Satisfaction Survey was created with the assistance of a large provider or-ganization in Minnesota. The first part solicits information about satisfaction withvarious job components. The second part asks employees to provide suggestions aboutwhat they like and do not like about their jobs and what they wish would be changed.It was developed based on analysis of hundreds of responses to open-ended questionsabout these topics. The responses were grouped into themes that were then incorpo-rated into the survey. This instrument has not undergone reliability testing. Its facevalidity has been assessed through reviews by managers, administrators, and humanresources professionals. It has been used with hundreds of employees in several differ-ent organizations.
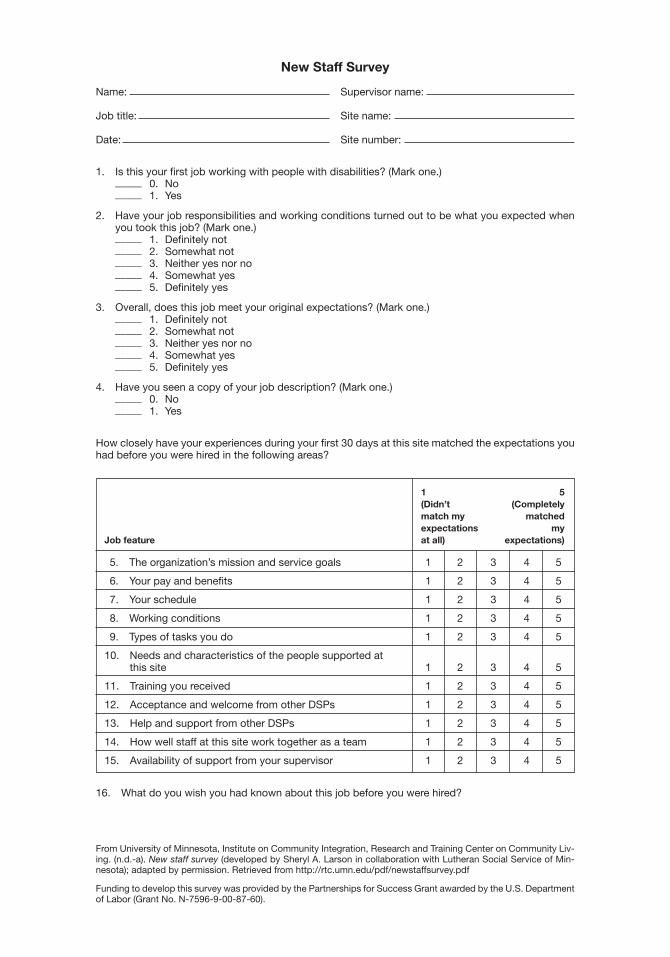
New Staff Survey
The New Staff Survey was developed to evaluate the extent to which the expectationsof newly hired DSPs matched their experiences on the job. It has been used in con-junction with RJPs to assess the effectiveness of those interventions. In some organi-zations, it is used as a survey to be completed independently by a newly hired employeeafter 30 days on the job. In other organizations, the survey is completed and is dis-cussed directly with the new employee’s supervisor.
Training Experiences Satisfaction Survey
The Training Experiences Satisfaction Survey was developed to assess staff satisfac-tion with the training provided by the employer. An earlier eight-item version of theTraining Experiences Satisfaction Survey was used in a series of research projects toevaluate employee opinions about the training they had received. Internal consistency(a measure of whether all of the items on the scale measure the same category of in-formation) for the eight-item scale was .81 based on responses from more than 100DSPs in community residential settings. The Training Experiences Satisfaction Sur-vey that appears in this chapter is a later version of this instrument, refined based onresearch use of the original version.
304 • Larson, LaLiberte, and Salmi
Other Methods of Workforce Assessment
Exit Interview or Survey
Exit interviews or surveys can ask leavers the extent to which several factors madethem want to stay or leave. A recent national study of human resources managersfound that 87% of all organizations surveyed conducted exit interviews or surveys (So-ciety for Human Resource Management, 2001b). Some organizations have found ituseful to ask leavers questions similar to or the same as those asked on the Staff Satis-faction Survey. Qualitative exit interviews are also useful in drawing out informationto assess and modify organization practices. Among the most productive qualitativeinterview items are questions such as the following:• If your best friend were considering a job like yours at this site, what two or three
things would you tell him or her? Give specific examples.• Give an example of one or two specific incidents that made you want to stay on this
job.• Give an example of one or two specific incidents that made you want to leave this
job.• What could (your supervisor and/or this organization) do to make your job better?• What type of position (if any) do you plan to work in after you leave this position
(e.g., DSP, supervisor, job coach, bank teller, full-time student, stay-at-homeparent)?
Asking leavers to respond to these questions can provide valuable information to as-sess and modify organization practices. Other information to review includes the em-ployee’s status at exit (e.g., whether leavers were fired or left for other reasons such asspousal transfer or to complete a college degree). Organizations may also want to in-clude the job performance of the leavers, whether the leavers will continue to be on-call workers, and where the people went when they left the organization (e.g., to per-form similar roles for another organization; to better position in the field; to makelateral move for higher pay, such as becoming a paraprofessional in the public schools).
Focus Groups
Focus groups are another common method to gather information from people aboutwhat they think and feel. Focus groups can help an organization discover underlyingconcerns and issues or to identify perceptions about a specific area. Focus groups are used not only to determine concerns but also to further refine questions, definechallenges, or gather ideas about solutions to problems that exist in the work environ-ment. Focus groups can be used alone or in conjunction with another strategy such asa survey.
A focus group is a specific group of people who have been brought together forthe purpose of informing others about important issues. Focus groups have a specificstructure and a strategic process designed to yield certain outcomes. When an organi-zation uses focus groups on workforce practices and issues, it is important to identifythe specific purpose for the focus group before it occurs. The purpose provides the rea-son for the focus group, is the driving force when the organization is formulating ques-tions to ask participants, defines the scope of the focus group process, keeps the groupfocused during the meeting, and guides analysis of the information gathered.
Assessing and Evaluating Workforce Challenges • 305
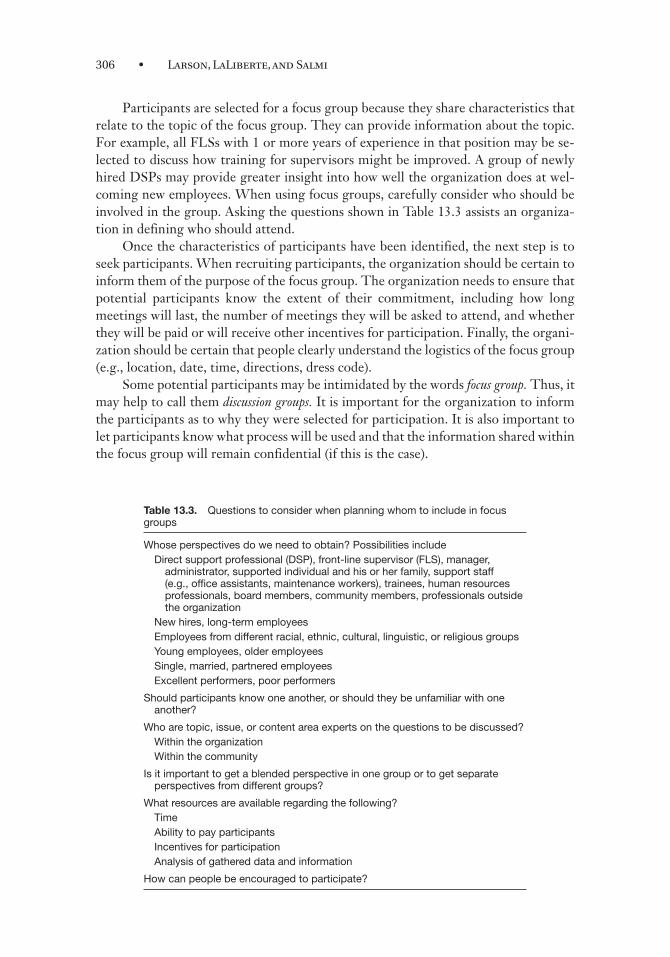
Participants are selected for a focus group because they share characteristics thatrelate to the topic of the focus group. They can provide information about the topic.For example, all FLSs with 1 or more years of experience in that position may be se-lected to discuss how training for supervisors might be improved. A group of newlyhired DSPs may provide greater insight into how well the organization does at wel-coming new employees. When using focus groups, carefully consider who should beinvolved in the group. Asking the questions shown in Table 13.3 assists an organiza-tion in defining who should attend.
Once the characteristics of participants have been identified, the next step is toseek participants. When recruiting participants, the organization should be certain toinform them of the purpose of the focus group. The organization needs to ensure thatpotential participants know the extent of their commitment, including how longmeetings will last, the number of meetings they will be asked to attend, and whetherthey will be paid or will receive other incentives for participation. Finally, the organi-zation should be certain that people clearly understand the logistics of the focus group(e.g., location, date, time, directions, dress code).
Some potential participants may be intimidated by the words focus group. Thus, itmay help to call them discussion groups. It is important for the organization to informthe participants as to why they were selected for participation. It is also important tolet participants know what process will be used and that the information shared withinthe focus group will remain confidential (if this is the case).
306 • Larson, LaLiberte, and Salmi
Table 13.3. Questions to consider when planning whom to include in focusgroups
Whose perspectives do we need to obtain? Possibilities includeDirect support professional (DSP), front-line supervisor (FLS), manager,
administrator, supported individual and his or her family, support staff (e.g., office assistants, maintenance workers), trainees, human resourcesprofessionals, board members, community members, professionals outsidethe organization
New hires, long-term employeesEmployees from different racial, ethnic, cultural, linguistic, or religious groupsYoung employees, older employeesSingle, married, partnered employeesExcellent performers, poor performers
Should participants know one another, or should they be unfamiliar with one another?
Who are topic, issue, or content area experts on the questions to be discussed?Within the organizationWithin the community
Is it important to get a blended perspective in one group or to get separate perspectives from different groups?
What resources are available regarding the following?TimeAbility to pay participantsIncentives for participationAnalysis of gathered data and information
How can people be encouraged to participate?
Finding a skilled facilitator is as important as selecting the correct participants.The facilitator needs to be comfortable working with groups and should have experi-ence facilitating focus groups. Facilitators must promote a nonjudgmental, permissiveenvironment that encourages self-disclosure among participants. Participants shouldfeel free to share their perceptions and points of view without feeling pressure to con-form or reach consensus (Krueger & Casey, 2000). It is also important to note that themoderator is not in a position of power and should promote comments of all types,both positive and negative.
Facilitators also need to be familiar with and have the ability to use various typesof group processes including brainstorming and the nominal group process, in whicheach group member independently generates answers to a question and then shares,or nominates, an idea one at a time until all ideas have been shared (Morrison, 1998).In some circumstances, especially when controversial issues will be discussed or whenthe participants are very mistrustful, it may help to use a facilitator from outside of theorganization. The person selected should be someone the participants can easily trust.
The ideal size for a focus group is 5–10 people. In groups smaller than 5, there ismore opportunity to share ideas, but the restricted size results in a smaller pool of totalideas. If the group size exceeds 10, there is a tendency for the group to fragment(Krueger & Casey, 2000). When selecting the focus group size, the organization canconsider how many different groups will be used. It is often better to have more thanone group than to have one group that is too large.
Whatever technique is used to assess the organization, it will be necessary tosummarize the results so that they can be used to inform decision making about strate-gies to remediate identified challenges.
Select an Intervention StrategyThe previous sections of this chapter have described many ways to learn the nature,size, and scope of the challenge an organization has. Once the problem or challengehas been identified, the next step is to select an intervention strategy to address thatproblem. Detailed instructions and guidance on how to select and implement an in-tervention for a specific problem can be found in Chapter 14 of this book. In that chap-ter, intervention selection and implementation are broken down into several parts:• Selecting a strategy• Identifying the major components of the strategy• Identifying the major barriers to implementation• Identifying supporting arguments and supporting stakeholders for the strategy• Setting goals, measuring progress, and establishing a time frameIn addition, most of the chapters in this book describe one or more intervention strate-gies that can be used to overcome various challenges. For example, Chapter 3 describeshow to use RJPs to reduce turnover by new employees who would not otherwise reallyunderstand what the job would be like. Readers are referred to those chapters for moreinformation about selecting an intervention.
Set Goals and Measure ProgressOnce the baseline measurement is established and the intervention is selected and im-plemented, a plan is needed for how to measure and evaluate any changes in the prob-
Assessing and Evaluating Workforce Challenges • 307
lem since the baseline measurement. This measurement will likely include both annualupdates of all general workforce development assessments (e.g., turnover calculations,staff satisfaction surveys), as well as periodic reassessments of specific indicators usedto establish the nature and extent of the problem (e.g., organizational commitmentmeasures). The plan should specify what will be assessed, when it will be assessed, andhow the information will be shared with those involved in the intervention. Theguidelines described in the section on assessing the problem also apply to the processof selecting a measurement method or tool to assess progress once an intervention hasbeen implemented.
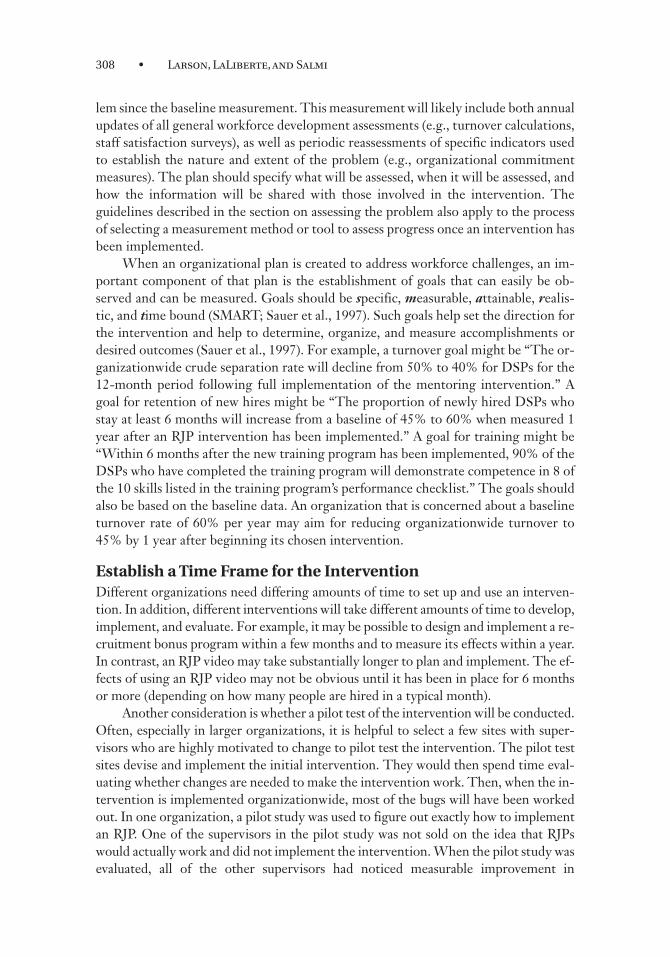
When an organizational plan is created to address workforce challenges, an im-portant component of that plan is the establishment of goals that can easily be ob-served and can be measured. Goals should be specific, measurable, attainable, realis-tic, and time bound (SMART; Sauer et al., 1997). Such goals help set the direction forthe intervention and help to determine, organize, and measure accomplishments ordesired outcomes (Sauer et al., 1997). For example, a turnover goal might be “The or-ganizationwide crude separation rate will decline from 50% to 40% for DSPs for the12-month period following full implementation of the mentoring intervention.” Agoal for retention of new hires might be “The proportion of newly hired DSPs whostay at least 6 months will increase from a baseline of 45% to 60% when measured 1year after an RJP intervention has been implemented.” A goal for training might be“Within 6 months after the new training program has been implemented, 90% of theDSPs who have completed the training program will demonstrate competence in 8 ofthe 10 skills listed in the training program’s performance checklist.” The goals shouldalso be based on the baseline data. An organization that is concerned about a baselineturnover rate of 60% per year may aim for reducing organizationwide turnover to45% by 1 year after beginning its chosen intervention.
Establish a Time Frame for the InterventionDifferent organizations need differing amounts of time to set up and use an interven-tion. In addition, different interventions will take different amounts of time to develop,implement, and evaluate. For example, it may be possible to design and implement a re-cruitment bonus program within a few months and to measure its effects within a year.In contrast, an RJP video may take substantially longer to plan and implement. The ef-fects of using an RJP video may not be obvious until it has been in place for 6 monthsor more (depending on how many people are hired in a typical month).
Another consideration is whether a pilot test of the intervention will be conducted.Often, especially in larger organizations, it is helpful to select a few sites with super-visors who are highly motivated to change to pilot test the intervention. The pilot testsites devise and implement the initial intervention. They would then spend time eval-uating whether changes are needed to make the intervention work. Then, when the in-tervention is implemented organizationwide, most of the bugs will have been workedout. In one organization, a pilot study was used to figure out exactly how to implementan RJP. One of the supervisors in the pilot study was not sold on the idea that RJPswould actually work and did not implement the intervention. When the pilot study wasevaluated, all of the other supervisors had noticed measurable improvement in
308 • Larson, LaLiberte, and Salmi
turnover, but this person had not. The feedback that person got from the other super-visors helped to motivate him to implement the intervention.
The organization should consider how long the intervention will be in place.Often an intervention can last many months to several years. Different situations maydictate different time frames for evaluation of progress. There is no one correct answer,but a definite time frame for checking progress should be selected. The organizationshould not allow the intervention to continue indefinitely without an evaluation.
Evaluate SuccessAfter the intervention is implemented, a final step is to evaluate the intervention, toidentify whether it actually produced the results it was designed to produce. An or-ganization can use the assessment strategies identified in this chapter to learn whetherthe intervention made a difference. For example, after initially having identified turn-over as the problem, the organization may have decided to assess both the turnoverrate and the proportion of new hires who left the organization during the first 6months after hire. If those assessments showed that turnover was 50% and that 40%of all newly hired DSPs left the organization within 6 months after hire, the organi-zation may have selected an RJP as its intervention. The intervention is not completeuntil an evaluation has been conducted to learn if it actually made a difference or not.In this example, the organization may choose to assess turnover and the tenure cate-gories of leavers 1 year after the intervention started. If that evaluation shows nochange in turnover or in the tenure of people who get an RJP, the organization willneed to use some of the specialized assessment tools to learn more about why there wasno change. For example, using the New Staff Survey may reveal that most new hiresstill have many unmet expectations when they are hired. In this case, the organizationwould need to refine the RJP to incorporate more of the information that new hireshave unmet expectations about. In contrast, if the 1-year assessment shows thatturnover has declined to 45% and that only 30% of all newly hired DSPs left within 6months after hire, the organization can conclude that the intervention is working asdesigned and that it should be continued. What is important is that the organizationhave an evaluation plan and use it to learn if the intervention worked.
OVERCOMING IMPLEMENTATION BARRIERS
Just as some people resist going to the doctor for regular physical examinations, someorganizations resist conducting regular assessments of their workforce. Without thisassessment, however, it is impossible to accurately identify problems, assess potentialcauses, and monitor the effectiveness of strategies to address those challenges. Com-mon barriers to evaluating progress on workforce development interventions and howthey might be overcome are discussed next.• Not seeing the value of the assessment (“We don’t have time because we already have too
much paperwork to do”): It is common for supervisors and human resources profes-sionals who are struggling to find, hire, and train sufficient staff to not see the valueof collecting assessment and evaluation information. An organization can over-
Assessing and Evaluating Workforce Challenges • 309
come this barrier by involving supervisors and human resources staff in planningthe interventions so that they have a stake in the outcome. The organization canexplain that the information from supervisors and human resources staff is neededto assess whether interventions actually make a difference or not and by using themost succinct assessment strategies that will actually get the job done. Organiza-tions should not collect more information than is needed. In addition, they shouldbe certain to use existing data whenever possible. Many organizations already havea database that can be used to assess turnover rates, tenure of stayers and leavers,and vacancy rates. Using those databases rather than asking employees to providenew information reduces the burden on those employees. Organizations that donot have such databases may wish to invest in a human resources database systemas part of their intervention.
• Not being familiar with existing instruments or assessment procedures: It is difficult to as-sess or evaluate workforce outcomes without the necessary tools. Often, organiza-tions do not know where to obtain assessment tools including surveys, formulas,and comparison data. This chapter includes several instruments and instructions onhow to compute common baseline data. The literature review in Chapter 1 pro-vides some of the needed comparison data. The resources section in this chapterlists other sources of information about instruments and assessment procedures.
• Lacking resources to pay for acquiring and using published instruments: Published in-struments can be expensive to use, but many have the advantage of being stan-dardized. Some organizations find that investing in standardized instruments paysoff because the information gathered is of high quality. Other organizations maywish to consult several published tools and, using the principles described in thischapter, modify them or create their own. A third option is to hire a consultant tocreate an instrument. Tools for conducting the most basic general workforce de-velopment assessments are included at the end of this chapter.
• Forgetting to seek input from DSPs throughout the process: A complete understandingof workforce issues and how to address them can only be obtained if all of the af-fected stakeholders are involved in the process. DSPs are key stakeholders for theissues discussed in this book, yet organizations often resist reaching out to DSPsto ask them about their problems and ideas for solutions. This resistance is some-times the result of fear that if DSPs are brought together to discuss problems, theymight organize a union. Other concerns include a reluctance to share informationabout what is learned with DSPs, having difficulty with work coverage so thatDSPs participate in data collection and problem-solving meetings, and a reluc-tance to pay DSPs for work other than providing direct support. Although thesefears are very real, organizations that reach out and include DSPs often find thatthe benefits of doing so far outweigh the negatives. Including DSPs can help DSPsfeel empowered, important, and valued. It validates their opinions and input andfosters increased commitment to both the organization and to the field. Over-coming the barrier of excluding DSPs requires the organization to be open tochange and to value the opinions of all its employees, including DSPs.
• Spending too much time assessing the problem and never implementing an intervention:Assessment and evaluation are very important parts of the intervention process,
310 • Larson, LaLiberte, and Salmi
but they are not the end in themselves. The lead authors of this book have workedwith organizations that have spent years getting baseline information without ac-tually implementing interventions to produce change. The predictable results ofsuch a strategy are that the organization obtains a better idea of how it measuresup to other organizations but that there is no change in the important indicators.Organizations should establish a baseline but should not let the process of doing sooverwhelm its effort. Organization should begin implementing at least one inter-vention within 3–6 months of the baseline assessment so that progress can be madetoward better workforce outcomes.
• Implementing an intervention without first conducting a baseline assessment: When anorganization neglects to establish a baseline, it has no way to know if the inter-vention has made a difference, aside from relying on a gut feeling that may or maynot be accurate. Organizations should be sure to conduct at least general work-force development assessments before moving on to interventions and evaluationof progress.
• Neglecting to create a plan to evaluate progress: It is easy for an organization to get sowrapped up in conducting interventions that it totally forgets to check if anyprogress is being made. To avoid this, the intervention plan should incorporate aplan to evaluate progress that is specified before the intervention is ever imple-mented (see the end of Chapter 14 for a tool to organize intervention planning).The organization can consult the plan periodically to ensure that it is being im-plemented as intended. Then at the specified interval, the evaluation can be con-ducted to assess progress.
• Forgetting to provide feedback to people involved in the intervention to monitor progress andidentify when adjustments are needed: The purpose of conducting an evaluation is tomeasure progress and to motivate others in the organization to continue to imple-ment selected interventions. People who have completed surveys or who have par-ticipated in focus groups need to learn how the information they provided was used.Failing to give this feedback will cause people to wonder if they wasted their time.Furthermore, if the organization does nothing visible with the results, the peoplewho gave their time to the process will be much more reluctant to participate thenext time the organization needs information. Another important function of pro-viding feedback is to help people understand how they are doing. Providing infor-mation to supervisors about their turnover rates and vacancy rates and how thoserates compare with those for the organization as a whole helps them to understandhow well they are doing or to understand the extent of the problem they have.
QUESTIONS TO PONDER
1. How big are the workforce challenges your organization is experiencing? How doyou know? How does your organization learn whether interventions actuallymake a difference?
2. How often does your organization measure turnover, tenure of leavers, and va-cancy rates? (Does it measure those factors at least annually?)
Assessing and Evaluating Workforce Challenges • 311
3. How is information about turnover and retention challenges shared with employ-ees at your organization?
4. When was the last time your organization measured staff satisfaction? What didyou do with the results? What is your next step now?
5. What procedures has your organization established to gather information fromemployees who are leaving the organization?
6. In what ways does your organization seek information from various employeesand stakeholders about workforce problems and solutions?
7. Have the purpose and outcome of data collection efforts been made clear to thoseasked to provide information?
8. How has your organization used the assessment information to guide its next steps?
CONCLUSION
This chapter provides an overview of the assessment and planning process that or-ganizations can use to learn about the nature and extent of their workforce challenges.It suggests that baseline and follow-up evaluations are essential to guide the process ofidentifying a problem, understanding the scope and nature of the problem, guiding theselection of an intervention, and assessing whether an intervention worked as in-tended. Chapter 14 provides more detailed information about how to use the assess-ment process to select a strategy for change and to develop comprehensive organiza-tional change interventions.
This site has links to calculators to estimate the costs of hiring and training, wages and benefits,and scheduling. (Note: Some of the links on this page do not work.)
University of Wisconsin Extension Services (http://www.uwex.edu/ces/cced/publicat/turn.html#calc)
This on-line calculator of the cost of turnover was developed by W.H. Pinkovitz, J. Moskal, andG. Green.
Information on Workforce Development SurveysInformation about other standardized surveys useful for workforce assessments can be obtainedfrom the following web sites:
Society for Human Resources Management (http://www.shrm.org/ hrresources/surveys_published/AllSurveysTOC.asp#TopOfPage)
Direct Support Professional Workforce Status and Outcomes
Please fill in the blanks for your organization, focusing only on direct support professional (DSP) posi-tions. These formulas assume you are making computations based on a calendar year.
Turnover (crude separation rate) of DSPs
total number of DSPs who left during the year —————————————————————————— � 100 = turnover ratetotal number of funded DSP positions as of December 31
total number of DSPs who leftFill in: ——————————————————— � 100 = % turnover rate
current staff + vacant positions
Average tenure of current DSPs (stayers)
total number of months worked by all current DSPs in the organization as of December 31 ————————————————————— = average tenure of stayers
total number of DSPs employed by the organization as of December 31
total number of months worked by current DSPsFill in: ————————————————————————— = months’ average tenure
total number of DSP stayers
Average tenure of DSPs who left in the last 12 months (leavers)
total number of months worked during the year by DSPs who left the organization by December 31 ——————————————————————— = average tenure of leavers
total number of DSPs who worked during the year and resigned by December 31
total number of months worked by DSPs leaversFill in: ————————————————————————— = months’ average tenure
total number of DSPs leavers
Percentage of DSP leavers with less than 6 months’ tenure
total number of DSPs who worked during the year and left
before working 6 months ———————————————— � 100 = % of leavers with less than 6 months’ tenuretotal number of DSPs who worked
during the year and resigned by December 31
total number of DSPs who left before 6 months
Fill in: ——————————————— � 100 = % of leavers with less than 6 months’ total number of DSP leavers tenure
Vacancy rate
total number of vacant positions as of December 31 —————————————————————————— � 100 = % vacancy ratetotal number of funded DSP positions as of December 31
total number of vacant positionsFill in: ————————————————— � 100 = % vacancy rate
total number current staff + total number of vacant positions
From O’Nell, S., Hewitt, A., Sauer, J., & Larson, S. (2001). Removing the revolving door: Strategies to address re-cruitment and retention challenges (p. 13 of Appendix C in facilitator guide). Minneapolis: University of Minnesota, In-stitute on Community Integration, Research and Training Center on Community Living; adapted by permission. Alsoavailable on-line: http://rtc.umn.edu/pdf/turnover.pdf
Source of formulas: Larson, 1998.
Staff Satisfaction Survey
Name: Supervisor name:
Job title: Site name:
Date: Site number:
This survey will be used to improve our workforce practices. Please answer each question as accurately as possible.If you do not understand a question, answer it as well as you can and note your question(s) in the margin. Youranswers will be kept confidential and will not affect your status as an employee at our organization. When you havecompleted this survey, please return it in the envelope provided. If you have questions, you can contact
. Thank you.
Please rate your work at our organization in the following areas. For each numbered item, mark in the column thatmost closely describes your overall opinion of each item.
From University of Minnesota, Institute on Community Integration, Research and Training Center on Community Living. (n.d.-b). Staffsatisfaction survey (developed by Sheryl A. Larson in collaboration with Lutheran Social Service of Minnesota); adapted by permis-sion. Retrieved from http://rtc.umn.edu/pdf/staffsatisfaction.pdf
Funding to develop this survey was provided by the Partnerships for Success Grant awarded by the U.S. Department of Labor (GrantNo. N-7596-9-00-87-60).
(continued)
1 2 3 4 0
No
opinion/
Topic Poor Fair Good Excellent N/A
Orientation and Training
1. Availability of a clear job description for your position
2. Communication of expectations about your job performance
3. Completeness and timeliness of orientation about our organization in general and your workplace in particular
4. Sufficient training materials and training opportunities to allow you to perform your job well
5. Availability of follow-up training
Supervision
6. Availability of a supervisor to answer your questions and to assist you to carry out your duties
7. Feedback and evaluation regarding your performance
8. Recognition by your supervisor for your accomplishments
9. Fairness in supervision and employment opportunities
10. Relationship with your supervisor
Compensation and Benefits
11. Your rate of pay for your work
12. Paid time off you receive
13. Our policy regarding eligibility for paid time off
14. Benefits you receive (for example, health and dental insurance, retirement)
15. Our policy regarding eligibility for benefits
30. What do you like best about our organization? (Mark up to 3 choices.)_____ a. Nothing_____ b. Benefits_____ c. Co-employees_____ d. Supervisors and managers_____ e. Individuals supported_____ f. The mission and service goals_____ g. The tasks I do for my job_____ h. Opportunity for personal or professional growth_____ i. Location_____ j. Work atmosphere_____ k. Training and development opportunities_____ l. Pay rate/salary_____ m. Job variety_____ n. Flexible hours/schedule_____ o. Recognition for a job well done_____ p. Rewarding work_____ q. Other (specify):
31. What could our organization do differently to help you in your job? (Mark up to three choices.)_____ a. Nothing_____ b. My supervisor/manager could be more supportive._____ c. Improve training and support for supervisors._____ d. Increase wages._____ e. Improve access to paid time off._____ f. Improve access to benefits (health, dental, retirement)._____ g. Clarify and communicate organization mission._____ h. Empower me to participate in decisions that affect my work._____ i. Provide more or better training._____ j. Reduce conflict between co-employees and/or improve team building.
1 2 3 4 0
No
opinion/
Topic Poor Fair Good Excellent N/A
Other Aspects of Your Experience
16. Opportunities to share your ideas about improving the services provided. You feel that your opinions count.
17. Your schedule/flexibility
18. Access to internal job postings
19. Opportunities for ongoing professional development
20. Degree to which your skills are used
21. Morale in your office or program
22. Relationship with your co-workers
23. Relationship with your supervisor’s manager
24. Attitude of consumers and families toward our organization
25. You have the opportunity to do what you do best every day.
26. Your supervisor or someone at work cares about you as a person.
27. Someone at work encourages your development.
28. Your co-workers are committed to doing quality work.
29. You have opportunities to learn and grow.
(continued)
_____ k. Improve supervisor–employee relations._____ l. Address low morale of workforce._____ m. Improve scheduling policies and practices._____ n. Improve communication between main office and program sites._____ o. Improve communication between supervisors/managers and other staff._____ p. Increase number of staff members in my work site._____ q. Improve recognition and feedback._____ r. Improve orientation for new employees._____ s. Increase opportunities for advancement._____ t. Reduce vacancy rate and turnover._____ u. Other (specify):
32. What are the top factors that make you want to leave our organization? (Mark up to threechoices.)_____ a. Nothing_____ b. Low wages or benefits_____ c. Conflicts with co-workers_____ d. Not enough hours or unsatisfactory schedule_____ e. Job is too stressful, difficult, or demanding._____ f. Our organization’s focus or mission has changed for the worse._____ g. Demands of my other job or primary employment_____ h. Lack of opportunities for professional growth or advancement_____ i. Personal reasons_____ j. Relocating out of area_____ k. Conflict with supervisor or manager_____ l. Favoritism or lack of fairness_____ m. Lack of staff_____ n. Too much criticism or lack of support_____ o. Challenges with clients/individuals served_____ p. Poor training_____ q. None of the above_____ r. Other (specify):
33. What makes you want to stay at our organization? (Mark up to 3 choices.)_____ a. Nothing_____ b. Benefits_____ c. Co-workers_____ d. Supervisors and managers_____ e. I like the clients/individuals supported._____ f. The individuals supported like and/or appreciate me._____ g. The mission and service goals_____ h. The tasks or activities I do for my job_____ i. Opportunity for personal or professional growth_____ j. Location_____ k. Work atmosphere_____ l. Training and development opportunities_____ m. Pay rate or salary_____ n. Job variety_____ o. Flexible hours or schedule_____ p. Recognition for a job well done_____ q. Rewarding work_____ r. The staff members are team players._____ s. This is a good company to work for._____ t. Other (specify):
New Staff Survey
Name: Supervisor name:
Job title: Site name:
Date: Site number:
1. Is this your first job working with people with disabilities? (Mark one.)_____ 0. No_____ 1. Yes
2. Have your job responsibilities and working conditions turned out to be what you expected whenyou took this job? (Mark one.)_____ 1. Definitely not_____ 2. Somewhat not_____ 3. Neither yes nor no_____ 4. Somewhat yes_____ 5. Definitely yes
3. Overall, does this job meet your original expectations? (Mark one.)_____ 1. Definitely not_____ 2. Somewhat not_____ 3. Neither yes nor no_____ 4. Somewhat yes_____ 5. Definitely yes
4. Have you seen a copy of your job description? (Mark one.)_____ 0. No_____ 1. Yes
How closely have your experiences during your first 30 days at this site matched the expectations youhad before you were hired in the following areas?
1 5
(Didn’t (Completely
match my matched
expectations my
Job feature at all) expectations)
5. The organization’s mission and service goals 1 2 3 4 5
6. Your pay and benefits 1 2 3 4 5
7. Your schedule 1 2 3 4 5
8. Working conditions 1 2 3 4 5
9. Types of tasks you do 1 2 3 4 5
10. Needs and characteristics of the people supported at this site 1 2 3 4 5
11. Training you received 1 2 3 4 5
12. Acceptance and welcome from other DSPs 1 2 3 4 5
13. Help and support from other DSPs 1 2 3 4 5
14. How well staff at this site work together as a team 1 2 3 4 5
15. Availability of support from your supervisor 1 2 3 4 5
16. What do you wish you had known about this job before you were hired?
From University of Minnesota, Institute on Community Integration, Research and Training Center on Community Liv-ing. (n.d.-a). New staff survey (developed by Sheryl A. Larson in collaboration with Lutheran Social Service of Min-nesota); adapted by permission. Retrieved from http://rtc.umn.edu/pdf/newstaffsurvey.pdf
Funding to develop this survey was provided by the Partnerships for Success Grant awarded by the U.S. Departmentof Labor (Grant No. N-7596-9-00-87-60).
1 2 3 4 5
Neither
Strongly agree nor Strongly
disagree Disagree disagree Agree agree
The training I have received so far . . .
1. Prepared me to complete my specific job responsibilities
2. Assisted me to develop skills in interacting with individuals with disabilities
3. Helped me improve the quality of life of the people I support
4. Provided information I need to perform my job
5. Has been worthwhile
6. Has sparked my interest
7. Was offered at a time that made it easy for me to attend
8. Was offered at a place that made it easy for me to attend
9. Offered an opportunity for me to share my experiences
10. Was tailored to meet my learning style (the way I learn best)
11. Allowed me to test out of training on skills I already had
12. Was delivered at a comfortable pace so that I could understand the content
13. Inspired me to begin or continue my career as a DSP
14. Gave me a chance to have my questions answered
My recommendations
15. This organization should keep its current training program.
16. This organization should change its training program.
17. I would recommend the training I have received so far to all new employees.
Training Experience Satisfaction Survey
Please answer these questions about the training you have received from the organization in which you now work.Mark in the column that most accurately reflects your opinion.
University of Minnesota, Institute on Community Integration, Research and Training Center on Community Living. (n.d.-c). Trainingexperience satisfaction survey (developed by Amy S. Hewitt & Sheryl A. Larson); adapted by permission. Retrieved fromhttp://rtc.umn.edu/pdf/trainingsurvey.pdf
Funding to develop this survey was provided by Grant No. H133B031116 from the U.S. Department of Education, Office of SpecialEducation and Rehabilitative Services, National Institute on Disability and Rehabilitation Research, to the University of Minnesota,Institute on Community Integration, Research and Training Center on Community Living.
Demographic Items for Surveys
1. Birth date: ____ ____Month Year
2. Gender:____ 0. Female____ 1. Male
3. Is English your first language? (Mark one.)____ 0. No____ 1. Yes
4. Which of the following best describes your role? (Mark one)____ 1. Direct support professional (DSP) (At least 50% of your time is spent in direct care.)____ 2. Front-line supervisor (FLS) (You may provide direct support, but your primary role is
to supervise direct support professionals.)____ 3. Other supervisor/manager (You supervise FLSs or other staff.)____ 4. Administrator (You provide overall direction and oversight for all workers.)____ 5. Other (specify): _____________________________________________
5. How many sites do you work at or are you responsible for? (Provide a number.)____ Number of sites
6. How many years of paid employment experience do you having working with people withintellectual or developmental disabilities?____ ____Years Months
7. How many years of paid employment experience do you have supervising DSPs who supportpeople with intellectual or developmental disabilities?____ ____Years Months
8. How long have you been working for your current employer?____ ____Years Months
9. How many years of formal education have you had? (Circle one.)10 11 12 (High school/GED)13 14 (Associate’s or 2-year degree)15 16 (Four-year degree)17 18 (Master’s degree)19 20 21 (Doctoral degree)
10. Are you currently enrolled in college or vocational or technical school? (Mark one.)____ 0. No____ 1. Yes
11. How many hours are you scheduled to work per week in your current position?____ Hours per week
12. Are you considered by your employer to be a full-time employee? (Mark one.)____ 0. No____ 1. Yes
13. What is your race? (Mark the one that best represents your race)a____ 1. Caucasian____ 2. African American or Black____ 3. American Indian____ 4. Alaska Native, Eskimo, or Aleut____ 5. Asian or Pacific Islander____ 6. Middle Eastern____ 7. Other (specify): _____________________________________________
14. Are you of Hispanic ancestry? (Mark one.)____ 0. No____ 1. Yes
Developed by researchers at the University of Minnesota, Institute on Community Integration, Research and TrainingCenter on Community Living; adapted by permission.
Note: These questions can be asked of current employees, but some of the questions should not be asked beforehire unless they pertain to a candidate’s ability to perform an essential job function as identified in a written job de-scription.aOrganizations can let respondents mark more than one race, but this can make data analysis more complex.