101
13
13
7 facts aboutValue Partners:
Footnote:
1. As of 31 December 2013.
2. As of 28 February 2014. Launch date was April 1993. Performance refers to that of Value Partners Classic Fund
(A Units). Performance of Classic Fund (A Units) over past five years: 2009: +82.9%; 2010: +20.2%; 2011: -17.2%;
2012: +14%; 2013: +11.2%; 2014 (YTD): -3.3%. Performance figures are calculated in US dollars on NAV to NAV,
with dividend reinvested. Performance data is net of all fees. Past performance is not indicative of future results.
3. Source: Institutional Investor’s Alpha Magazine, September 2013.
US$10.5 billion(1)
assets under management
16% annualized return and 2,174% cumulative return since launch in 1993 for Value Partners Classic Fund (A Units)(2)
No. 1 in 2013 Asia Hedge Fund 25(3)
80+ top performing awards and prizes since establishment
2,500 company visits and research meetings every year
40+ investment professionalsfocusing on Greater China investments
21 years of history weatheredat least 7 financial crises regionally and globally

1Value Partners Group LimitedAnnual Report 2013
CORPORATE PROFILE
Value Partners Group is one of Asia’s largest independent asset management firms with assets under management of US$10.5 billion as of 31 December 2013. Since our establishment in 1993, we have been a dedicated value investor with a focus on the Greater China region. In November 2007, the Value Partners Group became the first asset management firm listed on the main board of the Hong Kong Stock Exchange (Stock code: 806 HK). We manage absolute return long-biased funds, long-short hedge funds, exchange-traded funds, quantitative funds, as well as fixed income products for institutional and individual clients in Asia Pacific, Europe and the United States.
2 — Corporate Information
3 — Financial Highlights
4 — Highlights of the Year
8 — Chairman’s Statement
10 — Report of the Chief Executive Officer
15 — Financial Review
21 — Biographies of Directors and Senior Management
27 — Report of the Directors
36 — Corporate Governance Report
43 — Independent Auditor’s Report
44 — Consolidated Financial Statements
49 — Notes to the Consolidated Financial Statements
97 — Particulars of Subsidiaries
CONTENTS
2
CORPORATE INFORMATION
Value Partners Group LimitedAnnual Report 2013
Board of DirectorsChairman and Co-Chief Investment OfficerDato’ CHEAH Cheng Hye
Executive DirectorsMs. HUNG Yeuk Yan Renee (Deputy Chief Investment Officer)Mr. SO Chun Ki Louis (Deputy Chairman and Co-Chief Investment Officer)Mr. TSE Wai Ming, Timothy, CFA
(Chief Executive Officer)
Independent Non-executive DirectorsDr. CHEN Shih-Ta MichaelMr. LEE Siang ChinMr. Nobuo OYAMA
Non-executive Honorary ChairmanMr. YEH V-Nee
Company SecretaryMr. CHEUNG Kwong Chi, Aaron
Authorized RepresentativesMr. CHEUNG Kwong Chi, AaronMr. TSE Wai Ming, Timothy, CFA
Members of the Audit CommitteeMr. LEE Siang Chin (Chairman)Dr. CHEN Shih-Ta MichaelMr. Nobuo OYAMA
Members of the Nomination CommitteeDato’ CHEAH Cheng Hye (Chairman)Dr. CHEN Shih-Ta MichaelMr. LEE Siang ChinMr. Nobuo OYAMAMr. TSE Wai Ming, Timothy, CFA
Members of the Remuneration CommitteeDr. CHEN Shih-Ta Michael (Chairman)Dato’ CHEAH Cheng HyeMr. LEE Siang ChinMr. Nobuo OYAMAMr. TSE Wai Ming, Timothy, CFA
Members of the Risk Management CommitteeMs. LEE Vivienne (Chairman)Dato’ CHEAH Cheng HyeMr. MO Chun Wah, JonathanMr. SO Chun Ki LouisMr. TSE Wai Ming, Timothy, CFA
Members of the Valuation CommitteeMs. WONG Ngai Sze, Icy (Chairman)Mr. MO Chun Wah, JonathanMr. TSE Wai Ming, Timothy, CFA
Registered OfficeCricket Square, Hutchins DriveP.O. Box 2681Grand Cayman KY1-1111Cayman Islands
Principal Office9th Floor, Nexxus Building41 Connaught Road CentralHong Kong
Cayman Islands Principal Share Registrar and Transfer OfficeRoyal Bank of Canada Trust Company (Cayman) Limited4th Floor, Royal Bank House24 Shedden Road, George TownGrand Cayman KY1-1110Cayman Islands
Hong Kong Branch Share Registrar and Transfer OfficeTricor Investor Services Limited26/F Tesbury Centre28 Queen’s Road EastHong Kong(Effective from 31 March 2014, the address will be changed to:Level 22, Hopewell Centre28 Queen’s Road EastHong Kong)
AuditorPricewaterhouseCoopers
Legal AdvisorReed Smith Richards Butler
Principal BankersThe Hongkong and Shanghai Banking Corporation LimitedBank of China (Hong Kong) Limited
Websitewww.valuepartners.com.hk
Stock CodeStock Exchange of Hong Kong: 806

3Value Partners Group LimitedAnnual Report 2013
FINANCIAL HIgHLIgHTS
2013
2012
2011
2010
2009
HK$ million
0 1,200800400
1,027.6
1,075.2
688.9
460.3
Revenue
651.6
HK$ million
0 800 0 4,000 8,000 12,000200 400 600
167.3
384.3
653.2
318.8
376.4
US$ million
7,154
10,489
7,937
5,506
Assets under management
8,509
2013
2012
2011
2010
2009
2013
2012
2011
2010
2009
Profit attributable to equity holders of the Company
Results for the year ended 31 December
(In HK$ million) 2013 2012 % Change 2011 2010 2009
Revenue 1,027.6 651.6 +57.7% 688.9 1,075.2 460.3Operating profit (before other gains/losses) 468.2 254.4 +84.0% 293.6 664.0 222.8Profit attributable to equity holders of the Company 384.3 376.4 +2.1% 167.3 653.2 318.8Earnings per share (HK cents) – Basic 21.9 21.4 +2.3% 9.5 40.1 19.9 – Diluted 21.8 21.4 +1.9% 9.5 39.9 19.9
Assets and liabilities as at 31 December
(In HK$ million) 2013 2012 % Change 2011 2010 2009
Total assets 3,080.5 2,982.6 +3.6% 2,547.4 2,792.1 1,221.0Less: Total liabilities 251.8 265.4 -1.5% 123.4 374.2 151.6
Total net assets 2,828.7 2,717.2 +4.1% 2,424.0 2,417.9 1,069.4
Assets under management (“AUM”) as at 31 December
(In US$ million) 2013 2012 % Change 2011 2010 2009
AUM 10,489 8,509 +23.3% 7,154 7,937 5,506
Note: The above financial information was prepared based on the principal accounting policies as described in the notes to the consolidated
financial statements.
Value Partners Group LimitedAnnual Report 2013
4
HIgHLIgHTS OF THE YEAR
2013
January
• Value Partners obta ined a Qual i f ied Foreign Institutional Investors (“QFII”) quota of US$100 million from the State Administration of Foreign Exchange.
February
• Value Partners, in partnership with China Merchants Bank and Yinhua Fund Management, launched its first Qualified Domestic Institutional Investors (“QDII”) fund for private investors.
March
• In the 2013 Lipper Fund Awards, our Chinese Mainland Focus Fund and China Greenchip Fund were named the best China equity fund and the best Greater China equity fund, respectively. Both awards were based on performances in a 5-year period.
Mr. Timothy TSE, Group Chief Executive Officer, accepted the Lipper Fund Awards at the presentation ceremony.
• The Group organized its first PRC institutional investor conference in Hong Kong.
• Value Partners launched its first China A-share fund.
May
• Value Partners opened a new office in Beijing.
• Our High-Dividend Stocks Fund made it to the global Best 100 Hedge Fund ranking compiled by Barron’s.
June
• Dato’ CHEAH Cheng Hye received an Honorary Fellowship from the Hong Kong University of Science and Technology for his contributions to the university and society at large.
Dato’ CHEAH received the Fellowship award at the ceremony.
August
• Dato’ CHEAH was conferred the title of “Dato’ ” – an honorary title that recognizes exceptional individuals – by the government in his home state of Penang, Malaysia.
Dato’ CHEAH received the “Dato’ ” award (“Darjah Setia Pangkuan Negeri”) at the ceremony organized by the Penang government.
Value Partners Group LimitedAnnual Report 2013
5
HIgHLIgHTS OF THE YEAR
September• Value Partners was ranked No. 1 for the fourth
consecutive year in Asia Hedge Fund 25 – a survey of Asia’s largest hedge funds (based on assets under management).
• Value Partners won approvals from the China Securities Regulatory Commission to become a Renminbi Qualified Foreign Institutional Investor (“RQFII”).
• Value Partners was appointed an investment manager of The Asia Pacific Fund, Inc., a closed-end fund listed on the New York Stock Exchange.
October• The Group received a RQFII quota of RMB800 million
from the State Administration of Foreign Exchange.
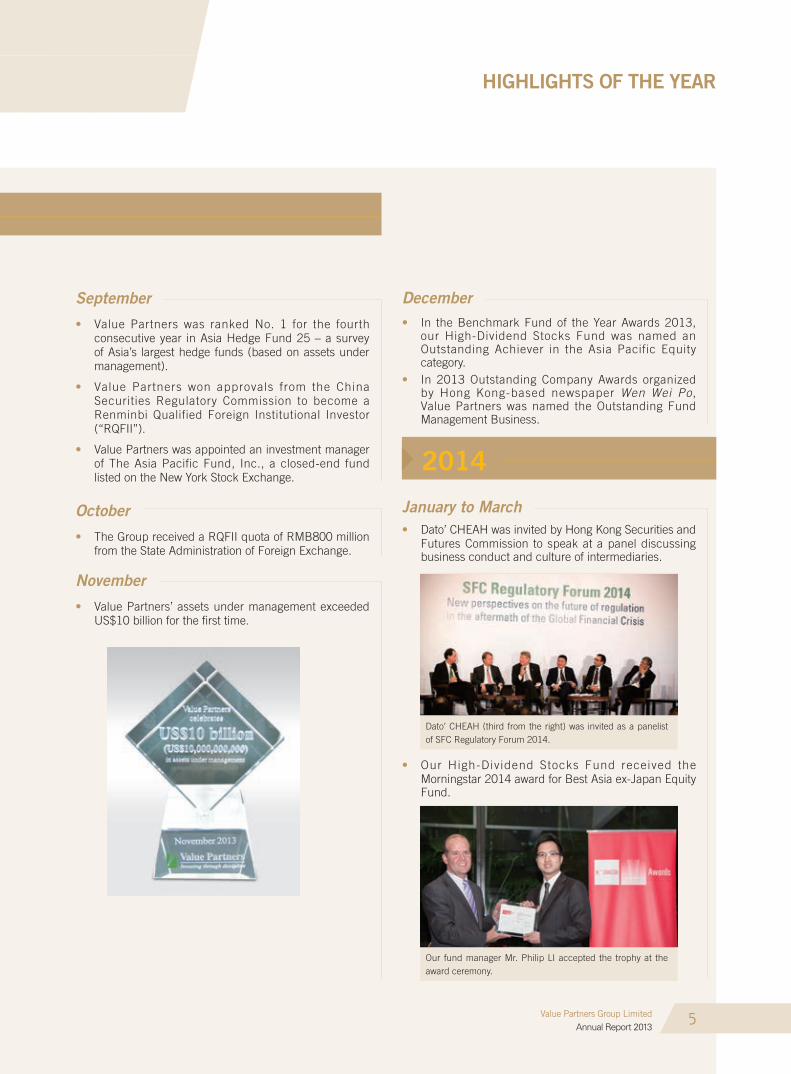
November• Value Partners’ assets under management exceeded
US$10 billion for the first time.
December• In the Benchmark Fund of the Year Awards 2013,
our High-Dividend Stocks Fund was named an Outstanding Achiever in the Asia Pacific Equity category.
• In 2013 Outstanding Company Awards organized by Hong Kong-based newspaper Wen Wei Po, Value Partners was named the Outstanding Fund Management Business.
2014
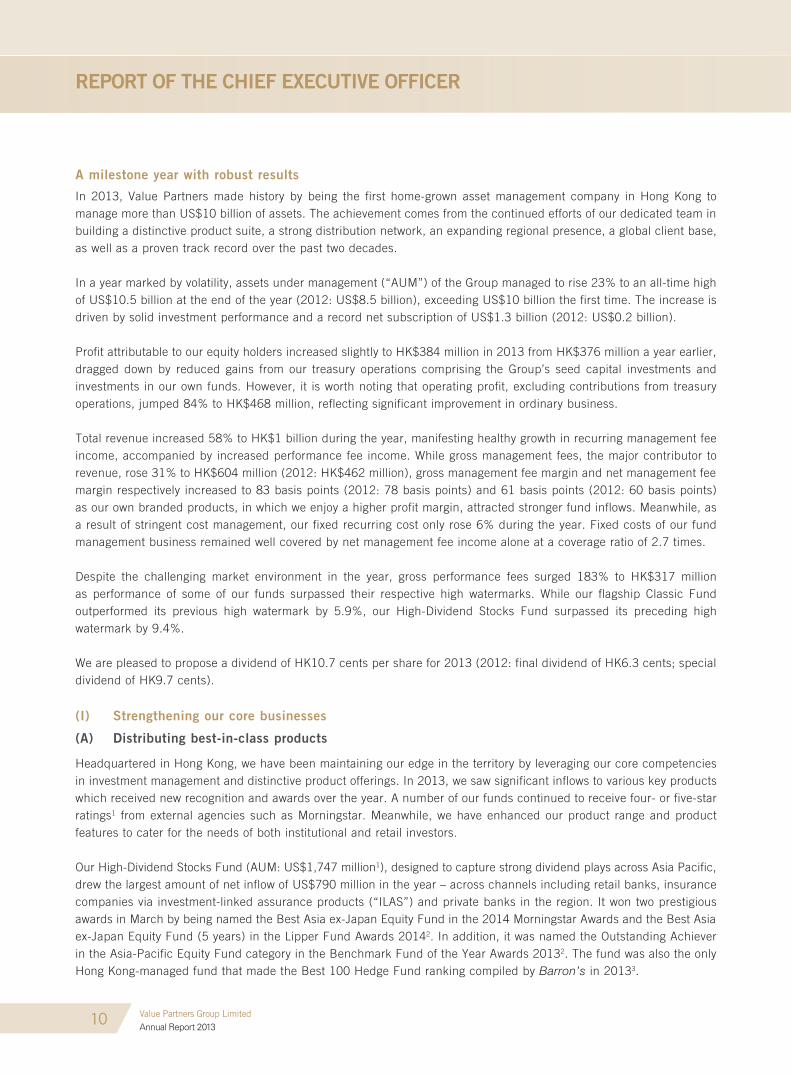
January to March• Dato’ CHEAH was invited by Hong Kong Securities and
Futures Commission to speak at a panel discussing business conduct and culture of intermediaries.
Dato’ CHEAH (third from the right) was invited as a panelist of SFC Regulatory Forum 2014.
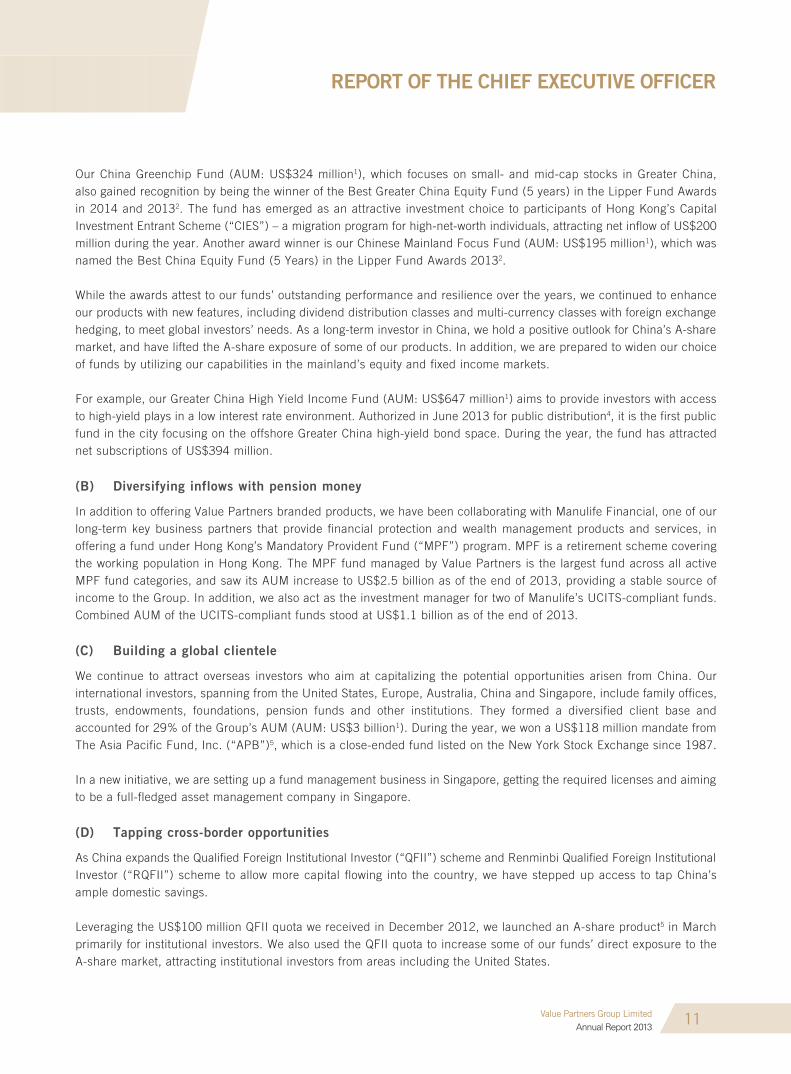
• Our High-Dividend Stocks Fund received the Morningstar 2014 award for Best Asia ex-Japan Equity Fund.
Our fund manager Mr. Philip LI accepted the trophy at the award ceremony.

Value Partners Group LimitedAnnual Report 2013
6
EVENTS OF THE YEAR
1 Our colleagues played in a friendly football match
with Athena Best Financial Group.
2 Our colleagues took part in the “Walk for Millions” event organized by The Community Chest of Hong Kong.
3 Mr. Louis SO, Group Deputy Chairman, presented a 20-year service award to Dato’ CHEAH Cheng Hye, Group Chairman, at the 2013 annual dinner.
1
2
3
Staff events

Value Partners Group LimitedAnnual Report 2013
7
EVENTS OF THE YEAR
4 Our fund manager Mr. Philip LI and our Managing Director of Retail Distribution Mr. Wallace TSANG, spoke at an investment seminar organized for high-net-worth investors.
5 Dato’ CHEAH, speaking at a Penang conference, encourage Chinese teenagers to demonstrate the “Asians can do” spirit.
6 Our fund managers were invited to talk about investment opportunities in China at an investment seminar.
7 We participated in an investment expo organized by the Hong Kong Stock Exchange to promote our ETF products.
6
7
5
Seminars and conferences
4

8
CHAIRMAN’S STATEMENT
Value Partners Group LimitedAnnual Report 2013
Value Partners’ net profit for 2013, at HK$384 million, was only slightly better than the previous year’s figure of HK$376 million. Beneath the surface, however, there was real progress. Operating profit, which reflects the actual operating business, totalled HK$468 million in 2013, increased 84% from the previous year’s HK$254 million. This strength was masked by a much higher tax expense (reflecting the higher operating profit) and much lower contributions from treasury operations (“treasury operations” refer to returns from investing our own capital, a major part of which is subscribed to our funds, side-by-side with clients).
Clearly we enjoyed a robust operation despite relatively weak markets across much of the Asia-Pacific region in 2013. One indicator was that our assets under management (“AUM”) passed the US$10 billion milestone for the first time, reaching US$10.5 billion at year end, compared to US$8.5 billion a year earlier. We remain among the very biggest independent asset-management firms in our region, and the only one of its kind listed on the Hong Kong Stock Exchange.
We are pleased to propose a dividend for 2013 of HK10.7 cents (compared to HK6.3 cents in 2012). In 2012, we also declared a special dividend of HK9.7 cents to mark the 20th anniversary of the group’s founding, but for 2013, it is back to business as usual, and no special dividend is proposed.
Dato’ CHEAH Cheng HyeChairman and Co-Chief Investment Officer
ReviewThe Value Partners brand is associated with fund performance, and in 2013, again, we didn’t disappoint our clients. Our flagship Value Partners Classic Fund (A Units) returned a net 11.2% in 2013, while the Hang Seng Index recorded a return of 6.5%; indeed, this fund (A Units) has returned a net 16.4% per annum, compounded, since inception in 1993, whereas the index’s annualized return was 8% over the same period1.
Still, 2013 was forgettable in terms of the market environment, with a gain of just 3.6% in the MSCI China Index (which covers China-related stocks) and only 3.4% in the MSCI Asia-Pacific ex-Japan Index, which covers regional stockmarkets outside Japan. Consequently, although a number of our funds, including the Classic Fund, qualified for performance fees in 2013, on top of their usual fixed management fees, the performance collection was relatively minor. (Under the “high-on-high” principle, a fund cannot earn a performance fee unless its net asset value exceeds its previous high; several of our funds surpassed their previous highs to some extent in 2013, thus earning performance fees.)
There is now potential for a much larger harvest of performance income if the China-related markets, and Asia-Pacific markets generally, stage a long-overdue recovery, which may allow our funds to reach major new heights. This potential is much bigger than before because of our large and growing fund size. After a bear market going back to 2007, China-related stocks currently trade at very cheap valuations, and what is now required is a turnaround in investor sentiment.
Currently, China is going through a transitional period, implementing a program of reforms under Xi Jinping, who became President in 2013. Inevitably, change has brought some uncertainty and pain, especially in the financial sector, which has various issues, including problems associated with high-yield debts (sometimes called “shadow banking” products).

9
CHAIRMAN’S STATEMENT
Value Partners Group LimitedAnnual Report 2013
Overall, however, China as a country is very strong financially, with large domestic savings and it is not dependent on foreign capital. It is very unlikely that China will suffer a “hard landing,” as there are sufficient resources to take care of the various problems that have emerged. Premier Li Keqiang stated recently that his “bottom line” is an economic growth rate of 7.2%, to ensure that enough new jobs are created. Certainly, over time, the new administration has the ability and the will to push through breakthrough reforms, including an anti-corruption drive, that will enable China to become a truly successful country, providing an even more attractive landscape for investors.
We believe that as investors take in the far-reaching implications of the reform program, market sentiment will recover. We think it is a question of when, not if, a recovery will occur.
Other mattersAs always, Value Partners’ priority is to continuously improve the way we do our job, especially in terms of investment analysis and fund management. Our Investment Team is being further strengthened, with more professionals joining and much thought given to how to better organize our people, so as to maximize our “knowledge utilization,” which involves making more effective use of the vast pool of knowledge accumulated by our team of analysts and fund managers.
Our achievements have received further recognition in the form of new performance awards. These include for the Value Partners High-Dividend Stocks Fund three highly coveted prizes: the Morningstar 2014 award for “Best Asia ex-Japan Equity Fund,” the Lipper 2014 (Hong Kong) award for “Best Asia ex-Japan Equity Fund over five years,” and the Benchmark Fund of the Year 2013 award for “Outstanding Achiever in the Asia Pacific Equity Fund category”2. Value Partners has now own a total of more than 80 awards and prizes since the firm’s founding 21 years ago.
For details and an in-depth discussion of the Group, including our progress in various business-development projects, please refer to the accompanying report from our Chief Executive Officer (CEO). Please note the significant new opportunities arising from the opening up of mainland China’s capital market. For example, the mainland Chinese and Hong Kong authorities have already reached an understanding on “mutual recognition” of funds, a breakthrough that opens the door for Hong Kong-domiciled funds to be sold on the mainland, and vice versa.
As the Chinese mainland gradually relaxes restrictions on fund flows, Value Partners is well positioned to provide investment services for both capital inflows and outflows related to the Greater China region. Apart from Hong Kong, Value Partners has established offices in Beijing, Shanghai, Chengdu and Taipei. Our vision extends beyond the Greater China region, however. In 2014, the group intends to open an important new office in Singapore, part of a strategy to enhance our role across the Asia-Pacific region and, over time, the world as a whole.
To our clients, employees, shareholders and friends who have now supported us for more than two decades – we remain deeply grateful.
Dato’ CHEAH Cheng HyeChairman and Co-Chief Investment Officer
1 Index returns are for reference only. Performance of Value Partners Classic Fund (A Units) over past five years: 2009: +82.9%; 2010:
+20.2%; 2011: -17.2%; 2012: +14%; 2013: +11.2%. Performance figures are calculated in US dollars on NAV to NAV, with dividends
reinvested. Performance data is net of all fees.
2 The Morningstar 2014 award was based on data of eligible funds in their respective Morningstar category up to 31 December 2013. The
Lipper 2014 awards were based on returns as of year-end 2013. The Benchmark award was based on data as of 30 September 2013.
10
REPORT OF THE CHIEF ExECUTIVE OFFICER
Value Partners Group LimitedAnnual Report 2013
A milestone year with robust results
In 2013, Value Partners made history by being the first home-grown asset management company in Hong Kong to manage more than US$10 billion of assets. The achievement comes from the continued efforts of our dedicated team in building a distinctive product suite, a strong distribution network, an expanding regional presence, a global client base, as well as a proven track record over the past two decades.
In a year marked by volatility, assets under management (“AUM”) of the Group managed to rise 23% to an all-time high of US$10.5 billion at the end of the year (2012: US$8.5 billion), exceeding US$10 billion the first time. The increase is driven by solid investment performance and a record net subscription of US$1.3 billion (2012: US$0.2 billion).
Profit attributable to our equity holders increased slightly to HK$384 million in 2013 from HK$376 million a year earlier, dragged down by reduced gains from our treasury operations comprising the Group’s seed capital investments and investments in our own funds. However, it is worth noting that operating profit, excluding contributions from treasury operations, jumped 84% to HK$468 million, reflecting significant improvement in ordinary business.
Total revenue increased 58% to HK$1 billion during the year, manifesting healthy growth in recurring management fee income, accompanied by increased performance fee income. While gross management fees, the major contributor to revenue, rose 31% to HK$604 million (2012: HK$462 million), gross management fee margin and net management fee margin respectively increased to 83 basis points (2012: 78 basis points) and 61 basis points (2012: 60 basis points) as our own branded products, in which we enjoy a higher profit margin, attracted stronger fund inflows. Meanwhile, as a result of stringent cost management, our fixed recurring cost only rose 6% during the year. Fixed costs of our fund management business remained well covered by net management fee income alone at a coverage ratio of 2.7 times.
Despite the challenging market environment in the year, gross performance fees surged 183% to HK$317 million as performance of some of our funds surpassed their respective high watermarks. While our flagship Classic Fund outperformed its previous high watermark by 5.9%, our High-Dividend Stocks Fund surpassed its preceding high watermark by 9.4%.
We are pleased to propose a dividend of HK10.7 cents per share for 2013 (2012: final dividend of HK6.3 cents; special dividend of HK9.7 cents).
(I) Strengthening our core businesses
(A) Distributing best-in-class products
Headquartered in Hong Kong, we have been maintaining our edge in the territory by leveraging our core competencies in investment management and distinctive product offerings. In 2013, we saw significant inflows to various key products which received new recognition and awards over the year. A number of our funds continued to receive four- or five-star ratings1 from external agencies such as Morningstar. Meanwhile, we have enhanced our product range and product features to cater for the needs of both institutional and retail investors.
Our High-Dividend Stocks Fund (AUM: US$1,747 million1), designed to capture strong dividend plays across Asia Pacific, drew the largest amount of net inflow of US$790 million in the year – across channels including retail banks, insurance companies via investment-linked assurance products (“ILAS”) and private banks in the region. It won two prestigious awards in March by being named the Best Asia ex-Japan Equity Fund in the 2014 Morningstar Awards and the Best Asia ex-Japan Equity Fund (5 years) in the Lipper Fund Awards 20142. In addition, it was named the Outstanding Achiever in the Asia-Pacific Equity Fund category in the Benchmark Fund of the Year Awards 20132. The fund was also the only Hong Kong-managed fund that made the Best 100 Hedge Fund ranking compiled by Barron’s in 20133.
11
REPORT OF THE CHIEF ExECUTIVE OFFICER
Value Partners Group LimitedAnnual Report 2013
Our China Greenchip Fund (AUM: US$324 million1), which focuses on small- and mid-cap stocks in Greater China, also gained recognition by being the winner of the Best Greater China Equity Fund (5 years) in the Lipper Fund Awards in 2014 and 20132. The fund has emerged as an attractive investment choice to participants of Hong Kong’s Capital Investment Entrant Scheme (“CIES”) – a migration program for high-net-worth individuals, attracting net inflow of US$200 million during the year. Another award winner is our Chinese Mainland Focus Fund (AUM: US$195 million1), which was named the Best China Equity Fund (5 Years) in the Lipper Fund Awards 20132.
While the awards attest to our funds’ outstanding performance and resilience over the years, we continued to enhance our products with new features, including dividend distribution classes and multi-currency classes with foreign exchange hedging, to meet global investors’ needs. As a long-term investor in China, we hold a positive outlook for China’s A-share market, and have lifted the A-share exposure of some of our products. In addition, we are prepared to widen our choice of funds by utilizing our capabilities in the mainland’s equity and fixed income markets.
For example, our Greater China High Yield Income Fund (AUM: US$647 million1) aims to provide investors with access to high-yield plays in a low interest rate environment. Authorized in June 2013 for public distribution4, it is the first public fund in the city focusing on the offshore Greater China high-yield bond space. During the year, the fund has attracted net subscriptions of US$394 million.
(B) Diversifying inflows with pension money
In addition to offering Value Partners branded products, we have been collaborating with Manulife Financial, one of our long-term key business partners that provide financial protection and wealth management products and services, in offering a fund under Hong Kong’s Mandatory Provident Fund (“MPF”) program. MPF is a retirement scheme covering the working population in Hong Kong. The MPF fund managed by Value Partners is the largest fund across all active MPF fund categories, and saw its AUM increase to US$2.5 billion as of the end of 2013, providing a stable source of income to the Group. In addition, we also act as the investment manager for two of Manulife’s UCITS-compliant funds. Combined AUM of the UCITS-compliant funds stood at US$1.1 billion as of the end of 2013.
(C) Building a global clientele
We continue to attract overseas investors who aim at capitalizing the potential opportunities arisen from China. Our international investors, spanning from the United States, Europe, Australia, China and Singapore, include family offices, trusts, endowments, foundations, pension funds and other institutions. They formed a diversified client base and accounted for 29% of the Group’s AUM (AUM: US$3 billion1). During the year, we won a US$118 million mandate from The Asia Pacific Fund, Inc. (“APB”)5, which is a close-ended fund listed on the New York Stock Exchange since 1987.
In a new initiative, we are setting up a fund management business in Singapore, getting the required licenses and aiming to be a full-fledged asset management company in Singapore.
(D) Tapping cross-border opportunities
As China expands the Qualified Foreign Institutional Investor (“QFII”) scheme and Renminbi Qualified Foreign Institutional Investor (“RQFII”) scheme to allow more capital flowing into the country, we have stepped up access to tap China’s ample domestic savings.
Leveraging the US$100 million QFII quota we received in December 2012, we launched an A-share product5 in March primarily for institutional investors. We also used the QFII quota to increase some of our funds’ direct exposure to the A-share market, attracting institutional investors from areas including the United States.
12
REPORT OF THE CHIEF ExECUTIVE OFFICER
Value Partners Group LimitedAnnual Report 2013
In March 2013, China’s securities regulator relaxed the RQFII scheme by widening the scope of eligibility to also include Hong Kong-based financial institutions. In October 2013, we were granted a RMB800 million RQFII quota which allows us to invest Renminbi (“RMB”) raised offshore into China’s domestic securities market. RQFII-themed offering was a key product development to us in the second half of the year. A series of RQFII products, including equity funds, are being developed for launch.
As regulators on the mainland and Hong Kong have been in final talks on implementing the mutual recognition of funds, 2014 is expected to be another fruitful year for us. If the policy is approved, qualified SFC-authorized funds domiciled in Hong Kong will be allowed to be sold directly on the mainland, and vice versa. We have been preparing ourselves in different aspects to ride on this tide.
(E) Enhancing ETF product suite
Since we launched our first exchange-traded funds (“ETF”) in 2009, we have already expanded our ETF product suite to include four single-market equity ETFs focusing on China, Japan, Korea and Taiwan; and a gold ETF. In November 2013, we introduced a RMB counter for Value Gold ETF, enabling investors to trade units of Value Gold ETF directly in RMB. It is also the first dual-counter gold ETF in the world. In fact, we have been capturing appetite for Chinese investment in the ETF space by launching two China-related indices with FTSE Group. FTSE Value-Stocks China A-Share Index was the latest benchmark established in 2011. Meanwhile, we introduced FTSE Value-Stocks ASEAN Index during the year to enrich our customer solutions with exposures to companies listed in Southeast Asia countries.
(II) Bolstering growth with greater China drivers
(A) Ongoing strategic expansion on the mainland
During the year, we have strengthened our co-operation with strategic mainland bank distributors and heightened our ties with institutional investors to capture the increased investment flows as China liberalizes its capital accounts.
We opened a new office in Beijing in May to strengthen our mainland network which we have been building since 2009. In addition, we organized our first Institutional Investor Conference in Hong Kong for executives from mainland institutions, such as banks and insurance companies.
As mainland investors have a strong interest to tap the securities market outside China, we, in partnership with China Merchants Bank, launched in February a Qualified Domestic Institutional Investor (“QDII”) product5, which raised RMB209 million (US$33 million).
Meanwhile, we continued to receive A-share advisory mandates from a leading mainland institution. We have also fostered our ties with other top-tier banks, insurers and securities firms to jointly develop domestic products.
In 2014, we will continue to make inroads on the mainland, targeting institutional investors. We will also enhance our bank distribution capability to reach out to more retail investors and high-net-worth individuals. Meanwhile, we are closely monitoring the development in Shenzhen’s Qianhai Bay Economic Zone and Shanghai’s Free Trade Zone, preparing ourselves to expand into the zones as regulation details are released. We have been working closely with the authorities since we signed a Memorandum of Understanding with the Authority of Qianhai Shenzhen-Hong Kong Modern Service Industry Cooperation Zone in 2012.
13
REPORT OF THE CHIEF ExECUTIVE OFFICER
Value Partners Group LimitedAnnual Report 2013
(B) Burgeoning presence in Taiwan
Taiwan is an important location to complete our Greater China footprint. Since we set up our joint venture Value Partners Concord Asset Management Company Limited in 2011, we have been constructing a comprehensive product range to differentiate ourselves from local competitors. During the year, we have successfully launched the Group’s first balanced fund in Taiwan with one of our key business partners in Taiwan. We have also introduced our Greater China Equity Fund5, boosting the AUM of our Taiwan business to NT$1,485 million (US$50 million) at the end of 2013.
Taiwan announced last year that it will relax rules on overseas banking units of lenders and overseas securities units of brokerage firms, allowing overseas wealth management products to be introduced in the Taiwan market. As the policy relaxation opens door for us to further grow our market share in the Taiwan market, we will bring our fund products in Hong Kong into Taiwan via our distribution partners to capture related business opportunities.
(C) Thriving small loan business in Chengdu
Chengdu Vision Credit Limited (“Vision Credit”), our joint venture engaging in small loan business in Chengdu city, has been providing an alternative source of income to the Group in addition to our core fund management business. Focusing on granting loans to the white collar, small-business entrepreneurs, as well as small and medium-sized enterprises, Vision Credit attained attractive loan yields while maintaining healthy asset quality. Outstanding loans of the company increased from RMB7 million in 2012 to about RMB181 million at the end of last year, of which a majority is secured lending. The unit has grown to a company with around 50 employees as of the end of 2013. Looking forward, we will continue to establish our brand name, grow our loan portfolio and develop multiple distribution channels.
A 20-year winning story
Since our establishment in 1993, we have been upholding our motto “investing with discipline” and evolved as one of the largest fund management companies in Asia. Our achievement is not only reflected in our expansion in size but also the local and regional recognition we received.
On the corporate level, we topped the Asia Hedge Fund 25 ranking compiled by Institutional Investor’s Alpha in 2013, the fourth consecutive year that the Group took the top spot. In the 2013 Hedge Fund 100 ranking, also released by Institutional Investor’s Alpha, we were ranked the first in Asia and the 62nd globally by AUM as of 2 January 2013.
We are pleased to report that Dato’ Cheah Cheng Hye, our Chairman and Co-Chief Investment Officer, has been appointed by the Hong Kong government as a member of the New Business Committee of the Financial Services Development Council. The council, set up in 2013, is an advisory body engaged in formulating proposals to the government on the further development of Hong Kong. In 2013, our Chairman was conferred the Malaysian honorary title of “Dato’ ” by the state government of Penang, Malaysia, in recognition of his outstanding achievements (Dato’ Cheah was born in Penang). Adding further to his list of awards and accolades, Dato’ Cheah received in June 2013 an Honorary Fellowship from the Hong Kong University of Science and Technology for his contribution to the university and society at large.
14
REPORT OF THE CHIEF ExECUTIVE OFFICER
Value Partners Group LimitedAnnual Report 2013
Appreciation
Finally, we would like to express our gratitude to our diligent team for their dedication and pursuit of performance excellence. We also extend our appreciation to our clients, business partners and shareholders.
TSE Wai Ming, Timothy, CFA
Chief Executive OfficerExecutive Director
1 As of 31 December 2013.
2 The 2014 Morningstar Awards was based on data of eligible funds in their respective Morningstar category up to 31 December 2013. The
Lipper Fund Awards 2014 and 2013 were based on data as of year-end 2013 and year-end 2012. Benchmark Fund of the Year Awards
2013 was based on data as of 30 September 2013.
3 Value Partners High-Dividend Stocks Fund is not authorized as a hedge fund by the Securities and Futures Commission (“SFC”) in Hong
Kong according to the Code on Unit Trusts and Mutual Funds.
4 SFC authorization is not a recommendation or endorsement of a scheme nor does it guarantee the commercial merits of a scheme or its
performance. It does not mean the scheme is suitable for all investors nor is it an endorsement of its suitability for any particular investor
or class of investors.
5 Not authorized by the SFC and not available for public distribution in Hong Kong.

FINANCIAL REVIEW
15Value Partners Group LimitedAnnual Report 2013
Assets Under Management
AUM and return
The Group’s AUM amounted to US$10,489 million at the end of December 2013 (2012: US$8,509 million). The increase was mainly driven by net subscriptions of US$1,334 million, together with positive fund returns of US$712 million recorded during the year. Our overall fund performance, as calculated in asset-weighted average return of funds under management, recorded a gain of 8.2% in 2013. Value Partners’ flagship Classic Fund1 managed to generate solid returns with a gain of 11.2% in the year, while Value Partners High-Dividend Stocks Fund2, the Group’s largest public fund3 in Hong Kong, recorded a gain of 8.1% in the year.
Gross subscriptions in the second half of 2013 (US$2,183 million) increased from the first half of 2013 (US$1,987 million), bolstering annual subscriptions (US$4,170 million) to rise significantly from the previous year (2012: US$2,093 million). Gross redemptions in the second half of 2013 (US$1,402 million) was slightly less than that in the first half of 2013 (US$1,434 million), bringing the full-year total to US$2,836 million. All in all, we were able to achieve strong net subscriptions of US$1,334 million (2012: US$183 million).
US$ million
Gross redemptions
Net subscriptions
Gross subscriptions
1H 2013 2H 2013 FY 2012FY 2013
2,093
1,434
1,987 2,183
1,402
781
4,170
1,334
183
1,910
2,836
0
1,000
2,000
3,000
4,000
5,000
553
Beginning AUM
Subscription
Redemption
Performance
Dividend distribution
Ending AUM
US$ million 2,000 4,0000 8,0006,000 10,000 12,000 14,000
10,489
(2,836)
712
(66)
AUM change in the year 20134
4,170
8,509
Monthly AUM in the year 2013
9,000
10,000
11,000US$ million
9,386
Jan Feb Mar Apr May Jun Jul Aug Sep Oct Nov Dec
Average AUM9,361
9,389 9,317 9,327 9,332
8,5888,815 8,900
9,180
9,933
10,535 10,489
8,000

FINANCIAL REVIEW
16 Value Partners Group LimitedAnnual Report 2013
AUM by category
The charts below provide an analysis of the Group’s AUM as at 31 December 2013 by three different classifications: brand, strategy and fund type. For the year, Own Branded Funds (62%) recorded an increase due to higher fund inflows into our own branded products following the expansion of our distribution network. By strategy, our Absolute Return Long-biased Funds continued to represent the majority of our funds (89%), followed by our Fixed Income Funds (6%), with our Greater China High Yield Income Fund taking the largest share. In terms of fund type, Hong Kong Securities and Futures Commission (“SFC”) authorized funds3 (i.e. public funds in Hong Kong) maintained the largest portion of our AUM (81%).
Classification by brand Classification by strategy Classification by type
2013 2012
• Own Branded Funds 62% 55%• White Label & Co-branded 38% 45% Funds
2013 2012
2013 2012
• Absolute Return 89% 90% Long-biased Funds• Fixed Income Funds 6% 5%• Long-short Hedge Funds 3% 3%• Quantitative Funds & ETF 2% 2%
2013 2012
2013 2012
• SFC authorized Funds3 81% 75%• Managed Accounts 10% 10%• Non-SFC authorized Funds 9% 15%
2013 2012
Client base
Institutional clients – including institutions, pension funds, high-net-worth individuals (HNWs), endowments and foundations, funds of funds, together with family offices and trusts – remained the Group’s primary set of fund investors, accounting for 73% of our AUM (2012: 78%). In particular, the increase in HNWs is attributable to the expanded business relationship with private banks in the region. The proportion of funds coming from retail investors increased to 27% of the AUM (2012: 22%) as a result of the higher fund inflow from Hong Kong retail investors through our expanded distribution network which include retail banks. By geographical region, Hong Kong clients accounted for 71% of the Group’s AUM (2012: 69%), while the percentage of clients in the United States and Europe was 19% (2012: 22%).
Client analysis by type Client analysis by geographical region2013 2012
• Institutions 27% 30%• Retail 27% 22%• Pension funds 26% 29%• High-net-worth individuals 13% 11%• Endowments & foundations 4% 5%• Funds of funds 2% 2%• Family offices & trusts 1% 1%
2013 2012
2013 2012
2013 2012
• Hong Kong 71% 69%• United States 11% 11%• Europe 8% 11%• Singapore 3% 2%• Australia 3% 4%• Taiwan 1% 1%• China 1% 0%• Others 2% 2%
FINANCIAL REVIEW
17Value Partners Group LimitedAnnual Report 2013
Summary of results
The key financial highlights for the reporting period are as follows:
(In HK$ million) 2013 2012 % Change
Total revenue 1,027.6 651.6 +57.7%Gross management fees 603.9 461.8 +30.8%Gross performance fees 317.0 112.1 +182.8%Operating profit (before other gains/losses) 468.2 254.4 +84.0%Profit attributable to equity holders of the Company 384.3 376.4 +2.1%Basic earnings per share (HK cents) 21.9 21.4 +2.3%Diluted earnings per share (HK cents) 21.8 21.4 +1.9%Interim dividend per share Nil NilFinal dividend per share (HK cents) 10.7 6.3 +69.8%Special dividend per share (HK cents) Nil 9.7
Revenue and fee margin
Breakdown of total net income
(In HK$ million) 2013 2012
Revenue 1,027.6 651.6
Management fees 603.9 461.8 Performance fees 317.0 112.1 Front-end fees 87.5 77.2 Interest income from loan portfolio 18.0 0.3 Fee income from loan portfolio 1.2 0.2
Distribution and advisory fee expenses (252.6) (179.0)
Management fee rebates (160.2) (104.5) Performance fee rebates (7.4) (0.5) Other revenue rebates (85.0) (74.0)
Other income 45.2 54.1
Total net income 820.2 526.7
The Group’s total revenue increased by 57.7% to HK$1,027.6 million for the year (2012: HK$651.6 million). The major contribution to our revenue was gross management fees, which increased to HK$603.9 million (2012: HK$461.8 million) as a result of a 22.5% increase in the Group’s average AUM to US$9,361 million (2012: US$7,641 million). With comparatively higher fund inflows from distribution channels into our Own Branded Funds, our annualized gross management fee margin increased to 83 basis points (2012: 78 basis points). The management fee rebates paid to distribution channels increased correspondingly by 53.3% to HK$160.2 million (2012: HK$104.5 million), resulting in an increase of 1 basis point in annualized net management fee margin (2013: 61 basis points; 2012: 60 basis points).

FINANCIAL REVIEW
18 Value Partners Group LimitedAnnual Report 2013
Gross performance fees, another source of revenue, amounted to HK$317.0 million, representing a HK$204.9 million increase (2012: HK$112.1 million). During the year, performance fees were generated when funds, at the dates of their performance fee crystallization, reported performances that had exceeded their benchmark returns for the respective periods ended or high watermarks.
Other revenue mainly includes front-end load, of which a substantial amount was rebated to distribution channels, and such rebate is a usual market practice. Other revenue also includes the HK$19.2 million (2012: HK$0.5 million) of interest and fee income generated from loan portfolio of our non-wholly owned subsidiary, which operates and develops small loan business in Chengdu. The small loan business commenced operations in the second half of 2012.
Other income, which mainly comprises dividend income and interest income, slightly decreased to HK$45.2 million (2012: HK$54.1 million). Dividend income increased to HK$10.4 million (2012: HK$4.7 million), while interest income decreased to HK$32.7 million (2012: HK$46.9 million) due to a drop in bank deposits and interest-bearing bond investments.
Other gains and losses
Breakdown of other (losses)/gains – net
(In HK$ million) 2013 2012
Changes in fair value of investment properties (18.5) 24.0Net gains on investments 4.1 132.7Net gains on investments held-for-sale 5.8 23.5Others (1.1) (3.3)
Other (losses)/gains – net (9.7) 176.9
Other gains or losses mainly include fair value changes and realized gains or losses on investment items including seed capital investments, investments in own funds, debt securities and other investments; together with net foreign exchange gains or losses. Seed capital investments are made by the Group to seed certain amount of capital to new funds which is considered necessary during the initial fund launch phase. The Group also invests in its own funds side by side with investors where appropriate, for better alignment of interest and investment returns.
Investment in an associate
In March 2012, the Group acquired 49% interests in Value Partners Goldstate Fund Management Company Limited (“VP Goldstate”). VP Goldstate engages in asset management and trust businesses in mainland China. The Group’s share of gain amounted to HK$1.2 million (2012: share of loss of HK$16.2 million).
FINANCIAL REVIEW
19Value Partners Group LimitedAnnual Report 2013
Cost management
Breakdown of total expenses
(In HK$ million) 2013 2012
Compensation and benefit expenses 267.7 197.1
Fixed salaries and staff benefits 129.9 122.6 Management bonus 125.1 68.2 Staff rebates 4.5 2.9 Share based compensation expenses 8.2 3.4
Other expenses 84.3 75.3
Other fixed operating costs 57.1 53.4 Sales and marketing 16.4 13.7 Depreciation 6.0 5.9 Non-recurring expenses 4.8 2.3
Total expenses 352.0 272.4
The Group’s management continued to exercise stringent cost discipline and aimed to keep fixed operating expenses well covered by its net management fee income, a relatively stable income source. We measure this objective with the “fixed cost coverage ratio”, an indicator of how many times fixed operating expenses are covered by net management fee income. For the current year, the Group’s fixed cost coverage (for asset management business) was 2.7 times.
Compensation and benefit expenses
Fixed salaries and staff benefits slightly increased by HK$7.3 million to HK$129.9 million (2012: HK$122.6 million). The increase was mainly attributable to salary increments and the additional headcount costs incurred by non-wholly owned subsidiary in Chengdu.
Management bonuses amounted to HK$125.1 million for the year (2012: HK$68.2 million). This is consistent with the Group’s compensation policy, which distributes 20% to 23% of the net profit pool every year as management bonuses to employees. The net profit pool comprises net profit before management bonuses and taxation, and after certain adjustments including cost of capital. This discretionary bonus promotes staff loyalty and performance, while aligning the interests of employees with those of shareholders.
Staff rebates increased to HK$4.5 million (2012: HK$2.9 million). Staff are entitled to partial rebates of management fees and performance fees when investing in funds managed by the Group.
The Group also recorded expenses of HK$8.2 million relating to stock options granted to employees. This expense item has no impact on cash flow and is recognized in accordance with Hong Kong Financial Reporting Standards.
FINANCIAL REVIEW
20 Value Partners Group LimitedAnnual Report 2013
Other expenses
Other non-staff operating costs such as rents, legal & professional fees, investment research fees and other administrative and office expenses, amounted to HK$57.1 million (2012: HK$53.4 million).
Sales and marketing expenses rose to HK$16.4 million for the year (2012: HK$13.7 million) as a result of increased spending on advertising and distributor sponsorship.
Non-recurring expenses mainly consisted of donations. The Group entered into a partnership with the Hong Kong University of Science and Technology (“HKUST”) in 2011, and launched the “Value Partners Center for Investing at the HKUST Business School”, for which the Group pledged a donation of up to HK$10.0 million over five years and HK$1.8 million was donated in 2013.
Dividends
The Group has been practising a consistent dividend distribution policy that takes into account of the relatively volatile nature of asset management income streams. This policy states that dividends (if any) will be declared once a year at the end of each financial year to better align them with the Group’s full-year performance.
For 2013, the Board of Directors recommended a final dividend of HK10.7 cents per share to shareholders.
Liquidity and financial resources
Fee income is the Group’s main source of income, while other income sources include interest income generated from bank deposits and interest-bearing bond investments, and dividend income from investments held. During the year, the Group’s balance sheet and cash flow positions remained strong, with a net cash balance of HK$692.1 million. Net cash inflows from operating activities amounted to HK$71.4 million, and the Group had no bank borrowings and did not pledge any assets as collateral for overdrafts or other loan facilities. The Group’s debt-to-equity ratio (interest-bearing external borrowings divided by shareholders’ equity) stood at zero while current ratio (current assets divided by current liabilities) came to 7.6 times.
Capital structure
As at 31 December 2013, the Group’s shareholders’ equity and total number of shares in issue for the Company stood at HK$2,828.7 million and 1.76 billion, respectively.
1 Performance of Value Partners Classic Fund (A Units) over past five years: 2009: +82.9%; 2010: +20.2%; 2011: -17.2%; 2012: +14%;
2013: +11.2%. Performance figures are calculated in US dollars on NAV to NAV, with dividends reinvested. Performance data is net of all
fees.
2 Performance of Value Partners High-Dividend Stocks Fund (Class A1) over past five years: 2009: +82.8%; 2010: +25.8%; 2011: -11.9%;
2012: +25.2%; 2013: +8.1%. Performance figures are calculated in US dollars on NAV to NAV, with dividends reinvested. Performance
data is net of all fees.
3 SFC authorization is not a recommendation or endorsement of a scheme nor does it guarantee the commercial merits of a scheme or its
performance. It does not mean the scheme is suitable for all investors nor is it an endorsement of its suitability for any particular investor
or class of investors.
4 Excluding AUM of VP Goldstate, in which the Group holds an ownership interest of 49%.

BIOgRAPHIES OF DIRECTORS AND SENIOR MANAgEMENT
21Value Partners Group LimitedAnnual Report 2013
Chairman
CHEAH Cheng Hye
Chairman and Co-Chief Investment Officer
Dato’ CHEAH Cheng Hye, aged 60, is Chairman and Co-Chief Investment Officer (“Co-CIO”) of Value Partners. He is in charge of Value Partners’ operations, and is actively engaged in all aspects of the Group’s activities, including investment research, fund management, business and product development, and corporate management. He sets the Group’s overall business and portfolio strategy. (Note: In July 2010, Mr. Louis SO was promoted to become Co-CIO of Value Partners, working alongside Dato’ CHEAH.)
Dato’ CHEAH has been in charge of Value Partners since he co-founded the firm in February 1993 with his partner, Mr. V-Nee YEH. Throughout the 1990s, he held the position of Chief Investment Officer and Managing Director of Value Partners, responsible for managing both the firm’s funds and business operation. He led Value Partners to a successful listing on the Main Board of the Hong Kong Stock Exchange in 2007, the first and only asset management company listed in Hong Kong. Dato’ CHEAH has more than 30 years of investment experience, and is considered one of the leading practitioners of value-investing in Asia and beyond. Value Partners and he personally have received numerous awards – a total of more than 80 professional awards and prizes since the firm’s inception in 1993.
In 2013, Mr. CHEAH was conferred the title of “Dato’” an honorary title that recognizes exceptional individuals – by the government in his home state of Penang, Malaysia. (The title comes with the award of an honorary “Darjah Setia Pangkuan Negeri”.) In April 2013, he was appointed as a member of the New Business Committee of the Financial Services Development Council by the Hong Kong Special Administrative Region government. He was also named an Honorary Fellow of The Hong Kong University of Science and Technology (“HKUST”) in June 2013 for outstanding achievements.
Dato’ CHEAH was the co-winner of “CIO of the Year in Asia” along with Mr. Louis SO in the 2011 Best of the Best Awards by Asia Asset Management. In October 2010, he was named by AsianInvestor as one of the Top-25 Most Influential People in Asian Hedge Funds. In 2009, he was named by AsianInvestor as one of the 25 Most Influential People in Asian Asset Management. He was also named “Capital Markets Person of the Year” by FinanceAsia in 2007, and in 2003, he was voted the “Most Astute Investor” in the Asset Benchmark Survey.
Prior to starting Value Partners, Dato’ CHEAH worked at Morgan Grenfell Group in Hong Kong, where, in 1989, he founded the Company’s Hong Kong/China equities research department as the Head of Research and proprietary trader for the firm. Prior to this, he was a financial journalist with the Asian Wall Street Journal and Far Eastern Economic Review, where he reported on business and financial news across East and Southeast Asia markets. Dato’ CHEAH served for nine years (1993 to 2002) as an independent non-executive director of Hong Kong-listed JCG Holdings, a leading microfinance company (renamed from 2006 as Public Financial Holdings).
BIOgRAPHIES OF DIRECTORS AND SENIOR MANAgEMENT
22 Value Partners Group LimitedAnnual Report 2013
Executive Directors
HUNg Yeuk Yan Renee
Deputy Chief Investment OfficerExecutive Director
Ms. Renee HUNG is Deputy Chief Investment Officer of Value Partners Group, responsible for the overall management of the investment management team. She also holds a leadership role in the Group’s investment process, and commands a high degree of responsibility for portfolio management.
Ms. HUNG has extensive experience in the investment industry, with a solid track record in research and portfolio management. She joined Value Partners as an Analyst in April 1998, and was promoted to Fund Manager and then Senior Fund Manager in 2004 and 2005, respectively. In March 2009, she was again promoted to her current role of Deputy Chief Investment Officer.
Ms. HUNG, aged 39, graduated from the University of California in Los Angeles in the U.S.A. with a degree in Applied Mathematics.
SO Chun Ki Louis
Deputy Chairman and Co-Chief Investment OfficerExecutive Director
Mr. Louis SO is Deputy Chairman and Co-Chief Investment Officer (“Co-CIO”) of Value Partners Group, responsible for assisting Dato’ CHEAH Cheng Hye, Chairman of the Board, for the Group’s affairs and activities, daily operations and overall management of the firm’s investment management team. He holds a leadership role in the Group’s investment process, including a high degree of responsibility for portfolio management.
Mr. SO has extensive experience in the investment industry, with a solid track record in research and portfolio management. He joined Value Partners in May 1999 as an Analyst and was promoted to the role of Fund Manager, Senior Fund Manager and Deputy Chief Investment Officer in 2004, 2005 and 2009, respectively. He was promoted to the role of Co-CIO in July 2010 and most recently promoted to the role of Deputy Chairman in June 2012. Mr. SO was the co-winner of “CIO of the Year in Asia” along with Dato’ CHEAH Cheng Hye in the 2011 Best of the Best Awards by Asia Asset Management.
Mr. SO, aged 38, obtained a degree in Commerce from the University of Auckland and a Master’s degree in Commerce from the University of New South Wales.

BIOgRAPHIES OF DIRECTORS AND SENIOR MANAgEMENT
23Value Partners Group LimitedAnnual Report 2013
TSE Wai Ming, Timothy, CFA
Chief Executive OfficerExecutive Director
Mr. Timothy TSE is Chief Executive Officer of Value Partners Group, responsible for the overall business development of the group. He assumes a leadership role in devising corporate strategy, and managing the company’s business operations as well as corporate affairs. He also leads the group’s efforts to provide best-in-class asset management services to top-tier institutional investors around the world, while driving the group’s China business initiatives. In addition to his responsibilities at the Hong Kong headquarters, he is also engaged in guiding and overseeing all aspects of the group’s regional joint venture businesses on the mainland and in Taiwan. He joined the firm in January 2007.
Prior to joining Value Partners, Mr. TSE worked in PricewaterhouseCoopers and KPMG, covering Investment Management Practice, as well as Transactions and Restructuring. He has extensive knowledge in the investment management industry and solid experience in capital markets and financial strategy in the Greater China Region.
Mr. TSE currently serves as an executive committee member of the Alternative Investment Management Association in Hong Kong.
Mr. TSE, aged 38, graduated from The Chinese University of Hong Kong with a Bachelor’s degree in Business Administration. He is a CFA charterholder and a Fellow of the Hong Kong Institute of Certified Public Accountants.
Independent Non-executive Directors
CHEN Shih-Ta Michael
Dr. Michael Shih-Ta CHEN was appointed as an Independent Non-executive Director of Value Partners Group Limited on 22 October 2007.
Dr. CHEN is currently the Executive Director of the Harvard Business School Asia Pacific Research Center, the first international research office established by the Harvard Business School in Asia. Prior to joining the Center in October 2005, Dr. CHEN worked in both the private and public sectors. Previously, Dr. CHEN served as Head of the Risk Management Unit of the Private Sector Operations Department of the Asian Development Bank, Head of International Private Banking in Hong Kong of Standard Chartered Bank, and Regional Director of National Westminster Bank. He served on the boards of a number of companies invested by Asian Development Bank. He also wrote cases and taught at various educational entities and universities.
Dr. CHEN, aged 68, graduated with a BA (Honors) Degree in Economics from the University of California, Berkeley in the U.S.A., received an MBA from Harvard University in the U.S.A. in 1972 and obtained a PhD in Economics from Cornell University in the U.S.A. in 1973.

BIOgRAPHIES OF DIRECTORS AND SENIOR MANAgEMENT
24 Value Partners Group LimitedAnnual Report 2013
LEE Siang Chin
Mr. LEE Siang Chin was appointed as an Independent Non-executive Director of Value Partners Group Limited on 22 October 2007.
Mr. LEE is a Director of the Social Security Organization of Malaysia and a member of its investment panel. Mr. LEE also serves as an Independent Non-executive Director for Maybank Investment Bank Bhd, Tune Insurance Malaysia Bhd, Star Publications (Malaysia) Bhd (a company listed on the Malaysian Stock Exchange) and Hilong Holding Ltd. (a company listed on The Stock Exchange of Hong Kong Limited). Mr. LEE previously served as Chairman and Managing Director of Surf88.com Sdn Bhd and AmSecurities Sdn Bhd, respectively. He also worked in corporate finance departments of leading investment banks in London, Sydney and Kuala Lumpur. In addition, Mr. LEE held various public offices. He was a board member of the Kuala Lumpur Stock Exchange and the President of the Association of Stock Broking Companies in Malaysia.
Mr. LEE, aged 65, became a member of the Malaysian Institute of Certified Public Accountants in 1975, and a Fellow of the Institute of Chartered Accountants in England and Wales in 1979.
Nobuo OYAMA
Mr. Nobuo OYAMA was appointed as an Independent Non-executive Director of Value Partners Group Limited on 22 October 2007.
Mr. OYAMA is a Director and Chief Financial Officer of XTrillion, Inc., Japan and PreXion Co., Ltd., Japan. He is also the founder and Managing Director of Asiavest Co., Ltd., Japan. Previously, Mr. OYAMA was a Director and Chief Financial Officer of Yappa Corporation, Japan. He also served as the Managing Director of Nichimen Co., (Hong Kong) Ltd. and Sojitz Trade & Investment Services (Hong Kong) Ltd. Mr. OYAMA had over 30 years of experience in offshore treasury operations across Japan, UK and Hong Kong for Nichimen Corporation in Japan and its overseas subsidiaries.
Mr. OYAMA, aged 60, received a Bachelor’s degree in Economics from the Kobe University in Japan, and was awarded a Master’s degree in Business Administration from Asia University, Tokyo, Japan, in 2010. He became a Chartered Member of the Securities Analysts Association of Japan (CMA®) in 2009.
BIOgRAPHIES OF DIRECTORS AND SENIOR MANAgEMENT
25Value Partners Group LimitedAnnual Report 2013
Other Senior Management
CHOW Wai Chiu William
Managing Director, ETF BusinessValue Partners Limited
Mr. William CHOW is a Managing Director, ETF Business at Value Partners, where he leads the Company’s exchange traded funds (ETFs) business. Mr. CHOW joined Value Partners in February 2010.
Mr. CHOW has extensive experience in the ETF industry, with a solid track record in product development and strategy as well as ETF portfolio management. Previously, he was the Senior Portfolio Manager at Blackrock North Asia Ltd, participating in iShares ETF portfolio management. He was also the Lead Portfolio Manager of a number of ETFs established under iShares, including iShares FTSE A50 China Index ETF (one of the largest ETFs in Asia). Prior to joining iShares, Mr. CHOW spent four years at State Street Global Advisors Asia Ltd. (“SSgA”) as a Portfolio Manager, responsible for various institutional equity index, asset allocation and currency hedging strategies. Tracker Fund of Hong Kong is among the ETFs that were managed by him. Before joining SSgA, Mr. CHOW worked for UBS AG.
Mr. CHOW, aged 38, graduated with a Master’s degree in Science in Operational Research from the London School of Economics and Political Science (UK). He also obtained a Bachelor’s degree in Engineering (Hons) in Civil Engineering from the University College London (UK).
HO Man Kei, Norman, CFA
Senior Investment DirectorValue Partners Limited
Mr. Norman HO is Senior Investment Director of Value Partners, where he holds a leadership role in the Company’s investment process, including a high degree of responsibility for portfolio management.
Mr. HO has extensive experience in the fund management and investment industry, with a focus on research and portfolio management. Mr. HO was promoted to Senior Investment Director in January 2014. He became an Investment Director in July 2010, and has since been participating in the Company’s investment management and leading the investment management team’s development. He joined Value Partners in November 1995. Prior to that, he was an executive with Dao Heng Securities Limited and had started his career with Ernst & Young.
Mr. HO, aged 47, graduated with a Bachelor’s degree in Social Sciences (majoring in Management Studies) from The University of Hong Kong. He is a CFA charterholder.

BIOgRAPHIES OF DIRECTORS AND SENIOR MANAgEMENT
26 Value Partners Group LimitedAnnual Report 2013
TAM Hin Tat Raymond
Deputy Chief Executive Officer and Head of SalesValue Partners Limited
Mr. Raymond TAM is Deputy Chief Executive Officer and Head of Sales at Value Partners, where he holds a leadership role in driving the Company’s sales and marketing activities. Mr. TAM joined the Group in April 2008 as Director of Sales and was appointed Executive Director of Sensible Asset Management Limited in July 2009. He was then promoted to Head of Sales and subsequently Managing Director of Sales in 2010 and 2012, respectively. He was most recently promoted to Deputy Chief Executive Officer and Head of Sales in June 2012. Mr. TAM currently also serves as President and Principal Executive Officer of Asia Pacific Fund, Inc. (a New York-listed closed-end management investment company, which appointed Value Partners as an investment manager in September 2013.)
Mr. TAM has over 17 years of experience in the asset management industry. Previously, he served as Vice President at BlackRock and was responsible for sales and marketing of both retail and institutional (pension business) channel businesses. Prior to that, he worked at JP Morgan Asset Management (formerly Jardine Fleming Asset Management), where he was responsible for direct sales and fund distribution.
Mr. TAM, aged 40, graduated from the University of Western Ontario in Canada, with a Bachelor’s degree in Economics.
LEE Vivienne
Chief Compliance OfficerValue Partners Limited
Ms. Vivienne LEE is Chief Compliance Officer of Value Partners, where she oversees the Company’s compliance function.
Ms. LEE has broad experience in the industry with a particular focus on compliance functions and scope, expertise in regulatory statutes, and other related functions. She joined Value Partners in May 2004 as an Assistant Compliance Manager. She was promoted to Compliance Manager, Senior Manager of Compliance and Compliance Director in 2004, 2005 and 2008, respectively. In May 2012, she was promoted to Chief Compliance Officer.
Previously, she was an Assistant Manager with the Hong Kong Securities and Futures Commission (“SFC”) responsible for monitoring and inspecting portfolios of licensed intermediaries. Prior to that, she was a staff accountant in Ernst & Young responsible for providing financial audit and business advisory services to a number of companies.
Ms. LEE, aged 40, graduated from the University of New South Wales with a Bachelor degree in Economics. She is a member of the CPA Australia.

REPORT OF THE DIRECTORS
27Value Partners Group LimitedAnnual Report 2013
The Board of Directors (the “Board” or the “Directors”) of Value Partners Group Limited (the “Company”, together with its subsidiaries, the “Group”) is pleased to present the annual report and the audited consolidated financial statements of the Group for the year ended 31 December 2013.
Principal activities
The Company is an investment holding company. The Group is principally engaged in value-oriented asset management businesses. The activities of its principal subsidiaries are set out in Note 17 to the consolidated financial statements.
Results
The results of the Group for the year are set out in the Consolidated Statement of Comprehensive Income on page 44.
Dividends
No interim dividend was paid during the year. The Directors recommend the payment of final dividend of HK10.7 cents per share for the year ended 31 December 2013 to the shareholders whose names are registered on the register of members of the Company on 9 May 2014. Subject to the approval of shareholders of the Company at the Annual General Meeting for the year 2014, the final dividend will be payable on or about 23 May 2014.
Summary of results, assets and liabilities
Summary of results, assets and liabilities for the years of 2009 to 2013 are set out on page 3 of this report.
Share capital
Details of the movements during the year in the share capital of the Company are set out in Note 28 to the consolidated financial statements.
Reserves
Details of the movements during the year in the reserves of the Group are set out in the Consolidated Statement of Changes in Equity on page 47.
In addition to the retained profits of the Company, the share premium account of the Company is also available for distribution to shareholders provided that the Company will be able to pay its debts as they fall due in the ordinary course of business immediately following the date on which any such distribution is proposed to be paid in accordance with the Companies Law of the Cayman Islands.
As at 31 December 2013, the Company’s distributable reserve was HK$1,752,933,000.
Charitable contributions
During the year, the Group made charitable contributions totalling HK$1,870,000.
REPORT OF THE DIRECTORS
28 Value Partners Group LimitedAnnual Report 2013
Board of DirectorsDuring the year ended 31 December 2013 and up to the date of this report the Board comprised:
Executive Directors
Dato’ CHEAH Cheng Hye (Chairman)Ms. HUNG Yeuk Yan ReneeMr. SO Chun Ki LouisMr. TSE Wai Ming, Timothy
Independent Non-executive Directors
Dr. CHEN Shih-Ta MichaelMr. LEE Siang ChinMr. Nobuo OYAMA
In accordance with article 87 of the Company’s articles of association, Mr. SO Chun Ki Louis, Mr. TSE Wai Ming, Timothy and Dr. CHEN Shih-Ta Michael will retire and, being eligible, offer themselves for re-election at the forthcoming annual general meeting.
The Company has received from each of the Independent Non-executive Directors an annual confirmation of his independence pursuant to Rule 3.13 of the Rules Governing the Listing of Securities on The Stock Exchange of Hong Kong Limited (the “Stock Exchange”) (the “Listing Rules”). The Company considers all of the Independent Non-executive Directors are independent.
Biographical details of the Directors as at the date of this annual report are set out on pages 21 to 26.
Directors’ service contractsEach of the Executive Directors has entered into a service contract with the Company for a term of three years. The service contract shall be terminated in accordance with the provisions of the service contract or, throughout the term of the appointment, by either party giving to the other party not less than three months’ prior notice in writing (other than Dato’ CHEAH Cheng Hye whose notice period is six months).
Each of the Independent Non-executive Directors has entered into a service contract with the Company for one year commencing on 22 November 2013 and either the Company or the Independent Non-executive Director may terminate the appointment by giving at least three months’ notice in writing.
Save as disclosed above, none of the Directors have entered or have proposed to enter into any service agreement with the Company or any member of the Group which is not determinable by the Company within one year without payment of compensation other than statutory compensation.
Directors’ interests in shares, underlying shares and debenturesAs at 31 December 2013, the interests and short positions of the Directors and the chief executive of the Company in the shares, underlying shares and debentures of the Company and its associated corporations (within the meaning of Part XV of Securities and Futures Ordinance (the “SFO”)) which had notified to the Company and the Stock Exchange pursuant to Divisions 7 and 8 of Part XV of the SFO (including interests and short positions which he is taken or deemed to have under such provisions of the SFO) or which had required, pursuant to section 352 of the SFO, to be recorded in the register referred to therein or which will be required to be notified to the Company and the Stock Exchange pursuant to the Model Code for Securities Transactions by Directors of Listed Issuers contained in the Listing Rules, were as follows:

REPORT OF THE DIRECTORS
29Value Partners Group LimitedAnnual Report 2013
(a) Long position in shares of the Company (“Shares”)
Name of Director Nature of interest Number of Shares
Number of underlyingShares in which
the Directors holdunder the shareoption scheme(4)
Approximatepercentage
of issued Shares
Dato’ CHEAH Cheng Hye Founder of trust/beneficial(1) 499,730,484 – 28.47%Beneficial – 57,050,828 3.25%
Ms. HUNG Yeuk Yan Renee Founder of trust(2) 26,704,583 – 1.52%Beneficial – 8,436,140 0.48%
Mr. SO Chun Ki Louis Beneficial 26,641,583 10,336,140 2.10%Mr. TSE Wai Ming, Timothy Beneficial 100,000 3,300,000 0.19%Dr. CHEN Shih-Ta Michael Beneficial – 200,000 0.01%Mr. LEE Siang Chin Corporate(3) 500,000 – 0.02%
Beneficial – 200,000 0.01%Mr. Nobuo OYAMA Beneficial 390,000 200,000 0.03%
Notes:
(1) These Shares are directly held by Cheah Capital Management Limited (“CCML”) which is wholly-owned by Cheah Company Limited which is in turn wholly-owned by Hang Seng Bank Trustee International Limited, a company incorporated in the Bahamas, as trustee for a discretionary trust, the discretionary objects of which include Dato’ CHEAH Cheng Hye and certain members of his family.
(2) These Shares are directly held by Bright Starlight Limited which is wholly-owned by Scenery Investments Limited which is in turn wholly-owned by Hang Seng Bank Trustee International Limited, a company incorporated in the Bahamas, as trustee for a discretionary trust, the discretionary objects of which include certain members of the family of Ms. HUNG Yeuk Yan Renee.
(3) These Shares are directly held by Stenying Holdings Limited, whose entire issued share capital is held by Mr. LEE Siang Chin and Ms. KOO Yoon Kin in equal shares. Ms. KOO Yoon Kin is the spouse of Mr. LEE Siang Chin.
(4) The number of underlying Shares in which the Directors hold under the share option scheme are detailed in “Share options” section below.
(b) Interest in associated corporation
Name of Director Name of associated corporationNature of
interestNumber of
shares
Approximatepercentage
of issued sharesof the relevant
associatedcorporation
Dato’ CHEAH Cheng Hye Value Partners Strategic Equity Fund Beneficial 74,000 non-voting shares
0.49% of the total issued non-voting
sharesMs. HUNG Yeuk Yan Renee Value Partners Strategic Equity Fund Beneficial 10,000 non-voting
shares0.07% of the total issued non-voting
sharesMr. LEE Siang Chin Value Partners Strategic Equity Fund Corporate
(Note)50,000 non-voting
shares0.33% of the total issued non-voting
shares
Note: These non-voting shares are directly held by Stenying Holdings Limited, whose entire issued share capital is held by Mr. LEE Siang Chin and Ms. KOO Yoon Kin in equal shares. Ms. KOO Yoon Kin is the spouse of Mr. LEE Siang Chin.
REPORT OF THE DIRECTORS
30 Value Partners Group LimitedAnnual Report 2013
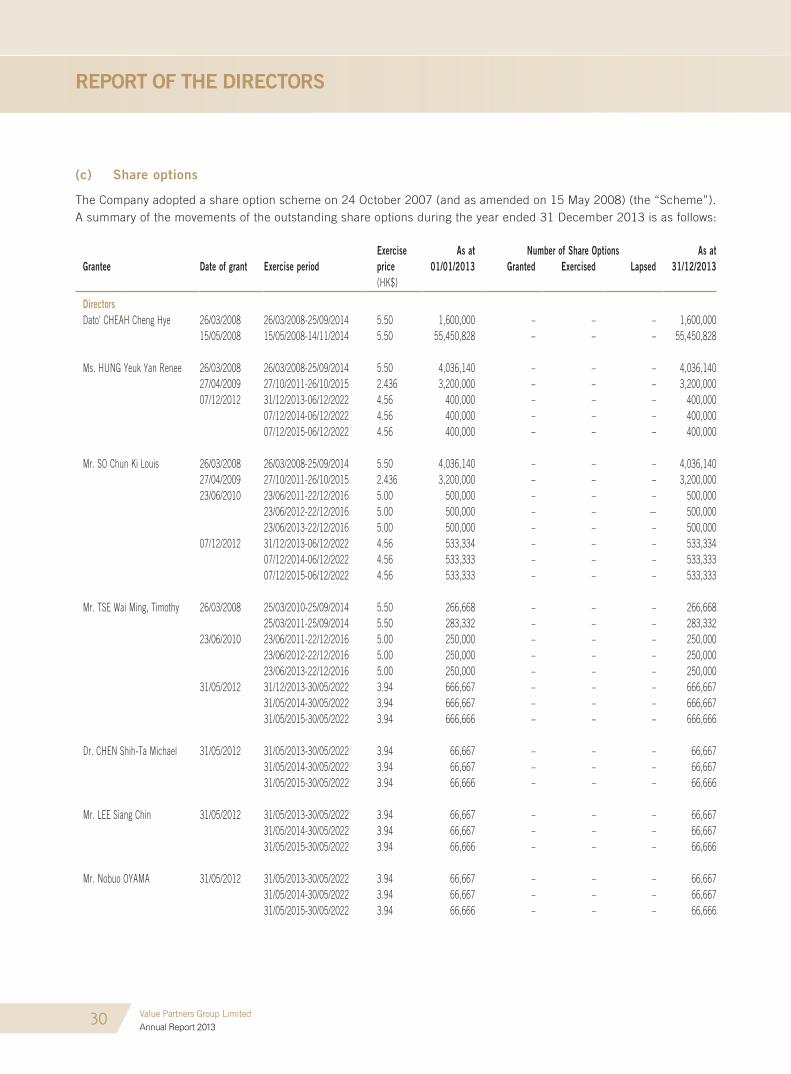
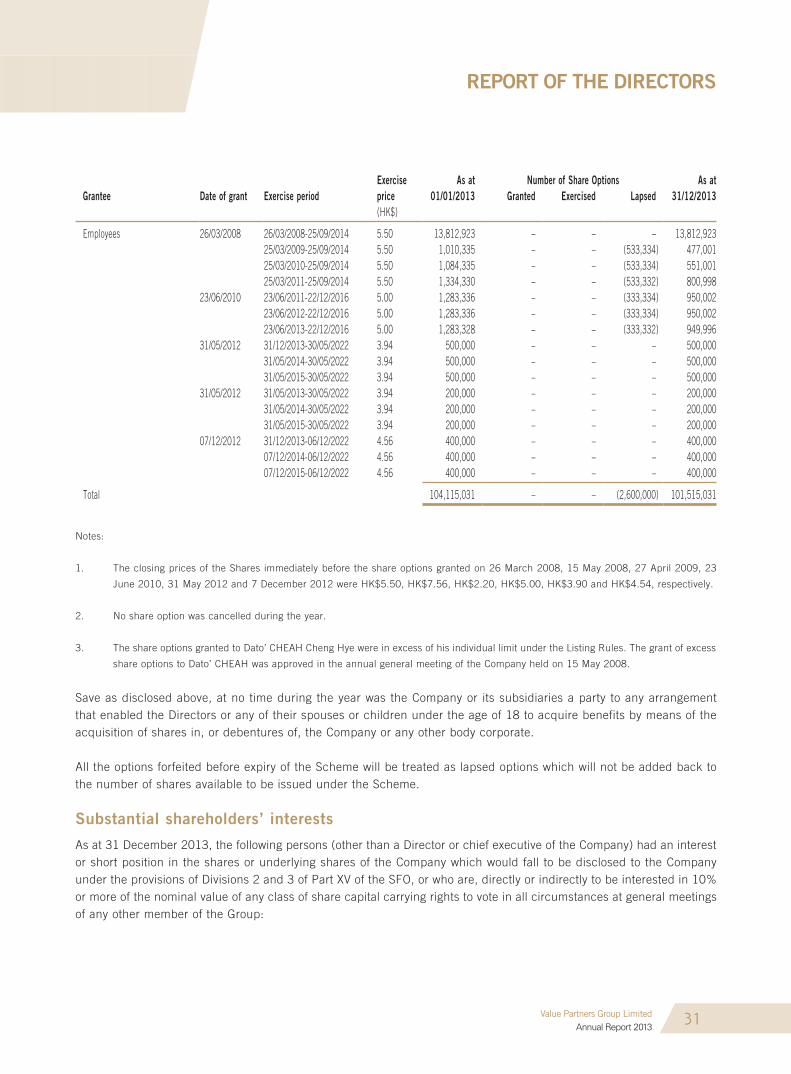
(c) Share options
The Company adopted a share option scheme on 24 October 2007 (and as amended on 15 May 2008) (the “Scheme”). A summary of the movements of the outstanding share options during the year ended 31 December 2013 is as follows:
Exercise As at Number of Share Options As atgrantee Date of grant Exercise period price 01/01/2013 granted Exercised Lapsed 31/12/2013
(HK$)
DirectorsDato’ CHEAH Cheng Hye 26/03/2008 26/03/2008-25/09/2014 5.50 1,600,000 – – – 1,600,000
15/05/2008 15/05/2008-14/11/2014 5.50 55,450,828 – – – 55,450,828
Ms. HUNG Yeuk Yan Renee 26/03/2008 26/03/2008-25/09/2014 5.50 4,036,140 – – – 4,036,14027/04/2009 27/10/2011-26/10/2015 2.436 3,200,000 – – – 3,200,00007/12/2012 31/12/2013-06/12/2022 4.56 400,000 – – – 400,000
07/12/2014-06/12/2022 4.56 400,000 – – – 400,00007/12/2015-06/12/2022 4.56 400,000 – – – 400,000
Mr. SO Chun Ki Louis 26/03/2008 26/03/2008-25/09/2014 5.50 4,036,140 – – – 4,036,14027/04/2009 27/10/2011-26/10/2015 2.436 3,200,000 – – – 3,200,00023/06/2010 23/06/2011-22/12/2016 5.00 500,000 – – – 500,000
23/06/2012-22/12/2016 5.00 500,000 – – – 500,00023/06/2013-22/12/2016 5.00 500,000 – – – 500,000
07/12/2012 31/12/2013-06/12/2022 4.56 533,334 – – – 533,33407/12/2014-06/12/2022 4.56 533,333 – – – 533,33307/12/2015-06/12/2022 4.56 533,333 – – – 533,333
Mr. TSE Wai Ming, Timothy 26/03/2008 25/03/2010-25/09/2014 5.50 266,668 – – – 266,66825/03/2011-25/09/2014 5.50 283,332 – – – 283,332
23/06/2010 23/06/2011-22/12/2016 5.00 250,000 – – – 250,00023/06/2012-22/12/2016 5.00 250,000 – – – 250,00023/06/2013-22/12/2016 5.00 250,000 – – – 250,000
31/05/2012 31/12/2013-30/05/2022 3.94 666,667 – – – 666,66731/05/2014-30/05/2022 3.94 666,667 – – – 666,66731/05/2015-30/05/2022 3.94 666,666 – – – 666,666
Dr. CHEN Shih-Ta Michael 31/05/2012 31/05/2013-30/05/2022 3.94 66,667 – – – 66,66731/05/2014-30/05/2022 3.94 66,667 – – – 66,66731/05/2015-30/05/2022 3.94 66,666 – – – 66,666
Mr. LEE Siang Chin 31/05/2012 31/05/2013-30/05/2022 3.94 66,667 – – – 66,66731/05/2014-30/05/2022 3.94 66,667 – – – 66,66731/05/2015-30/05/2022 3.94 66,666 – – – 66,666
Mr. Nobuo OYAMA 31/05/2012 31/05/2013-30/05/2022 3.94 66,667 – – – 66,66731/05/2014-30/05/2022 3.94 66,667 – – – 66,66731/05/2015-30/05/2022 3.94 66,666 – – – 66,666
REPORT OF THE DIRECTORS
31Value Partners Group LimitedAnnual Report 2013
Exercise As at Number of Share Options As atgrantee Date of grant Exercise period price 01/01/2013 granted Exercised Lapsed 31/12/2013
(HK$)
Employees 26/03/2008 26/03/2008-25/09/2014 5.50 13,812,923 – – – 13,812,92325/03/2009-25/09/2014 5.50 1,010,335 – – (533,334) 477,00125/03/2010-25/09/2014 5.50 1,084,335 – – (533,334) 551,00125/03/2011-25/09/2014 5.50 1,334,330 – – (533,332) 800,998
23/06/2010 23/06/2011-22/12/2016 5.00 1,283,336 – – (333,334) 950,00223/06/2012-22/12/2016 5.00 1,283,336 – – (333,334) 950,00223/06/2013-22/12/2016 5.00 1,283,328 – – (333,332) 949,996
31/05/2012 31/12/2013-30/05/2022 3.94 500,000 – – – 500,00031/05/2014-30/05/2022 3.94 500,000 – – – 500,00031/05/2015-30/05/2022 3.94 500,000 – – – 500,000
31/05/2012 31/05/2013-30/05/2022 3.94 200,000 – – – 200,00031/05/2014-30/05/2022 3.94 200,000 – – – 200,00031/05/2015-30/05/2022 3.94 200,000 – – – 200,000
07/12/2012 31/12/2013-06/12/2022 4.56 400,000 – – – 400,00007/12/2014-06/12/2022 4.56 400,000 – – – 400,00007/12/2015-06/12/2022 4.56 400,000 – – – 400,000
Total 104,115,031 – – (2,600,000) 101,515,031
Notes:
1. The closing prices of the Shares immediately before the share options granted on 26 March 2008, 15 May 2008, 27 April 2009, 23
June 2010, 31 May 2012 and 7 December 2012 were HK$5.50, HK$7.56, HK$2.20, HK$5.00, HK$3.90 and HK$4.54, respectively.
2. No share option was cancelled during the year.
3. The share options granted to Dato’ CHEAH Cheng Hye were in excess of his individual limit under the Listing Rules. The grant of excess
share options to Dato’ CHEAH was approved in the annual general meeting of the Company held on 15 May 2008.
Save as disclosed above, at no time during the year was the Company or its subsidiaries a party to any arrangement that enabled the Directors or any of their spouses or children under the age of 18 to acquire benefits by means of the acquisition of shares in, or debentures of, the Company or any other body corporate.
All the options forfeited before expiry of the Scheme will be treated as lapsed options which will not be added back to the number of shares available to be issued under the Scheme.
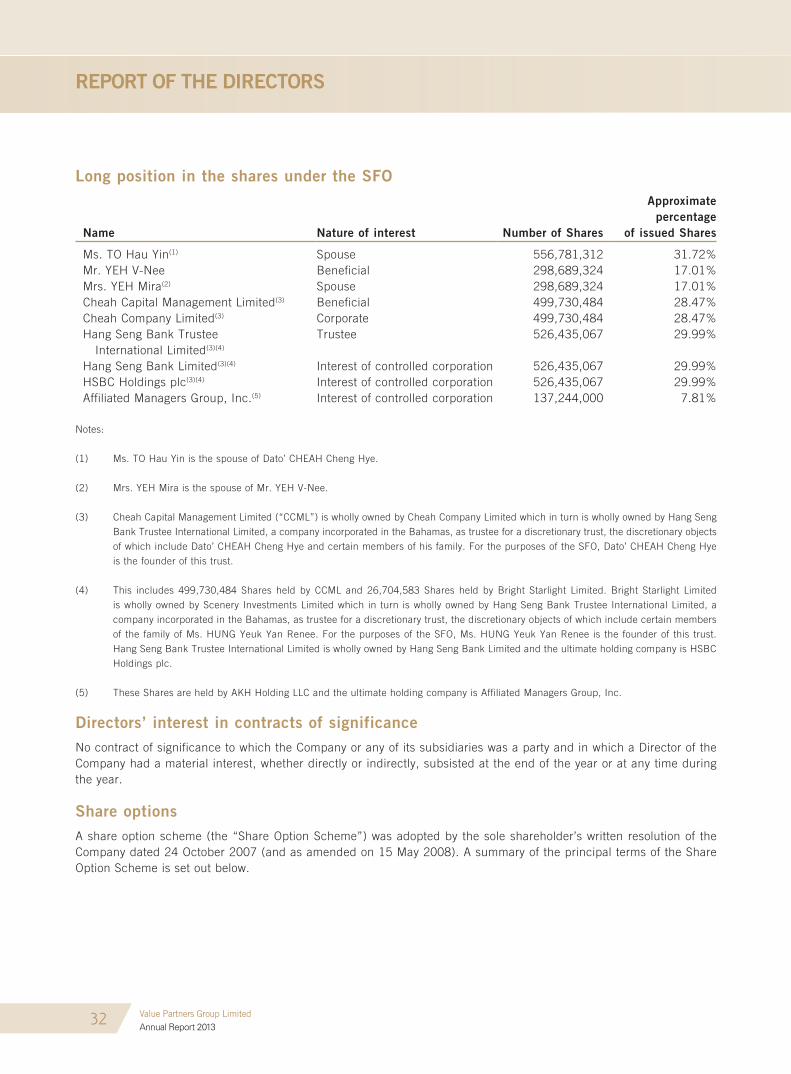
Substantial shareholders’ interests
As at 31 December 2013, the following persons (other than a Director or chief executive of the Company) had an interest or short position in the shares or underlying shares of the Company which would fall to be disclosed to the Company under the provisions of Divisions 2 and 3 of Part XV of the SFO, or who are, directly or indirectly to be interested in 10% or more of the nominal value of any class of share capital carrying rights to vote in all circumstances at general meetings of any other member of the Group:
REPORT OF THE DIRECTORS
32 Value Partners Group LimitedAnnual Report 2013
Long position in the shares under the SFO
Name Nature of interest Number of Shares
Approximatepercentage
of issued Shares
Ms. TO Hau Yin(1) Spouse 556,781,312 31.72%Mr. YEH V-Nee Beneficial 298,689,324 17.01%Mrs. YEH Mira(2) Spouse 298,689,324 17.01%Cheah Capital Management Limited(3) Beneficial 499,730,484 28.47%Cheah Company Limited(3) Corporate 499,730,484 28.47%Hang Seng Bank Trustee International Limited(3)(4)
Trustee 526,435,067 29.99%
Hang Seng Bank Limited(3)(4) Interest of controlled corporation 526,435,067 29.99%HSBC Holdings plc(3)(4) Interest of controlled corporation 526,435,067 29.99%Affiliated Managers Group, Inc.(5) Interest of controlled corporation 137,244,000 7.81%
Notes:
(1) Ms. TO Hau Yin is the spouse of Dato’ CHEAH Cheng Hye.
(2) Mrs. YEH Mira is the spouse of Mr. YEH V-Nee.
(3) Cheah Capital Management Limited (“CCML”) is wholly owned by Cheah Company Limited which in turn is wholly owned by Hang Seng
Bank Trustee International Limited, a company incorporated in the Bahamas, as trustee for a discretionary trust, the discretionary objects
of which include Dato’ CHEAH Cheng Hye and certain members of his family. For the purposes of the SFO, Dato’ CHEAH Cheng Hye
is the founder of this trust.
(4) This includes 499,730,484 Shares held by CCML and 26,704,583 Shares held by Bright Starlight Limited. Bright Starlight Limited
is wholly owned by Scenery Investments Limited which in turn is wholly owned by Hang Seng Bank Trustee International Limited, a
company incorporated in the Bahamas, as trustee for a discretionary trust, the discretionary objects of which include certain members
of the family of Ms. HUNG Yeuk Yan Renee. For the purposes of the SFO, Ms. HUNG Yeuk Yan Renee is the founder of this trust.
Hang Seng Bank Trustee International Limited is wholly owned by Hang Seng Bank Limited and the ultimate holding company is HSBC
Holdings plc.
(5) These Shares are held by AKH Holding LLC and the ultimate holding company is Affiliated Managers Group, Inc.
Directors’ interest in contracts of significanceNo contract of significance to which the Company or any of its subsidiaries was a party and in which a Director of the Company had a material interest, whether directly or indirectly, subsisted at the end of the year or at any time during the year.
Share optionsA share option scheme (the “Share Option Scheme”) was adopted by the sole shareholder’s written resolution of the Company dated 24 October 2007 (and as amended on 15 May 2008). A summary of the principal terms of the Share Option Scheme is set out below.
REPORT OF THE DIRECTORS
33Value Partners Group LimitedAnnual Report 2013
1. Purpose of the Share Option Scheme
To reward Participants who have contributed to the Group and to encourage Participants to work towards enhancing the value of the Company and its shares for the benefit of the Company and its Shareholders as a whole.
2. Participants of the Share Option Scheme
Directors (including Executive Directors, Non-executive Directors and Independent Non-executive Directors) and employees of the Group and any advisors, consultants, distributors, contractors, suppliers, agents, customers, business partners, joint venture business partners, promoters, service providers of any member of the Group who the Board considers, in its sole discretion, have contributed or will contribute to the Group.
3. Total number of Shares available for issue under the Share Option Scheme and percentage of issued share capital as at 31 December 2013
160,000,000 shares (9.12%)
4. Maximum entitlement of each participant under the Share Option Scheme
In any 12-month period, in aggregate not over:–(a) 1% of the issued share capital (excluding substantial shareholders and Independent Non-executive Directors).(b) 0.1% of the issued share capital and exceeding HK$5 million in aggregate value (for substantial shareholders
and Independent Non-executive Directors).
Such further grant of options shall be subject to prior approval by a resolution of the Shareholders.
5. The period within which the Shares must be taken up under an option
In respect of any particular option, the period to be determined and notified by the Board to the grantee at the time of making an offer which shall not expire later than 10 years from the date of grant.
6. The minimum period for which an option must be held before it can be exercised
Nil
7. The amount payable on application or acceptance of the option and the period within which payments or calls must or may be made or loans for such purposes must be repaid
Upon acceptance of the option, the grantee shall inform the Company together with HK$1 by way of consideration for the grant within 28 days from the date of offer.
8. The basis of determining the exercise price
The exercise price shall be determined by the Board in its absolute discretion but in any event shall not be less than the higher of:–(a) the closing price of the Shares as stated in the daily quotations sheets issued by the Stock Exchange on the date
of grant which must be a business day;(b) the average closing price of the Shares as stated in the daily quotations sheets issued by the Stock Exchange for
the five business days immediately preceding the date of grant; and(c) the nominal value of the Shares.
9. The remaining life of the Share Option Scheme
The Share Option Scheme will remain valid until 23 October 2017.
REPORT OF THE DIRECTORS
34 Value Partners Group LimitedAnnual Report 2013
Connected transactions and continuing connected transactions
During the year, the Company did not have any connected transactions and continuing connected transactions which were subject to the disclosure requirements of the Listing Rules. The related-party transactions as disclosed in Note 36 did not fall under the definition of connected transactions or continuing connected transactions in the Listing Rules.
Disclosure of information of Directors
Pursuant to Rule 13.51B(1) of the Listing Rules, the changes of information of the Directors are as follows:
• The monthly salary of Dato’ CHEAH Cheng Hye was revised from HK$458,000 to HK$470,000 with effect from 1 January 2014.
• The monthly salary of Ms. HUNG Yeuk Yan Renee was revised from HK$168,800 to HK$182,000 with effect from 1 January 2014.
• The monthly salary of Mr. SO Chun Ki Louis was revised from HK$233,200 to HK$270,000 with effect from 1 January 2014.
• The monthly salary of Mr. TSE Wai Ming, Timothy was revised from HK$195,800 to HK$216,000 with effect from 1 January 2014.
• The annual remuneration of each of Dr. CHEN Shih-Ta Michael, Mr. LEE Siang Chin and Mr. Nobuo OYAMA was revised from HK$275,000 to HK$289,000 with effect from 23 November 2013.
Management contracts
No contracts concerning the management and administration of the whole or any substantial part of the business of the Company were entered into or existed during the year.
Directors’ and the five highest-paid individuals’ emoluments
The Directors’ fees and remuneration and the emoluments of the five highest-paid individuals are disclosed in Note 9 to the consolidated financial statements. The emoluments of the Directors are determined with regard to their duties and responsibilities, the Company’s performance, prevailing market conditions and after considering the market emoluments for Directors of other listed companies.
Pension schemes
Pension costs for the year are set out in Note 9 to the consolidated financial statements.
Sufficiency of public float
As at the latest practicable date prior to the issue of this annual report, to the best knowledge of the Directors and based on the information publicly available to the Company, there is a sufficient public float as required by the Listing Rules.
Purchase, redemption or sale of listed shares of the Company
Neither the Company, nor any of its subsidiaries purchased, redeemed or sold any of the Company’s listed shares during the year.
REPORT OF THE DIRECTORS
35Value Partners Group LimitedAnnual Report 2013
Pre-emptive rights
There is no provision for pre-emptive rights under the Company’s articles of association although there are no restrictions against such rights under the Companies Law in the Cayman Islands.
Major customers and suppliers
The Group’s five largest customers (in terms of AUM as of 31 December 2013) accounted for 21.6% of the Group’s total fee income, and the Group’s five largest suppliers accounted for 67.4% of the Group’s distribution fee expenses for the year ended 31 December 2013.
The Group’s largest customer (in terms of AUM as at the end of year) accounted for approximately 7.7% of the Group’s total fee income whereas our largest supplier accounted for approximately 18.9% of total distribution fee expenses.
None of the Directors or any of their associates or any shareholders (which, to the best knowledge of the Directors, own more than 5% of the Company’s issued share capital) had any material beneficial interest in the Group’s top five largest customers or suppliers.
Property, plant and equipment
Details of movements in property, plant and equipment during the year are set out in Note 18 to the consolidated financial statements.
Post balance sheet event
There was no post balance sheet event for the year ended 31 December 2013.
Auditor
The consolidated financial statements for the year ended 31 December 2013 have been audited by PricewaterhouseCoopers, who retire and, being eligible, offer themselves for reappointment.
A resolution to re-appoint PricewaterhouseCoopers as auditor of the Company will be submitted at the forthcoming annual general meeting of the Company.
On behalf of the BoardDato’ CHEAH Cheng HyeChairman and Co-Chief Investment Officer
Hong Kong, 13 March 2014
CORPORATE gOVERNANCE REPORT
36 Value Partners Group LimitedAnnual Report 2013
The Board of Directors of the Company (the “Board” or “Directors”) strives to attain and maintain high standards of corporate governance as it believes that effective corporate governance practices are fundamental to enhancing shareholder value and safeguarding interests of shareholders, clients and other stakeholders. In running a regulated business, the Group adopts sound corporate governance principles that emphasize a quality Board, effective internal control, stringent compliance practices and transparency and accountability to all stakeholders.
In the Directors’ opinion, the Company has complied with the code provisions set out in the Corporate Governance Code (the “CG Code”) as stated in Appendix 14 to the Rules Governing the Listing of Securities on The Stock Exchange of Hong Kong Limited (the “Stock Exchange”) (the “Listing Rules”) throughout the year of 2013. The Company continued to maintain high standards of corporate governance and business ethics, and to ensure the full compliance of our operations with applicable laws and regulations.
Compliance with the Model Code
The Company has adopted the Model Code for Securities Transactions by Directors (the “Model Code”) set out in Appendix 10 of the Listing Rules as the code of conduct in respect of transactions in securities of the Company by Directors. The Company, having made specific enquiry of all the Directors, was not aware of any non-compliance with the Model Code by the Directors during the year. The blackout periods in respect of transactions in securities of the Company by Directors also apply to all staff of the Group.
Board of Directors
The Board, with over one third of the Board members are Independent Non-executive Directors, is responsible for overseeing and directing the senior management of the Company. The major duties of the Board include:
• Formulating the vision of the Group;• Reviewing and approving the interim and final results of the Group;• Reviewing and approving, if considered fit, the business plans and financial budget of the Group;• Reviewing the business and financial updates of the Group;• Ensuring a high standard of corporate governance, compliance, internal control and risk management; and• Overseeing the performance of the senior management.
All Directors have separate and independent access rights to the senior management about the conduct of the business and development of the Company. In order to facilitate the Directors in discharging their duties, a monthly management report incorporating financial statements, cost analysis, headcount information, assets under management breakdown and fee margin analysis has been circulated to the Directors. The management report of the preceding month would be released to the Directors by the end of each month.
The Board held four meetings in 2013 and the attendance record of each Director at the board meetings is set out below:
No. of board meetings attended/held
Executive DirectorsDato’ CHEAH Cheng Hye (Chairman) 4/4Ms. HUNG Yeuk Yan Renee 4/4Mr. SO Chun Ki Louis 4/4Mr. TSE Wai Ming, Timothy 4/4
Independent Non-executive DirectorsDr. CHEN Shih-Ta Michael 4/4Mr. LEE Siang Chin 4/4Mr. Nobuo OYAMA 4/4
CORPORATE gOVERNANCE REPORT
37Value Partners Group LimitedAnnual Report 2013
The Group ensures that appropriate and sufficient information is provided to Directors in a timely manner to keep them abreast of the Group’s latest developments thereby assisting them in the discharge of their duties.
The Chairman held a meeting with the Independent Non-executive Directors without the presence of Executive Directors in 2013.
To the best knowledge of the Directors, the Board is not aware of any financial, business, family or other material/relevant relationships among the Board members. All the Directors had received training/briefing which covered topics in directors’ duties and liabilities, continuing obligations of a listed company, corporate governance and compliance issues after their appointments. Ongoing updates of any applicable laws and regulations were provided by the Company to the Directors in a reasonable time frame.
According to the records provided by the directors, a summary of training received by the Directors during 2013 is as follows:
Type of continuous professional development programmes
Executive DirectorsDato’ CHEAH Cheng Hye (Chairman) A, BMs. HUNG Yeuk Yan Renee A, BMr. SO Chun Ki Louis A, BMr. TSE Wai Ming, Timothy A, B
Independent Non-executive DirectorsDr. CHEN Shih-Ta Michael BMr. LEE Siang Chin BMr. Nobuo OYAMA B
Notes: A: Attending seminars and courses relating to regulations, updates and development on fund management business
B: Reading materials relating to the new Companies Ordinance and also relating to business and industry
Each of the Executive Directors entered into a service contract with the Company for a term of three years and each of the Independent Non-executive Directors entered into a service contract with the Company for a term of one year. Under the Company’s articles of association, one third of the Directors, who have served longest on the Board, must retire, thus becoming eligible for re-election at each annual general meeting.
The Company has received the annual confirmation of independence from all the Independent Non-executive Directors pursuant to Rule 3.13 of the Listing Rules and considered them independent to the Group.
The Company has arranged appropriate director and officer liability and professional indemnity insurance coverage since 2007, which is reviewed on an annual basis, for liabilities arising out of corporate activities from being the Directors and senior management of the Group.
Chairman and Chief Executive Officer
The Chairman of the Board, Dato’ CHEAH Cheng Hye, chairs all the board meetings and general meetings. He is leading the overall business and investment strategies of the Group. Mr. TSE Wai Ming, Timothy, the Chief Executive Officer of the Company, is responsible for overall business development of the Group. He assumes a leadership role in devising corporate strategy, as well as managing the company’s business operations and corporate affairs.

CORPORATE gOVERNANCE REPORT
38 Value Partners Group LimitedAnnual Report 2013
Board committees
The Board has established the following committees with specific responsibilities as described in the respective terms of reference available on the Company’s and/or the Stock Exchange’s website(s):
1. Audit Committee
The Company established the Audit Committee on 24 October 2007 with written terms of reference in compliance with the CG Code. The primary duties of the Audit Committee include providing an independent review of the effectiveness of the financial reporting process, certain corporate governance functions, as well as the system of internal controls and risk management which includes the corporate audit function. The Audit Committee also oversees the appointment, remuneration and terms of engagement of the Company’s auditor, as well as their independence. The Audit Committee comprises Dr. CHEN Shih-Ta Michael, Mr. LEE Siang Chin and Mr. Nobuo OYAMA, all of which are Independent Non-executive Directors. The Audit Committee is chaired by Mr. LEE Siang Chin.
The Audit Committee held four meetings in 2013. The Chief Executive Officer, the Chief Operating Officer, the Chief Compliance Officer, the Head of Corporate Audit, the Head of Finance and representatives of the Auditor attended all/some of the meetings. The attendance record of each member at the Audit Committee meetings is set out below:
No. of Audit Committee meetings attended/held
Mr. LEE Siang Chin (Chairman) 4/4Dr. CHEN Shih-Ta Michael 4/4Mr. Nobuo OYAMA 4/4
In 2013, the Audit Committee reviewed, discussed and/or approved the issues related to:
• The Group’s interim and annual results, preliminary announcements and reports and recommendations of their major opinions to the Board.
• The auditor’s remuneration (including the non-audit services) and its terms of engagement.• The treasury activities and liquidity of the Group.• The IT infrastructure review action plan.• The reports prepared by risk management, compliance and corporate audit departments.• The Group’s adherence to the code provisions in the CG Code.• The enterprise risk management report.
In order to further enhance independent reporting, the members met in separate private session with the Auditor once a year and met with Chief Compliance Officer and Head of Corporate Audit twice a year without the presence of the management.
2. Remuneration Committee
The Company established the Remuneration Committee on 24 October 2007 with written terms of reference in compliance with the CG Code. The primary duties of the Remuneration Committee include determining the policy and structure for the remuneration of Executive Directors and senior management, reviewing incentive schemes and Directors’ service contracts, and confirming the performance based remuneration packages for all Directors and senior management. The Remuneration Committee comprises Dato’ CHEAH Cheng Hye, Mr. TSE Wai Ming, Timothy, Dr. CHEN Shih-Ta Michael, Mr. LEE Siang Chin and Mr. Nobuo OYAMA, three of which are Independent Non-executive Directors. The Remuneration Committee is chaired by Dr. CHEN Shih-Ta Michael.
CORPORATE gOVERNANCE REPORT
39Value Partners Group LimitedAnnual Report 2013
The Remuneration Committee held two meetings in 2013. The attendance record of each member at the RemunerationCommittee meetings is set out below:
No. of Remuneration Committee meetings attended/held
Dr. CHEN Shih-Ta Michael (Chairman) 2/2Dato’ CHEAH Cheng Hye 2/2Mr. LEE Siang Chin 2/2Mr. Nobuo OYAMA 2/2Mr. TSE Wai Ming, Timothy 2/2
In 2013, the Remuneration Committee reviewed, discussed and/or approved the issues related to:
• The remuneration level for Directors and senior management for the year 2014 which was based on individual performance with reference to an independent salary survey report.
• The bonus allocation to the Directors and senior management with reference to the Group’s financial results and individual performance.
• The renewal of service contracts of Directors.• The talent management and a holistic human relations management policy.
3. Nomination Committee
The Company established the Nomination Committee on 13 March 2012. The primary duties of the Nomination Committee are to review the structure, size and composition (including the skills, knowledge and experience) of the Board at least annually and make recommendations on any proposed changes to the Board to complement the Company’s corporate strategy. The Nomination Committee comprises Dato’ CHEAH Cheng Hye, Dr. CHEN Shih-Ta Michael, Mr. LEE Siang Chin, Mr. Nobuo OYAMA and Mr. TSE Wai Ming, Timothy, three of which are Independent Non-executive Directors. The Nomination Committee is chaired by Dato’ CHEAH Cheng Hye.
The Nomination Committee held one meeting in 2013. The attendance record of each member at the NominationCommittee meeting is set out below:
No. of Nomination Committee meeting attended/held
Dato’ CHEAH Cheng Hye (Chairman) 1/1Dr. CHEN Shih-Ta Michael 1/1Mr. LEE Siang Chin 1/1Mr. Nobuo OYAMA 1/1Mr. TSE Wai Ming, Timothy 1/1
In 2013, the Nomination Committee reviewed, discussed and/or approved the issues related to:
• Reviewing and recommending the structure, size and composition of the Board with reference to the board diversity policy.
• Assessment of the independence of Independent Non-executive Directors.• Offering recommendation to the Board on relevant matters relating to the re-appointment of Directors in the
forthcoming annual general meeting.
During 2013, no new Director has been selected or recommended for directorship.
CORPORATE gOVERNANCE REPORT
40 Value Partners Group LimitedAnnual Report 2013
4. Risk Management Committee
The Company established the Risk Management Committee on 24 October 2007. The primary duties of the Risk Management Committee are to establish and maintain effective policies and guidelines to ensure proper management of risks to which the Group and its clients are exposed, and to take appropriate and timely action to manage such risks. The Risk Management Committee comprises Dato’ CHEAH Cheng Hye and Mr. SO Chun Ki Louis or their designated investment officers, Ms. Vivienne LEE, Mr. TSE Wai Ming, Timothy and Mr. MO Chun Wah, Jonathan (our Chief Operating Officer). The Risk Management Committee is chaired by Ms. Vivienne LEE.
In the meetings which the Risk Management Committee held during 2013, the members reviewed, discussed and/or approved measures related to enhancement of the system network security, implementation of the business continuity plan, monitoring of liquidity risk, market risk and counterparty risk, enhancement of certain features in the in-house fund management system, compliance with new regulations in the Untied States and Euro Zone and setting up of enterprise risk management framework.
5. Valuation Committee
The Company established the Valuation Committee on 31 January 2008. The primary duties of the Valuation Committee include ensuring that the investment instruments of funds under the Group’s management are appropriately valued by persons independent of those who manage the funds and, in particular that these values are fair to fund investors. The Valuation Committee comprises Mr. TSE Wai Ming, Timothy, Mr. MO Chun Wah, Jonathan and Ms. WONG Ngai Sze, Icy (our Head of Finance). The Valuation Committee is chaired by Ms. WONG Ngai Sze, Icy.
In the meetings which the Valuation Committee held during 2013, the members reviewed, discussed and/or approved the valuation of various securities and bonds invested by the Group.
Internal control
It is the responsibility of the Board to ensure that the Group maintains sound and effective system of internal controls. The key procedures to provide effective internal controls are described as follows:
• The internal control system of the Group has an organizational structure with clear reporting lines and supervisory, as well as reporting responsibilities assigned to qualified and experienced persons.
• Business plans and budgets are prepared annually and subject to review and approval by the senior management team.
• Business decisions are governed under the established parameters of delegated authority.• Key duties and functions are appropriately segregated.• Detailed written compliance manual, policies and procedures are in place with which all staff are provided, and
are required to review and follow.• Staff who are licensed persons are required to attend continuous professional training.• Core business activities are conducted through a custom designed system with sufficient audit trail maintained.• The Group employs independent, reputable and credible custodian banks to safeguard clients’ assets.• All subscription/redemption monies are made payable directly to/from the custodian banks.• Client identification and prevention of money laundering and terrorist financing procedures are conducted to verify
the identity and source of funds.• A business contingency plan is in place to provide continuation of critical business operations in the event of
disaster, whether natural or man-made.

CORPORATE gOVERNANCE REPORT
41Value Partners Group LimitedAnnual Report 2013
The Head of Corporate Audit oversees internal audit matters. The roles and functions of the Corporate Audit Department include:
• Conducting audit reviews to assess level of adherence to company policies and procedures, as well as follow up on issues identified.
• Evaluating the adequacy, effectiveness and efficiency of internal controls and procedures, and providing recommendations to senior management.
• Reviewing procedure manuals.
Periodic reports on the internal control status of the Group’s operations prepared by the Corporate Audit Department are submitted to the Audit Committee for review. The reports specify any internal issues that may have been identified, details on how the issues have been dealt with and recommendations on how the procedures can be improved.
The Board, through the Audit Committee, assesses on an annual basis the effectiveness of the Group’s internal control system which covers all material controls, including financial, operational, compliance controls and risk management functions. The Board considered the internal control system was effective and adequate for the period under review.
Auditor’s remunerationThe remuneration of the audit services rendered by the auditor of the Company was mutually agreed in view of the scope of services to be provided. The audit fee for the year ended 31 December 2013 was approximately HK$4.1 million. In addition, the auditor of the Company also provided tax services and other engagements to the Group in 2013 and the fees were approximately HK$0.5 million and HK$0.2 million, respectively.
Preparation of Financial StatementsThe Directors acknowledge their responsibility for preparing consolidated financial statements of the Group for the year ended 31 December 2013 (the “Financial Statements”) and the auditor of the Company also set out their reporting responsibilities on the Financial Statements in its auditor’s report of this annual report.
Communication with ShareholdersDuring 2013, the Company has adopted a shareholders communication policy to ensure that Shareholders, and in appropriate circumstances, the investment community at large, are provided with ready, equal and timely access to balanced and understandable information about the Company, in order to enable shareholders to exercise their rights in an informed manner, and to allow Shareholders and the investment community to engage actively with the Company.
1. Information Disclosure
The Company endeavours to disclose all material information about the Group to all interested parties as timely as possible. The Company maintains a website at www.valuepartners.com.hk to keep shareholders and investors posted of the latest business developments, interim and annual results announcements, financial reports, public announcements, corporate governance practices and other relevant information of the Group.
Since 2008, the Company has voluntarily commenced releasing the information of the unaudited assets under management of the Company and its subsidiaries on a monthly basis to further increase the transparency of the Company. Starting from 2013, we also disclosed the fund flow information of the funds managed by the Group on a quarterly basis.
To ensure our investors and shareholders have a better understanding of the Company, our Chief Executive Officer and Head of Finance communicate with research analysts, investors and shareholders in an on-going manner. In addition, they attend major investors’ conferences and participate in international non-deal roadshows to explain the Company’s financial performance and business strategy. The Company actively distributes information on the annual and interim results, an archive of the webcast is on the Company’s website so that the results presentation is easily and readily accessible to investors and shareholders all over the world.

CORPORATE gOVERNANCE REPORT
42 Value Partners Group LimitedAnnual Report 2013
2. general Meetings with Shareholders
The Company regards the annual general meeting (“AGM”) an important event as it provides a platform for the Board to communicate with the shareholders. The notice of AGM is sent to the shareholders at least 20 clear business days prior to the date of AGM. The Chairman himself takes the chair in the AGM to ensure shareholders’ views and questions are well communicated and answered by the Board. Separate resolutions are proposed on each substantially separate issue at the general meetings.
The attendance record of each Director at the annual general meeting for the year 2013 is set out below:
No. of general
meetings attended/held
Executive Directors
Dato’ CHEAH Cheng Hye (Chairman) 1/1
Ms. HUNG Yeuk Yan Renee 1/1
Mr. SO Chun Ki Louis 1/1
Mr. TSE Wai Ming, Timothy 1/1
Independent Non-executive Directors
Dr. CHEN Shih-Ta Michael 1/1
Mr. LEE Siang Chin 1/1
Mr. Nobuo OYAMA 1/1
We had more than 70 shareholders or their representatives participated in our annual general meeting for the year 2013 and all the resolutions proposed were passed by poll voting in the meeting. Representatives of the auditor also attended this AGM to present the auditor’s report to the shareholders. Poll results are made publicly available on the same day of the meeting, typically in the space of a few hours, to ensure the timely disclosure of information.
3. Shareholders’ Rights
The Finance Department of the Company responds to emails, letters and telephone enquiries from the public, shareholders and investors. Any enquiry on matters related to the Company and to be addressed to the Board may be put in writing and sent to the principal office of the Company in Hong Kong or through an email to [email protected].
Pursuant to the articles of association of the Company, the Board may call an extraordinary general meeting whenever it thinks fit. Any one or more members holding at the date of deposit of the requisition not less than one-tenth of such of the paid-up capital of the Company carrying the right of voting at general meetings of the Company shall at all times have the right, by written requisition to the Board or the Secretary of the Company, to require an extraordinary general meeting to be called by the Board for the transaction of any business specified in such requisition; and such meeting shall be held within two months after the deposit of such requisition.
Shareholders are welcomed to suggest proposals relating to the operations, strategy and/or management of the Group to be discussed at general meeting. Proposal shall be sent to the Board or the Secretary of the Company by written requisition. Pursuant to the articles of association of the Company, shareholders who wish to put forward a proposal should convene an extraordinary general meeting by following the procedures set out in above paragraph.
The memorandum and articles of association of the Company (no change in 2013) is available on the Company’s website.
43
INDEPENDENT AUDITOR’S REPORT
Value Partners Group LimitedAnnual Report 2013
INDEPENDENT AUDITOR’S REPORT TO THE SHAREHOLDERS OFVALUE PARTNERS gROUP LIMITED(Incorporated in the Cayman Islands with limited liability)
We have audited the consolidated financial statements of Value Partners Group Limited (the “Company”) and its subsidiaries (together, the “Group”) set out on pages 44 to 96, which comprise the consolidated and company balance sheets as at 31 December 2013, and the consolidated statement of comprehensive income, the consolidated statement of changes in equity and the consolidated cash flow statement for the year then ended, and a summary of significant accounting policies and other explanatory information.
Directors’ responsibility for the consolidated financial statementsThe directors of the Company are responsible for the preparation of consolidated financial statements that give a true and fair view in accordance with Hong Kong Financial Reporting Standards issued by the Hong Kong Institute of Certified Public Accountants and the disclosure requirements of the Hong Kong Companies Ordinance, and for such internal control as the directors determine is necessary to enable the preparation of consolidated financial statements that are free from material misstatement, whether due to fraud or error.
Auditor’s responsibilityOur responsibility is to express an opinion on these consolidated financial statements based on our audit and to report our opinion solely to you, as a body, and for no other purpose. We do not assume responsibility towards or accept liability to any other person for the contents of this report.
We conducted our audit in accordance with Hong Kong Standards on Auditing issued by the Hong Kong Institute of Certified Public Accountants. Those standards require that we comply with ethical requirements and plan and perform the audit to obtain reasonable assurance about whether the consolidated financial statements are free from material misstatement.
An audit involves performing procedures to obtain audit evidence about the amounts and disclosures in the consolidated financial statements. The procedures selected depend on the auditor’s judgment, including the assessment of the risks of material misstatement of the consolidated financial statements, whether due to fraud or error. In making those risk assessments, the auditor considers internal control relevant to the entity’s preparation of consolidated financial statements that give a true and fair view in order to design audit procedures that are appropriate in the circumstances, but not for the purpose of expressing an opinion on the effectiveness of the entity’s internal control. An audit also includes evaluating the appropriateness of accounting policies used and the reasonableness of accounting estimates made by the directors, as well as evaluating the overall presentation of the consolidated financial statements.
We believe that the audit evidence we have obtained is sufficient and appropriate to provide a basis for our audit opinion.
OpinionIn our opinion, the consolidated financial statements give a true and fair view of the state of affairs of the Company and of the Group as at 31 December 2013, and of the Group’s profit and cash flows for the year then ended in accordance with Hong Kong Financial Reporting Standards and have been properly prepared in accordance with the disclosure requirements of the Hong Kong Companies Ordinance.
PricewaterhouseCoopersCertified Public Accountants
Hong Kong, 13 March 2014
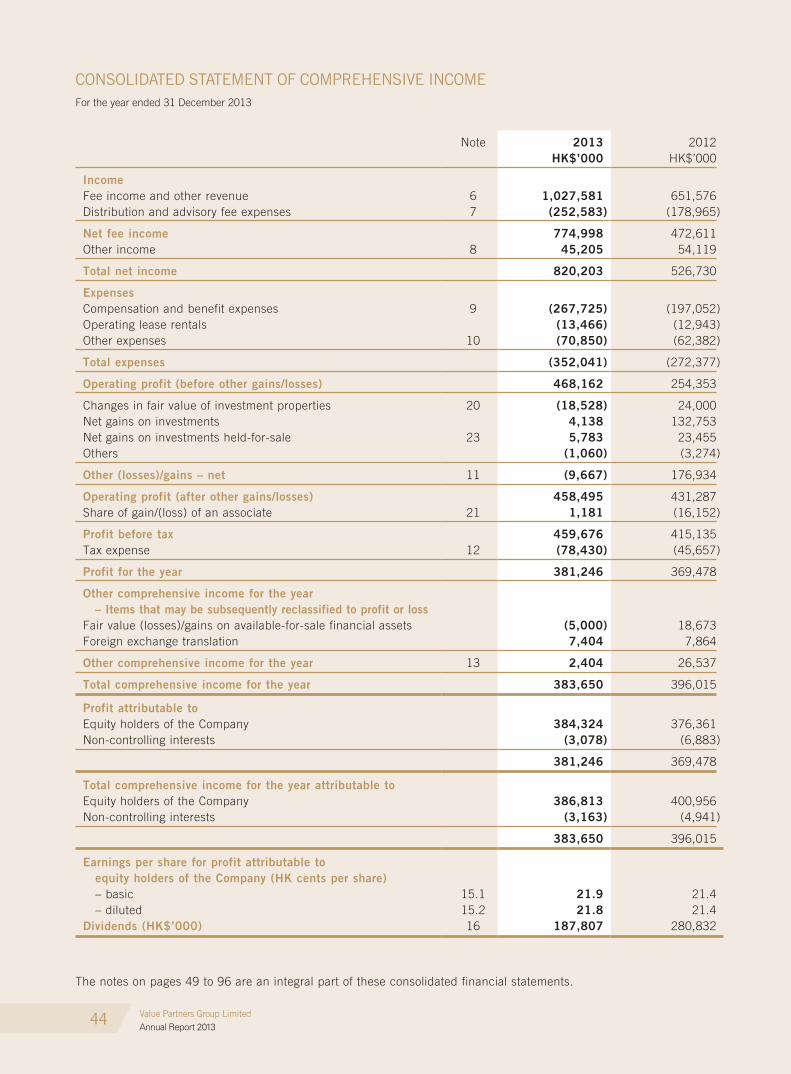
44
CONSOLIDATED STATEMENT OF COMPREHENSIVE INCOMEFor the year ended 31 December 2013
Value Partners Group LimitedAnnual Report 2013
Note 2013 2012HK$’000 HK$’000
IncomeFee income and other revenue 6 1,027,581 651,576Distribution and advisory fee expenses 7 (252,583) (178,965)
Net fee income 774,998 472,611Other income 8 45,205 54,119
Total net income 820,203 526,730
ExpensesCompensation and benefit expenses 9 (267,725) (197,052)Operating lease rentals (13,466) (12,943)Other expenses 10 (70,850) (62,382)
Total expenses (352,041) (272,377)
Operating profit (before other gains/losses) 468,162 254,353
Changes in fair value of investment properties 20 (18,528) 24,000Net gains on investments 4,138 132,753Net gains on investments held-for-sale 23 5,783 23,455Others (1,060) (3,274)
Other (losses)/gains – net 11 (9,667) 176,934
Operating profit (after other gains/losses) 458,495 431,287Share of gain/(loss) of an associate 21 1,181 (16,152)
Profit before tax 459,676 415,135Tax expense 12 (78,430) (45,657)
Profit for the year 381,246 369,478
Other comprehensive income for the year – Items that may be subsequently reclassified to profit or lossFair value (losses)/gains on available-for-sale financial assets (5,000) 18,673Foreign exchange translation 7,404 7,864
Other comprehensive income for the year 13 2,404 26,537
Total comprehensive income for the year 383,650 396,015
Profit attributable toEquity holders of the Company 384,324 376,361Non-controlling interests (3,078) (6,883)
381,246 369,478
Total comprehensive income for the year attributable toEquity holders of the Company 386,813 400,956Non-controlling interests (3,163) (4,941)
383,650 396,015
Earnings per share for profit attributable to equity holders of the Company (HK cents per share) – basic 15.1 21.9 21.4 – diluted 15.2 21.8 21.4Dividends (HK$’000) 16 187,807 280,832
The notes on pages 49 to 96 are an integral part of these consolidated financial statements.

Value Partners Group LimitedAnnual Report 2013
45
CONSOLIDATED BALANCE SHEETAs at 31 December 2013
Note 2013 2012HK$’000 HK$’000
Non-current assetsProperty, plant and equipment 18 4,332 7,747Intangible assets 19 55,614 54,404Investment properties 20 – 102,000Investment in an associate 21 92,125 90,944Deferred tax assets 30 554 399Investments 22 898,026 953,135Other assets 26 9,044 13,987Loan portfolio, net 27 98,837 8,024
1,158,532 1,230,640
Current assetsInvestments 22 441,558 240,862Investments held-for-sale 23 226,782 245,899Fees receivable 24 386,398 179,067Loan portfolio, net 27 132,882 337Amounts receivable on sale of investments 13,437 164,224Prepayments and other receivables 28,730 33,473Cash and cash equivalents 25 692,116 888,090
1,921,903 1,751,952
Current liabilitiesAccrued bonus 125,060 68,243Distribution fee expenses payable 31 54,802 28,915Amounts payable on purchase of investments – 135,033Other payables and accrued expenses 18,913 17,870Current tax liabilities 52,995 15,353
251,770 265,414
Net current assets 1,670,133 1,486,538
Net assets 2,828,665 2,717,178
EquityCapital and reserves attributable to equity holders of the CompanyIssued equity 28 889,213 889,213Other reserves 29 192,811 181,653Retained earnings– proposed dividends 16 187,807 280,832– others 1,477,244 1,280,727
2,747,075 2,632,425Non-controlling interests 81,590 84,753
Total equity 2,828,665 2,717,178
On behalf of the Board
SO Chun Ki Louis TSE Wai Ming, TimothyDirector Director
The notes on pages 49 to 96 are an integral part of these consolidated financial statements.
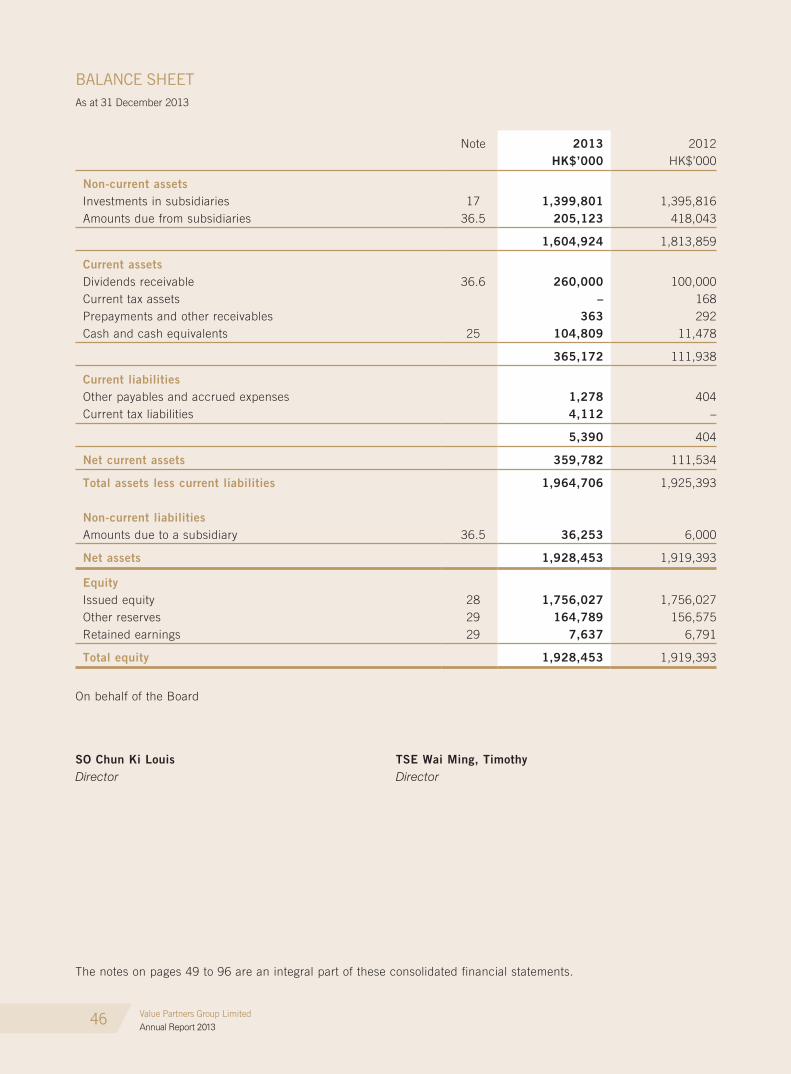
46
BALANCE SHEETAs at 31 December 2013
Value Partners Group LimitedAnnual Report 2013
Note 2013 2012HK$’000 HK$’000
Non-current assetsInvestments in subsidiaries 17 1,399,801 1,395,816Amounts due from subsidiaries 36.5 205,123 418,043
1,604,924 1,813,859
Current assetsDividends receivable 36.6 260,000 100,000Current tax assets – 168Prepayments and other receivables 363 292Cash and cash equivalents 25 104,809 11,478
365,172 111,938
Current liabilitiesOther payables and accrued expenses 1,278 404Current tax liabilities 4,112 –
5,390 404
Net current assets 359,782 111,534
Total assets less current liabilities 1,964,706 1,925,393
Non-current liabilitiesAmounts due to a subsidiary 36.5 36,253 6,000
Net assets 1,928,453 1,919,393
EquityIssued equity 28 1,756,027 1,756,027Other reserves 29 164,789 156,575Retained earnings 29 7,637 6,791
Total equity 1,928,453 1,919,393
On behalf of the Board
SO Chun Ki Louis TSE Wai Ming, TimothyDirector Director
The notes on pages 49 to 96 are an integral part of these consolidated financial statements.
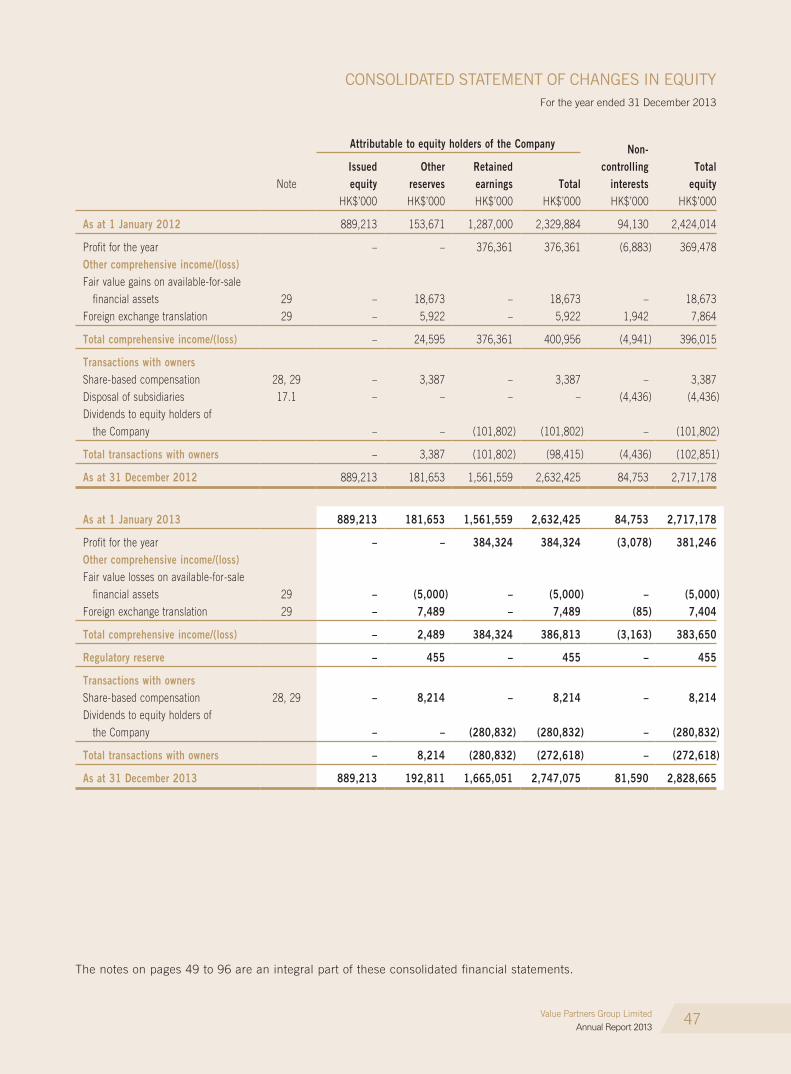
47
CONSOLIDATED STATEMENT OF CHANGES IN EQUITYFor the year ended 31 December 2013
Value Partners Group LimitedAnnual Report 2013
Note
Attributable to equity holders of the Company Non-controlling
interestsTotal
equity
Issuedequity
Otherreserves
Retainedearnings Total
HK$’000 HK$’000 HK$’000 HK$’000 HK$’000 HK$’000
As at 1 January 2012 889,213 153,671 1,287,000 2,329,884 94,130 2,424,014
Profit for the year – – 376,361 376,361 (6,883) 369,478Other comprehensive income/(loss)Fair value gains on available-for-sale financial assets 29 – 18,673 – 18,673 – 18,673Foreign exchange translation 29 – 5,922 – 5,922 1,942 7,864
Total comprehensive income/(loss) – 24,595 376,361 400,956 (4,941) 396,015
Transactions with ownersShare-based compensation 28, 29 – 3,387 – 3,387 – 3,387Disposal of subsidiaries 17.1 – – – – (4,436) (4,436)Dividends to equity holders of the Company – – (101,802) (101,802) – (101,802)
Total transactions with owners – 3,387 (101,802) (98,415) (4,436) (102,851)
As at 31 December 2012 889,213 181,653 1,561,559 2,632,425 84,753 2,717,178
As at 1 January 2013 889,213 181,653 1,561,559 2,632,425 84,753 2,717,178
Profit for the year – – 384,324 384,324 (3,078) 381,246Other comprehensive income/(loss)Fair value losses on available-for-sale financial assets 29 – (5,000) – (5,000) – (5,000)Foreign exchange translation 29 – 7,489 – 7,489 (85) 7,404
Total comprehensive income/(loss) – 2,489 384,324 386,813 (3,163) 383,650
Regulatory reserve – 455 – 455 – 455
Transactions with ownersShare-based compensation 28, 29 – 8,214 – 8,214 – 8,214Dividends to equity holders of the Company – – (280,832) (280,832) – (280,832)
Total transactions with owners – 8,214 (280,832) (272,618) – (272,618)
As at 31 December 2013 889,213 192,811 1,665,051 2,747,075 81,590 2,828,665
The notes on pages 49 to 96 are an integral part of these consolidated financial statements.
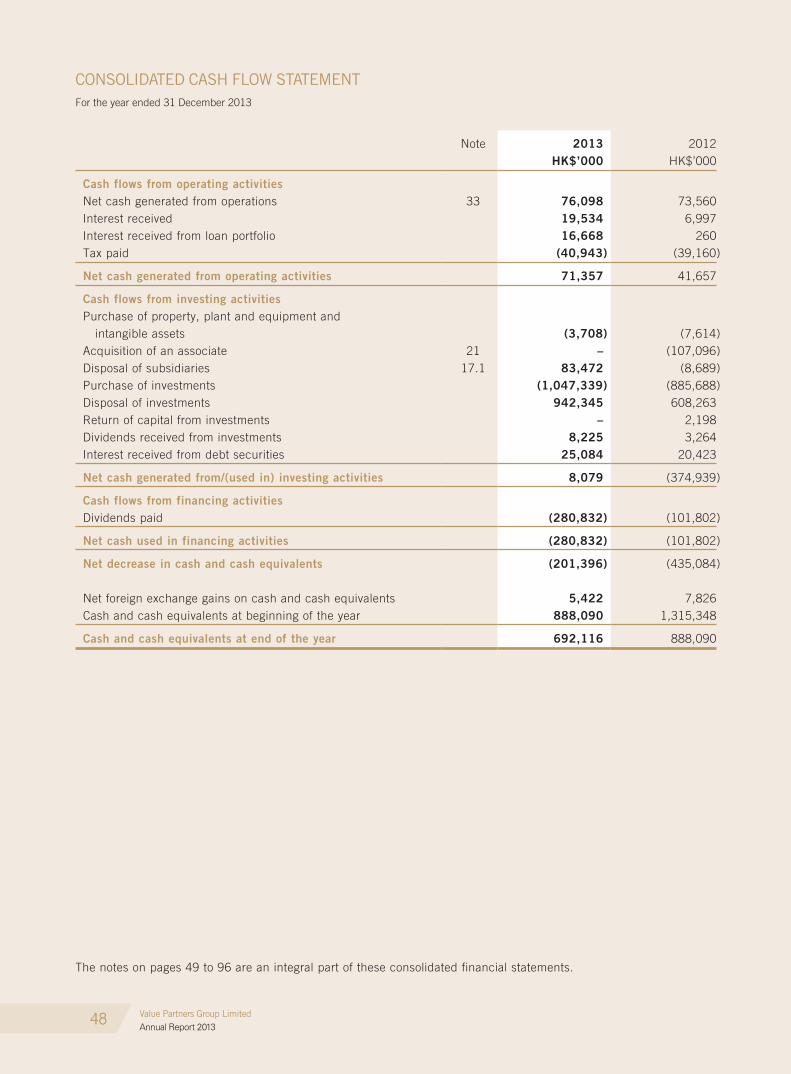
48
CONSOLIDATED CASH FLOW STATEMENTFor the year ended 31 December 2013
Value Partners Group LimitedAnnual Report 2013
Note 2013 2012HK$’000 HK$’000
Cash flows from operating activitiesNet cash generated from operations 33 76,098 73,560Interest received 19,534 6,997Interest received from loan portfolio 16,668 260Tax paid (40,943) (39,160)
Net cash generated from operating activities 71,357 41,657
Cash flows from investing activitiesPurchase of property, plant and equipment and intangible assets (3,708) (7,614)Acquisition of an associate 21 – (107,096)Disposal of subsidiaries 17.1 83,472 (8,689)Purchase of investments (1,047,339) (885,688)Disposal of investments 942,345 608,263Return of capital from investments – 2,198Dividends received from investments 8,225 3,264Interest received from debt securities 25,084 20,423
Net cash generated from/(used in) investing activities 8,079 (374,939)
Cash flows from financing activitiesDividends paid (280,832) (101,802)
Net cash used in financing activities (280,832) (101,802)
Net decrease in cash and cash equivalents (201,396) (435,084)
Net foreign exchange gains on cash and cash equivalents 5,422 7,826Cash and cash equivalents at beginning of the year 888,090 1,315,348
Cash and cash equivalents at end of the year 692,116 888,090
The notes on pages 49 to 96 are an integral part of these consolidated financial statements.
49
NOTES TO THE CONSOLIDATED FINANCIAL STATEMENTSFor the year ended 31 December 2013
Value Partners Group LimitedAnnual Report 2013
1 general information
Value Partners Group Limited (the “Company”) was incorporated in the Cayman Islands on 10 November 2006 as an exempted company with limited liability under the Companies Law, Cap 22 (Law 3 of 1961, as consolidated and revised) of the Cayman Islands. The address of its registered office and its principal place of business are Cricket Square, Hutchins Drive, P.O. Box 2681, Grand Cayman, KY1-1111, Cayman Islands and 9th Floor, Nexxus Building, 41 Connaught Road Central, Hong Kong, respectively.
The Company acts as an investment holding company. The activities of its principal subsidiaries are disclosed in Note 17 below. The Company and its subsidiaries (together, the “Group”) principally provides investment management services to investment funds and managed accounts. The Company is listed on the Main Board of The Stock Exchange of Hong Kong Limited (the “Hong Kong Stock Exchange”).
These consolidated financial statements are presented in thousands of Hong Kong dollars (HK$’000), unless otherwise stated. These consolidated financial statements have been approved for issue by the Board of Directors on 13 March 2014.
2 Summary of significant accounting policies
The principal accounting policies applied in the preparation of these consolidated financial statements are set out below. These policies have been consistently applied to all the years presented, unless otherwise stated.
2.1 Basis of preparation
The consolidated financial statements of the Company have been prepared in accordance with Hong Kong Financial Reporting Standards (the “HKFRS”) issued by the Hong Kong Institute of Certified Public Accountants (the “HKICPA”). The consolidated financial statements have been prepared under the historical cost convention, as modified by the revaluation of investment properties and investments.
The preparation of consolidated financial statements in conformity with HKFRS requires the use of accounting estimates. It also requires the directors to exercise their judgement in the process of applying the Group’s accounting policies. The areas involving a higher degree of judgement or complexity, or areas where assumptions and estimates are significant to the consolidated financial statements, are disclosed in Note 4 below.
New standards adopted by the group
• Amendment to HKAS 1 “Financial Statement Presentation” requires entities to group items presented in “other comprehensive income” (OCI) on the basis of whether they are potentially reclassifiable to profit or loss subsequently (reclassification adjustments). The adoption of the amended HKAS 1 only affects the presentation of the consolidated statement of comprehensive income.
• HKAS 28 (revised 2011) “Investments in Associates and Joint Ventures” includes the requirements for joint ventures, as well as associates, to be equity accounted for following the issue of HKFRS 11 “Joint Arrangements”. The Group has already used the equity method to account for the associate, refer to Note 21 for details.
• HKFRS 10 “Consolidated Financial Statements” builds on existing principles by identifying the concept of control as the determining factor in whether an entity should be included within the consolidated financial statements of the parent company. The standard provides additional guidance to assist in the determination of control where this is difficult to assess. The Group assessed HKFRS 10’s impact and considered that there is minimal impact on the Group’s consolidated financial statements.
50
NOTES TO THE CONSOLIDATED FINANCIAL STATEMENTSFor the year ended 31 December 2013
Value Partners Group LimitedAnnual Report 2013
2 Summary of significant accounting policies (continued)
2.1 Basis of preparation (continued)
New standards adopted by the group (continued)
• HKFRS 12 “Disclosures of Interests in Other Entities” includes the disclosure requirements for all forms of interests in other entities, including joint arrangements, associates, special purpose vehicles and other off balance sheet vehicles. The Group has disclosed the relevant information for the investment in associate in Note 21 and the interests in unconsolidated structured entity in Note 22.
• HKFRS 13 “Fair Value Measurement” aims to improve consistency and reduce complexity by providing a precise definition of fair value and a single source of fair value measurement and disclosure requirements for use across HKFRS. The requirements do not extend the use of fair value accounting but provide guidance on how it should be applied where its use is already required or permitted by other standards within HKFRS. The Group makes additional relevant disclosures in these consolidated financial statements, refer to Note 3 for details.
• Amendments to HKFRS 7 “Disclosures – Offsetting Financial Assets and Financial Liabilities” require additional disclosures to enable users of financial statements to evaluate the effect or the potential effects of netting arrangements, including rights of set-off associated with an entity’s recognized financial assets and recognized financial liabilities, on the entity’s financial position. The amendments did not have any impact on the Group’s financial position or performance.
New standards, amendments and interpretations issued but are not effective for the financial year beginning 1 January 2013 and have not been early adopted
• HKFRS 9 “Financial Instruments” addresses the classification, measurement and recognition of financial assets and liabilities and hedge accounting. HKFRS 9 replaces HKAS 39 that relate to the classification and measurement of financial instruments and hedge accounting (other than specific accounting for open portfolios and macro hedging). The mandatory effective date of HKFRS 9 is yet to be decided. The Group is yet to assess HKFRS 9’s full impact. The Group will also consider the impact of the remaining phase of HKFRS 9 when completed.
• Amendments to HKFRS 10 “Consolidated Financial Statements” is effective for annual periods beginning on or after 1 January 2014. The amendments to HKFRS 10 define an investment entity and introduce an exception from the consolidation requirements for investment entities. The Group considers that there will be minimal impact on the Group’s consolidated financial statements.
• Amendments to HKAS 32 “Offsetting Financial Assets and Financial Liabilities” is effective for annual periods beginning on or after 1 January 2014. These amendments clarify the offsetting criteria in HKAS 32 and address inconsistencies in their application. This includes clarifying the meaning of “currently has a legally enforceable right of set-off” and that some gross settlement systems may be considered equivalent to net settlement. The amendments are not expected to have a material impact on the Group’s financial position or performance.
There are no other HKFRS or HK(IFRIC) Interpretations that are not yet effective that would be expected to have a material impact on the Group.
2.2 Subsidiaries
(a) Consolidation
Subsidiaries are all entities (including structured entities) over which the Group has control. The Group controls an entity when the Group is exposed to, or has rights to, variable returns from its involvement with the entity and has the ability to affect those returns through its power over the entity.
51
NOTES TO THE CONSOLIDATED FINANCIAL STATEMENTSFor the year ended 31 December 2013
Value Partners Group LimitedAnnual Report 2013
2 Summary of significant accounting policies (continued)
2.2 Subsidiaries (continued)
(a) Consolidation (continued)
De-facto control of an entity may arise from circumstances where the Group does not have more than 50% of the voting
power but it has the practical ability to direct the relevant activities of the entity.
Subsidiaries are fully consolidated from the date on which control is transferred to the Group. They are de-consolidated
from the date that control ceases.
Inter-company transactions, balances, income and expenses on transactions between group companies are eliminated.
Profits and losses resulting from inter-company transactions that are recognized in assets are also eliminated.
Business combinations
The Group applies the acquisition method to account for business combinations. The consideration transferred for the
acquisition of a subsidiary is the fair value of the assets transferred, the liabilities incurred to the former owners of the
acquiree and the equity interests issued by the Group. The consideration transferred includes the fair value of any asset or
liability resulting from a contingent consideration arrangement. Identifiable assets acquired and liabilities and contingent
liabilities assumed in a business combination are measured initially at their fair value at the acquisition date. The Group
recognizes any non-controlling interest in the acquiree on an acquisition-by-acquisition basis, either at fair value or at
the non-controlling interest’s proportionate share of the recognized amounts of the acquiree’s identifiable net assets.
Acquisition-related costs are expensed as incurred.
If the business combination is achieved in stages, the acquisition date carrying value of the acquirer’s previously held
equity interest in the acquiree is remeasured to fair value at the acquisition date; any gains or losses arising from such
remeasurement are recognized in the consolidated statement of comprehensive income.
Goodwill is initially measured as the excess of the aggregate of the consideration transferred, the fair value of
non-controlling interest and the acquisition-date fair value of any previous equity interest in the acquiree over the net
identifiable assets acquired and liabilities assumed. If this consideration is lower than the fair value of the net assets of
the subsidiary acquired, the difference is recognized in the consolidated statement of comprehensive income.
Changes in ownership interests in subsidiaries without change of control
Transactions with non-controlling interests that do not result in loss of control are accounted for as equity transactions –
that is, as transactions with the owners in their capacity as owners. The difference between fair value of any consideration
paid and the relevant share acquired of the carrying value of net assets of the subsidiary is recorded in equity. Gains or
losses on disposals to non-controlling interests are also recorded in equity.
Disposal of subsidiaries
When the Group ceases to have control, any retained interest in the entity is remeasured to its fair value at the date when
control is lost, with the change in carrying amount recognized in profit or loss. The fair value is the initial carrying amount
for the purposes of subsequently accounting for the retained interest as an associate, joint venture or financial asset. In
addition, any amounts previously recognized in other comprehensive income in respect of that entity are accounted for as
if the Group had directly disposed of the related assets or liabilities. This may mean that amounts previously recognized
in other comprehensive income are reclassified to profit or loss.
52
NOTES TO THE CONSOLIDATED FINANCIAL STATEMENTSFor the year ended 31 December 2013
Value Partners Group LimitedAnnual Report 2013
2 Summary of significant accounting policies (continued)
2.2 Subsidiaries (continued)
(a) Consolidation (continued)
Structured entities
A structured entity is an entity that has been designed so that voting or similar rights are not the dominant factor in deciding who controls the entity, such as when any voting rights relate to administrative tasks only, and the relevant activities are directed by means of contractual arrangements. A structured entity often has restricted activities and a narrow and well defined objective, such as to provide investment opportunities for investors by passing on risks and rewards associated with the assets of the structured entity. Consequently, investment funds are considered as “structured entities”.
(b) Separate financial statements
Investments in subsidiaries are accounted for at cost less impairment. Cost also includes directly attributable costs of investment. The results of subsidiaries are accounted for by the Company on the basis of dividends received and receivable.
Impairment testing of the investments in subsidiaries is required upon receiving dividends from these investments if the dividend exceeds the total comprehensive income of the subsidiary in the period the dividend is declared or if the carrying amount of the investment in the separate financial statements exceeds the carrying amount in the consolidated financial statements of the investee’s net assets including goodwill.
2.3 Associates
Associates are all entities over which the Group has significant influence but not control, generally accompanying a shareholding of between 20% and 50% of the voting rights. Investments in associates are accounted for using the equity method of accounting. Under the equity method, the investment is initially recognized at cost, and the carrying amount is increased or decreased to recognize the investor’s share of the profit or loss of the investee after the date of acquisition. The Group’s investment in associates includes goodwill identified on acquisition.
If the ownership interest in an associate is reduced but significant influence is retained, only a proportionate share of the amounts previously recognized in other comprehensive income is reclassified to profit or loss where appropriate.
The Group’s share of post-acquisition profit or loss is recognized in the consolidated statement of comprehensive income, and its share of post-acquisition movements in other comprehensive income is recognized in other comprehensive income with a corresponding adjustment to the carrying amount of the investment. When the Group’s share of losses in an associate equals or exceeds its interest in the associate, including any other unsecured receivables, the Group does not recognize further losses, unless it has incurred legal or constructive obligations or made payments on behalf of the associate.
The Group determines at each reporting date whether there is any objective evidence that the investment in the associate is impaired. If this is the case, the Group calculates the amount of impairment as the difference between the recoverable amount of the associate and its carrying value and recognizes the amount adjacent to “share of profit/(loss) of an associate” in the consolidated statement of comprehensive income.
Profits and losses resulting from upstream and downstream transactions between the Group and its associate are recognized in the Group’s consolidated financial statements only to the extent of unrelated investor’s interests in the associates. Unrealized losses are eliminated unless the transaction provides evidence of an impairment of the asset transferred. Accounting policies of associates have been changed where necessary to ensure consistency with the policies adopted by the Group.
53
NOTES TO THE CONSOLIDATED FINANCIAL STATEMENTSFor the year ended 31 December 2013
Value Partners Group LimitedAnnual Report 2013
2 Summary of significant accounting policies (continued)
2.3 Associates (continued)
The Group has invested in certain investment funds that it manages. As an investment manager, the Group may put seed capital in investment funds that it manages in order to facilitate their launch. The purpose of seed capital is to ensure that the investment funds can have a reasonable starting fund size to operate and to build track record. The Group may subsequently vary the holding of these seed capital investments depending on the market conditions and various other factors. The Group has applied the measurement exemption within HKAS 28 “Investments in Associates and Joint Ventures” for mutual funds, unit trusts and similar entities and such investments are classified as financial assets at fair value through profit or loss.
2.4 Segment reporting
Operating segments are reported in a manner consistent with the internal reporting provided to the chief operating decision-maker. The chief operating decision-maker, who is responsible for allocating resources and assessing performance of the operating segments, has been identified as the Board of Directors that makes strategic decisions.
2.5 Foreign currency translation
(a) Functional and presentation currency
Items included in the financial statements of each of the Group’s entities are measured using the currency of the primary economic environment in which the entity operates (the “functional currency”). The consolidated financial statements are presented in Hong Kong dollars, which is the Company’s functional and presentation currency.
(b) Transactions and balances
Foreign currency transactions are translated into the functional currency using the exchange rates prevailing at the dates of the transactions. Foreign exchange gains and losses resulting from the settlement of such transactions and from the translation at year-end exchange rates of monetary assets and liabilities denominated in foreign currencies are recognized in the consolidated statement of comprehensive income.
Translation differences on non-monetary financial assets such as equities held at fair value through profit or loss are recognized in profit or loss as part of the fair value gains or losses. Translation differences on non-monetary financial assets such as equities classified as available-for-sale financial assets are included in other comprehensive income.
(c) Translation from functional currency to presentation currency
The results and financial position of all the group entities (none of which has the currency of a hyperinflationary economy) that have a functional currency different from the presentation currency are translated into the presentation currency as follows:
(i) assets and liabilities for each balance sheet presented are translated at the closing rate at the date of that balance sheet;
(ii) income and expenses for each statement of comprehensive income are translated at average exchange rates (unless this average is not a reasonable approximation of the cumulative effect of the rates prevailing on the transaction dates, in which case income and expenses are translated at the rate on the dates of the transactions); and
(iii) all resulting exchange differences are recognized in other comprehensive income.
54
NOTES TO THE CONSOLIDATED FINANCIAL STATEMENTSFor the year ended 31 December 2013
Value Partners Group LimitedAnnual Report 2013
2 Summary of significant accounting policies (continued)2.5 Foreign currency translation (continued)
(c) Translation from functional currency to presentation currency (continued)
Goodwill and fair value adjustments arising on the acquisition of a foreign entity are treated as assets and liabilities of the foreign entity and translated at the closing rate. Exchange differences arising are recognized in other comprehensive income.
(d) Disposal of foreign operation
On the disposal of a foreign operation (that is, a disposal of the Group’s entire interest in a foreign operation, or a disposal involving loss of control over a subsidiary that includes a foreign operation, loss of joint control over a joint arrangement that includes a foreign operation, or loss of significant influence over an associate that includes a foreign operation), all of the exchange differences accumulated in equity in respect of that operation attributable to the equity holders of the company are reclassified to the consolidated statement of comprehensive income.
2.6 Property, plant and equipment
Property, plant and equipment, comprising leasehold improvements, furniture and fixtures, office equipment and vehicles, are stated at historical cost less accumulated depreciation. Historical cost includes expenditure that is directly attributable to the acquisition of the items.
Subsequent costs are included in the asset’s carrying amount or recognized as a separate asset, as appropriate, only when it is probable that future economic benefits associated with the item will flow to the Group and the cost of the item can be measured reliably. The carrying amount of the replaced part is derecognized. All other repairs and maintenance are charged to the consolidated statement of comprehensive income during the period in which they are incurred.
Depreciation of property, plant and equipment is calculated using the straight-line method to allocate cost over their estimated useful lives, as follows:
Leasehold improvements Over the lease termsFurniture and fixtures Five yearsOffice equipment Three yearsVehicles Three years
The assets’ useful lives are reviewed, and adjusted if appropriate, at the end of each reporting period. An asset’s carrying amount is written down immediately to its recoverable amount if the asset’s carrying amount is greater than its estimated recoverable amount.
Gains and losses on disposals are determined by comparing proceeds with carrying amounts and are recognized in the consolidated statement of comprehensive income.
2.7 Intangible assets
(a) goodwill
Goodwill arises on the acquisition of subsidiaries and associates and represents the excess of the consideration transferred over the Group’s interest in the net fair value of the net identifiable assets, liabilities and contingent liabilities of the acquiree and the fair value of the non-controlling interest in the acquiree.
For the purpose of impairment testing, goodwill acquired in a business combination is allocated to each of the cash-generating units (“CGUs”) or groups of CGUs that is expected to benefit from the synergies of the combination. Each unit or group of units to which the goodwill is allocated represents the lowest level within the entity at which the goodwill is monitored for internal management purposes.

55
NOTES TO THE CONSOLIDATED FINANCIAL STATEMENTSFor the year ended 31 December 2013
Value Partners Group LimitedAnnual Report 2013
2 Summary of significant accounting policies (continued)
2.7 Intangible assets (continued)
(a) goodwill (continued)
Goodwill impairment reviews are undertaken annually or more frequently if events or changes in circumstances indicate a potential impairment. The carrying value of goodwill is compared to the recoverable amount, which is the higher of value in use and the fair value less costs of disposal. Any impairment is recognized immediately as an expense and is not subsequently reversed.
(b) Licence
Licence acquired in a business combination is recognized at fair value at the acquisition date. The licence is considered to have an infinite useful life as it has no specified termination date and is carried at cost less accumulated impairment losses.
(c) Computer software
Acquired computer software licences are capitalized on the basis of the costs incurred to acquire and bring to use the specific software. These costs are amortized over their estimated useful lives (five years).
Costs associated with developing or maintaining computer software programmes are recognized as an expense as incurred. Costs that are directly associated with the development of identifiable and unique software products controlled by the Group, and that will probably generate economic benefits exceeding costs beyond one year, are recognized as intangible assets. Computer software development costs recognized as assets are amortized over their estimated useful lives (not exceeding five years).
2.8 Investment properties
Investment properties, principally comprising leasehold land and buildings, are held for long-term rental yields or for capital appreciation or both, and that are not occupied by the Group. Land held under operating leases are accounted for as investment properties when the rest of the definition of an investment property is met. In such cases, the operating leases concerned are accounted for as if they were finance leases. Investment properties are initially measured at cost, including related transaction costs. After initial recognition, investment properties are carried at fair value, representing open market value determined at each reporting date by external valuers. Fair value is based on active market prices, adjusted, if necessary, for any difference in the nature, location or condition of the specific asset. If the information is not available, the Group uses alternative valuation methods such as recent prices on less active markets or discounted cash flow projections. Changes in fair values are recorded in the consolidated statement of comprehensive income.
2.9 Impairment
(a) Impairment of non-financial assets
Assets that have an indefinite useful life are not subject to amortisation and are tested annually for impairment. Assets that are subject to amortisation are reviewed for impairment whenever events or changes in circumstances indicate that the carrying amounts may not be recoverable. An impairment loss is recognized for the amount by which an asset’s carrying amount exceeds its recoverable amount. The recoverable amount is the higher of an asset’s fair value less costs of disposal and value in use. For the purpose of assessing impairment, assets are grouped at the lowest levels for which there are separately identifiable cash flows (CGUs). Non-financial assets other than goodwill that suffered an impairment are reviewed for possible reversal of the impairment at each reporting date.
56
NOTES TO THE CONSOLIDATED FINANCIAL STATEMENTSFor the year ended 31 December 2013
Value Partners Group LimitedAnnual Report 2013
2 Summary of significant accounting policies (continued)
2.9 Impairment (continued)
(b) Impairment of financial assets
The Group assesses at the end of each reporting period whether there is objective evidence that a financial asset or group of financial assets is impaired. A financial asset or a group of financial assets is impaired and impairment losses are incurred only if there is objective evidence of impairment as a result of one or more events that occurred after the initial recognition of the asset (a loss event) and that loss event (or events) has an impact on the estimated future cash flows of the financial asset or group of financial assets that can be reliably estimated.
If there is objective evidence that an impairment loss on loans and receivables or held-to-maturity investments carried at amortized cost has been incurred, the amount of the loss is measured as the difference between the asset’s carrying amount and the present value of estimated future cash flows (excluding future credit losses that have not been incurred) discounted at the financial asset’s original effective interest rate. The carrying amount of the asset is reduced through the use of an allowance account and the amount of the loss is recognized in the consolidated statement of comprehensive income. If a loan or held-to-maturity investment has a variable interest rate, the discount rate for measuring any impairment loss is the current effective interest rate determined under the contract.
The calculation of the present value of estimated future cash flows of a collateralized financial asset reflects the cash flows that may result from foreclosure less costs for obtaining and selling the collateral, whether or not foreclosure is probable.
For the purposes of a collective evaluation of impairment, financial assets are grouped on the basis of similar credit risk characteristics which are relevant to the estimation of future cash flows for groups of such assets by being indicative of the debtors’ ability to pay all amounts due according to the contractual terms of the assets being evaluated.
Future cash flows in a group of financial assets that are collectively evaluated for impairment are estimated on the basis of the contractual cash flows of the assets in the group and historical loss experience for assets with credit risk characteristics similar to those in the group. Historical loss experience is adjusted on the basis of current observable data to reflect the effects of current conditions that did not affect the period on which the historical loss experience is based and to remove the effects of conditions in the historical period that do not exist currently.
Estimates of changes in future cash flows for groups of assets should reflect and be directionally consistent with changes in related observable data from period to period which are indicative of changes in the probability of losses in the group and their magnitude. The methodology and assumptions used for estimating future cash flows are reviewed regularly by the Group to reduce any differences between loss estimates and actual loss experience.
When a loan is uncollectable, it is written off against the related allowance for loan impairment at the discretion of the management. Such loans are written off after all the necessary procedures have been completed and the amount of the loss has been determined. Subsequent recoveries of amounts previously written off decrease the amount of the allowance for loan impairment in the consolidated statement of comprehensive income.
If, in a subsequent period, the amount of the impairment loss decreases and the decrease can be related objectively to an event occurring after the impairment was recognized, the previously recognized impairment loss is reversed by adjusting the allowance account. The amount of the reversal is recognized in the consolidated statement of comprehensive income.
57
NOTES TO THE CONSOLIDATED FINANCIAL STATEMENTSFor the year ended 31 December 2013
Value Partners Group LimitedAnnual Report 2013
2 Summary of significant accounting policies (continued)
2.10 Non-current assets held-for sale
Non-current assets are classified as held for sale when their carrying amount is to be recovered principally through a sale transaction and a sale is considered highly probable. The non-current assets are stated at the lower of carrying amount and fair value less costs to sell.
The Group acts as an investment manager to a number of investment funds, and has provided seed capital for the set up of these funds. Certain interests in such investment funds are controlled by the Group and are classified as held-for-sale as the Group intends to market these funds and dilute its holdings as soon as practically possible to a level where its aggregate economic interest does not constitute a control.
2.11 Financial assets
The Group classifies its financial assets in the following categories: at fair value through profit or loss, held-to-maturity, loans and receivables and available-for-sale. The classification depends on the purposes for which the financial assets were acquired. Management determines the classification of its financial assets at initial recognition.
(a) Financial assets at fair value through profit or loss
Financial assets at fair value through profit or loss are financial assets held for trading and those being designated in accordance with the measurement exemption within HKAS 28. A financial asset is classified as held for trading if acquired principally for the purpose of selling in the short term. Derivatives are also categorized as held for trading.
Held for trading financial assets are included in current assets. Financial assets at fair value through profit or loss being designated in accordance with the measurement exemption within HKAS 28 are included in non-current assets unless management intends to dispose of the financial assets within 12 months of the end of the reporting period.
(b) Held-to-maturity financial assets
Held-to-maturity financial assets are non-derivative financial assets with fixed or determinable payments and fixed maturities that the Group’s management has the positive intention and ability to hold to maturity. If the Group were to sell other than an insignificant amount of held-to-maturity financial assets, the whole category would be tainted and reclassified as available-for-sale. Held-to-maturity financial assets are included in non-current assets, except for those with maturities less than 12 months from the end of the reporting period which are classified as current assets.
If, as a result of change in intention or ability, it is no longer appropriate to classify an investment as held-to-maturity, it shall be reclassified as available-for-sale and remeasured at fair value, and the difference between its carrying amount and fair value shall be recognized in other comprehensive income.
(c) Loans and receivables
Loans and receivables are non-derivative financial assets with fixed or determinable payments that are not quoted in an active market. They are included in current assets, except for maturities greater than 12 months after the end of the reporting period which are classified as non-current assets. The Group’s loans and receivables comprise mainly loan portfolio, fees receivable, other receivables, cash and cash equivalents.
(d) Available-for-sale financial assets
Available-for-sale financial assets are non-derivative financial instruments that are either designated in this category or not classified in any of the other categories. They are included in non-current assets unless management intends to dispose of the investments within 12 months of the end of the reporting period.
58
NOTES TO THE CONSOLIDATED FINANCIAL STATEMENTSFor the year ended 31 December 2013
Value Partners Group LimitedAnnual Report 2013
2 Summary of significant accounting policies (continued)
2.11 Financial assets (continued)
(d) Available-for-sale financial assets (continued)
Regular way purchases and sales of financial assets are recognized on the trade-date – the date on which the Group commits to purchase or sell the financial assets. They are initially recognized at fair value plus transaction costs for all financial assets not carried at fair value through profit or loss. Financial assets carried at fair value through profit or loss are initially recognized at fair value, and transaction costs are expensed in the consolidated statement of comprehensive income. Financial assets are derecognized when the rights to receive cash flows from the financial assets have expired or have been transferred and the Group has transferred substantially all risks and rewards of ownership.
Financial assets at fair value through profit or loss and available-for-sale financial assets are subsequently carried at fair value. Held-to-maturity financial assets and loans and receivables are subsequently carried at amortized cost using the effective interest method.
Gains or losses arising from changes in the fair value of financial assets at fair value through profit or loss are recognized in the consolidated statement of comprehensive income in the period in which they arise. Changes in the fair value of securities classified as available-for-sale financial assets are recognized in other comprehensive income.
When securities classified as available-for-sale financial assets are sold or impaired, the accumulated fair value adjustments recognized in equity are included in the consolidated statement of comprehensive income as gains and losses from available-for-sale financial assets.
Interest on available-for-sale securities calculated using the effective interest method is recognized in the consolidated statement of comprehensive income as part of other income. Dividends on available-for-sale equity instruments are recognized in the consolidated statement of comprehensive income as part of other income when the Group’s right to receive payments is established.
The fair value of quoted financial assets is based on last traded market prices. If the market for a financial asset is not active and for unlisted securities, the Group establishes fair value by using external valuations or valuation techniques. These include the use of prices provided by fund administrators and valuations performed by external valuation specialists, making maximum use of market inputs and relying as little as possible on entity-specific inputs.
The Group assesses at the end of each reporting period whether there is objective evidence that a financial asset or a group of financial assets is impaired. In the case of equity securities classified as available-for-sale financial assets, a significant or prolonged decline in the fair value of the security below its cost is evidence that the assets are impaired. If any such evidence exists for available-for-sale financial assets, the cumulative loss – measured as the difference between the acquisition cost and the current fair value, less any impairment loss on that financial asset previously recognized in profit or loss – is removed from equity and recognized in the consolidated statement of comprehensive income. Impairment losses recognized in the consolidated statement of comprehensive income on equity securities classified as available-for-sale financial assets are not reversed through the consolidated statement of comprehensive income.
Transfers between levels of the fair value measurement hierarchy are recognized as of the date of the event or change in circumstances that caused the transfer.
2.12 Derivative financial instruments
Derivative financial instruments are initially recognized at fair value on the date a derivative contract is entered into and are subsequently remeasured at their fair value. The derivative financial instruments are designated as non-hedging instruments and are classified as current assets or liabilities. Changes in the fair value of any non-hedging derivative financial instruments are recognized immediately in the consolidated statement of comprehensive income.
59
NOTES TO THE CONSOLIDATED FINANCIAL STATEMENTSFor the year ended 31 December 2013
Value Partners Group LimitedAnnual Report 2013
2 Summary of significant accounting policies (continued)
2.13 Offsetting financial instruments
Financial assets and liabilities are offset and the net amount reported in the consolidated balance sheet when there is a legally enforceable right to offset the recognized amounts and there is an intention to settle on a net basis or realize the asset and settle the liability simultaneously.
2.14 Fees receivable
Fees receivable are initially recognized at fair value of the fee income receivable and subsequently measured at amortized cost using the effective interest method, less any provision for impairment. A provision for impairment of fees receivable is established when there is objective evidence that the Group will not be able to collect all amounts due.
2.15 Cash and cash equivalents
Cash and cash equivalents include cash in hand, deposits held at call with banks and brokers and other short-term highly liquid investments with original maturities of three months or less.
2.16 Share capital
Ordinary shares are classified as equity. Incremental costs directly attributable to the issue of new shares or share options are shown in equity as a deduction from the proceeds. Costs directly attributable to the repurchase of issued ordinary shares are shown in equity as a deduction and the nominal value of the shares repurchased is transferred from retained earnings to the capital redemption reserve.
2.17 Current and deferred tax
The current tax charge is calculated on the basis of the tax laws enacted or substantively enacted by the reporting date in the jurisdictions where the Group, its joint ventures and associates operate and generate taxable income. Management periodically evaluates positions taken in tax returns with respect to situations in which applicable tax regulation is subject to interpretation and establishes provisions, where appropriate, on the basis of amounts expected to be paid to the tax authorities.
Deferred tax is provided in full, using the liability method, on temporary differences arising between the tax bases of assets and liabilities and their carrying amounts in the consolidated financial statements. However, deferred tax is not accounted for if it arises from initial recognition of an asset or liability in a transaction other than a business combination that at the time of the transaction affects neither accounting nor taxable profit or loss. Deferred tax is determined using tax rates (and laws) that have been enacted or substantively enacted by the reporting date and are expected to apply when the related deferred tax asset is realized or the deferred tax liability is settled.
Deferred tax assets are recognized to the extent that it is probable that future taxable profit will be available against which the temporary differences can be utilized.
Deferred tax assets and liabilities are offset when there is a legally enforceable right to offset current tax assets against current tax liabilities and when the deferred tax assets and liabilities relate to taxes levied by the same tax authority.
Deferred tax liabilities are provided on temporary differences arising on investments in subsidiaries, joint arrangements and associates, except where the timing of the reversal of the temporary differences is controlled by the Group and it is probable that the temporary differences will not reverse in the foreseeable future.
60
NOTES TO THE CONSOLIDATED FINANCIAL STATEMENTSFor the year ended 31 December 2013
Value Partners Group LimitedAnnual Report 2013
2 Summary of significant accounting policies (continued)
2.18 Income recognition
Revenue comprises the fair value of the consideration received or receivable for the provision of services in the ordinary course of the Group’s activities.
The Group recognizes revenue when the amount of revenue can be reliably measured, it is probable that future economic benefits will flow to the entity and specific criteria have been met for each of the Group’s activities as described below. The amount of revenue is not considered to be reliably measurable until all contingencies relating to the provision of services have been resolved. Revenue is recognized as follows:
(a) Fees from investment management activities
Management fees are recognized on a time-proportion basis with reference to the net asset value of the investment funds and managed accounts.
Performance fees are recognized on the performance fee valuation day of the investment funds and managed accounts when there is a positive performance for the relevant performance period, taking into consideration the relevant basis of calculation for the investment funds and managed accounts.
(b) Fees from fund distribution activities
Front-end fees are recognized on a straight-line basis over the estimated holding periods of the investors in the investment funds. Any unrecognized amounts are treated as deferred income.
Back-end fees are recognized upon redemption by the investors in the investment funds.
(c) Interest income
Interest income is recognized on a time-proportion basis using the effective interest method.
(d) Dividend income
Dividend income is recognized when the right to receive payment is established.
(e) Rental income
Rental income from investment properties is recognized on a straight-line basis over the term of the lease.
2.19 Fee expenses
Fee expenses comprise:
(a) Distribution fee expenses
Distribution fee expenses represent rebates of management fee, performance fee and front-end fee income by the Group to the distributors for selling its products. Distribution fee expenses are recognized when the corresponding management fees, performance fees and front-end fees are earned by the Group and the Group is obliged to pay the rebates.
61
NOTES TO THE CONSOLIDATED FINANCIAL STATEMENTSFor the year ended 31 December 2013
Value Partners Group LimitedAnnual Report 2013
2 Summary of significant accounting policies (continued)
2.19 Fee expenses (continued)
(b) Advisory fee expenses
Advisory fee expenses comprise fees paid and payable to the advisors for the provision of advisory services in relation to fund investment policies and strategies. Advisory fee expenses are recognized when the advisory services are received by the Group.
2.20 Compensation and benefits
(a) Bonus
The Group recognizes a liability and an expense for bonus on a basis that takes into consideration the profit attributable to equity holders of the Company and various other factors. The bonus is paid in cash to employees and directors. The Group recognizes a liability where contractually obliged or where there is a past practice that has created a constructive obligation.
(b) Share-based compensation
The Group operates an equity-settled, share-based compensation plan. The fair value of the employee services received in exchange for the grant of the share options is recognized as an expense. The total amount to be expensed is determined by reference to the fair value of the share options granted:
• including any market performance conditions;• excluding the impact of any service and non-market performance vesting conditions; and• including the impact of any non-vesting conditions.
Non-market vesting conditions are included in assumptions about the number of share options that are expected to vest. The total expense is recognized over the vesting period, which is the period over which all of the specified vesting conditions are to be satisfied. At the end of each reporting period, the entity revises its estimates of the number of share options that are expected to vest based on the non-market vesting conditions. It recognizes the impact of the revision to original estimates, if any, in the consolidated statement of comprehensive income, with a corresponding adjustment to equity.
When the share options are exercised, the Company issues new shares. The proceeds received net of any directly attributable transaction costs are credited to share capital (nominal value) and share premium when the options are exercised.
The grant by the Company of options over its equity instruments to the employees of subsidiaries in the Group is treated as a capital contribution. The fair value of employee services received, measured by reference to the grant date fair value, is recognized over the vesting period as an increase to investments in subsidiaries, with a corresponding credit to equity. In the same financial period, the Company makes a recharge to the subsidiaries in respect of share options granted to the subsidiaries’ employees.
(c) Pension obligations
The Group participates in a mandatory provident fund scheme in Hong Kong which is a defined contribution plan generally funded through payments to trustee-administered funds. The Group pays contributions to the mandatory provident fund scheme on a mandatory basis. The Group has no legal or constructive obligations to pay further contributions if the mandatory provident fund scheme does not hold sufficient assets to pay all employees the benefits relating to employee services in the current and prior periods. The contributions are recognized as compensation and benefit expenses when they are due.
62
NOTES TO THE CONSOLIDATED FINANCIAL STATEMENTSFor the year ended 31 December 2013
Value Partners Group LimitedAnnual Report 2013
2 Summary of significant accounting policies (continued)
2.20 Compensation and benefits (continued)
(d) Other employee benefits
Short-term employee benefit costs are charged in the period to which the employee services relate.
Employee entitlements to annual leave and long-service leave are recognized when they accrue to employees. An accrual is made for the estimated liability for annual leave and long-service leave as a result of services rendered by employees up to the reporting date.
2.21 Operating leases
Leases in which a significant portion of the risks and rewards of ownership are retained by the lessor are classified as operating leases. Payments made under operating leases (net of any incentives received from the lessor) are charged to the consolidated statement of comprehensive income on a straight-line basis over the period of the lease.
2.22 Dividend distribution
Dividend distribution to the Company’s shareholders is recognized as a liability in the Group’s and the Company’s financial statements in the period in which the dividends are approved by the Company’s shareholders or directors, as appropriate.
2.23 Contingent liabilities and contingent assets
A contingent liability is a possible obligation that arises from past events and whose existence will only be confirmed by the occurrence or non-occurrence of one or more uncertain future events not wholly within the control of the Group. It can also be a present obligation arising from past events that is not recognized because it is not probable that outflow of economic resources will be required or the amount of obligation cannot be measured reliably. A contingent liability is not recognized but is disclosed in the notes to the consolidated financial statements. When a change in the probability of an outflow occurs so that the outflow is probable, it will then be recognized as a provision.
A contingent asset is a possible asset that arises from past events and whose existence will only be confirmed by the occurrence or non-occurrence of one or more uncertain future events not wholly within the control of the Group. A contingent asset is not recognized but is disclosed in the notes to the consolidated financial statements, where necessary, when an inflow of economic benefits is probable. When inflow is virtually certain, an asset is recognized.
3 Financial risk management
3.1 Financial risk factors
The Group’s activities in relation to financial instruments expose it to a variety of financial risks: market risk (including foreign exchange risk, interest rate risk and price risk), credit risk and liquidity risk. The Group’s overall financial risk management programme focuses on the analysis, evaluation and management of financial risks and seeks to minimize potential adverse effects on the Group’s financial performance.
(a) Foreign exchange risk
The Group is exposed to foreign exchange risk arising primarily from fees receivable denominated in United States dollar, loan portfolio denominated in Renminbi and bank deposits denominated in Renminbi, United States dollar and Taiwan dollar. Foreign exchange risk arises from future commercial transactions, recognized assets and liabilities and net investments in foreign operations which are denominated in a currency that is not the entity’s functional currency. Foreign currency exposures are covered by forward contracts and options whenever appropriate.
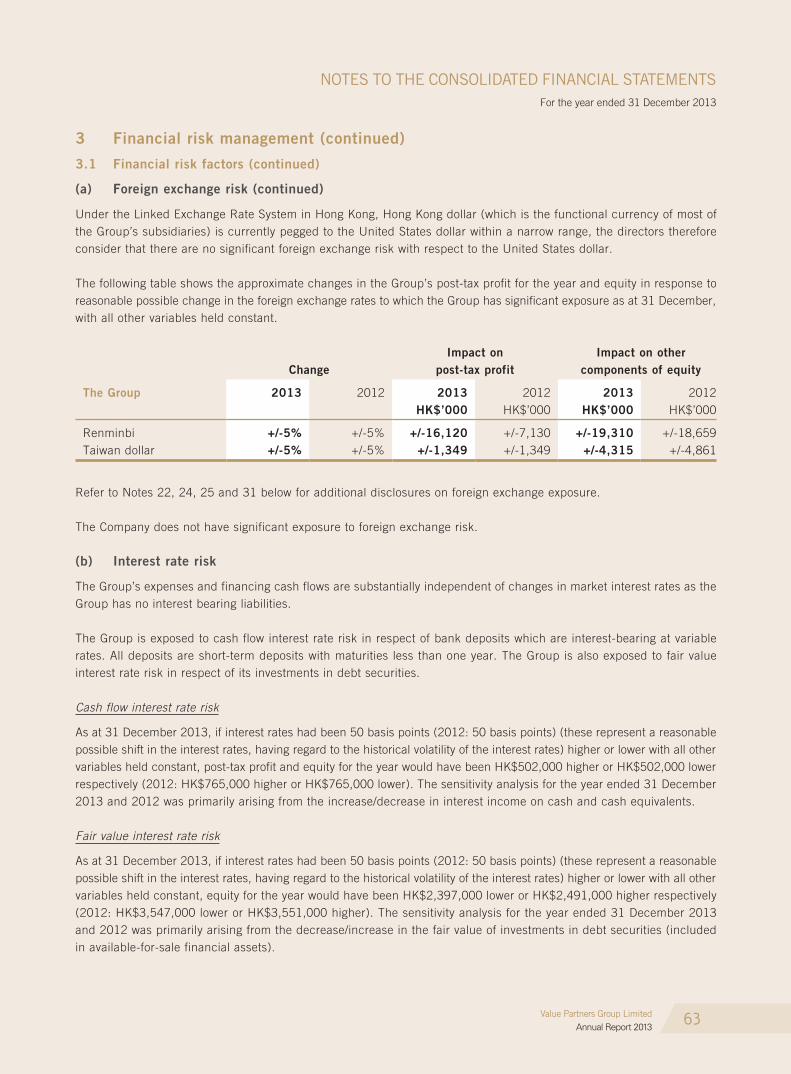
63
NOTES TO THE CONSOLIDATED FINANCIAL STATEMENTSFor the year ended 31 December 2013
Value Partners Group LimitedAnnual Report 2013
3 Financial risk management (continued)
3.1 Financial risk factors (continued)
(a) Foreign exchange risk (continued)
Under the Linked Exchange Rate System in Hong Kong, Hong Kong dollar (which is the functional currency of most of the Group’s subsidiaries) is currently pegged to the United States dollar within a narrow range, the directors therefore consider that there are no significant foreign exchange risk with respect to the United States dollar.
The following table shows the approximate changes in the Group’s post-tax profit for the year and equity in response to reasonable possible change in the foreign exchange rates to which the Group has significant exposure as at 31 December, with all other variables held constant.
ChangeImpact on
post-tax profitImpact on other
components of equity
The group 2013 2012 2013 2012 2013 2012HK$’000 HK$’000 HK$’000 HK$’000
Renminbi +/-5% +/-5% +/-16,120 +/-7,130 +/-19,310 +/-18,659Taiwan dollar +/-5% +/-5% +/-1,349 +/-1,349 +/-4,315 +/-4,861
Refer to Notes 22, 24, 25 and 31 below for additional disclosures on foreign exchange exposure.
The Company does not have significant exposure to foreign exchange risk.
(b) Interest rate risk
The Group’s expenses and financing cash flows are substantially independent of changes in market interest rates as the Group has no interest bearing liabilities.
The Group is exposed to cash flow interest rate risk in respect of bank deposits which are interest-bearing at variable rates. All deposits are short-term deposits with maturities less than one year. The Group is also exposed to fair value interest rate risk in respect of its investments in debt securities.
Cash flow interest rate risk
As at 31 December 2013, if interest rates had been 50 basis points (2012: 50 basis points) (these represent a reasonable possible shift in the interest rates, having regard to the historical volatility of the interest rates) higher or lower with all other variables held constant, post-tax profit and equity for the year would have been HK$502,000 higher or HK$502,000 lower respectively (2012: HK$765,000 higher or HK$765,000 lower). The sensitivity analysis for the year ended 31 December 2013 and 2012 was primarily arising from the increase/decrease in interest income on cash and cash equivalents.
Fair value interest rate risk
As at 31 December 2013, if interest rates had been 50 basis points (2012: 50 basis points) (these represent a reasonable possible shift in the interest rates, having regard to the historical volatility of the interest rates) higher or lower with all other variables held constant, equity for the year would have been HK$2,397,000 lower or HK$2,491,000 higher respectively (2012: HK$3,547,000 lower or HK$3,551,000 higher). The sensitivity analysis for the year ended 31 December 2013 and 2012 was primarily arising from the decrease/increase in the fair value of investments in debt securities (included in available-for-sale financial assets).
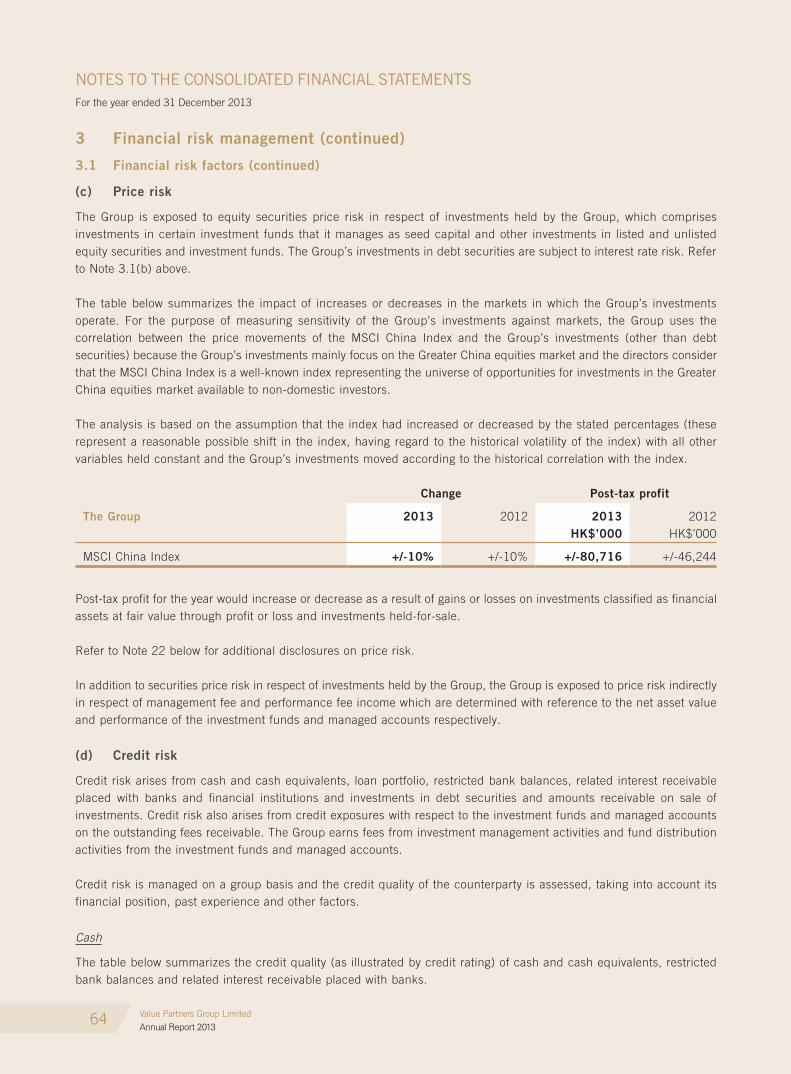
64
NOTES TO THE CONSOLIDATED FINANCIAL STATEMENTSFor the year ended 31 December 2013
Value Partners Group LimitedAnnual Report 2013
3 Financial risk management (continued)
3.1 Financial risk factors (continued)
(c) Price risk
The Group is exposed to equity securities price risk in respect of investments held by the Group, which comprises investments in certain investment funds that it manages as seed capital and other investments in listed and unlisted equity securities and investment funds. The Group’s investments in debt securities are subject to interest rate risk. Refer to Note 3.1(b) above.
The table below summarizes the impact of increases or decreases in the markets in which the Group’s investments operate. For the purpose of measuring sensitivity of the Group’s investments against markets, the Group uses the correlation between the price movements of the MSCI China Index and the Group’s investments (other than debt securities) because the Group’s investments mainly focus on the Greater China equities market and the directors consider that the MSCI China Index is a well-known index representing the universe of opportunities for investments in the Greater China equities market available to non-domestic investors.
The analysis is based on the assumption that the index had increased or decreased by the stated percentages (these represent a reasonable possible shift in the index, having regard to the historical volatility of the index) with all other variables held constant and the Group’s investments moved according to the historical correlation with the index.
Change Post-tax profit
The group 2013 2012 2013 2012HK$’000 HK$’000
MSCI China Index +/-10% +/-10% +/-80,716 +/-46,244
Post-tax profit for the year would increase or decrease as a result of gains or losses on investments classified as financial assets at fair value through profit or loss and investments held-for-sale.
Refer to Note 22 below for additional disclosures on price risk.
In addition to securities price risk in respect of investments held by the Group, the Group is exposed to price risk indirectly in respect of management fee and performance fee income which are determined with reference to the net asset value and performance of the investment funds and managed accounts respectively.
(d) Credit risk
Credit risk arises from cash and cash equivalents, loan portfolio, restricted bank balances, related interest receivable placed with banks and financial institutions and investments in debt securities and amounts receivable on sale of investments. Credit risk also arises from credit exposures with respect to the investment funds and managed accounts on the outstanding fees receivable. The Group earns fees from investment management activities and fund distribution activities from the investment funds and managed accounts.
Credit risk is managed on a group basis and the credit quality of the counterparty is assessed, taking into account its financial position, past experience and other factors.
Cash
The table below summarizes the credit quality (as illustrated by credit rating) of cash and cash equivalents, restricted bank balances and related interest receivable placed with banks.

65
NOTES TO THE CONSOLIDATED FINANCIAL STATEMENTSFor the year ended 31 December 2013
Value Partners Group LimitedAnnual Report 2013
3 Financial risk management (continued)
3.1 Financial risk factors (continued)
(d) Credit risk (continued)
2013 2012HK$’000 HK$’000
The groupA+ 105,640 90,522A 251,782 228,924A- 33,646 183,746BBB+ 140,118 10,685BBB 21,209 25,966BBB- 142,123 4,542BB+ – 334,511Unrated 5,209 30,099
699,727 908,995
The CompanyA+ 6,899 8,209A 4,026 269A- – 3,021BBB+ 93,976 –
104,901 11,499
The reference independent credit rating used is Standard & Poor’s or Fitch Ratings long-term local issuer credit rating. The directors do not expect any losses from non-performance by these counterparties.
Loan portfolio
Maximum exposures to credit risk before taking into account any collateral held or other credit enhancements are HK$233,356,000 (2012: HK$8,445,000).
Credit quality of the loan portfolio can be assessed by reference to historical information about counterparty default rates. The credit quality is analysed as follows.
The group 2013 2012HK$’000 HK$’000
Neither past due nor impaired 228,601 8,445Past due but not impaired 1 – 90 days 4,697 – 91 days – 1 year 58 –
Gross loan portfolio 233,356 8,445Allowance for loan impairment – collectively assessed (1,637) (84)
231,719 8,361
The Group manages and controls credit risk by setting limits on the amount of risk it is willing to accept for individual counterparties and by monitoring exposures in relation to such limits. The Group has established a credit quality review process to provide early identification of possible changes in the creditworthiness of counterparties.
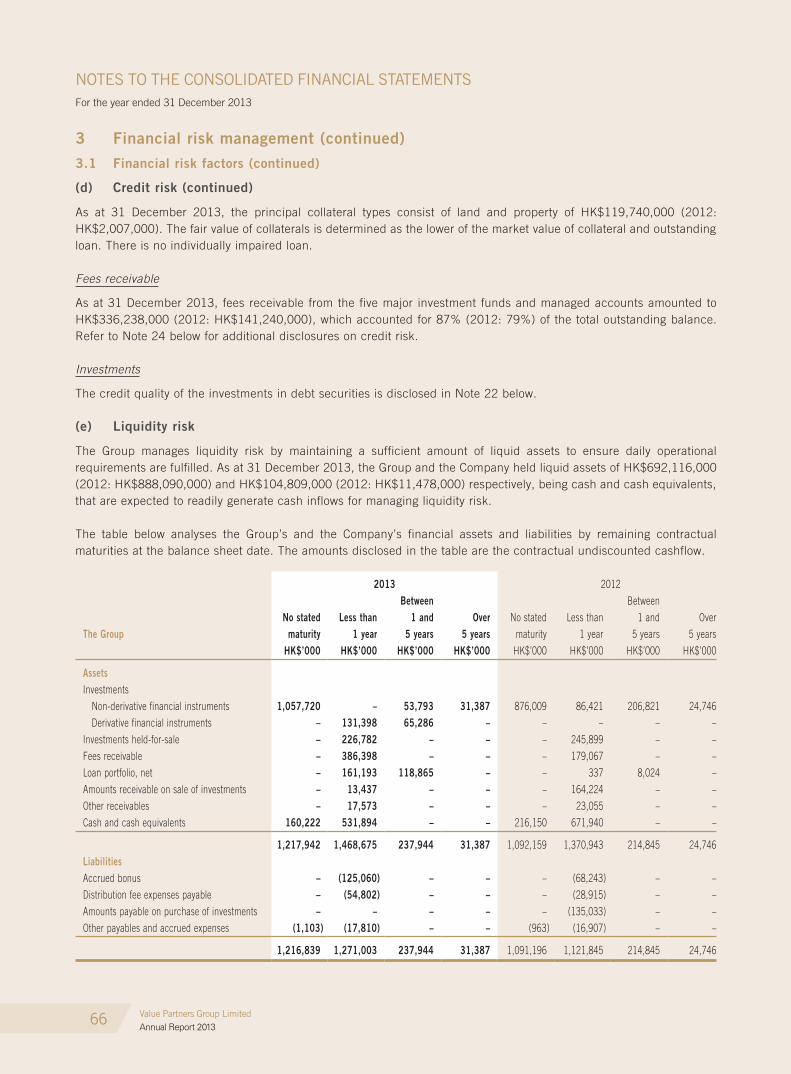
66
NOTES TO THE CONSOLIDATED FINANCIAL STATEMENTSFor the year ended 31 December 2013
Value Partners Group LimitedAnnual Report 2013
3 Financial risk management (continued)
3.1 Financial risk factors (continued)
(d) Credit risk (continued)
As at 31 December 2013, the principal collateral types consist of land and property of HK$119,740,000 (2012: HK$2,007,000). The fair value of collaterals is determined as the lower of the market value of collateral and outstanding loan. There is no individually impaired loan.
Fees receivable
As at 31 December 2013, fees receivable from the five major investment funds and managed accounts amounted to HK$336,238,000 (2012: HK$141,240,000), which accounted for 87% (2012: 79%) of the total outstanding balance. Refer to Note 24 below for additional disclosures on credit risk.
Investments
The credit quality of the investments in debt securities is disclosed in Note 22 below.
(e) Liquidity risk
The Group manages liquidity risk by maintaining a sufficient amount of liquid assets to ensure daily operational requirements are fulfilled. As at 31 December 2013, the Group and the Company held liquid assets of HK$692,116,000 (2012: HK$888,090,000) and HK$104,809,000 (2012: HK$11,478,000) respectively, being cash and cash equivalents, that are expected to readily generate cash inflows for managing liquidity risk.
The table below analyses the Group’s and the Company’s financial assets and liabilities by remaining contractual maturities at the balance sheet date. The amounts disclosed in the table are the contractual undiscounted cashflow.
2013 2012
The groupNo stated
maturityLess than
1 year
Between 1 and
5 yearsOver
5 yearsNo stated
maturity
Less than
1 year
Between
1 and
5 years
Over
5 years
HK$’000 HK$’000 HK$’000 HK$’000 HK$’000 HK$’000 HK$’000 HK$’000
AssetsInvestments
Non-derivative financial instruments 1,057,720 – 53,793 31,387 876,009 86,421 206,821 24,746
Derivative financial instruments – 131,398 65,286 – – – – –
Investments held-for-sale – 226,782 – – – 245,899 – –
Fees receivable – 386,398 – – – 179,067 – –
Loan portfolio, net – 161,193 118,865 – – 337 8,024 –
Amounts receivable on sale of investments – 13,437 – – – 164,224 – –
Other receivables – 17,573 – – – 23,055 – –
Cash and cash equivalents 160,222 531,894 – – 216,150 671,940 – –
1,217,942 1,468,675 237,944 31,387 1,092,159 1,370,943 214,845 24,746
LiabilitiesAccrued bonus – (125,060) – – – (68,243) – –
Distribution fee expenses payable – (54,802) – – – (28,915) – –
Amounts payable on purchase of investments – – – – – (135,033) – –
Other payables and accrued expenses (1,103) (17,810) – – (963) (16,907) – –
1,216,839 1,271,003 237,944 31,387 1,091,196 1,121,845 214,845 24,746

67
NOTES TO THE CONSOLIDATED FINANCIAL STATEMENTSFor the year ended 31 December 2013
Value Partners Group LimitedAnnual Report 2013
3 Financial risk management (continued)
3.1 Financial risk factors (continued)
(e) Liquidity risk (continued)
2013 2012
The CompanyNo stated
maturityLess than 3 months
No stated maturity
Less than 3 months
HK$’000 HK$’000 HK$’000 HK$’000
AssetsAmounts due from subsidiaries 205,123 – 418,043 –Dividends receivable – 260,000 – 100,000Other receivables – 92 – 21Cash and cash equivalents 6,901 97,908 8,478 3,000
212,024 358,000 426,521 103,021LiabilitiesOther payables and accrued expenses – (1,278) – (404)Amounts due to a subsidiary (36,253) – (6,000) –
175,771 356,722 420,521 102,617
3.2 Capital risk management
The Group’s objectives in managing capital are to safeguard its ability to continue as a going concern in order to provide returns for shareholders and benefits for other stakeholders. In order to maintain or adjust the capital structure, the Group may adjust the amount of dividends paid to shareholders, return capital to shareholders, issue new shares or sell assets to reduce liabilities. The Group monitors capital on the basis of total equity as shown in the consolidated balance sheet. The Group’s strategy is to maintain a solid capital base to support the operations and development of its business in the long term.
As at 31 December 2013, Sensible Asset Management Hong Kong Limited, Sensible Asset Management Limited, Value Partners Hong Kong Limited, Value Partners Limited and Value Partners Private Equity Limited, wholly-owned subsidiaries of the Group, are licensed to carry out regulated activities under the Hong Kong Securities and Futures Ordinance as follows:
Sensible Asset Management Hong Kong Limited (a) Types 4 and 9Sensible Asset Management Limited (a) Types 4 and 9Value Partners Hong Kong Limited Types 1, 4, 5 and 9Value Partners Limited Types 1, 4, 5 and 9Value Partners Private Equity Limited (a) Types 4 and 9
(a) The regulated entities are subject to specified licensing conditions.
The types of regulated activities are as follows:
Type 1 Dealing in securitiesType 4 Advising on securitiesType 5 Advising on futures contractsType 9 Asset management

68
NOTES TO THE CONSOLIDATED FINANCIAL STATEMENTSFor the year ended 31 December 2013
Value Partners Group LimitedAnnual Report 2013
3 Financial risk management (continued)
3.2 Capital risk management (continued)
As a result, they are subject to capital requirements on the paid-up capital and liquid capital and file financial returns with the Securities and Futures Commission as follows:
Sensible Asset Management Hong Kong Limited Half-yearlySensible Asset Management Limited Half-yearlyValue Partners Hong Kong Limited MonthlyValue Partners Limited MonthlyValue Partners Private Equity Limited Half-yearly
In addition, Value Partners Concord Asset Management Co., Ltd. is subject to a minimum capital requirement on the paid-up capital for its asset management business in Taiwan.
3.3 Fair value estimation
The following table presents the Group’s financial instruments that are measured at fair value at the end of the reporting period by level of the fair value measurement hierarchy.
Level 1 Level 2 Level 3 Total
2013 2012 2013 2012 2013 2012 2013 2012HK$’000 HK$’000 HK$’000 HK$’000 HK$’000 HK$’000 HK$’000 HK$’000
Investments (Note 22) Listed securities 515,493 599,858 – – – – 515,493 599,858 Unlisted securities Investment funds – Cayman Islands – – 486,794 471,036 52 52 486,846 471,088 Others – – 140,561 123,051 – – 140,561 123,051 Derivative financial instruments – – 196,684 – – – 196,684 –Investments held-for-sale (Note 23) – – 226,782 245,899 – – 226,782 245,899
The fair value of financial instruments traded in active markets is based on quoted market prices for identical instruments at the reporting date. A market is regarded as active if quoted prices are readily and regularly available, and those prices represent actual and regularly occurring market transactions on an arm’s length basis. These instruments are included in level 1. Prior to 1 January 2013, the quoted market price used for financial assets held by the Group was the bid price. The Group adopted HKFRS 13 “Fair Value Measurement” from 1 January 2013 and changed its fair valuation inputs to utilize the last traded market price for financial assets. The adoption has no impact on the Group’s financial position or performance in prior year as the difference between last traded market price and bid/ask price was immaterial.
The fair value of financial instruments that are not traded in an active market is determined by using valuation techniques. These valuation techniques maximize the use of observable market data where it is available and rely as little as possible on entity-specific estimates. If all significant inputs required to fair value an instrument are observable, either directly (as prices) or indirectly (derived from prices), the instrument is included in level 2. These instruments include the Group’s investments in investment funds and debt securities.

69
NOTES TO THE CONSOLIDATED FINANCIAL STATEMENTSFor the year ended 31 December 2013
Value Partners Group LimitedAnnual Report 2013
3 Financial risk management (continued)
3.3 Fair value estimation (continued)
If one or more of the significant inputs is not based on observable market data, the instrument is included in level 3.
Specific valuation techniques used to value financial instruments include:
• Quoted bid prices (or net asset value) provided by fund administrators for unlisted investment funds. These investment funds invest substantially in listed equities.
• Derivative financial instruments are measured by reference to the fair value of underlying assets at which the issuers have agreed to buy back from holders.
• Other techniques, such as valuations performed by external valuation specialists, recent arm’s length transactions or reference to other instruments that are substantially the same, for the remaining financial instruments.
The following table presents the movement of level 3 instruments.
Investments
2013 2012HK$’000 HK$’000
As at 1 January 52 1,877Addition to level 3 – 6Disposal of level 3 – (2)Return of capital from investments – (2,198)Gains recognized in profit or loss – 369
As at 31 December 52 52
Total gains for the year included in the consolidated statement of comprehensive income for level 3 instruments for the year – 369
Change in unrealized gains or losses for level 3 instruments held at year end and included in net gains on investments – 369
The level 3 instruments include the investment funds managed by the Group. Such investment funds are stated with reference to the net asset value provided by the respective administrators of the investment funds. If the net asset value of the investment funds is not available or the Group considers that such net asset value is not reflective of fair value, the Group may exercise its judgement and discretion to determine the fair value of the investment funds. There were no changes in valuation techniques during the period.
As at 31 December 2013 and 2012, the majority of the Group’s investments are included in levels 1 and 2. There were no transfers between levels of the fair value measurement hierarchy for the year ended 31 December 2013 (2012: Nil).
Except for the assets disclosed above, the carrying amounts of other financial assets and liabilities as at 31 December 2013 and 2012 are approximation of their fair value.
The maturities of fees receivable, amounts receivable on sale of investments, other receivables, restricted bank balances, cash and cash equivalents and financial liabilities are within one year, and the carrying value approximates their fair value.
70
NOTES TO THE CONSOLIDATED FINANCIAL STATEMENTSFor the year ended 31 December 2013
Value Partners Group LimitedAnnual Report 2013
4 Critical accounting estimates and judgementsFair value estimation of financial instruments
The fair value of financial instruments that are not traded in an active market is determined by using external valuations or valuation techniques. The Group uses its judgement to select a variety of methods and make assumptions that are mainly based on market conditions existing at the end of each reporting period. The resulting accounting estimates may not be equal to the related actual results.
Fair value estimation of share options
The Group determines the fair value of its share options using the Black-Scholes valuation model which requires input of subjective assumptions as disclosed in Note 28 below. Any change in the subjective input assumptions may materially affect the fair value of an option.
Fair value estimation of investment properties
The fair value of investment property is determined by an independent valuer on an open market for existing use basis. In making the judgement, consideration has been given to assumptions that are mainly based on market conditions existing at the reporting date and appropriate capitalization rates. The directors have critically assessed these estimates and have regularly compared to actual market data and transactions entered into by the Group.
Estimated impairment of goodwill and other intangible assets
The Group tests annually whether goodwill and other intangible assets have suffered any impairment in accordance with accounting policies stated in Note 2.9(a) above. The recoverable amounts of CGUs have been determined based on value-in-use calculations or their fair value less costs of disposal, whichever is appropriate, and both bases require the Group to estimate the future cash flows expected to arise from the CGUs and a suitable discount rate in order to calculate the present value. Where the actual future cash flows are less than expected, a material impairment loss may arise. Please refer to Note 19.1 below.
Impairment allowances on loan portfolio
The Group reviews its loan portfolio to assess impairment regularly. In determining whether an impairment loss should be recorded in the consolidated statement of comprehensive income, the Group makes judgments as to whether there is any observable data indicating that there is a measurable decrease in the estimated future cash flows from a portfolio of loans before the decrease can be identified with an individual loan in that portfolio. This evidence may include observable data indicating that there has been an adverse change in the payment status of borrowers in a group, or national or local economic conditions that correlate with defaults on assets in the group. Management uses estimates based on historical loss experience for assets with credit risk characteristics and objective evidence of impairment similar to those in the portfolio when scheduling its future cash flows. The methodology and assumptions used for estimating both the amount and timing of future cash flows are reviewed regularly to reduce any differences between loss estimates and actual loss experience.
Investment funds managed by the group
The Group acts as an investment manager to a number of investment funds and has provided seed capital for the set up of these funds. When determining whether the Group controls these funds, usually the level of aggregate economic interests of the Group in these funds and the level of investors’ rights to remove the investment manager are considered.
The Group determines that it has no control over some investment funds since the level of aggregate economic interests of the Group in those funds is not so significant that it gives the Group control over the funds together with the level of investors’ rights to remove the investment manager.
The Group determines that it has control over some investment funds and has classified them as held-for-sale as it intends to market these funds and dilute its holdings as soon as practically possible to a level where its aggregate economic interest does not constitute a control.

71
NOTES TO THE CONSOLIDATED FINANCIAL STATEMENTSFor the year ended 31 December 2013
Value Partners Group LimitedAnnual Report 2013
5 Segment informationThe Board of Directors reviews the Group’s internal financial reporting and other information and also obtains other relevant external information in order to assess performance and allocate resources and operating segments are identified with reference to these.
The Group determines its operating segments based on the information reviewed by the Board of Directors, which is used to make strategic decisions. The Board of Directors evaluates the business from a product perspective.
The Group has two reportable segments – asset management business and small loan business. The two segments are managed separately and offer different products and services. The asset management business is the Group’s core business. It derives revenues from investment management services to investment funds and managed accounts.
The Group set up a small loan business in Chengdu and commenced business in the second half of 2012. Major income of this small loan business includes interest income and administrative fee income.
The Board of Directors assesses the performance of the operating segments based on a measure of profit before tax.
Profit or loss
The revenue and profit before tax reported to the Board of Directors is measured in a manner consistent with that in the consolidated financial statements. An analysis of the Group’s reportable segment revenue and profit before tax for the year by operating segments is as follows:
Year ended 31 December 2013 Year ended 31 December 2012Asset
management business
Small loan business Total
Asset management
businessSmall loan
business TotalHK$’000 HK$’000 HK$’000 HK$’000 HK$’000 HK$’000
Income from external customers 1,008,393 19,188 1,027,581 651,050 526 651,576Distribution and advisory fee expenses (252,583) – (252,583) (178,965) – (178,965)
Net fee income 755,810 19,188 774,998 472,085 526 472,611Other income 38,669 6,536 45,205 43,349 10,770 54,119
Total net income 794,479 25,724 820,203 515,434 11,296 526,730Depreciation and amortisation (5,328) (640) (5,968) (5,481) (390) (5,871)Operating expenses (326,339) (19,734) (346,073) (256,129) (10,377) (266,506)
Operating profit (before other gains/losses) 462,812 5,350 468,162 253,824 529 254,353Other (losses)/gains – net (9,667) – (9,667) 176,934 – 176,934
Operating profit (after other gains/losses) 453,145 5,350 458,495 430,758 529 431,287Share of gain/(loss) of an associate 1,181 – 1,181 (16,152) – (16,152)
Profit before tax 454,326 5,350 459,676 414,606 529 415,135Tax expense (75,648) (2,782) (78,430) (45,475) (182) (45,657)
Profit for the year 378,678 2,568 381,246 369,131 347 369,478
Income from external customers consists of fee income from asset management business of HK$1,008,393,000 (2012: HK$651,050,000), interest income from small loan business of HK$17,992,000 (2012: HK$322,000) and fee income from small loan business of HK$1,196,000 (2012: HK$204,000).
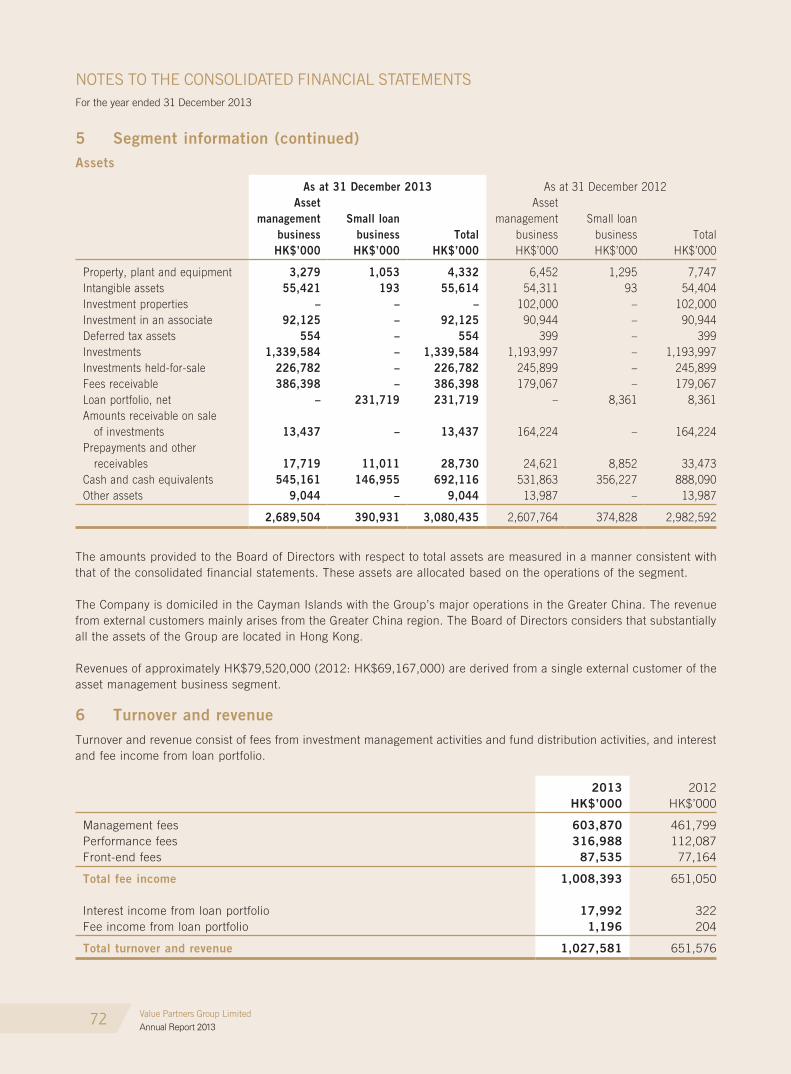
72
NOTES TO THE CONSOLIDATED FINANCIAL STATEMENTSFor the year ended 31 December 2013
Value Partners Group LimitedAnnual Report 2013
5 Segment information (continued)Assets
As at 31 December 2013 As at 31 December 2012Asset
management business
Small loan business Total
Asset management
businessSmall loan
business TotalHK$’000 HK$’000 HK$’000 HK$’000 HK$’000 HK$’000
Property, plant and equipment 3,279 1,053 4,332 6,452 1,295 7,747Intangible assets 55,421 193 55,614 54,311 93 54,404Investment properties – – – 102,000 – 102,000Investment in an associate 92,125 – 92,125 90,944 – 90,944Deferred tax assets 554 – 554 399 – 399Investments 1,339,584 – 1,339,584 1,193,997 – 1,193,997Investments held-for-sale 226,782 – 226,782 245,899 – 245,899Fees receivable 386,398 – 386,398 179,067 – 179,067Loan portfolio, net – 231,719 231,719 – 8,361 8,361Amounts receivable on sale of investments 13,437 – 13,437 164,224 – 164,224Prepayments and other receivables 17,719 11,011 28,730 24,621 8,852 33,473Cash and cash equivalents 545,161 146,955 692,116 531,863 356,227 888,090Other assets 9,044 – 9,044 13,987 – 13,987
2,689,504 390,931 3,080,435 2,607,764 374,828 2,982,592
The amounts provided to the Board of Directors with respect to total assets are measured in a manner consistent with that of the consolidated financial statements. These assets are allocated based on the operations of the segment.
The Company is domiciled in the Cayman Islands with the Group’s major operations in the Greater China. The revenue from external customers mainly arises from the Greater China region. The Board of Directors considers that substantially all the assets of the Group are located in Hong Kong.
Revenues of approximately HK$79,520,000 (2012: HK$69,167,000) are derived from a single external customer of the asset management business segment.
6 Turnover and revenueTurnover and revenue consist of fees from investment management activities and fund distribution activities, and interest and fee income from loan portfolio.
2013 2012HK$’000 HK$’000
Management fees 603,870 461,799Performance fees 316,988 112,087Front-end fees 87,535 77,164
Total fee income 1,008,393 651,050
Interest income from loan portfolio 17,992 322Fee income from loan portfolio 1,196 204
Total turnover and revenue 1,027,581 651,576
73
NOTES TO THE CONSOLIDATED FINANCIAL STATEMENTSFor the year ended 31 December 2013
Value Partners Group LimitedAnnual Report 2013
7 Distribution and advisory fee expenses
Distribution and advisory fee expenses payable to third parties are recognized over the period for which the services are provided.
2013 2012HK$’000 HK$’000
Distribution fee expenses 248,528 175,320Advisory fee expenses 4,055 3,645
Total fee expenses 252,583 178,965
8 Other income
2013 2012HK$’000 HK$’000
Interest income on cash and cash equivalents and restricted bank balances 11,499 15,789Interest income on debt securities 21,159 31,091Dividend income on financial assets at fair value through profit or loss 5,683 3,721Dividend income on available-for-sale financial assets 4,708 992Rental income from investment properties 2,056 2,229Others 100 297
Total other income 45,205 54,119
Dividend income from listed and unlisted investments for the year ended 31 December 2013 amounted to HK1,854,000 (2012: HK$2,272,000) and HK$8,537,000 (2012: HK$2,441,000) respectively.
Interest income from listed and unlisted debt securities for the year ended 31 December 2013 amounted to HK$21,007,000 (2012: HK$29,514,000) and HK$152,000 (2012: HK$1,577,000) respectively.
9 Compensation and benefit expenses
2013 2012HK$’000 HK$’000
Salaries, wages and other benefits 132,510 123,621Management bonus 125,060 68,243Share-based compensation (Notes 28 and 29) 8,214 3,387Pension costs – mandatory provident fund scheme 1,941 1,801
Total compensation and benefit expenses 267,725 197,052
9.1 Pension costs – mandatory provident fund scheme
There were no forfeited contributions utilized during the year ended 31 December 2013 (2012: Nil) and as at 31 December 2013 (2012: Nil) to reduce future contributions.
As at 31 December 2013, no contributions were payable to the mandatory provident fund scheme (2012: Nil).

74
NOTES TO THE CONSOLIDATED FINANCIAL STATEMENTSFor the year ended 31 December 2013
Value Partners Group LimitedAnnual Report 2013
9 Compensation and benefit expenses (continued)
9.2 Directors’ emoluments
The remuneration of each director of the Company is as follows:
Salaries andother benefits(a)
Management bonus
Share-based compensation
Pension costs Total
HK$’000 HK$’000 HK$’000 HK$’000 HK$’000
Year ended 31 December 2013Executive directorsDato’ Cheah, Cheng Hye 9,324 22,400 – 15 31,739Ms Hung, Yeuk Yan Renee 2,435 11,350 1,188 15 14,988Mr So, Chun Ki Louis(b) 3,031 16,340 1,760 15 21,146Mr Tse, Wai Ming, Timothy(c) 2,550 7,195 1,688 15 11,448Independent non-executive directorsDr Chen, Shih Ta Michael 277 – 133 – 410Mr Lee, Siang Chin 277 – 133 – 410Mr Oyama, Nobuo 277 – 133 – 410
18,171 57,285 5,035 60 80,551
Year ended 31 December 2012Executive directorsMr Chan, Sheung Lai, Jimmy(d) 1,005 – – 6 1,011Dato’ Cheah, Cheng Hye 7,757 12,891 – 14 20,662Ms Hung, Yeuk Yan Renee 2,194 5,831 61 14 8,100Mr So, Chun Ki Louis(b) 2,619 8,445 440 14 11,518Mr Tse, Wai Ming, Timothy(c) 2,220 3,400 850 14 6,484Independent non-executive directorsDr Chen, Shih Ta Michael 275 – 92 – 367Mr Lee, Siang Chin 275 – 92 – 367Mr Oyama, Nobuo 275 – 92 – 367
16,620 30,567 1,627 62 48,876
(a) Other benefits include rebates of management fees and performance fees by the Group in relation to the directors’ investments in the
investment funds under the Group’s management. Rebates of management fees and performance fees for the year ended 31 December
2013 amounted to HK$3,616,000 (2012: HK$2,166,000).
(b) Mr So Chun Ki Louis became the Deputy Chairman of the Company with effect from 1 June 2012.
(c) Mr Tse Wai Ming, Timothy became the Chief Executive Officer of the Company with effect from 1 June 2012.
(d) Mr Chan Sheung Lai, Jimmy became the Co-Chief Executive Officer of the Company with effect from 28 January 2011 and has been
re-designated as Chief Executive Officer of the Company with effect from 20 May 2011. Mr Chan subsequently resigned as Chief Executive
Officer of the Company with effect from 1 June 2012.
75
NOTES TO THE CONSOLIDATED FINANCIAL STATEMENTSFor the year ended 31 December 2013
Value Partners Group LimitedAnnual Report 2013
9 Compensation and benefit expenses (continued)
9.2 Directors’ emoluments (continued)
The table above discloses the total remuneration received by the directors in their capacity as directors from the Group for the year, excluding remuneration that the director received as an employee of the Group before appointment as a director and that the individual received after resignation as director but remaining as an employee of the Group. No apportionment had been applied to management bonus and share-based compensation which were earned by the individuals as employees of the Group.
None of the directors received or will receive any fees, inducement fees or compensation for loss of office as director for the year ended 31 December 2013 (2012: Nil). No directors waived or agreed to waive any emoluments for the year ended 31 December 2013 (2012: Nil).
9.3 Five highest-paid individuals
The five highest-paid individuals in the Group during the year ended 31 December 2013 included four (2012: four) directors whose emoluments are reflected in the analysis presented above. Details of the remuneration of the remaining highest-paid individual are as follows:
2013 2012HK$’000 HK$’000
Management bonus 11,350 5,831Salaries, wages and other benefits 2,604 2,402Share-based compensation 1,188 61Pension costs – mandatory provident fund scheme 15 14
15,157 8,308
Individual emoluments were within the following bands:
Number of individuals
2013 2012
HK$5,000,001 to HK$10,000,000 0 1HK$15,000,001 to HK$20,000,000 1 0
9.4 Senior management remuneration by band
Details of the remuneration of the senior management were within the following bands:
Number of individuals
2013 2012
Below HK$5,000,000 2 2HK$5,000,001 to HK$10,000,000 0 2HK$10,000,001 to HK$15,000,000 1 0HK$15,000,001 to HK$20,000,000 1 0
76
NOTES TO THE CONSOLIDATED FINANCIAL STATEMENTSFor the year ended 31 December 2013
Value Partners Group LimitedAnnual Report 2013
10 Other expenses
2013 2012HK$’000 HK$’000
Marketing expenses 13,230 10,524Research expenses 10,776 10,194Legal and professional fees 7,323 7,995Depreciation and amortization (Notes 18 and 19) 5,968 5,871Travelling expenses 5,719 6,819Office expenses 4,925 4,824Auditor’s remuneration 4,126 2,874Insurance expenses 3,678 3,419Entertainment expenses 2,282 1,524Transaction costs 1,981 132Donations 1,870 1,750Recruitment expenses 1,698 1,545Charge of loan impairment allowances (Note 27.2) 1,534 84Registration and licensing fees 1,097 1,059Others 4,643 3,768
Total other expenses 70,850 62,382
11 Other (losses)/gains – net
2013 2012HK$’000 HK$’000
Changes in fair value of investment properties (Note 20) (18,528) 24,000Net gains on investments Gains on financial assets at fair value through profit or loss 118,522 155,825 Losses on financial assets at fair value through profit or loss (121,229) (60,448) Gains on disposal of available-for-sale financial assets 7,932 23,743 Losses on disposal of available-for-sale financial assets (1,087) – Gains on disposal of held-to-maturity financial assets (Note 22.1) – 13,633Gains on investments held-for-sale (Note 23) 5,783 23,455Others Losses on disposal of subsidiaries (Note 17.1) (328) (3,975) Net foreign exchange (losses)/gains (732) 701
Total other (losses)/gains – net (9,667) 176,934
12 Tax expense
Under current tax laws of the Cayman Islands, there are no income, estate, corporation, capital gains or other taxes payable by the Group. As a result, no provision for income and capital gains taxes has been made in the consolidated financial statements.
Hong Kong profits tax has been provided on the estimated assessable profit for the year ended 31 December 2013 at the rate of 16.5% (2012: 16.5%).
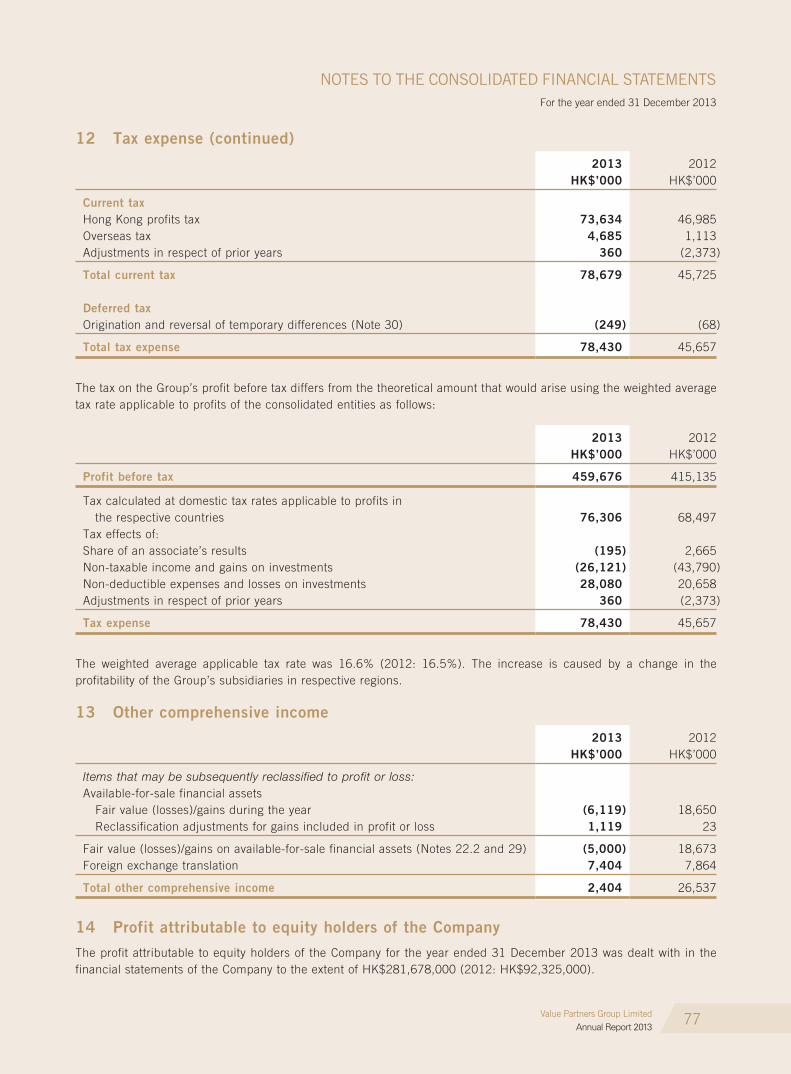
77
NOTES TO THE CONSOLIDATED FINANCIAL STATEMENTSFor the year ended 31 December 2013
Value Partners Group LimitedAnnual Report 2013
12 Tax expense (continued)
2013 2012HK$’000 HK$’000
Current taxHong Kong profits tax 73,634 46,985Overseas tax 4,685 1,113Adjustments in respect of prior years 360 (2,373)
Total current tax 78,679 45,725
Deferred taxOrigination and reversal of temporary differences (Note 30) (249) (68)
Total tax expense 78,430 45,657
The tax on the Group’s profit before tax differs from the theoretical amount that would arise using the weighted average tax rate applicable to profits of the consolidated entities as follows:
2013 2012HK$’000 HK$’000
Profit before tax 459,676 415,135
Tax calculated at domestic tax rates applicable to profits in the respective countries 76,306 68,497Tax effects of:Share of an associate’s results (195) 2,665Non-taxable income and gains on investments (26,121) (43,790)Non-deductible expenses and losses on investments 28,080 20,658Adjustments in respect of prior years 360 (2,373)
Tax expense 78,430 45,657
The weighted average applicable tax rate was 16.6% (2012: 16.5%). The increase is caused by a change in the profitability of the Group’s subsidiaries in respective regions.
13 Other comprehensive income
2013 2012HK$’000 HK$’000
Items that may be subsequently reclassified to profit or loss:Available-for-sale financial assets Fair value (losses)/gains during the year (6,119) 18,650 Reclassification adjustments for gains included in profit or loss 1,119 23
Fair value (losses)/gains on available-for-sale financial assets (Notes 22.2 and 29) (5,000) 18,673Foreign exchange translation 7,404 7,864
Total other comprehensive income 2,404 26,537
14 Profit attributable to equity holders of the Company
The profit attributable to equity holders of the Company for the year ended 31 December 2013 was dealt with in the financial statements of the Company to the extent of HK$281,678,000 (2012: HK$92,325,000).
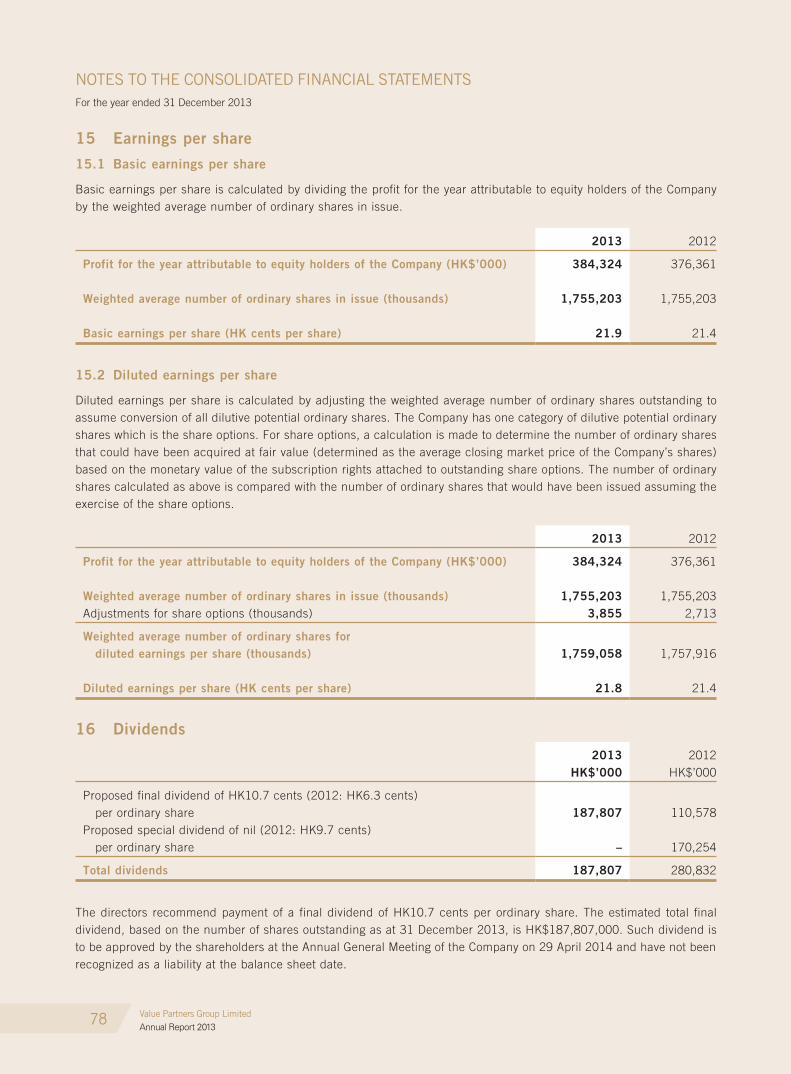
78
NOTES TO THE CONSOLIDATED FINANCIAL STATEMENTSFor the year ended 31 December 2013
Value Partners Group LimitedAnnual Report 2013
15 Earnings per share
15.1 Basic earnings per share
Basic earnings per share is calculated by dividing the profit for the year attributable to equity holders of the Company by the weighted average number of ordinary shares in issue.
2013 2012
Profit for the year attributable to equity holders of the Company (HK$’000) 384,324 376,361
Weighted average number of ordinary shares in issue (thousands) 1,755,203 1,755,203
Basic earnings per share (HK cents per share) 21.9 21.4
15.2 Diluted earnings per share
Diluted earnings per share is calculated by adjusting the weighted average number of ordinary shares outstanding to assume conversion of all dilutive potential ordinary shares. The Company has one category of dilutive potential ordinary shares which is the share options. For share options, a calculation is made to determine the number of ordinary shares that could have been acquired at fair value (determined as the average closing market price of the Company’s shares) based on the monetary value of the subscription rights attached to outstanding share options. The number of ordinary shares calculated as above is compared with the number of ordinary shares that would have been issued assuming the exercise of the share options.
2013 2012
Profit for the year attributable to equity holders of the Company (HK$’000) 384,324 376,361
Weighted average number of ordinary shares in issue (thousands) 1,755,203 1,755,203Adjustments for share options (thousands) 3,855 2,713
Weighted average number of ordinary shares for diluted earnings per share (thousands) 1,759,058 1,757,916
Diluted earnings per share (HK cents per share) 21.8 21.4
16 Dividends
2013 2012HK$’000 HK$’000
Proposed final dividend of HK10.7 cents (2012: HK6.3 cents) per ordinary share 187,807 110,578Proposed special dividend of nil (2012: HK9.7 cents) per ordinary share – 170,254
Total dividends 187,807 280,832
The directors recommend payment of a final dividend of HK10.7 cents per ordinary share. The estimated total final dividend, based on the number of shares outstanding as at 31 December 2013, is HK$187,807,000. Such dividend is to be approved by the shareholders at the Annual General Meeting of the Company on 29 April 2014 and have not been recognized as a liability at the balance sheet date.
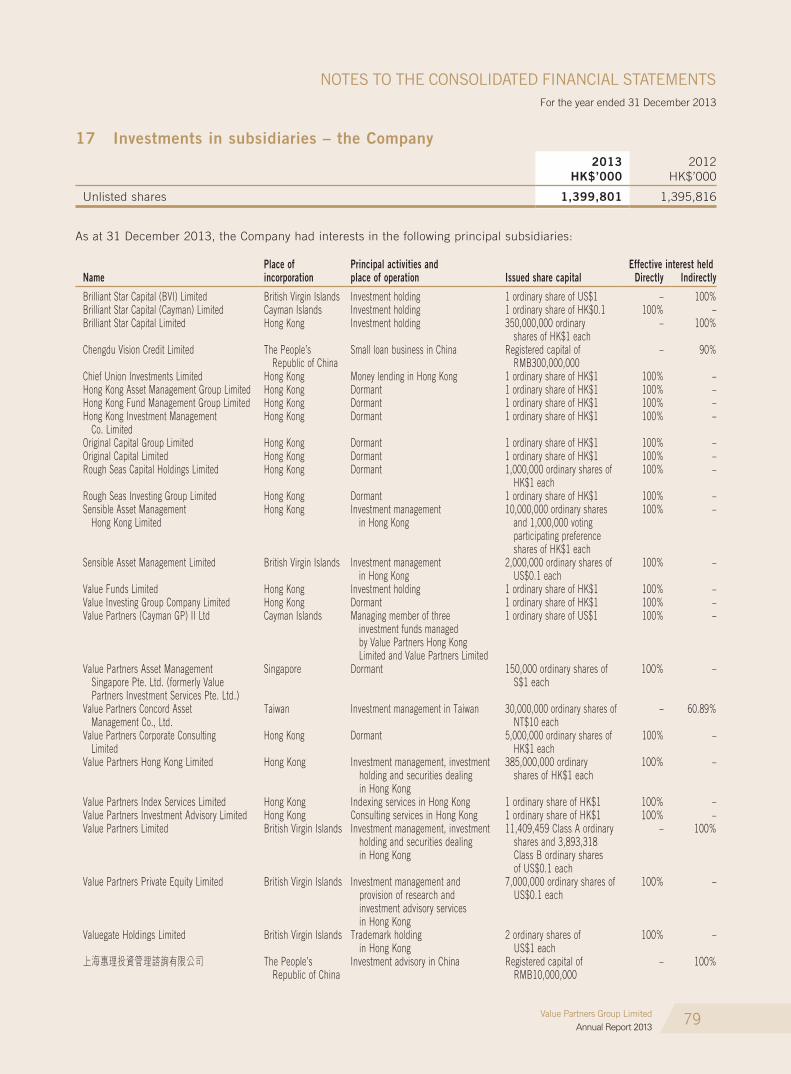
79
NOTES TO THE CONSOLIDATED FINANCIAL STATEMENTSFor the year ended 31 December 2013
Value Partners Group LimitedAnnual Report 2013
17 Investments in subsidiaries – the Company2013 2012
HK$’000 HK$’000
Unlisted shares 1,399,801 1,395,816
As at 31 December 2013, the Company had interests in the following principal subsidiaries:
Place of Principal activities and Effective interest heldName incorporation place of operation Issued share capital Directly Indirectly
Brilliant Star Capital (BVI) Limited British Virgin Islands Investment holding 1 ordinary share of US$1 – 100%Brilliant Star Capital (Cayman) Limited Cayman Islands Investment holding 1 ordinary share of HK$0.1 100% –Brilliant Star Capital Limited Hong Kong Investment holding 350,000,000 ordinary
shares of HK$1 each– 100%
Chengdu Vision Credit Limited The People’s Republic of China
Small loan business in China Registered capital of RMB300,000,000
– 90%
Chief Union Investments Limited Hong Kong Money lending in Hong Kong 1 ordinary share of HK$1 100% –Hong Kong Asset Management Group Limited Hong Kong Dormant 1 ordinary share of HK$1 100% –Hong Kong Fund Management Group Limited Hong Kong Dormant 1 ordinary share of HK$1 100% –Hong Kong Investment Management Co. Limited
Hong Kong Dormant 1 ordinary share of HK$1 100% –
Original Capital Group Limited Hong Kong Dormant 1 ordinary share of HK$1 100% –Original Capital Limited Hong Kong Dormant 1 ordinary share of HK$1 100% –Rough Seas Capital Holdings Limited Hong Kong Dormant 1,000,000 ordinary shares of
HK$1 each100% –
Rough Seas Investing Group Limited Hong Kong Dormant 1 ordinary share of HK$1 100% –Sensible Asset Management Hong Kong Limited
Hong Kong Investment management in Hong Kong
10,000,000 ordinary shares and 1,000,000 voting participating preference shares of HK$1 each
100% –
Sensible Asset Management Limited British Virgin Islands Investment management in Hong Kong
2,000,000 ordinary shares of US$0.1 each
100% –
Value Funds Limited Hong Kong Investment holding 1 ordinary share of HK$1 100% –Value Investing Group Company Limited Hong Kong Dormant 1 ordinary share of HK$1 100% –Value Partners (Cayman GP) II Ltd Cayman Islands Managing member of three
investment funds managed by Value Partners Hong Kong Limited and Value Partners Limited
1 ordinary share of US$1 100% –
Value Partners Asset Management Singapore Pte. Ltd. (formerly Value Partners Investment Services Pte. Ltd.)
Singapore Dormant 150,000 ordinary shares of S$1 each
100% –
Value Partners Concord Asset Management Co., Ltd.
Taiwan Investment management in Taiwan 30,000,000 ordinary shares of NT$10 each
– 60.89%
Value Partners Corporate Consulting Limited
Hong Kong Dormant 5,000,000 ordinary shares of HK$1 each
100% –
Value Partners Hong Kong Limited Hong Kong Investment management, investment holding and securities dealing in Hong Kong
385,000,000 ordinary shares of HK$1 each
100% –
Value Partners Index Services Limited Hong Kong Indexing services in Hong Kong 1 ordinary share of HK$1 100% –Value Partners Investment Advisory Limited Hong Kong Consulting services in Hong Kong 1 ordinary share of HK$1 100% –Value Partners Limited British Virgin Islands Investment management, investment
holding and securities dealing in Hong Kong
11,409,459 Class A ordinary shares and 3,893,318 Class B ordinary shares of US$0.1 each
– 100%
Value Partners Private Equity Limited British Virgin Islands Investment management and provision of research and investment advisory services in Hong Kong
7,000,000 ordinary shares of US$0.1 each
100% –
Valuegate Holdings Limited British Virgin Islands Trademark holding in Hong Kong
2 ordinary shares of US$1 each
100% –
上海惠理投資管理諮詢有限公司 The People’s Republic of China
Investment advisory in China Registered capital of RMB10,000,000
– 100%
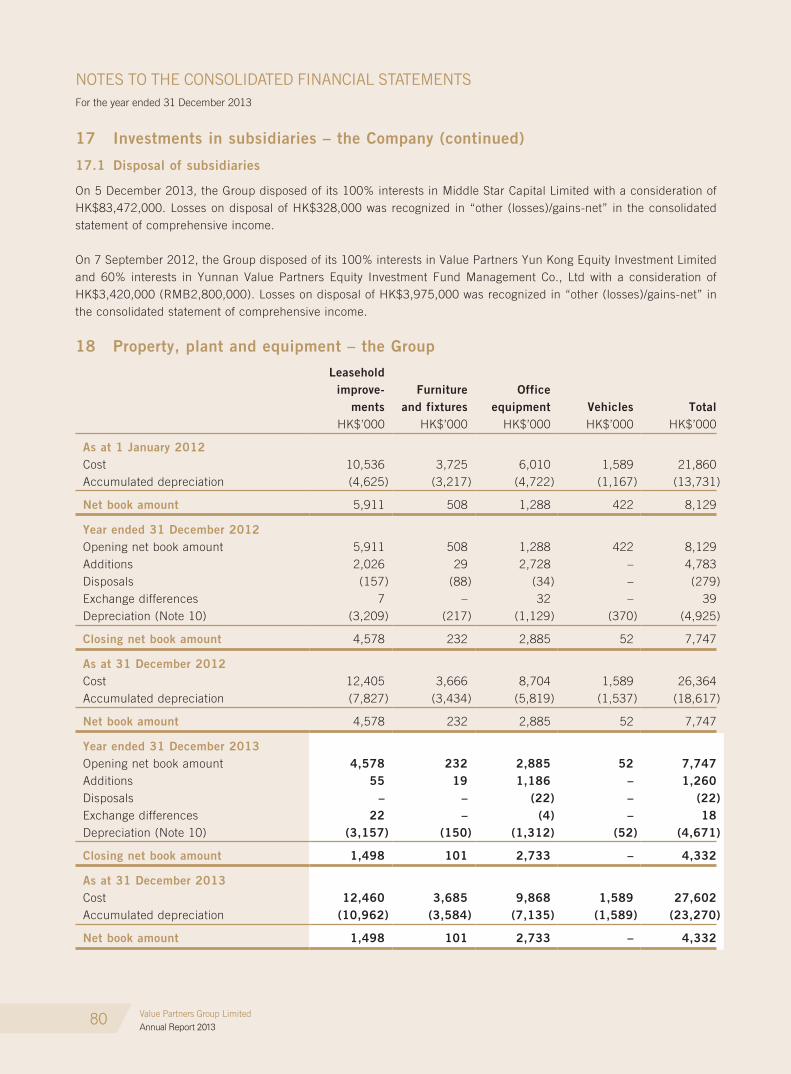
80
NOTES TO THE CONSOLIDATED FINANCIAL STATEMENTSFor the year ended 31 December 2013
Value Partners Group LimitedAnnual Report 2013
17 Investments in subsidiaries – the Company (continued)
17.1 Disposal of subsidiaries
On 5 December 2013, the Group disposed of its 100% interests in Middle Star Capital Limited with a consideration of HK$83,472,000. Losses on disposal of HK$328,000 was recognized in “other (losses)/gains-net” in the consolidated statement of comprehensive income.
On 7 September 2012, the Group disposed of its 100% interests in Value Partners Yun Kong Equity Investment Limited and 60% interests in Yunnan Value Partners Equity Investment Fund Management Co., Ltd with a consideration of HK$3,420,000 (RMB2,800,000). Losses on disposal of HK$3,975,000 was recognized in “other (losses)/gains-net” in the consolidated statement of comprehensive income.
18 Property, plant and equipment – the group
Leasehold improve-
mentsFurniture
and fixturesOffice
equipment Vehicles TotalHK$’000 HK$’000 HK$’000 HK$’000 HK$’000
As at 1 January 2012Cost 10,536 3,725 6,010 1,589 21,860Accumulated depreciation (4,625) (3,217) (4,722) (1,167) (13,731)
Net book amount 5,911 508 1,288 422 8,129
Year ended 31 December 2012Opening net book amount 5,911 508 1,288 422 8,129Additions 2,026 29 2,728 – 4,783Disposals (157) (88) (34) – (279)Exchange differences 7 – 32 – 39Depreciation (Note 10) (3,209) (217) (1,129) (370) (4,925)
Closing net book amount 4,578 232 2,885 52 7,747
As at 31 December 2012Cost 12,405 3,666 8,704 1,589 26,364Accumulated depreciation (7,827) (3,434) (5,819) (1,537) (18,617)
Net book amount 4,578 232 2,885 52 7,747
Year ended 31 December 2013Opening net book amount 4,578 232 2,885 52 7,747Additions 55 19 1,186 – 1,260Disposals – – (22) – (22)Exchange differences 22 – (4) – 18Depreciation (Note 10) (3,157) (150) (1,312) (52) (4,671)
Closing net book amount 1,498 101 2,733 – 4,332
As at 31 December 2013Cost 12,460 3,685 9,868 1,589 27,602Accumulated depreciation (10,962) (3,584) (7,135) (1,589) (23,270)
Net book amount 1,498 101 2,733 – 4,332
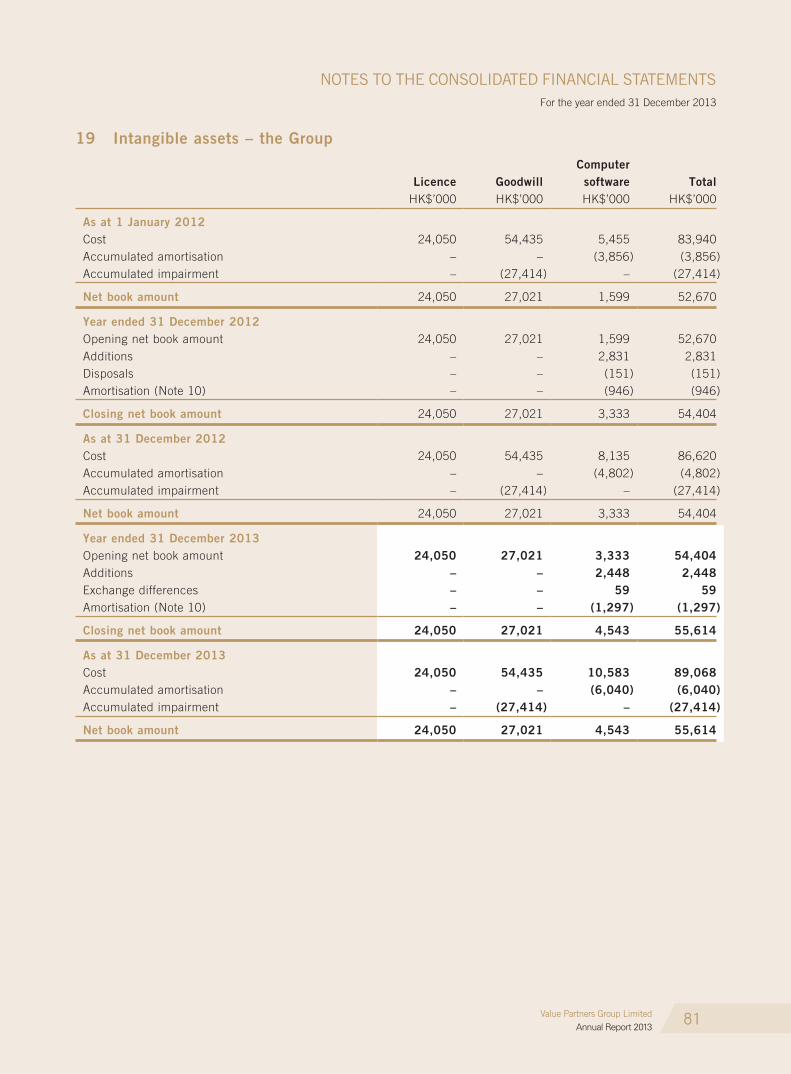
81
NOTES TO THE CONSOLIDATED FINANCIAL STATEMENTSFor the year ended 31 December 2013
Value Partners Group LimitedAnnual Report 2013
19 Intangible assets – the group
Licence goodwillComputer
software TotalHK$’000 HK$’000 HK$’000 HK$’000
As at 1 January 2012Cost 24,050 54,435 5,455 83,940Accumulated amortisation – – (3,856) (3,856)Accumulated impairment – (27,414) – (27,414)
Net book amount 24,050 27,021 1,599 52,670
Year ended 31 December 2012Opening net book amount 24,050 27,021 1,599 52,670Additions – – 2,831 2,831Disposals – – (151) (151)Amortisation (Note 10) – – (946) (946)
Closing net book amount 24,050 27,021 3,333 54,404
As at 31 December 2012Cost 24,050 54,435 8,135 86,620Accumulated amortisation – – (4,802) (4,802)Accumulated impairment – (27,414) – (27,414)
Net book amount 24,050 27,021 3,333 54,404
Year ended 31 December 2013Opening net book amount 24,050 27,021 3,333 54,404Additions – – 2,448 2,448Exchange differences – – 59 59Amortisation (Note 10) – – (1,297) (1,297)
Closing net book amount 24,050 27,021 4,543 55,614
As at 31 December 2013Cost 24,050 54,435 10,583 89,068Accumulated amortisation – – (6,040) (6,040)Accumulated impairment – (27,414) – (27,414)
Net book amount 24,050 27,021 4,543 55,614
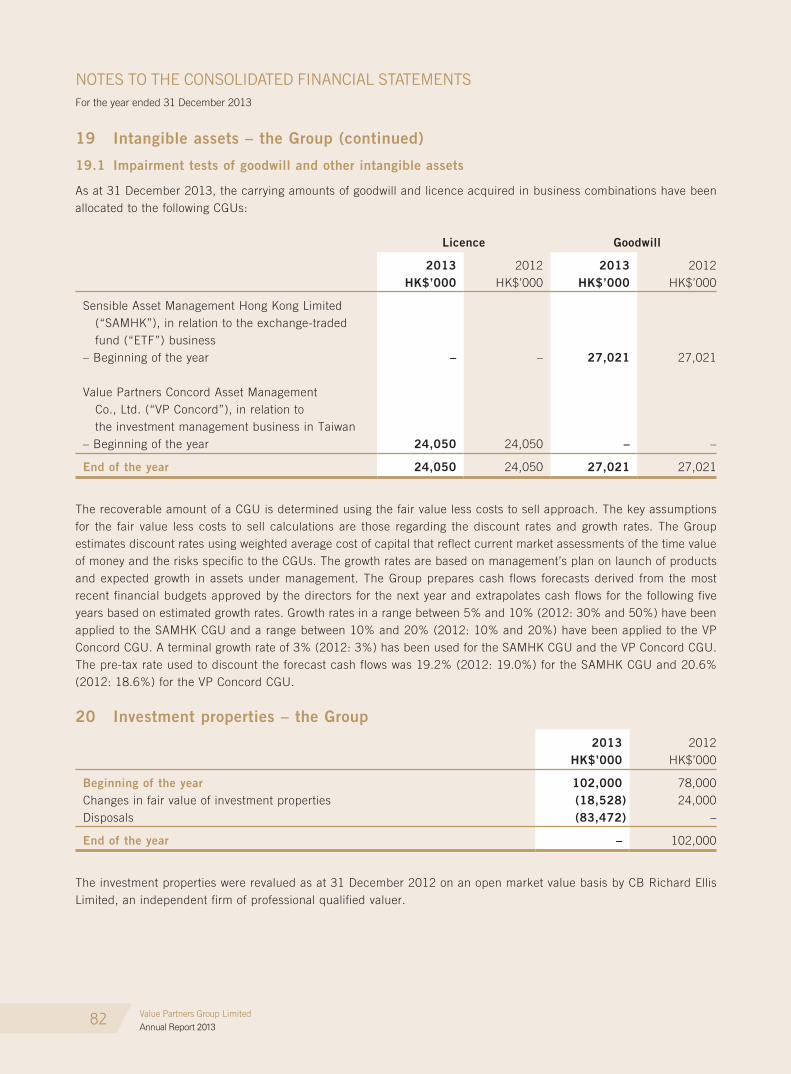
82
NOTES TO THE CONSOLIDATED FINANCIAL STATEMENTSFor the year ended 31 December 2013
Value Partners Group LimitedAnnual Report 2013
19 Intangible assets – the group (continued)
19.1 Impairment tests of goodwill and other intangible assets
As at 31 December 2013, the carrying amounts of goodwill and licence acquired in business combinations have been allocated to the following CGUs:
Licence goodwill
2013 2012 2013 2012HK$’000 HK$’000 HK$’000 HK$’000
Sensible Asset Management Hong Kong Limited (“SAMHK”), in relation to the exchange-traded fund (“ETF”) business– Beginning of the year – – 27,021 27,021
Value Partners Concord Asset Management Co., Ltd. (“VP Concord”), in relation to the investment management business in Taiwan– Beginning of the year 24,050 24,050 – –
End of the year 24,050 24,050 27,021 27,021
The recoverable amount of a CGU is determined using the fair value less costs to sell approach. The key assumptions for the fair value less costs to sell calculations are those regarding the discount rates and growth rates. The Group estimates discount rates using weighted average cost of capital that reflect current market assessments of the time value of money and the risks specific to the CGUs. The growth rates are based on management’s plan on launch of products and expected growth in assets under management. The Group prepares cash flows forecasts derived from the most recent financial budgets approved by the directors for the next year and extrapolates cash flows for the following five years based on estimated growth rates. Growth rates in a range between 5% and 10% (2012: 30% and 50%) have been applied to the SAMHK CGU and a range between 10% and 20% (2012: 10% and 20%) have been applied to the VP Concord CGU. A terminal growth rate of 3% (2012: 3%) has been used for the SAMHK CGU and the VP Concord CGU. The pre-tax rate used to discount the forecast cash flows was 19.2% (2012: 19.0%) for the SAMHK CGU and 20.6% (2012: 18.6%) for the VP Concord CGU.
20 Investment properties – the group
2013 2012HK$’000 HK$’000
Beginning of the year 102,000 78,000Changes in fair value of investment properties (18,528) 24,000Disposals (83,472) –
End of the year – 102,000
The investment properties were revalued as at 31 December 2012 on an open market value basis by CB Richard Ellis Limited, an independent firm of professional qualified valuer.
83
NOTES TO THE CONSOLIDATED FINANCIAL STATEMENTSFor the year ended 31 December 2013
Value Partners Group LimitedAnnual Report 2013
21 Investment in an associate – the group
2013 2012HK$’000 HK$’000
Beginning of the year 90,944 –Acquisition – 49,918Capital injection – 57,178Share of results – gain/(loss) after tax 1,181 (16,152)
End of the year 92,125 90,944
Details of the associate of the Group which was indirectly held are as follows:
Interest held
Name Place of incorporation 2013 2012
Value Partners Goldstate Fund Management Company Limited (“VP Goldstate”)
The People’s Republic of China49% 49%
On 26 March 2012, the Group acquired 49% interests in VP Goldstate, a licensed mutual fund management company headquartered in Shanghai, for a consideration of HK$49,918,000. A goodwill amounted to HK$14,460,000 was generated from such acquisition transaction and was recognized within “Investment in an associate” in the consolidated balance sheet. As at 31 December 2013 and 2012, there was no impairment loss on such goodwill. In October 2012, the Group has further injected HK$57,178,000 to VP Goldstate.
Although the remaining 51% interests are held by one shareholder, the Group has the ability to exercise significant influence over VP Goldstate through representation on its Board of Directors.
The associate is individually immaterial and is accounted for using equity method. The Group’s interest in the associate is summarized below:
2013 2012HK$’000 HK$’000
Carrying amount 92,125 90,944
Share of profit/(loss) from continuing activities and total comprehensive income 1,181 (16,152)
The Group invested in certain investment funds that it manages and applied the measurement in accordance with accounting policies stated in Note 2.3 above.
Details of such investment funds are summarized in Note 22.
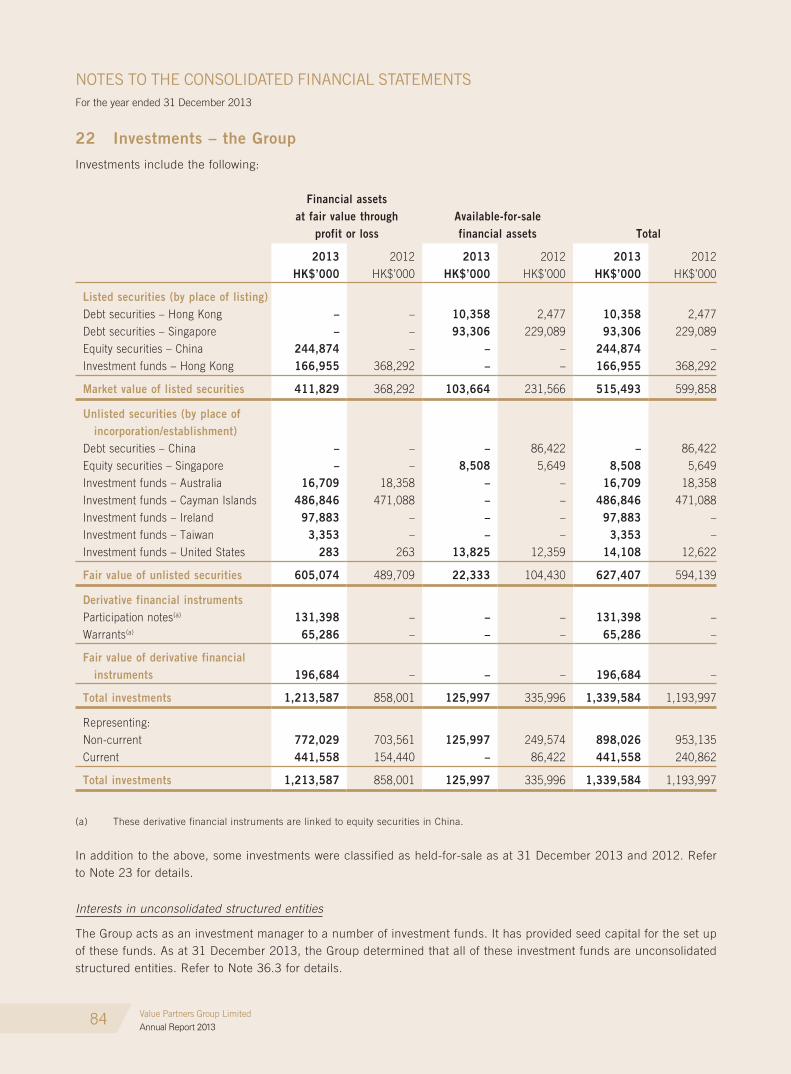
84
NOTES TO THE CONSOLIDATED FINANCIAL STATEMENTSFor the year ended 31 December 2013
Value Partners Group LimitedAnnual Report 2013
22 Investments – the group
Investments include the following:
Financial assets at fair value through
profit or lossAvailable-for-sale financial assets Total
2013 2012 2013 2012 2013 2012HK$’000 HK$’000 HK$’000 HK$’000 HK$’000 HK$’000
Listed securities (by place of listing)Debt securities – Hong Kong – – 10,358 2,477 10,358 2,477Debt securities – Singapore – – 93,306 229,089 93,306 229,089Equity securities – China 244,874 – – – 244,874 –Investment funds – Hong Kong 166,955 368,292 – – 166,955 368,292
Market value of listed securities 411,829 368,292 103,664 231,566 515,493 599,858
Unlisted securities (by place of incorporation/establishment)Debt securities – China – – – 86,422 – 86,422Equity securities – Singapore – – 8,508 5,649 8,508 5,649Investment funds – Australia 16,709 18,358 – – 16,709 18,358Investment funds – Cayman Islands 486,846 471,088 – – 486,846 471,088Investment funds – Ireland 97,883 – – – 97,883 –Investment funds – Taiwan 3,353 – – – 3,353 –Investment funds – United States 283 263 13,825 12,359 14,108 12,622
Fair value of unlisted securities 605,074 489,709 22,333 104,430 627,407 594,139
Derivative financial instrumentsParticipation notes(a) 131,398 – – – 131,398 –Warrants(a) 65,286 – – – 65,286 –
Fair value of derivative financial instruments 196,684 – – – 196,684 –
Total investments 1,213,587 858,001 125,997 335,996 1,339,584 1,193,997
Representing:Non-current 772,029 703,561 125,997 249,574 898,026 953,135Current 441,558 154,440 – 86,422 441,558 240,862
Total investments 1,213,587 858,001 125,997 335,996 1,339,584 1,193,997
(a) These derivative financial instruments are linked to equity securities in China.
In addition to the above, some investments were classified as held-for-sale as at 31 December 2013 and 2012. Refer to Note 23 for details.
Interests in unconsolidated structured entities
The Group acts as an investment manager to a number of investment funds. It has provided seed capital for the set up of these funds. As at 31 December 2013, the Group determined that all of these investment funds are unconsolidated structured entities. Refer to Note 36.3 for details.

85
NOTES TO THE CONSOLIDATED FINANCIAL STATEMENTSFor the year ended 31 December 2013
Value Partners Group LimitedAnnual Report 2013
22 Investments – the group (continued)
The maximum exposure to loss to all interests in structured entities is the carrying value of the investments in investment funds (refer to Note 36.3) and fees receivable as shown in the consolidated balance sheet. The size of the investment funds ranges from US$0.3 million to US$1.7 billion. During the year, the Group did not provide financial support to unconsolidated structured entities and has no intention of providing financial or other support.
Investments are denominated in the following currencies:
2013 2012HK$’000 HK$’000
Australian dollar 16,849 18,358Hong Kong dollar 343,729 368,292Renminbi 244,874 138,218Singapore dollar 8,509 5,649Taiwan dollar 3,353 –United States dollar 721,993 663,480Others 277 –
Total investments 1,339,584 1,193,997
The credit quality of the investments in debt securities by reference to Standard & Poor’s or Fitch Ratings credit ratings is as follows:
2013 2012HK$’000 HK$’000
A+ – 2,477B+ 26,575 98,709BB 22,266 45,338BB- 36,339 –Unrated 18,484 171,464
Total investments in debt securities 103,664 317,988
The maximum exposure to credit risk at the reporting date is the carrying amount of investments in debt securities.
22.1 Held-to-maturity financial assets
The movement of held-to-maturity financial assets is as follows:
2013 2012HK$’000 HK$’000
Beginning of the year – 146,195Additions – 244,693Disposals – (106,620)Amortisation – 6,965Reclassified to available-for-sale financial assets (Note 22.2) – (291,233)
End of the year – –
During 2012, the Group sold some held-to-maturity financial assets and recorded gains of HK$13,633,000. The Group subsequently reclassified all the remaining held-to-maturity financial assets to available-for-sale financial assets.

86
NOTES TO THE CONSOLIDATED FINANCIAL STATEMENTSFor the year ended 31 December 2013
Value Partners Group LimitedAnnual Report 2013
22 Investments – the group (continued)22.2 Available-for-sale financial assets
The movement of available-for-sale financial assets is as follows:
2013 2012HK$’000 HK$’000
Beginning of the year 335,996 12,054Additions 131,916 142,307Reclassified from held-to-maturity financial assets (Note 22.1) – 291,233Disposals (335,766) (128,880)Fair value (losses)/gains (Notes 13 and 29) (5,000) 18,673Amortisation (1,149) 609
End of the year 125,997 335,996
There was no impairment provision on available-for-sale financial assets as at 31 December 2013 (2012: Nil).
23 Investments held-for-sale – the groupThe Group classified the following interests in investment funds as held-for-sale as the Group intends to market these funds and dilute its holdings as soon as practically possible to a level where its aggregate economic interest does not constitute a control.
Fair value
2013 2012HK$’000 HK$’000
Investment funds – Cayman Islands 197,160 133,262Investment funds – Ireland – 85,638Investment funds – Taiwan 29,622 26,999
Total investments held-for-sale 226,782 245,899
As at 31 December 2013 and 2012, the major assets of the above funds were securities.
Income recognized in other (losses)/gains – net relating to investments held-for-sale
2013 2012HK$’000 HK$’000
Unrealized gains on investments held-for-sale 5,783 23,455
24 Fees receivable – the group
The carrying amounts of fees receivable approximate their fair value due to the short-term maturity. The maximum exposure to credit risk at the reporting date is the carrying amounts of the fees receivable. The Group did not hold any collateral as security as at 31 December 2013 (2012: Nil).
Fees receivable from investment management activities are mainly due at the end of the relevant valuation period of the investment funds and managed accounts. However, some of these fees receivable are only due after the relevant valuation period as a result of credit periods granted to certain investment funds and managed accounts which are generally within one month. The ageing analysis of fees receivable that were past due but not impaired is as follows.
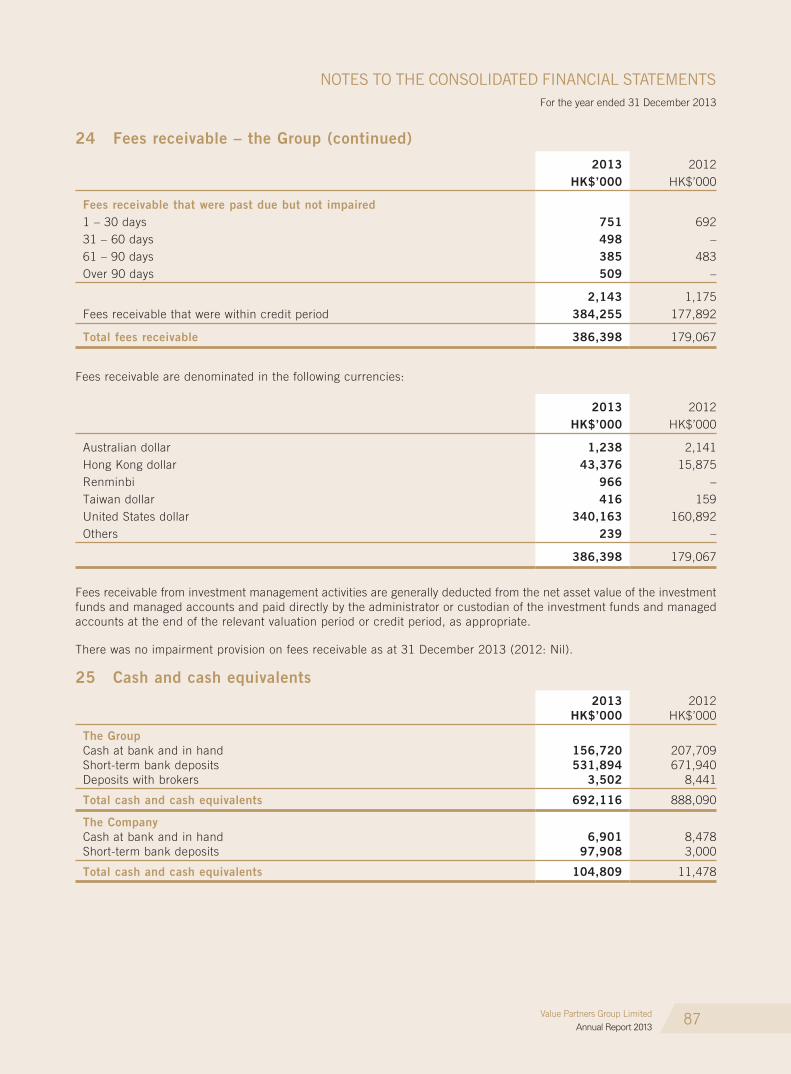
87
NOTES TO THE CONSOLIDATED FINANCIAL STATEMENTSFor the year ended 31 December 2013
Value Partners Group LimitedAnnual Report 2013
24 Fees receivable – the group (continued)
2013 2012HK$’000 HK$’000
Fees receivable that were past due but not impaired1 – 30 days 751 69231 – 60 days 498 –61 – 90 days 385 483Over 90 days 509 –
2,143 1,175Fees receivable that were within credit period 384,255 177,892
Total fees receivable 386,398 179,067
Fees receivable are denominated in the following currencies:
2013 2012HK$’000 HK$’000
Australian dollar 1,238 2,141Hong Kong dollar 43,376 15,875Renminbi 966 –Taiwan dollar 416 159United States dollar 340,163 160,892Others 239 –
386,398 179,067
Fees receivable from investment management activities are generally deducted from the net asset value of the investment funds and managed accounts and paid directly by the administrator or custodian of the investment funds and managed accounts at the end of the relevant valuation period or credit period, as appropriate.
There was no impairment provision on fees receivable as at 31 December 2013 (2012: Nil).
25 Cash and cash equivalents2013 2012
HK$’000 HK$’000
The groupCash at bank and in hand 156,720 207,709Short-term bank deposits 531,894 671,940Deposits with brokers 3,502 8,441
Total cash and cash equivalents 692,116 888,090
The CompanyCash at bank and in hand 6,901 8,478Short-term bank deposits 97,908 3,000
Total cash and cash equivalents 104,809 11,478
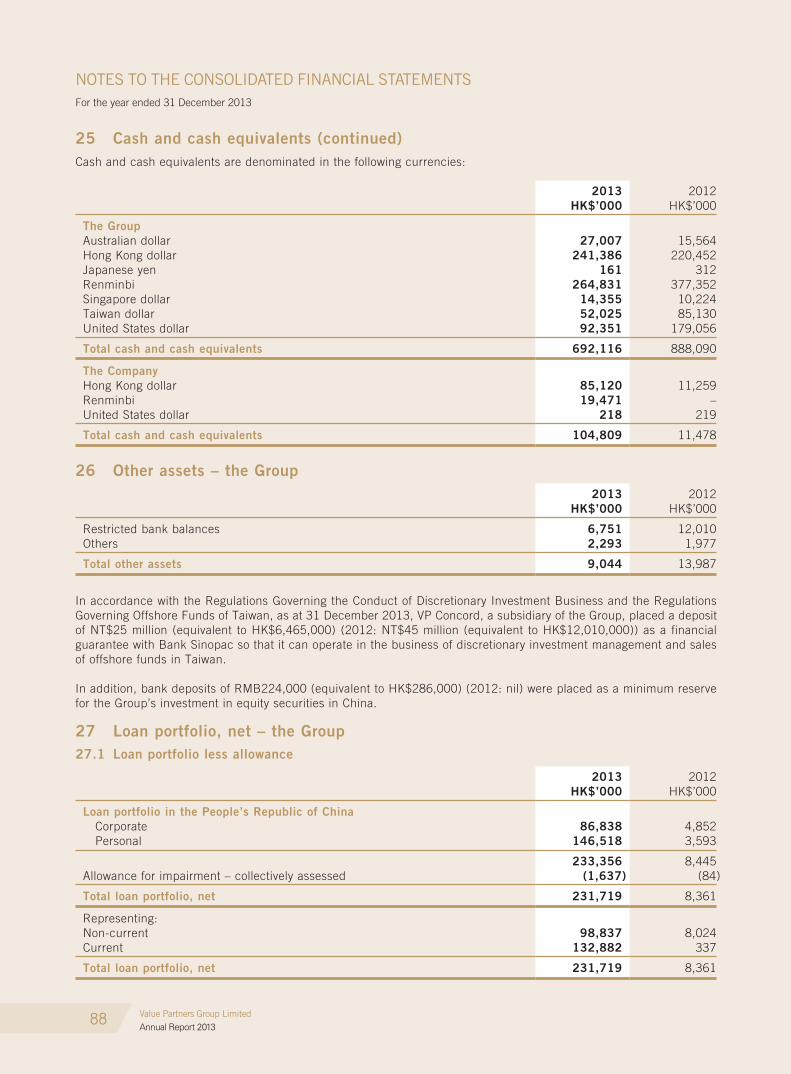
88
NOTES TO THE CONSOLIDATED FINANCIAL STATEMENTSFor the year ended 31 December 2013
Value Partners Group LimitedAnnual Report 2013
25 Cash and cash equivalents (continued)Cash and cash equivalents are denominated in the following currencies:
2013 2012HK$’000 HK$’000
The groupAustralian dollar 27,007 15,564Hong Kong dollar 241,386 220,452Japanese yen 161 312Renminbi 264,831 377,352Singapore dollar 14,355 10,224Taiwan dollar 52,025 85,130United States dollar 92,351 179,056
Total cash and cash equivalents 692,116 888,090
The CompanyHong Kong dollar 85,120 11,259Renminbi 19,471 –United States dollar 218 219
Total cash and cash equivalents 104,809 11,478
26 Other assets – the group2013 2012
HK$’000 HK$’000
Restricted bank balances 6,751 12,010Others 2,293 1,977
Total other assets 9,044 13,987
In accordance with the Regulations Governing the Conduct of Discretionary Investment Business and the Regulations Governing Offshore Funds of Taiwan, as at 31 December 2013, VP Concord, a subsidiary of the Group, placed a deposit of NT$25 million (equivalent to HK$6,465,000) (2012: NT$45 million (equivalent to HK$12,010,000)) as a financial guarantee with Bank Sinopac so that it can operate in the business of discretionary investment management and sales of offshore funds in Taiwan.
In addition, bank deposits of RMB224,000 (equivalent to HK$286,000) (2012: nil) were placed as a minimum reserve for the Group’s investment in equity securities in China.
27 Loan portfolio, net – the group27.1 Loan portfolio less allowance
2013 2012HK$’000 HK$’000
Loan portfolio in the People’s Republic of China Corporate 86,838 4,852 Personal 146,518 3,593
233,356 8,445Allowance for impairment – collectively assessed (1,637) (84)
Total loan portfolio, net 231,719 8,361
Representing:Non-current 98,837 8,024Current 132,882 337
Total loan portfolio, net 231,719 8,361
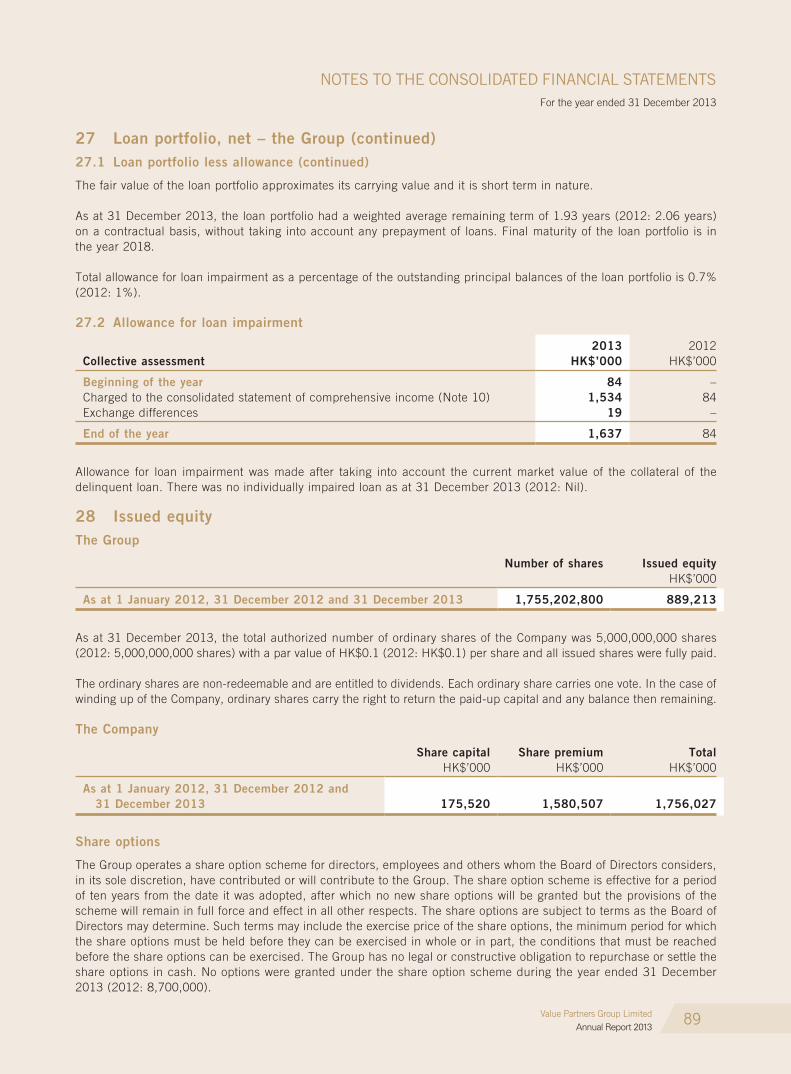
89
NOTES TO THE CONSOLIDATED FINANCIAL STATEMENTSFor the year ended 31 December 2013
Value Partners Group LimitedAnnual Report 2013
27 Loan portfolio, net – the group (continued)27.1 Loan portfolio less allowance (continued)
The fair value of the loan portfolio approximates its carrying value and it is short term in nature.
As at 31 December 2013, the loan portfolio had a weighted average remaining term of 1.93 years (2012: 2.06 years) on a contractual basis, without taking into account any prepayment of loans. Final maturity of the loan portfolio is in the year 2018.
Total allowance for loan impairment as a percentage of the outstanding principal balances of the loan portfolio is 0.7% (2012: 1%).
27.2 Allowance for loan impairment
2013 2012Collective assessment HK$’000 HK$’000
Beginning of the year 84 –Charged to the consolidated statement of comprehensive income (Note 10) 1,534 84Exchange differences 19 –
End of the year 1,637 84
Allowance for loan impairment was made after taking into account the current market value of the collateral of the delinquent loan. There was no individually impaired loan as at 31 December 2013 (2012: Nil).
28 Issued equityThe group
Number of shares Issued equityHK$’000
As at 1 January 2012, 31 December 2012 and 31 December 2013 1,755,202,800 889,213
As at 31 December 2013, the total authorized number of ordinary shares of the Company was 5,000,000,000 shares (2012: 5,000,000,000 shares) with a par value of HK$0.1 (2012: HK$0.1) per share and all issued shares were fully paid.
The ordinary shares are non-redeemable and are entitled to dividends. Each ordinary share carries one vote. In the case of winding up of the Company, ordinary shares carry the right to return the paid-up capital and any balance then remaining.
The Company
Share capital Share premium TotalHK$’000 HK$’000 HK$’000
As at 1 January 2012, 31 December 2012 and 31 December 2013 175,520 1,580,507 1,756,027
Share options
The Group operates a share option scheme for directors, employees and others whom the Board of Directors considers, in its sole discretion, have contributed or will contribute to the Group. The share option scheme is effective for a period of ten years from the date it was adopted, after which no new share options will be granted but the provisions of the scheme will remain in full force and effect in all other respects. The share options are subject to terms as the Board of Directors may determine. Such terms may include the exercise price of the share options, the minimum period for which the share options must be held before they can be exercised in whole or in part, the conditions that must be reached before the share options can be exercised. The Group has no legal or constructive obligation to repurchase or settle the share options in cash. No options were granted under the share option scheme during the year ended 31 December 2013 (2012: 8,700,000).
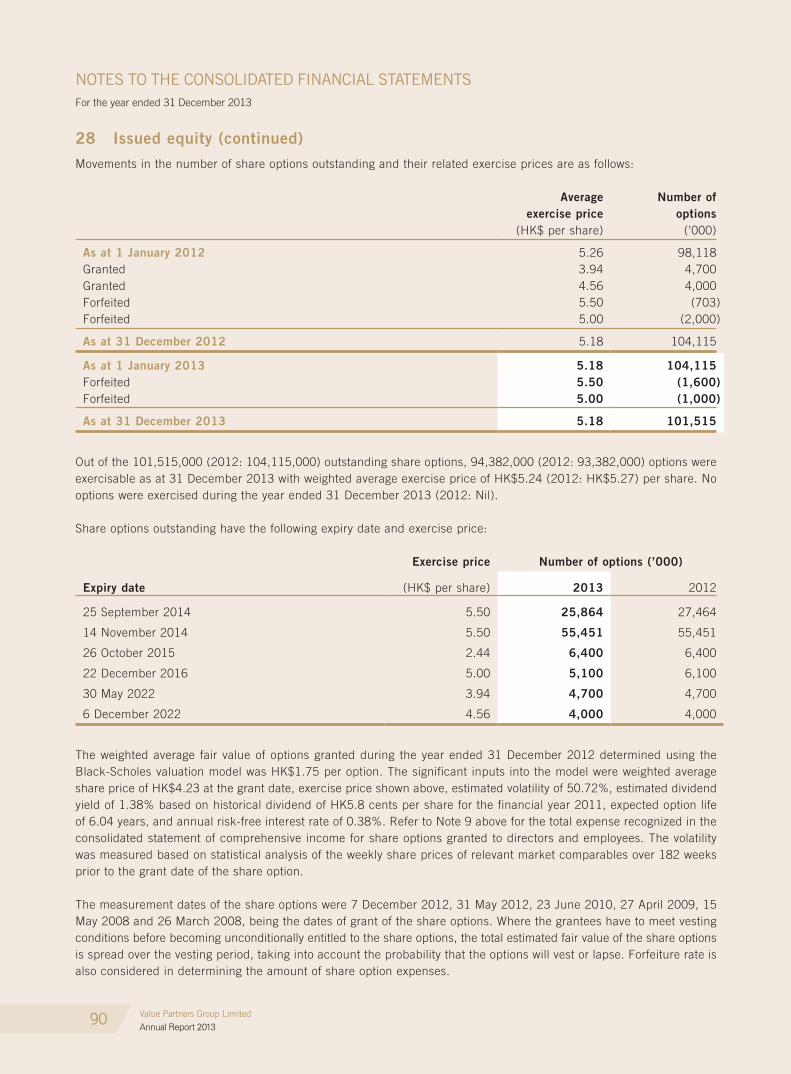
90
NOTES TO THE CONSOLIDATED FINANCIAL STATEMENTSFor the year ended 31 December 2013
Value Partners Group LimitedAnnual Report 2013
28 Issued equity (continued)
Movements in the number of share options outstanding and their related exercise prices are as follows:
Averageexercise price
Number ofoptions
(HK$ per share) (’000)
As at 1 January 2012 5.26 98,118Granted 3.94 4,700Granted 4.56 4,000Forfeited 5.50 (703)Forfeited 5.00 (2,000)
As at 31 December 2012 5.18 104,115
As at 1 January 2013 5.18 104,115Forfeited 5.50 (1,600)Forfeited 5.00 (1,000)
As at 31 December 2013 5.18 101,515
Out of the 101,515,000 (2012: 104,115,000) outstanding share options, 94,382,000 (2012: 93,382,000) options were exercisable as at 31 December 2013 with weighted average exercise price of HK$5.24 (2012: HK$5.27) per share. No options were exercised during the year ended 31 December 2013 (2012: Nil).
Share options outstanding have the following expiry date and exercise price:
Exercise price Number of options (’000)
Expiry date (HK$ per share) 2013 2012
25 September 2014 5.50 25,864 27,464
14 November 2014 5.50 55,451 55,451
26 October 2015 2.44 6,400 6,400
22 December 2016 5.00 5,100 6,100
30 May 2022 3.94 4,700 4,700
6 December 2022 4.56 4,000 4,000
The weighted average fair value of options granted during the year ended 31 December 2012 determined using the Black-Scholes valuation model was HK$1.75 per option. The significant inputs into the model were weighted average share price of HK$4.23 at the grant date, exercise price shown above, estimated volatility of 50.72%, estimated dividend yield of 1.38% based on historical dividend of HK5.8 cents per share for the financial year 2011, expected option life of 6.04 years, and annual risk-free interest rate of 0.38%. Refer to Note 9 above for the total expense recognized in the consolidated statement of comprehensive income for share options granted to directors and employees. The volatility was measured based on statistical analysis of the weekly share prices of relevant market comparables over 182 weeks prior to the grant date of the share option.
The measurement dates of the share options were 7 December 2012, 31 May 2012, 23 June 2010, 27 April 2009, 15 May 2008 and 26 March 2008, being the dates of grant of the share options. Where the grantees have to meet vesting conditions before becoming unconditionally entitled to the share options, the total estimated fair value of the share options is spread over the vesting period, taking into account the probability that the options will vest or lapse. Forfeiture rate is also considered in determining the amount of share option expenses.
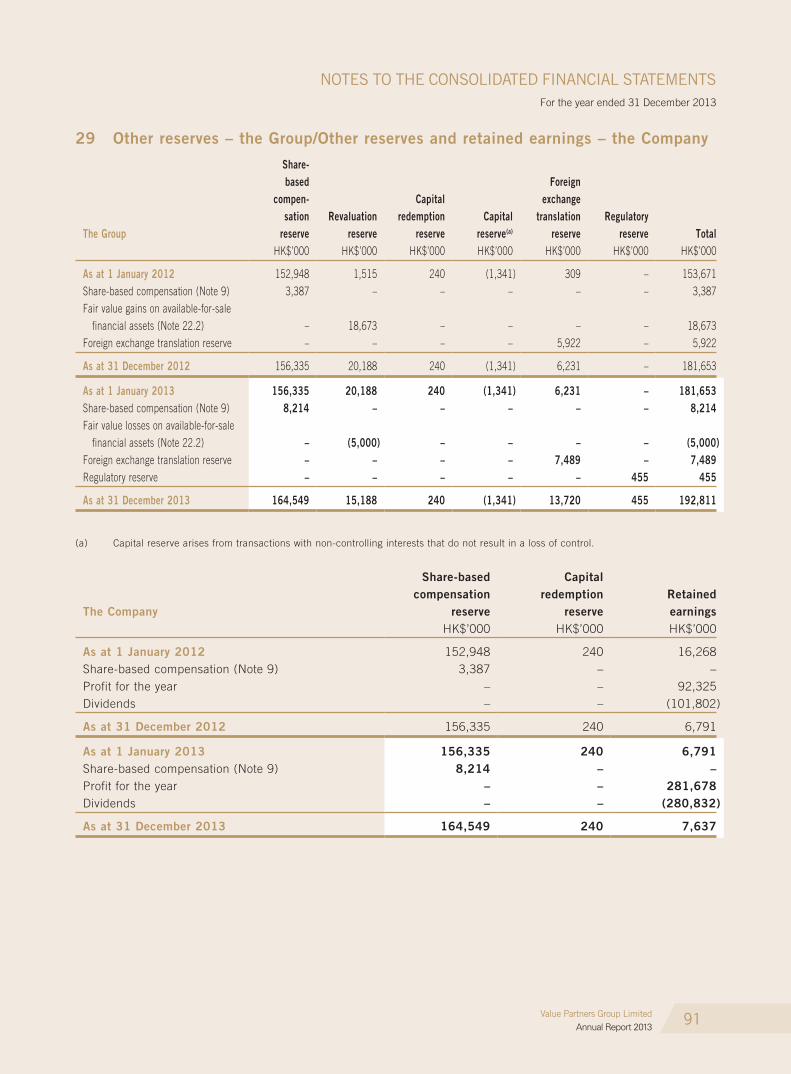
91
NOTES TO THE CONSOLIDATED FINANCIAL STATEMENTSFor the year ended 31 December 2013
Value Partners Group LimitedAnnual Report 2013
29 Other reserves – the group/Other reserves and retained earnings – the Company
The group
Share-based
compen-sation
reserveRevaluation
reserve
Capitalredemption
reserveCapital
reserve(a)
Foreignexchange
translationreserve
Regulatoryreserve Total
HK$’000 HK$’000 HK$’000 HK$’000 HK$’000 HK$’000 HK$’000
As at 1 January 2012 152,948 1,515 240 (1,341) 309 – 153,671Share-based compensation (Note 9) 3,387 – – – – – 3,387Fair value gains on available-for-sale financial assets (Note 22.2) – 18,673 – – – – 18,673Foreign exchange translation reserve – – – – 5,922 – 5,922
As at 31 December 2012 156,335 20,188 240 (1,341) 6,231 – 181,653
As at 1 January 2013 156,335 20,188 240 (1,341) 6,231 – 181,653Share-based compensation (Note 9) 8,214 – – – – – 8,214Fair value losses on available-for-sale financial assets (Note 22.2) – (5,000) – – – – (5,000)Foreign exchange translation reserve – – – – 7,489 – 7,489Regulatory reserve – – – – – 455 455
As at 31 December 2013 164,549 15,188 240 (1,341) 13,720 455 192,811
(a) Capital reserve arises from transactions with non-controlling interests that do not result in a loss of control.
The Company
Share-basedcompensation
reserve
Capitalredemption
reserveRetainedearnings
HK$’000 HK$’000 HK$’000
As at 1 January 2012 152,948 240 16,268Share-based compensation (Note 9) 3,387 – –Profit for the year – – 92,325Dividends – – (101,802)
As at 31 December 2012 156,335 240 6,791
As at 1 January 2013 156,335 240 6,791Share-based compensation (Note 9) 8,214 – –Profit for the year – – 281,678Dividends – – (280,832)
As at 31 December 2013 164,549 240 7,637

92
NOTES TO THE CONSOLIDATED FINANCIAL STATEMENTSFor the year ended 31 December 2013
Value Partners Group LimitedAnnual Report 2013
30 Deferred tax – the group
The movement of deferred tax assets is as follows:
Accelerated tax depreciation
HK$’000
As at 1 January 2012 328Credited to the consolidated statement of comprehensive income (Note 12) 68Exchange differences 3
As at 31 December 2012 399
As at 1 January 2013 399Credited to the consolidated statement of comprehensive income (Note 12) 249Debited to regulatory reserve (94)
As at 31 December 2013 554
Deferred tax assets are recognized for tax loss carry-forwards to the extent that the realization of the related tax benefit through future taxable profits is probable. As at 31 December 2013, the Group did not have any tax losses that can be carried forward against future taxable profits (2012: Nil).
31 Distribution fee expenses payable – the group
The carrying amounts of distribution fee expenses payable approximate their fair value due to the short-term maturity. The ageing analysis of distribution fee expenses payable is as follows:
2013 2012HK$’000 HK$’000
0 – 30 days 53,194 28,61031 – 60 days 797 13661 – 90 days 811 –Over 90 days – 169
Total distribution fee expenses payable 54,802 28,915
Distribution fee expenses payable are denominated in the following currencies:
2013 2012HK$’000 HK$’000
Taiwan dollar 89 18United States dollar 54,713 28,897
Total distribution fee expenses payable 54,802 28,915
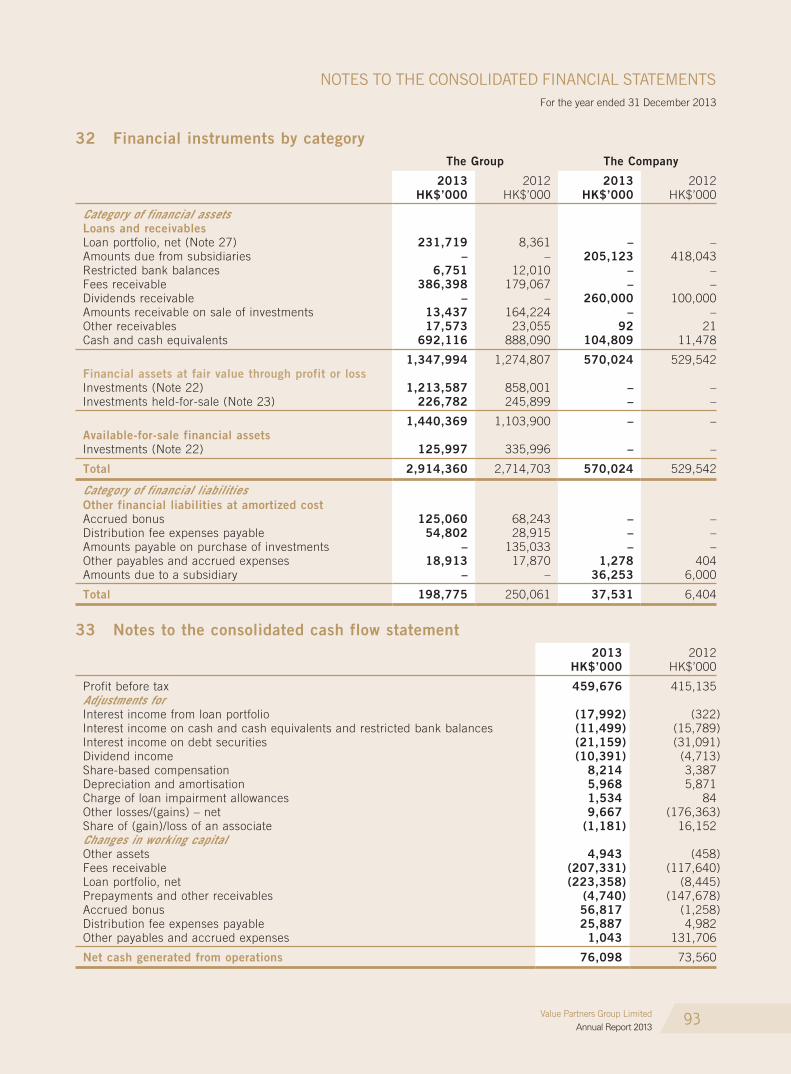
93
NOTES TO THE CONSOLIDATED FINANCIAL STATEMENTSFor the year ended 31 December 2013
Value Partners Group LimitedAnnual Report 2013
32 Financial instruments by categoryThe group The Company
2013 2012 2013 2012HK$’000 HK$’000 HK$’000 HK$’000
Category of financial assetsLoans and receivablesLoan portfolio, net (Note 27) 231,719 8,361 – –Amounts due from subsidiaries – – 205,123 418,043Restricted bank balances 6,751 12,010 – –Fees receivable 386,398 179,067 – –Dividends receivable – – 260,000 100,000Amounts receivable on sale of investments 13,437 164,224 – –Other receivables 17,573 23,055 92 21Cash and cash equivalents 692,116 888,090 104,809 11,478
1,347,994 1,274,807 570,024 529,542Financial assets at fair value through profit or lossInvestments (Note 22) 1,213,587 858,001 – –Investments held-for-sale (Note 23) 226,782 245,899 – –
1,440,369 1,103,900 – –Available-for-sale financial assetsInvestments (Note 22) 125,997 335,996 – –
Total 2,914,360 2,714,703 570,024 529,542
Category of financial liabilitiesOther financial liabilities at amortized costAccrued bonus 125,060 68,243 – –Distribution fee expenses payable 54,802 28,915 – –Amounts payable on purchase of investments – 135,033 – –Other payables and accrued expenses 18,913 17,870 1,278 404Amounts due to a subsidiary – – 36,253 6,000
Total 198,775 250,061 37,531 6,404
33 Notes to the consolidated cash flow statement2013 2012
HK$’000 HK$’000
Profit before tax 459,676 415,135Adjustments forInterest income from loan portfolio (17,992) (322)Interest income on cash and cash equivalents and restricted bank balances (11,499) (15,789)Interest income on debt securities (21,159) (31,091)Dividend income (10,391) (4,713)Share-based compensation 8,214 3,387Depreciation and amortisation 5,968 5,871Charge of loan impairment allowances 1,534 84Other losses/(gains) – net 9,667 (176,363)Share of (gain)/loss of an associate (1,181) 16,152Changes in working capitalOther assets 4,943 (458)Fees receivable (207,331) (117,640)Loan portfolio, net (223,358) (8,445)Prepayments and other receivables (4,740) (147,678)Accrued bonus 56,817 (1,258)Distribution fee expenses payable 25,887 4,982Other payables and accrued expenses 1,043 131,706
Net cash generated from operations 76,098 73,560

94
NOTES TO THE CONSOLIDATED FINANCIAL STATEMENTSFor the year ended 31 December 2013
Value Partners Group LimitedAnnual Report 2013
34 Commitments
34.1 Operating lease commitments
The group as the lessee
The Group leases various offices and office equipment under non-cancellable operating lease agreements. The lease terms are between two and five years. The majority of lease agreements are renewable at the end of the lease period at market rate. The future aggregate minimum lease payments under non-cancellable operating leases are as follows:
2013 2012HK$’000 HK$’000
Not later than one year 14,760 12,569Later than one year and not later than five years 29,194 6,349
Total operating lease commitments 43,954 18,918
The group as the lessor
The Group has future aggregate minimum lease receipts under non-cancellable operating leases as follows:
2013 2012HK$’000 HK$’000
Not later than one year – 2,379Later than one year and not later than five years – 694
Total operating lease commitments – 3,073
35 Contingencies
The Group has contingent assets in respect of performance fees and contingent liabilities in respect of the performance fee element of distribution fee expenses arising in the ordinary course of business.
35.1 Contingent assets
Performance fees for non-private equity fund products for each performance period are generally calculated annually with reference to a performance fee valuation day. Performance fees for private equity fund products are generally calculated at the end of the period over which the performance is measured (performance fee valuation day) and this is generally the end of the life of the private equity fund or upon each successful divestment of an investment of the private equity fund. Performance fees are only recognized when they are earned by the Group.
As a result, as at 31 December 2013 and 2012, performance fees in respect of performance periods ending on a performance fee valuation day not falling within the corresponding year have not been recognized. These performance fees may be receivable in cash if a positive performance results (for non-private equity fund products) or a performance threshold is exceeded (for private equity fund products) on the performance fee valuation days, taking into consideration the relevant basis of calculation for the investment funds and managed accounts.
95
NOTES TO THE CONSOLIDATED FINANCIAL STATEMENTSFor the year ended 31 December 2013
Value Partners Group LimitedAnnual Report 2013
35 Contingencies (continued)
35.2 Contingent liabilities
The performance fee element of distribution fee expenses is based on the performance fees earned by the Group. These distribution fee expenses are recognized when the performance fees are earned by the Group and the Group is obliged to pay the corresponding distribution fee expenses.
As a result, as at 31 December 2013 and 2012, the performance fee element of distribution fee expenses in respect of performance periods ending on a performance fee valuation day not falling within the corresponding year have not been recognized. These distribution fee expenses may be payable in cash if the performance fees are subsequently earned on the performance fee valuation days.
36 Related-party transactions
Parties are considered to be related if one party has the ability, directly or indirectly, to control the other party or exercise significant influence over the other party in making financial and operating decisions. Parties are also considered to be related if they are subject to common control or common significant influence.
Apart from those disclosed elsewhere in the consolidated financial statements, the Group has also entered into the following significant related-party transactions which, in the opinion of the directors, were carried out in the ordinary and usual course of the Group’s business.
36.1 Summary of transactions entered into during the ordinary course of business with related parties
2013 2012HK$’000 HK$’000
Rental expenses paid by a subsidiary to an associate (347) (445)
36.2 Key management compensation
Key management includes the executive directors of the Group. The compensation to key management for employee services is as follows:
2013 2012HK$’000 HK$’000
Management bonus, salaries and other short-term employee benefits 74,626 46,362Share-based compensation 4,635 1,351Pension costs – mandatory provident fund scheme 60 62
Total key management compensation 79,321 47,775
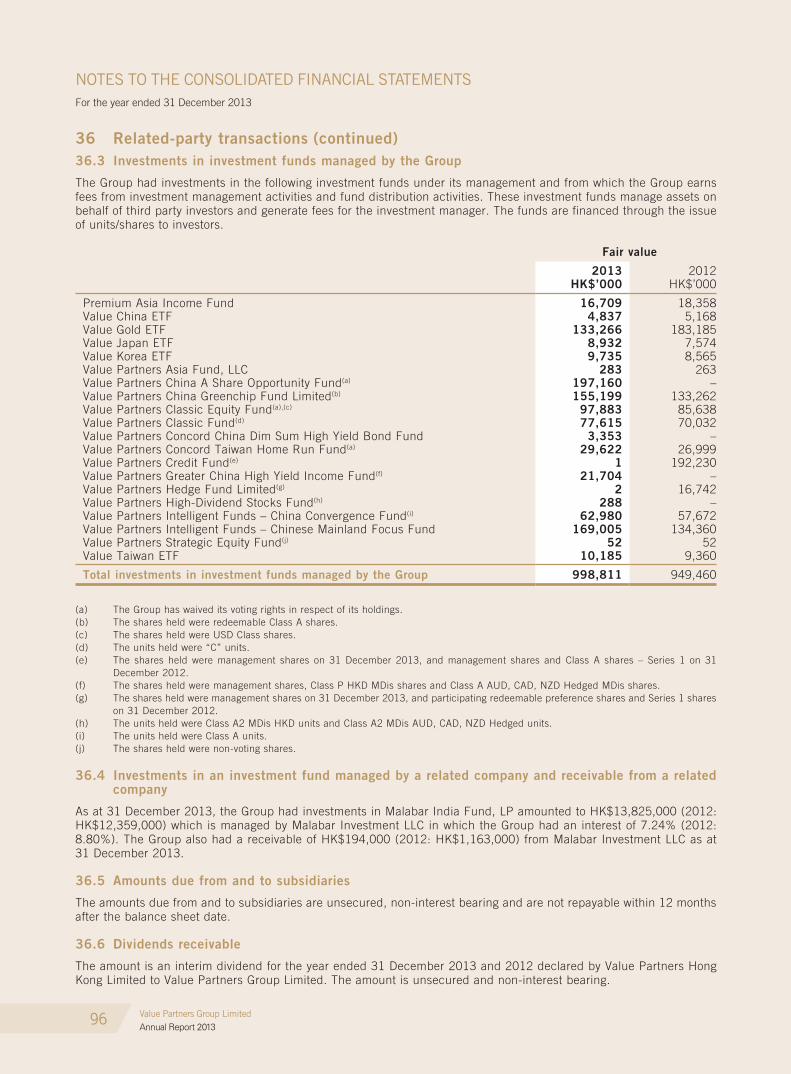
96
NOTES TO THE CONSOLIDATED FINANCIAL STATEMENTSFor the year ended 31 December 2013
Value Partners Group LimitedAnnual Report 2013
36 Related-party transactions (continued)36.3 Investments in investment funds managed by the group
The Group had investments in the following investment funds under its management and from which the Group earns fees from investment management activities and fund distribution activities. These investment funds manage assets on behalf of third party investors and generate fees for the investment manager. The funds are financed through the issue of units/shares to investors.
Fair value
2013 2012HK$’000 HK$’000
Premium Asia Income Fund 16,709 18,358Value China ETF 4,837 5,168Value Gold ETF 133,266 183,185Value Japan ETF 8,932 7,574Value Korea ETF 9,735 8,565Value Partners Asia Fund, LLC 283 263Value Partners China A Share Opportunity Fund(a) 197,160 –Value Partners China Greenchip Fund Limited(b) 155,199 133,262Value Partners Classic Equity Fund(a),(c) 97,883 85,638Value Partners Classic Fund(d) 77,615 70,032Value Partners Concord China Dim Sum High Yield Bond Fund 3,353 –Value Partners Concord Taiwan Home Run Fund(a) 29,622 26,999Value Partners Credit Fund(e) 1 192,230Value Partners Greater China High Yield Income Fund(f) 21,704 –Value Partners Hedge Fund Limited(g) 2 16,742Value Partners High-Dividend Stocks Fund(h) 288 –Value Partners Intelligent Funds – China Convergence Fund(i) 62,980 57,672Value Partners Intelligent Funds – Chinese Mainland Focus Fund 169,005 134,360Value Partners Strategic Equity Fund(j) 52 52Value Taiwan ETF 10,185 9,360
Total investments in investment funds managed by the group 998,811 949,460
(a) The Group has waived its voting rights in respect of its holdings.(b) The shares held were redeemable Class A shares.(c) The shares held were USD Class shares.(d) The units held were “C” units.(e) The shares held were management shares on 31 December 2013, and management shares and Class A shares – Series 1 on 31
December 2012.(f) The shares held were management shares, Class P HKD MDis shares and Class A AUD, CAD, NZD Hedged MDis shares.(g) The shares held were management shares on 31 December 2013, and participating redeemable preference shares and Series 1 shares
on 31 December 2012.(h) The units held were Class A2 MDis HKD units and Class A2 MDis AUD, CAD, NZD Hedged units.(i) The units held were Class A units.(j) The shares held were non-voting shares.
36.4 Investments in an investment fund managed by a related company and receivable from a related company
As at 31 December 2013, the Group had investments in Malabar India Fund, LP amounted to HK$13,825,000 (2012: HK$12,359,000) which is managed by Malabar Investment LLC in which the Group had an interest of 7.24% (2012: 8.80%). The Group also had a receivable of HK$194,000 (2012: HK$1,163,000) from Malabar Investment LLC as at 31 December 2013.
36.5 Amounts due from and to subsidiaries
The amounts due from and to subsidiaries are unsecured, non-interest bearing and are not repayable within 12 months after the balance sheet date.
36.6 Dividends receivable
The amount is an interim dividend for the year ended 31 December 2013 and 2012 declared by Value Partners Hong Kong Limited to Value Partners Group Limited. The amount is unsecured and non-interest bearing.
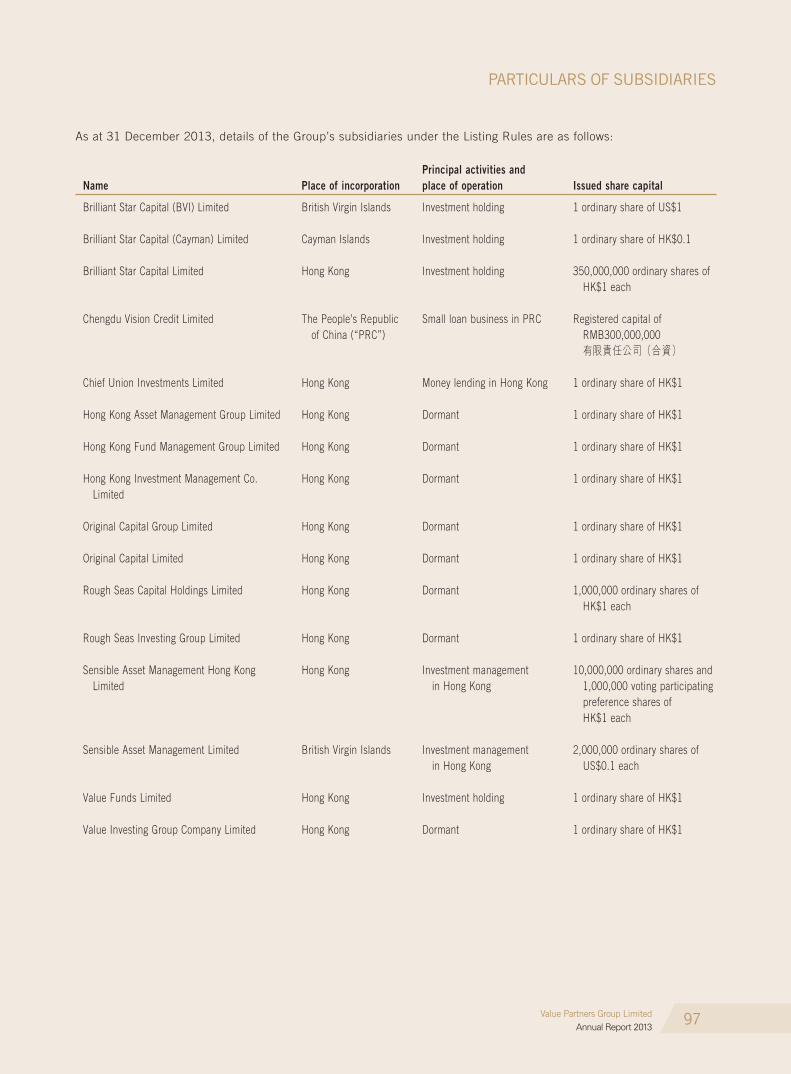
97
PARTICULARS OF SUBSIDIARIES
Value Partners Group LimitedAnnual Report 2013
As at 31 December 2013, details of the Group’s subsidiaries under the Listing Rules are as follows:
Name Place of incorporationPrincipal activities andplace of operation Issued share capital
Brilliant Star Capital (BVI) Limited British Virgin Islands Investment holding 1 ordinary share of US$1
Brilliant Star Capital (Cayman) Limited Cayman Islands Investment holding 1 ordinary share of HK$0.1
Brilliant Star Capital Limited Hong Kong Investment holding 350,000,000 ordinary shares of HK$1 each
Chengdu Vision Credit Limited The People’s Republic of China (“PRC”)
Small loan business in PRC Registered capital of RMB300,000,000 有限責任公司(合資)
Chief Union Investments Limited Hong Kong Money lending in Hong Kong 1 ordinary share of HK$1
Hong Kong Asset Management Group Limited Hong Kong Dormant 1 ordinary share of HK$1
Hong Kong Fund Management Group Limited Hong Kong Dormant 1 ordinary share of HK$1
Hong Kong Investment Management Co. Limited
Hong Kong Dormant 1 ordinary share of HK$1
Original Capital Group Limited Hong Kong Dormant 1 ordinary share of HK$1
Original Capital Limited Hong Kong Dormant 1 ordinary share of HK$1
Rough Seas Capital Holdings Limited Hong Kong Dormant 1,000,000 ordinary shares of HK$1 each
Rough Seas Investing Group Limited Hong Kong Dormant 1 ordinary share of HK$1
Sensible Asset Management Hong Kong Limited
Hong Kong Investment management in Hong Kong
10,000,000 ordinary shares and 1,000,000 voting participating preference shares of HK$1 each
Sensible Asset Management Limited British Virgin Islands Investment management in Hong Kong
2,000,000 ordinary shares of US$0.1 each
Value Funds Limited Hong Kong Investment holding 1 ordinary share of HK$1
Value Investing Group Company Limited Hong Kong Dormant 1 ordinary share of HK$1

98
PARTICULARS OF SUBSIDIARIES
Value Partners Group LimitedAnnual Report 2013
Name Place of incorporationPrincipal activities andplace of operation Issued share capital
Value Partners (Cayman GP) II Ltd Cayman Islands Managing member of three investment funds managed by Value Partners Hong Kong Limited and Value Partners Limited
1 ordinary share of US$1
Value Partners Concord Asset Management Co., Ltd.
Taiwan Investment management in Taiwan
30,000,000 ordinary shares of NT$10 each
Value Partners Corporate Consulting Limited Hong Kong Dormant 5,000,000 ordinary shares of HK$1 each
Value Partners Hong Kong Limited Hong Kong Investment management, investment holding and securities dealing in Hong Kong
385,000,000 ordinary shares of HK$1 each
Value Partners Index Services Limited Hong Kong Indexing services in Hong Kong 1 ordinary share of HK$1
Value Partners Investment Advisory Limited Hong Kong Consulting services in Hong Kong
1 ordinary share of HK$1
Value Partners Asset Management Singapore Pte. Ltd. (formerly Value Partners Investment Services Pte. Ltd.)
Singapore Dormant 150,000 ordinary shares of S$1 each
Value Partners Limited British Virgin Islands Investment management, investment holding and securities dealing in Hong Kong
11,409,459 Class A ordinary shares and 3,893,318 Class B ordinary shares of US$0.1 each
Value Partners Private Equity Limited British Virgin Islands Investment management and provision of research and investment advisory services in Hong Kong
7,000,000 ordinary shares of US$0.1 each
Valuegate Holdings Limited British Virgin Islands Trademark holding in Hong Kong
2 ordinary shares of US$1 each
Value Partners Strategic Equity Fund (Note) Cayman Islands Investment fund 1,000 voting non-participating management shares of US$1 each
上海惠理投資管理諮詢有限公司 The People’s Republic of China
Investment advisory in PRC Registered capital of RMB10,000,000 有限責任公司(獨資)
Note: Value Partners Strategic Equity Fund (“VPSEF”) is the Group’s subsidiary for the purposes of Listing Rules. In accordance with Hong
Kong Financial Reporting Standards, the interest in VPSEF is accounted for as an investment and is classified as investment at fair value
through profit & loss accounts rather than a subsidiary of the Group in view of the economic substance of the transaction and other
considerations according to the accounting standards. Therefore, VPSEF’s results are not accounted for by the Group in the consolidated
financial statements and VPSEF also is not included in the list of subsidiaries in Note 17 to the consolidated financial statements.

13


