235 13. Mathematical models of grey squirrel invasion: a case study on Anglesey HANNAH E JONES, ANDY WHITE, PETER WW LURZ, MIKE BOOTS and CRAIG M SHUTTLEWORTH Summary A spatial, stochastic model to represent the dynamics of red squirrels (Sciurus vulgaris) and grey squirrels (Sciurus carolinensis) and squirrel pox infection is developed to understand the documented replacement of red squirrels by grey squirrels which occurred on the Isle of Anglesey between approximately 1966 and 1998. The model results compare well with the observed historical field data and indicate that competition was the key process responsible for red squirrel decline. Squirrelpox virus (SQPV), which was prevalent in grey squirrels both on the mainland and latterly as they colonized Anglesey, failed to spread extensively through the resident red squirrel populations on the island. Model findings showed that disease outbreaks may occur in relatively high density red squirrel populations at the local level where reds were sympatric to greys, but at the larger scale, red squirrel densities were too low and/or too fragmented to maintain continual intra-specific spread of pathological infection. This finding has important consequences for applied conservation management and suggests that pathological squirrel pox outbreaks may be localised and the risk of extensive squirrel pox spread through low density red squirrel populations may be low. Mathematical models of the grey squirrel invasion The introduction and invasion of exotic organisms has often caused, and continues to cause, catastrophic damage to native species and ecological communities (Kolar & Lodge 2001; Ehrenfeld 2011; Simberloff 2011; Martin- Albarracin et al. 2015). Understanding the mechanisms and processes that determine successful invasion are therefore key challenges for ecological theory (Manchester & Bullock 2000; Sutherland et al. 2006). Mathematical models are important tools that can be used to understand ecological invasions. These model frameworks can underpin applied conservation efforts to protect native species and be used to develop management strategies that aim for effective temporal and spatial targeting of resources and actions. A well-known and important example of ecological invasion is the replacement of the native red squirrel (Sciurus vulgaris) by the introduced North American eastern grey squirrel (Sciurus carolinensis) in the United Kingdom (UK). Since its introduction, the grey squirrel has replaced the native red squirrel throughout most of England and Wales, and in parts of Scotland and Ireland (Bryce 1997;
Transcript
235
13. Mathematical models of grey squirrel invasion: a case study on Anglesey
HANNAH E JONES, ANDY WHITE, PETER WW LURZ, MIKE BOOTS and CRAIG M SHUTTLEWORTH
Summary
A spatial, stochastic model to represent the dynamics of red squirrels (Sciurus vulgaris) and grey squirrels (Sciurus carolinensis) and squirrel pox infection is developed to understand the documented replacement of red squirrels by grey squirrels which occurred on the Isle of Anglesey between approximately 1966 and 1998. The model results compare well with the observed historical field data and indicate that competition was the key process responsible for red squirrel decline. Squirrelpox virus (SQPV), which was prevalent in grey squirrels both on the mainland and latterly as they colonized Anglesey, failed to spread extensively through the resident red squirrel populations on the island. Model findings showed that disease outbreaks may occur in relatively high density red squirrel populations at the local level where reds were sympatric to greys, but at the larger scale, red squirrel densities were too low and/or too fragmented to maintain continual intra-specific spread of pathological infection. This finding has important consequences for applied conservation management and suggests that pathological squirrel pox outbreaks may be localised and the risk of extensive squirrel pox spread through low density red squirrel populations may be low.
Mathematical models of the grey squirrel invasion
The introduction and invasion of exotic organisms has often caused, and continues to cause, catastrophic damage to native species and ecological communities (Kolar & Lodge 2001; Ehrenfeld 2011; Simberloff 2011; Martin-Albarracin et al. 2015). Understanding the mechanisms and processes that determine successful invasion are therefore key challenges for ecological theory (Manchester & Bullock 2000; Sutherland et al. 2006). Mathematical models are important tools that can be used to understand ecological invasions. These model frameworks can underpin applied conservation efforts to protect native species and be used to develop management strategies that aim for effective temporal and spatial targeting of resources and actions.
A well-known and important example of ecological invasion is the replacement of the native red squirrel (Sciurus vulgaris) by the introduced North American eastern grey squirrel (Sciurus carolinensis) in the United Kingdom (UK). Since its introduction, the grey squirrel has replaced the native red squirrel throughout most of England and Wales, and in parts of Scotland and Ireland (Bryce 1997;
Grey Squirrels: Ecology & Management of an Invasive Species in Europe
236
O’Teangana et al. 2000; Gurnell et al. 2004; Halliwell et al 2015). Grey squirrels are now abundant throughout the UK with the exception of the Highlands of Scotland. Red squirrel populations remain widespread in northern Scotland but are often fragmented elsewhere in northern Britain. In southern and central Scotland and across northern England, red squirrel populations are typically sympatric with grey squirrels. Three small mainland populations persist in Wales, and these are largely sympatric with grey squirrels (Halliwell et al. 2015). Conserving the remaining red squirrel populations, either by preventing further range expansion of grey squirrel populations, or by removing sympatric grey squirrels are major red squirrel conservation priorities (DEFRA 2007; Parrott et al. 2009; Wales Squirrel Forum 2009; FCS 2012; Schuchert et al. 2014).
Mathematical modelling has been influential in understanding the drivers of invasion in the UK squirrel system. The first mathematical models considered the potential competitive differences between the two species (Okubo et al. 1989; Rushton et al. 1997). These studies indicated that competition could cause the replacement of red squirrels by grey squirrels, but these early models could not fit the observed expansion of grey squirrels. The model systems were modified to include the role of squirrelpox virus (SQPV; Rushton et al. 2000; Tompkins et al. 2003) – an asymptomatic infection carried by, but essentially harmless to, grey squirrels, yet producing pathological disease when spread to red squirrels (McInnes et al. 2006; Sainsbury et al. 2008). These mathematical studies, indicated that the disease was critical in the invasion process, could increase the rate of replacement of red squirrels (Tompkins et al. 2003; Rushton et al. 2006) and models that included both competitive and disease processes showed a good fit to observed data (Tompkins et al. 2003). Mathematical models therefore, played a key role in shaping the current view that squirrel pox is unequivocally linked to the replacement of red squirrels (Bosch & Lurz 2012; Lurz et al. 2015). An acceptance of the central role of squirrel pox has had an impact on both policy and practice to protect red squirrels. Consequently, a priority is given to the control of grey squirrel numbers in order to prevent the spread of squirrel pox and to protect red squirrels in priority conservation areas (such as landscape forest areas defined as ‘strongholds’) (Parrott et al. 2009; FCS 2012; Gurnell et al. 2015).
Mathematical models have been developed to assess the level of grey control required to protect red populations and to prevent the spread of squirrel pox (White et al. 2014, 2015). They have indicated that while control can prevent grey squirrels from establishing within strongholds, it cannot prevent inter-specific spread of SQPV to red squirrels within such priority conservation areas, resulting in periodic outbreaks of disease and mortality in red populations. These disease outbreaks lead to a local crash in red squirrel population abundance, potentially taking several years for red squirrel populations to return to pre-infection levels (Chantrey et al. 2014; White et al. 2014, 2015; Lurz et al. 2015). Typically, these studies have assessed the role of disease in medium to high density squirrel
237
Mathematical models of grey squirrel invasion
populations (0.5 to 2 squirrels per hectare (ha)). Models have also examined the potential spread of squirrel pox in red squirrel (only) populations at low density (0.05 to 0.2 per ha, see Macpherson et al. 2016) and indicate that the impact of associated pathological disease may be significantly reduced as infectious outbreaks may be localised, with squirrel pox failing to spread extensively.
Many of the remaining red squirrel populations in Wales, northern England and southern Scotland are associated with coniferous forests dominated landscapes and broadleaved habitats that support relatively low density squirrel populations. It is therefore important to understand the potential replacement of red squirrels by grey squirrels and the role of squirrel pox in such settings. To examine this, we will focus on the case study system of the invasion of grey squirrels and replacement of red squirrels on Anglesey, Wales, in which the habitat is fragmented with patches of better quality habitat in the south and east of the island, but where generally population densities are relatively low. We will develop a stochastic, spatial, mathematical model of the red-grey-squirrel pox system that includes a realistic representation of the habitat on Anglesey. Our objectives will be to determine whether squirrel pox is a critical driver in red squirrel replacement in habitats that support low density populations and examine the persistence and variation in SQPV prevalence within grey squirrel populations. This information is important for conservation management as these squirrel density characteristics represent many of the regions in which red squirrels still persist in Britain and Ireland and where conservation management measures are implemented to protect them.
The replacement of red squirrels on Anglesey
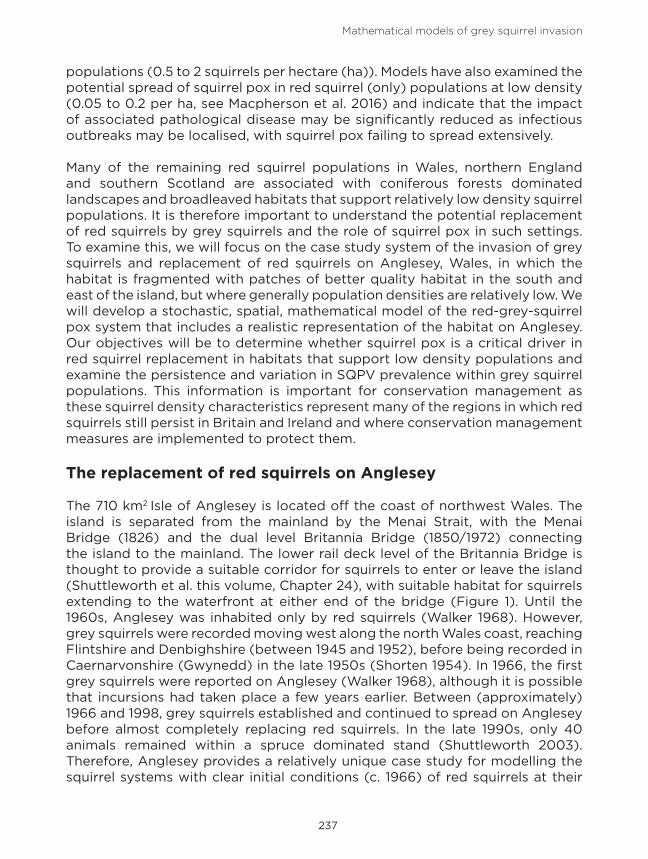
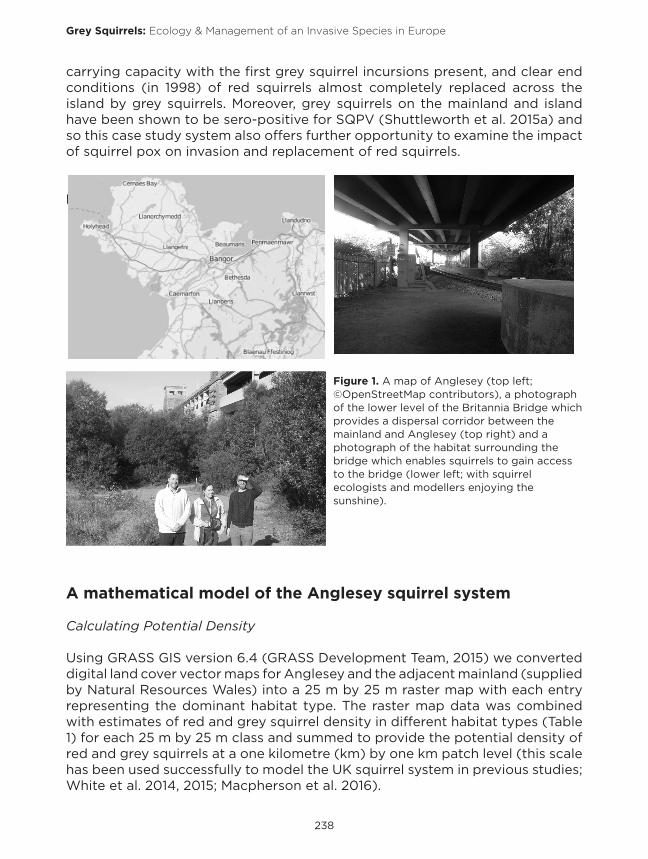
The 710 km2 Isle of Anglesey is located off the coast of northwest Wales. The island is separated from the mainland by the Menai Strait, with the Menai Bridge (1826) and the dual level Britannia Bridge (1850/1972) connecting the island to the mainland. The lower rail deck level of the Britannia Bridge is thought to provide a suitable corridor for squirrels to enter or leave the island (Shuttleworth et al. this volume, Chapter 24), with suitable habitat for squirrels extending to the waterfront at either end of the bridge (Figure 1). Until the 1960s, Anglesey was inhabited only by red squirrels (Walker 1968). However, grey squirrels were recorded moving west along the north Wales coast, reaching Flintshire and Denbighshire (between 1945 and 1952), before being recorded in Caernarvonshire (Gwynedd) in the late 1950s (Shorten 1954). In 1966, the first grey squirrels were reported on Anglesey (Walker 1968), although it is possible that incursions had taken place a few years earlier. Between (approximately) 1966 and 1998, grey squirrels established and continued to spread on Anglesey before almost completely replacing red squirrels. In the late 1990s, only 40 animals remained within a spruce dominated stand (Shuttleworth 2003). Therefore, Anglesey provides a relatively unique case study for modelling the squirrel systems with clear initial conditions (c. 1966) of red squirrels at their
Grey Squirrels: Ecology & Management of an Invasive Species in Europe
238
carrying capacity with the first grey squirrel incursions present, and clear end conditions (in 1998) of red squirrels almost completely replaced across the island by grey squirrels. Moreover, grey squirrels on the mainland and island have been shown to be sero-positive for SQPV (Shuttleworth et al. 2015a) and so this case study system also offers further opportunity to examine the impact of squirrel pox on invasion and replacement of red squirrels.
A mathematical model of the Anglesey squirrel system
Calculating Potential Density
Using GRASS GIS version 6.4 (GRASS Development Team, 2015) we converted digital land cover vector maps for Anglesey and the adjacent mainland (supplied by Natural Resources Wales) into a 25 m by 25 m raster map with each entry representing the dominant habitat type. The raster map data was combined with estimates of red and grey squirrel density in different habitat types (Table 1) for each 25 m by 25 m class and summed to provide the potential density of red and grey squirrels at a one kilometre (km) by one km patch level (this scale has been used successfully to model the UK squirrel system in previous studies; White et al. 2014, 2015; Macpherson et al. 2016).
239
Mathematical models of grey squirrel invasion
Table 1. Squirrel densities per ha for different habitat types present on Anglesey and the surrounding mainland. (Data taken from Bosch & Lurz 2012; Gurnell 1983, 1996; Shuttleworth et al. 2012).
Habitat Red squirrels (per ha) Grey squirrels (per ha)
The population dynamics of red and grey squirrels and squirrel pox infection are represented by the spatial, stochastic model outlined in White et al. (2014) and White & Lurz (2014). A stochastic model is required because it can represent the chance of extinction or disease fade-out at low density. This framework has been used successfully to examine the impact of SQPV on grey squirrel invasion in red squirrel strongholds (White et al. 2014) and on realistic landscapes (White & Lurz, 2014). The model is modified further to include seasonality, assuming births occur for six months of the year (between March and September), while other life-history and disease processes operate throughout the year. The inclusion of seasonality means that the population density oscillates with an annual signal around the potential density and in particular, can be above the potential density towards the end of the breeding season. This surplus triggers an increase in squirrel dispersal and better reflects the dynamics of the natural system (Macpherson, 2014). The stochastic population model is developed by modifying an underlying deterministic system of Tompkins et al. (2003) which represents the dynamics of susceptible and infected reds (SR, IR) and susceptible, infected and immune greys (SG, IG, RG). The deterministic model is as shown in Table 2.
Grey Squirrels: Ecology & Management of an Invasive Species in Europe
240
( )
( )
( )
( ) RRRGRR
RGRRRR
GGG
GGRGGG
RGGGGG
IbIIISdtdI
IISbStAdtdS
bRIdtdR
IbIIISdtdI
IISbStAdtdS
γβ
β
γ
γβ
β
−−+=
+−−=
−=
−−+=
+−−=
)(
)(
(1)
where HG=SG+IG+RG and HR=SR+IR represent the total squirrel populations and
( )( )⎩⎨⎧
<≤
<≤+−=
15.005.001
)(t
tHHcHqatA GRRGGG
G (2) (2)
represents the periodic birth rate of grey squirrels which assumes births occur for only half of the year (between March and September each year). The term for AR(t) (Eqn. 1) is equivalent to AG(t) (Eqn. 2) with the subscripts for R and G interchanged. In Tompkins et al. (2003) the two squirrel species have the same rate of adult mortality (b=0.9: Barkalow et al. 1970) but different rates of maximum reproduction (aR=3, aG=3.4 adapted from Tompkins et al. 2003 to account for seasonality). The competitive effect of grey squirrels on red squirrels is denoted by cG=1.65, whilst that of red squirrels on grey squirrels is denoted by cR=0.61 (Bryce et al. 2001). SQPV is transmitted (both within and between each squirrel species) with coefficient β=3.27 (following the method of Tompkins et al. 2003, to match the sero-prevalence on the mainland adjacent to Anglesey of 67%, Schuchert et al. 2014). Infected red squirrels die due to the disease at rate α=26 and infected grey squirrels recover at rate g =13 (Tompkins et al. 2003). The susceptibilities to crowding (qR, qG) are set to ensure the average density over one year is equal to the potential density in each one km by one km grid cell. To generate the stochastic model, the rates in the deterministic model are converted to probabilities of events that account for changes in individual patch level abundance (Renshaw 1991). The probabilities are shown in Table 2.
241
Mathematical models of grey squirrel invasion
Table 2. The stochastic model within each one km grid cell indicating the probability of different events. Here R=∑ [rates] (the sum of the rates in square brackets). Note, the birth terms shown in the table apply for the breeding season only (and are set to zero otherwise). Due to daily squirrel movement within a core range of radius, Ө = 0.15km km, squirrel pox transmission can occur from infected squirrels within the focal grid cell and also from the eight neighbouring grid cells (with adjacent and corner cells weighted appropriately). The dispersal term is shown for class SG only, but is similar for all other classes. The model assumes density dependent dispersal, such that squirrel dispersal increases as density increases and the dispersal rate is m=2b, when the patch density is equal to the potential density. Therefore, individuals undergo long distance dispersal on average twice in their lifetime and relocate to a different patch up to a distance of two km from the focal patch (with dispersal probability weighted appropriately for patches within the dispersal range).
[ ][ ]
( ) ( ) ( )
[ ][ ][ ][ ][ ]
( ) ( ) ( )
[ ]( )[ ] RKHcHmSSSPS
RIbIIPI
RIIIIIISIISSP
RbSSSPSRHHcHqaSSPS
RbRRRPRRIRRIIPRbIIIPI
RIIIIIISIISSP
RbSSSPSRHHcHqaSSPS
GRRGGGGG
RRRR
Adjacent CornerRGRGRGRRRRR
RRRR
RGGRRRRRR
GGGG
GGGGGG
GGGG
Adjacent CornerRGRGRGGGGGG
GGGG
GRRGGGGGG
//:)1( of Dispersal/)(:)1( ofDeath
/:)1,1(Red ofInfection
/:)1( ofDeath Natural/))((:)1( toRed ofBirth
/:)1( ofDeath Natural/:)1,1(Grey ofRecovery
/:)1( ofDeath Natural
/:)1,1(Grey ofInfection
/:)1( ofDeath Natural/))((:)1( Grey to ofBirth
2
2
+−→
+−→⎥⎥⎦
⎤
⎢⎢⎣
⎡⎟⎟⎠
⎞⎜⎜⎝
⎛++++++→−→
−→
+−+→
−→
+→−→
−→⎥⎥⎦
⎤
⎢⎢⎣
⎡⎟⎟⎠
⎞⎜⎜⎝
⎛++++++→−→
−→
+−+→
∑ ∑
∑ ∑
α
θθβ
γ
θθβ
The events are incremented at random with the associated probabilities updated due to changes in population density after each event. The time between events is an exponentially distributed random variable and can be determined as Tevent = -ln(σ)/R where σ is a random number drawn from a uniform distribution between zero and one (see Renshaw 1991). The model is coded using Fortran 90 and individual simulations are undertaken using a Gillespie algorithm and provide information of the behaviour in a single realisation. Multiple realisations are generated to assess the average behaviour and variability (see White et al. 2014 for further details of the model set-up).
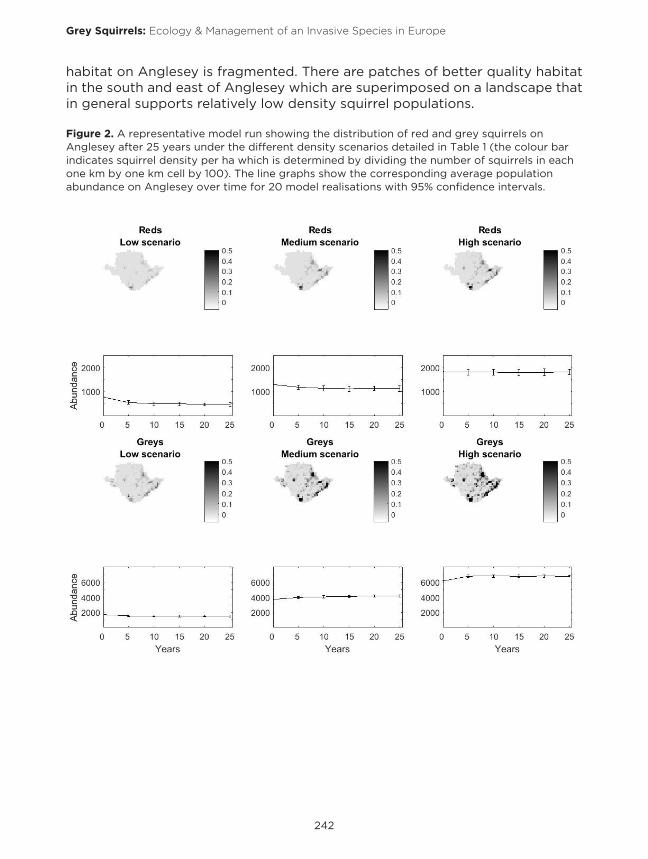
To determine which of the estimates of potential density best reflects the densities observed on Anglesey, we ran the model using the low, medium and high density estimates in Table 1 (see Figure 2). Estimates of the abundance of red and grey squirrels on Anglesey in the absence of the other species are 3,000 to 4,000 grey squirrels, (Schuchert et al. 2014), and 700 red squirrels (Halliwell et al. 2015). These, correspond most closely with the medium estimates of density and therefore, we used these values for the remaining analysis. The overestimate in squirrel numbers under medium density values may reflect the fact that the model system does not account for poor seed crops, which would decrease squirrel numbers and in the model system, squirrels can persist on the northwest of Anglesey (Holy Island) but squirrels were not observed here during the 1960s to 1990s period. Figure 2 also indicated that the suitable squirrel
Grey Squirrels: Ecology & Management of an Invasive Species in Europe
242
habitat on Anglesey is fragmented. There are patches of better quality habitat in the south and east of Anglesey which are superimposed on a landscape that in general supports relatively low density squirrel populations.
Figure 2. A representative model run showing the distribution of red and grey squirrels on Anglesey after 25 years under the different density scenarios detailed in Table 1 (the colour bar indicates squirrel density per ha which is determined by dividing the number of squirrels in each one km by one km cell by 100). The line graphs show the corresponding average population abundance on Anglesey over time for 20 model realisations with 95% confidence intervals.
243
Mathematical models of grey squirrel invasion
Model application: the driver of red squirrel replacement on Anglesey
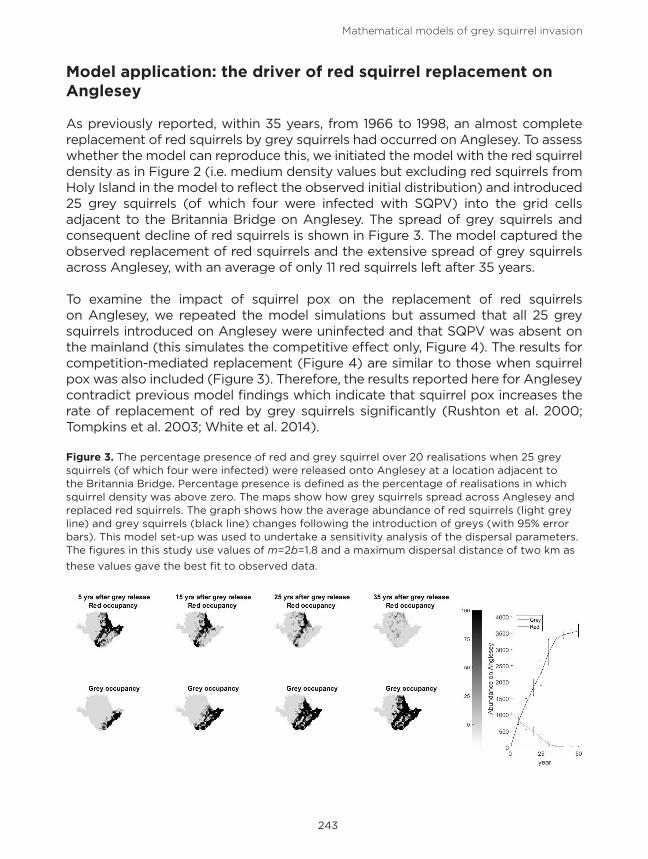
As previously reported, within 35 years, from 1966 to 1998, an almost complete replacement of red squirrels by grey squirrels had occurred on Anglesey. To assess whether the model can reproduce this, we initiated the model with the red squirrel density as in Figure 2 (i.e. medium density values but excluding red squirrels from Holy Island in the model to reflect the observed initial distribution) and introduced 25 grey squirrels (of which four were infected with SQPV) into the grid cells adjacent to the Britannia Bridge on Anglesey. The spread of grey squirrels and consequent decline of red squirrels is shown in Figure 3. The model captured the observed replacement of red squirrels and the extensive spread of grey squirrels across Anglesey, with an average of only 11 red squirrels left after 35 years.
To examine the impact of squirrel pox on the replacement of red squirrels on Anglesey, we repeated the model simulations but assumed that all 25 grey squirrels introduced on Anglesey were uninfected and that SQPV was absent on the mainland (this simulates the competitive effect only, Figure 4). The results for competition-mediated replacement (Figure 4) are similar to those when squirrel pox was also included (Figure 3). Therefore, the results reported here for Anglesey contradict previous model findings which indicate that squirrel pox increases the rate of replacement of red by grey squirrels significantly (Rushton et al. 2000; Tompkins et al. 2003; White et al. 2014).
Figure 3. The percentage presence of red and grey squirrel over 20 realisations when 25 grey squirrels (of which four were infected) were released onto Anglesey at a location adjacent to the Britannia Bridge. Percentage presence is defined as the percentage of realisations in which squirrel density was above zero. The maps show how grey squirrels spread across Anglesey and replaced red squirrels. The graph shows how the average abundance of red squirrels (light grey line) and grey squirrels (black line) changes following the introduction of greys (with 95% error bars). This model set-up was used to undertake a sensitivity analysis of the dispersal parameters. The figures in this study use values of m=2b=1.8 and a maximum dispersal distance of two km as
these values gave the best fit to observed data.
Grey Squirrels: Ecology & Management of an Invasive Species in Europe
244
Figure 4. The percentage presence of red and grey squirrel over 20 realisations and the change in population abundance when 25 uninfected grey squirrels were released onto Anglesey at a location adjacent to the Britannia Bridge. Percentage presence is defined as the percentage of realisations in which squirrel density was above zero. The graph shows how the average abundance of red squirrels (light grey line) and grey squirrels (black line) changes following the introduction of greys (with 95% error bars), (other details are as in Figure 3).
Squirrelpox dynamics in grey squirrel populations
To understand why squirrel pox did not increase the rate of replacement of red squirrels on Anglesey in the model, we plotted the prevalence of SQPV in grey squirrels (RG /HG) in each grid cell for a typical model realisation (Figure 5) and the presence of susceptible and infected red squirrels in each grid cell (Figure 6). It is noticeable that the pathological infection (arriving as an asymptomatic infection in grey squirrels) does not spread rapidly through the red squirrel population and only localised disease outbreaks are observed in populations adjacent to grey squirrels (Figure 6). The infection also initially fades out within grey squirrel populations on Anglesey and only starts to persist once Anglesey grey squirrel abundance and range has expanded sufficiently to support the infection (after approximately 20 years, Figure 5). Even in established grey squirrel populations, SQPV prevalence is observed to fluctuate and fade-out over time (both on Anglesey and the mainland).
Figure 5. SQPV prevalence in grey squirrels for a typical model realisation on Anglesey and the mainland assuming the mainland initially contains grey squirrels with SQPV and Anglesey initially contains red squirrels without the disease. 25 grey squirrels (with four infected) were introduced to Anglesey adjacent to the Britannia Bridge at time zero. The circles labelled A to D on the final image give the locations at which the epidemiological dynamics are examined in detail in Figure 7.
245
Mathematical models of grey squirrel invasion
Figure 6. Red squirrel presence on Anglesey and the mainland, for a typical model realisation, with the set-up as in Figure 5, highlighting where susceptible red squirrels (grey shaded cells) and infected red squirrels (black shaded cells) are present over a one year period.
contains red squirrels without the disease. 25 grey squirrels (with four infected) were introduced to Anglesey adjacent to the Britannia Bridge at time zero. The circles labelled A to D on the final image give the locations at which the epidemiological dynamics are examined in detail in Figure 7.
To investigate the epidemiological dynamics in grey squirrels during the replacement, we plotted the abundance of susceptible, infected and recovered/immune individuals and the infection prevalence for key grid cells (Figure 7). These key cells are chosen to highlight how squirrel pox impacts on red squirrel replacement in regions where grey squirrels are initially absent and therefore grey squirrel invasion follows a process of dispersal and expansion (Figure 7A) and regions in which squirrel pox is present at the onset of grey squirrel invasion (Figure 7B). The key cells are also chosen to examine the epidemiological dynamics, in particular the variation in SQPV prevalence, in established grey squirrel populations on the mainland (Figures 7C and 7D) and expanding populations on Anglesey (Figures 7A and 7B). When SQPV is present, there is a clear annual signal in the prevalence. This is driven by seasonality in reproduction and results in peak prevalence at the end of the breeding season following the infection of (new) susceptible grey squirrels. While SQPV can persist in the long-term, there are periods where the infection may fade-out, before re-establishing due to the spread of infection from neighbouring regions. For instance, SQPV fades out in the region either side of the Britannia bridge from years 10 to 18 (Figure 5, Figures 7B and 7C) before it is reintroduced through infection spread from populations on the mainland to the east of Bangor. In some regions, red squirrels are replaced by grey squirrels through competitive processes only, before SQPV reaches that cell (Figure 7A). However, when squirrel pox is present it can cause high levels of mortality in local red squirrel populations (Figure 7B). So while squirrel pox is not expected to spread extensively through red squirrel populations, it can spread locally from grey to red squirrels and have important impacts on red squirrel survival at the local level. This may be of particular significance for the red squirrel populations on Anglesey adjacent to the Britannia bridge, as this is the most likely dispersal route of grey squirrels from the mainland.
Figure 4. The percentage presence of red and grey squirrel over 20 realisations and the change in population abundance when 25 uninfected grey squirrels were released onto Anglesey at a location adjacent to the Britannia Bridge. Percentage presence is defined as the percentage of realisations in which squirrel density was above zero. The graph shows how the average abundance of red squirrels (light grey line) and grey squirrels (black line) changes following the introduction of greys (with 95% error bars), (other details are as in Figure 3).
Squirrelpox dynamics in grey squirrel populations
To understand why squirrel pox did not increase the rate of replacement of red squirrels on Anglesey in the model, we plotted the prevalence of SQPV in grey squirrels (RG /HG) in each grid cell for a typical model realisation (Figure 5) and the presence of susceptible and infected red squirrels in each grid cell (Figure 6). It is noticeable that the pathological infection (arriving as an asymptomatic infection in grey squirrels) does not spread rapidly through the red squirrel population and only localised disease outbreaks are observed in populations adjacent to grey squirrels (Figure 6). The infection also initially fades out within grey squirrel populations on Anglesey and only starts to persist once Anglesey grey squirrel abundance and range has expanded sufficiently to support the infection (after approximately 20 years, Figure 5). Even in established grey squirrel populations, SQPV prevalence is observed to fluctuate and fade-out over time (both on Anglesey and the mainland).
Figure 5. SQPV prevalence in grey squirrels for a typical model realisation on Anglesey and the mainland assuming the mainland initially contains grey squirrels with SQPV and Anglesey initially contains red squirrels without the disease. 25 grey squirrels (with four infected) were introduced to Anglesey adjacent to the Britannia Bridge at time zero. The circles labelled A to D on the final image give the locations at which the epidemiological dynamics are examined in detail in Figure 7.
Grey Squirrels: Ecology & Management of an Invasive Species in Europe
246
Figure 7. Population abundance and prevalence of sero-positive grey squirrels between years 0 and 35 in the cells highlighted by the labelled circles in Figure 5. In (A) and (B) the population abundance of susceptible and infected red squirrels is also plotted.
Discussion
We developed a spatial, stochastic model of red-grey-squirrel pox dynamics on Anglesey and showed how the model could represent the historical replacement of red by grey squirrels observed from 1966 to 1998. If the initial invasion of grey squirrels on Anglesey includes individuals that carry SQPV this can lead to a local disease outbreak in red squirrels in the relatively high density populations in regions adjacent to the Britannia bridge. In these (localised) regions, competition and disease processes led to the rapid replacement of red squirrels by grey squirrels. The fragmented nature of the habitat on Anglesey, where the majority of habitat on the island supports only low density squirrel populations, coupled with the high virulence of SQPV in red squirrels, means the infection failed to spread extensively via intra-specific pathways through the resident native red squirrel populations on Anglesey. Squirrel pox also failed to persist in establishing grey squirrel populations on Anglesey and therefore, SQPV was absent from Anglesey for a significant period while the grey squirrel
247
Mathematical models of grey squirrel invasion
range expanded. During this period, competition was the key driver of grey squirrel invasion and establishment. Once the grey squirrel abundance and range had increased on Anglesey, squirrel pox could establish and persist, with reinfection driven through grey squirrel intra-specific pathways with populations on the mainland. By this time, many of the red squirrel populations on Anglesey had been replaced by grey squirrels, with the impact of squirrel pox on red squirrels limited to localised outbreaks at the leading edge of the expanding grey distribution. The model findings suggest that squirrel pox may not play a significant role in the invasion of grey squirrels and replacement of red squirrels when they occupy habitats that predominantly support relatively low population densities.
An important finding in our study - that squirrel pox is not always a key factor in the invasion of grey squirrels into landscape occupied by red squirrels - qualifies previous studies that had suggested that the presence of the infection will (automatically) significantly increase the rate of red squirrel replacement by grey squirrels (Tompkins et al. 2003; Rushton et al. 2006; Bell et al. 2009; White et al. 2014). The previous studies suggest that the infection and associated disease will spread through red squirrel populations in advance of invading grey squirrels, causing red squirrel population crashes, with the resultant low red squirrel population density offering little competitive resistance to incursion and population establishment of the advancing grey squirrels. It is noteworthy, that previous studies have typically represented systems that can support high density populations; for example densities of 2.5 to 4.0 squirrels per ha in a designated stronghold in Formby, Lancashire. In such examples, intra-specific squirrel pox infection can lead to epidemics in red squirrels resulting in 80% mortality (Chantrey et al. 2014; White et al. 2014). In systems with lower densities, such as 0.5 to 0.8 per ha reported within Dumfries and Galloway, models indicate that populations suffer less severe epidemics with 60% mortality (White & Lurz 2014; White et al. 2015).
The model findings presented here for the Anglesey system, represents habitat that is fragmented, modelled using one km cells supporting approximately 0.05 to 0.25 red squirrels per hectare. The results indicate that squirrel pox can spread at a localised level within fragmented habitats that support higher red squirrel densities, but here the disease will fade-out and fail to persist. Moreover, squirrel pox was not predicted to spread extensively across Anglesey as it failed to spread throughout the predominantly low density landscape that connected fragments of better quality habitat. This reinforces previous model findings that examined squirrel pox spread at low density (White et al. 2014; Macpherson et al. 2016). Since squirrel pox fails to spread through the established red squirrel populations, it does not lead to the widespread disease induced mortality that reduces red squirrel density, nor the subsequent advantage to grey squirrels through disease mediated invasion. In low density environments, the model predicts that competitive processes are the key driver of the replacement of
Grey Squirrels: Ecology & Management of an Invasive Species in Europe
248
red squirrels by grey squirrels.Control measures implemented in the period 1998 to 2013 led to the eradication of grey squirrels from Anglesey (Shuttleworth et al. 2015a) and in the period 2004 to 2013, red squirrels were reintroduced to many parts of the island with the result that it supports a population of approximately 700 red squirrels (Halliwell et al. 2015). Histological tests have shown that even though restored red squirrel populations were sympatric with grey squirrels during some periods, no squirrel pox disease was recorded in red squirrels and no animals were ever found with antibodies to SQPV (Shuttleworth et al. 2015b). This is likely due to the impact of grey squirrel control reducing grey squirrel density to levels that could not support squirrel pox in regions where red and grey squirrels where sympatric (Schuchert et al. 2014). However, with the close proximity of a mainland grey squirrel population and dispersal opportunities offered by the Britannia bridge, it is unsurprising that since eradication, a small number of re-incursion events have been recorded (see Shuttleworth et al. this volume, Chapter 24). A concern of conservation groups is that such incursions may introduce squirrel pox to the re-established red squirrel island population. Our work suggests that if this happened, squirrel pox disease outbreaks in red squirrels would be localised and the infection would fade-out (Figure 6). While localised outbreaks would cause red squirrel mortality, provided grey squirrels are prevented from establishing on the island, the red squirrel population will return to pre-infection densities following disease fade-out. A caveat to our findings, is that the model assumes the same rate of transmission for grey-grey, grey-red, red-grey and red-red squirrel interactions. Since red squirrel infections are more acute/symptomatic, it may be that red squirrels have a higher level of infectivity. In particular, if the rate of transmission between red squirrels is increased (beyond the current level that is fitted for grey-grey transmission), then the disease can spread more extensively and cause greater levels of mortality, although it is still predicted to fade-out after an epidemic outbreak (Macpherson et al. 2016).
Our modelling work may help explain the epidemiological dynamics of SQPV in grey squirrel populations. Model results examining the sero-prevalence of SQPV in grey squirrel populations as their range expanded on Anglesey indicate that the infection failed to persist in grey squirrel populations and therefore the sero-prevalence was low or zero, until their abundance and range had expanded. Field observations support this finding reporting low sero-prevalence at the wave-front of grey squirrel expansion in Ireland where population levels are low (Stritch et al. 2015). Model results also highlight that there can be considerable variation in the levels of prevalence both annually and on a multi-year level. The annual signal shows that prevalence is driven by the seasonal pattern of reproduction, with a peak at the end of the breeding season. However, the model findings indicate that in addition to the annual signal, prevalence can become low or SQPV can fade-out periodically before being reintroduced through dispersal (Figure 7). The fade-out of SQPV in grey
249
Mathematical models of grey squirrel invasion
squirrel populations occurs at the regional scale in the model – with low or zero sero-prevalence in the connected region around Bangor between years 10 to 18 (Figure 5, Figure 7C) and in the Gwydir forest park region around Betws-y-Coed between years 20 to 27 (Figure 5, Fig 7D). SQPV becomes re-established through the rare dispersal of infected individuals between regions. This has important implications for disease monitoring in the field, as variation in the sero-prevalence in grey squirrel populations may depend on the time of year in which sampling is undertaken, on the population abundance in a particular year (which will depend on seed availability), or on the size and level of connectivity of a particular forest block as infection may periodically fade-out at the regional level. Importantly, our work indicates that the significant and sustained reduction in grey squirrel density, through control, is likely to reduce SQPV prevalence in grey squirrels – and this is supported by field studies (Schuchert et al. 2014).
The findings in this study, have shown how mathematical models can be useful tools for understanding the key population and disease processes involved in ecological invasions and for informing conservation management practice. Future work will focus on extending the models to represent the control of grey squirrels and to fit the model to the population data on Anglesey between 1998 and 2013, in which grey squirrels were removed and red squirrels reintroduced and established. This model can help plan future conservation decisions on Anglesey and on the neighbouring mainland and can be adapted to inform on red squirrel conservation strategy throughout the UK.
Acknowledgements
AW, MB and PL are supported in part by a NERC Innovations grant NE/M021319/1. HEJ is supported by an EPSRC DTA award and funding via a Heritage Lottery Fund grant award. The authors would like to thank Jonathan Rothwell and Dr Liz Halliwell of Natural Resources Wales, for providing GIS Land Cover Map layers and two anonymous referees for detailed and helpful comments.
References
Barkalow FS, Hamilton RB, Soots RF (1970) The vital statistics of an unexploited grey squirrel population. Journal of Wildlife Management 34: 489-500.
Bell SS, White A, Sherratt JA, Boots M (2009) Invading with biological weapons: the role of shared disease in ecological invasion. Theoretical Ecology 2: 53-66.
Bosch S, Lurz PWW (2012) The Eurasian red squirrel. Westarp Wissenschaften.Bryce J (1997) Changes in the distribution of red and grey squirrels in Scotland. Mammal Review 27:
171-176. Bryce JM, Speakman JR, Johnson PJ, Macdonald DW (2001) Competition between Eurasian red
and introduced Eastern grey squirrels: the energetic significance of body-mass differences. Proceedings of the Royal Society of London B 268: 1731-1736.
Grey Squirrels: Ecology & Management of an Invasive Species in Europe
250
Chantrey J, Dale TD, Read JM, White S, Whitfield F, Jones D, McInnes CJ, Begon M (2014) European red squirrels population dynamics driven by squirrelpox at a gray squirrel invasion interface. Ecology and Evolution 4: 3788-3799.
DEFRA (2007) Conserving Biodiversity - The UK Approach. Defra, London.Ehrenfeld JD (2011) Ecosystem consequences of biological invasions. Annual Review of Ecology,
Evolution, and Systematics 41: 59-80.FCS (2012) Managing Forests as red squirrel stronghold. Forestry Commission Scotland Publication.
http://scotland.forestry.gov.uk/images/corporate/pdf/FCS StrongholdsGuidance.pdfGRASS Development Team (2015) Geographic Resources Analysis Support System (GRASS)
Software, Version 6.4. Open Source Geospatial Foundation. http://grass.osgeo.org Gurnell J (1983) Squirrel numbers and the abundance of tree seeds. Mammal Review 13: 133 148.Gurnell J (1996) The effects of food availability and winter weather on the dynamics of a grey squirrel
population in southern England. Journal of Applied Ecology 33: 325-338.Gurnell J, Blackett T, Butler H, Lurz PWW, Magris L, Shuttleworth CM (2015) Red squirrel strongholds:
challenges for conservation. In Shuttleworth CM, Lurz PWW, Hayward MW (eds) Red Squirrels: Ecology, Conservation & Management in Europe, 211-232. European Squirrel Initiative, Woodbridge, Suffolk, England.
Gurnell J, Wauters LA, Lurz PWW, Tosi G (2004) Alien species and interspecific competition: effects of introduced eastern grey squirrels on red squirrel population dynamics. Journal of Animal Ecology 73: 26-35.
Halliwell EC, Shuttleworth CM, Wilberforce EM, Denman H, Lloyd I, Cartmel S (2015) Striving for success: an evaluation of local action to conserve red squirrels (Sciurus vulgaris) in Wales. In: Shuttleworth CM, Lurz PWW, Hayward MW (eds) Red Squirrels: Ecology, Conservation & Management in Europe, 175-192. European Squirrel Initiative, Woodbridge, Suffolk, England.
Kolar CS, Lodge DM (2001) Progress in invasion biology: predicting invaders. Trends in Ecology and Evolution 16: 199-204.
Lurz PWW, White A, Meredith A, McInnes C, Boots M (2015) Living with pox project: forest management for areas affected by squirrelpox virus. Forestry Commission Scotland Report.
Macpherson MF (2014) Modelling population and disease dynamics in complex ecological systems. PhD thesis, Heriot-Watt University.
Macpherson MF, Davidson RS, Duncan DB, Lurz PWW, Jarrott A, White A (2016) Incorporating habitat distribution in wildlife disease models: conservation implications for the threat of squirrelpox on the Isle of Arran. Animal Conservation 19: 3-14.
Manchester S, Bullock J (2000) The impacts of non-native species on UK biodiversity and the effectiveness of control. Journal of Applied Ecology 37: 845-864.
Martin-Albarracin VL, Amico GC, Simberloff D, Nuñez MA (2015) Impact of non-native birds on native ecosystems: a global analysis. PLoS ONE 10: e0143070 oi:10.1371/journal.pone.0143070.
McInnes CJ, Wood AR, Thomas K, Sainsbury AW, Gurnell J, Dein FJ, Nettleton PF (2006) Genomic characterisation of a novel poxvirus contributing to the decline of the red squirrel (Sciurus vulgaris) in the UK. Journal of General Virology 87: 2115-2125.
Okubo A, Maini PK, Williamson MH, Murray JD (1989) On the spatial spread of the grey squirrel in Britain. Proceedings of the Royal Society of London B 238: 113-125.
O’Teangana D, Reilly S, Montgomery WI, Rochford J (2000) Distribution and status of the red squirrel (Sciurus vulgaris) and grey squirrel (Sciurus carolinensis) in Ireland. Mammal Review 30: 45-56.
Parrott D, Quy R, van Driel K, Lurz PWW, Rushton S et al. (2009) Review of red squirrel conservation activity in northern England. Natural England Contract No. 08/09/N/004.
251
Mathematical models of grey squirrel invasion
Renshaw E (1991) Modelling biological populations in space and time. Cambridge University Press, Cambridge.
Rushton SP, Lurz PWW, Fuller R, Garson PJ (1997) Modelling the distribution of the red and grey squirrel at the landscape scale: a combined GIS and population dynamics approach. Journal of Applied Ecology 34: 1137-1154.
Rushton SP, Lurz PWW, Gurnell J, Fuller R (2000) Modelling the spatial dynamics of parapoxvirus disease in red and grey squirrels: a possible cause of the decline in the red squirrel in the UK? Journal of Applied Ecology 37: 997-1012.
Rushton SP, Lurz PWW, Gurnell J, Nettleton P, Bruemmer C, Shirley MDF, Sainsbury AW (2006) Disease threats posed by alien species: the role of a poxvirus in the decline of the native red squirrel in Britain. Epidemiology and Infection 134: 521-533.
Sainsbury AW, Deaville R, Lawson B, Cooley WA, Farelly SSJ, Stack MJ, Duff P, McInnes CJ, Gurnell J, Russell PH (2008) Poxviral disease in Red Squirrels Sciurus vulgaris in the UK: Spatial and temporal trends of an emerging threat. EcoHealth 5: 305-316.
Schuchert P, Shuttleworth CM, McInnes CJ, Everest DJ, Rushton SP (2014) Landscape scale impacts of culling upon a European grey squirrel population: can trapping reduce population size and decrease the threat of squirrelpox virus infection for the native red squirrel? Biological Invasions 16: 2381-2391.
Shorten M (1954) Squirrels. Collins, England.Shuttleworth CM (2003) A tough nut to crack: red squirrel conservation in Wales. Biologist 50: 231-
235.Shuttleworth CM, Lurz PWW, Geddes N, Browne J (2012) Integrating red squirrel (Sciurus vulgaris)
habitat requirements with the management of pathogenic tree disease in commercial forests in the UK. Forest Ecology and Management 279: 167-175.
Shuttleworth CM, Schuchert P, Everest DJ, McInnes CJ, Rushton SP, Jackson NL, Kenward RE (2015a) Developing integrated and applied red squirrel conservation programmes: What lessons can Europe learn from a regional grey squirrel eradication programme in North Wales? In Shuttleworth CM, Lurz PWW, Hayward MW (eds) Red squirrels: Ecology, Conservation & Management in Europe, 233-250. European Squirrel Initiative, Woodbridge, Suffolk, England.
Shuttleworth CM, Signorile AL, Everest DJ, Duff JP, Lurz PWW (2015b) Assessing causes and significance of red squirrel (Sciurus vulgaris) mortality during regional population restoration: An applied conservation perspective. Hystrix, The Italian Journal of Zoology 26: 69-75.
Simberloff D (2011) How common are invasion-induced ecosystem impacts? Biological Invasions 13: 1255-1268.
Stritch C, Naulty F, Zintl A, Callanan JJ, McCullough M, Deane D, Marnell F, McMahon BJ (2015) Squirrelpox virus reservoir expansion on the east coast of Ireland. European Journal of Wildlife Research 61: 483-486.
Sutherland WJ, Armstrong-Brown S, Armsworth PR, Tom B, Brickland J et al. (2006) The identification of 100 ecological questions of high policy relevance in the UK. Journal of Applied Ecology 43: 617-627.
Tompkins DM, White AR, Boots M (2003) Ecological replacement of native red squirrels by invasive greys driven by disease. Ecology Letters 6: 189-196.
Wales Squirrel Forum (2009) Conservation plan for red squirrels in Wales. Forestry Commission, Welsh Assembly Government, Countryside Council for Wales, Bangor, UK.
Walker TG (1968) The Mammals of Anglesey. In Jones WE (ed) Natural History of Anglesey, 204-203. Anglesey Antiquarian Society, Llangefni, Anglesey.
White A, Bell SS, Lurz PWW, Boots M (2014) Conservation management within strongholds in the
Grey Squirrels: Ecology & Management of an Invasive Species in Europe
252
face of disease-mediated invasions: red and grey squirrels as a case study. Journal of Applied Ecology. 51, 1631-1642.
White A, Lurz PWW (2014) A modelling assessment of control strategies to prevent/reduce Squirrelpox spread. Scottish Natural Heritage Commissioned Report No. 627.
White A, Lurz PWW, Jones HE, Boots M, Bryce J, Tonkin M, Ramoo K, Bamforth L, Jarrott A (2015) The use of mathematical models in red squirrel conservation: assessing the threat from grey invasion and disease to the Fleet basin stronghold. In Shuttleworth CM, Lurz PWW, Hayward MW (eds) Red squirrels: Ecology, Conservation & Management in Europe. European Squirrel Initiative, Woodbridge, Suffolk, England.