372 Agriculture and Food Security in China The economic impact of the ASEAN–China Free Trade Area A computatonal analyss wth specal emphass on agrculture Jun Yang and Chunlai Chen Trade between Chna and the Assocaton of South-East Asan Natons (ASEAN) has ncreased very rapdly n the past decade. Total trade (mports plus exports) between China and ASEAN expanded 6.7 times, from US$19.3 billion in 1996 to US$105.1 billion in 2005—an annual growth rate of 21 per cent. Currently, China is ASEAN’s third largest trading partner, and ASEAN s Chna’s fourth largest tradng partner. As the growth rate of Chna’s mports from ASEAN s hgher than that of ts exports to the regonal group, China’s trade status with ASEAN has changed from a trade surplus to a trade deficit, and the deficit has been rising in recent years. In 2005, China’s trade deficit with ASEAN reached US$19.8 billion. The tradng relatonshp between Chna and ASEAN s expected to become closer because of the establishment of the ASEAN–China Free Trade Agreement (ACFTA). The Framework Agreement on ASEAN–China Comprehensive Economic Cooperation was signed in 2002, and represented a milestone in cooperation between the two economies. The ACFTA is scheduled to enter nto force n 2010. 1 Wth a vew to acceleratng the implementation of the agreement, the parties agreed to implement an Early Harvest Program (EHP) with a package of agricultural and industrial products. The EHP committed the participating countries to the elimination of tarffs on these products between 2004 and 2006. 2 13
Transcript
372
Agriculture and Food Security in China
The economic impact of the ASEAN–China Free Trade AreaA computat�onal analys�s w�th spec�al emphas�s on agr�culture
Jun Yang and Chunlai Chen
Trade between Ch�na and the Assoc�at�on of South-East As�an Nat�ons (ASEAN) has �ncreased very rap�dly �n the past decade. Total trade (�mports plus exports) between China and ASEAN expanded 6.7 times, from US$19.3 billion in 1996 to US$105.1 billion in 2005—an annual growth rate of 21 per cent. Currently, China is ASEAN’s third largest trading partner, and ASEAN �s Ch�na’s fourth largest trad�ng partner. As the growth rate of Ch�na’s �mports from ASEAN �s h�gher than that of �ts exports to the reg�onal group, China’s trade status with ASEAN has changed from a trade surplus to a trade deficit, and the deficit has been rising in recent years. In 2005, China’s trade deficit with ASEAN reached US$19.8 billion.
The trad�ng relat�onsh�p between Ch�na and ASEAN �s expected to become closer because of the establishment of the ASEAN–China Free Trade Agreement (ACFTA). The Framework Agreement on ASEAN–China Comprehensive Economic Cooperation was signed in 2002, and represented a milestone in cooperation between the two economies. The ACFTA is scheduled to enter �nto force �n 2010.1 W�th a v�ew to accelerat�ng the implementation of the agreement, the parties agreed to implement an Early Harvest Program (EHP) with a package of agricultural and industrial products. The EHP committed the participating countries to the elimination of tar�ffs on these products between 2004 and 2006.2
13
373
The economic impact of the ASEAN–China Free Trade Area
Recent stud�es have shown that econom�c �ntegrat�on between Ch�na and ASEAN w�ll br�ng numerous opportun�t�es as well as challenges for the part�c�pants. Some stud�es show that Ch�na and ASEAN w�ll exper�ence net trade gains from the ACFTA and that it will promote economic growth �n both econom�es (Ch�rath�vat 2002; ASEAN Jo�nt Experts Group 2001). In contrast, some studies find that China and ASEAN will be more likely to compete with, rather than complement, each other (Tongzon 2005; Holst and Weiss 2004; Voon and Yue 2003; Wong and Chan 2002). As the ACFTA will likely increase the competitive pressures on ASEAN producers in third-country markets and in ASEAN domestic markets, some special and d�fferent�al treatment has been seen as necessary for the poorer ASEAN economies (Wattanapruttipaisan 2003). Studies have, however, pointed out that China’s market liberalisation under the ACFTA would provide ASEAN countries with promising economic opportunities (Tongzon 2005; Holst and Weiss 2004). Moreover, both economies would gain large benefits from becom�ng more compet�t�ve and attract�ng fore�gn �nvestment �nto the�r integrated market in the long run (Wong and Chan 2003).
These d�fferent v�ews certa�nly ra�se �ssues worthy of further study. Moreover, many empirical studies have shown that regional free trade agreements contr�bute to member countr�es’ growth through the accumulation of physical and human capital, productivity growth and accelerated domestic reforms (for example, Ethier 2000; Fukase and Winters 2003), but that it cannot be assumed that all participants and sectors will benefit equally. Some could, in fact, be hurt by the liberalisation. Moreover, the realisation of the ACFTA is a complex procedure involving several steps. It is useful, therefore, to study the effects under different pol�cy arrangements dur�ng the d�fferent stages. There has been no study focusing on the dynamics of the agreement. Therefore, one of the main aims of this chapter is to explore the different economic effects of the EHP during 2004–06 and the full implementation of the ACFTA in 2010.
Trade liberalisation in China and ASEAN
Because the major issue in a free trade agreement is tariff reduction, accurate est�mat�on of the tar�ffs used by the part�c�pants �s very �mportant. In th�s
374
Agriculture and Food Security in China
section, we analyse the trade liberalisation schedules in China and ASEAN, examining China’s World Trade Organization (WTO) commitments, ASEAN Free Trade Area (AFTA) commitments and the ACFTA commitments.
Ch�na’s WTO comm�tments
After 15 years of arduous negotiations, China acceded to the WTO at the end of 2001. As a result of the negotiations, China has agreed to undertake a ser�es of comm�tments to l�beral�se �ts trade pol�cy �n order to better �ntegrate �nto the world economy and offer a pred�ctable env�ronment for trade and fore�gn �nvestment �n accordance w�th WTO rules.3 Under �ts WTO commitments, China will further reduce its import tariffs on goods and reduce or eliminate trade barriers on services. Other prohibitions, quant�tat�ve restr�ct�ons or protect�ve measures used aga�nst �mports that are �ncons�stent w�th WTO agreements w�ll be phased out or otherw�se dealt w�th �n accordance w�th mutually agreed terms.
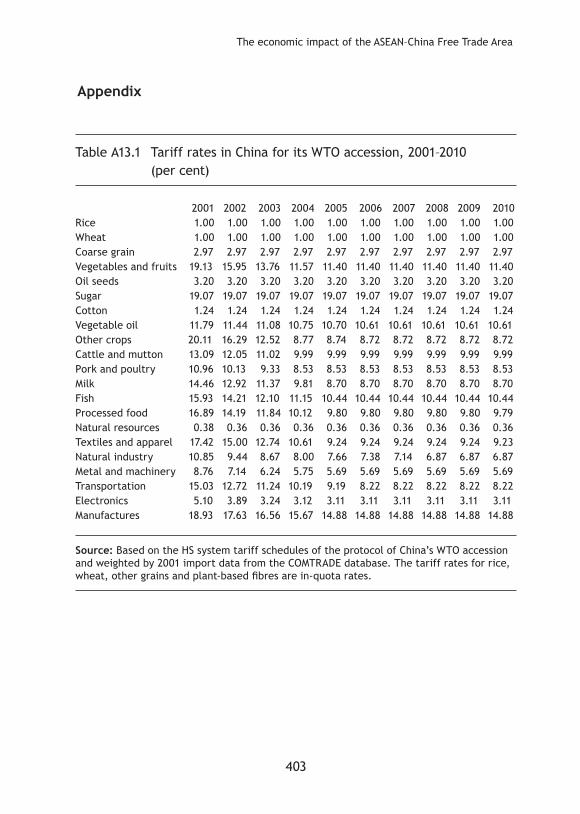
Import tar�ffs w�ll be reduced gradually between 2001 and 2010. Based on the Harmonised Commodity Description and Coding System (HS) tariff schedules of the protocol of Ch�na’s WTO access�on and we�ghted by 2001 import data from the United Nations Statistics Division, Commodity Trade Statistics Database (COMTRADE), China’s average import tariff will be reduced gradually from 8.79 per cent in 2001 to 5.43 per cent in 2010.4 The scheduled import tariff reductions—by commodity and year—are provided in Table A13.1. As there is no tariff line in the services sector, it is difficult to estimate the liberalisation directly. In the empirical analysis, we adopt the estimate of Tongeren and Huang (2004) and Francois and Spinager (2004) that the �mport tar�ff equ�valent of Ch�na’s serv�ces sector w�ll be reduced from 19 per cent to 9 per cent.
Ch�na w�ll confront cons�derable challenges �n �ts l�beral�sat�on of the agricultural sector. In addition to the agreed tariff reductions, China committed to removing quantitative restrictions, phasing out all export subsidies and reducing product-specific support to 8.5 per cent.5 Although Ch�na’s WTO agreement allows the government to manage the trade of ‘nat�onal strateg�c products’6 through a tariff rate quota (TRQ), the quotas under low tar�ffs w�ll be expanded wh�le the shares of state-owned enterpr�ses (SOEs) w�ll be reduced gradually.
375
The economic impact of the ASEAN–China Free Trade Area
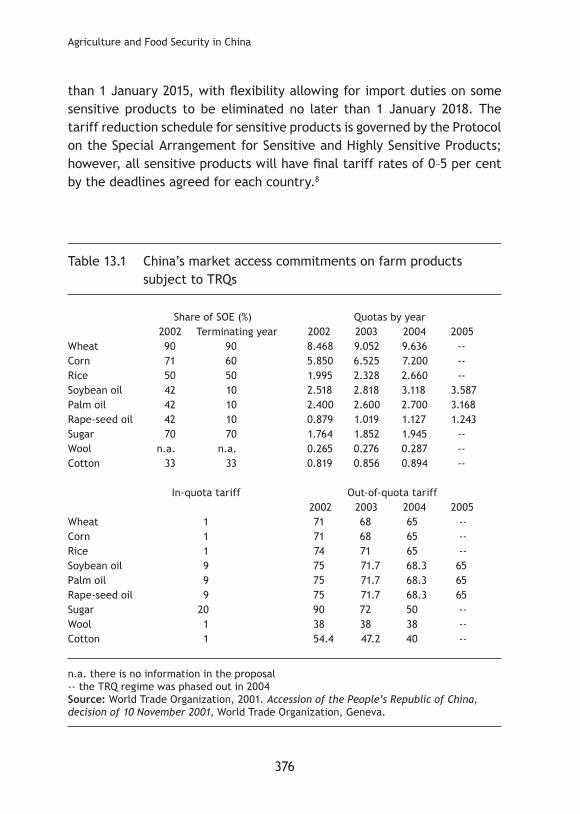
The details of China’s TRQs in agricultural products are shown in Table 13.1. The within-quota tariffs are quite low, while the out-of-quota tariffs are almost prohibitive. For example, the in-quota tariff for sugar is 20 per cent, while it is 9 per cent for edible oils and only 1 per cent for rice, wheat, maize and wool. The quantities imported at these low tariff levels are limited; however, the in-quota volumes were to grow over a four-year period (2002–05) at annual rates ranging from 4 per cent to 19 per cent. At the same time, tariffs on out-of-quota imports and import shares for SOEs would be reduced substant�ally between 2002 and 2005.
AFTA’s tariff reduction schedule
The ASEAN Free Trade Area (AFTA) was established in January 1992 with the object�ve of el�m�nat�ng tar�ff barr�ers among ASEAN member countr�es. The Agreement on the Common Effect�ve Preferent�al Tar�ff (CEPT) Scheme for the AFTA requires that tariff rates levied on a wide range of products traded within the region will be reduced to no more than 5 per cent. Quantitative restr�ct�ons and other non-tar�ff barr�ers are to be el�m�nated. The free trade agreement covers all manufactured and agr�cultural products; however, 734 tariff lines on the General Exception List—representing 1.09 per cent of all tariff lines in ASEAN—are permanently excluded from the agreement for reasons of nat�onal secur�ty (ASEAN Secretar�at 2002).
ASEAN member countr�es have made good progress �n lower�ng �ntra-regional tariffs. More than 99 per cent of the products in the CEPT Inclusion List of ASEAN+6 have been brought down to the 0–5 per cent tariff range (Figure 13.1). ASEAN’s new members have also reduced their import tariffs, with almost 80 per cent of their products having been moved into their respective CEPT inclusion lists. Of these items, about 66 per cent already have tariffs within the 0–5 per cent band. Vietnam had until 2006 to bring down tar�ffs of products on �ts �nclus�on l�st to no more than 5 per cent; Laos and Myanmar have until 2008, and Cambodia until 2010.
Accord�ng to the amend�ng protocol7 s�gned by ASEAN member states �n 2003, import duties on products on the inclusion lists of Brunei, Indonesia, Malaysia, the Philippines, Singapore and Thailand will be eliminated no later than 1 January 2010. Import dut�es on products on the �nclus�on l�sts for Cambodia, Laos, Myanmar and Vietnam will be eliminated no later
376
Agriculture and Food Security in China
than 1 January 2015, with flexibility allowing for import duties on some sensitive products to be eliminated no later than 1 January 2018. The tar�ff reduct�on schedule for sens�t�ve products �s governed by the Protocol on the Special Arrangement for Sensitive and Highly Sensitive Products; however, all sensitive products will have final tariff rates of 0–5 per cent by the deadl�nes agreed for each country.8
Table 13.1 China’s market access commitments on farm products subject to TRQs
n.a. there �s no �nformat�on �n the proposal -- the TRQ regime was phased out in 2004 Source: World Trade Organization, 2001. Accession of the People’s Republic of China, decision of 10 November 2001, World Trade Organization, Geneva.
377
The economic impact of the ASEAN–China Free Trade Area
The free trade agreement between ASEAN and China (ACFTA)
The ACFTA was proposed initially by then Chinese Premier, Zhu Rongji, at the ASEAN–China summit in November 2000. The framework agreement on comprehens�ve econom�c cooperat�on between Ch�na and ASEAN nat�ons was signed on 4 November 2002, and represented a milestone in cooperation between the two part�es. Accord�ng to the t�me frame prov�ded by the agreement, the ACFTA covering trade in goods will be established by 2010 for Brunei, China, Indonesia, Malaysia, the Philippines, Singapore and Thailand, and by 2015 for the new ASEAN member states, Vietnam, Laos, Cambodia and Myanmar.
W�th a v�ew to accelerat�ng the �mplementat�on of the framework agreement, the parties agreed to implement the EHP for a package of agricultural and industrial products. Starting in 2004, the EHP committed the countr�es to the el�m�nat�on of tar�ffs on these products by 2006. As shown in Table 13.2, the EHP comprises agricultural products under HS Chapters 1–8. The original ASEAN members and China reduced the import tar�ffs on these commod�t�es to zero before 1 January 2006. The newer ASEAN members enjoy a longer per�od before they are to el�m�nate tar�ffs on these commod�t�es.9
According to the trade-in-goods agreement, participating countries w�ll el�m�nate tar�ffs and non-tar�ff barr�ers substant�ally for all products traded over time. For ASEAN+6 and China, the schedule for the bulk of the goods subject to tariff elimination ranges from 2005–10. The newer ASEAN members have unt�l 2015 to remove all �mport tar�ffs. Countr�es have the flexibility to protect a limited number of products that are considered sensitive for their economies; however, the tariffs on most of these products will be reduced to 0–5 per cent by 2018.
Methodology and policy scenarios
The ma�n analyt�cal tool used �n th�s study �s a global trade model based on the Global Trade Analysis Project (GTAP). Following a brief introduction of the model, efforts to enhance GTAP’s database and parameters for China are discussed. Finally, the baseline and two policy scenarios are defined for the purposes of evaluating the effects of the EHP during 2004–06 and the full implementation of the ACFTA during 2006–10.
378
Agriculture and Food Security in China
Figure 13.1 Percentage of tariff lines at 0–5 per cent in the tentative 2004 CEPT package
9 9 .4 5
6 6 .5 7
9 0 .17
3 3 .4 3
9 .7 70 .4 7
0 .0 60 .0 00 .0 8
0%
10%
20%
30%
40%
50%
60%
70%
80%
90%
100%
ASEAN-6 CLMV Total ASEAN
0 - 5 per cent > 5 per cent Other
Source: ASEAN statistics, 2005. Available online at http://www.aseansec.org
Table 13.2 Product coverage in the Early Harvest Program (EHP)
Chapter Descr�pt�on01 L�ve an�mals02 Meat and edible meat offal03 Fish04 Da�ry products05 Other an�mal products06 L�ve trees07 Ed�ble vegetables08 Edible fruits and nuts
Source: ASEAN-China FTA Framework Agreement (2002). Available online at http://www.b�laterals.org
379
The economic impact of the ASEAN–China Free Trade Area
Br�ef �ntroduct�on to the GTAP model
GTAP is a multi-region, multi-sector, computable general equilibrium model, with perfect competition and constant returns to scale. The model is described fully in Hertel (1997). It has been used widely to analyse the �mpacts of changes �n trade pol�cy.
In the GTAP model, each country or region is depicted within the same econom�c structure. The consumer s�de �s represented by the country or regional household to which are assigned the income of factors, tariff revenues and taxes. The country or reg�onal household allocates �ts income to three expenditure categories: private household expenditure, government expenditure and savings. For the consumption of the private household, the non-homothetic Constant Difference of Elasticities (CDE) function is applied. Firms combine intermediate inputs and primary factors, land, labour (skilled and unskilled) and capital. Intermediate inputs are composites of domestic and foreign components, and the foreign component �s d�fferent�ated by reg�on of or�g�n (the so-called Arm�ngton assumpt�on). With respect to factor markets, the model assumes full employment, w�th labour and cap�tal be�ng fully mob�le w�th�n reg�ons but �mmob�le �nternat�onally. Labour and cap�tal remunerat�on rates are determ�ned endogenously at equilibrium. In the case of crop production, farmers make dec�s�ons on land allocat�on. Land �s assumed to be �mperfectly mobile between crops, and hence the model allows for endogenous land rent d�fferent�als. Each country or reg�on �s equ�pped w�th one country or reg�onal household that d�str�butes �ncome across sav�ngs and consumpt�on expend�ture to max�m�se �ts ut�l�ty.
The GTAP model �ncludes two global �nst�tut�ons. All transport between reg�ons �s carr�ed out by the �nternat�onal transport sector. The trad�ng costs reflect the transaction costs involved in international trade as well as the phys�cal act�v�ty of transportat�on �tself. Us�ng transport �nputs from all regions, the international transport sector minimises its costs under Cobb-Douglas technology. The second global institution is the global bank, wh�ch takes the sav�ngs from all reg�ons and purchases �nvestment goods �n all reg�ons depend�ng on the expected rates of return. The global bank guarantees that global sav�ngs are equal to global �nvestments.
380
Agriculture and Food Security in China
The model does not have an exchange rate variable; however, by choos�ng as a numeraire the index of global factor prices, each region’s change of factor pr�ces relat�ve to the numeraire directly reflects a change �n the purchas�ng power of the reg�on’s factor �ncomes on the world market. Th�s change can be �nterpreted d�rectly as a change �n the real exchange rate. Welfare changes are measured by the equivalent variation, which can be computed from each reg�on’s household expend�ture funct�on.
Taxes and other pol�cy measures are represented as ad valorem tax equ�valents. These create wedges between the und�storted pr�ces and the pol�cy-�nclus�ve pr�ces. Product�on taxes are placed on �ntermed�ate or primary inputs, or on output. Trade policy instruments include applied most-favoured nation tariffs, anti-dumping duties, countervailing duties, export quotas and other trade restr�ct�ons. Add�t�onal �nternal taxes can be placed on domestic or imported intermediate inputs, and can be appl�ed at d�fferent�al rates that d�scr�m�nate aga�nst �mports. Taxes could also be placed on exports and on primary factor income. Finally, where relevant, taxes are placed on final consumption, and these can be applied d�fferent�ally to the consumpt�on of domest�c and �mported goods.
Data �mprovement
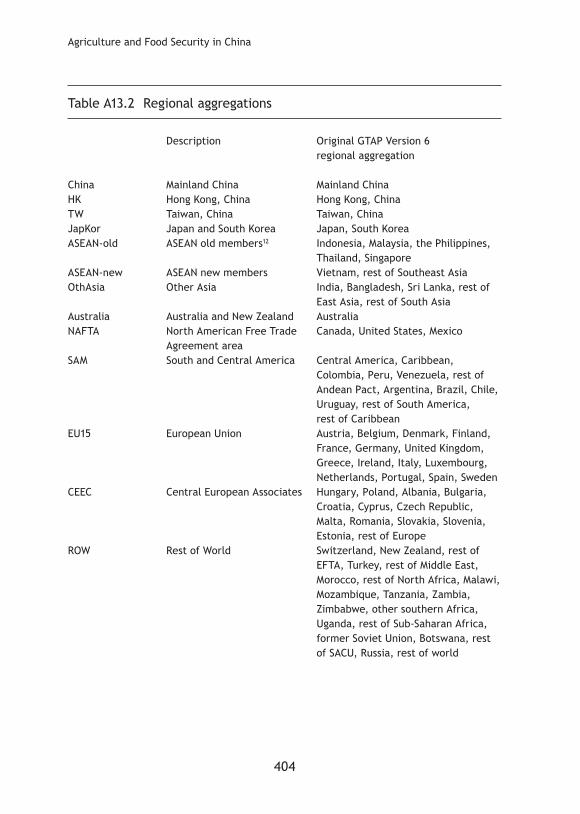
The GTAP database contains detailed bilateral trade, transport and protection data character�s�ng econom�c l�nkages among reg�ons. Reg�ons are l�nked w�th individual country input–output databases, which account for inter-sectoral linkages among the 57 sectors in each of the 87 regions. The database provides detailed sectoral classifications for agriculture, with 14 primary agricultural sectors and seven agr�cultural-process�ng sectors. The base year for the version used in this study (Version 6) is 2001. For the purpose of the study, the database has been aggregated into 13 regions and 22 sectors. The regional and sectoral aggregations are summarised in Tables A13.2 and A13.3.
Before applying the GTAP Version 6, we carefully examined the database and parameters for Ch�na and made substant�al �mprovements �n several aspects related to agricultural input and output ratios, demand parameters, trade pol�c�es and product�on values. The ma�n �mprovements to GTAP Version 6 include the following.
381
The economic impact of the ASEAN–China Free Trade Area
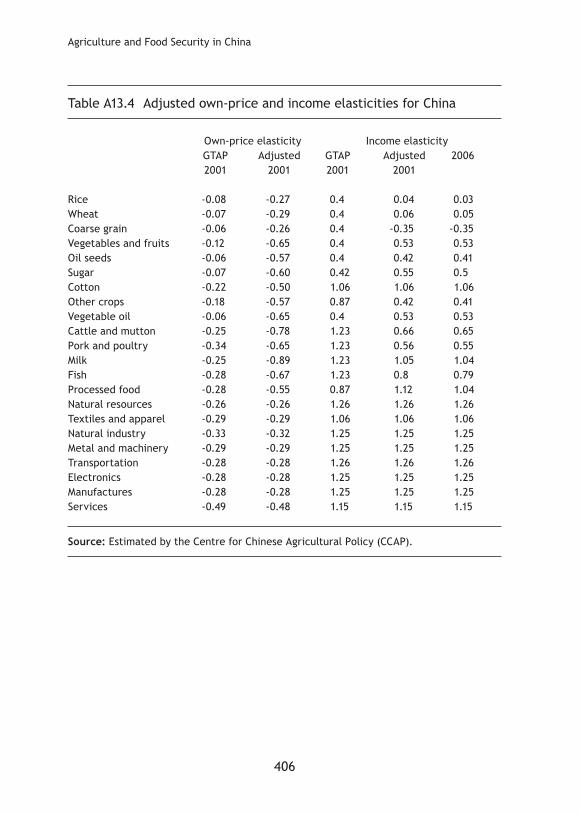
Input–output tables in the agricultural sector. We overcame some of the shortcom�ngs �n the database by tak�ng advantage of data that were collected by the Nat�onal Development and Reform Comm�ss�on (NDRC) and government organ�sat�ons. The NDRC collects data on the costs of product�on of all of Ch�na’s major crops and l�vestock �ndustr�es. The data set conta�ns �nformat�on on quant�t�es and total expend�ture of labour and mater�al �nputs as well as expend�ture on a large number of m�scellaneous costs such as tax, transportation and marketing. Each farmer reports output and the total revenue earned from crops or l�vestock. The data were used prev�ously �n analyses of Ch�na’s agr�cultural supply and �nput demand (Huang and Rozelle 1996; World Bank 1997). Similar methods have been used for other studies (Huang and Yang 2006; Tongeren and Huang 2004). In this way, we ensure the balance and consistency of input–output relat�onsh�ps among sectors.Improving own-price and income elasticities for China. We �ncorp-orated the most up-to-date est�mates for pr�ce and �ncome elast�c�t�es of demand for various foods in China (Fan et al. 1995; Huang and Bouis 1996; Huang and Rozelle 1998). Table A13.4 summarises the major adjustments that have been made. In addition, we assume that income elasticities of demand for var�ous commod�t�es w�ll change as �ncomes �ncrease. Th�s �s an essent�al assumpt�on for long-term s�mulat�ons. Based on other emp�r�cal studies (Huang and Bouis 1996; Huang and Rozelle 1998), we assume that food income elasticities decline with income growth (Table A13.4). Us�ng �nformat�on on uncompensated �ncome elast�c�t�es and own-pr�ce elasticities, we recalibrate the expansion and substitution parameters for the CDE by the method introduced by Liu et al. (1998) and Yu et al. (2003). Trade distortions. Various studies have estimated the magnitude of agr�cultural pr�ce d�stort�ons us�ng ava�lable ser�es on domest�c and international prices. Unfortunately, the results obtained have varied widely. Huang et al. (2004) adopted a new approach, which estimated the policy �mpacts from deta�led �nterv�ews w�th part�c�pants �n Ch�na’s agr�cultural market�ng and trad�ng act�v�t�es. Th�s approach prov�des a much clearer �nd�cat�on of the �mpl�cat�ons of agr�cultural trade pol�c�es than would otherw�se be poss�ble. The�r results have been used �n several recent
382
Agriculture and Food Security in China
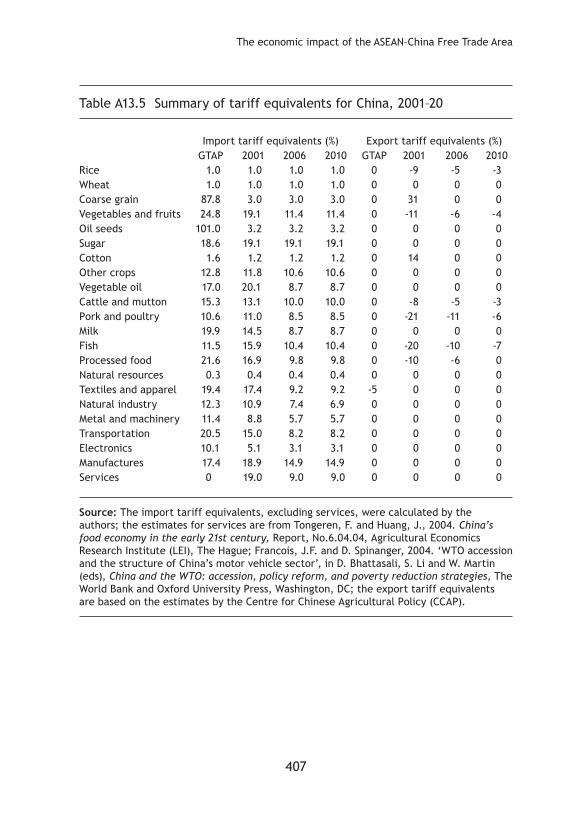
stud�es on the �mpacts of WTO access�on on Ch�na’s economy (Bhattasal� et al. 2004; Anderson et al. 2004; Ianchovichina and Martin 2004). We adjust �mport and export tar�ff equ�valents of agr�cultural commod�t�es �n the base year (2001) using results from the study by Huang et al. (2004). Details of the adjustments are provided in Table A13.5.
Assumpt�ons for the d�fferent scenar�os
The central goal of th�s study �s to assess the econom�c �mpacts of the ACFTA during its various stages of implementation. Towards this end, three scenarios have been developed: I) the baseline scenario; II) the EHP policy scenario in 2006; and III) the full implementation of the ACFTA by 2010.The baseline scenarios. In this study, we compare two trade liberalis-ations over two different periods: the EHP during 2004–06 and the full implementation of the ACFTA during 2006–10. We construct two baselines (I and II) to evaluate the effects of pol�cy changes �n the two per�ods. Baseline (I) is constructed for the period 2001–06 to capture the effects of the EHP; Baseline (II) incorporates the effects of the EHP during 2001–06 and projects to 2010 �n order to �solate the effects of the l�beral�sat�on �n the second stage.
Both basel�nes are constructed us�ng a recurs�ve dynam�c approach to reflect the changes over time in the endowments of the countries. This procedure has been used in several other studies (for example, Hertel and Martin 1999; Tongeren and Huang 2004). The growth in endowments (GDP, population, skilled and unskilled labour, capital and natural resources) is taken mainly from other similar studies (Huang and Yang 2006; Tongeren and Huang 2004; Walmsley et al. 2000).
The basel�ne project�on also �ncludes a cont�nuat�on of ex�st�ng pol�c�es and the effectuat�on of �mportant pol�cy events related to �nternat�onal trade, as they are known to date. The important policy changes are: �mplementat�on of the rema�n�ng comm�tments from the General Agreement on Tar�ffs and Trade (GATT) Uruguay Round agreements; Ch�na’s WTO access�on comm�tments between 2001 and 2010; the global phase-out of the Multifibre Agreement under the WTO Agreement on Textiles and
383
The economic impact of the ASEAN–China Free Trade Area
Cloth�ng (ATC) by January 2005; European Un�on enlargement to �nclude Central and Eastern European countr�es (CEECs); and the �mplementat�on of the AFTA among ASEAN member countries. The economic effects of the EHP during 2004–06. Under the EHP scenario, all assumpt�ons under the Basel�ne (I) scenar�o are held except for the �mport tariffs on commodities listed in the EHP between China and ASEAN member countries. According to the protocol of the EHP, the import tariffs were to be el�m�nated �n Ch�na and the or�g�nal ASEAN members before 1 January 2006. Therefore, in this simulation, tariffs between China and the old ASEAN members are reduced to zero on the commodities listed in the EHP.
As for the new ASEAN members, there is a longer period for them to reduce their tariffs on commodities listed in the EHP. As the tariffs on many commodities were to be reduced to about 5 per cent by 2006 (Shang 2005), we adopt the s�mple and reasonable assumpt�on that the �mport tar�ffs of commodities listed in the EHP for China’s exports to the newer ASEAN members were reduced to 5 per cent �n 2006. The �mport tar�ffs for the newer ASEAN members’ exports to Ch�na w�ll be el�m�nated.The full implementation of the ACFTA by 2010. Under the scenar�o of the full implementation of the ACFTA, all assumptions for Baseline (II) are ma�nta�ned except for the �mport tar�ffs between Ch�na and ASEAN. According to the trade-in-goods agreement, participating countries will el�m�nate substant�ally tar�ffs and non-tar�ff barr�ers for all products traded. For ASEAN+6 and China, the schedule for the bulk of the goods subject to tariff elimination is before 2010. Therefore, tariffs between China and old ASEAN members w�ll be reduced to zero on all commod�t�es that are not included in the EHP.
As for the newer ASEAN members, they have five additional years (until 2015) to remove all import tariff lines, including tariffs on commodities listed in the EHP. Therefore, in this simulation, we assume newer ASEAN members w�ll make no l�beral�sat�on except for �mplement�ng the�r comm�tments �n the EHP, but their exports to China will face zero import tariffs.
Comparison of the simulation results with those for the first stage of the EHP will help us understand the impacts of the second stage of l�beral�sat�on.
384
Agriculture and Food Security in China
S�mulat�on results and explanat�ons
In this section, we present the economic impacts of the EHP during 2004–06 and the full implementation of the ACFTA for other commodities during 2006–10 separately. Some of the economic forces underlying the impacts are analysed.
The economic impacts of the EHP
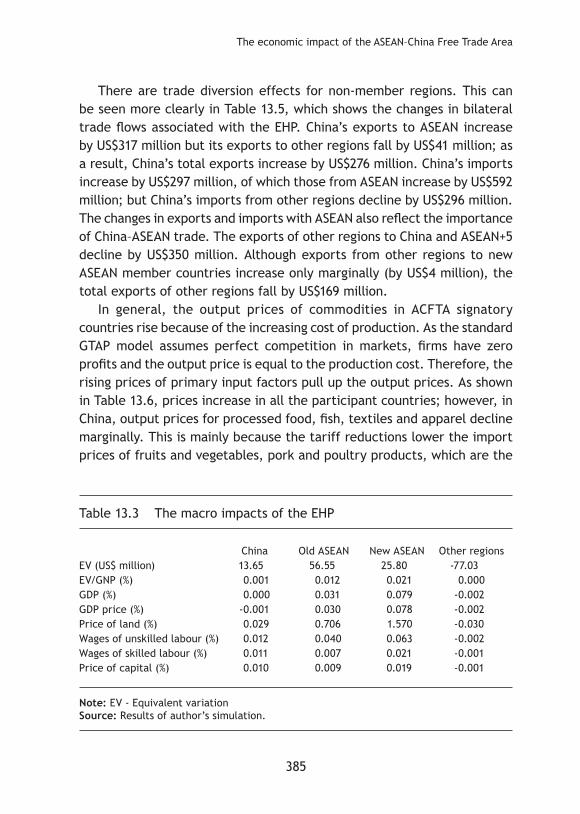
The welfare effects of the EHP are presented in Table 13.3, and the participant countries capture the benefits. The ASEAN+5 countries are the b�ggest w�nners �n terms of the absolute �ncrease �n soc�al welfare (US$56.55 million). Newer ASEAN members are next, with welfare increasing by US$25.8 million. The newer ASEAN members are, however, the biggest winners in relative terms. China’s welfare increase is modest at US$13.65 million. As for other regions,10 their total welfare declines by US$77.03 million because of trade diversion effects. As a whole, global welfare rises by US$18.97 million.
The returns to primary inputs—that is, land, capital and labour—increase in all the EHP countries. As trade liberalisation through the EHP promotes production in all countries, the demand for primary factors increases. Therefore, the price of primary factors rises in the new equilibrium under the assumption of the fixed supply of primary factors. The price of land increases by 0.029 per cent in China, by 0.71 per cent in ASEAN+5 and by 1.57 per cent �n the newer ASEAN members. As relat�vely more unsk�lled labour is employed in the agricultural sector, the wage increases of unskilled labour are greater than for skilled labour in EHP countries. The returns to pr�mary factors fall �n other reg�ons.
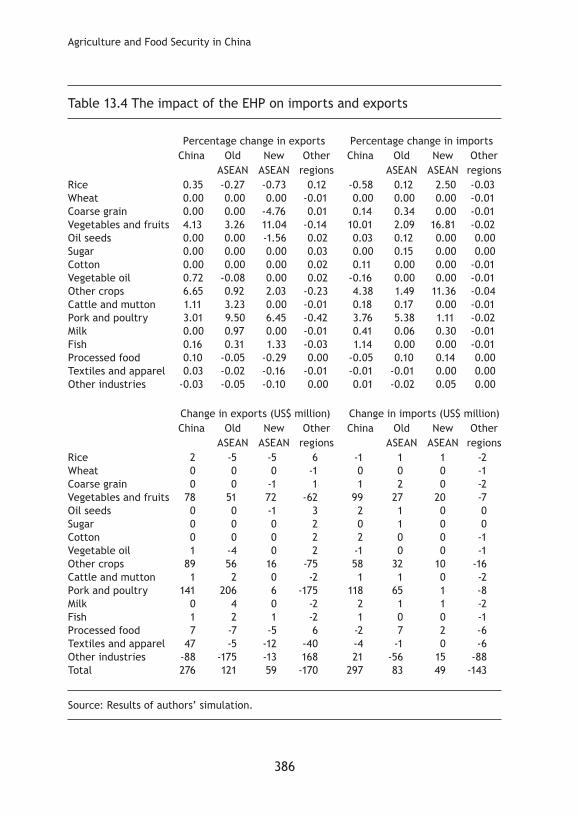
Trade increases in all of the ACFTA signatory countries. As shown in Table 13.4, total exports and imports increase in China by US$276 million and US$297 million respectively, by US$121 million and US$83 million in ASEAN+5 and by US$59 million and US$49 million in new ASEAN member countries. In aggregate, the EHP increases global exports (or imports) by US$286 million. Moreover, the exports and imports of the commodities listed in the EHP increase in all ACFTA signatory countries and their growth rates are larger than those of other commod�t�es.
385
The economic impact of the ASEAN–China Free Trade Area
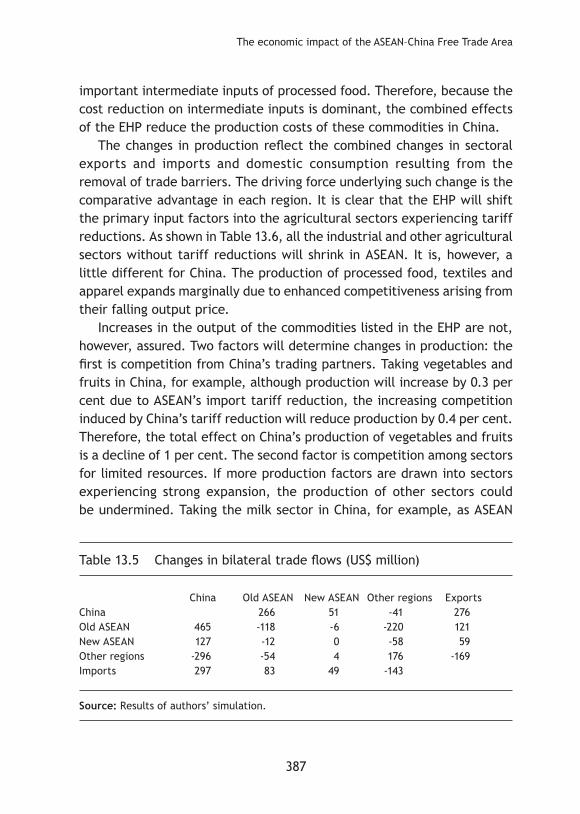
There are trade d�vers�on effects for non-member reg�ons. Th�s can be seen more clearly in Table 13.5, which shows the changes in bilateral trade flows associated with the EHP. China’s exports to ASEAN increase by US$317 million but its exports to other regions fall by US$41 million; as a result, China’s total exports increase by US$276 million. China’s imports increase by US$297 million, of which those from ASEAN increase by US$592 m�ll�on; but Ch�na’s �mports from other reg�ons decl�ne by US$296 m�ll�on. The changes in exports and imports with ASEAN also reflect the importance of China–ASEAN trade. The exports of other regions to China and ASEAN+5 decline by US$350 million. Although exports from other regions to new ASEAN member countries increase only marginally (by US$4 million), the total exports of other reg�ons fall by US$169 m�ll�on.
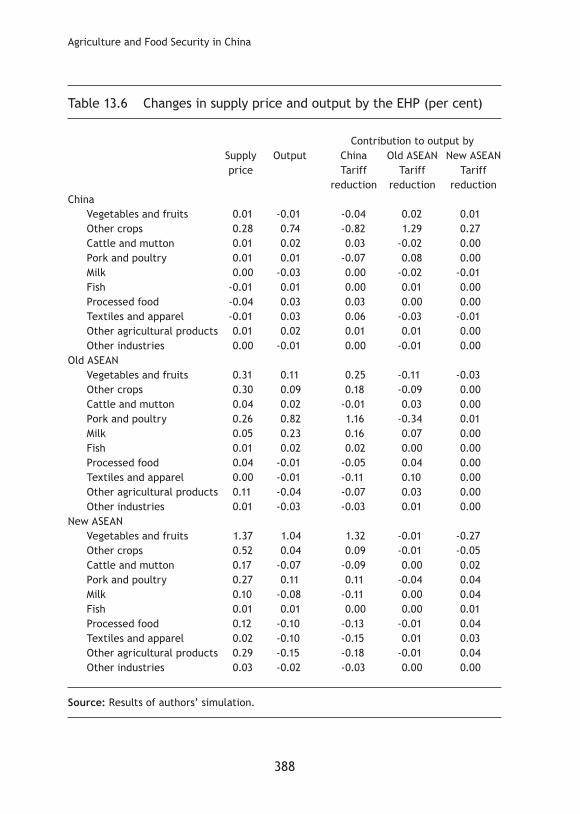
In general, the output prices of commodities in ACFTA signatory countr�es r�se because of the �ncreas�ng cost of product�on. As the standard GTAP model assumes perfect competition in markets, firms have zero profits and the output price is equal to the production cost. Therefore, the r�s�ng pr�ces of pr�mary �nput factors pull up the output pr�ces. As shown in Table 13.6, prices increase in all the participant countries; however, in China, output prices for processed food, fish, textiles and apparel decline marg�nally. Th�s �s ma�nly because the tar�ff reduct�ons lower the �mport prices of fruits and vegetables, pork and poultry products, which are the
Table 13.3 The macro impacts of the EHP
Ch�na Old ASEAN New ASEAN Other reg�onsEV (US$ million) 13.65 56.55 25.80 -77.03EV/GNP (%) 0.001 0.012 0.021 0.000GDP (%) 0.000 0.031 0.079 -0.002GDP price (%) -0.001 0.030 0.078 -0.002Price of land (%) 0.029 0.706 1.570 -0.030Wages of unskilled labour (%) 0.012 0.040 0.063 -0.002Wages of skilled labour (%) 0.011 0.007 0.021 -0.001Price of capital (%) 0.010 0.009 0.019 -0.001
Note: EV - Equivalent variation Source: Results of author’s s�mulat�on.
386
Agriculture and Food Security in China
Table 13.4 The impact of the EHP on imports and exports
The economic impact of the ASEAN–China Free Trade Area
important intermediate inputs of processed food. Therefore, because the cost reduction on intermediate inputs is dominant, the combined effects of the EHP reduce the production costs of these commodities in China.
The changes in production reflect the combined changes in sectoral exports and �mports and domest�c consumpt�on result�ng from the removal of trade barr�ers. The dr�v�ng force underly�ng such change �s the comparative advantage in each region. It is clear that the EHP will shift the pr�mary �nput factors �nto the agr�cultural sectors exper�enc�ng tar�ff reductions. As shown in Table 13.6, all the industrial and other agricultural sectors without tariff reductions will shrink in ASEAN. It is, however, a little different for China. The production of processed food, textiles and apparel expands marg�nally due to enhanced compet�t�veness ar�s�ng from the�r fall�ng output pr�ce.
Increases in the output of the commodities listed in the EHP are not, however, assured. Two factors will determine changes in production: the first is competition from China’s trading partners. Taking vegetables and fruits in China, for example, although production will increase by 0.3 per cent due to ASEAN’s import tariff reduction, the increasing competition �nduced by Ch�na’s tar�ff reduct�on w�ll reduce product�on by 0.4 per cent. Therefore, the total effect on China’s production of vegetables and fruits �s a decl�ne of 1 per cent. The second factor �s compet�t�on among sectors for l�m�ted resources. If more product�on factors are drawn �nto sectors experiencing strong expansion, the production of other sectors could be undermined. Taking the milk sector in China, for example, as ASEAN
Table 13.5 Changes in bilateral trade flows (US$ million)
The economic impact of the ASEAN–China Free Trade Area
tariff reductions will promote production in some sectors quite strongly, production factors will be drawn away from the milk sector; as a result, the production of milk will fall by 0.03 per cent due to the relocation of product�on factors.
The economic impacts of the full implementation of the ACFTA
The macro effects of the full implementation of the ACFTA are much larger than those of the EHP. The increases in real GDP and social welfare in the ACFTA signatories are much larger than those in the EHP (Table 13.7). Welfare in all ACFTA signatories increases by US$1.8 billion, with US$451 million in China, US$1.25 b�ll�on in ASEAN+5 and US$92 million in the new ASEAN members. ASEAN+5 is the largest beneficiary in absolute and relat�ve terms. The negat�ve �mpacts on the rest of the world are also more significant than those of the EHP. The social welfare of other regions decl�nes by US$1.9 b�ll�on. The global welfare loss due to the creat�on of the ASEAN–China Free Trade Area is US$115 million.
The impacts on the returns to primary factors in ACFTA signatories are substantial. As shown in Table 13.7, all the returns to primary factors increase in China and in the new ASEAN members. As for ASEAN+5, returns to labour and cap�tal �ncrease wh�le returns to land decl�ne. Land �s the sluggish factor in the GTAP model, so its price can vary across sectors (Hertel 1997). The land prices reported in Table 13.7 reflect the aggregate effects of pol�cy changes on land use. Because the non-agr�cultural sectors in ASEAN+5 grow so strongly and draw labour and capital away from agricultural sectors, the demand for land declines. As a result, land prices drop after the full implementation of the ACFTA. The returns to primary factors �n the other reg�ons decl�ne marg�nally.
The results indicate that there will be trade gains for all ACFTA s�gnator�es. Trade creat�on w�ll eas�ly offset trade d�vers�on. As shown �n Tables 13.8 and 13.9, total exports and imports increase by US$6.5 billion and US$6.8 billion, respectively, for China, by US$4.7 billion and US$4.9 billion for ASEAN+5 and by US$153 million and US$203 million for the new ASEAN members. As a whole, the implementation of the ACFTA by 2010 will promote global exports of US$8.2 billion.
The effects on exports and �mports vary remarkably across sectors. Wh�le
390
Agriculture and Food Security in China
there are declines in cattle and mutton, pork and poultry, manufacturing and services, exports of other commodities from China increase. As shown in Table 13.8, the most significant growth in absolute terms is in electronic products �n the �ndustr�al sector and �n processed food �n the agr�cultural sector. Although the growth of sugar in China is very impressive, its increase �n absolute terms �s l�m�ted as �ts �n�t�al export value �s very small. As for ASEAN+5 and the new ASEAN members, exports of natural resource-related �ndustr�al products �n the �ndustr�al sector and vegetable o�ls �n the agricultural sector increase most significantly in absolute terms. The growth in the export of sugar is also quite remarkable—in ASEAN+5 and in the new ASEAN members.
Imports also rise among the ACFTA signatories. China’s imports of sugar and vegetable oil rise significantly, increasing by 10.5 per cent (US$40 million) and 28.5 per cent (US$174 million) respectively. As China does not have comparative advantage in these two agricultural commodities, its imports of vegetable o�ls (ma�nly palm o�l) from ASEAN have r�sen dramat�cally �n recent years. The el�m�nat�on of �mport tar�ffs w�ll further st�mulate the �mportat�on of vegetable o�l from ASEAN. Ch�na’s �mports of natural resource-related industrial products, electronics and metal and machinery also increase significantly. The increase in these three commodities accounts for 85.5 per
Table 13.7 The macro effects of the implementation of the ACFTA, up to 2010
Ch�na Old ASEAN New ASEAN Other reg�onsEV (US$ million) 451 1,254 92 -1,912EV/GNP (%) 0.025 0.244 0.062 -0.006GDP (%) 0.141 0.610 0.351 0.034GDP price (%) 0.136 0.576 0.338 -0.033Price of land (%) 0.200 -0.071 0.156 0.001Wages of unskilled labour (%) 0.288 0.877 0.310 -0.002Wages of skilled labour (%) 0.311 0.848 0.317 -0.001Price of capital (%) 0.306 0.889 0.333 -0.001
Note: EV - Equivalent variation Source: Results of authors’ s�mulat�on.
391
The economic impact of the ASEAN–China Free Trade Area
cent of the total �ncrease �n �mports of �ndustr�al products.For ASEAN+5, among agricultural products, imports of processed food
increase most significantly (by 2.83 per cent or US$212 million). Imports of all industrial products increase, with the highest growth rate of 6.75 per cent (US$683 million) in textiles and apparel, and the largest increase in value of US$1.05 billion in metal and machinery (a 1.98 per cent increase). Because the new ASEAN members w�ll cont�nue to �mplement the tar�ff reduct�on
Table 13.8 Impacts on exports after implementation of the ACFTA, up to 2010
schedule for the commodities listed in the EHP during 2006–10, imports of these agr�cultural commod�t�es �ncrease more than �mports of other commodities. As there is no liberalisation in industrial sectors, the import growth of �ndustr�al products �n the new ASEAN members �s very small.
There is significant trade diversion from the non-member regions during the full implementation of the ACFTA. China’s exports to ASEAN+5 and the new ASEAN members increase by 35.6 per cent (US$8.8 billion) and 0.9 per
Table 13.9 Impacts on imports of the implementation of the ACFTA, up to 2010
The economic impact of the ASEAN–China Free Trade Area
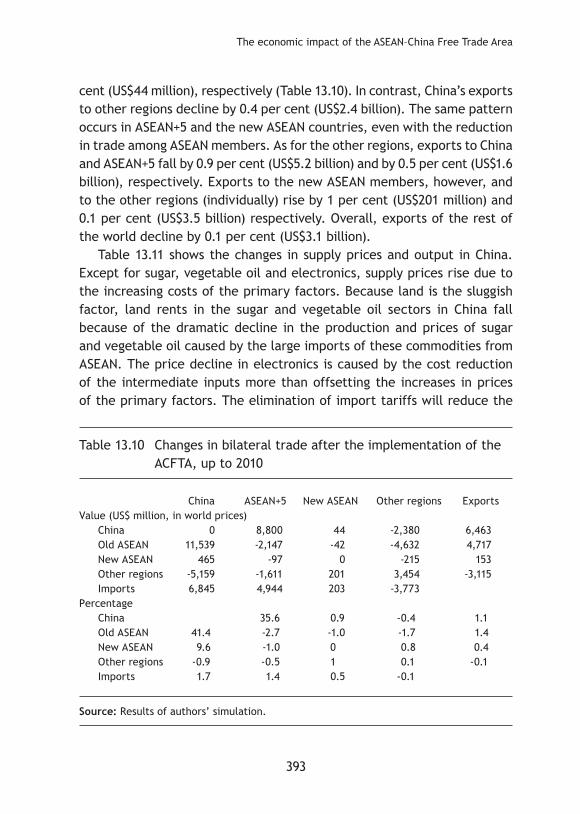
cent (US$44 million), respectively (Table 13.10). In contrast, China’s exports to other reg�ons decl�ne by 0.4 per cent (US$2.4 b�ll�on). The same pattern occurs in ASEAN+5 and the new ASEAN countries, even with the reduction in trade among ASEAN members. As for the other regions, exports to China and ASEAN+5 fall by 0.9 per cent (US$5.2 billion) and by 0.5 per cent (US$1.6 billion), respectively. Exports to the new ASEAN members, however, and to the other reg�ons (�nd�v�dually) r�se by 1 per cent (US$201 m�ll�on) and 0.1 per cent (US$3.5 billion) respectively. Overall, exports of the rest of the world decline by 0.1 per cent (US$3.1 billion).
Table 13.11 shows the changes in supply prices and output in China. Except for sugar, vegetable oil and electronics, supply prices rise due to the �ncreas�ng costs of the pr�mary factors. Because land �s the slugg�sh factor, land rents in the sugar and vegetable oil sectors in China fall because of the dramat�c decl�ne �n the product�on and pr�ces of sugar and vegetable o�l caused by the large �mports of these commod�t�es from ASEAN. The pr�ce decl�ne �n electron�cs �s caused by the cost reduct�on of the �ntermed�ate �nputs more than offsett�ng the �ncreases �n pr�ces of the pr�mary factors. The el�m�nat�on of �mport tar�ffs w�ll reduce the
Table 13.10 Changes in bilateral trade after the implementation of the ACFTA, up to 2010
China ASEAN+5 New ASEAN Other regions ExportsValue (US$ million, in world prices)
import prices of finished and semi-finished products of electronics from ASEAN. Imported semi-finished electronic products account for a significant share of the total production cost of electronics. As a result, the prices of electron�cs �n Ch�na fall.
In China, the ACFTA will promote the production and increase the output of rice, vegetables and fruits, processed foods and fish in the agricultural sector and metal and machinery, transportation and electronics in the industrial sector (Table 13.11). In order to distinguish between the effects of trade liberalisation on output in agriculture and industry, we further decompose the total �mpacts on output �nto three sources: the contr�but�on of tar�ff reduct�ons on agr�cultural commod�t�es l�sted �n the EHP for the new ASEAN members; the contribution of tariff reductions on other agr�cultural commod�t�es; and the contr�but�on of tar�ff reduct�ons on �ndustr�al products.
The decompos�t�on of the total �mpacts on output reveals the d�rect effect of trade l�beral�sat�on and the effect of resource relocat�on. Tak�ng the processed-food sector in China, for example, the tariff reduction in the agricultural sector increases its production by 0.26 per cent, but the l�beral�sat�on of �ndustry draws resources out of the agr�cultural sector and reduces processed-food production by 0.03 per cent. The combined impact �s to �ncrease processed-food product�on by 0.24 per cent. As vegetables and fru�ts are the most �mportant �ntermed�ate �nputs of the processed-food industry, the increase in output of the processed-food sector promotes the product�on of vegetables and fru�ts.11
Ch�na’s huge domest�c market w�ll prov�de great opportun�t�es for ASEAN countries, but the effects on output will be determined by their comparative advantages and by competition among sectors. As Table 13.12 shows, the supply prices of all commodities in ASEAN+5 rise; however, this is not the case for output. In agricultural sectors, the output of sugar and vegetable oil increases but other agricultural sectors shrink. In the industrial sector, the output of natural resource-related industry, electronics and metal and mach�nery �ncreases but the others decl�ne. The full �mplementat�on of the ACFTA should, therefore, help ASEAN+5 members to exploit their comparat�ve advantages.
According to the ACFTA, the new ASEAN members will have a transitional
395
The economic impact of the ASEAN–China Free Trade Area
period beyond 2010 to eliminate most import tariffs, but they will continue to reduce the tariff lines on commodities listed in the EHP until 2010. For commodities not listed in the EHP, the new ASEAN members will enjoy the opportun�t�es of reduced tar�ffs �n Ch�na’s market w�thout any liberalisation on their part before 2010. As shown in Table 13.13, the tariff reductions on the commodities in the EHP reduce the production of those agricultural commodities, except for fish, in the new ASEAN members.
Table 13.11 Changes in China in supply prices and output from the implementation of the ACFTA, up to 2010
The output of vegetable oil, sugar, cotton, processed food, oil seeds and rice is, however, expected to increase. In the industrial sector, the output of natural resource-related industry, electronics, and manufactures will increase, but others will shrink.
Table 13.12 Changes in ASEAN+5 in supply prices and output after the implementation of the ACFTA, up to 2010
The economic impact of the ASEAN–China Free Trade Area
Conclusions
This chapter assesses the economic effects of the ACFTA in its two stages up to 2010. The analys�s �s based on an �mproved recurs�ve GTAP model. The data are based on Version 6 of the GTAP database for 2001, together w�th data der�ved from other sources. There are two d�st�ngu�sh�ng characteristics of this study. The first is that, in addition to the commitments in the ACFTA, the study incorporates trade liberalisation in China (China’s
Table 13.13 Changes in the new ASEAN members in supply prices and output after the implementation of the ACFTA, up to 2010
WTO comm�tments) and trade l�beral�sat�on �n ASEAN (ASEAN free trade comm�tments). The second �s that we have separated and explored the different effects of the two-stage implementation of the ACFTA. The following are the key findings of the study.
All member countries will gain from the ACFTA: it will increase social welfare and promote real GDP in the EHP phase from 2004–06 and in the fuller implementation during 2006–10. As the EHP includes only a small package of agricultural commodities, the gains during the fuller implementation of the ACFTA will be much larger in all member countries.
There is a large trade creation effect among the ACFTA signatories; their total exports will increase. A trade diversion effect is, however, also apparent. Trade between ACFTA signatories and other regions can be expected to decl�ne due to the creat�on of the agreement. Because the trade creation effect is much larger than the trade diversion effect, global trade will be increased by the ACFTA, especially in the fuller �mplementat�on stage of the agreement.
The ACFTA will bring about substantial structural changes in China and �n ASEAN countr�es. Trade l�beral�sat�on w�ll �mprove the explo�tat�on of comparative advantages in ACFTA signatories. The structural changes will take place �n the agr�cultural and �ndustr�al sectors. Our results also show that the d�fferent pol�cy arrangements stemm�ng from the two-stage trade l�beral�sat�on w�ll have d�fferent �mpacts on the sh�fts �n econom�c structure dur�ng the process of �mplementat�on.
The rest of the world w�ll have to face the challenges brought about by the ACFTA. Because the agreement will enhance the competitiveness of China and ASEAN in each other’s markets, exports from non-member countr�es w�ll be subst�tuted. Soc�al welfare and real GDP w�ll decl�ne �n the non-member countries as a result of the creation of the ACFTA.
The results provide some useful insights into the impacts of the ACFTA on trade and economic relations between China and ASEAN; however, some limitations of the exercise should be mentioned. First, as many studies have observed, there are serious disguised unemployment problems in agricultural sectors. This reality is not modelled. Therefore, instead of the increases in wages the ACFTA gives rise to in the simulations, it is more likely that the ACFTA will create job opportunities. If we take this factor into account, China’s gain from the agreement could be much larger and the
399
The economic impact of the ASEAN–China Free Trade Area
changes �n sectoral output could be d�fferent to the results of th�s study. Second, because of the lack of information about the barriers to trade in services, this study does not capture the impact of liberalisation in the services sectors. Finally, no allowance has been made for possible increases in capital formation and improvements in productivity that the ACFTA could engender. It �s poss�ble that the dynam�c growth and product�v�ty ga�ns of the ACFTA could turn out to be very significant.
Notes
1 The ACFTA will be established in 2010 for ASEAN+6 and China; it will include the newer ASEAN member states of Cambodia, Laos, Myanmar and Vietnam after 2015.
2 This schedule holds for China, Brunei, Singapore, Thailand, Malaysia and Indonesia. Cambodia, Vietnam, Myanmar and Laos will complete their EHP in 2010. The Philippines has not concluded �ts negot�at�ons.
3 A more complete description of the terms of China’s WTO accession is available from http://www.wto.org/english/news_e/pres01_e/pr243_e.htm
4 In this study, all import tariffs—by commodity and country—are calculated by this method.
5 Despite its status as a developing country, China’s de minimis exemption for product-specific support is only 8.5 per cent of the value of production of each agricultural product. In comparison, a 10 per cent rate has been agreed with other developing countries.
6 These products include rice, wheat, maize, edible oils, sugar, cotton and wool.7 The full name for the amend�ng protocol �s the Protocol to Amend the Agreement on
the Common Effective Preferential Tariff (CEPT) Scheme for the ASEAN Free Trade Area (AFTA) for the Elimination of Import Duties. The agreement can be downloaded from http://www.aseansec.org/14183.htm
8 Member states—except Cambodia, Laos, Myanmar and Vietnam—will eliminate all other non-tariff barriers on sensitive and highly sensitive products by 1 January 2010. Vietnam will eliminate all other non-tariff barriers on sensitive products by 1 January 2013, Laos and Myanmar by 1 January 2015 and Cambodia by 1 January 2017.
9 The deadlines for eliminating tariffs on commodities listed in the EHP vary among the newer ASEAN members: Vietnam before 1 January 2008; Laos and Myanmar before 1 January 2009; and Cambod�a before 1 January 2010.
10 We focus mainly on the effects of the ACFTA on China and ASEAN countries. For other countries, we present only the total effects on the rest of the world (other regions).
11 As the GTAP model adopts the Leontief technology, an output increase in a sector promotes �ts demand for �ntermed�ate �nputs by the same proport�on.
12 As the GTAP Version 6 database has no detailed information on Brunei, only the other five members are included as representative of the original ASEAN members.
400
Agriculture and Food Security in China
References
Anderson, K., Huang, J. and Ianchovichina, E., 2004. ‘Will China’s WTO accession worsen farm household income?’, China Economic Review, 15:443–56.
ASEAN Joint Experts Group, 2001. Forging closer ASEAN–China economic relations in the 21st century, Report submitted by the ASEAN–China Expert Group on Economic Cooperation, October. Available from http://www.aseansec.org/newdata/asean_chi.pdf.
ASEAN-China FTA Framework Agreement, 2002. Available online at http://www.bilaterals.org/article.php3?id_article=2488.
ASEAN Secretariat, 2002. Southeast Asia: a free trade area. Ava�lable from http://www.aseansec.org/viewpdf.asp?file=/pdf/afta.pdf.
Bhattasali, D., Li., S. and Martin, W. (eds), 2004. China and the WTO: accession, policy reform, and poverty reduction strategies, The World Bank and Oxford University Press, Washington, DC.
Chirathivat, S., 2002. ‘ASEAN–China Free Trade Area: background, implications and future development’, Journal of Asian Economics, 13(5):671–86.
Ethier, W., 2000. ‘The new regionalism’, Economic Journal, 108:1,149–61.Fan, S., Wales, E.J. and Crame, G.L., 1995. ‘Household demand in rural
China: a two-stage LES-AIDS model’, American Journal of Agricultural Economics, 77:54–62.
Francois, J.F. and D. Spinanger, 2004. ‘WTO accession and the structure of China’s motor vehicle sector’, in D. Bhattasali, S. Li and W. Martin (eds), China and the WTO: accession, policy reform, and poverty reduction strategies, The World Bank and Oxford University Press, Washington, DC.
Fukase, E. and Winters, L.A., 2003. ‘Possible dynamic effects of AFTA for the new member countries’, World Economy, 26:853–71.
Hertel, T.W. (ed.), 1997. Global Trade Analysis: modelling and applications, Cambr�dge Un�vers�ty Press.
Hertel, T.W. and Martin, W., 1999. Would developing countries gain from inclusion of manufactures in the WTO negotiations?, GTAP Working Paper, Purdue University, West Lafayette.
401
The economic impact of the ASEAN–China Free Trade Area
Holst, D. and Weiss, J., 2004. ‘ASEAN and China: export rivals or partners in regional growth?’, The World Economy, 27(8):1,255–74.
Huang, J. and Bouis, H., 1996. Structural changes in demand for food in Asia, Food, Agriculture and the Environment Discussion Paper, International Food Policy Research Institute, Washington, DC.
Huang, J. and Rozelle, S., 1996. ‘Technological change: rediscovery of the engine of productivity growth in China’s rural economy’, Journal of Development Economics, 49(2):337–69.
——, 1998. ‘Market development and food consumption in rural China’, Ch�na Economic Review, 9:25–45.
Huang, J. and Yang, J., 2006. ‘China’s rapid economic growth and its �mpl�cat�ons for agr�culture and food secur�ty �n Ch�na and the rest of world’, Management World, 1:67–76.
Huang, J., Rozelle, S. and Chang, M., 2004. ‘Tracking distortions in agriculture: China and its accession to the World Trade Organization’, World Bank Economic Review, 18(1):59–84.
Ianchovichina, E. and Martin, W., 2004. ‘Economic impacts of China’s accession to WTO’, in D. Bhattasali, S. Li. and W. Martin (eds), China and the WTO: accession, policy reform, and poverty reduction strategies, The World Bank and Oxford University Press, Washington, DC.
Liu, J., Surry, Y., Dimmaraman, B. and Hertal, T., 1998. ‘CDE calibration’, in R.A. McDougall, A. Elbehri and T.P. Truoung (eds), Global Trade Assistance and Protection: the GTAP 4 Data Base, Centre for Global Trade Analysis, Purdue University, West Lafayette.
Shang, G., 2005. The Trial Field of China–ASEAN Free Trade Area: early harvest. Ava�lable from http://b�g5.mofcom.gov.cn/gate/b�g5/www.mofcom.gov.cn/aarticle/Nocategory/200507/20050700180151.html
Tongzon, J., 2005. ‘ASEAN–China Free Trade Area: a bane or boon for ASEAN countries?’, World Economy, 28(2):191–210.
Tongeren, F. and Huang, J., 2004. China’s food economy in the early 21st century, Report, No.6.04.04, Agricultural Economics Research Institute (LEI), The Hague.
United Nations Statistics Division, Commodity Trade Statistics Database, COMTRADE. Available online at http://unstats.un.org/unsd/comtrade/default.aspx.
402
Agriculture and Food Security in China
Voon, J. and Yue, R., 2003. ‘China–ASEAN export rivalry in the US market: the importance of the HK–China production synergy and the Asian financial crisis’, Journal of Asia Pacific Economy, 8(2):157–79.
Walmsley, T.L., Betina, V.D. and Robert, A.M., 2000. A Base Case Scenario for the Dynamic GTAP Model, Centre for Global Trade Analysis, Purdue University, West Lafayette.
Wattanapruttipaisan, T., 2003. ‘ASEAN–China Free Trade Area: advantages, challenges, and implications for the newer ASEAN member countries’, ASEAN Economic Bulletin, 20(1):31–48.
Wong, J. and Chan, S., 2002. ‘China’s emergence as a global manufacturing centre: implications for ASEAN’, Asia Pacific Business Review, 9(1):79–94.
Source: Based on the HS system tariff schedules of the protocol of China’s WTO accession and weighted by 2001 import data from the COMTRADE database. The tariff rates for rice, wheat, other grains and plant-based fibres are in-quota rates.
404
Agriculture and Food Security in China
Table A13.2 Regional aggregations
Description Original GTAP Version 6 reg�onal aggregat�on
China Mainland China Mainland China HK Hong Kong, China Hong Kong, China TW Taiwan, China Taiwan, China JapKor Japan and South Korea Japan, South Korea ASEAN-old ASEAN old members12 Indonesia, Malaysia, the Philippines, Thailand, Singapore ASEAN-new ASEAN new members Vietnam, rest of Southeast AsiaOthAsia Other Asia India, Bangladesh, Sri Lanka, rest of East Asia, rest of South AsiaAustral�a Austral�a and New Zealand Austral�a NAFTA North American Free Trade Canada, United States, Mexico Agreement areaSAM South and Central America Central America, Caribbean, Colombia, Peru, Venezuela, rest of Andean Pact, Argentina, Brazil, Chile, Uruguay, rest of South America, rest of Car�bbeanEU15 European Union Austria, Belgium, Denmark, Finland, France, Germany, United Kingdom, Greece, Ireland, Italy, Luxembourg, Netherlands, Portugal, Spain, Sweden CEEC Central European Assoc�ates Hungary, Poland, Albania, Bulgaria, Croatia, Cyprus, Czech Republic, Malta, Romania, Slovakia, Slovenia, Estonia, rest of Europe ROW Rest of World Switzerland, New Zealand, rest of EFTA, Turkey, rest of Middle East, Morocco, rest of North Africa, Malawi, Mozambique, Tanzania, Zambia, Zimbabwe, other southern Africa, Uganda, rest of Sub-Saharan Africa, former Soviet Union, Botswana, rest of SACU, Russia, rest of world
405
The economic impact of the ASEAN–China Free Trade Area
Table A13.3 Sector aggregation
Original GTAP Version 6 sector aggregation
Rice Paddy rice, processed rice Wheat Wheat Coarse grain Cereals, grains nec Vegetables and fruits Vegetables, fruit, nutsO�l seeds O�l seeds Sugar Sugar cane, sugar beet, sugar Cotton Plant-based fibres Other crops Crops-nec Vegetable oil Cattle and mutton Cattle, sheep, goats, horses and their meat Pork and poultry Animal products nec, wool, silk-worm cocoons, meat products Milk Raw milk, dairy products Fish Fish Processed food Food products nec, beverages, tobacco products Natural resources Forestry, coal, oil, gas, minerals nec Textiles and apparel Textiles, clothing apparel, leather products Natural industry Wood products, paper products and publishing, petroleum, coal products; chemical, rubber and plastic products; m�neral productsMetal and machinery Ferrous metals, metals nec, metal products, machinery and equ�pment nec Transportation Motor vehicles and parts, transport equipment nec Electron�cs Electron�c equ�pmentManufactures Manufactures nec Services Electricity, gas manufacture, distribution, water, construction, trade, transport nec, sea transport, air transport, communication, financial services nec, insurance, business services nec, recreation and other services, public administration/defence/health/education, dwell�ngs
Note: nec - not elsewhere classified
406
Agriculture and Food Security in China
Table A13.4 Adjusted own-price and income elasticities for China
Source: The import tariff equivalents, excluding services, were calculated by the authors; the estimates for services are from Tongeren, F. and Huang, J., 2004. China’s food economy in the early 21st century, Report, No.6.04.04, Agricultural Economics Research Institute (LEI), The Hague; Francois, J.F. and D. Spinanger, 2004. ‘WTO accession and the structure of China’s motor vehicle sector’, in D. Bhattasali, S. Li and W. Martin (eds), China and the WTO: accession, policy reform, and poverty reduction strategies, The World Bank and Oxford University Press, Washington, DC; the export tariff equivalents are based on the est�mates by the Centre for Ch�nese Agr�cultural Pol�cy (CCAP).