ww.sciencedirect.com
i n t e r n a t i o n a l j o u r n a l o f h y d r o g e n en e r g y 3 8 ( 2 0 1 3 ) 1 1 4 5e1 1 5 6
Available online at w
journal homepage: www.elsevier .com/locate/he
Influences of geometry and flow pattern on hydrogenseparation in a Pd-based membrane tube
Wei-Hsin Chen a,*, Wei-Ze Syu b, Chen-I Hung b, Yu-Li Lin c, Chang-Chung Yang c
aDepartment of Greenergy, National University of Tainan, Tainan 700, Taiwan, ROCbDepartment of Mechanical Engineering, National Cheng Kung University, Tainan 701, Taiwan, ROCcEnergy and Environmental Laboratories, Industrial Technology Research Institute, Hsinchu 310, Taiwan, ROC
a r t i c l e i n f o
Article history:
Received 22 August 2012
Received in revised form
18 October 2012
Accepted 21 October 2012
Available online 26 November 2012
Keywords:
Palladium-based (Pd-based)
membrane
Concentration polarization
Hydrogen separation and recovery
Geometric size
Baffle
Numerical simulation
* Corresponding author. Tel.: þ886 6 2605031E-mail address: [email protected]
0360-3199/$ e see front matter Copyright ªhttp://dx.doi.org/10.1016/j.ijhydene.2012.10.0
a b s t r a c t
The abatement of concentration polarization in a membrane tube is of the utmost
importance for improving the efficiency of hydrogen separation. In order to enhance the
performance of hydrogen separation, the characteristics of hydrogen permeation in a Pd-
based membrane system under various operating conditions and geometric designs are
studied numerically. The effects of Reynolds numbers, shell size, baffle, and pressure
difference on hydrogen mass transfer across the membrane are evaluated. The predictions
suggest that a larger shell deteriorates concentration polarization, stemming from a larger
H2 concentration boundary layer. Baffles equipped in the shell are conducive to disturbing
H2 concentration boundary layer and reducing concentration polarization at the retentate
side, thereby intensifying H2 permeation. The more the number of baffles, the less the
increment of improvement in H2 permeation is. The installation of one baffle is recom-
mended for enhancing H2 separation and it is especially obvious under the environments
of high pressure difference. Within the investigated ranges of Reynolds number at the
permeate side and the retentate side, the feasible operating conditions are suggested in
this study.
Copyright ª 2012, Hydrogen Energy Publications, LLC. Published by Elsevier Ltd. All rights
reserved.
1. Introduction is the most abundant element in the universe [7], but most of
Hydrogen is important raw material and fuel in industry [1].
On the raw material aspect, hydrogen has been extensively
consumed for petroleum refining, production of ammonia and
methanol, desulfurization, hydrogenation of liquid oils, and
pharmaceutical products [2,3]. On the fuel side, hydrogen can
be used in liquid rocket engines, space shuttles, gas turbines,
and internal combustion engines as the source of power. On
account of much progress in low-temperature fuel cells in the
last decade [4e6], hydrogen production for power generation
from fuel cells has received a great deal of attention. Hydrogen
; fax: þ886 6 2602205.(W.-H. Chen).2012, Hydrogen Energy P68
the hydrogen is stored in water, hydrocarbons, and biomass
[8,9]. To gain pure hydrogen, fuel processing from the afore-
mentioned materials followed by hydrogen separation is thus
required.
In contrast to pressure swing adsorption and cryogenic
distillation, hydrogen separated from hydrogen-rich gas by
means of membranes, especially via Pd-based membranes,
seems to be more flexible for prospective hydrogen economy
[10e12]. This arises from the fact that hydrogen separation
through membranes can be achieved in small-scale facilities
which are suitable for fuel cell applications [5,13]. Besides,
ublications, LLC. Published by Elsevier Ltd. All rights reserved.
Nomenclature
Ac cross sectional area, m2
Am surface area of membrane, m2
C volumetric molar concentration, mol m�3
CPI concentration polarization index, dimensionless
cp gas mixture specific heat, J kg�1 K�1
D diffusion coefficient, m2 s�1
DH hydraulic diameter, m
Di inner diameter, m
Do outer diameter, m
F flux, mol m�2 s�1
K permeance, mol m�2 s�1 Pa�n
k thermal conductivity, W m�1 K�1
Mi molar mass of species i, kg kg mol�1
P pressure, Pa
Pw wetted perimeter, m
R universal gas constant, 8.314 m3 Pa K�1 mol�1
Re Reynolds number, dimensionless
S source term, kg m�3 s�1
T temperature, K
V velocity, m s�1
wi mass fraction of species i, dimensionless
xi mole fraction of species i, dimensionless
z axial coordinate, m
Greek letters
m viscosity, Pa s
r density, kg m�3
f binding factor, dimensionless
Ud diffusion collision integral, dimensionless
c volume of source domain or sink domain
Subscript
atm atmosphere
H2 hydrogen
i species i
in inlet
j species j
m membrane
p permeate side
r retentate side
total total pressure at the retentate side
i n t e rn a t i o n a l j o u r n a l o f h y d r o g e n en e r g y 3 8 ( 2 0 1 3 ) 1 1 4 5e1 1 5 61146
membrane separation possesses other advantages, such as
more compact system, lower energy consumption, and higher
purity of hydrogen [13,14]. In Pd-based membranes, hydrogen
separation is characterized by a solution-diffusion mecha-
nism [15] and local hydrogen flux across a membrane has
been extensively described by
FH2¼ K
�pnr;H2
� pnp;H2
�(1)
In the preceding equation, the pressure exponent n usually
ranges from 0.5 to 1 [16] and the ratio between the hydrogen
flux and the pressure difference is a constant, namely, the
permeance. Normally, the partial pressures of hydrogen at the
retentate side and the permeate one are expressed in terms of
the inlet conditions, based on the concept of continuous
stirred tank reactor (CSTR) [1,17]. The higher the hydrogen
partial pressure difference, the better the hydrogen flux. In
realistic situations, however, concentration polarization may
be encountered [17] and it is highly related to the performance
of membrane [18,19]. While hydrogen permeates through
a membrane, the partial pressure of hydrogen along the
membrane surface at the retentate side is reduced, whereas it
is increased at the permeate side stemming from hydrogen
accumulation [20]. This results in two mass transfer resis-
tances so that the behavior of hydrogen permeation departs
from the concept of CSTR. Currently, there is a trend to
develop high-permeance membranes. The transport resis-
tances due to concentration polarization will become more
obvious when high-permeance membranes are employed.
To minimize concentration polarization, two different
methods have been developed. The first route is introducing
a sweep gas into the permeate side of a membrane [20e24].
The sweep gas is able to move permeated hydrogen away
quickly so as to lower the partial pressure of hydrogen at the
permeate side. Considering the directions of sweep gas and
feed gas, two different flow patterns with one the counter-
current mode and the other the co-current one can be adop-
ted. The second mean is to change the flow field at the
retentate side of a membrane using baffles [1,25]. When the
flow field is disturbed by baffles, the hydrogen concentration
boundary layer along themembrane surface will be destroyed
to a certain extent. As a result, it yields a more uniform
hydrogen concentration field and the hydrogen partial pres-
sure along the membrane surface at the retentate side is
enlarged, thereby enhancing hydrogen separation efficiency.
Though a number of studies concerning the formation of
concentration polarization and its improvement have been
carried out, more detailed investigation is still required. For
instance, the information of concentration polarization
affected by scaling up a membrane module in order to
approach industrial applications is absent in past studies. In
addition, the combined effect of sweep gas and baffles on the
performance of hydrogen permeation under various operating
conditions has yet to be studied. To provide a comprehensive
recognition of hydrogen separation influenced by various
geometric designs and operations in a membrane system, the
present work aims to utilize a two-dimensional numerical
method to simulate the phenomena of hydrogen separation
and recovery from a gas mixture. The concentration polari-
zation and hydrogen separation efficiencywill be examined in
detail.
2. Mathematical formulation and modeling
2.1. Permeation system and governing equations
The membrane system consists of a membrane tube and
a shell, as shown in Fig. 1(a). Three different sizes of shell are
considered and their geometries are shown in Fig. 1(b). Steam
is adopted as the sweep gas and it is sent into the membrane
50 mm 100 mm
150
mm
400
mm
25 mm
a
b
8 mm
2
Fig. 1 e Schematics of (a) permeation system and
computational domains as well as (b) three different shell
sizes.
i n t e r n a t i o n a l j o u r n a l o f h y d r o g e n en e r g y 3 8 ( 2 0 1 3 ) 1 1 4 5e1 1 5 6 1147
tube from the center of the system (i.e. the tube). Alterna-
tively, a hydrogen-rich gas serves as the feed gas and it is
transported into the shell. Steam and the feed gas flow in the
membrane system in the form of counter-current pattern. It is
Table 1 e Governing equations and boundary conditions.
Governing equation
Continuity equation
Momentum equations
Species equations
Equation of state
Boundary condition Retentate
Inflow V!¼ �Vin;r n
! and w
Outflow vV.
vz¼ Vwi ¼ 0 and p
Tube centerline e
Membrane surface V. ¼ Vwi ¼ 0
Wall V. ¼ Vwi ¼ 0
assumed that the hydrogen permeation system is isothermal
(350 �C) and the mass transfer process is in steady state. The
flow fields in the tube and the shell are laminar and axisym-
metric. Regarding the membrane, its permselectivity to
hydrogen is infinite but it is zero to other gases. The body
forces of all gases in the permeation system are neglected and
the gas mixture in the system abides by the ideal gas law.
For hydrogen separated from a hydrogen-rich gas in the
membrane system, the physical phenomena are governed by
the conservative equations of continuity, momentum, and
species as well as equation of state. Meanwhile, the boundary
conditions are made up of the upstream inflow, downstream
outflow, tube centerline, membrane centerline, and wall in
the shell and the tube. The governing equations and boundary
conditions are tabulated in Table 1.
In this work, the concept of conjugate hydrogen perme-
ation is adopted to approach hydrogen permeation process;
that is, fluid dynamics and mass transfer at the both sides of
the membrane are fully simulated and hydrogen permeation
in the membrane is simultaneously considered. To deal with
hydrogen permeation process easier, the membrane is
conceived to be composed of a hydrogen-sink region and
a hydrogen-source one [1,20]. Accordingly, the entire perme-
ation system is partitioned into four computational domains
(Fig. 1(a)), consisting of a retentate domain, a permeate
domain, a source domain, and a sink domain. The computa-
tional domain in the membrane at the retentate side is
referred to as the hydrogen-sink domain, whereas it is spoken
of as the hydrogen-source one at the permeate side. The
source and sink terms obey Sieverts’ law (n ¼ 0.5) locally.
Details of the source and sink terms are listed at Table 2 where
the notations c and Am stand for the volume of source
domain or sink domain and the surface area of the Pd
membrane, respectively. The values of c and Am can be ob-
tained from the geometries shown in Fig. 1(b).
2.2. Properties of gas mixture
In the permeation system, four different gases of H2, CO, CO2,
and H2O are simultaneously considered to account for the
V$ðrV.Þ ¼ S
rV.$VV
. ¼ �Vpþ V$½mðVV. þ ðVV.ÞTÞ�
V$
� rwi
Pj
Dij
�Vxj þ ðxj �wjÞ
Vpp
�þ rwi V
!1A ¼ Si
p ¼ rRTPNi
1xiMi
Permeate
i ¼ wi;in;r V!¼ �Vin;p n
! and wi ¼ wi;in;p
¼ ptotalvV.
vz¼ Vwi ¼ 0 and p ¼ patm
VV. ¼ Vwi ¼ 0
V. ¼ Vwi ¼ 0
V. ¼ Vwi ¼ 0
Table 2 e A list of source and sink terms in governing equations at different domains.
Domain Continuity equation Species equation
Retentate S ¼ 0 Si ¼ 0 ði ¼ CO; CO2; H2O; H2ÞSource
S ¼ þMH2Am
cKðp0:5r;H2
� p0:5p;H2Þ Si ¼ þMH2Am
cKðp0:5r;H2
� p0:5p;H2Þ ði ¼ H2Þ
Si ¼ 0 ði ¼ CO; CO2; H2OÞSink
S ¼ �MH2Am
cKðp0:5r;H2
� p0:5p;H2Þ Si ¼ �MH2Am
cKðp0:5r;H2
� p0:5p;H2Þ ði ¼ H2Þ
Si ¼ 0 ði ¼ CO; CO2; H2OÞPermeate S ¼ 0 Si ¼ 0 ði ¼ CO; CO2; H2O; H2Þ
i n t e rn a t i o n a l j o u r n a l o f h y d r o g e n en e r g y 3 8 ( 2 0 1 3 ) 1 1 4 5e1 1 5 61148
hydrogen permeation process. Therefore, Wilke semi-
empirical correlation [26e28] is adopted to calculate the
viscosity of gas mixture and the correlation is expressed as
m ¼XNi¼1
ximiPnj¼1 xjfij
(2)
where x, M, and f are the molar fraction, molecular weight,
and binding factor, respectively. The thermal conductivity of
gas mixture is also estimated by Wilke semi-empirical corre-
lation [26] as the following
k ¼XNi¼1
xikiPnj¼1 xjfij
(3)
When calculating the binary mixture diffusivity of gas
mixture under an isothermal condition, the Chap-
maneEnskog equation [27,28] is considered and it is written as
Dij ¼ 1:881� 10�3 �T1:5
�1
Miþ 1
Mj
�0:5
ps2ijUd
(4)
where T, p, sij and Ud are temperature, absolute pressure,
interaction value for binary mixture and diffusion collision
integral, respectively. The diffusion collision integral Ud is
correlated by
Ud ¼ A2B
þ CexpðD2Þ þ
EexpðF2Þ þ
GexpðH2Þ (5)
Table 3 e A list of properties of four gases (at 350 �C) and other
H2
Viscosity (Pa s) 1.47 � 10�5
Thermal conductivity (W m�1 K�1) 0.322
Heat capacity at constant pressure (J kg�1 K�1) 14,579
Binding factor fij (�) j ¼ H2
i ¼ H2 1
i ¼ CO 0.223
i ¼ CO2 0.195
i ¼ H2O 0.323
si (�A) 59.7
3i/k (K) 2.827
Parameters of correlation for calculating Ud
A B C D
1.06036 0.15610 0.19300 0.47635
2 ¼ kT(6)
3ij
The parameters sij and 3ij are obtained by the following
equations of pure compounds
sij ¼si þ sj
2(7)
3ij ¼ ffiffiffiffiffiffiffi3i 3j
p(8)
Detailed properties of pure gases (i.e. H2, CO, CO2, and H2O),
such as viscosity, thermal conductivity, and heat capacity at
constant pressure, as well as the values for the properties of
gas mixture are listed in Table 3. The permselectivity of the
membrane to CO, CO2, and H2O is assumed to be zero in this
study, implying that H2O does not mix with CO and CO2 in the
membrane system. Therefore, the binding factors for COeH2O
and H2OeCO2 are not included in Table 3.
2.3. Concentration polarization index (CPI) and Reynoldsnumber
To realize the polarization extent on the membrane surface,
a set of concentration polarization index (CPI) is defined as the
following [20,29]:
CPIr ¼ 1� CH2 ;m
CH2 ;in¼ 1�
CH2 ;m
Ctotal
CH2 ;in
Ctotal
¼ 1� xH2 ;m
xH2 ;in(9)
values for calculating the properties of gas mixture [27,28].
CO CO2 H2O
1.75 � 10�5 2.7 � 10�5 2.15 � 10�5
0.025 0.045 0.044
1043 1095 2039
j ¼ CO j ¼ CO2 j ¼ H2O
2.624 2.332 1.982
1 0.999 e
0.981 1 e
e e 1
91.7 195.2 809.1
3.690 3.941 2.641
E F G H
1.03587 1.52996 1.76474 3.89411
Fig. 2 e (a) A schematic of grid system as well as the
comparisons of (b) average H2 flux and (c) velocity
distribution at various grid systems with large shell
(Rer [ 30, Rep [ 160, and Dp [ 9 atm).
i n t e r n a t i o n a l j o u r n a l o f h y d r o g e n en e r g y 3 8 ( 2 0 1 3 ) 1 1 4 5e1 1 5 6 1149
CPIp ¼ xH2 ;m (10)
CPI ¼ CPIr þ CPIp2
(11)
where the subscripts r and p denote the retentate and
permeate sides, respectively, and xH2 ;m designates the mole
fraction of H2 in the gas mixture. CPI represents the non-
uniformity of hydrogen concentration on the membrane
surface. A higher CPI stands for more serious concentration
polarization. When a feed gas flows into the shell, the Rey-
nolds number in the shell is defined by
Re ¼ rVDH
m¼ rVðDo � DiÞ
m(12)
where DH (¼ 4Ac/Pw) is hydraulic diameter and in the shell it is
given by
DH ¼ 4Ac
Pw¼ 4� 0:25p
�D2
o � D2i
�pðDo þ DiÞ ¼ Do � Di (13)
2.4. Numerical method
The commercial software COMSOL Multiphysics 4.0a was
utilized to solve the governing equations in association with
boundary conditions in which SPOOLES solver was used. An
orthogonal grid system for the purpose of reducing numerical
truncation error was employed to construct the physical
geometry. Meanwhile, to provide a flexible grid system, the
entire permeation system was divided into a number of
blocks, as shown in Fig. 2(a). In the figure, only the gird
number in the sink domain rather than in both source and
sink domains is included. However, it should be illustrated
that the grid number in the source domain is equivalent to
that in the sink domain. Three different grid numbers
Table 4 e A list of operating conditions and properties ofmembrane.
Gas mixture 65.2% H2 þ 0.2%
CO þ 34.6% CO2
Sweep gas Steam
Pressure at the exit of permeate
side (atm)
1
Temperature (�C) 350
Pressure difference (atm) 5e30
Mass flow rate of feed gas
at m0 (mg s�1)
66.87
Mass flow rate of sweep gas
at Rep ¼ 20 (mg s�1)
2.70
Smallshell
Mediumshell
Largeshell
Rer (at m0 and DP ¼ 10 atm) 98.18 55.86 30
Membrane Pd membrane
Membrane thickness (mm) 20
Permselectivity to H2 Infinite
Permselectivity to CO,
CO2, and H2O
Zero
Permeance
(mol m�2 s�1 Pa�0.5)
1.83 � 10�3
Fig. 3 e Distributions of (a) average H2 flux and (b) H2 recovery at various operating conditions and geometric sizes of shell
(Dp [ 9 atm).
i n t e rn a t i o n a l j o u r n a l o f h y d r o g e n en e r g y 3 8 ( 2 0 1 3 ) 1 1 4 5e1 1 5 61150
(Fig. 2(a)) were tested and compared with each other. The
profiles of average H2 flux across the membrane (Fig. 2(b)) and
gas velocity along the r-direction at the outlets of the tube and
the large shell for a gas mixture flowing through the shell are
sketched in Fig. 2(b) and (c), respectively. The compositions of
the tested gas mixture are listed in Table 4 which was ob-
tained from water gas shift reactions [30], and the Reynolds
numbers at the retentate side (Rer) and the permeate side (Rep)
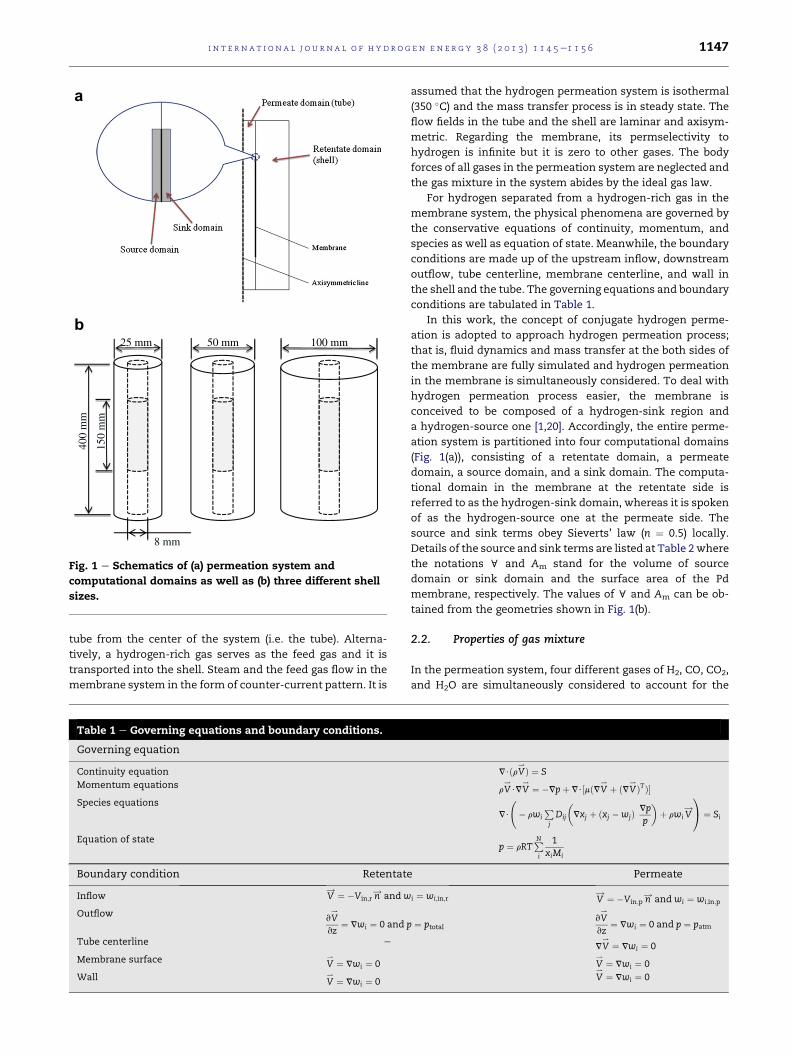
Fig. 4 e Distributions of H2 concentration contour in the
permeation systemwith (a) small, (b) medium, and (c) large
shell (feed gas [ m0 and Dp [ 9 atm).
Fig. 5 e Distributions of H2 partial pressure along the
membrane surface (feed gas [ m0, Rep [ 160, and
Dp [ 9 atm).
i n t e r n a t i o n a l j o u r n a l o f h y d r o g e n en e r g y 3 8 ( 2 0 1 3 ) 1 1 4 5e1 1 5 6 1151
are 30 and 160, respectively. The distributions shown in Fig. 2
suggest that that the difference between the second and the
third grid systems are almost imperceptible. As a conse-
quence, the second grid system is adopted for simulations
because of satisfying the requirement of grid independence.
The developed numerical method has been validated in
a previous study [20] by comparing the predicted H2 recovery
and gas concentrations to the experimental results [30]. It
indicated that the numerical predictions were in good
agreement with the experimental measurements.
Fig. 6 e A schematic of baffle location and operating
conditions at various cases.
3. Results and discussion
In the present work, a Pd-basedmembrane serves as the basis
of the study. Detailed properties of themembrane are listed in
Table 4. The membrane thickness was 20 mm, and the thick-
nesses of source and sink domains (Fig. 1(a)) are equally
distributed by 10 mm. Themembrane permeance (¼ 1.83� 10�3
m�2 s�1 Pa�0.5) was determined from the measurement of
a practical pure Pd membrane tube in our laboratory. Four
important factors of Reynolds number, shell size, baffle
number, and pressure difference across the membrane are
taken into account. The Reynolds number in the tube (i.e. the
permeate side) and the shell (i.e. the retentate side) are in the
ranges of 20e2000 and 20e800, respectively. Three different
shell sizes, as shown in Fig. 1(a), are investigated. Four baffles
are installed in the shell to evaluate their effect on concentra-
tion polarization. For a pure Pd membrane, the operating
temperatures are usually controlled between 300 and 400 �C to
avoidhydrogenembrittlementat lower temperatures (<300 �C)and material damage at higher temperatures (>400 �C) [30].Therefore, it is assumed that the system temperature is at
350 �C. With regard to pressure difference between the reten-
tate side and the permeation side, it is between 5 and 30 atm;
that is, the total pressure at the retentate side ( ptotal) ranges
from 6 to 31 atm.
Fig. 7 e Distributions of (a) CPIr, (b) CPIp, and (c) CPI along
membrane surface with large shell under various numbers
of baffles (Rer [ 30, Rep [ 160, and Dp [ 9 atm).
i n t e rn a t i o n a l j o u r n a l o f h y d r o g e n en e r g y 3 8 ( 2 0 1 3 ) 1 1 4 5e1 1 5 61152
3.1. Influence of shell size
Fig. 3 first demonstrates the distributions of average H2 flux
and H2 recovery at various operating conditions under the
three different shell sizes where the pressure difference (Dp)
at the two sides of the membrane is fixed at 9 atm. In other
words, the total pressure at the retentate side ( ptotal) is 10 atm.
As can be seen in the figure, increasing Reynolds number at
the permeate side (Rep) intensifies both the average H2 flux
and H2 recovery. When Rep is larger than 1000, it is noted that
the increment in H2 flux and recovery due to increasing Repbecomes slight, regardless of what the shell size is. This
reflects that the flow rate of sweep gas should not be too high.
An increase in the flow rate of feed gas is also able to enhance
average H2 flux, but it reduces H2 recovery. For instance, with
the flow rate of feed gas at m0, the H2 recovery is larger than
70%. Once the flow rate is lifted to 8m0, the H2 recovery is less
than 20%, implying that a lower flow rate of feed gas gives
a better H2 separation efficiency. With regard to the influence
of shell size on H2 permeation, a smaller shell is conducive to
the performance of H2 separation. This arises from the fact
that the H2 boundary layer in a smaller shell is thinner and it is
easier for H2 moving to the membrane surface, even though
the residence time of feed gas in the large shell is longer.
However, once the flow rate of feed gas is as high as 8m0, the
H2 recovery is insensitive to the variation of shell side
(Fig. 3(b)).
To provide a clearer observation of H2 permeation, the H2
concentration contours under various shell sides and Rey-
nolds numbers of sweep gas are displayed in Fig. 4 where the
H2 concentrations at both the lumen and shell sides have been
non-dimensionalized in terms of the individual maximum
concentrations. As can be seen in the figure, the larger the
shell size, the thicker the H2 concentration boundary layer,
resulting in lessened H2 concentration gradient along the
membrane surface. This further lowers H2 permeation across
themembrane so that the concentration of H2 at the exit of the
shell is higher. Fig. 4 also depicts that increasing the Reynolds
number of sweep gas at the lumen side (i.e. Rep) facilitates the
mass transfer of H2 in that the H2 concentration at the exit of
the shell is lower. In examining the distributions of H2 partial
pressure along the membrane surface at various shell sizes,
overall, Fig. 5 indicates that the small shell at the retentate side
has a higher profile of H2 partial pressure at the membrane
upstream. It follows that its concentration polarization at the
retentate side is less severe compared to those of the medium
and large shells. A higher H2 partial pressure leads to a higher
H2 permeation rate at themembrane upstream. This results in
a lower H2 partial pressure at the membrane downstream.
This is the reason that the profiles of H2 partial pressure at the
membrane upstream have a different trend as compared with
those at the membrane downstream.
3.2. Influence of baffle
The preceding results suggest that the membrane tube with
large shell gives a lower efficiency of H2 separation. However,
it should be pointed out that the membrane tube with large
shell has a potential to separate more H2 from the feed gas if
its flow rate is large. Accordingly, in the following study
Fig. 8 e Distributions of H2 concentration contour in the permeation system with large shell under various numbers of
baffles (Rer [ 30, Rep [ 160, and Dp [ 9 atm).
Fig. 9 e Profile of H2 recovery in the permeation system
with large shell under various numbers of baffles (Rer [ 30,
Rep [ 160, and Dp [ 9 atm).
i n t e r n a t i o n a l j o u r n a l o f h y d r o g e n en e r g y 3 8 ( 2 0 1 3 ) 1 1 4 5e1 1 5 6 1153
emphasis is placed on the influence of baffle installed in the
shell upon H2 separation. Fig. 6 presents the detailed locations
and geometric size of the baffles and Fig. 7 shows the distri-
butions of CPIr, CPIp and CPI under the conditions of Rer ¼ 30,
Rep ¼ 160, and Dp ¼ 9 atm. When the first baffle is installed in
the shell, the curve of CPI at the retentate side, CPIr, declines to
a certain extent (Fig. 7(a)), implying that the concentration
polarization is lessened. By virtue of more H2 separated at the
leading portion of the membrane, this results in less H2
retained at the trailing portion and, thereby, the curve of CPIris higher compared to that without installing the baffle. If
more baffles are equipped, the curve of CPIr can be further
reduced. However, the improvement in concentration polari-
zation becomes less pronounced. For example, the difference
in the distributions of CPIr between installing 3 baffles and 4
baffles is slight. In regard to the CPI at the lumen side, namely,
CPIp, the curves are almost independent of the installation of
baffles (Fig. 7(b)). This can be explained by the tiny influence of
flow patter by the baffles on the distribution of H2 concen-
tration at the lumen side. In view of the counter-current
pattern adopted in the present study, the trend of CPI at the
lumen side of the membrane is contrary to the other side.
When the CPIr and CPIp are simultaneously considered, the
profiles of CPI almost remain horizontal (Fig. 7(c)).
Upon inspection of H2 concentration contours shown in
Fig. 8, the H2 concentration boundary layer in the vicinity of
themembrane surface is obviously exhibitedwhenno baffle is
installed. Once a baffle is situated in the shell, the H2
concentration boundary layer is disturbed in a significant way
and more H2 is pushed toward the membrane surface.
Besides, a recirculation bubble is triggered behind the baffle.
This facilitates the mixing of H2 and other gases and entrains
H2 toward the membrane surface. In view of the two factors,
the profile of CPIr is reduced (Fig. 7(a)) under the situation of
one-baffle installation, in contrast to that without installing
baffle. When two baffles are mounted in the shell, the H2
partial pressure along the membrane surface adjacent to the
baffles is further enlarged. It is also noted that more H2 is
trapped in the space between the two baffles. This is the
reason that the profile of CPIr is further lowered. When more
baffles are installed, more recirculation bubbles develop and
the movement of H2 toward the membrane surface is more
notable. As a consequence, the concentration polarization is
diminished with increasing baffle number (Fig. 8(a)).
The profile of H2 recovery versus number of baffles is
plotted in Fig. 9. As a whole, increasing the number of baffles
enlarges the H2 recovery. When a baffle is placed in the shell,
the value of H2 recovery is promoted from 77.4 to 80.6%,
i n t e rn a t i o n a l j o u r n a l o f h y d r o g e n en e r g y 3 8 ( 2 0 1 3 ) 1 1 4 5e1 1 5 61154
accounting for 3.2% improvement in H2 recovery. When two
baffles are installed, the H2 recovery is increased to 81.8%,
yielding only 1.2% of improvement in H2 recovery in
comparison with that with one baffle. When four baffles are
included, the H2 recovery reaches 84.5%. From the profile, the
installation of one baffle is recommended in that more than
one baffle will increase the capital cost markedly. But the
improvement of H2 recovery is not linearly proportional to the
cost.
3.3. H2 recovery in the absence and presence of baffle
The three-dimensional profiles of average H2 flux on the
membrane surface in the absence and presence of one baffle
are shown in Fig. 10(a) and (b), respectively. The Reynolds
numbers at the retentate side (Rer) and the permeate side
(Rep) are in the ranges of 20e800 and 20e2000, respectively.
Fig. 10 depicts that the H2 flux is sensitive to the variations of
Rer and Rep when their values are low, especially for Rer.
When Rer and Rep are larger than 160 and 400, respectively,
the growth of H2 flux tends to slow down, regardless of the
installation of the baffle. An increase in Rep means more
sweep gas (steam) and thereby energy sent into the
Fig. 10 e Three-dimensional distributions of average H2
flux for the permeation system with large shell equipping
(a) 0 and (b) 1 baffle (Dp [ 9 atm).
membrane tube. Alternatively, increasing Rer makes H2
recovery go down (Fig. 3(b)). From operation point of view, the
conditions of Rer ¼ 160 and Rep ¼ 400 are recommended for H2
separation.
The three-dimensional profile of improvement in H2
separation is plotted in Fig. 11. The parameter of improvement
in H2 separation under the effect of one baffle is defined as
Improvementð%Þ ¼ FH2 ;b � FH2 ;0
FH2 ;0
� 100 (14)
where FH2 ;0 and FH2 ;b stand for H2 fluxes in the absence and
presence of one baffle. Within the investigated ranges of Rerand Rep, the improvement is located between 2.2 and 7.6%.
The maximum improvement occurs at Rer ¼ 800 and
Rep ¼ 2000, whereas the minimum one develops at Rer ¼ 20
and Rep ¼ 2000. Varying Rep has a slight effect on the
improvement. This can be explained by the flow field at the
permeate side hardly affected by the baffle which is installed
at the retentate side. Once Rer is larger than 80, the change in
the improvement becomes slight. This observation is consis-
tent with the foregoing illustration where Rer ¼ 160 and
Rep ¼ 400 are recommended for H2 separation.
The concentration contours of H2 at three different values
of Rer (i.e. 20, 160, and 800) in the absence and presence of the
first baffle are provided in Fig. 12. The H2 concentration
boundary layers are clearly exhibited in the shell under the
situation of without baffle (Fig. 12(a)). With the installation on
the baffle, the flow fields are significantly disturbed and more
H2 is pushed toward the membrane surface. This leads to
thinner H2 concentration boundary layers (Fig. 12(b)). In view
of the promotion of H2 concentration along the membrane
surface at the retentate side, the concentration polarization is
abated. In contrast, the concentration contours of H2 at the
permeate side are hardly affected by the installation of the
baffle.
3.4. Effect of total pressure difference
A higher pressure difference between the two sides of
a membrane is conducive to H2 flux, as expressed in Eq. (1).
The profiles of average H2 flux in the absence and presence of
Fig. 11 e Three-dimensional distribution of H2 flux
improvement in the permeation system with large shell
(Dp [ 9 atm).
Fig. 12 e Distributions of H2 concentration contours in the
membrane permeation system with large shell equipping
(a) 0 and (b) 1 baffle (Rep [ 800 and Dp [ 9 atm).
i n t e r n a t i o n a l j o u r n a l o f h y d r o g e n en e r g y 3 8 ( 2 0 1 3 ) 1 1 4 5e1 1 5 6 1155
a baffle are displayed in Fig. 13 to evaluate the influence of the
baffle in improving H2 flux under various pressure differences.
Obviously, the higher the pressure difference, the higher the
average H2 flux. Increasing pressure difference also intensifies
the difference of average H2 flux between the two difference
situations, thereby enhancing the effect of the baffle in
separating H2. Specifically, when the pressure difference is
5 atm, the improvement is 5.4%. Once the pressure difference
is as high as 30 atm, the improvement reaches 15.7%,
accounting for 3 folds in improvement. It is thus concluded
that the function of installing baffle will be intensified if the
pressure difference is larger.
Fig. 13 e Distributions of average H2 flux and H2 recovery in
the permeation system with large shell with/without
equipping a baffle (Rer [ 800, Rep [ 2000, and
Dp [ 5e30 atm).
4. Conclusions
Hydrogen separation in a permeation system under various
geometry designs and flow patterns have been examined via
a numerical method. In the method, H2 permeation through
a membrane is approached by introducing a sourceesink pair
in the governing equation, and a multi-block in association
with orthogonal grid system is employed. The parameters of
Reynolds numbers at the both sides of the membrane, shell
size, baffle, and pressure difference are taken into consider-
ation to account for their effects on hydrogen separation and
recovery. The numerical results indicate that an increase in
Reynolds number at the permeate side intensifies average H2
flux and H2 recovery. However, the performance of sweep gas
upon H2 separation tends to become ignorable if its Reynolds
number is not smaller than 1000. Increasing the flow rate of
feed gas is also able to enhance average H2 flux, but it reduces
H2 recovery. Though a large shell has higher potential for
industrial applications of H2 separation, the H2 concentration
boundary layer is larger compared with that in a small shell
under the same flow rate of feed gas, thereby causing more
serious concentration polarization. Installation of baffles in
the shell can disturb H2 concentration boundary layer so that
the concentration polarization at the retentate side is reduced
and H2 permeation is intensified. The more the number of
baffles, the less the increment of improvement in H2 perme-
ation is. From the viewpoint of capital cost, the installation of
one baffle is recommended in enhancing H2 separation. The
function of baffle is especially obvious when the pressure
difference is higher. If the membrane tube with large shell is
utilized, the conditions of Rer ¼ 160 and Rep ¼ 400 are appro-
priate for H2 separation whether one baffle is installed or not.
Acknowledgments
The authors would like to thank the financial support from
Bureau of Energy, Ministry of Economic Affairs, Taiwan, R.O.C.
r e f e r e n c e s
[1] Coroneo M, Montante G, Paglianti A. Numerical andexperimental fluid-dynamic analysis to improve the masstransfer performances of PdeAg membrane modules forhydrogen purification. Ind Eng Chem Res 2010;49:9300e9.
[2] Lin YM, Rei MH. Separation of hydrogen from the gasmixture out of catalytic reformer by using supportedpalladium membrane. Sep Purif Technol 2001;25:87e95.
[3] Rahimpour MR, Mazinani S, Vaferi B, Baktash MS.Comparison of two different flow types on CO removal alonga two-stage hydrogen permselective membrane reactor formethanol synthesis. Appl Energy 2011;88:41e51.
[4] Majlan EH, Daud WRW, Iyuke SE, Mohamad AB,Kadhum AAH, Mohammad AW, et al. Hydrogen purificationusing compact pressure swing adsorption system for fuelcell. Int J Hydrogen Energy 2009;34:2771e7.
[5] Chen WH, Lin BJ. Effect of microwave double absorption onhydrogen generation from methanol steam reforming. Int JHydrogen Energy 2010;35:1987e97.
i n t e rn a t i o n a l j o u r n a l o f h y d r o g e n en e r g y 3 8 ( 2 0 1 3 ) 1 1 4 5e1 1 5 61156
[6] Chein RY, Chen YC, Chang CS, Chung JN. Numericalmodeling of hydrogen production from ammoniadecomposition for fuel cell applications. Int J HydrogenEnergy 2010;35:589e97.
[7] Adhikari S, Fernando S. Hydrogen membrane separationtechniques. Ind Eng Chem Res 2006;45:875e81.
[8] Chein RY, Chen YC, Chung JN. Thermal resistance effect onmethanol-steam reforming performance in micro-scalereformers. Int J Hydrogen Energy 2012;37:250e62.
[9] Taghvaei H, Shirazi MM, Hooshmand N, Rahimpour MR,Jahanmiri A. Experimental investigation of hydrogenproduction through heavy naphtha cracking in pulsed DBDreactor. Appl Energy 2012;98:3e10.
[10] Lattin WC, Utgikar VP. Transition to hydrogen economy inthe United States: a 2006 status report. Int J Hydrogen Energy2007;32:3230e7.
[11] Chen WH, Chiu IH. Transient dynamic of hydrogenpermeation through a palladium membrane. Int J HydrogenEnergy 2009;34:2440e8.
[12] Chen WH, Hsu PC, Lin BJ. Hydrogen permeation acrossa palladium membrane in a varying pressure environment.Int J Hydrogen Energy 2010;35:5410e8.
[13] Sjardin M, Damen KJ, Faaij APC. Techno-economicprospects of small-scale membrane reactors in a futurehydrogen-fuelled transportation sector. Energy 2006;31:2523e55.
[14] Peramanu S, Cox BG, Pruden BB. Economics of hydrogenrecovery processes for the purification of hydroprocessorpurge and off-gases. Int J Hydrogen Energy 1999;24:405e24.
[15] ChenWH, Hsu BJ. Hydrogen permeation measurements of Pdand PdeCu alloy membranes using dynamic pressuredifference method. Int J Hydrogen Energy 2011;36:9355e66.
[16] Chen WH, Syu WZ, Hung CI. Numerical characterization onpolarization of hydrogen permeation in a Pd-basedmembrane tube. Int J Hydrogen Energy 2011;36:14734e44.
[17] Coroneo M, Montante G, Paglianti A. Modeling the effect ofoperating conditions on hydrodynamics and mass transferin a PdeAg membrane module for H2 purification. J MembrSci 2009;343:34e41.
[18] Mourgues A, Sanchez J. Theoretical analysis ofconcentration polarization in membrane modules for gasseparation with feed inside the hollow-fibers. J Membr Sci2005;252:133e44.
[19] Zhang J, Liu D, He M, Xu H, Li W. Experimental andsimulation studies on concentration polarization in H2
enrichment by highly permeable and selective Pdmembranes. J Membr Sci 2006;274:83e91.
[20] Chen WH, Syu WZ, Hung CI, Lin YL, Yang CC. A numericalapproach of conjugate hydrogen permeation andpolarization in a Pd membrane tube. Int J Hydrogen Energy2012;37:12666e79.
[21] Basile A, Tosti S, Capannelli G, Vitulli G, Iulianelli A,Gallucci F, et al. Co-current and counter-current modes formethanol steam reforming membrane reactor: experimentalstudy. Catal Today 2006;118:237e45.
[22] Gallucci F, Basile A. Co-current and counter-current modesfor methanol steam reforming membrane reactor. Int JHydrogen Energy 2006;31:2243e9.
[23] Gallucci F, Falco MD, Tosti S, Marrelli L, Basile A. Co-currentand counter-current configurations for ethanol steamreforming in a dense PdeAg membrane reactor. Int JHydrogen Energy 2008;33:6165e71.
[24] Iulianelli A, Longo T, Basile A. CO-free hydrogen productionby steam reforming of acetic acid carried out in a PdeAgmembrane reactor: the effect of co-current and counter-current mode. Int J Hydrogen Energy 2008;33:4091e6.
[25] Liu SX, Peng M, Vane LM. CFD simulation of effect of baffleon mass transfer in a slit-type pervaporation module. JMembr Sci 2005;265:124e36.
[26] Falco MD, Paola LD, Marrelli L. Heat transfer and hydrogenpermeability in modelling industrial membrane reactors formethane steam reforming. Int J Hydrogen Energy 2007;32:2902e13.
[27] Caravella A, Barbieri G, Drioli E. Modelling and simulation ofhydrogen permeation through supported Pd-alloymembranes with a multicomponent approach. Chem Eng Sci2008;63:2149e60.
[28] Catalano J, Baschetti MG, Sarti GC. Influence of the gas phaseresistance on hydrogen flux through thin palladiumesilvermembranes. J Membr Sci 2009;339:57e67.
[29] Bhattacharya S, Hwang ST. Concentration polarization,separation factor, and Peclet number in membraneprocesses. J Membr Sci 1997;132:73e90.
[30] Chen WH, Lu JJ. Hydrogen production from water gas shiftreactions in association with separation using a palladiummembrane tube. Int J Energy Res 2012;36:346e54.