This case study was written by Kathleen Gilsinan and Adam Stepan for the Case Consortium @ Columbia and the Picker Center for Executive Education, SIPA. Research assistance was provided by Nora Shannon Johnson. The faculty sponsors were Professor of Professional Practice in International and Public Affairs William B. Eimicke of Columbia University and Associate Professor of Public Policy Dennis Smith of New York University. Funding for the audiovisual piece came from the Lemann Foundation. (05/2014) From Compstat to Gov 2.0 Big Data in New York City Management In the 1980s and early 1990s, New York City was a dangerous place to live. The city’s homicide rate peaked at more than 2,200 in 1990; meanwhile the risk of robbery and muggings was a daily reality for the city’s roughly 7 million residents. Time magazine’s September 17, 1990 cover story proclaimed “the rotting of the Big Apple,” citing a “surge of brutal killings” that had left New Yorkers feeling unsafe and uncertain whether to remain in the city. 1 The New York Times declared in December that the city’s streets resembled “a New Calcutta, bristling with beggars and sad schizophrenics tuned to inner voices.” 2 In 1994, William J. Bratton took over as commissioner of the New York City Police Department (NYPD) with an ambitious goal: bring the crime rate down, fast. Key to his efforts was a management tool known as Compstat (“computerized comparison crime statistics”), which allowed Bratton to reorient the department toward proactive crime prevention by analyzing crime data and directing more resources to higher----crime areas. Using up----to- ---date data to guide decision---making was a radical departure for the department, and it paid off. By the end of the decade, New York City’s crime rate had dropped by half. 3 The Police Department’s success using data analysis to improve service delivery drew the notice of other city departments—in particular, the New York City Fire Department (FDNY). After a 2007 fire that killed two firefighters, due in part to inadequate safety inspections, FDNY’s leadership decided it needed a better way to prioritize building inspections. In 2013, the department instituted a computerized inspection system based on sophisticated and up--- -to----date measures of a building’s fire risk and, like the Police Department, began directing scarce resources to the highest----risk areas. 1 Joelle Attinger, “The Decline of New York,” Time, September 17, 1990. 2 “To Restore New York City, First Reclaim the Streets,” New York Times, December 30, 1990. See: http://www.nytimes.com/1990/12/30/opinion/to-restore-new-york-city-first-reclaim-the-streets.html 3 Dennis C. Smith and William J. Bratton, “Performance Management in New York City: Compstat and the Revolution in Police Management,” in Dall Forsyth (ed.), Quicker, Better, Cheaper? Managing Performance in American Government, New York: Rockefeller Institute Press, October 2001. p. 455. Note that this decline started under the Dinkins administration. SIPA - - 14 - - 0004.0
Transcript
This case study was written by Kathleen Gilsinan and Adam Stepan for the Case Consortium @ Columbia and
the Picker Center for Executive Education, SIPA. Research assistance was provided by Nora Shannon
Johnson. The faculty sponsors were Professor of Professional Practice in International and Public Affairs
William B. Eimicke of Columbia University and Associate Professor of Public Policy Dennis Smith of New
York University. Funding for the audiovisual piece came from the Lemann Foundation. (05/2014)
From Compstat to Gov 2.0 Big Data in New York City Management
In the 1980s and early 1990s, New York City was a dangerous place to live. The city’s
homicide rate peaked at more than 2,200 in 1990; meanwhile the risk of robbery and muggings
was a daily reality for the city’s roughly 7 million residents. Time magazine’s September 17,
1990 cover story proclaimed “the rotting of the Big Apple,” citing a “surge of brutal killings”
that had left New Yorkers feeling unsafe and uncertain whether to remain in the city.1 The
New York Times declared in December that the city’s streets resembled “a New Calcutta,
bristling with beggars and sad schizophrenics tuned to inner voices.”2
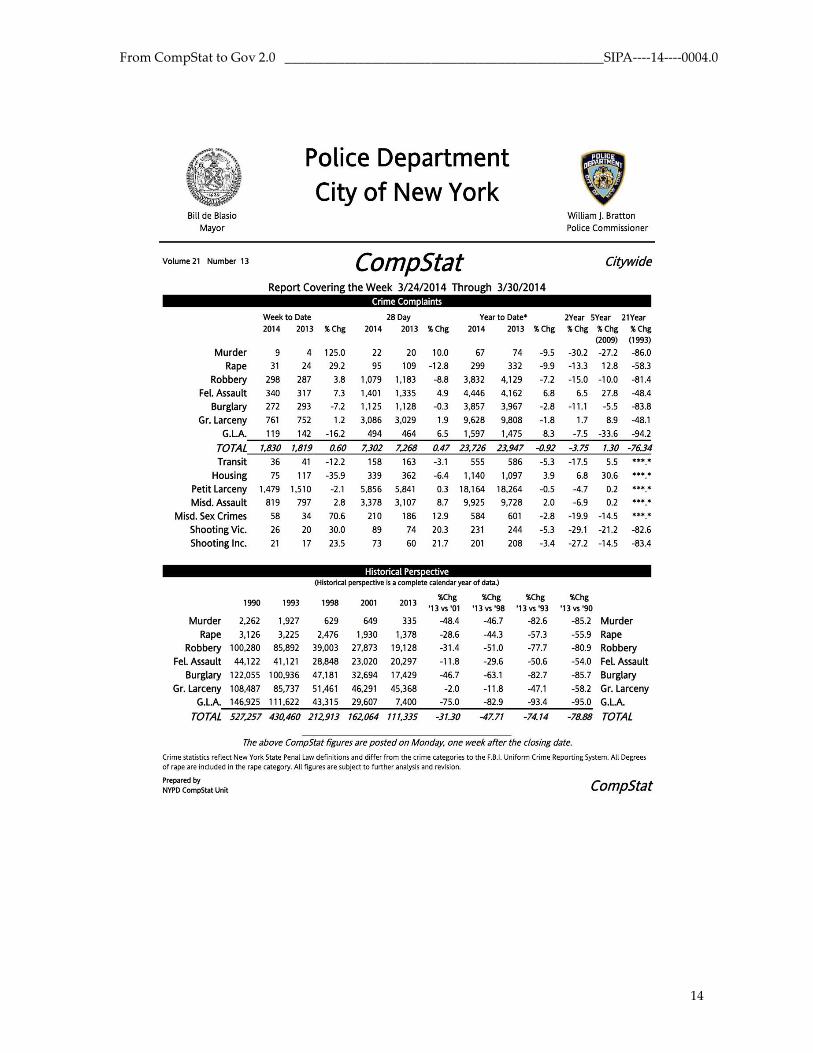
In 1994, William J. Bratton took over as commissioner of the New York City Police
Department (NYPD) with an ambitious goal: bring the crime rate down, fast. Key to his
efforts was a management tool known as Compstat (“computerized comparison crime
statistics”), which allowed Bratton to reorient the department toward proactive crime prevention
by analyzing crime data and directing more resources to higher----crime areas. Using up----to-
---date data to guide decision---making was a radical departure for the department, and it
paid off. By the end of the decade, New York City’s crime rate had dropped by half.3
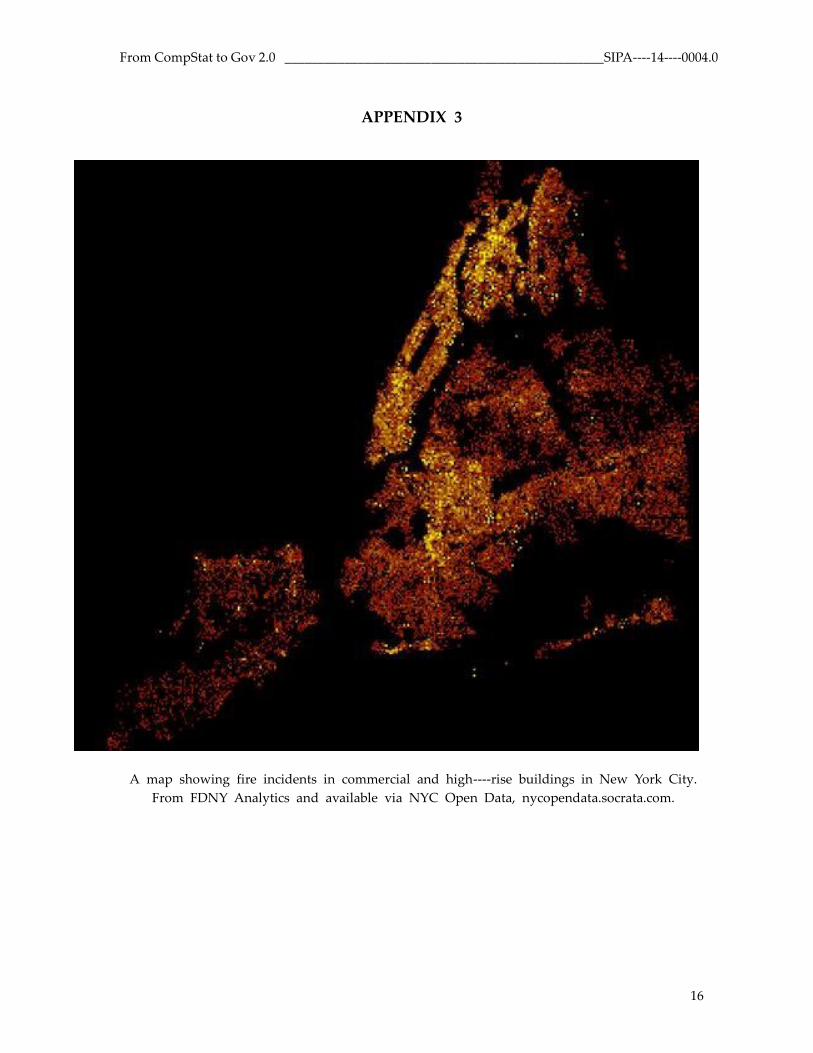
The Police Department’s success using data analysis to improve service delivery drew
the notice of other city departments—in particular, the New York City Fire Department (FDNY).
After a 2007 fire that killed two firefighters, due in part to inadequate safety inspections,
FDNY’s leadership decided it needed a better way to prioritize building inspections. In 2013,
the department instituted a computerized inspection system based on sophisticated and up---
-to----date measures of a building’s fire risk and, like the Police Department, began directing
scarce resources to the highest----risk areas.
1 Joelle Attinger, “The Decline of New York,” Time, September 17, 1990. 2 “To Restore New York City, First Reclaim the Streets,” New York Times, December 30, 1990. See:
http://www.nytimes.com/1990/12/30/opinion/to-restore-new-york-city-first-reclaim-the-streets.html 3 Dennis C. Smith and William J. Bratton, “Performance Management in New York City: Compstat and the
Revolution in Police Management,” in Dall Forsyth (ed.), Quicker, Better, Cheaper? Managing Performance in
American Government, New York: Rockefeller Institute Press, October 2001. p. 455. Note that this decline
started under the Dinkins administration.
SIPA -
-
14 -
-
0004.0
From CompStat to Gov 2.0 ________________________________________________SIPA----14----0004.0
2
Meanwhile, Michael Bloomberg took office as New York City’s mayor in 2002. A
financial data services mogul, he championed efficiency through data----driven decisionmaking.
Data became a City Hall watchword. The mayor oversaw the implementation in 2003 of a
311 non----emergency hotline to streamline the delivery of city services through a single point
of contact. In 2013, he created a new Mayor’s Office of Data Analytics (MODA)—a team of
number----crunchers tasked with uncovering correlations and locating problems.
As Bloomberg’s three----term tenure drew to a close in late 2013, more city agencies
had moved to data----driven decisionmaking. Still, information was often stovepiped in
individual departments. While city agencies were collecting more and perhaps better data than
ever before, the uncoordinated nature of department----level reforms made it hard to reconcile
data sets to solve system----wide problems. MODA had managed this itself on an ad hoc
basis by aggregating data to solve a specific problem, like identifying which pharmacies
distributed painkillers illegally.
But it was unclear whether Bloomberg’s initiative would continue after his term expired.
Should data----driven governance be standardized across all city agencies? What about privacy
concerns? Was the New York model one to emulate across the country and around the globe?
At what cost?
Crime meets Bratton
By the early 1990s, New York City had experienced more than two decades of rising
crime. New York City’s 1975 fiscal crisis—the city nearly went bankrupt—prompted a brutal
series of budget cuts, including 5,000 layoffs in the NYPD.4 By 1980, the department had lost
another nearly 8,000 officers to attrition; taken together, the department had shrunk by about
34 percent, even while the rate of serious crime rose 40 percent.5 Smaller offenses like vandalism
and vagrancy proliferated largely unchecked, contributing to an overall sense of disorder and
chaos.
“There was this sense that New York was declining, and that crime was a critical part
of that,” says Professor Dennis Smith, an expert on public policy and performance
management.6 Rudolph Giuliani won New York’s November 1993 mayoral election with
promises to crack down on crime.7 On January 10, 1994, Mayor Giuliani installed William J.
Bratton as commissioner of the NYPD.
4 Michael D. White, “The New York City Police Department, its Crime-Control Strategies and Organizational
Changes, 1970-2009,” Published online via John Jay College of Criminal Justice, September 13, 2012. See:
http://www.jjay.cuny.edu/white.pdf 5 Ibid. 6 Authors’ interview with Professor Dennis Smith on February 17, 2014, at Columbia University. All further
quotes from Smith, unless otherwise attributed, are from this interview. Smith was an associate professor at
the Robert F. Wagner School of Public Service at New York University. 7 Todd S. Purdum, “Giuliani Ousts Dinkins by a Thin Margin; Whitman is an Upset Winner Over Florio,” New
York Times, November 3, 1993. Available: http://www.nytimes.com/1993/11/03/nyregion/1993-elections-
mayor- giuliani-ousts-dinkins-thin-margin-whitman-upset-winner.html. Two thirds of voters who identified
crime as a decisive issue voted for Giuliani.
From CompStat to Gov 2.0 ________________________________________________SIPA----14----0004.0
3
Bratton had overseen a reduction in subway crime as chief of the New York City
Transit Police from 1990----92. Embracing the novel “broken windows” theory of policing,
which posited a link between general disorder and serious crime, the transit police under
Bratton aggressively enforced lower----level infractions such as farebeating. The logic was that
by cracking down on minor infractions, NYPD could prevent more serious crimes. In his first
six months with the Transit Police, Bratton oversaw a spike in summonses, ejections, and
arrests in the subway, and subway crime fell.8
New job. In 1994, Bratton took the helm of a much larger and more complex
organization than his previous assignment at the Transit Police: some 50,000 police officers
responsible for the public safety of 7 million New Yorkers spread throughout 76 precincts.
Yet he and his team had some advantages. Former Mayor David Dinkins had expanded NYPD
resources with an initiative called Safe Streets, Safe Cities, which authorized the NYPD to hire
some 6,000 officers. “Crime had already started going down a little bit” at the end of the
Dinkins administration, says Smith. “[The NYPD] already had this pipeline of more officers
coming in… And it gave Commissioner Bratton the opportunity to innovate.” Police
departments across the country had to devote significant resources to meeting standards such
as average response time to 911 emergency calls, says Smith, but with money and officers
flowing into the department, Bratton had space both to maintain traditional standards and
experiment with other policing strategies.
Real----time statistics. Bratton believed that the Police Department was capable not just
of responding to crime, but of proactively preventing it. To do so, however, would require
detailed knowledge of where crimes were most likely to occur, and a strategic and timely
deployment of resources. The NYPD already knew a lot about crime. The department had
been an epicenter of what later came to be known as “big data” since at least the 1970s,
when it became one of the first US cities to institute a 911 emergency call system. “Almost
immediately, there were [millions of] calls a year to the police department,” says Smith.9 The
department had long used data from these calls and other sources to create precinct----specific
pictures of crime patterns.
But the reports were compiled quarterly, so data was already four months old by the
time it reached police commanders. Though detailed, the reports provided “management
information history” rather than a basis for decisions, says Smith. With crime patterns that
shifted on a weekly or even daily basis, Bratton felt police resources should move
correspondingly. Says Smith:
When you decide you’re going to actually try to get on top of
crime, you’re going to fight crime, you’re going to fight it block by
block, you need to have information that is more timely, more
8 John Buntin, “Assertive Policing, Plummeting Crime: The NYPD Takes on Crime in New York City,” Harvard
Kennedy School of Government, August 1999, p. 3. 9 In 2012, New York City was estimated to receive some 11 million calls per year. See: “New York City
Completes Major 911 System Overhaul,” Government Technology, January 9, 2012. Available:
From CompStat to Gov 2.0 ________________________________________________SIPA----14----0004.0
4
disaggregated, and given attention of a different kind than it had
[been] in the past.
But implementing a new decision system was not going to be easy. For example,
when the new deputy commissioner for crime control strategies, Jack Maple, wanted the
previous day’s crime figures, he was told it would take six months to get. Bratton recalls his
dismay: “The largest police department in America was going to take six months to tell us
what happened yesterday in New York City.”10
NYPD and Compstat
In response, Maple in early 1993 required each of New York City’s 76 precincts to
compile crime statistics and map crime locations daily, then fax the information to headquarters.
NYPD’s technology department told Maple it would take 6----12 months to computerize the
process. But Maple and Bratton were in a hurry. “We were losing six people a day being
murdered in the city at that time, another 15 or 20 being shot,” Bratton says. “Lives were
being lost.” With money from the Police Foundation, funded by private donors to support
the department, Maple and his team bought a Hewlett----Packard 360 computer. “Jack [Maple]
and his people quickly wired that up and began the Compstat revolution,” says Bratton.
As Maple introduced technological change, Bratton turned to the department’s
management. He devolved unprecedented authority to the city’s 76 precinct commanders—
each of whom oversaw about 200----400 police officers serving some 100,000 residents. Bratton
gave the commanders flexibility to respond to area crime on an individual basis and as they
saw fit.11
By April 1994, Maple had put in place a system of computerized, up----to----date crime
statistics that provided commanders with a clear picture of day----to----day crime patterns. At
the same time, Bratton, Maple, and Chief of Patrol Louis Anemone convened twice----weekly
meetings for top commanders to review crime statistics with their precinct colleagues in an
effort to determine response patterns. Compstat, Bratton recalls, “allowed for the creation of
a system of accountability.”
Maps were important from early on; the new data allowed commanders to visualize
where crime was occurring and, crucially, whether arrest patterns matched crime patterns. A
map projected at the front of the room used dots to indicate crime incidents—and precinct
commanders were held accountable for “putting cops on the dots,” says Bratton. The meetings
were designed so that NYPD leaders could ask, in effect, “’What are you doing about the
crime problem that we are identifying?’” Bratton says. “’We now know where [crime] is
happening, who’s doing it… What are you doing about it?’” In addition to holding
commanders accountable, the process also allowed departmental units to share intelligence on
successful tactics.
10 Stepan’s interview with William J. Bratton on March 21, 2014, at One Police Plaza, New York City. All
further quotes from Bratton, unless otherwise attributed, are from this interview. 11 Buntin, “Assertive Policing, Plummeting Crime,” p.10.
From CompStat to Gov 2.0 ________________________________________________SIPA----14----0004.0
5
The process could be adversarial. Bratton recalls one meeting in which a narcotics
squad was touting the number of arrests it had made. Using the Compstat maps, however,
Maple demonstrated that arrests were not occurring where most of the crime took place.
“’Your arrests should be where the problems are,’” Bratton recalls Maple saying.
Compstat changed the way data was collected, how resources were deployed and how
commanders were held accountable. As Maple later summarized, its key components were
“accurate and timely intelligence combined with effective tactics, rapid deployment, relentless
follow----up and assessment, and decentralized accountability.”12 By the end of 1994, index
crime in New York City had declined by 12 percent compared to 1993, exceeding Bratton’s
promise of 10 percent (nationwide, it dropped a scant 1.1 percent).13 From 1993 to 1999, New
York City crime dropped 50 percent. 14
A similar shift in mentality—from responding to problems to preventing them—would
soon take hold at other city agencies. Among them was Parks and Recreation, which in March
1997 held its first Compstat----style meeting. The department dubbed its version ParkStat.
Managers were encouraged to describe in detail developments in each district, and to
brainstorm collective solutions. ParkStat, wrote expert Dennis Smith, “builds on the earlier
development of a systematic parks conditions inspection and rating system that divides the
Parks Department facilities into ratable sites that receive pass/fail marks after each inspection.”15
In addition, the department implemented weekly performance reviews in order to
establish a direct connection between headquarters and park managers. By putting statistics
and direct communication at the forefront of park management, ParkStat was able to double
the number of sites passing inspection.16 By 2002, ParkStat had expanded to monitor such
indicators as crime, vehicle maintenance, personnel, resource allocation and enforcement.
Before long, the Fire Department of New York (FDNY) would also take a close look at
Compstat.
FDNY and Risk----Based Assessment
FDNY was considered one of the most successful fire departments in the United States.
Transformed in 1865 from a volunteer organization to a career department, it was the first in
12 Dennis C. Smith and William J. Bratton, “Performance Management in New York City: Compstat and the
Revolution in Police Management,” in Dall Forsyth (ed.), Quicker, Better, Cheaper? Managing Performance in
American Government, New York: Rockefeller Institute Press, October 2001. p. 477. 13 John Buntin, “Assertive Policing, Plummeting Crime: The NYPD Takes on Crime in New York City,” Harvard
Kennedy School of Government, August 9, 1999, p. 22 14 Dennis C. Smith and William J. Bratton, “Performance Management in New York City: Compstat and the
Revolution in Police Management,” in Dall Forsyth (ed.), Quicker, Better, Cheaper? Managing Performance in
American Government, New York: Rockefeller Institute Press, October 2001. p. 455. Note that this decline
started under the Dinkins administration. 15 Dennis C. Smith, “What Can Public Managers Learn from Police Reform in New York?: COMPSTAT and the
Promise of Performance Management,” New York University Robert F. Wagner Graduate School of Public
Service. Paper prepared for presentation at the 19th Annual Research Conference of the Association of Public
Policy and Management, New York, NY. November 1997. pp. 5-6. 16 Ibid, p.6.
From CompStat to Gov 2.0 ________________________________________________SIPA----14----0004.0
6
the nation to create a bureau of fire prevention to inspect buildings and identify risks. But
by 2007, the inspection system had broken down.
The September 11, 2001 World Trade Center attacks, in which more than 343 New
York firefighters lost their lives, showed that while the department was expert at firefighting,
its command and control operations were lacking. “We were not prepared because what
happened is [firefighters] ran to the World Trade Center—that’s the way that those people
are,” says William Eimicke, in 2007 appointed FDNY deputy commissioner for strategic planning.
But what would have happened if there was another event in the
Bronx? It took months to figure out who died because we didn’t
know who was there. Because a lot of people went there without
being called—they were off duty, some of them were retired. They
took other people’s equipment to go. All laudable, but organizationally
awful.17
FDNY’s management deficiencies were further evidenced in an August 2007 fire at the
Deutsche Bank building at 130 Liberty Street. It had been vacant since 9/11, and was
undergoing demolition when an errant cigarette set it ablaze. Firefighters responded within 3
1/2 minutes; still, it ultimately took 475 firefighters seven hours to put out the fire. Two
firefighters died from suffocation. A city investigation later attributed the severity of the fire
to the building’s lack of a functioning standpipe to help direct water to the blaze and
concluded that inadequate inspection and reporting procedures had contributed to the firemen’s
deaths.
Strategic Plan. Deputy Commissioner Eimicke was put in charge of analyzing the
existing inspection system. He learned that a cadre of 350 civilian inspectors was responsible
for some 300,000 buildings. FDNY classified buildings as either A, B, or C: A buildings were
inspected annually, B buildings biannually, and C buildings every three years. The
classifications—largely unaltered for six decades—were based on a combination of factors,
including the building’s use, its location, and the commander’s intuition about whether it was
hazardous. FDNY kept a record of the rankings in a card catalogue.
Eimicke chose Rich Tobin, FDNY’s assistant chief at the Bureau of Fire Prevention, to
lead efforts to reform the inspection system. Tobin and his internal team realized that the
existing system lacked hard data. ”We had assigned those ratings based on our own experience
in the area,” says Tobin. “And a lot of times they were just passed on. There was no up---
-to----date data… A new company commander could come in and never update the status of
a building.”18 Moreover, certain FDNY units, such as in midtown Manhattan where most
17 Professor William B. Eimicke’s lecture on February 10, 2014, for his course. “Effective Management in the
Public Service,” at Columbia University. Columbia granted Eimicke a leave of absence in 2007 to work for
FDNY. 18 Stepan’s interview with FDNY Assistant Chief of Fire Prevention Richard Tobin, on February 25, 2014, at
FDNY’s Bureau of Fire Prevention in New York City. All further quotes from Tobin, unless otherwise
attributed, are from this interview.
From CompStat to Gov 2.0 ________________________________________________SIPA----14----0004.0
7
buildings were high----rises, did not have enough manpower to complete the required
inspections in any given year.
Eimicke and Tobin saw much to be gained by applying certain principles from the
Compstat model to a new fire safety inspection system that could more accurately predict
and forestall fires. “We saw all of the successes the Police Department had with Compstat,”
says Tobin.
We saw where they were targeting their resources to where the crime
was occurring. The whole idea was to get there before the crime
occurred, saturate the area. And we wanted to duplicate the same
thing with our inspection process. We didn’t want to wait for a fire
to hit, we wanted to be out there proactively inspecting these
buildings, eliminating their hazards before they had a fire there.
Compstat’s basic principle of resource allocation based on risk could be adapted to
the Fire Department, and specifically to the Bureau of Fire Prevention. FDNY had a fixed
number of inspectors and too many buildings to inspect. If the department could send
inspectors to buildings with the highest risk of fire, the same number of inspectors could
prevent a higher number of fires.
Digitize. The first step was to update and digitize FDNY’s existing inspection data. In
2009, Eimicke brought in consultants from IBM. The IBM team began its work by
accompanying inspectors on every step of the inspection process for a period of months.
Claudia Gerola, an IBM business strategy and development consultant, had the challenging
job of mapping the status quo. She explains:
To determine how to proceed with this project, we had to
understand what everybody did all day long, what the flow of their
day was, when they captured information, how they recorded it, what
did the form look like that they had to fill out—the purpose being
obviously to capture that data and digitize it so that it could be
accessible and manipulated. But in order to do that… we would
bring 10 or 12 experts into a room and get them to open up.19
It was important to involve the inspectors early in the reform process, not least to
bridge the culture gap between the tradition----bound FDNY and the IBM consultants. The
IBM survey potentially invited a backlash from the close----knit—and unionized—firefighters.
“We were… telling them to go out with these teams and re----inspect every building in their
district and take their card---based data and put it into the computer with the IBM team,”
says Tobin. “So we were doubling their work.”
By mid----2010, FDNY had digitized its inspection system. But making the inspection
system truly risk----based required a more sophisticated assessment of each building’s chance
of catching fire. Data that could help predict the probability of fire in any given building
19 Stepan’s interview with Claudia Gerola on March 3, 2014, at Columbia University, New York City. All
further quotes from Gerola, unless otherwise attributed, are from this interview.
From CompStat to Gov 2.0 ________________________________________________SIPA----14----0004.0
8
was spread across multiple city agencies. For example, buildings in poor or high----crime
neighborhoods were more likely to catch fire than the same kinds of structures in safer, more
affluent neighborhoods—but crime and income information resided with NYPD and the
Finance Department. Buildings with code violations were also more likely to be at risk, but
that information was at the Buildings Department.
It became clear to Eimicke, Tobin and their team that one of the biggest challenges
would be access to data from other city agencies. Tobin explains that the even though many
agencies had digitized their data, it came in formats that could not be read by other
departments. “One of the biggest challenges to overcome was the fact that every one of the
agencies had its own silo of data. The other point was, they weren’t all on the same
platforms. So sharing that data across lines was very difficult, really difficult,” he recalls.
Not only was other departments’ data difficult to merge with that of the fire department, it
was also in some cases out of date. “We hit some real bumps in the road” in constructing
the risk----based system, Tobin says. FDNY inspectors, for example, might visit a building
flagged by the Buildings Department only to discover that there was no longer a building at
that location.
Bloomberg and Open Gov
While Eimicke, Tobin and their team were working through the challenges of data
sharing across city agencies as part of their work on the FDNY inspection system, a parallel
development at City Hall provided crucial help—the public sharing and publishing of city
data of all kinds. Michael Bloomberg had succeeded Giuliani as mayor in 2002 (he was
reelected in 2005 and 2009). Bloomberg had come from Bloomberg LP, a financial information
services company he created and ran. Over his business career, Bloomberg had learned to
appreciate the value of reliable numbers. “In God we trust. Everyone else, bring data,” he
was known to quip, only partly in jest.20 He made it a priority to promote the use of data
to govern better.
An early innovation was a hotline that would provide a single point of access to city
services. The call----in telephone number was 311, and it launched on March 9, 2003. It
functioned like a 911 hotline for non----emergencies. In its first 10 years, 311 handled an
average 16 million calls a year, and “consolidated more than 40 separate City call centers and
hotlines—and 11 pages of government listings in the phone book—into one, easy----to---
-remember number,” according to the city’s history of the program.21
Goldsmith. Meanwhile, Bloomberg in 2010 brought in Stephen Goldsmith as deputy
mayor for operations. He had been former two----time mayor of Indianapolis, a special advisor
to President George W. Bush, and chair of the board of directors of the Corporation for
National and Community Service. As mayor of Indianapolis, Goldsmith improved the quality
20 Sam Roberts, “Statistics, Beloved by Mayor, Show a Slump in City Services,” New York Times, August 29, 2011.
Available: http://www.nytimes.com/2011/08/30/nyregion/new-york-data-shows-slump-in-city-services.html 21 “Mayor Bloomberg Commemorates Ten Years Of Nyc311, The Nation's Largest And Most Comprehensive
311 Service,” New York City Office of the Mayor, March 11, 2013. Available: http://www1.nyc.gov/office-of-
From CompStat to Gov 2.0 ________________________________________________SIPA----14----0004.0
9
and accessibility of public spaces and rebuilt neglected neighborhoods. He had learned to
listen to citizens and address their needs in an effective and efficient manner. In New York,
he was still charged with addressing the needs of the public, but in an entirely new context:
Big Data. He recalls:
When I came in as new deputy mayor of operations, the city’s budget
was very stressed… High----quality services were being produced, but
they were being produced at reasonably high costs that I didn’t
think was sustainable. So we looked for ways to increase the efficiency,
productivity [and] effectiveness of [New York City] government.22
One of his key missions was to take the various “big data” initiatives under way in
the administration, and give them an official shape and direction. There was a need to
connect data mining and citizens’ issues, and Goldsmith saw social media as a key tool in
establishing the link— citizens were already creating data, but it had not yet seen practical
application within city management. “You have cloud computing which drives down the cost
of acquisition of sophisticated solutions,” says Goldsmith.
You have essentially every field worker with the capacity to have
a handheld device, real----time data, actionable data, at the scene of
a crime or… child welfare problem. You have social media, which
means that broad arrays of individuals in the community, New
York City, can communicate or complain or tweet about a very
significant problem or not. You can mine that data and identify it.
New York City already had an infrastructure for collecting data on city services
delivery. Since the 1970s fiscal crisis, the mayor’s office had tracked aspects of city government
performance, including money spent and services delivered, through the Mayor’s Management
Planning and Reporting System (MMPRS), which published management statistics every six
months. A study found that at the end of the 1980s, however, the MMPRS’ “voluminous
agency statistics reported to the public twice a year included almost no measures of outcomes
or ‘results.’”23 That perception persisted for the next decade. Good government advocates and
the public alike saw it as little more than “an obligatory exercise in eyestrain and endurance,”
according to a New York Times editorial early in the Bloomberg administration.24 Goldsmith
and his team revamped the Mayor’s Management Report to make it more user----friendly,
with less jargon and an online interactive tool that allowed users to access neighborhood---
-level statistics.
He also updated the 311 service. In 2011, a 311 Services Map went live on the city’s
website; it illustrated how 311 complaints were distributed geographically. Goldsmith
22 Stepan’s interview with Stephen Goldsmith on February 24, 2014, at Columbia University. All further quotes
from Smith, unless otherwise attributed, are from this interview. 23 Dennis C. Smith and William J. Bratton, “Performance Management in New York City: Compstat and the
Revolution in Police Management,” in Dall Forsyth (ed.), Quicker, Better, Cheaper? Managing Performance in
American Government, New York: Rockefeller Institute Press, October 2001. p. 545, referring to Smith 1993. 24 “How am I Doing — Really?,” The New York Times, October 1, 2002. Available:
From CompStat to Gov 2.0 ________________________________________________SIPA----14----0004.0
10
announced at the launch that New Yorkers had the “right to know where the problems and
trouble spots are in their neighborhoods… so they can look at those problems and can hold
government accountable.”25
These initiatives made city government activities more visible to the public through
user---friendly data, and made its services more accessible. It became easier for citizens not
only to obtain but to evaluate government services. But for all the success, Goldsmith says,
311 in particular “assumes that people have to call to register a problem—that government
can’t figure out about the problem before somebody complains about it.”26 Given the amount
of data available to government, was there a better way to use it to find and fix problems
even before they generated complaints?
Sharing Data
Bloomberg had hired someone to look at exactly that problem. Michael Flowers was
a key player in the administration’s smart data campaign. A former prosecutor and Justice
Department lawyer in Iraq, Flowers joined New York City government in December 2009 as
head of the city’s Financial Crimes Task Force. Among other tasks, he investigated mortgage
fraud and learned, he says, that “the city knew a tremendous amount” about its people and
businesses.27 The task force’s responsibilities evolved as Flowers discovered that information
used to track mortgage fraud could easily be adapted to identify other problems. By 2012,
Flowers was director of analytics for the Office of Policy and Strategic Planning in the mayor’s
office.
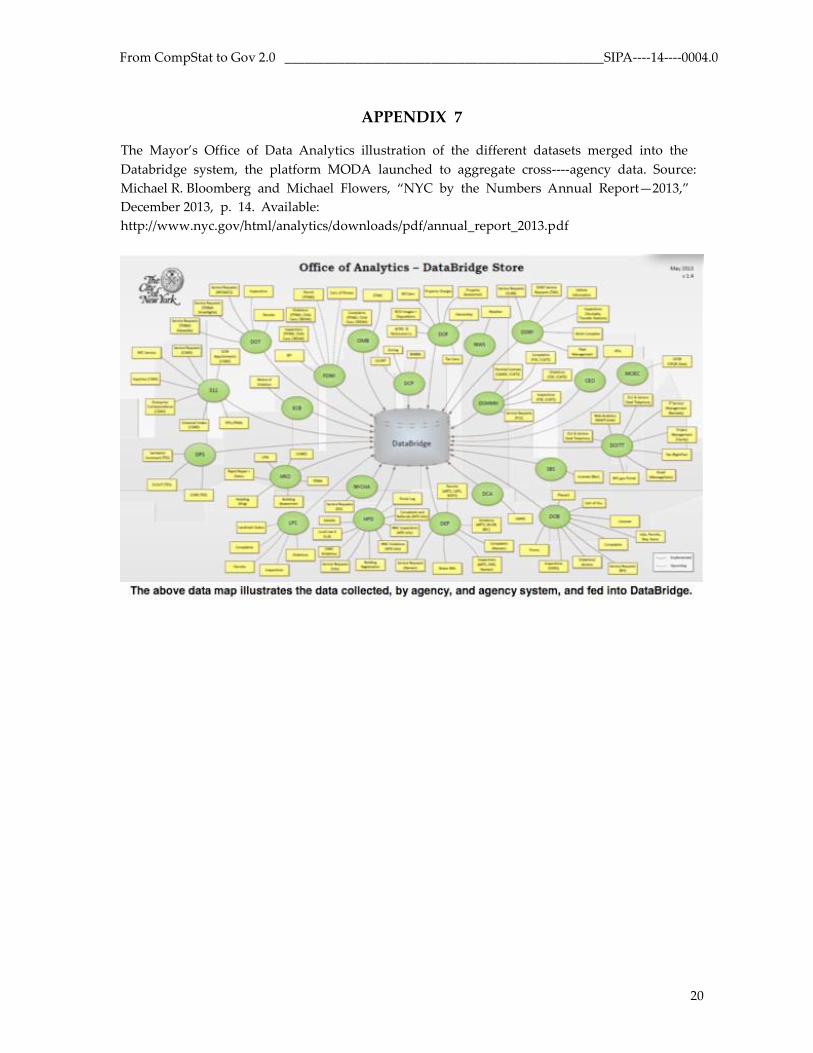
MODA. On February 14, 2013, Bloomberg announced the creation of the Mayor’s
Office of Data Analytics (MODA), a small team within City Hall that would synthesize data
from 40 different city agencies in an effort to solve problems that spanned the responsibilities
of—and the information collected by—those agencies. In announcing its formation, Bloomberg
said MODA would “launch a new platform that will improve the way all agencies share
information.”28 To lead this effort, he appointed Flowers as the city’s first----ever chief analytics
officer.
Flowers and his team of about six looked for innovative ways to use data to solve
problems. They relied on the insight that data relevant to the performance of one city agency
might be housed in another. Flowers believes that the challenges to sharing data across
agencies fall into four broad categories—“technical, cultural, political and legal, in no particular
order.” Legal concerns included citizen privacy and statutory limits on the authority of certain
25 Elizabeth A. Harris, “Getting a Visual on New Yorkers’ 311 Calls,” The New York Times (City Room blog),
February 16, 2011. Available: http://cityroom.blogs.nytimes.com/2011/02/16/getting-a-visual-on-new-yorkers-
311calls/?_php=true&_type=blogs&emc=eta1&_r=0 26 Adam Stepan’s interview with former New York City Deputy Mayor of Operations Stephen Goldsmith on
February 24, 2014, at Columbia University in New York City. All further quotes from Goldsmith, unless
otherwise attributed, are from this interview. 27 Stepan’s interview with Michael Flowers, on February 26, 2014, at Columbia University. All further quotes
from Flowers, unless otherwise attributed, are from this interview. 28 Michael Bloomberg, State of the City Address, 2013, New York City Office of the Mayor, February 14, 2013.